Article

Optimization Method for Land Use of the Xi’an Rail Transit Station Area Based on a Multi-Objective Model

1
School of Architecture, Chang’an University, Xi’an 710061, China
2
School of Architecture, Xi’an University of Architecture and Technology, Xi’an 710055, China
*
Author to whom correspondence should be addressed.
Land 2023, 12(9), 1705; https://doi.org/10.3390/land12091705
Submission received: 20 July 2023 / Revised: 27 August 2023 / Accepted: 30 August 2023 / Published: 31 August 2023
(This article belongs to the Topic Urban Land Use and Spatial Analysis)

Abstract

:
For the intensive, efficient, and sustainable utilization of land resources, it is of great significance to optimize the spatial allocation of different types of land use intensity in rail transit station areas. The current land use optimization model has some shortcomings in objective function, constraint conditions, and the solution process. In response to this, a new multi-objective optimization model for rail transit station land use was built. With station space efficiency as the starting point, the three objectives of the model optimization were the traffic volume, environment quality, and land balance of the rail transit station, and the constraint conditions were the plot ratio, environment quality, and efficiency level. Lingo was used to solve the optimal plot ratio of different types of land use intensity. Compared with the non-inferior solution of the rail transit station area multi-objective original model, the ideal plot ratio of various land uses obtained by the optimized new model was more reasonable. There was a relatively large gap between the non-inferior solutions of some original models and the actual conditions. In contrast, the optimized new model had stronger maneuverability. The deviation ranges of the two models were −0.4% to 0.9% on the residential land plot ratio adjustment index, −3.2% to 4.8% on the public land plot ratio adjustment index, and 1.1% to 1.9% on the commercial land plot ratio adjustment index. This research aimed to provide a basis and reference for the land use and planning of Xi’an rail transit station.

1. Introduction

Given that land is the core resource for urban development and construction, changes in land use patterns can have direct or indirect impacts on the urban socio-economy. Land use optimization aims to realize the sustainable development of urban land resources by rationally arranging the proportion structure and spatial layout of various land use types in a region [1,2]. In the context of rapid urbanization, many cities in China are rapidly developing rail transit construction. As of April 2023, eight subway lines have been opened in the built-up area of Xi’an, with a running mileage of 252.6 km. The urban public transport share rate of rail transit has reached more than 50%. However, various problems have been exposed during the rapid construction of urban rail transit, including unreasonable station land use structures and poor operational efficiency [3,4,5,6,7]. Through land use optimization of the rail transit station area [8,9], limited land resources can support the economic development of the station area and even the region [10,11,12,13,14,15]. Therefore, research on land use optimization of rail transit station areas has important scientific and guiding significance.
In existing research, research on land use optimization around rail transit areas can be classified into three categories: hypothetical research, descriptive research, and model simulation statistical research [16]. Usually, a mixed approach to decision making is carried out [17,18,19,20,21]. To realize land use optimization, model simulation is an important tool [22]. There have been a large number of studies on land use change simulation from scholars, and the application prospects of a series of land use optimization models have been explored, including the Markov model [17], system dynamics (SD) model [23], Gray Model (GM) [24], Multiple Regression Model (MLR) [25], and Multi-Objective Programming (MOP) model [26,27,28,29]. The construction of the SD model was relatively complicated [23]. The Markov model and GM model are based on mathematical statistics for quantity prediction [17], without combining the driving factors of station operation [24]. The MOP model addresses the limitation of 1D objective function and can optimize land use allocation on the basis of the maximization of rail transit volume, the optimization of station environmental quality, and the balance of station land use. For land use optimization of rail transit station areas, the multi-objective decision-making model is more commonly used. For example, Lin Zhenjia and Mo Yikui et al. used a multi-objective decision-making model with the development intensity of various types of rail transit station areas as the decision variable [30,31,32]. In the process of building the multi-objective decision-making model, the maximization function optimization objectives usually include travel efficiency [31], maximum carrying capacity, optimal regional environment, the most balanced land use [32], and the maximum land use benefits [33]. Constraint conditions usually include resource and environmental carrying capacity, land type, population, population density of different land types [34], and station type [35]. The algorithms include the ε constraint method, real number genetic algorithm, parallel genetic algorithm [36], MATLAB language editing genetic algorithm, and NSGA-II algorithm [37].
For the consideration of the objective function, the number of factors in the past application of this model was small. Moreover, few constraint conditions have been proposed from the perspective of station space efficiency [38]. Therefore, it is meaningful to construct a multi-objective linear function model based on station area efficiency for station land use optimization. First, the original multi-objective optimization model for land use of the rail transit station area was proposed. The optimization of the model was carried out based on the four aspects of the basic assumptions, objective function, constraint conditions, and solution process. The objective function was proposed to include high space efficiency, medium space efficiency, and low space efficiency [38]. Finally, the new land use optimization model of the Xi’an rail transit station area was constructed. Using the original model and the optimized new model, the optimal values of development intensity for various types of land use in each station area were obtained. The results showed that the plot ratios of residential land, public land, and commercial land in the station area should be adjusted to varying degrees. The research results can provide not only a reference for the construction of the Xi’an rail transit station area during the process of rapid development, but also important guidance for land structure adjustment in land use planning.

2. Study Area and Data Source
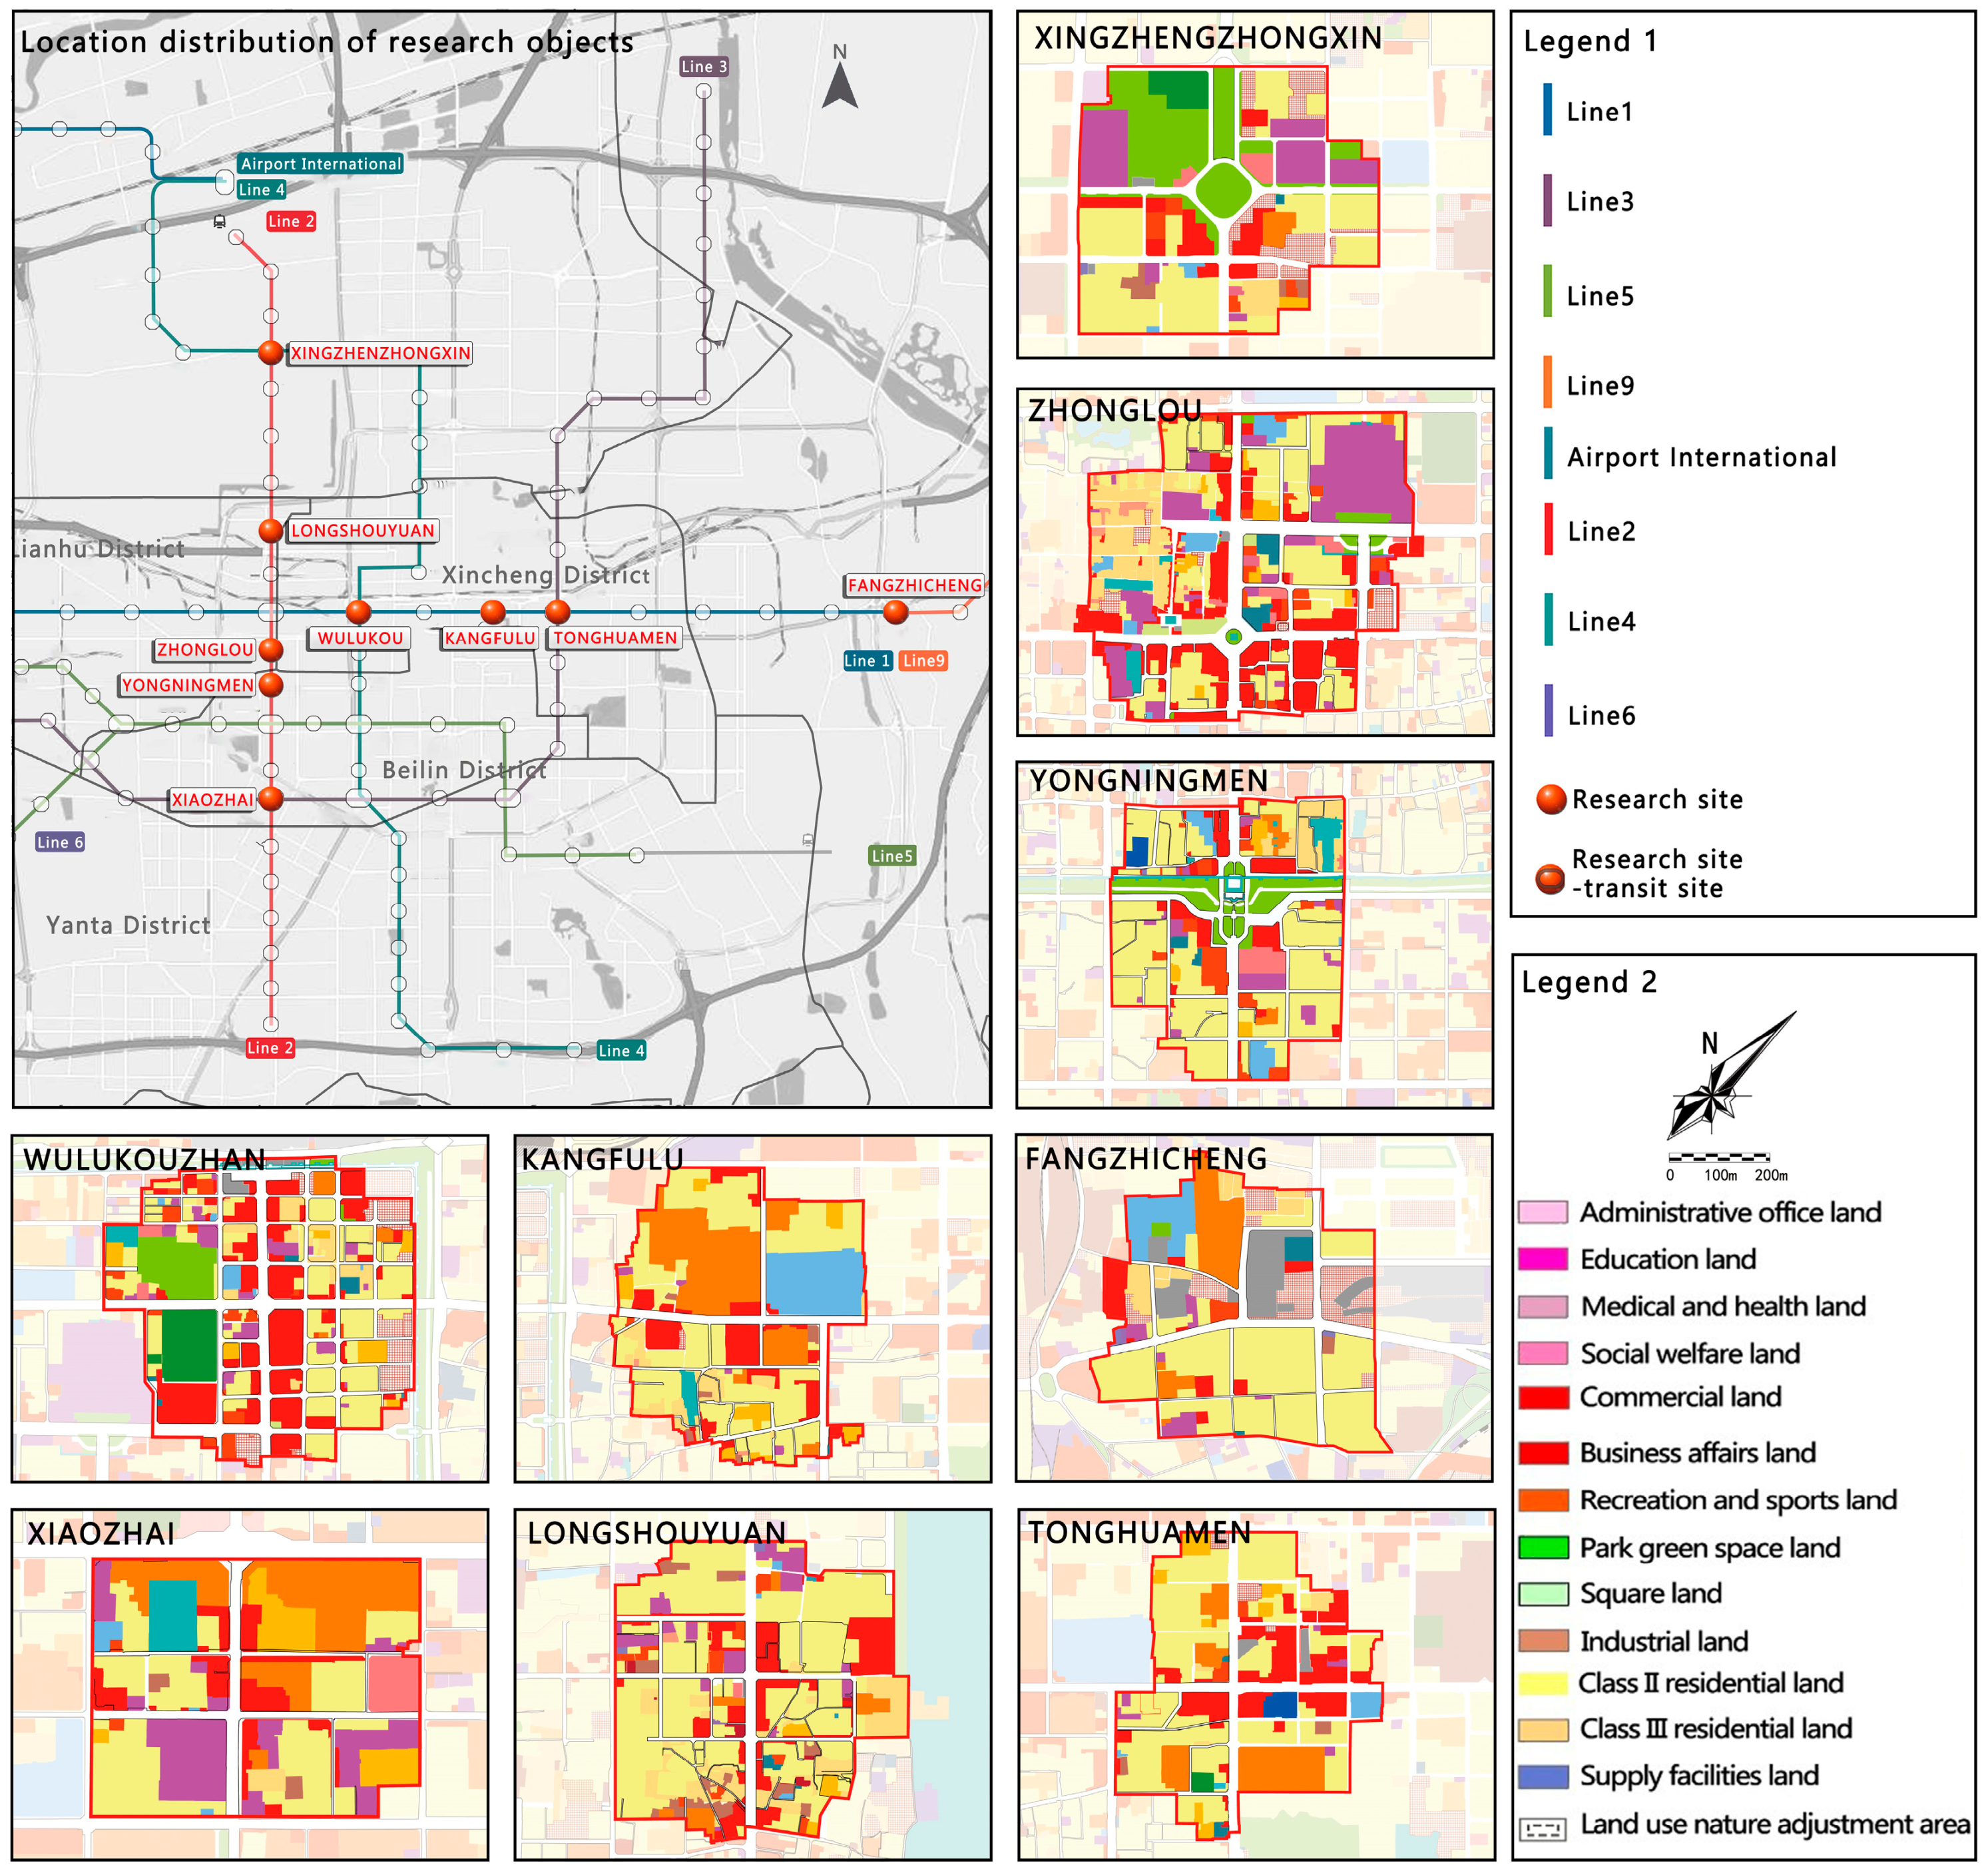
2.1. Study Area

Metro line 1 and line 2 are the backbone lines of the Xi’an rail transit network. Compared with the newly built line, the land characteristics along metro line 1 and line 2 are stably formed. Therefore, we selected stations within metro line 1 and line 2. Station selection consisted of the following two steps. 1. For land use optimization based on station space efficiency, station selection needed to consider the intensity of station land use [39]. Therefore, this survey selected nine stations on line 1 and line 2 with large-scale centralized commercial complexes around them (connected to the station by a relatively continuous underground space system), as well as integrated development characteristics and potential for the integrated development of stations and cities in 44 subway stations (Figure 1). 2. Station selection should consider the constraints of different station space efficiency levels [40,41,42], and their impact on the optimization results. Based on the DEA data envelopment model, station area traffic, and land data, this study measured the efficiency of nine stations. The results were given in three grades of high space efficiency, medium space efficiency, and low space efficiency. High-space-efficiency stations were generally urban or district-level cores, which contained commercial service facilities with high development intensity and handled a large number of people and activities. Medium-space-efficiency stations generally had mixed functions and a large amount of commercial land and some residential land. Compared with the high-space-efficiency stations and the medium-space-efficiency stations, the traffic passenger flow and commercial area passenger flow of the low-space-efficiency stations were small. Among the sample stations, high-space-efficiency stations included Fangzhicheng Station, Zhonglou Station, Xiaozhai Station, Longshouyuan Station, and Yongningmen Station. Medium-space-efficiency stations included Xingzhengzhongxin Station and Kangfulu Station. Low-space-efficiency stations included Tonghuamen Station and Wulukou Station.
Based on most documents, the rail transit station area is mainly between 400 and 800 m. In this paper, the station area was specified as the urban built-up area occupied by concentric circles, with the station as the core and 800 m as the radius. Considering that the road network structure in Xi’an is mainly a grid or ring structure, the station area, with clear plot ownership, continuous roads, and complete building outlines, was determined as the boundary of the research scope [43].

2.2. Data Source

The data in this paper included rail transit station area land use data, rail transit passenger flow data, social development data, and economic level data. The land use data were taken from high-definition satellite images (Baidu map), on-site surveys and measurements, and GIS database statistics of built-up areas inside the Third-Ring Road of Xi’an City. The land use data were used to calculate the built environment characteristic indicators, such as the land use nature and building area of the station area. The source of rail transit passenger flow data was the operating branch of Xi’an Rail Transit Transportation Group Co., Ltd. We avoided special periods such as holidays, and we ensured that the complete subway operation time was covered. Then, the subway passenger flow data of the sample station for 1 week (20 April 2021 to 26 April 2021) were collected. Social development data and economic level data were from the 2021 Xi’an Statistical Yearbook, 2021 Xi’an Economic and Social Development Statistical Bulletin, and field research.

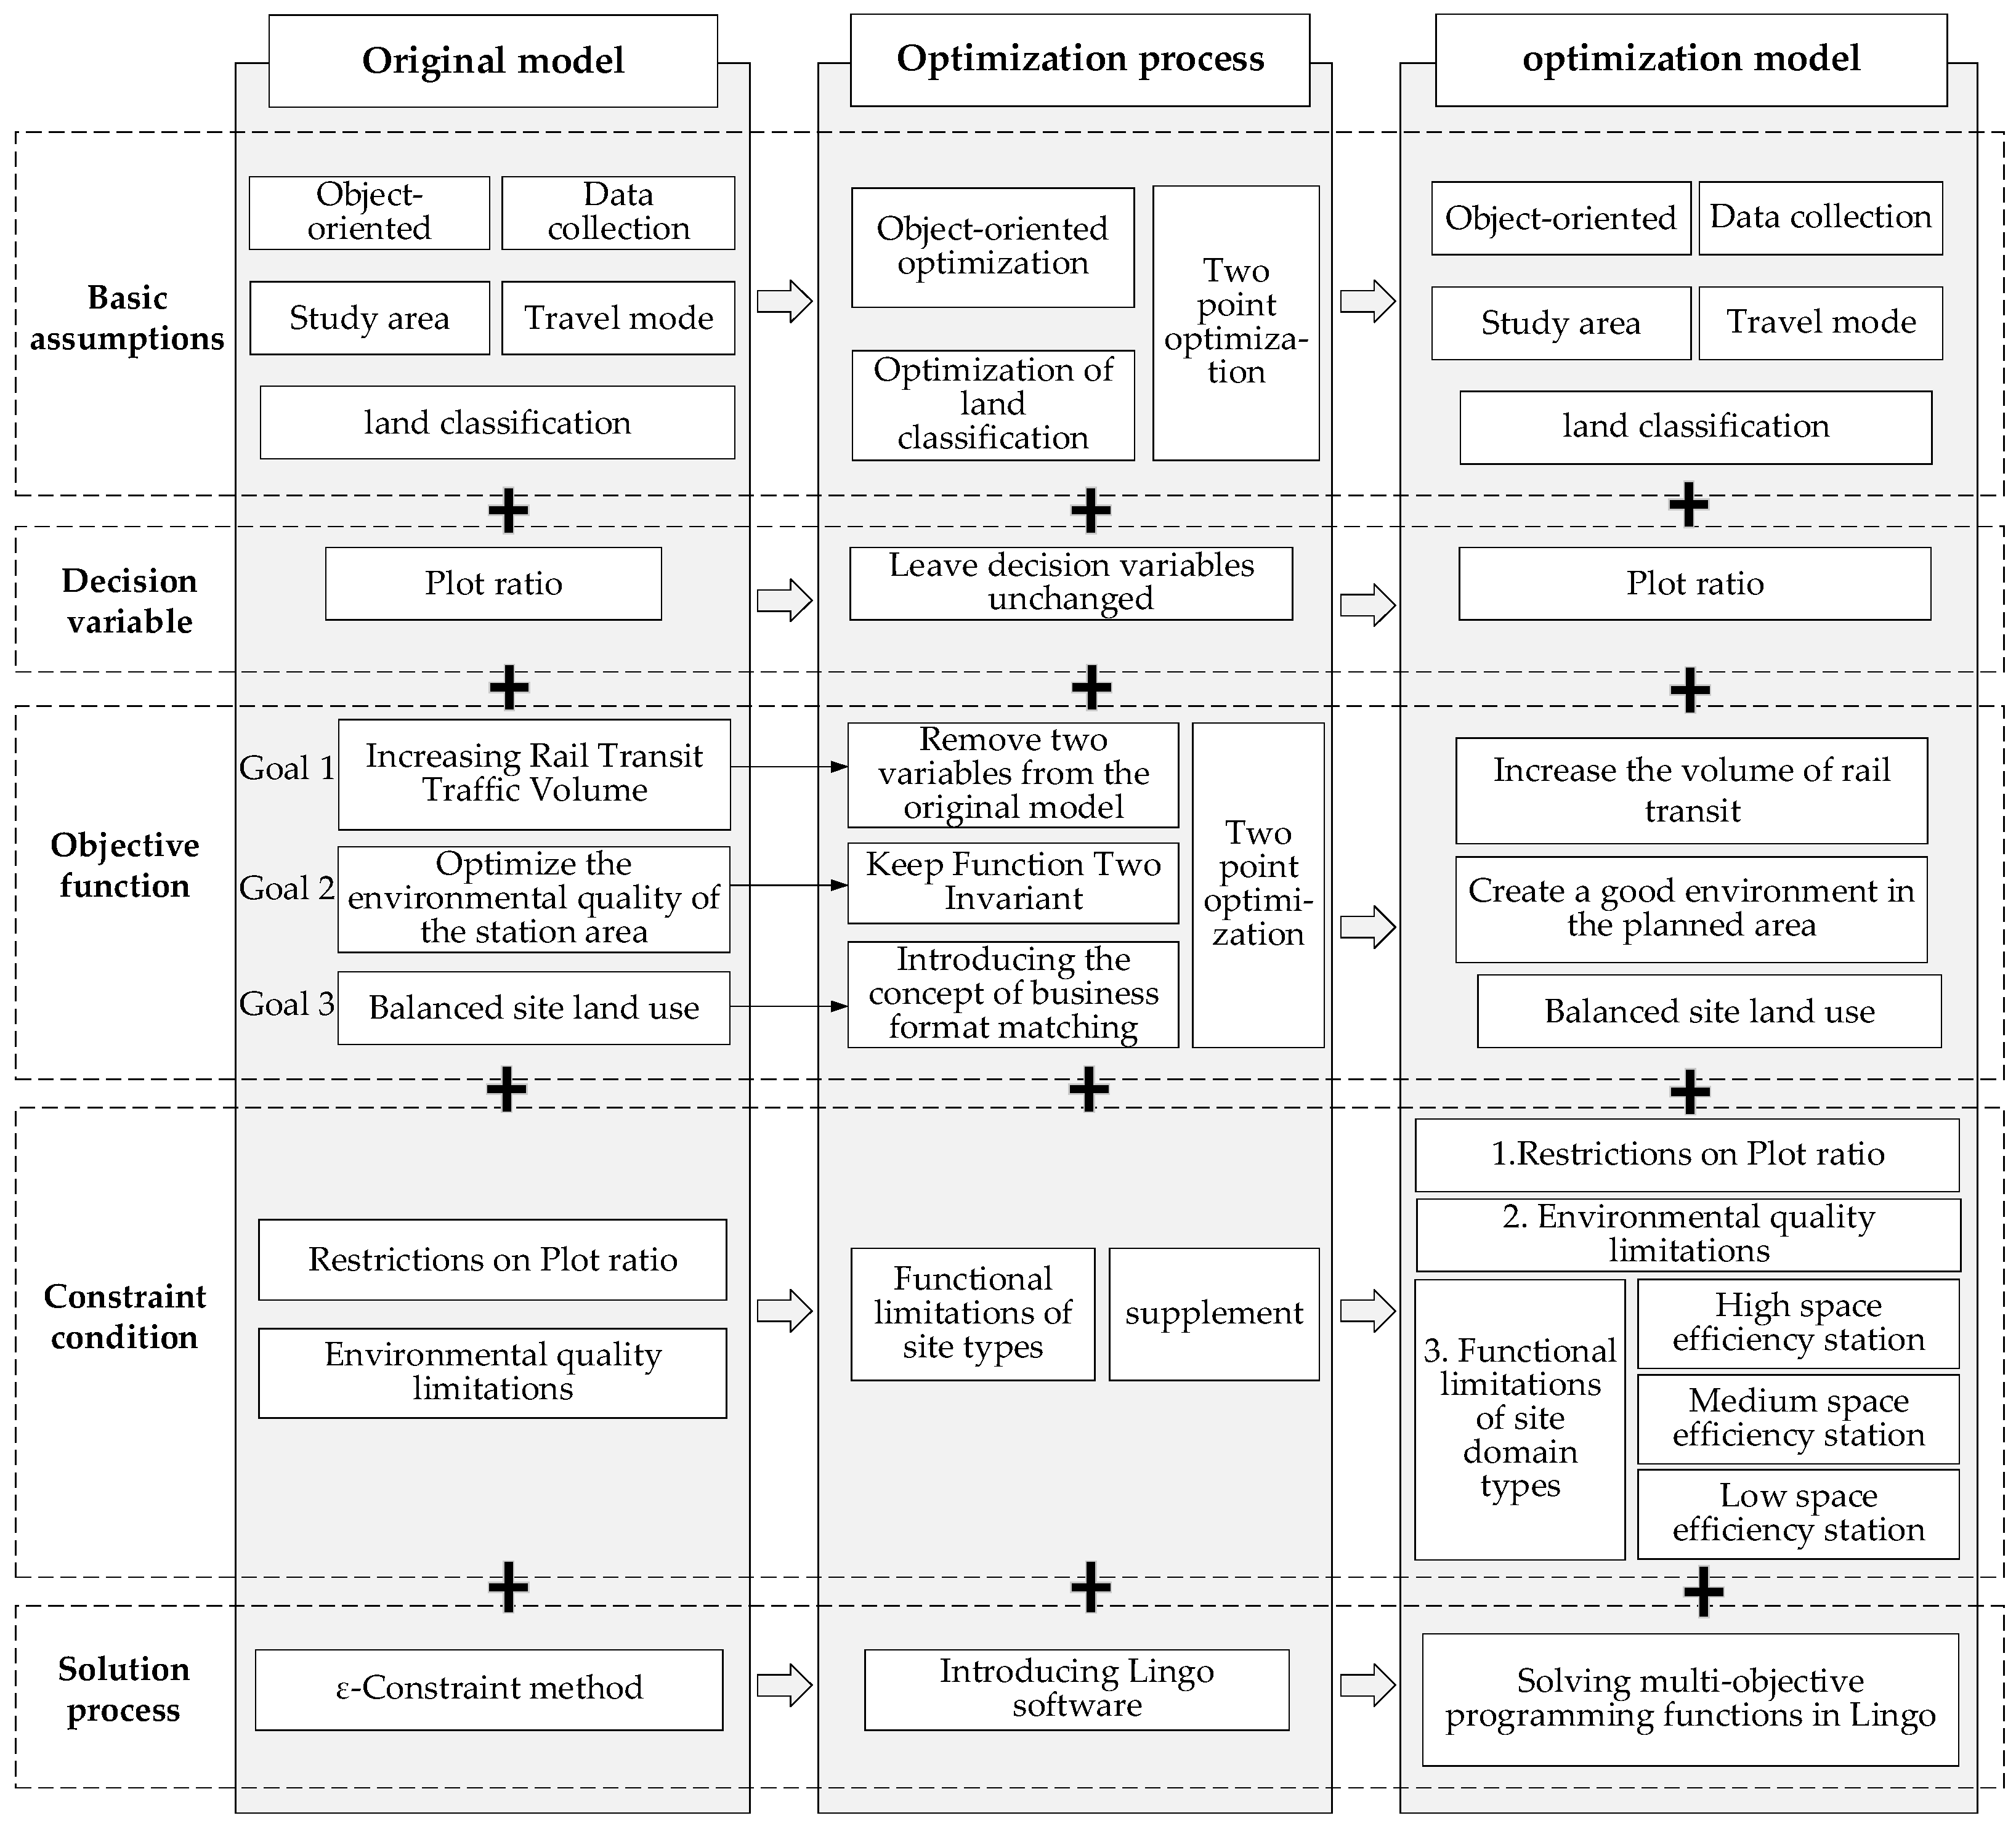
3. Construction of the Optimization Model

According to the characteristics of the acquired data and the research purpose, the multi-objective optimization model was applied to land use optimization simulation of the rail transit station area. The research steps are shown in Figure 2. First, the original multi-objective optimization model for land use of the rail transit station area was proposed. Second, the original model was optimized in terms of the basic assumptions, objective function, constraint conditions, and solution process. Third, a new multi-objective optimization model for the Xi’an rail transit station area land use was constructed.

3.1. Establishment of the Original Multi-Objective Programming Mathematical Model of the Rail Transist Station Area

Combined with previous research [44], the “3D” principle (Density, Design, and Diversity) in the TOD mode was introduced for the purpose of efficient development and operation of the station area. In more detail, the passenger flow of public transport was increased by intensively developing the land around the station (Density), environmental quality was improved by improving the environmental quality of the land around the station (Design), and inter-traffic volume was reduced through the balanced and diverse development of the land (Diversity). The above three principles correspond to the three objective functions of the original optimization model, with the decision variables as the plot ratios of different types of land use. The specific model is as follows:

3.1.1. Basic Assumptions

  • For social public benefits, the optimization model was constructed from the perspective of the planning department;
  • The total land area of different land types in the station area was determined as the basis for the optimization model;
  • The station area land within a radius of 800 m with the station as the core was taken as the research area;
  • Residents within the research area were defaulted to prefer rail transit as their means of transportation;
  • The optimization of the plot ratio used the classification in the Urban Land Use Classification and Planning and Construction Land Standard (GB50137-2011). This has a total of two categories and eight subcategories, including residential land (R1, R2, R3, R4), and public facility land (C2, C3, C5, C6).

3.1.2. Decision Variable

The plot ratio of various types of land in the rail transit station area was taken as the decision variable of the multi-objective model.

3.1.3. Objective Function

Goal 1: To increase the transportation volume of rail transit. The high-density development of land within the station area can introduce a large number of people and increased heat, and it can improve the transport capacity of the station. See Table 1 for the meaning of each index in Formula (1).
M a x Z 1 = i L i r × M i r × T i r × K i r m i r + i L i c × M i c × T i c × K i c m i c
Goal 2: To create a good environment within the planned area. The ratio of the sum of the land area of public facilities, green spaces, squares, and roads to the building area of the sum of residential, commercial, and business office land indicates the environment quality of the station area. The higher the value, the better the environment quality level. See Table 1 for the meaning of each index in Formula (2).
M a x Z 2 = L g + L s i L i r × M i r + i L i c × M i c
Goal 3: To balance station land use. The ratio of the residential population to employment represents the land balance. Taking the ratio of the total resident population of the station area to the employment position as the standard value, the minimum difference between the two can represent the relative balance of the station land use. See Table 1 for the meaning of each index in Formula (3).
M a x Z 3 = i L i r × M i r m i r i L i c × M i c m i c γ

3.1.4. Constraint Condition

(1)
Plot ratio restriction
An excessive building density and plot ratio in the station area will lead to problems such as traffic congestion and insufficient supply of facilities. Therefore, it is necessary to ensure that the plot ratio of various types of land is not greater than the upper limit proposed by relevant policies and regulations. For efficient development of the station area, the value of plot ratio should not be too low. Based on relevant literature and the control range of plot ratios in major cities in China, the lower limit of the original model was the upper limit of the current planning control, and the upper limit was 1.4 times the current control upper limit [45]. See Table 1 for the meaning of each index in Formulas (4) and (5).
f i r M i r 1.4 f i r
f i c M i c 1.4 f i c
(2)
Environment quality restriction
The value of dividing the sum of the per capita public green area of the current residents and the total construction area of the current public management and public service facilities by the residential land construction area was used as the lower limit value of the living environment quality limit. See Table 1 for the meaning of each index in Formulas (6) and (7).
i L i r × M i r m i r × d g L g
i L i r × M i r × λ i = 2 4 L i c × M i c

3.1.5. Solution Process

In this multi-objective model, Formula (2) is a nonlinear function that can be transformed into a linear multi-objective programming model. When the increased rail traffic volume is the objective function, optimizing the station area environment quality and balancing the station land use become the constraint conditions. In this case, the ε-constraint method can be used to obtain a non-inferior solution.

3.2. Proposal of a New Multi-Objective Optimization Model for Rail Transit Station Area Land Use

3.2.1. Basic Assumptions

The basic assumptions were optimized. In the original model, the model construction was oriented to the government planning department. In the optimized model, the targets include government planning departments, rail transit design units, and subway operating companies. The original model calculated the plot ratio of eight types of land use. According to the latest Guidelines for Classification of Land and Sea for Land and Space Survey, Planning, and Use Control, the new model optimizes the types of land use to 07 residential area land, 08 public management and public service land, and 0902 commercial and financial land. The basic assumptions after optimization were as follows:
  • The station area is the land within a radius of 800 m from the station as the core. There are two principles to follow. One principle is to guarantee the integrity of the same plot. The other principle is to use roads as segmentation boundaries;
  • From the perspective of decision makers, the construction of the optimization model adopts the principle of focusing on the main target benefit and supplementing the secondary target benefit;
  • The availability of land use area and intensity data for various types of land use in the station area is guaranteed;
  • The optimization of the plot ratio takes 07 residential area land, 08 public management and public service land, and 0902 commercial and financial land as the land use standard.

3.2.2. Decision Variable

The plot ratio was used as a decision variable.

3.2.3. Objective Function

The mathematical models were optimized. Due to the difficulty of data collection and the complexity of data calculation, the representation form of the objective function changed accordingly. For objective function 1, rail traffic volume can be expressed directly by passenger flow. Therefore, the two indicators of  m i r  and  m i c  in the original model that characterize the per capita land area can be eliminated and replaced by the maximum passenger flow of the station peak hour (Vmax). The expression of objective function 2 is simple and the data collection is less difficult, remaining unchanged. For objective function 3, the concept of the commercial form ratio and the standard deviation tool in mathematics are introduced. The proportion of various types of land use in the station area was measured to indicate the balance of station land use.
Goal 1: To increase the transportation volume of rail transit. Based on the land intensification characteristics of station and urban integration, high-intensity land development around the station is carried out, aiming to attract more people and increase rail transit capacity. The larger the obtained Z1 value, the larger the traffic passenger volume or transport capacity of the rail transit station. See Table 1 for the meaning of each index in Formula (8).
M a x Z 1 = V max i L i r × M i r + i L i c × M i c
Goal 2: To create a good environment within the planned area. The measurement standard is the ratio of the land area of green land and square land to the total construction area of residential land and commercial and office land. The larger the Z2 value, the higher the proportion of green land and square land, and the better the environment quality of the station area. See Table 1 for the meaning of each index in Formula (9).
M a x Z 2 = L g + L s i L i r × M i r + i L i c × M i c
Goal 3: To balance station land use. Residential land, public land (public facilities and commercial finance), and other land use (green land and square land) were compared with the commercial form ratio. The smaller the value of Z3, the better the land mix balance of the station area, and the better the environment quality of the station area. In the formula, the meanings of Z3, X, L, k, and i are the same as those mentioned above;  a i  is the ratio of various building areas to the total building area; μ is the average building area (m2). See Table 1 for the meaning of each index in Formulas (10)–(12).
M a x Z 3 = 1 5 i = 1 5 ( a i μ ) 2
a i = L i k × M i k i = 1 5 L i k × M i k
μ = i = 1 5 L i k × M i k 5

3.2.4. Constraint Conditions

The constraint conditions were optimized. The constraint conditions of the new model included the plot ratio, station area environment quality, and station type. The constraints on the plot ratio (Equations (13) and (14)) remained the same as the original model. Constraints on the station area environment quality (Equations (18) and (19)) took the ratio of the current residents’ other land use (including municipal facility land, green land, and road square land) to the residential area as the lower limit. It should be noted that the index was removed to ensure that the optimized station area environment quality was improved. The minimum value was the ratio of the building area of public land to the building area of residential land, which made the optimized land use more balanced. In addition, functional restrictions on station types were added. The constraints on station types were based on station space efficiency, including high-efficiency station areas, medium-efficiency station areas, and low-efficiency station areas.
(1)
High-space-efficiency station
The high-space-efficiency station area setting was optimized to balance station land use (Z3). In this case, increasing the transportation volume of rail transit (Z1) and creating a good environment within the planned area (Z2) became secondary objectives and translated into constraint conditions for Z3. With a strong business atmosphere and a relatively stable flow of people, the environment of the station area still needs to be further improved. Under the premise of ensuring that 90% of the current traffic volume Z1 remained unchanged, the current environment quality Z2 should be appropriately improved. For this purpose, 1.2 times the current value was selected as the critical value of the constraint condition [43]. The model was as follows:
f i r M i r 1.4 f i r
f i c M i c 1.4 f i c
i L i r × M i r i L i c × M i c
V max i L i r × M i r + i L i c × M i c × 0.9 Z 1 V max i L i r × M i r + i L i c × M i c
L g + L s i L i r × M i r + i L i c × M i c Z 2 = = L g + L s i L i r × M i r + i L i c × M i c × 1.2
d e L g + L s i L i r × M i r
λ i = 2 4 L i c × M i c i L i r × M i r
(2)
Medium-space-efficiency station
For land use in the medium-space-efficiency station area, it is necessary to pursue the optimization of a good environment within the planned area (Z2). Increasing the transportation volume of rail transit (Z1) and balancing station land use (Z3) became secondary objectives and transitioned to a constraint condition for creating a good environment within the planned area (Z2). In this type of station, residential land accounted for a large proportion, and the flow of residents increased slightly. However, the requirements for mixed land use were relatively low. Under the premise of ensuring that 90% of the current land mixed use Z3 remained unchanged, the current traffic volume Z1 should be appropriately increased. In addition, 1.2 times the status quo value was used as the critical value of the constraint condition [43]. The model was as follows:
f i r M i r 1.4 f i r
f i c M i c 1.4 f i c
i L i r × M i r i L i c × M i c
V max i L i r × M i r + i L i c × M i c Z 1 V max i L i r × M i r + i L i c × M i c × 1.2
1 5 i = 1 5 ( a i μ ) 2 × 0.9 Z 3 1 5 i = 1 5 ( a i μ ) 2
d e L g + L s i L i r × M i r
λ i = 2 4 L i c × M i c i L i r × M i r
(3)
Low-space-efficiency station
For low-space-efficiency station area, land use should pursue the optimization of the transportation volume of rail transit (Z1). Creating a good environment within the planned area (Z2) and balancing station land use (Z3) became secondary objectives and transformed into the constraint conditions for increasing the transportation volume of rail transit (Z1). Since the maximization of Z1 will have a negative impact on the surrounding environment, it is necessary to appropriately increase the mixed use of the existing land Z3 to ensure 90% of the current environment quality Z2. In addition, 1.2 times the status quo value was used as the critical value of the constraint condition [43]. The model was as follows:
f i r M i r 1.4 f i r
f i c M i c 1.4 f i c
i L i r × M i r i L i c × M i c
L g + L s i L i r × M i r + i L i c × M i c Z 2 = = L g + L s i L i r × M i r + i L i c × M i c × 1.2
1 5 i = 1 5 ( a i μ ) 2 Z 3 1 5 i = 1 5 ( a i μ ) 2 × 1.2
d e L g + L s i L i r × M i r

3.2.5. Solution Process

Finally, the solution process was optimized. In the original model, the ε-constraint method was used to transform the multi-objective optimization problem into a single-objective optimization problem. The new model used a nonlinear single-objective programming model. The solution of multi-objective programming functions in Lingo is easier to operate, more accurate, and faster. Lingo (Linear Interactive and General Optimizer) is mainly used to establish and solve linear, nonlinear, and integer optimization models. It has the following characteristics:
(1)
Concise expression form. Lingo uses formulas to express logic to realize the rapid transformation of real problems into mathematical problems, which are easy to understand and construct.
(2)
Data input and output. Lingo can quickly realize data docking between the original collected data and the model base, and the direct delivery of the solution results to the data platform.
(3)
Rapid model solving process. The built-in solver in Lingo can analyze the model and quickly select the appropriate model solver to obtain the results. The meaning of each indicator in the above function is shown in Table 1.

4. Results and Discussion

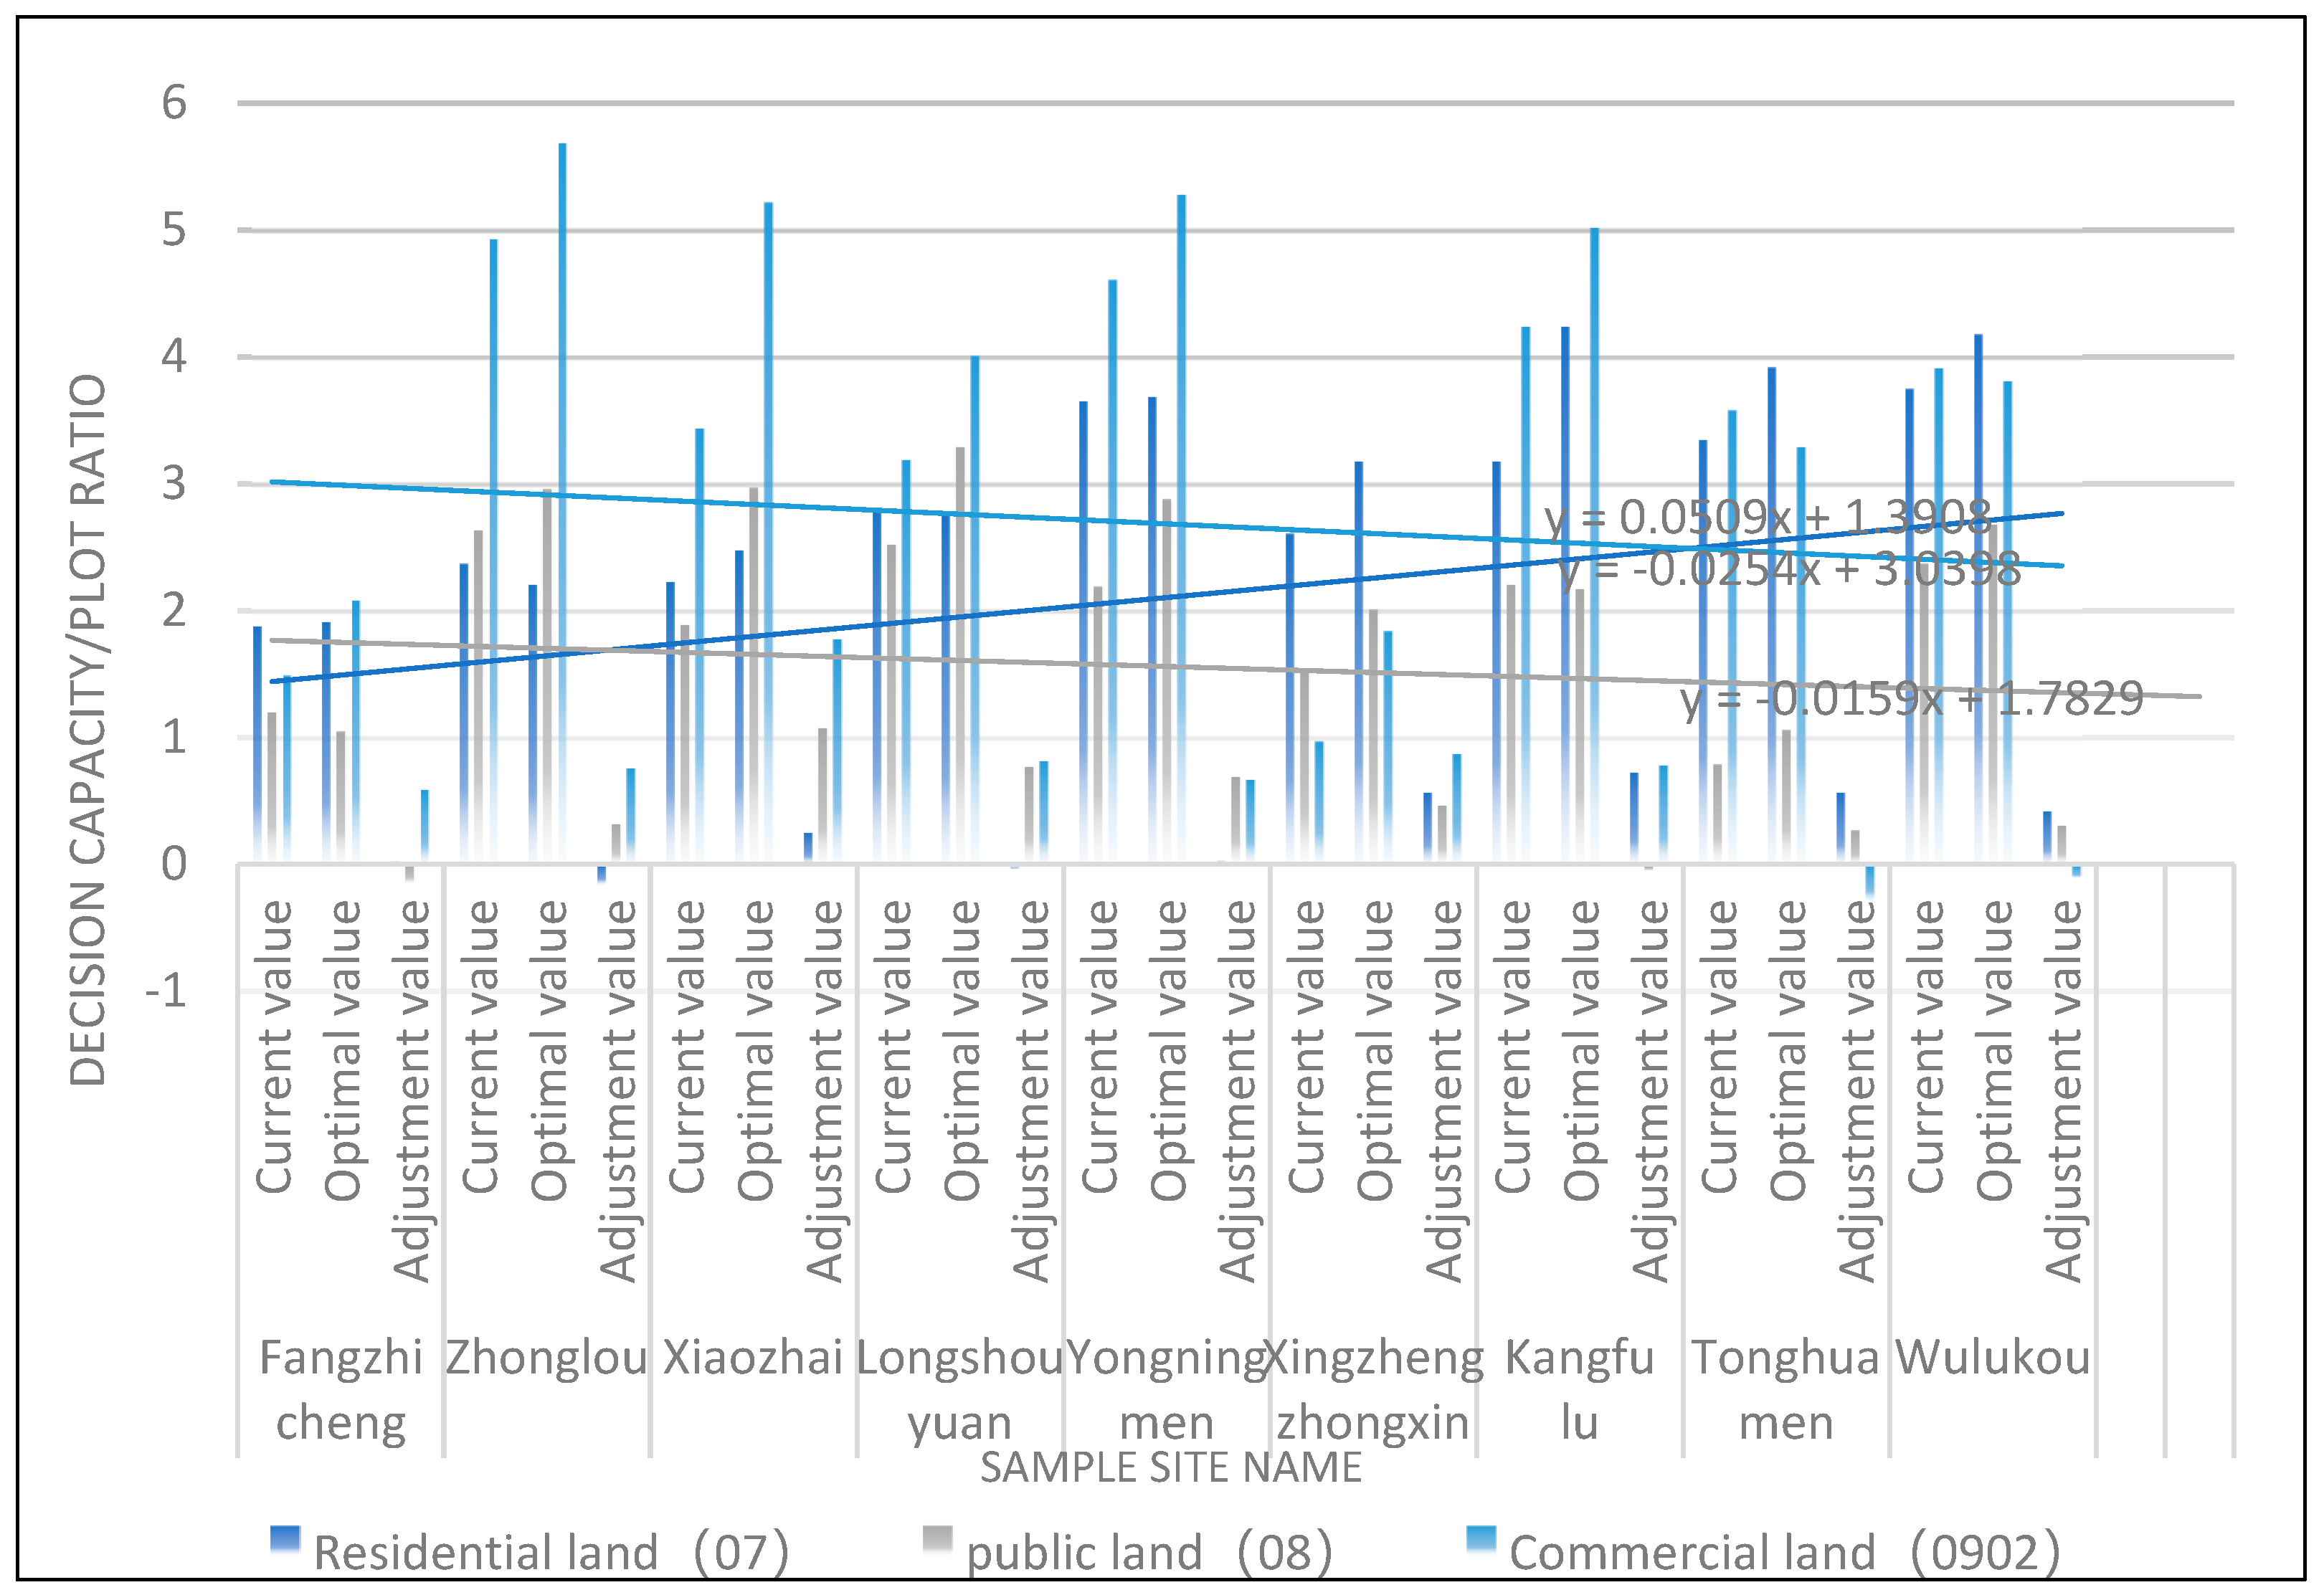
4.1. Station Land Use Optimization Value Results

The decision variable of different types of land in the station area was measured. The results include the original model results and the optimized model results. The optimized new multi-objective model was found to be more effective.

4.1.1. Calculation Results of the Original Model Indicators

Through the collection of the current data, the area and plot ratio of each type of land use in the nine sample station areas were obtained. According to the Technical Regulations on Urban Planning Management of Xi’an City, the upper limit of the residential land plot ratio outside the Second Ring Road is 2.5 (250%), and the upper limit of the residential land plot ratio inside the Second Ring Road is 2.8 (280%). Moreover, the upper limit of the commercial land plot ratio outside the Second Ring Road is 5.5, and the upper limit of commercial land plot ratio inside the Second Ring Road is 6.5. According to the actual research, the ratio of the subway travel volume to the total traffic travel volume can reflect the subway share rate of each station, the proportion of residents who choose rail transit to travel, and the proportion of residents in public facility land who choose rail transit to travel. According to interviews, the average daily number of trips for a single resident population in the station area residential land is 1.92 times, and the average daily number of trips for each post in the public facility land is 3.88 times. According to the data on population and housing in the 2021 Xi’an Statistical Yearbook, the per capita living floor area in residential land is 34.9 m2/person, and the per capita green land and square land area is 14 m2/person. Based on the population and employment data of the station area in the Statistical Yearbook, the value of γ is 0.88. Based on the research, the construction area occupied by each post on the public facility land was 16 m2/person. The calculation results of each index value in the original model are shown in Table 2.
Through the ε-constraint method, the ideal plot ratio of the original model was obtained for comparison with the optimization results of the new model. The non-inferior solution of the original model was obtained by screening the plot ratio values of the eight types of land use, as shown in Last Table.

4.1.2. Calculation Results of Model Indicators after Optimization

According to the collected status data, each index value in the optimization model was calculated, as shown in Table 3. Among them, the value of Vmax was the 1 h data with the largest one-way passenger flow of each station in the passenger flow database from 20 April to 26 April 2021, as the maximum value of one-way passenger flow in peak hours was calculated based on the current land area and building area data of each station.
Each index value was substituted into the multi-objective programming function in Lingo. The optimized values obtained are shown in Table 4.
It can be seen from Table 4 that the public land plot ratio and commercial land plot ratio calculated by the original model were different to the current plot ratio. For example, the non-inferior solution value of the commercial land original model in Fangzhicheng Station was 3.85, which was 1.77 higher than the plot ratio value of 2.08 calculated by the new model. The non-inferior solution value of the original commercial land model of Zhonglou Station was 6.56, which exceeded the specified value of 6.5 for the commercial plot ratio within the Second Ring Road in the Technical Regulations on Urban Planning and Management of Xi’an City. In this paper, the optimized model obtained by Lingo was 5.69, which was more reasonable and operable than the non-inferior solution of the original model.

4.2. Discussion on Adjusting the Land Use Optimization Value

As shown in Figure 3, the functional types of the high-space-efficiency station were singular, comprising mainly commercial land and construction land. According to Table 4, there was a gap between the current development intensity of public management and public service facility land and commercial land compared with the optimized development intensity value. Although the high-efficiency station already had a certain development intensity, these two types of land still had development potential for creating urban core nodes, which was in line with the high-density and high-intensity development of station–city integration. This could further enhance the commercial functions of the high-efficiency station and the performance of the land use. Taking residential land as an example, the current residential plot ratio value of the high-efficiency rail station was very close to the optimal value, indicating that residential land tends to be saturated.
The function types of the medium-space-efficiency station were relatively complex, including residential functions, commercial functions, and other public service functions. It can be seen from Figure 3 that the satisfaction factory plot ratio of Xingzhengzhongxin Station increased from 2.61 to 3.51, indicating that the development intensity of residential land still needs to be further improved. In the station area, the residential land includes mid-to-high-rise buildings and multi-story buildings. Some old multi-story buildings have a single shape and average quality, leaving room for optimization. The satisfaction factory plot ratio of public service land increased from 1.54 to 1.56, with a relatively small optimization range. This was in line with the status quo of the functionality of the station itself. The public service land of Xingzhengzhongxin Station occupies a large proportion, and the development is close to saturation. The satisfaction factory plot ratio of commercial land increased from 0.97 to 1.21. While the optimization was modest, some level of optimization is still required. Kangfulu Station has relatively more businesses. Northwest Trade City and Light Industry Market can attract a large number of people and provide jobs. In order to further enhance the commercial functions of this station, it is necessary to build a commercial station to increase the plot ratio of commercial service land.
The function type of the low-space-efficiency station tends to be singular. The land use data of Tonghuamen Station and Wulukou Station showed that residential land accounts for the largest proportion, at 33% and 54%, respectively. The optimization goal of this type of station is mainly to optimize and improve the local environment, which can improve the quality of residential land. According to the optimized plot ratio value, the satisfaction factory plot ratio of residential land has not changed much. Therefore, the development intensity of the residential land of this type of station is moderate, which theoretically meets the land intensive development requirements of the rail transit station area. The degree of optimization of public services and commercial finance is relatively large. By adding public services and commercial and financial facilities, the service level of the station area was improved, thereby bringing convenience to residents. At the same time, service facilities were arranged around the rail station to form a public activity center, which could improve the absorption capacity of the rail transit, as well as the service capacity and efficiency of the low-efficiency rail station.

5. Discussion

With the multi-objective function as a tool, a new optimization model for land use in rail transit station areas was proposed. Compared with the original model [46,47], the new model was optimized for object orientation and land classification based on basic assumptions. For the mathematical model, two variables that are difficult to obtain data for were eliminated, and the concept of the commercial form ratio was introduced. An important innovation was to supplement the functional limitations of station types (divided into high efficiency, medium efficiency, and low efficiency) as constraints, in order to better reflect the station status. Compared with the non-inferior solution of the original model, the optimized solution of the new model was more realistic and had stronger operability.
Due to the difficulty of investigating the research objects, and the large amounts of complex data, there will inevitably be a small amount of error in the recording and analysis process. The GIS database of built-up areas in Xi’an is relatively old. Although manual proofreading and updating have been carried out, there is still a certain degree of error. Inaccurate data may cause differences between the current situation and the actual situation. Follow-up research should further strengthen the combined application of network big data and field survey data to reduce error.

6. Conclusions

In this paper, the multi-objective model was used to study the land use optimization of rail transit station areas. First, a station land use multi-objective primitive optimization model was proposed. Various optimization paths were proposed from the perspective of basic assumptions, mathematical models, constraint conditions, and solution methods. Finally, a scientific and effective multi-objective optimization system for station land use was constructed. By fully considering the synergistic relationships of various types of land in the station area during the configuration process, this method was able to achieve decision-making capacity while taking into account the rail transit’s transport capacity benefits, environment quality benefits, and land use layout balance benefits (plot ratio) to optimize the configuration results. This represents an innovation in the land optimization method technology of rail transit station areas, which could provide a reference for the planning of rail transit station land use. The following conclusions were obtained:
(1)
A new multi-objective optimization model for rail transit station area land use.
From the perspective of decision makers, a new multi-objective programming model of Xi’an station land use optimization was constructed. The adjustment of station land use adopted the principle of focusing on the main target benefit and supplementing the secondary target benefits. Finally, a new multi-objective optimization model for Xi’an rail transit station land use was obtained. 1. The optimization objectives included increasing the transportation volume of rail transit, creating a good environment within the planned area, and balancing station land use. 2. There were three constraint conditions. High-space-efficiency station areas pursued the optimization of balancing station land use. Medium-space-efficiency station areas pursued the optimization of creating a good environment within the planned area. Low-space-efficiency station areas pursued the optimization of increasing the transportation volume of rail transit.
(2)
The optimal value of the development intensity of various land uses in each station area was obtained.
The optimization calculation results of the two models were obtained. The non-inferior solution of the original model suggested that the adjustment ratio of the residential plot ratio was 1~5% of itself, the adjustment ratio of the public land plot ratio was −4% to 11% of itself, and the adjustment ratio of the commercial land plot ratio was 2~7.7% of itself. After optimization, the model suggested that the adjustment ratio of the residential plot ratio should be −0.6% to 4.1% of itself, the adjustment ratio of the public land plot ratio should be 0.8~6.2% of itself, and the adjustment ratio of the commercial land plot ratio should be −0.9% to 5.8% of itself.

Author Contributions

Conceptualization, writing—original draft preparation, H.T.; writing—review and editing, X.D.; supervision, project administration, J.L. All authors have read and agreed to the published version of the manuscript.

Funding

This research was funded by the National Natural Science Foundation of China, grant number 52108039.

Data Availability Statement

The data presented in this study are available on request from the corresponding author. The data are not publicly available due to ownership rights.

Acknowledgments

We are thankful to the anonymous reviewers for their valuable comments.

Conflicts of Interest

The authors declare no conflict of interest.

References

  1. Ma, B.Y.; Huang, J.; Li, S.C. Optimal allocation of land use in Jing-Jin-Ji based on ecological economic balance. Prog. Geogr. Sci. 2019, 38, 26–37. [Google Scholar]
  2. Wei, W.; Xie, Y.; Wei, X.; Xie, B.; Zhang, Q.; Hao, Y. Optimal allocation of land use in Shiyang River basin based on CLUE-S model and ecological security pattern. J. Wuhan Univ. Inf. Sci. Ed. 2017, 42, 1306–1315. [Google Scholar]
  3. Lu, X.T.; Yu, X. Discussion on the Comprehensive Development Planning Path of Land TOD along the Rail Transit Line: Taking Longdong Station of the Guangfo Ring Line (Guangzhou South Station to Baiyun Airport Section) of the Pearl River Delta Intercity Rail Transit as an Example. Planner 2018, 34, 57–62. [Google Scholar]
  4. Liang, Z.; Chen, S.Y. Preliminary Exploration of Comprehensive Development of Rail Transit Stations. J. Archit. 2008, 5, 77–79. [Google Scholar]
  5. Xu, F.C.; Dong, P.L. Development Plan for Underground Space of Jiangwan Wujiaochang Urban Sub center. J. Undergr. Space Eng. 2006, 1, 1154–1159. [Google Scholar]
  6. Zhen, J.F.; Liu, H.Y. Comprehensive Development of Rail Transit and Land in Japan. Chin. Railw. Sci. 2003, 3, 134–139. [Google Scholar]
  7. Fu, B.J.; Wang, S.; Zhang, J.Z.; Hou, Z.Q.; Li, J.H. Unravelling the complexity in achieving the l7 sustainable-development goals. Natl. Sci. Rev. 2019, 6, 386–388. [Google Scholar] [CrossRef]
  8. Lu, H.; Luo, X. Optimization Model for Land Use around Rail Transit Stations under TOD Mode. Compr. Transp. 2020, 42, 38–43. [Google Scholar]
  9. He, J.J.; Zheng, S.X.; Zhao, Y.L. Research on Control Elements of Land Development and Utilization Planning along Rail Transit. Planner 2008, 24, 67–70. [Google Scholar]
  10. Hou, Q.H.; Duan, Y.Q.; Ma, R.G. Collaborative optimization method of land use intensity and traffic capacity in urban hierarchical planning. J. Chang. Univ. 2015, 35, 114–121. [Google Scholar]
  11. Hu, J.; Zhang, G.H.; Huang, K. Technical ideas for regional planning along the rail transit—Taking the planning adjustment along Fuzhou Line 1 (North Bid Section) as an example. J. Urban Plan. 2012, 3, 76–84. [Google Scholar]
  12. Duan, Y.Q.; Hou, Q.H.; Zhang, S.Y. Review on the Relationship between Low Carbon Mobility and Intensive Land Use in Urban Built up Areas. Planner 2019, 35, 5–11. [Google Scholar]
  13. Duan, D.G.; Zhang, F. Research on the classification of urban rail stations from the perspective of land use optimization—Taking Xi’an Metro Line 2 as an example. Urban Plan. 2013, 37, 39–45. [Google Scholar]
  14. Pan, H.X.; Ren, C.Y.; Yang, T.X. Empirical study on the impact of Shanghai rail transit on land use in station areas. J. Urban Plan. 2007, 4, 92–97. [Google Scholar]
  15. Lu, J.H.; Mei, Z.X.; Zhao, S.F. Research on Chaotic Ant Colony Optimization Algorithm for Land Use Allocation. J. Earth Inf. Sci. 2017, 19, 1026–1035. [Google Scholar]
  16. Crane, R. The influence of urban form on travel: An interpretive review. J. Plan. Lit. 2000, 15, 3–23. [Google Scholar] [CrossRef]
  17. Zhen, J.F.; Liu, H.Y. The Comprehensive Development of Rail Transit and Land Resources in Hong Kong. Chin. Railw. Sci. 2002, 5, 3–7. [Google Scholar]
  18. Yang, L. Explore the impact of the metro station to the surrounding area. In Proceedings of the 2nd International Symposium on Rail Transit Comprehensive Development (ISRTCD), Chengdu, China, 6 July 2021; Volume 5, pp. 23–39. [Google Scholar]
  19. Lai, X.; Schonfeld, P. Concurrent optimization of rail transit alignments and station locations. Urban Rail Transit 2016, 2, 1–15. [Google Scholar] [CrossRef]
  20. Cao, Z. Integrating station-area development with Rail Transit Networks: Lessons from Japan Railway in Tokyo. Urban Rail Transit 2022, 8, 3–4. [Google Scholar]
  21. Li, C.; Zhang, F.R.; Song, N.P. Research on Several Issues of Optimizing Land Use Structure. Geogr. Geogr. Inf. Sci. 2003, 3, 52–59. [Google Scholar]
  22. Liu, J.F.; Wang, P.; Li, J. Study on spatial-temporal change of land use in Changling County based on Markov model. Res. Water Soil Conserv. 2009, 16, 16–19. [Google Scholar]
  23. Tian, H.; Liang, X.; Li, X. Simulation of Land Use Change Scenarios in China from 2010 to 2050 Based on SD Model. Trop. Geogr. 2017, 37, 547–561. [Google Scholar]
  24. Geng, H.; Wang, Z.M. Research on optimization of land use structure based on grey Linear programming. J. Wuhan Univ. Surv. Mapp. Sci. Technol. 2000, 25, 167–171, 182. [Google Scholar]
  25. Liu, X.; Zhao, Y.X.; Feng, X.M. Multi objective land use pattern simulation and optimization based on CLUE-S model—Taking Beisan County, Langfang City, Hebei Province as an example. Geogr. Geogr. Inf. Sci. 2018, 34, 92–98. [Google Scholar]
  26. Schlager, K.J. A land use plan design model. J. Am. Inst. Plan. 1965, 31, 103–111. [Google Scholar] [CrossRef]
  27. Chen, X.; Huang, J.C.; Yang, H.X.; Peng, J.Q. Approaching low-energy high-rise building by integrating passive architectural design with photovoltaic application. J. Clean. Prod. 2019, 220, 313–330. [Google Scholar] [CrossRef]
  28. Herrera-León, S.; Lucay, F.; Cisternas, L.; Kraslawski, A. Applying a multi-objective optimization approach in designing water supply systems for mining industries. the case of chile. J. Clean. Prod. 2019, 210, 994–1004. [Google Scholar] [CrossRef]
  29. Zhang, H.H.; Zeng, Y.N.; Jin, X.B. Simulating multi-objective land use optimization allocation using Multi-agent system: A case study in Changsha, China. Ecol. Model. 2016, 320, 334–347. [Google Scholar] [CrossRef]
  30. Wang, Y.Y.; Lu, H.P. A Combined Model of Land Use and Transportation Structure Based on Sustainable Development. J. Tsinghua Univ. 2004, 44, 1240–1243. [Google Scholar]
  31. Mo, Y.K. TOD planning model and application in urban rail transit station area. Civ. Archit. Environ. Eng. 2009, 31, 116–120. [Google Scholar]
  32. Yu, X.H. Research on Interactive Planning and Design of Land Use and Transportation in Rail Station Area. J. Tongji Univ. 2011, 39, 370–375. [Google Scholar]
  33. Wang, H.B. Research on Urban Land Use Optimization Model Guided by Public Transport. Transp. Stand. 2009, 17, 23–26. [Google Scholar]
  34. Song, K.; Zhou, R.; Lin, H.Z. Optimization Analysis of Land Use around Rail Transit Stations: A Case Study of Wujiaochang Station on Shanghai Metro Line 10. J. Fudan Univ. 2013, 52, 78–85. [Google Scholar]
  35. Li, Y.; Guo, H.L.; Li, H.; Xu, G.H.; Wang, Z.R.; Kong, C.W. Transit-Oriented Land Planning Model Considering Sustainability of Mass Rail Transit. J. Urban Plan. Dev. 2010, 136, 243–248. [Google Scholar] [CrossRef]
  36. Song, M.J.; Chen, D.M. An improved knowledge-informed NSGA-Il for multi-objective land allocation (MOLA). Geo-Spat. Inf. Sci. 2018, 21, 273–287. [Google Scholar] [CrossRef]
  37. Tang, F.; Xu, L.Q. Research on the development and spatial efficiency of rail transit plots from the perspective of station city integration: A case study of three rail transit stations in Shanghai. West. J. Hum. Settl. 2017, 32, 7–14. [Google Scholar]
  38. Cervero, R. Transit-oriented development and land use. Transp. Technol. Sustain. 2013, 1, 947–958. [Google Scholar]
  39. Zhong, L.Q.; Yang, D.L.; Zhang, H.F.; Cui, Z.X.; Zhang, Z.W.; Wang, Y.J. A Study on the Spatial Efficiency Evaluation of Historical and Cultural Recreation Areas Based on Consumer Vitality: A Case Study of Qinghefang in Hangzhou. Archit. Cult. 2019, 12, 129–131. [Google Scholar]
  40. Zhang, Y.Z.; Yan, Y.S.; Jiang, N. Study on comprehensive evaluation of urban rail Transportation planning network based on DEA. J. Railw. Eng. 2010, 27, 96–99. [Google Scholar]
  41. Xia, Z.W.; Zhang, Y.; Xu, L.Q. Factors affecting the efficiency of TOD in rail transit station areas and optimization strategies. Planner 2019, 35, 5–12. [Google Scholar]
  42. Xiao, T.Q.; Gu, K.K.; Yang, Q.Q.; Cheng, F. Construction of urban ecological network based on spatial efficiency—Taking Bozhou City as an example. China Agric. Resour. Zoning 2019, 40, 80–85+120. [Google Scholar]
  43. Liu, C. Research on Optimization of Multi-Objective Planning Model for Rail Transit Stations based on TOD Theory. Master’s Thesis, Hunan University, Changsha, China, 2015. [Google Scholar]
  44. Chen, Q.Y.; Song, Y.X. Research on the comprehensive definition method of the spatial scope of urban agglomeration—Taking Changzhutan as an example. Geogr. Sci. 2010, 30, 660–666. [Google Scholar]
  45. Lin, J.J.; Gan, C.C. A TOD planning model to review the regulation of allowable development densities around subway stations. Land Use Policy 2006, 23, 353–360. [Google Scholar] [CrossRef]
  46. Feng, X.; Tao, Z.; Niu, X.; Ruan, Z. Multi-objective land use allocation optimization in view of overlapped influences of Rail Transit stations. Sustainability 2021, 13, 13219. [Google Scholar] [CrossRef]
  47. Shen, H.; Ma, G. Tod Mode: Study on land planning and land use optimization for urban rail transit station area. Arch. Transp. 2023, 66, 33–43. [Google Scholar] [CrossRef]
Figure 1. Research objects and scope.
Land 12 01705 g001
Figure 2. Research conceptual framework.
Land 12 01705 g002
Figure 3. Comparison of the adjustment results between two models.
Land 12 01705 g003
Table 1. Meaning of each formula indicator.
IndexMeaningIndexMeaning
Z 1 Rail Transit Traffic Volume (Person Times) Z 2 Environmental quality of the rail transit station area
Z 3 Balance of land use in the station areaMPlot ratio
LTotal area of various types of land in the station area (m2)r07 Land area (m2)
c08 land area (m2)gMunicipal public facilities and green land area (m2)
sLand area for roads and squares (m2) γ The ratio of resident population to employment positions in the rail transit station area
iThe i-th land type in 07 land or 08 landkLand type
T i r The daily average travel frequency of a single resident population on the i-th 07 land (times/person) T i c The daily average number of trips per position on the i-th 08 land use (times/person)
K i r The proportion of residents on the i-th 07 land choosing rail transit for travel K i c The proportion of people choosing to use rail transit on the i-th 08 land use
m i r The per capita residential building area on the i-th 07 land (m2/person) f i c The per capita residential building area on the i-th 08 land (m2/person)
f i r The upper limit value of the Floor area ratio of i-th 07 land specified by the current laws and regulations a i The proportion of various types of land in the rail transit station area
d g Current per capita public green land area (m2/person) μ The average value of various types of land use in the rail transit station area
λ The ratio of the current construction area on the 08 land to the construction area on the 07 land V m a x Maximum daily peak hour passenger flow (person times/h)
m i c Building area occupied by each employment position on the i-th 08 land (m2/person)
Note: 07 refers to residential land, 08 refers to public management and public service land, and 0902 refers to commercial service industry land in the Guidelines for Classification of Land Use in Land and Space Survey, Planning, and Use Control.
Table 2. Statistical table of the original model indicators.
IndexIndicator Value
FangzhichengZhonglouXiaozhaiLongshouyuanYongningmenXingzhengzhongxinKangfuluTonghuamenWulukou
L r 93.07114.4156.15132.4483.7965.574.8346.3476.33
L 1 c 34.8551.9393.5220.9127.1950.9369.2127.4832.05
L 2 c 17.3648.4736.2536.1721.0023.7317.8345.8232.96
L g + L s 145.28214.81185.92189.52131.98140.16161.87119.64141.34
γ 0.880.880.880.880.880.860.860.850.85
λ 0.240.511.410.140.190.460.640.270.14
f i r 2.52.52.52.52.52.52.52.52.5
M r 1.882.372.232.793.652.613.183.353.75
M 1 c 1.202.641.892.522.191.542.210.792.37
M 2 c 1.494.933.443.194.610.974.243.583.91
T r 1.921.921.921.921.921.841.841.761.76
T 1 c 3.883.883.883.883.883.883.883.883.88
T 2 c 3.883.883.883.883.883.883.883.883.88
f i c 6.56.56.56.56.56.56.56.56.5
m r 34.934.934.934.934.934.934.934.934.9
m 1 c 161616161618181616
m 2 c 151515151516161212
K r 0.160.190.220.170.150.210.190.260.26
K 1 c 0.260.280.260.270.260.260.220.220.19
K 2 c 0.260.280.260.270.260.260.220.220.19
d g 141414141414141414
Table 3. Descriptive statistical table of indicators for the optimization model.
IndexIndicator Value
FangzhichengZhonglouXiaozhaiLongshouyuanYongningmenXingzhengzhongxinKangfuluTonghuamenWulukou
L r 93.07114.4156.15132.4483.7965.574.8346.3476.33
L 1 c 34.8551.9393.5220.9127.1950.9369.2127.4832.05
L 2 c 17.3648.4736.2536.1721.0023.7317.8345.8232.96
L g + L s 145.28214.81185.92189.52131.98140.16161.87119.64141.34
V m a x 532369294397775239952165625422722461
M r 1.882.372.232.793.652.613.183.353.75
M 1 c 1.202.641.892.522.191.542.210.792.37
M 2 c 1.494.933.443.194.610.974.243.583.91
M g + M s 3.5516.88--26.6116.24-2.12-
d e 0.010.06--0.110.210.160.090.02
λ 0.240.511.410.140.190.460.640.270.14
f i r 2.52.52.52.52.52.52.52.52.5
f i c 6.56.56.56.56.56.56.56.56.5
Table 4. Comparison of results between the original model and the optimized model.
Sample SiteDecision Capacity/Plot Ratio
Residential LandPublic LandCommercial Land
Non-Inferior Solution of Original ModelOptimization Solution of New ModelNon-Inferior Solution of the Original ModelOptimization Solution of New ModelNon-Inferior Solution of the Original ModelOptimization Solution of New Model
high-efficiency stationFangzhicheng1.961.912.241.053.852.08
Zhonglou2.612.213.62.966.565.69
Xiaozhai3.562.483.912.974.845.22
Longshouyuan3.682.764.253.294.214.01
Yongningmen3.673.693.152.886.265.28
medium-efficiency stationXingzhengzhongxin3.153.182.662.012.351.84
Kangfulu5.184.242.882.174.864.08
Low-efficiency stationTonghuamen3.083.921.991.065.293.29
Wulukou3.694.181.652.684.653.81
Disclaimer/Publisher’s Note: The statements, opinions and data contained in all publications are solely those of the individual author(s) and contributor(s) and not of MDPI and/or the editor(s). MDPI and/or the editor(s) disclaim responsibility for any injury to people or property resulting from any ideas, methods, instructions or products referred to in the content.

