Article

High-Performance Landscapes: Re-Thinking Design and Management Choices to Enhance Ecological Benefits in Urban Environments

1
The Nature Conservancy, Houston, TX 77098, USA
2
Tarrant Regional Water District, Fort Worth, TX 76102, USA
3
Regenerative Environmental Design, Austin, TX 78748, USA
4
Fort Worth Botanic Garden, Fort Worth, TX 76107, USA
5
Department of Agricultural Sciences and Engineering Technology, Sam Houston State University, Huntsville, TX 77340, USA
6
School of Architecture, University of Texas at Austin, Austin, TX 78712, USA
7
Department of Integrative Biology, University of Texas at Austin, Austin, TX 78712, USA
8
Lady Bird Johnson Wildflower Center, Austin, TX 78739, USA
*
Author to whom correspondence should be addressed.
Land 2023, 12(9), 1689; https://doi.org/10.3390/land12091689
Submission received: 28 July 2023 / Revised: 24 August 2023 / Accepted: 25 August 2023 / Published: 29 August 2023
(This article belongs to the Special Issue Feature Papers for Land Planning and Architecture Section)

Abstract

:
A growing body of research indicates that urban landscapes can support biodiversity and provide multiple ecosystem services. However, we still have limited knowledge about how specific design and management choices impact environmental benefits within highly modified landscapes. Furthermore, we know relatively little about the potential tradeoffs and synergies encountered when managing for multiple ecosystem services within urban landscapes. In this study, we address knowledge gaps in both research and practice by leveraging a ‘designed experiment’ approach that included a diverse team of researchers and practitioners to evaluate the impacts of designed landscapes on several focal environmental outcomes essential for urban sustainability. Specifically, we evaluated small-scale designed-landscape research plots that varied in plant richness, origin of vegetation, and drought tolerance, and we simultaneously quantified impacts on water conservation, pollinators, and maintenance-related impacts, as well as their intersection with aesthetic appeal for residents. Our results indicate that key landscape choices such as the selection of drought-tolerant plants and a diverse native plant palette can simultaneously enhance water conservation, increase resources for pollinators, and reduce maintenance impacts. Importantly, the designs that rated more highly in terms of visual quality were also those that supported higher pollinator biodiversity and required relatively little water for irrigation, indicating that synergy across multiple benefits is achievable in designed landscapes. In urban landscapes, aesthetic appeal is often a top priority, and our results indicate that visual quality does not need to be sacrificed in order to design landscapes that additionally support water conservation and provide resources for pollinators.

1. Introduction

Cities are increasingly recognized as drivers of innovation and are often on the front line of progress toward global sustainability [1]. With attention shifting from rural to urban areas as model systems for evaluating sustainability practices, there is a growing focus on the capacity of cities to sustainably integrate green and blue infrastructure and generate locally produced ecosystem services [2], defined as the diverse suite of processes through which natural systems support human life [3]. Indeed, urban green spaces, such as parks and nature preserves, can provide ecosystem services that improve the health and wellbeing of city residents, including the regulation of water flows, the mitigation of urban heat island effects, the support of desired wildlife species, and the provision of spaces for recreation, mental restoration, and aesthetic value [4,5].
However, while parks and preserves are critical components of urban ecosystems, ecologists and planners are increasingly recognizing the need to “think outside the park” and look for opportunities to integrate key habitat resources and enhance environmental benefits in many land-use types outside of large green spaces [6,7]. Within the field of urban landscape ecology, the “matrix” of land uses between large habitat patches is increasingly being recognized as an important consideration for urban conservation and management [8]. Small-scale individual management of green space, beyond park boundaries, is also very common in urban environments; for example, residential landscapes often comprise 30–40% of the total land area in cities and towns and provide just as much “green space” area as city parks [7]. A growing body of research suggests that many urban sites—across distinct sizes, management practices, and contexts within an urban ecosystem—have the potential to contribute to ecosystem services [9,10]. For example, even small patches of vegetation in developed areas can contribute to cooler microclimates at local scales [11], can store and sequester carbon [12], and can provide foraging and habitat resources that support native birds and pollinators [13]. However, despite both the potential for and complexity of urban ecosystem benefit provision, we still have limited knowledge about how specific vegetation design practices and management choices impact environmental benefits within developed landscapes.
Furthermore, we also lack an understanding of potential tradeoffs and synergies that may emerge within urban designed landscapes, given the need to manage for multiple ecosystem services [14]. In many real-world urban landscapes, outdoor spaces are designed and developed for a particular use or function, with less attention paid to potential co-benefits or tradeoffs that could be experienced at the same time, such as the benefits to human health and wellbeing that arise from contact with nature [15], the potential co-benefits to biodiversity [16], or the tradeoffs between landscape maintenance and a green space’s carbon footprint [17]. In addition, land use demands in urban and urbanizing areas, intensified by the housing affordability crisis, can impact ecosystem provision [18,19], including environmental injustice implications related to location and accessibility of vegetated urban spaces and associated benefits in highly competitive land markets [20,21,22]. Hence, due to land-use constraints, urban areas require design that allows for multifunctional use and associated layered ecosystem service provision [23,24]. For example, green space surrounding a school in a dense urban neighborhood can be managed with respect to recreation (e.g., a playground, sports fields), food production (e.g., produce gardens, orchards), habitat (e.g., a pollinator garden, riparian buffers), and water quality (e.g., raingardens, integrated pest management). Although multi-functional landscapes have recently been recognized as being important within urban systems [25,26], past research efforts in urban landscapes have often focused on a single ecological function or ecosystem service [27,28], rather than a suite of co-occurring services or outcomes (but see [29,30]).
Here, we address gaps in past research and practice by leveraging the ‘designed experiment’ approach [31] to address a key guiding question: How can real-world urban landscapes be designed to provide benefits across multiple environmental and social outcomes? Specifically, this research focuses on identifying (1) the relative importance of specific vegetation design practices in generating environmental benefits, and (2) the potential tradeoffs associated with those practices. The designed experiment approach “inserts designed experiments into the urban mosaic” and combines experimental research with real-world design and the myriad complexities of urban systems [31]. This approach uniquely positions researchers and practitioners to evaluate the outcomes of real choices made in urban landscapes every day and to generate knowledge applicable to enhancing environmental benefits in urban ecosystems [32]. Furthermore, the approach is enhanced by a strong collaborative partnership between ecologists, landscape designers, and landscape maintenance professionals, from project start to finish.
In this study, we strategically designed, established, and monitored a suite of small-scale designed-landscape research plots in Fort Worth, Texas, which we utilized, along with social surveys, to evaluate the impacts of designed landscapes on several environmental outcomes essential for urban sustainability: water conservation, pollinators, emissions associated with landscape maintenance, and aesthetic appeal for urban residents. Reducing water use in urban landscapes is recognized as a critical strategy for securing future water demands, especially in places likely to experience more frequent and extended droughts with climate change, as is expected in Texas [33] and much of the US [34]. Increasing resources for urban pollinators is also an important ecosystem service conservation strategy, as high floral species richness may promote bee visitation to both wild and cultivated plant species [35,36], potentially enhancing reproduction for ornamental and crop plants [36,37,38]. In addition, cities across the world are focusing on strategies to reduce their carbon emissions, and while many urban landscapes store and sequester greenhouse gases [11,39], conventional lawn and garden management practices, such as gas-powered mowing, fertilizer application, and irrigation, are associated with emissions of greenhouse gases that are important to consider when evaluating environmental costs and benefits of urban green areas [40,41]. In addition, gasoline-powered landscape maintenance equipment emits air pollutants that can have health implications for nearby residents [42]. To comprehensively evaluate tradeoffs and synergies across key environmental indices within designed urban landscapes, we drew on the expertise of a diverse and interdisciplinary research team—composed of urban ecologists, animal biologists, plant ecologists, horticulturalists, and environmental designers—and developed a unique designed experiment approach for evaluating the impacts of common landscape design choices on environmental outcomes. This approach also allowed us to quantify the synergies and tradeoffs in the focal environmental benefits, with an emphasis on practical application and management in real-world urban landscapes.
We evaluated the following research questions:
  • What specific design factors are most important for environmental benefits related to urban water conservation, increased pollinator visitor abundance and richness, and reduced emissions associated with maintenance?
  • Are there tradeoffs and synergies between environmental benefits and aesthetic appeal in designed landscapes?
  • What are the fundamental considerations for landscape designers, contractors, and maintenance professionals who aim to maximize environmental benefits and increase resilience in urban systems?

2. Materials and Methods
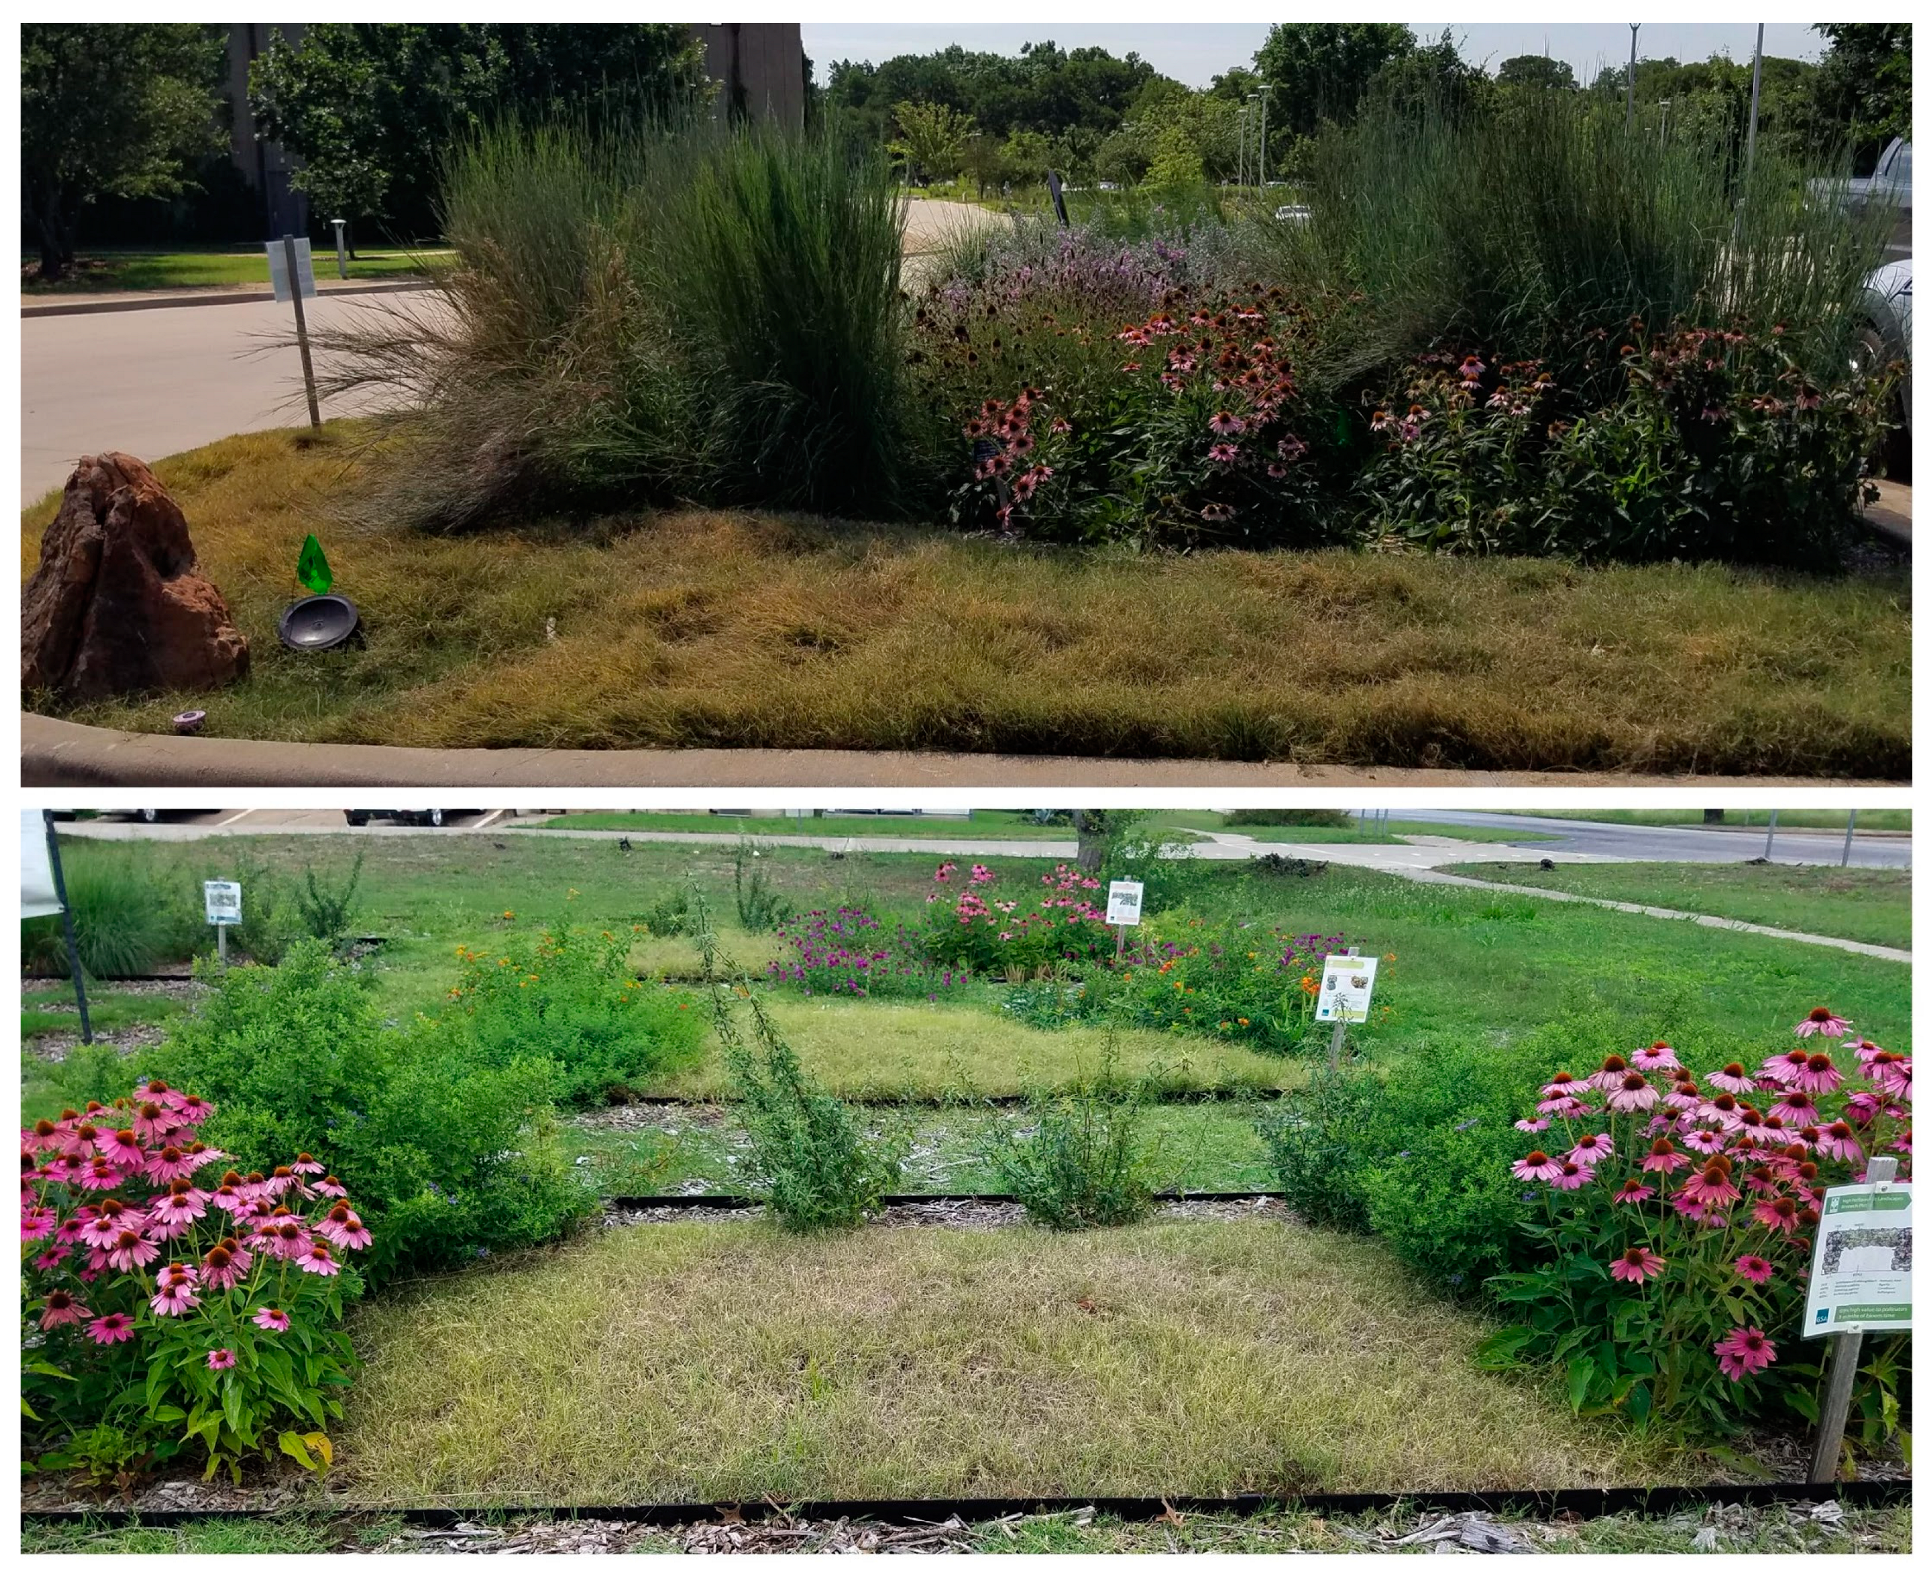
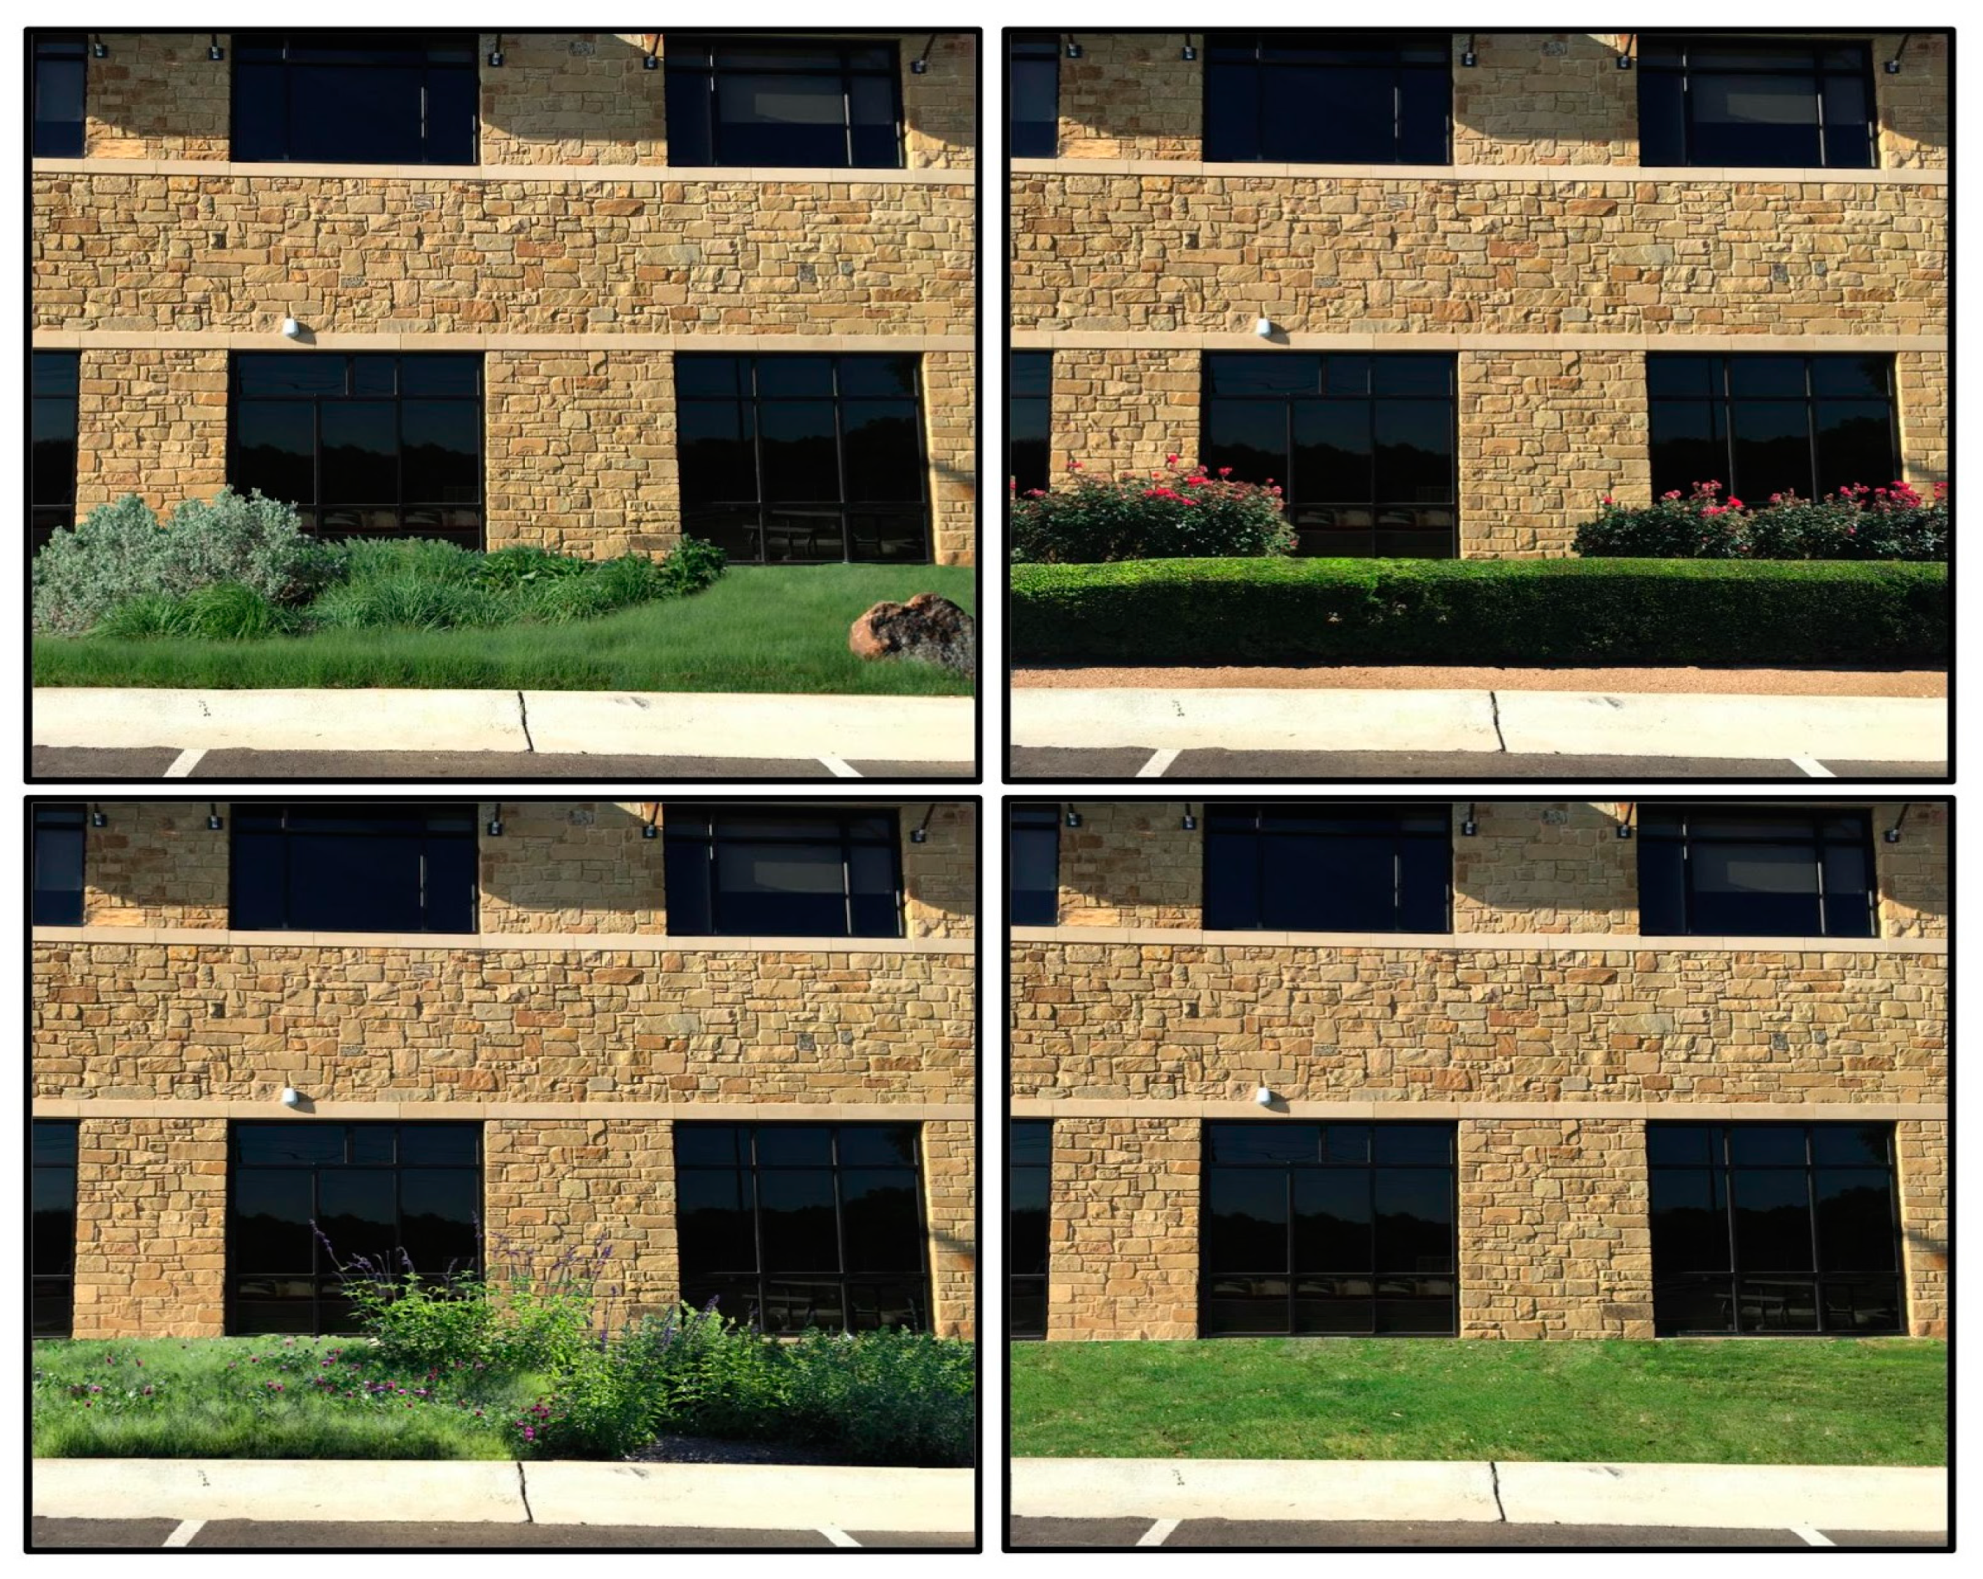
2.1. Study System

This research was performed across two land units in Fort Worth, Texas, a Fort Worth federal research site managed by the General Services Administration (GSA) (32.6714, −97.3327) and a public non-profit research site managed by the Botanical Research Institute of Texas (BRIT) (32.7413, −97.3633). These two land units were selected due to their space availability and willingness to participate in a landscape design experiment. Both sites were located in developed areas of Fort Worth, with similar climatic conditions, soils, and broader landscape characteristics; additionally, the BRIT site is open to public visitors and has an advanced irrigation control system that supported further data collection in the form of surveying about visual appeal and quantifying water use. For the GSA land unit, the 20 designed research plots were installed in a grassy field, with each plot measuring 15 × 7′ (105 ft2). For the BRIT land unit, the 20 designed research plots were installed in parking bay “endcaps”, which are the vegetated beds within parking lots and which represent a critical component of urban vegetation management [32], with each plot measuring between 116 and 325 ft2 (Figure 1). At the GSA land unit, the research plots focused on quantifying two categories of environmental costs/benefits: (1) pollinator abundance and richness and (2) maintenance-related impacts. At the BRIT land unit, given greater public visitation rates and irrigation control, the research plots focused on quantifying four categories of environmental costs/benefits: (1) pollinator abundance and richness; (2) maintenance-related impacts; (3) water use; and (4) aesthetic appeal (methodological details below). We used the imperial system for all measurements, given that this is the dominant unit of measurement in the US. All pollinator response variables, maintenance response variables, and water response variables were normalized per square foot to account for plot size differences at BRIT, and land unit was included as a random effect in all models that included data from both land units (analytical details below).

2.2. Plot Landscape Design: Predictor Variables

The structure and composition of the plots were outlined by the environmental designer (HV) utilizing a variety of plant species that represent the specific options that urban residents, landscape designers, and maintenance contractors consider every day. Specifically, the plots were designed to highlight three factors that are common decision points for urban landscape designers: origin of vegetation (i.e., native to local ecoregion or native elsewhere); richness of vegetation; and vegetation adaptation to soil moisture (water requirements). Plots were designed by a professional environmental designer on the interdisciplinary research team (HV) and were intended to be aesthetically appealing throughout the growing season, with a diversity of color and texture. All plots were located in full sun conditions and none of the plots contained trees. The plots were intended to represent common options and decision points for typical designed urban landscapes in the region, which tend to focus on the management of forbs and grasses.
The environmental designer (HV) and lead ecologist (JAB) worked together to implement an experimental regression design approach, which is an efficient approach well-suited for analysis of ecological data [43]. It allows for a full range of values for continuous predictor variables to be evaluated, rather than artificially transforming a continuous variable into a categorical variable to test only a few levels [43]. This approach required iterative and frequent communication between the environmental designer and the lead ecologist during the plot design phase, to ensure that the final landscape designs included a full and uniform range of three predictor variables: (i) native plant coverage, which ranged between 22 and 100%; (ii) plant richness, which ranged from two to seven species; and (iii) vegetation adaptation to soil moisture (water requirements), which ranged from low to high (described in detail below) (Table 1). These three variables reflect common decision points for urban landscape designers, and the plots represented the range of typical design options for the region [44]. For plots with less than 100% native plant coverage, non-native turfgrasses were used in the remaining areas of the plot (Bermuda grass, Cynodon dactylon, and St. Augustine turfgrass, Bouteloua dactyloides), as this is a common component of urban landscape design [44]. The landscape designer selected the native plants for the plots using the Native Plants of North America searchable database, run by the Lady Bird Johnson Wildflower Center [45], which can be filtered by plant characteristics such as plant origin, bloom color and season, benefits to pollinators, or resilience to water limitations. The designer selected native plants for the plots that were appropriate for local site conditions. All plots were designed to be similar in aesthetic to real landscapes installed in this region, based on the landscape designer’s professional experiences, and provide visual appeal throughout the growing season (Supplementary Materials File S1).
Research plots in both sites were constructed from March to June 2016, and existing soils were tested and amended prior to planting in order to ensure adequate drainage and equivalent soil conditions for the selected plant palettes across both sites. Soil tests prior to plant installation indicated consistent texture and bulk density, with pH and organic matter content suitable for plants native to North Central Texas [46]. Soil compaction levels were also measured with a penetrometer after plant establishment and were typical of landscaped beds of the region.
After establishment in June 2016, plot characteristics were repeatedly monitored. Specifically, the identity of plant species and percent cover by each species was recorded once every three months for each plot (March, June, and September 2017); this was accomplished by surveying the entire area of each plot to quantify plant species richness and percent coverage per plot of each species [47]. We used the plant species data and percent cover data to quantify the three predictor variables that represent common decision points for urban landscape designers (as described above). The first predictor variable, origin of vegetation, was represented by native plant cover, which was calculated as the average cover of plants native to this region (as defined by [45]) across the three sampling windows throughout the study period. The second predictor variable, plant richness, was calculated as the sum of the unique plant species present in the plot. The third predictor variable, vegetation adaptation to soil moisture, was represented by a soil moisture adaptation index, which was calculated for each plot by multiplying the percent cover of each plant species by a soil moisture adaptation factor (1 for dry soils, 5 for moist soils, and 10 for wet soils, as per [45]) and summing across all plants in the plot (similar to the landscape coefficient approach in [48]); this provided a simple measure that allowed us to characterize the overall soil moisture adaptation level for the plant community in each plot which ranged from low to high.

2.3. Data Collection: Response Variables

We collected data in four key categories related to environmental costs/benefits: (1) pollinators; (2) maintenance inputs; (3) water for irrigation; and (4) visual quality or aesthetic appeal. These four categories represent key focal areas of potential human benefit and management concern within many urban ecosystems (reviewed in [38]).

2.3.1. Pollinators

We quantified two response variables to characterize floral visitors from among Lepidoptera, Diptera, and Hymenoptera (hereafter pollinator visitors), which are insect orders that often act as pollinators (e.g., [49]) and have been monitored for fine-scale pollination service studies within urban landscapes (e.g., [37]): (a) visitor abundance and (b) visitor morphospecies richness. During each survey, a single observer stood near the plot edge and recorded all floral visitors within the plot for 10 consecutive minutes. Pollinator visitors were visually categorized into morphospecies (as per [50]), either in real time or later with photos taken of the pollinators. Such visual surveys are effective at characterizing pollinator community composition and are particularly useful in sites where destructive sampling is not possible [51], such as public botanic gardens. We used a range of resources to identify pollinators, including Bees of Central Texas [52], Bee Genera of North and Central America [53], Bumble bees of the Western US [54], Hymenoptera of the World: an identification guide to families [55], and BugGuide [56]. Measures of both pollinator response variables were taken once per month over 10 months between 2016–2017 (June, July, and September of 2016; March, April, May, June, July, August, and September of 2017). All surveys were completed between 7 a.m. and 3 p.m., with temperatures above 70 °F and wind speed not exceeding 8 mph. For every site, each month, pollinator surveys were conducted on the same day for all plots, and both sites were surveyed within 5 days of each other.

2.3.2. Maintenance Time and Associated Emissions

We used an online form to allow staff and volunteers to log the details of each maintenance event, from which we summarized two response variables related to maintenance activities for each plot: (a) time of fuel-powered equipment use per square foot, as a proxy for the estimated emissions associated with landscape maintenance (sensu [39]); and (b) total time dedicated to landscape maintenance per square foot, including time spent on manual maintenance (e.g., hand-weeding, pruning) in addition to fuel-powered maintenance. Maintenance guidelines typical of urban green spaces were followed as prescribed by the landscape designer (HV) for the project. Such maintenance is often used to compare vegetation management strategies, and in our study included activities such as weeding, mowing, edging using a string trimmer, and pruning old or excess growth. All plots were maintained weekly during the growing season, and monthly during the dormant season. Response variables were averaged across all 15 months for which maintenance data were collected.

2.3.3. Water

We measured two response variables to evaluate the water conservation potential for each plot: (a) average number of consecutive days without supplemental irrigation for which a plot could maintain high aesthetic appeal (‘dry days’), and (b) average monthly irrigation rate required to maintain high aesthetic appeal (reported in inches for ease of local interpretation). Both response variables integrate a visual quality rating system because aesthetic appeal is often a top priority in urban designed landscapes. These methods and the visual quality rating system were adapted from a similar study evaluating aesthetic appearance of plants with restricted irrigation levels [57]. These variables approximate total irrigation volume and irrigation frequency, two important metrics in real-world designed landscapes.
Our first water-related response variable, ‘dry days’, was quantified with a monthly check in which all plots were irrigated at the beginning of the month with the same application rate (in terms of volume per square foot). To determine the initial application rate for each plot in each month, we used a simplified version of the Water Demand calculation by multiplying the area of the plot (in square feet), the weekly reference evapotranspiration rate in Dallas–Fort Worth for that time period (in inches), a plant factor of 0.3 (as suggested for native plants in Texas [58]), and a conversion factor (0.623 to convert inches of water per square foot to gallons) (as per [59]). The resulting water volume (in gallons) from the Water Demand calculation was then divided by the plot’s irrigation head application rate (in gallons per minute, or GPM, as quantified by a professional irrigation contractor on a per-plot basis) to determine the number of minutes that each plot’s irrigation system was turned on for the initial irrigation event each month. After the initial irrigation event each month, plots were monitored daily for visual quality by a consistent observer while irrigation was withheld from the plots. The visual quality of each plot was rated daily using a scale from 1 to 5, where 1 = dead, 3 = minimally acceptable appearance in a landscape, and 5 = excellent color and optimum aesthetic appearance (as per [57]) by the same observer. When plants in a plot showed the first indication of water stress (e.g., wilting vegetation, brown leaves, or dropped leaves) and dropped below a visual quality rating of 5, irrigation for that plot was resumed, and the number of days since irrigation, referred to as ‘dry days,’ was recorded.
Our second water-related response variable, average monthly irrigation rate required to maintain high aesthetic appeal, was quantified by recording details about plot-level irrigation requirements (as described above) in an irrigation log maintained by on-site research staff. For the duration of the study, irrigation rates were adjusted up or down on a per-plot basis based on the visual quality rating system described above [57]. This allowed us to fine-tune the irrigation rates so we could better understand the water needs required to achieve high aesthetic appeal, the primary objective for most urban landscape managers, rather than applying consistent irrigation rates to all plots (sensu [57]). Specifically, the date and number of minutes of irrigation applied per plot for each irrigation event was recorded. As described above, the application rates of the irrigation heads for each plot (in gallons per minute, or GPM) were determined by a professional irrigation contractor; the applied minutes of irrigation were multiplied by the plot’s GPM to calculate the water volume applied in gallons and then divided by total plot area to calculate the volume of water applied per unit area of landscape, where we report irrigation rate in inches, calculated using a standard conversion factor (1″ = 0.623 gallons per square foot). For both water-related response variables, measurements were repeated for nine months across all four seasons: twice in autumn (October and November 2016); twice in winter (December and February 2017); three times in spring (March, April, and May 2017); and twice in summer (July and September 2017).

2.3.4. Visual Ratings

We developed a social survey instrument to evaluate a single response variable, a visual quality rating of landscape design, modeled after a similar survey developed in human–landscape interaction research [60]. The survey was designed to evaluate the visual appeal of 12 different landscape designs, including six designs from the BRIT land unit and six more conventional non-native landscape designs. The six landscape designs from the BRIT land unit were selected as a random subset of the BRIT research plots (Plots B, D, G, J, N, and O; details in Supplementary Materials File S1). The six conventional non-native landscape designs were photographed in urban commercial areas nearby. The survey contained a photograph of each landscape design in front of a consistent background—a conventional multi-story office building that is a typical setting for urban landscapes and similar in style to the BRIT facility (Figure 2). All images were modified in Photoshop to include an identical building in the immediate background and were similar in lighting and scale (similar to the approach of [60]). In addition, all photographs were taken during the same timeframe (early May) to standardize for season. This survey instrument allowed us to evaluate the aesthetic appeal of an important subset of our experimental plots, while controlling for built landscape background/context and seasonality, as well as making the survey more accessible to the broader community, including those who do not typically visit botanic gardens. We aimed to keep the survey relatively short (12 pages with one landscape photograph per page) to be respectful of the participants’ time.
Respondents ranked the appeal of each landscape using a 7-point Likert scale, with 1 as “dislike very much” and 7 as “like very much” for the landscape in the photograph (adapted from [61]). The questionnaire was printed on colored-paper booklets and distributed to attendees of several public events held in Fort Worth in 2017, including Prairie Day (a family event open to the public), research presentations, and teacher training workshops held at the BRIT facility. We attempted to include a diverse group in our sample population, including students from local universities and local teachers; however, we note that public events, presentations, and workshops were inherently themed around botany, and thus the respondents may have been more familiar with native plants than other community members. In total, 160 individuals responded to the survey. The questionnaire and associated research methods (Supplementary Materials File S2) were reviewed and approved by the Institutional Review Board at St. Edward’s University in Austin, Texas.

2.4. Analysis

2.4.1. Model Selection for Pollinators, Maintenance-Related Variables, and Water

In order to quantify the impacts of key landscape design choices on multiple categories of environmental benefits, we developed individual models for the response variables measured in the experimental plots (pollinators, maintenance-related impacts, and water). Each model included the three predictor variables described above: (1) native plant coverage; (2) plant richness; and (3) vegetation adaptation to soil moisture adaptation. Since one of our primary goals was to identify the landscape design choices that result in the greatest quantifiable impact on environmental benefits, we used the information-theoretic model comparison approach to investigate the relative importance of the three different predictor variables on the response variables for pollinators, maintenance-related impacts, and water. This approach allows multiple hypotheses to be examined simultaneously in order to identify the best-supported model [62,63]. The models for each environmental category were ranked with Akaike’s information criterion corrected for small sample sizes (AICc) [62], and the single best model for each is reported in the Results. We used the MuMIn package in R for all model selection and model averaging analyses [64]. For models where datasets from both land units were included (Pollinators and Maintenance), we included ‘land unit’ as a random effect in linear mixed-effects models using the lme4 package in R [65], and used linear models in the R stats package for datasets where only one land unit was included (Water). No multicollinearity was detected between predictor variables (all variance inflation factors < 4). In order to appropriately assess the impact of predictor variables measured in units with different magnitudes, all continuous variables were standardized prior to modeling using the stdize function in the MuMIn package, which scales each element of the vector by subtracting the mean and dividing by the standard deviation. The response variables were normally distributed, with the exception of fuel-powered equipment time, pollinator visitor abundance, and pollinator visitor richness (for which we used a square root transformation to improve normality).

2.4.2. Visual Quality Ratings

Visual quality ratings were summarized from all survey participants (n = 160). First, we compared visual quality ratings for the research plot landscape designs (n = 6) and conventional landscape designs (n = 6) using Mann–Whitney U-tests. Given that many of our surveys were conducted at botanically themed events, we performed a follow-up analysis focusing only on teachers attending a STEM curriculum training workshop (unrelated to plants) and analyzed those responses (n = 32) in isolation from the other respondents.

2.4.3. Tradeoffs and Synergies

For the final portion of the analysis, we used pairwise Spearman correlations to identify synergies and tradeoffs between the distinct environmental benefits in the BRIT land unit. We selected a single focal indicator (to avoid collinearity) per environmental indicator category. The goal of this analysis was to explore whether it is possible to achieve high performance across the different indicator categories we evaluated: (a) pollinator visitors per plot (focusing on visitor morphospecies richness); (b) water use (focusing on average irrigation rates); (c) maintenance-related impacts (focusing on fuel-powered equipment use associated with maintenance hours); and (d) visual quality ratings.

3. Results

3.1. Pollinators

In total, 4840 observations of floral visitors were recorded across all plots at both study sites. A total of 112 morphospecies were recorded, 92 of which were Lepidopterans, Dipterans, and Hymenopterans, and were therefore assumed to be pollinators. Substantial differences were observed between plots, with pollinator visitation ranging from 4 to 204 visits per plot per observation period (mean = 94.3, SD = 62.4) and morphospecies richness per plot ranging from 4 to 36 per observation period (mean = 18.9, SD = 8.7). European honeybees (Apis mellifera) were the most commonly observed pollinator (n = 1361), followed by grass skipper butterflies (Hesperiidae/Hesperiinae) (n = 513) and small sweat bees (Halictus spp.) (n = 162).
In the model comparison, the best-supported model for pollinator visitors and pollinator visitor richness included plant richness (+), which had a positive impact on both response variables (Table 2). The best-supported models explained 32% and 31% of the variance for pollinator visitors and pollinator visitor richness, respectively.

3.2. Maintenance Time and Associated Emissions

Plots required an average of 19.8 min of maintenance per month (SD = 7.8, min = 8.1, max = 37.8 min per month). The majority of this time was spent on manual maintenance tasks such as hand-weeding and pruning. In addition, the average plot required 2.3 min of fuel-powered equipment use per month (SD = 1.7, min = 0, max = 7.1 min per month). Seven of the plots required no fuel-powered equipment at all during the 16 months of the study; these plots were characterized by high native plant cover (mean 87% cover of native plants) and zero coverage of non-native turfgrasses.
In our model comparisons, the best-supported model for fuel-powered equipment time included native plant cover (−) and plant richness (+) (Table 2). The best-supported model for total maintenance time included plant richness (+) only. The best-supported model for both maintenance-related response variables performed relatively poorly (R2 = 0.20 for fuel-powered equipment time and R2 = 0.09 for total maintenance time).

3.3. Water

The mean number of ‘dry days’ per month was 19.5 (minimum = 14.3 days per month; maximum = 24.3 days per month) and average supplemental irrigation rate required to maintain aesthetic quality was 1.44 inches per month (minimum = 0.61 inches per month; maximum = 2.65 inches per month).
The best-supported model for both of the water-related response variables included only one predictor variable, vegetation adaptation to soil moisture, which was positively related to irrigation rate (+) and negatively related to ‘dry days’ (−). In other words, plots with more native plants adapted to dry soils had lower average irrigation volumes and less frequent irrigation requirements for maintaining high aesthetic quality (Table 2). The best-supported models explained 63% and 48% of total variance for irrigation volume and ‘dry days’, respectively. Native plant cover and plant richness were not included in the best-supported model for either response variable.

3.4. Visual Quality Ratings

Across all survey respondents (n = 160), research plot landscapes were rated significantly higher than conventional non-native landscapes commonly found in commercial areas (research plot mean = 4.98, conventional mean = 2.80, on a Likert scale of 1–7 with 1 indicating “dislike very much” and 7 indicating “like very much”; p < 0.0001 in Mann–Whitney U test). As a follow-up analysis, we found that a group of teachers who took the survey during a general curriculum training workshop (n = 32) had ratings that were consistent with those of the entire group of respondents (research plot mean = 4.92, conventional mean = 3.46, p < 0.0001 in Mann–Whitney U test).

3.5. Tradeoffs and Synergies

We documented a synergy between pollinator visitor richness per plot and visual quality, which were strongly positively correlated (Table 3). There was also a synergy between pollinator richness and reduced water use, where increased pollinator richness was correlated with reduced irrigation rates. We also found a weak but significant relationship between pollinators and fuel-powered equipment use during maintenance, in which greater pollinator richness occurred in plots with lower fuel-powered equipment use. Furthermore, we found a negative (but non-significant) relationship between water and visual quality, whereby plots with lower irrigation rates had higher visual ratings.

4. Discussion

In this uniquely integrative urban design experiment, we quantified diverse environmental benefits and numerous synergies experienced as part of real-world urban management decisions. Our results indicate that landscape design choices can simultaneously have positive impacts on water conservation and pollinators, while reducing maintenance time and carbon emissions. In total, we observed 92 pollinator morphospecies in designed landscape plots over 10 months, and plots retained high visual quality for nearly 3 weeks (on average) without irrigation. Importantly, we also found that designs that rated highly in terms of visual quality also supported high pollinator species richness and required relatively little water for irrigation. Thus, our study is one of the first to demonstrate that residents and landscape designers can optimize multiple distinct environmental outcomes, especially in low water urban systems, by landscaping with a diverse native plant palette and selecting plants with targeted benefits for both water and pollinator conservation.

4.1. Broader Environmental Benefits from Decisions in Small-Scale Urban Landscapes

Our findings join a growing body of research indicating that even small-scale planted areas, such as native plant landscapes interspersed within an impervious parking lot, can provide benefits to urban wildlife, especially birds and bees [66,67,68]. For example, we found that pollinator visitation responded at very localized scales, where plots with just two native plant species tended to be visited by far fewer pollinators (as few as 4 visits per observation period) than plots with five or more native plantings (as many as 198 visits per observation period). Although both local- and landscape-scale variables have been shown to be important for urban pollinator community composition in previous research (e.g., [69]), our study, which focused on fine-scale visitation, indicated that floral visitors can respond to plantings at hyper-local scales (as seen in [67,70,71]). For landscape designers, it may be helpful to consider planting layouts that include clumps of an individual plant species that are at least 3 feet (1 m) in diameter, as recommended by pollinator experts [72] and as implemented by the environmental designer in this study. These results are encouraging for individual land managers within the urban matrix who may wish to enhance their own local habitats to increase pollinator visitation, regardless of landscape size or surrounding context.
Furthermore, improving water conservation in urban landscapes is an important long-term strategy for reducing potable water demand and managing water resources sustainably. This is especially important in light of the increased stress on water supplies and intensified droughts that are projected with climate change [73]. Our results indicate that water savings resulting from targeted plant palettes is substantial—we found that supplemental irrigation could be substantially reduced (from an average of 2.5 inches per month to less than 1 inch per month) by choosing native plants adapted to dry soil moisture conditions. To illustrate this with an example, September 2017 was a particularly hot and dry month in the study region, and plots with drought-adapted plants required an average of only 1.4 inches of supplemental irrigation during that month, while plots without these drought-tolerant species required an average of 3.0 inches or more of supplemental irrigation. Given that landscape irrigation comprises 31% of residential water use in cities in Texas on average [74], our results suggest that changes in landscape plant palettes could result in dramatic reductions in potable water consumption. In fact, the city of San Antonio, Texas, has seen reductions in potable water use of approximately 15–25% over the past 20 years (despite experiencing rapid growth), thanks in large part to its incentives and educational campaigns focused on drought-tolerant landscaping and more efficient irrigation techniques [75]. While irrigating landscapes can have local benefits in terms of mitigating urban heat island effects [76,77], potable water also has a carbon footprint of its own due to the embodied energy required for treatment and distribution [78]. Increasingly, municipalities are seeking to address these tradeoffs by conserving water resources and using non-potable water sources like rainwater, air conditioner condensate, or graywater to meet non-drinking water needs (e.g., [79]).

4.2. Synergies in Environmental Benefits in Urban Landscapes

An important component of this research project was our evaluation of environmental costs and benefits across multiple categories, which allowed us to examine the potential synergies and tradeoffs in environmental outcomes. Tradeoffs in ecosystem services have been evaluated at broad landscape scales (e.g., [80]), but rarely monitored or evaluated at finer spatial or temporal scales, despite the relevance of both scales to the populations of service-providing organisms and human beneficiaries (reviewed in [26,81]). Our results highlight several important synergies between environmental benefits in real-world urban landscapes, suggesting that design and management choices at small scales can provide multiple desired outcomes simultaneously.
In urban landscapes, aesthetic appeal is often a top priority, and our results indicate that visual quality does not need to be sacrificed in order to design landscapes that additionally support water conservation and provide resources for pollinators. We found a strong positive correlation between visual ratings and pollinator richness, likely because a diverse plant palette appeals to both humans and pollinators [82,83]. Furthermore, we found a positive relationship between visual ratings and water conservation, in that plots with lower irrigation rates had higher visual ratings. While some of our survey respondents may have had greater familiarity with native plants, we found similar trends when analyzing a subset of respondents who attended workshops unrelated to botany. This indicates that designers do not have to choose between aesthetic appeal and environmental performance—with targeted plant palettes, multiple objectives can be met.
Our findings also highlight that landscape maintenance techniques in real-world urban landscapes involve a different set of “tradeoffs”, specifically in terms of maintenance. We found that plots with greater native plant cover required less fuel-powered equipment use; however, native plant cover was not an important variable explaining total maintenance time. These results support the conventional wisdom that native plant landscapes require less maintenance [84] with respect to fuel-powered maintenance. While native plant landscapes in our study required relatively little fuel-powered equipment, we note that they still required manual maintenance, such as hand weeding or pruning.

4.3. Tools and Approaches for Urban Landscape Designers

Overall, we demonstrate that the careful selection of plants utilized in urban landscape design can help land managers achieve multiple environmental benefits simultaneously. There are several tools and programs that urban landscape designers may find useful early in the design process [85]. For example, the Native Plants of North America searchable database, run by the Lady Bird Johnson Wildflower Center, can be a helpful resource for landscape designers during the plant selection process. This tool enables users to conduct custom searches for plants with specific characteristics, such as plants that have special value to native bees and plants that are adapted to dry soil moisture conditions, in addition to many other filters (such as bloom time, bloom color, shade tolerance, and growth pattern), which may be important to designers seeking to achieve multiple goals in urban landscapes [45]. Our results also suggest that weighing tradeoffs and considering long-term maintenance requirements early in the design process can help maximize the environmental benefits of urban landscapes. To that end, the Landscape Performance Series has compiled a “Benefits Toolkit” [86] that allows users to explore the potential benefits associated with different landscape design and management decisions in terms of their effects on carbon footprint, water conservation potential, stormwater management, habitat quality, and many more. Lastly, comprehensive tools like SITES [87] can be very useful for designers interested in a broad suite of sustainability metrics. SITES is a green building rating system for landscapes that focuses on soils, plants, water, materials, human health and wellbeing, and construction practices. Whether or not a project is pursuing certification, SITES prerequisites and credits can create a framework for project planning and design decisions that guide a site toward more sustainable outcomes [88,89]. Landscape for Life is a sustainable garden resource website and educational program based on the principles of SITES. The educational tool was developed specifically for homeowners and residential garden designers [90]. These types of tools can guide and support urban landscape designers in integrating habitat resources and environmental benefits into all types of sites within urban landscapes, regardless of site size, type, or location—even within parking lots.
In addition, we would also like to note that the approach we used here—in which a landscape designer worked alongside researchers in an interdisciplinary research team—is an important strategy for collecting relevant environmental cost and benefit data within real-world designed landscapes. For example, without the integration of the environmental designer as part of the research team, the methods focused on rating visual quality and irrigation restriction would not have been included, as these are typically not incorporated in ecological studies, even those conducted in urban landscapes [91]. Furthermore, integrating the environmental designer into the research design process enabled us to develop plots that represented realistic urban landscape designs while simultaneously including a broad range of predictor variables to meet the requirements of an experimental regression design. By connecting practitioners with research scientists, we extended the potential impact of this research to integrate the interests of homeowners, gardeners, and landscape designers who are trying to achieve visually appealing and sustainable landscapes. Our interdisciplinary research team was able to collect data and analyze research questions relevant to the decisions made by multiple stakeholders in urban landscapes.

4.4. Opportunities for Municipal Policy to Shape Urban Landscape Design

At a larger spatial scale, municipal policymakers can use incentives or regulations to shape urban landscape design, including those that encourage the use of native plants to reduce water and fossil fuel use and increase pollinator and aesthetic appeal. Cost-sharing incentives such as grants, technical assistance, or rebates can be used to increase the use of native plants within residential and commercial landscapes. Incentives that are structured as grants or technical assistance for design/implementation can be more equitable for lower-income households and small businesses that may not have the financial capacity to pay upfront for design/implementation and later submit paperwork for a municipal rebate [92,93]. Other urban greening programs, such as those focused on energy efficiency or green stormwater, have found that incentives structured as grants or technical assistance are also more accessible to renters, who often make up a significant percentage of urban residents and who are less likely to spend funds to benefit a property which they do not own [94,95]. While municipalities have commonly used residential-scaled regulations for ecosystem services such as stormwater infiltration, water quality protection, and water conservation [96,97], municipalities in the US infrequently use regulations to enforce new or redesigned landscape standards that support biodiversity or habitat conservation. In addition, counterproductively, existing residential landscape regulations can reduce some ecosystem service provisioning through prohibitions on plant height and wilder, less visually ordered landscaping [96,98,99]. Going forward, landscape architects could work with municipal staff to develop landscape practices that better balance a broader array of ecosystem services, utilizing, for example, the SITES or Landscape Performance Series toolkit mentioned above. Lastly, the co-benefits we found between native-plant landscape management and fossil fuel reduction (even though human labor costs remained) suggest that municipal “green New Deal” programs that seek to employ residents in activities that reduce carbon use and/or increase climate adaptation, such as the City of Austin’s Austin Civil Conservation Corps program [100,101], may offer a policy mechanism that produces synergy among the establishment of urban native plant landscapes, fossil fuel reduction, and local workforce development opportunities.

5. Conclusions

By 2030, global urban land cover is expected to increase by 1.2 million km2, which represents a tripling of urban areas since 2000 [102]. As cities expand over the next century, we have an opportunity to re-think the way we design and manage our urban landscapes in order to provide important ecosystem services for city residents and to reduce the environmental footprints of cities themselves. Our designed experiment revealed that key landscape design factors can have simultaneous positive impacts on water conservation, resources for pollinators, and maintenance-related emissions. Importantly, we found synergies—rather than tradeoffs—between several key environmental categories, where the landscapes that rated highly in terms of visual quality also supported high pollinator species richness and required relatively little water for irrigation. Our results build on recent research indicating that local management decisions in urban areas can “scale up” to generate broader benefits for urban conservation outcomes [103,104,105]. Most importantly, we showed that small-scale developed landscapes can make contributions to human wellbeing via landscape aesthetics, water conservation, pollinator habitat, and reduced emissions, illustrating the wide variety of distinct synergies possible with integrative and inclusive perspectives in urban design.

Supplementary Materials

The following supporting information can be downloaded at: https://www.mdpi.com/article/10.3390/land12091689/s1, File S1: Plot characteristics; File S2: Full text of questionnaire.

Author Contributions

Conceptualization, J.A.B., H.V., H.B., K.B. and S.J.; methodology, J.A.B., H.V., H.B. and S.J.; formal analysis, J.A.B.; investigation, J.A.B. and H.B.; writing—original draft preparation, J.A.B., H.B., H.V., K.B., T.P., K.L. and S.J; writing—review and editing, J.A.B. and H.B., H.V., K.B., T.P., K.L. and S.J.; project administration, H.B. and K.B. All authors have read and agreed to the published version of the manuscript.

Funding

This research was funded by a collaboration between the Botanical Research Institute of Texas and the General Services Administration.

Data Availability Statement

The data presented in this study are openly available in FigShare at 10.6084/m9.figshare.24045375.

Conflicts of Interest

The authors declare no conflict of interest.

References

  1. Glaeser, E. Engines of Innovation. Sci. Am. 2011, 305, 50–55. [Google Scholar] [CrossRef] [PubMed]
  2. McPhearson, T.; Andersson, E.; Elmqvist, T.; Frantzeskaki, N. Resilience of and through urban ecosystem services. Ecosyst. Serv. 2015, 12, 152–156. [Google Scholar] [CrossRef]
  3. Daily, G. (Ed.) Nature’s Services: Societal Dependence on Natural Ecosystems; Island Press: Washington, DC, USA, 1997. [Google Scholar]
  4. Bolund, P.; Hunhammar, S. Ecosystem services in urban areas. Ecol. Econ. 1999, 29, 293–301. [Google Scholar] [CrossRef]
  5. Gómez-Baggethun, E.; Barton, D.N. Classifying and valuing ecosystem services for urban planning. Ecol. Econ. 2013, 86, 235–245. [Google Scholar] [CrossRef]
  6. Marzluff, J.M.; Rodewald, A.D. Conserving Biodiversity in Urbanizing Areas: Nontraditional Views from a Bird’s Perspective. Cities Environ. 2008, 1, 1–27. [Google Scholar] [CrossRef]
  7. Minor, E.S.; Anderson, E.; Belaire, A.J.; Garfinkel, M.; Smith, A. Urban green infrastructures and ecological networks for urban biodiversity conservation. In Urban Biodiversity; Ossola, A., Niemela, J., Eds.; Routledge: London, UK, 2017. [Google Scholar]
  8. Norton, B.; Evans, K.L.; Warren, P.H. Urban Biodiversity and Landscape Ecology: Patterns, Processes and Planning. Curr. Landsc. Ecol. Rep. 2016, 1, 178–192. [Google Scholar] [CrossRef]
  9. Lovell, S.T.; Johnston, D.M. Designing Landscapes for Performance Based on Emerging Principles in Landscape Ecology. Ecol. Soc. 2009, 14, 44. Available online: http://www. ecologyandsociety.org/vol14/iss1/art44/ (accessed on 1 July 2010). [CrossRef]
  10. Windhager, S.; Steiner, F.; Simmons, M.T.; Heymann, D. Toward Ecosystem Services as a Basis for Design. Landsc. J. 2010, 29, 107–123. [Google Scholar] [CrossRef]
  11. Shashua-Bar, L.; Pearlmutter, D.; Erell, E. The cooling efficiency of urban landscape strategies in a hot dry climate. Landsc. Urban Plan. 2009, 92, 179–186. [Google Scholar] [CrossRef]
  12. Davies, Z.; Edmonson, J.; Heinemeyer, A.; Leake, J.; Gaston, K.J. Mapping an urban ecosystem service: Quantifying above-ground carbon storage at a city-wide scale. J. Appl. Ecol. 2011, 48, 1125–1134. [Google Scholar] [CrossRef]
  13. Narango, D.L.; Tallamy, D.W.; Marra, P.P. Native plants improve breeding and foraging habitat for an insectivorous bird. Biol. Conserv. 2016, 213, 42–50. [Google Scholar] [CrossRef]
  14. Perring, M.P.; Maning, P.; Hobbs, R.J.; Lugo, A.E.; Ramalho, C.E.; Standish, R.J. Novel urban ecosystems and ecosystem services. In Novel Ecosystems: Intervening in the New Ecological World Order; Hobbs, R.J., Higgs, E.S., Hall, C.M., Eds.; Wiley-Blackwell: Oxford, UK, 2013; pp. 310–325. [Google Scholar]
  15. Kondo, M.C.; South, E.C.; Branas, C.C. Nature-Based Strategies for Improving Urban Health and Safety. J. Urban Health 2015, 92, 800–814. [Google Scholar] [CrossRef] [PubMed]
  16. Aronson, M.F.; Lepczyk, C.A.; Evans, K.L.; Goddard, M.A.; Lerman, S.B.; MacIvor, J.S.; Nilon, C.H.; Vargo, T. Biodiversity in the city: Key challenges for urban green space management. Front. Ecol. Environ. 2017, 15, 189–196. [Google Scholar] [CrossRef]
  17. Strohbach, M.W.; Arnold, E.; Haase, D. The carbon footprint of urban green space—A life cycle approach. Landsc. Urban Plan. 2012, 104, 220–229. [Google Scholar] [CrossRef]
  18. Haaland, C.; van den Bosch, C.K. Challenges and strategies for urban green-space planning in cities undergoing densification: A review. Urban For. Urban Green. 2015, 14, 760–771. [Google Scholar] [CrossRef]
  19. Gomes, E.; Inácio, M.; Bogdzevič, K.; Kalinauskas, M.; Karnauskaitė, D.; Pereira, P. Future land-use changes and its impacts on terrestrial ecosystem services: A review. Sci. Total Environ. 2021, 781, 146716. [Google Scholar] [CrossRef]
  20. Kronenberg, J.; Haase, A.; Łaszkiewicz, E.; Antal, A.; Baravikova, A.; Biernacka, M.; Dushkova, D.; Filčak, R.; Haase, D.; Ignatieva, M.; et al. Environmental justice in the context of urban green space availability, accessibility, and attractiveness in postsocialist cities. Cities 2020, 106, 102862. [Google Scholar] [CrossRef]
  21. Rigolon, A.; Németh, J. Green gentrification or ‘just green enough’: Do park location, size and function affect whether a place gentrifies or not? Urban Stud. 2020, 57, 402–420. [Google Scholar] [CrossRef]
  22. Sikorska, D.; Łaszkiewicz, E.; Krauze, K.; Sikorski, P. The role of informal green spaces in reducing inequalities in urban green space availability to children and seniors. Environ. Sci. Policy 2020, 108, 144–154. [Google Scholar] [CrossRef]
  23. Mitchell, M.G.; Devisscher, T. Strong relationships between urbanization, landscape structure, and ecosystem service multifunctionality in urban forest fragments. Landsc. Urban Plan. 2022, 228, 104548. [Google Scholar] [CrossRef]
  24. Peng, R.; Liu, T.; Cao, G. Valuating Multifunctionality of Land Use for Sustainable Development: Framework, Method, and Application. Land 2023, 12, 222. [Google Scholar] [CrossRef]
  25. Belaire, J.A.; Higgins, C.; Zoll, D.; Lieberknecht, K.; Bixler, R.P.; Neff, J.L.; Keitt, T.H.; Jha, S. Fine-scale monitoring and mapping of biodiversity and ecosystem services reveals multiple synergies and few tradeoffs in urban green space management. Sci. Total Environ. 2022, 849, 157801. [Google Scholar] [CrossRef] [PubMed]
  26. Jha, S.; Egerer, M.H.; Bichier, P.; Cohen, H.; Liere, H.; Lin, B.B.; Lucatero, A.; Philpott, S.M. Multiple ecosystem service synergies and landscape-mediation of biodiversity within urban agroecosystems. Ecol. Lett. 2023, 26, 369–383. [Google Scholar] [CrossRef]
  27. Lowenstein, D.M.; Matteson, K.C.; Minor, E.S. Diversity of wild bees supports pollination services in an urbanized landscape. Oecologia 2015, 179, 811–821. [Google Scholar] [CrossRef]
  28. Matos, P.; Vieira, J.; Rocha, B.; Branquinho, C.; Pinho, P. Modeling the provision of air-quality regulation ecosystem service provided by urban green spaces using lichens as ecological indicators. Sci. Total Environ. 2019, 665, 521–530. [Google Scholar] [CrossRef]
  29. Pickard, B.; Van Berkel, D.; Petrasova, A.; Meentemeyer, R. Forecasts of urbanization scenarios reveal trade-offs between landscape change and ecosystem services. Landsc. Ecol. 2017, 32, 617–634. [Google Scholar] [CrossRef]
  30. Ziter, C. The biodiversity–ecosystem service relationship in urban areas: A quantitative review. Oikos 2016, 125, 761–768. [Google Scholar] [CrossRef]
  31. Felson, A.J.; Pickett, S.T. Designed experiments: New approaches to studying urban ecosystems. Front. Ecol. Environ. 2005, 3, 549–556. [Google Scholar] [CrossRef]
  32. Felson, A.J.; Bradford, M.A.; Terway, T.M. Promoting Earth Stewardship through urban design experiments. Front. Ecol. Environ. 2013, 11, 362–367. [Google Scholar] [CrossRef]
  33. Banner, J.L.; Jackson, C.S.; Yang, Z.L.; Hayhoe, K.; Woodhouse, C.; Gulden, L.; Jacobs, K.; North, G.; Leung, R.; Washington, W.; et al. Texas Water Journal climate change impacts on Texas water A white paper assessment of the past, present and future and recommendations for action. Tex. Water J. 2010, 1, 1–19. [Google Scholar] [CrossRef]
  34. Cook, B.I.; Mankin, J.S.; Marvel, K.; Williams, A.P.; Smerdon, J.E.; Anchukaitis, K.J. Twenty-First Century Drought Projections in the CMIP6 Forcing Scenarios. Earth’s Futur. 2020, 8, e2019EF001461. [Google Scholar] [CrossRef]
  35. Frankie, G.W.; Thorp, R.W.; Schindler, M.; Hernandez, J.; Ertter, B.; Rizzardi, M. Ecological Patterns of Bees and Their Host Ornamental Flowers in Two Northern California Cities. J. Kans. Èntomol. Soc. 2005, 78, 227–246. [Google Scholar] [CrossRef]
  36. Lowenstein, D.M.; Matteson, K.C.; Xiao, I.; Silva, A.M.; Minor, E.S. Humans, bees, and pollination services in the city: The case of Chicago, IL (USA). Biodivers. Conserv. 2014, 23, 2857–2874. [Google Scholar] [CrossRef]
  37. Cohen, H.; Philpott, S.M.; Liere, H.; Lin, B.B.; Jha, S. The relationship between pollinator community and pollination services is mediated by floral abundance in urban landscapes. Urban Ecosyst. 2021, 24, 275–290. [Google Scholar] [CrossRef]
  38. Lin, B.B.; Philpott, S.M.; Jha, S. The future of urban agriculture and biodiversity-ecosystem services: Challenges and next steps. Basic Appl. Ecol. 2015, 16, 189–201. [Google Scholar] [CrossRef]
  39. Zirkle, G.; Lal, R.; Augustin, B. Modeling Carbon Sequestration in Home Lawns. HortScience 2011, 46, 808–814. [Google Scholar] [CrossRef]
  40. Gu, C.; Crane II, J.; Hornberger, G.; Carrico, A. The effects of household management practices on the global warming potential of urban lawns. J. Environ. Manag. 2015, 151, 233–242. [Google Scholar] [CrossRef]
  41. Morris, J.; Bagby, J. Measuring environmental value for Natural Lawn and Garden Care practices. Int. J. Life Cycle Assess. 2008, 13, 226–234. [Google Scholar] [CrossRef]
  42. Banks, J.L.; McConnell, R. National Emissions from Lawn and Garden Equipment. U.S. Environmental Protection Agency. 2015. Available online: https://www.epa.gov/sites/default/files/2015-09/documents/banks.pdf (accessed on 1 May 2023).
  43. Gotelli, N.; Ellison, M. A Primer of Ecological Statistics; Oxford University Press: Oxford, UK, 2012. [Google Scholar]
  44. Texas A&M AgriLife. Texas Urban Landscape Guide. Available online: https://agrilifeextension.tamu.edu/asset-local/texas-urban-landscape-guide/ (accessed on 30 January 2022).
  45. Lady Bird Johnson Wildflower Center. Native Plant Database and Plant Lists & Collections. Available online: https://www.wildflower.org (accessed on 15 January 2017).
  46. Natural Resources Conservation Service. Natural Resources Conservation Service Soil Survey of Tarrant County. Available online: https://www.nrcs.usda.gov/wps/portal/nrcs/surveylist/soils/survey/state/?stateId=TX (accessed on 15 January 2016).
  47. Kent, M.; Coker, P. Vegetation Description and Data Analysis: A Practical Approach; Belhaven Press: London, UK, 1992. [Google Scholar]
  48. Sun, H.; Kopp, K.; Kjelgren, R. Water-efficient Urban Landscapes: Integrating Different Water Use Categorizations and Plant Types. HortScience 2012, 47, 254–263. [Google Scholar] [CrossRef]
  49. Cusser, S.; Haddad, N.M.; Jha, S. Unexpected functional complementarity from non-bee pollinators enhances cotton yield. Agric. Ecosyst. Environ. 2021, 314, 107415. [Google Scholar] [CrossRef]
  50. Obrist, M.K.; Duelli, P. Rapid biodiversity assessment of arthropods for monitoring average local species richness and related ecosystem services. Biodivers. Conserv. 2010, 19, 2201–2220. [Google Scholar] [CrossRef]
  51. Mandelik, Y.; Dayan, T.; Chikatunov, V.; Kravchenko, V. The relative performance of taxonomic vs. environmental indicators for local biodiversity assessment: A comparative study. Ecol. Indic. 2012, 15, 171–180. [Google Scholar] [CrossRef]
  52. Trevino, L.; Jha, S. Bees of Central Texas—General Guide. Available online: http://w3.biosci.utexas.edu/jha/landowners-naturalists/texas-pollinator-guides (accessed on 1 February 2018).
  53. Michener, C.D.; McGinley, R.J.; Danforth, B.N. The Bee Genera of North and Central America (Hymenoptera: Apoidea); Smithsonian Institution Press: Washington, DC, USA, 1994. [Google Scholar]
  54. Koch, J.; Strange, J.P.; Williams, P. Bumble bees of the western United States. USDA Forest Service Research Notes. Pub-lication No. FS-972. 2012. Available online: https://www.ars.usda.gov/research/publications/publication/?seqNo115=286891 (accessed on 1 July 2018).
  55. Goulet, H.; Huber, J.T. (Eds.) Hymenoptera of the World: An Identification Guide to Families; Research Branch Agriculture Canada, Publication l894/E; Centre for Land and Biological Resources Research: Ottawa, ON, Canada, 1993. [Google Scholar]
  56. Iowa State University. BugGuide. 2018. Available online: https://bugguide.net/ (accessed on 1 February 2018).
  57. Pittenger, D.R.; Downer, A.J.; Hodel, D.R. Estimating water needs of landscape palms in Mediterranean climates. Hort Technol. 2009, 19, 700–704. [Google Scholar] [CrossRef]
  58. Pittenger, D. Methodology for Estimating Landscape Irrigation Demand—Review and Recommendations. A Report to the Barton Springs/Edwards Aquifer Conservation District. 2014. Available online: https://bseacd.org/ (accessed on 1 July 2017).
  59. ANSI/ASABE S623.1 JAN2017; Determining Landscape plant Water Demands. Revised and approved January 2017 as an American National Standard; American Society of Agricultural and Biological Engineers: St. Joseph, MI, USA, 2017.
  60. Nassauer, J.I.; Wang, Z.; Dayrell, E. What will the neighbors think? Cultural norms and ecological design. Landsc. Urban Plan. 2009, 92, 282–292. [Google Scholar] [CrossRef]
  61. U.S. Forest Service. Landscape Aesthetic Handbook: A Handbook for Scenery Management. US Department of Agriculture, Forest Service, Agriculture Handbook Number 701. 1995. Available online: https://www.nrc.gov/docs/ML1224/ML12241A377.pdf (accessed on 15 January 2016).
  62. Burnham, K.P.; Anderson, D.R. Model Selection and Multimodel Inference: A Practical Information-Theoretic Approach; Chamberlain, D.E., Gough, S., Vaughan, H., Vick, S., Eds.; Springer: New York, NY, USA, 2002. [Google Scholar]
  63. Johnson, J.B.; Omland, K.S. Model selection in ecology and evolution. Trends Ecol. Evol. 2004, 19, 101–108. [Google Scholar] [CrossRef]
  64. Barton, K. Mu-MIn: Multi-Model Inference. R Package Version 0.12.2/r18. 2018. Available online: http://R-Forge.R-project.org/projects/mumin/ (accessed on 30 July 2019).
  65. Bates, D.; Mächler, M.; Bolker, B.; Walker, S. Fitting Linear Mixed-Effects Models Using lme4. J. Stat. Softw. 2015, 67, 48. [Google Scholar] [CrossRef]
  66. Chiquet, C.; Dover, J.; Mitchell, P. Birds and the urban environment: The value of green walls. Urban Ecosyst. 2013, 16, 453–462. [Google Scholar] [CrossRef]
  67. Matteson, K.C.; Langellotto, G.A. Determinates of inner city butterfly and bee species richness. Urban Ecosyst. 2010, 13, 222–347. [Google Scholar] [CrossRef]
  68. Tonietto, R.; Fant, J.; Ascher, J.; Ellis, K.; Larkin, D. A comparison of bee communities of Chicago green roofs, parks and prairies. Landsc. Urban Plan. 2011, 103, 102–108. [Google Scholar] [CrossRef]
  69. Ballare, K.M.; Neff, J.L.; Ruppel, R.; Jha, S. Multi-scalar drivers of biodiversity: Local management mediates wild bee community response to regional urbanization. Ecol. Appl. 2019, 29, e01869. [Google Scholar] [CrossRef]
  70. Pardee, G.L.; Philpott, S.M. Native plants are the bee’s knees: Local and landscape predictors of bee richness and abundance in backyard gardens. Urban Ecosyst. 2014, 17, 641–659. [Google Scholar] [CrossRef]
  71. Quistberg, R.D.; Bichier, P.; Philpott, S.M. Landscape and Local Correlates of Bee Abundance and Species Richness in Urban Gardens. Environ. Èntomol. 2016, 45, 592–601. [Google Scholar] [CrossRef] [PubMed]
  72. Mader, E.; Shepherd, M.; Vaughan, M.; Black, S.H.; LeBuhn, G. Attracting Native Pollinators: Protecting North America’s Bees and Butterflies; Storey Publishing: North Adams, MA, USA, 2011. [Google Scholar]
  73. U.S. Global Change Research Program. Impacts, Risks, and Adaptation in the United States: Fourth National Climate Assessment; 2018. Available online: https://nca2018.globalchange.gov/chapter/front-matter-about/ (accessed on 1 July 2019).
  74. Hermitte, S.M.; Mace, R.E. The Grass is Always Greener. Outdoor Residential Water Use in Texas. Texas Water De-velopment Board Technical Note 12-01. 2012. Available online: http://www.twdb.texas.gov/publications/reports/technical_notes/doc/SeasonalWaterUseReport-final.pdf (accessed on 1 November 2018).
  75. Chavey, S.M. Some San Antonio Residents have Used more than 1M Gallons of Water so Far this Year. Here’s why. San Antonio Express News. 2018. Available online: https://www.expressnews.com/news/local/article/San-Antonio-residents-companies-water-use-13159113.php (accessed on 1 July 2019).
  76. Beard, J.B.; Green, R.L. The Role of Turfgrasses in Environmental Protection and Their Benefits to Humans. J. Environ. Qual. 1994, 23, 452–460. [Google Scholar] [CrossRef]
  77. Livesley, S.J.; McPherson, E.J.; Calfapietra, C. The Urban Forest and Ecosystem Services: Impacts on Urban Water, Heat, and Pollution Cycles at the Tree, Street, and City Scale. J. Environ. Qual. 2016, 45, 119–124. [Google Scholar] [CrossRef]
  78. Bakhshi, A.A.; Demonsabert, S.M. Estimating the carbon footprint of the municipal water cycle. J. AWWA 2012, 104, E337–E347. [Google Scholar] [CrossRef]
  79. City of Austin, Texas. Water Forward: A Water Plan for the Next 100 Years. Austin, Texas Water Forward Task Board. 2018. Available online: http://austintexas.gov/sites/default/files/files/Water/WaterForward/Water_Forward_Plan_Report_-_A_Water_Plan_for_the_Next_100_Years.pdf (accessed on 15 November 2018).
  80. Steffan-Dewenter, I.; Kessler, M.; Barkmann, J.; Bos, M.M.; Buchori, D.; Erasmi, S.; Faust, H.; Gerold, G.; Glenk, K.; Gradstein, S.R.; et al. Tradeoffs between income, biodiversity, and ecosystem functioning during tropical rainforest conversion and agroforestry intensification. Proc. Natl. Acad. Sci. USA 2007, 104, 4973–4978. [Google Scholar] [CrossRef] [PubMed]
  81. Luck, G.W.; Harrington, R.; Harrison, P.A.; Kremen, C.; Berry, P.M.; Bugter, R.; Dawson, T.P.; de Bello, F.; Díaz, S.; Feld, C.K.; et al. Quantifying the Contribution of Organisms to the Provision of Ecosystem Services. BioScience 2009, 59, 223–235. [Google Scholar] [CrossRef]
  82. Fuller, R.A.; Irvine, K.N.; Devine-Wright, P.; Warren, P.H.; Gaston, K.J. Psychological benefits of greenspace increase with biodiversity. Biol. Lett. 2007, 3, 390–394. [Google Scholar] [CrossRef] [PubMed]
  83. Majewska, A.A.; Altizer, S. Planting gardens to support insect pollinators. Conserv. Biol. 2018, 34, 15–25. [Google Scholar] [CrossRef] [PubMed]
  84. Diekelmann, J.; Schuster, R. Natural Landscaping: Designing with Native Plant Communities; University of Wisconsin Press: Madison, WI, USA, 2002. [Google Scholar]
  85. Pham, M.A.; Scott, S.B.; Fyie, L.R.; Gardiner, M.M. Sustainable landscaping programs in the United States and their potential to encourage conservation and support ecosystem services. Urban Ecosyst. 2022, 25, 1481–1490. [Google Scholar] [CrossRef]
  86. Landscape Performance Series Benefits Toolkit. Available online: https://www.landscapeperformance.org/benefits-toolkit (accessed on 27 July 2023).
  87. Sustainable Sites Initiative. Available online: www.sustainablesites.org (accessed on 27 July 2023).
  88. Lerman, S.B.; Turner, V.K.; Bang, C. Homeowner Associations as a Vehicle for Promoting Native Urban Biodiversity. Ecol. Soc. 2012, 17, 45. [Google Scholar] [CrossRef]
  89. Jin, L.; Wang, Y. The practice and potential of the SITES v2 rating system for the sustainable design of a landscape: A case study of Chicago’s Navy Pier. Front. Environ. Sci. 2023, 11, 966726. [Google Scholar] [CrossRef]
  90. Landscape for Life. Available online: https://landscapeforlife.colostate.edu (accessed on 27 July 2023).
  91. Egerer, M.; Lin, B.B.; Philpott, S.M. Water Use Behavior, Learning, and Adaptation to Future Change in Urban Gardens. Front. Sustain. Food Syst. 2018, 2, 71. [Google Scholar] [CrossRef]
  92. Wheeler, S.M. Reimagining Sustainable Cities: Strategies for Designing Greener, Healthier, More Equitable Communities; University of California Press: Oakland, CA, USA, 2021. [Google Scholar]
  93. Matsler, M.; Finewood, M.; Richards, R.; Pierce, O.; Ledermann, Z. Institutionalizing barriers to access? An equity scan of green stormwater infrastructure (GSI) incentive programs in the United States. J. Environ. Policy Plan. 2023, 25, 413–428. [Google Scholar] [CrossRef]
  94. Wrigley, K.; Crawford, R.H. Identifying policy solutions for improving the energy efficiency of rental properties. Energy Policy 2017, 108, 369–378. [Google Scholar] [CrossRef]
  95. Riedman, E.; Roman, L.A.; Pearsall, H.; Maslin, M.; Ifill, T.; Dentice, D. Why don’t people plant trees? Uncovering barriers to participation in urban tree planting initiatives. Urban For. Urban Green. 2022, 73, 127597. [Google Scholar] [CrossRef]
  96. Larson, K.L.; Andrade, R.; Nelson, K.C.; Wheeler, M.M.; Engebreston, J.M.; Hall, S.J.; Avolio, M.L.; Groffman, P.M.; Grove, M.; Heffernan, J.B.; et al. Municipal regulation of residential landscapes across US cities: Patterns and implications for landscape sustainability. J. Environ. Manag. 2020, 275, 111132. [Google Scholar] [CrossRef] [PubMed]
  97. Pincetl, S.; Gillespie, T.W.; Pataki, D.E.; Porse, E.; Jia, S.; Kidera, E.; Nobles, N.; Rodriguez, J.; Choi, D.-A. Evaluating the effects of turf-replacement programs in Los Angeles. Landsc. Urban Plan. 2019, 185, 210–221. [Google Scholar] [CrossRef]
  98. Sisser, J.M.; Nelson, K.C.; Larson, K.L.; Ogden, L.A.; Polsky, C.; Chowdhury, R.R. Lawn enforcement: How mu-icipal policies and neighborhood norms influence homeowner residential landscape management. Landsc. Urban Plan. 2016, 150, 16–25. [Google Scholar] [CrossRef]
  99. Lerman, S.B.; Contosta, A.R.; Milam, J.; Bang, C. To mow or to mow less: Lawn mowing frequency affects bee abundance and diversity in suburban yards. Biol. Conserv. 2018, 221, 160–174. [Google Scholar] [CrossRef]
  100. Goh, K. Planning the Green New Deal: Climate Justice and the Politics of Sites and Scales. J. Am. Plan. Assoc. 2020, 86, 188–195. [Google Scholar] [CrossRef]
  101. Solis, M.; Lieberknecht, K.; Oden, M.; Liu, H. Labor Lacuna: Local Climate Action & the Left-Out World of Workforce Development. In review.
  102. Seto, K.C.; Güneralp, B.; Hutyra, L.R. Global forecasts of urban expansion to 2030 and direct impacts on biodiversity and carbon pools. Proc. Natl. Acad. Sci. USA 2012, 109, 16083–16088. [Google Scholar] [CrossRef] [PubMed]
  103. Goddard, M.A.; Dougill, A.J.; Benton, T.G. Scaling up from gardens: Biodiversity conservation in urban environments. Trends Ecol. Evol. 2010, 25, 90–98. [Google Scholar] [CrossRef]
  104. Belaire, J.A.; Whelan, C.J.; Minor, E.S. Having our yards and sharing them too: The collective effects of yards on native bird species in an urban landscape. Ecol. Appl. 2014, 24, 2132–2143. [Google Scholar] [CrossRef] [PubMed]
  105. Kinzig, A.P.; Warren, P.; Martin, C.; Hope, D.; Katti, M. The Effects of Human Socioeconomic Status and Cultural Characteristics on Urban Patterns of Biodiversity. Ecol. Soc. 2005, 10. [Google Scholar] [CrossRef]
Figure 1. Research plots at two sites in Fort Worth, Texas: parking lot “endcaps” at the Botanical Research Institute of Texas (BRIT) (top), and grassy field between parking area and building at the Fort Worth federal property managed by General Services Administration (GSA) (bottom).
Land 12 01689 g001
Figure 2. Example landscape designs included in the questionnaire. The survey included photographs of landscaping with plants native to the north Texas region from 6 of the BRIT research plots (examples on left side), as well as photographs of conventional landscaping from 6 Texas urban commercial sites with non-native plants (examples on right side). All landscapes were modified in Photoshop to include an identical building in the immediate background to control for the built landscape context.
Land 12 01689 g002
Table 1. Plot landscape design variables.
Design VariableDescriptionMin–MaxMean (Std. Dev.)
Native plant coverage *Cover of plants native to ecoregion (%)22–100%80% (18%)
Plant richnessTotal number of unique plant species2–74.3 (1.5)
Vegetation adaptation to soil moisture *Plot-level index of soil moisture adaptation for the plant community in each plot *0.8–8.53.2 (2.7)
* Data sources: vegetation origin and vegetation adaptation to soil moisture were derived from the Native Plants of North America searchable database, run by the Lady Bird Johnson Wildflower Center, as described in the text.
Table 2. Model coefficients and R2 for best-supported models with response variables in the left column and predictor variables and R-squared value in subsequent columns. All variables were standardized prior to modeling. All pollinator response variables, maintenance response variables, and water response variables were normalized per square foot to account for plot size differences at BRIT, and land unit was included as a random effect in all models that included data from both land units. Greater coefficient values indicate a greater relative role for this variable in the focal environmental outcomes, whereas “x” indicates that this variable was not included in the best-supported models. For mixed-effects models for Pollinators and Maintenance, the displayed R2 values are marginal values, which represent the variance from fixed effects only (i.e., site effects are excluded). Stars indicate significance value of predictor variables, ** p < 0.01 and *** p < 0.001.
Response VariablesNative Plants
(% Cover)
Plant RichnessVegetation Adaptation to Soil MoistureR2
Pollinators
Visitorsx0.22 ***x0.32
Visitor richnessx0.07 ***x0.31
Water
‘Dry days’xx−2.06 ***0.48
Irrigation rate (inches per month)xx0.50 ***0.63
Maintenance
Total timex0.01x0.09
Total fuel-powered equipment time−0.03 **0.02x0.20
Table 3. Tradeoffs and synergies between environmental outcomes (response variables) as indicated by pairwise Spearman correlations. * p < 0.05 and ** p < 0.01.
WaterPollinatorsMaintenance
Emissions
Visual Quality
Water −0.47 **0.35−0.77
Pollinators −0.39 *0.94 **
Maintenance
emissions
0.43
Visual quality
Disclaimer/Publisher’s Note: The statements, opinions and data contained in all publications are solely those of the individual author(s) and contributor(s) and not of MDPI and/or the editor(s). MDPI and/or the editor(s) disclaim responsibility for any injury to people or property resulting from any ideas, methods, instructions or products referred to in the content.

