Article

What Should Be Learned from the Dynamic Evolution of Cropping Patterns in the Black Soil Region of Northeast China? A Case Study of Wangkui County, Heilongjiang Province

1
School of Public Administration and Law, Northeast Agricultural University, Harbin 150030, China
2
School of Economics and Management, Northeast Agricultural University, Harbin 150030, China
*
Author to whom correspondence should be addressed.
These authors contributed equally to this work.
Land 2023, 12(8), 1574; https://doi.org/10.3390/land12081574
Submission received: 13 June 2023 / Revised: 3 August 2023 / Accepted: 5 August 2023 / Published: 9 August 2023

Abstract

:
Conventional and scientific cropping patterns are important in realizing the sustainable utilization of Black soil and promoting the high-quality development of agriculture. It also has far-reaching significance for protecting Black soil and constructing the crop rotation system to identify the cropping patterns in Northeast China and analyze their spatio-temporal dynamic change. Using the geo-information Tupu methods and transfer land matrix, this study identified the cropping patterns and their spatio-temporal change based on remote sensing data for three periods, namely 2002–2005, 2010–2013, and 2018–2021. The main results revealed that the maize continuous, mixed cropping, maize-soybean rotation, and soybean continuous cropping patterns were the main cropping patterns in Wangkui County, with the total area of the four patterns accounting for 95.28%, 94.66%, and 81.69%, respectively, in the three periods. Against the backdrop of global climate warming, the cropping patterns of continuous maize and soybean and the mixed cropping pattern in Wangkui County exhibited a trend towards evolving into a maize-soybean rotation in the northern region. Moreover, the maize-soybean rotation further evolved into a mixed cropping system of maize and soybean in the north. Furthermore, the spatio-temporal evolution of cropping patterns was significantly driven by natural and social factors. Specifically, natural factors influenced the spatio-temporal patterns of variation in cropping patterns, while social factors contributed to the transformation of farmers’ cropping decision-making behavior. Accordingly, new insights, institutional policies, and solid solutions, such as exploring and understanding farmers’ behavior regarding crop rotation practices and mitigating the natural and climatic factors for improving food security, are urgent in the black soil region of China.

1. Introduction

As one of the three major black soil regions in the northern hemisphere, the black soil region of Northeast China is characterized by a concentrated distribution of arable land, with a total area of 3.59 × 10⁷ hectares [1]. According to China Justice Observer in 2022, black soil refers to well-shaped and highly fertile arable land with black or dark black humus topsoil within some areas of Heilongjiang Province, Jilin Province, and Liaoning Province [2]. It is characterized by thick, black, humus-rich topsoil [3]. In recent years, this region has supplied over 33% of the national maize production, approximately 50% of the soybean production [4], and 60% of the commercial volume of japonica rice in China [5]. It holds an irreplaceable position in China’s food security strategy and is a cornerstone for ensuring grain security [6]. However, due to the continuous overuse of the land and inappropriate cropping methods, particularly monoculture [7], the black soil quality has become vulnerable due to various driven factors that may impact its productivity. In other words, land degradation can lead to the loss of ecosystem functions and productivity [8]. Accordingly, it was learned from previous studies that crop rotations can help prevent soil erosion in upland regions and minimize the risk of soil erosion [9]. Conversely, inappropriate maize and soybean crop rotation implementation may induce long-term soil erosion. In addition to these factors, salinization [10], and desertification, linked with rainfall variability [11], can significantly compromise the soil’s fertility, resulting in diminished productivity. As a result, the sustainable utilization of black soil is weakened and poses a serious threat [12] to China’s agricultural production and food supply.
Consequently, reasonable cropping patterns substantially influence the texture of black soil and enhance soil fertility and quality. Empirical investigations have consistently demonstrated crop rotation constitutes highly advantageous cropping, synergistically harmonizing economic, ecological, and social benefits [13]. These findings underscore the multifaceted advantages of implementing crop rotation as a sustainable agricultural practice. Crop rotation is critical in improving soil properties and increasing soil fertility. In other words, crop rotation is an invaluable step to implementing ecological civilization policies and protecting cultivated land [14]. It also helps prevent and control grass pests while enhancing crop yield and operational efficiency [15,16,17,18]. The dynamic evolution of cropping patterns is insufficiently understood to accomplish suitable cultivated land protection. In addition, to our knowledge, no relevant literature is available at the country level through geo-information Tupu, exploring at the same time the dynamics of cropping patterns and their trajectory. In other words, within the strategic context of promoting the effective management and preservation of black soil [19] and implementing a rotational fallow system [20], it is paramount to investigate the various types, spatio-temporal differentiation characteristics and evolutionary trends of cropping patterns. This investigation reveals a significant cropping rotation information gap to optimize the crop rotation model in the black soil region.
The concept of “cropping patterns” pertains to the systematic utilization of cultivated land and the adoption of specific crop cultivation methods, which can be categorized into two main modes: continuous cropping and crop rotation [21]. The cropping patterns exhibit multiple intricate variations, leading most scholars to employ methodologies such as remote sensing monitoring to recognize and extract crop cropping patterns regarding multi-temporal, high spatial resolution, and multispectral satellite image analysis for identifying cropping patterns. Martínez-Casasnovas [22] employed the maximum likelihood classification method to discern long-term sequential cropping patterns during the spring and summer seasons over a continuous seven-year time series. Additionally, Zhu [23] introduced statistical models to interpret TM images from 2001 to 2004, extracting two rotational cropping patterns, namely cotton–rice and rice–cotton, in Xinghua City, Jiangsu Province. Moreover, an estimation model for cotton rotation was developed.
Furthermore, Du [24,25] utilized multi-temporal remote sensing images and geo-information Tupu methods to construct a comprehensive cropping pattern map. This study also involved analyzing the region’s spatio-temporal characteristics of cropping patterns. Both Nguyen [26] and Zhang [27] utilized MODIS EVI time series imagery to identify cropping patterns using multispectral remote sensing data and vegetation index time series. They successfully delineated single-season and double-season corn planting areas in Dak Lak Province, located in central Vietnam, as well as the primary types of cropping patterns in the North China Plain. In addition, Li et al. [28] also employed a comprehensive 10-year dataset of SPOT/VGT-NDVI time series data to examine the spatial patterns of typical cropping systems in the North China region. Current research on cropping patterns primarily focuses on remote sensing identification and spatial patterns, with limited attention given to the evolution of cropping patterns. However, studies on land use change have made significant progress in understanding the evolution of land classes, which can provide valuable insights for studying cropping pattern evolution. For instance, GIS space matrix and kernel density analysis were extensively employed to assess the spatiotemporal evolution characteristics of agricultural non-point source pollution [29]. In rural settlement evolution, the utilization of multi-period remote sensing interpretation data of land use and economic statistics enables the quantification of the historical and current conditions of rural settlement changes [30].
In addition, the land transformation model (LTM) was utilized to forecast the future spatial patterns of rural settlements, thereby uncovering the evolutionary patterns inherent to rural settlements [31]. Crop cultivation represents the most direct method of land utilization, characterized by a distinct correspondence between specific crops and arable land [32]. The spatiotemporal differentiation patterns observed in crop production processes provide insights into the transformative features of land use. Then, cropping patterns denote various crops’ temporal and spatial arrangements [33]. From then on, using theories and methodologies of land use change is viable to assess the spatiotemporal evolution of cropping patterns. As such, this research used the geo-information Tupu method to identify and extract different cropping patterns in Wangkui County, Heilongjiang Province. Accordingly, the study focused on three crop rotation periods constructed from crop classification data, namely 2002–2005, 2010–2013, and 2018–2021. Specifically, using statistical analysis, and building classification methods, this current investigation aimed to identify the main cropping patterns through spatial overlay. Additionally, it assessed the temporal and spatial pattern evolution. The ultimate objective of this research was to provide a solid foundation for establishing crop rotation systems in the black soil region of Northeast China.

2. Materials and Methods
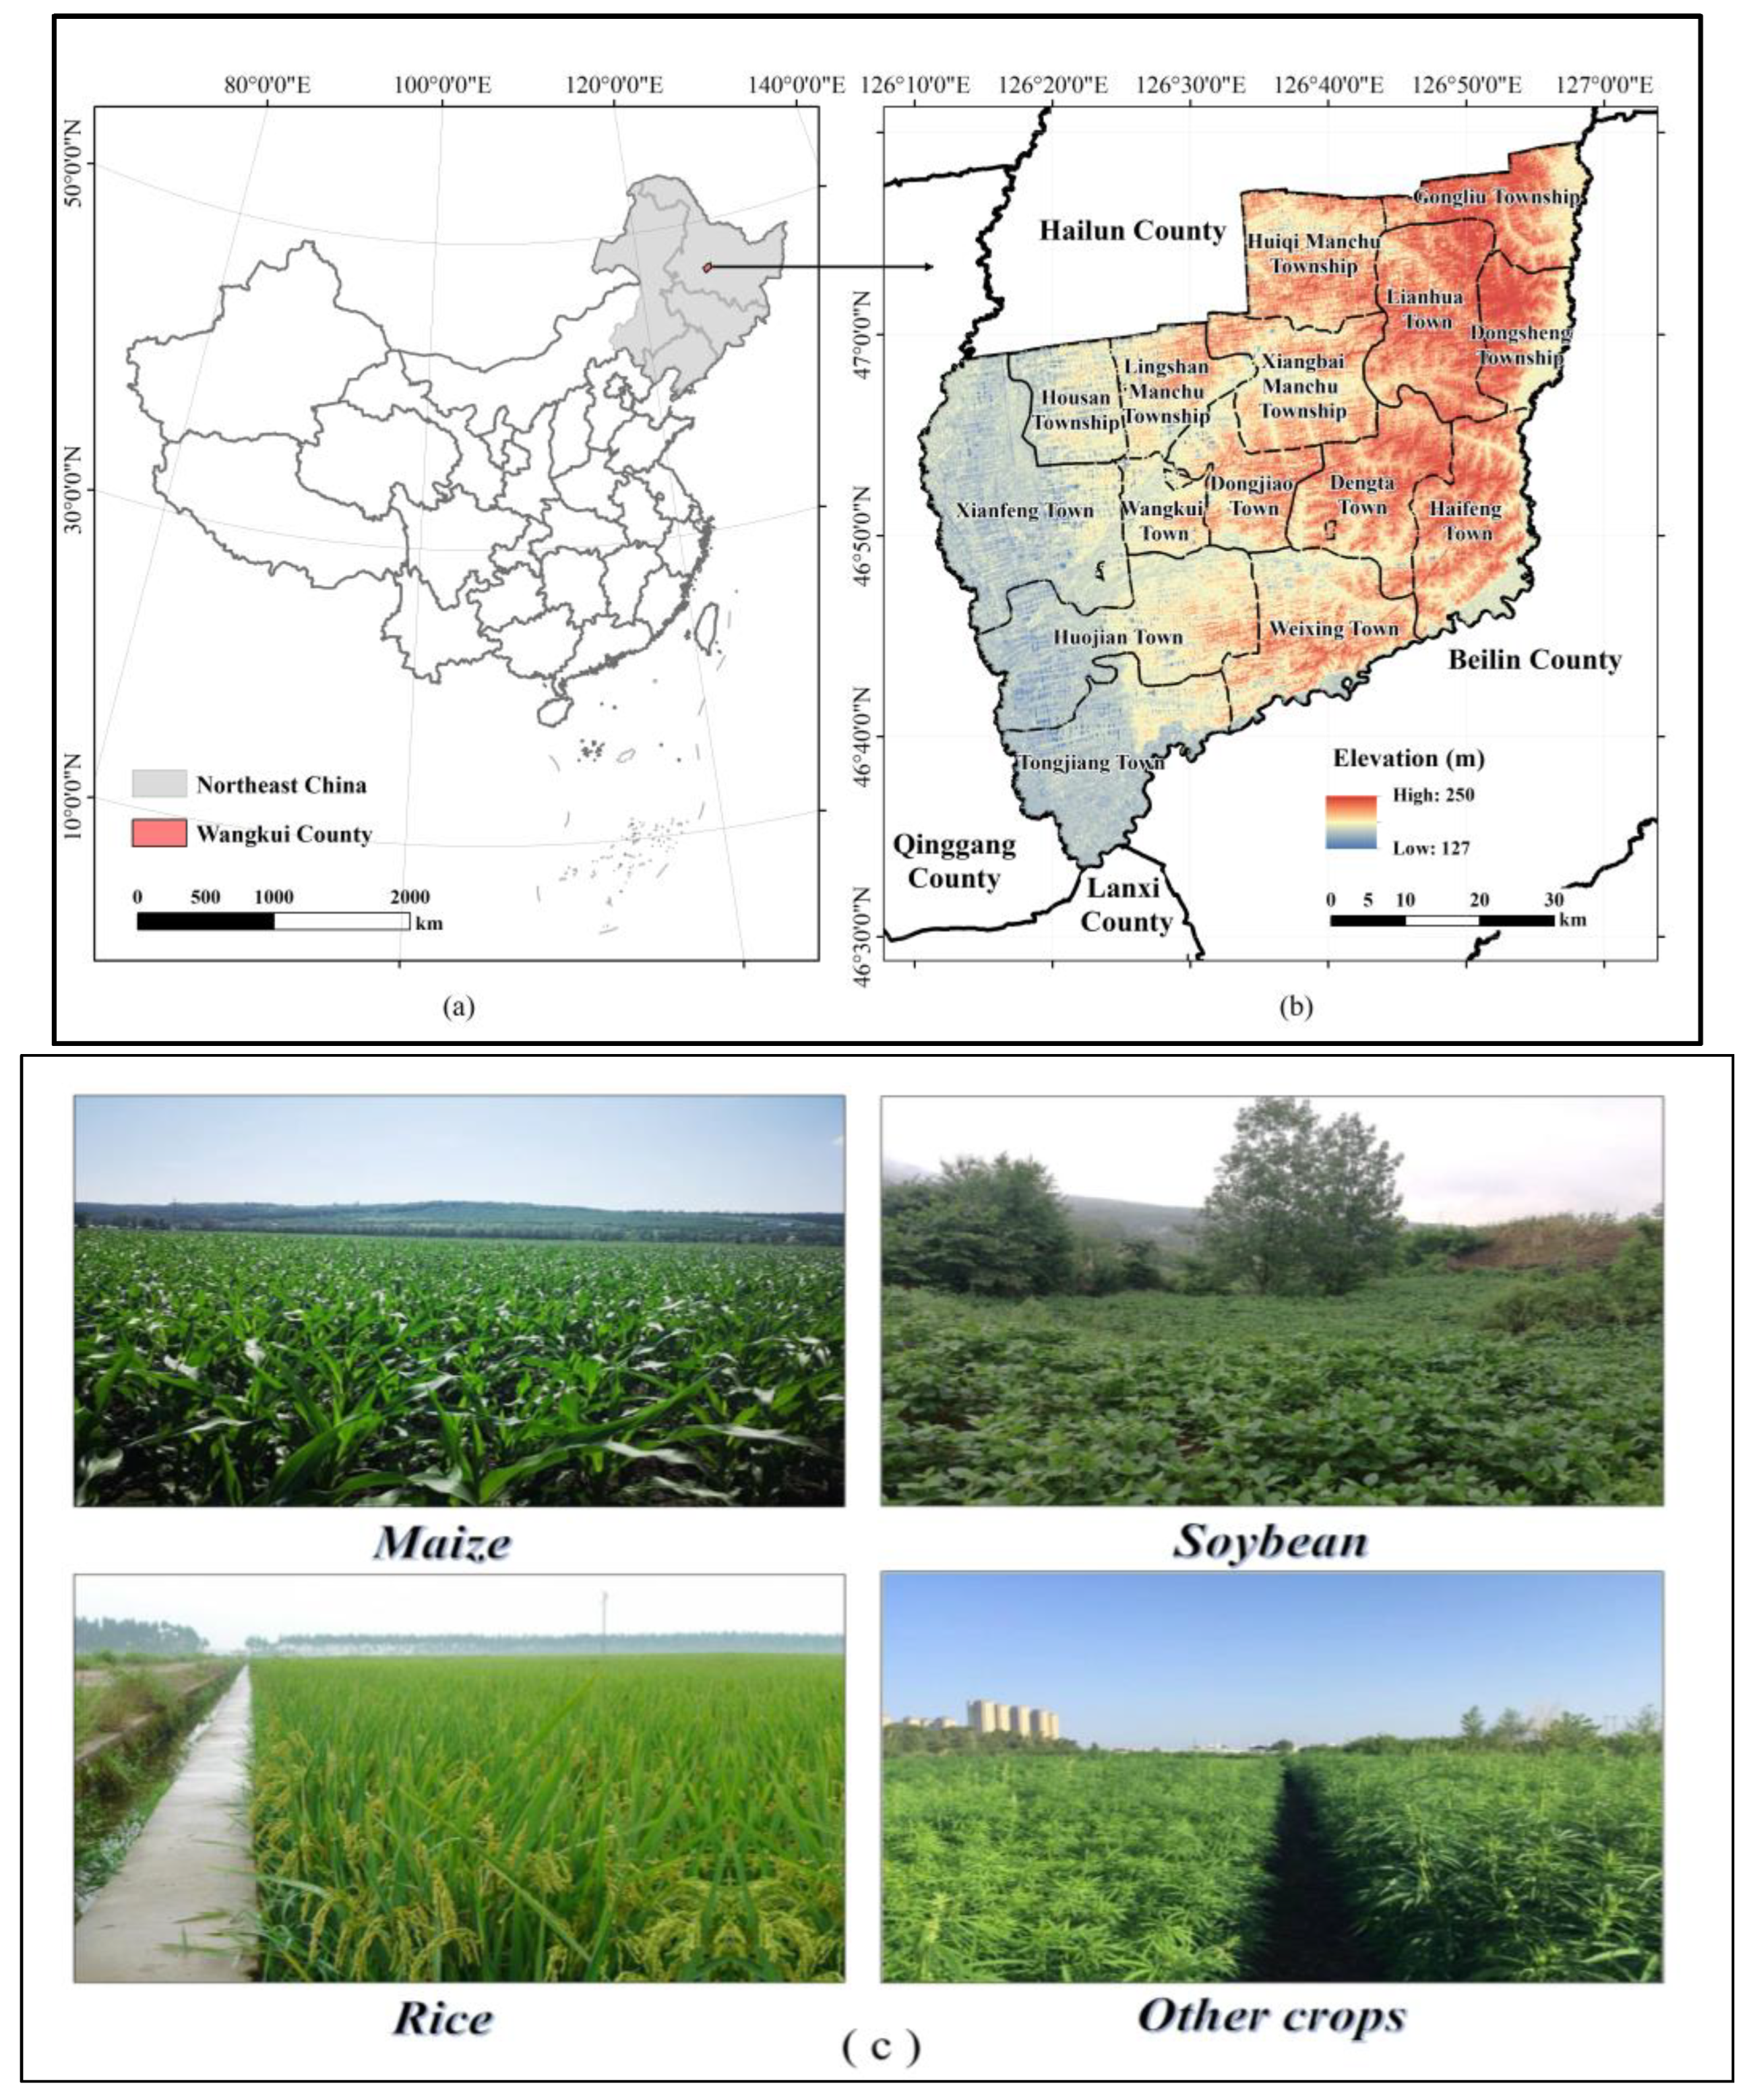
2.1. Study Area

Wangkui County is localized in the center of the black soil region of Northeast China, between 46°32′ to 47°28′ north latitude and 126°10′ to 126°59′ east longitude. It falls under the jurisdiction of Suihua City in Heilongjiang Province. The county’s eastern border with the Beilin District is adjacent to Lanxi County in the south and is separated from Qinggang County by the Tongken River to the west. It connects with Hailun City in the north part, as shown in Figure 1.
Wangkui County encompasses 15 townships. The county’s topography slopes gradually from east to west, characterized by undulating hills, gentle slopes, low-lying plains, and an elevation ranging from 127.8 to 250.10 m. It experiences a temperate continental semi-humid monsoon climate characterized by ample sunlight, with an average annual precipitation of 475 mm, primarily concentrated in July and August. The yearly average temperature stands at 2.8 °C, and the accumulated temperature exceeding 10 °C throughout the year reaches 2605 °C. The county’s total land area covers 2313.88 km2, with cultivated land representing about 1413.33 km2, or 60.97%. The county’s soil types are diverse, but the fertile black soil is widely distributed throughout the region, vital to agricultural productivity. Dryland farming predominates in Wangkui County, with a single annual cropping season. The primary crops cultivated are maize and soybeans, supplemented by a smaller area dedicated to rice cultivation.

2.2. Data Sources

Based on advanced methods for remote sensing-based crop type identification and existing research [34], this study used a comprehensive dataset comprising Landsat 7 ETM+ images collected on July and August of 2002, 2003, and 2010–2012; Landsat 5 TM images from 2004 and 2005; as well as Landsat 8 OLI images from 2013 and 2018–2021. Identifying the crop’s characteristics is necessary for remote sensing data interpretation with a consistent method. As such, each crop type shows different color aspects during the growing period. For instance, the rice showed significant spectral differences in the remote sensing images from May to June [35]. From mid-to-late July to mid-August, known as “the mature pot” (R7 date) [36], the soybean leaves and pods change from green to yellow-green or yellow. Accordingly, July and August can help identify the crop types’ characteristics.
As shown in Table 1, these high-quality satellite images were obtained from the United States Geological Survey (USGS-Global Visualization Viewer; http//glovis.usgs.gov, accessed between 1 and 3 July 2022). Additional auxiliary data, including the updated annual database from the third land survey in Wangkui County, administrative boundary vector data, and 30 m resolution DEM data, were incorporated to complement the analysis.

2.3. Methods

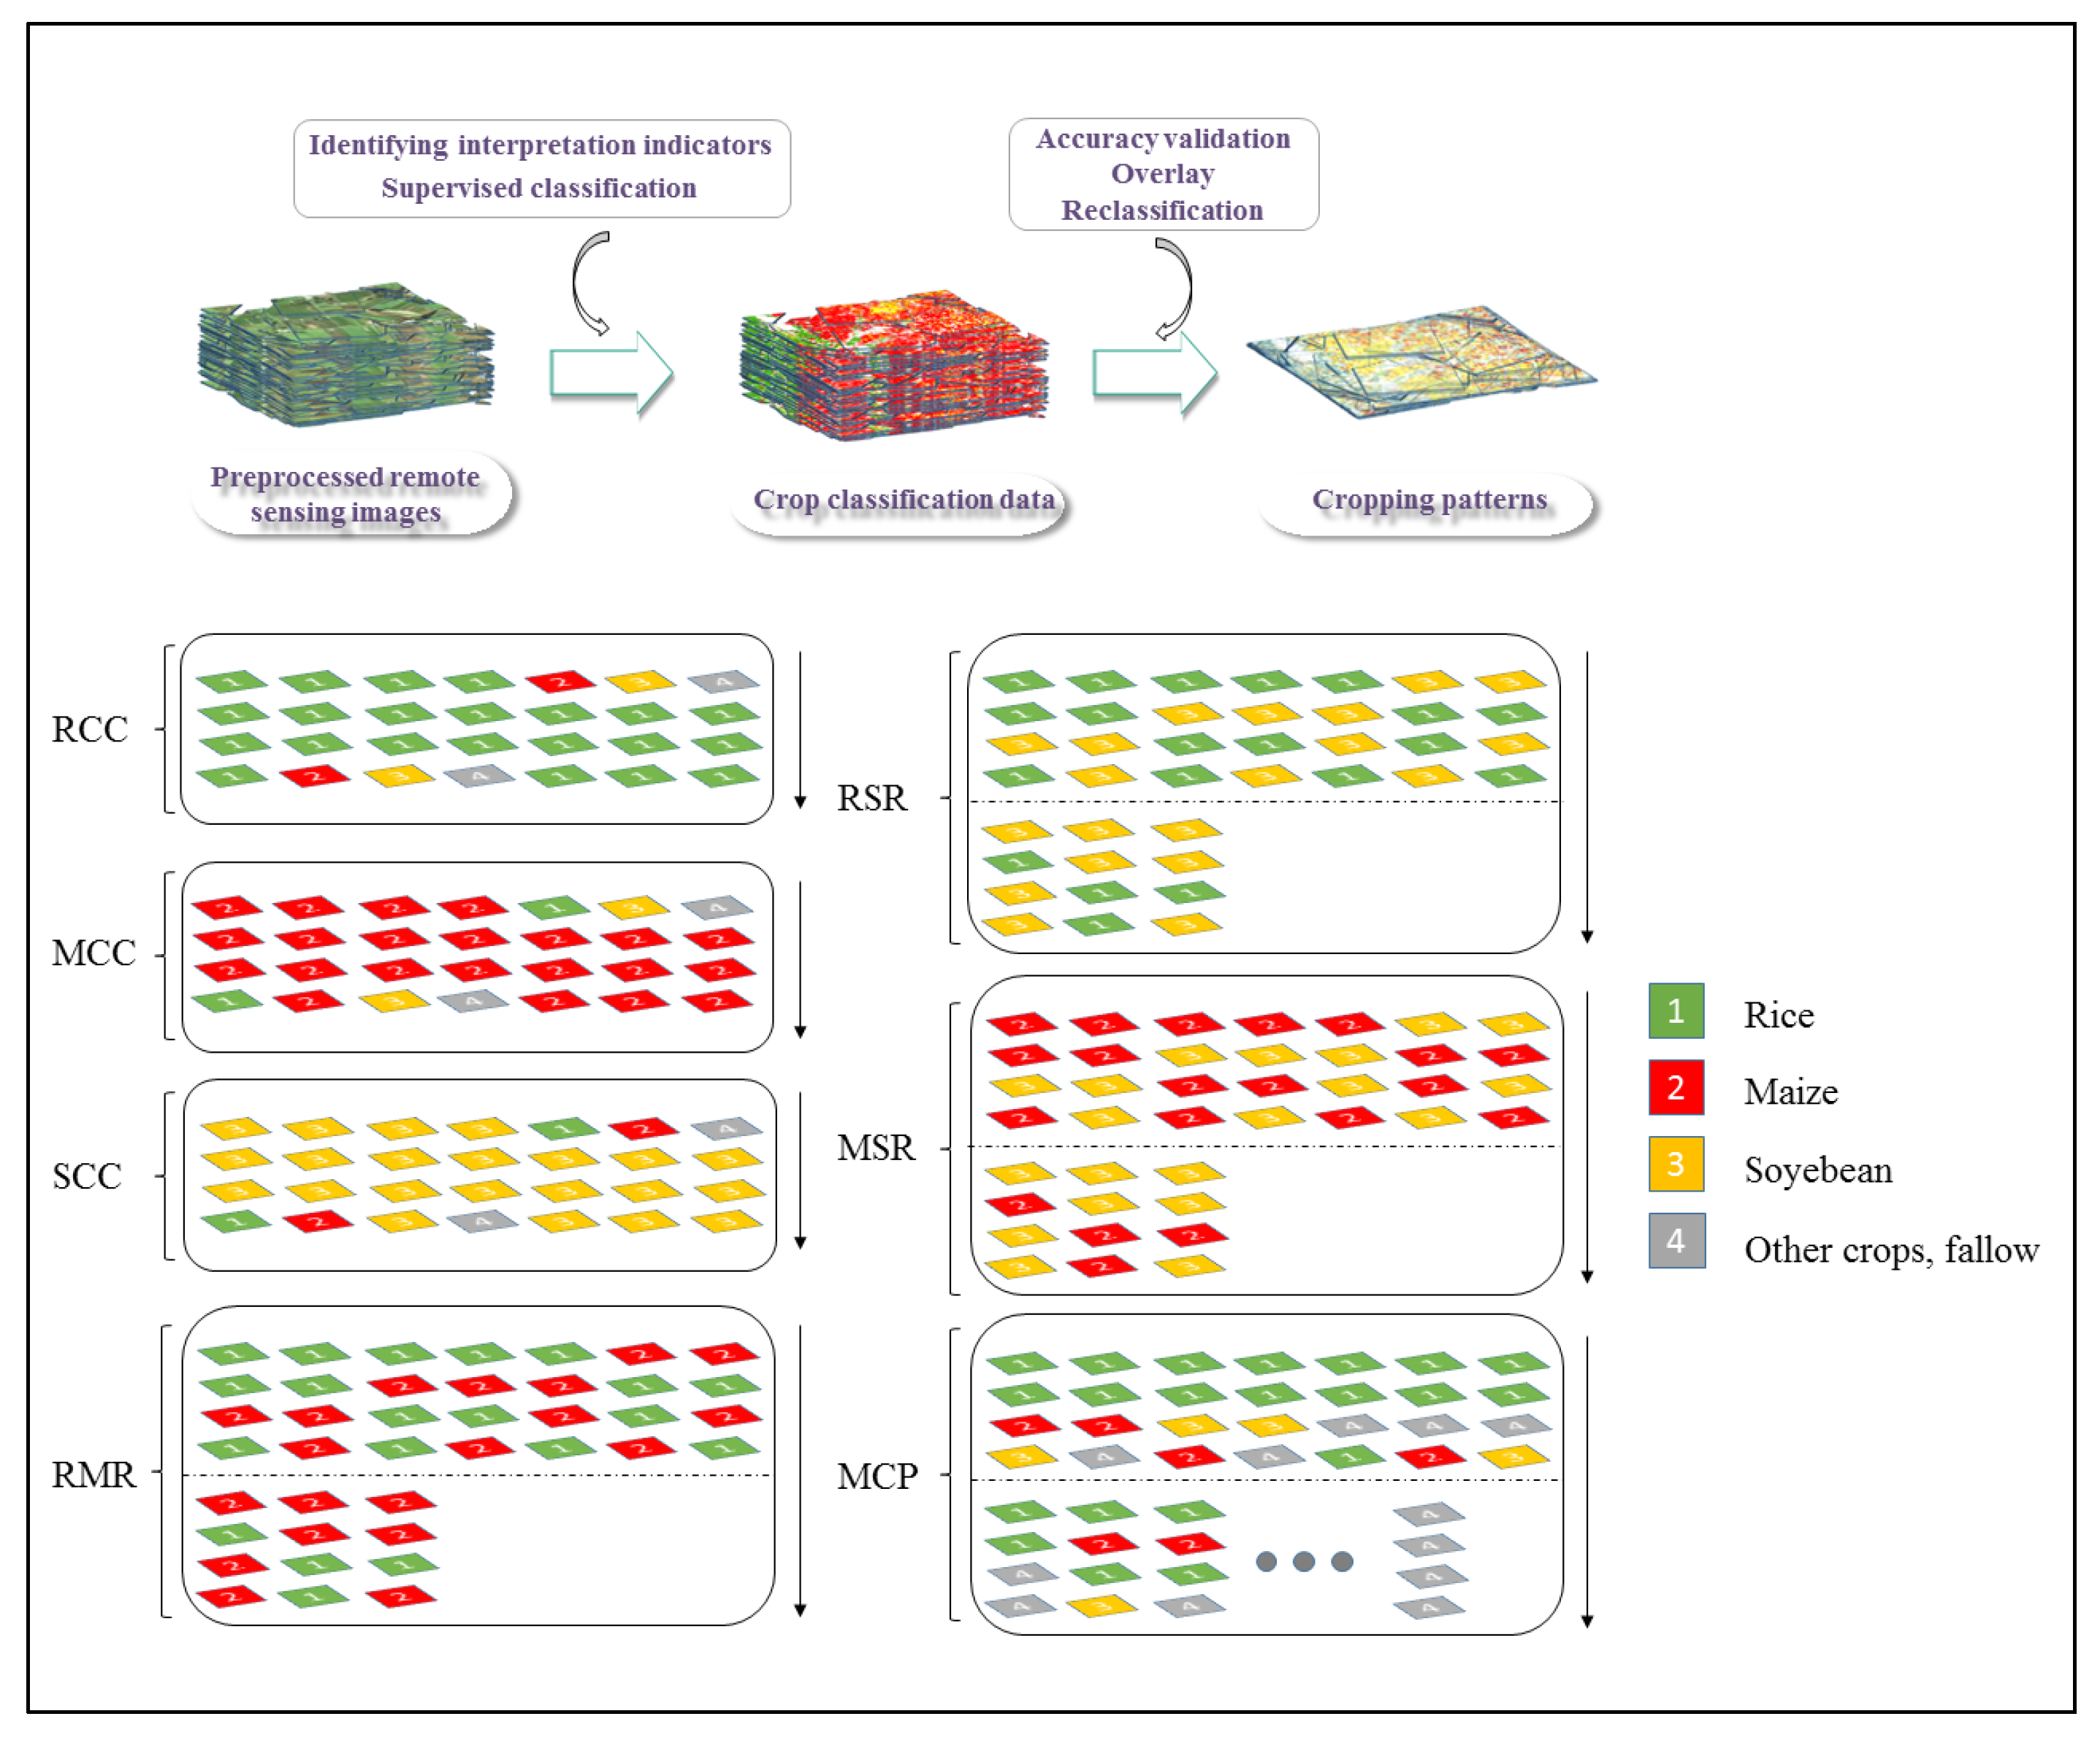
2.3.1. Crop Classification Method

The preprocessing workflow encompassed meticulous procedures to enhance the quality and accuracy of the remote sensing data. Firstly, through the inversion crop classification method, the remote sensing data underwent appropriate image preprocessing using ENVI 5.3 software. Subsequently, precise geometric corrections were performed on the remote sensing images using county-level 30 m resolution, ensuring spatial accuracy. Notably, meticulous measures were taken before geometric correction to eliminate error strips from the Landsat 7 ETM+ images obtained in 2003 and 2010–2012 [37]. Moreover, the data underwent essential radiometric calibration, atmospheric correction, image fusion, and image mosaic steps as part of the comprehensive preprocessing pipeline. Therefore, a refined mask was created to facilitate accurate analysis using county-level cultivated land vector data, enabling precise cropping and delineation of the relevant areas of interest within the remote sensing images.
Based on the distinctive growth characteristics and image features at different stages of crops, we carefully selected specific combinations of spectral bands that are sensitive to different crops. These bands were then integrated from various remote sensing images to establish a crop classification indicator for the study area, encompassing four primary categories: rice, maize, soybean, and other crops. A manual visual interpretation was employed to classify the remote-sensing images based on the crop classification indicator. Subsequently, a training sample dataset was constructed using the crop classification indicator. Seventy training and thirty validation samples were uniformly and randomly selected for each crop category: rice, maize, soybean, and other crops. The separability between different crop samples was ensured to be greater than 1.9, demonstrating the rationale behind the sample selection. Finally, the “New Region of Interest” function in ENVI 5.3 software was utilized to conduct a supervised classification of various crop types in Wangkui County for 2002–2005, 2010–2013, and 2018–2021. The overall accuracy ranged from 0.83 to 0.96, with kappa coefficients falling between 0.85 and 0.93. Additionally, the consistency between the classified data and the statistical yearbook exceeded 80%, meeting the precision requirements of this research.

2.3.2. Geo-Information Tupu

In the black soil region of Northeast China, known for its one-year crop rotation period, the rotation periods typically ranged from two to three years. The predominant rotation systems included two years of “maize-soybean” and “soybean-maize,” as well as three years of “maize-maize-soybean” and “soybean-soybean-maize.” This study focused on the past two decades, precisely the period since the beginning of the 21st century, to examine the effects of different policy contexts on the spatial and temporal variations in cropping patterns. As such, to ensure the integrity of the rotation periods, a four-year rotation period was employed, encompassing both the two-year and three-year rotations. This approach guaranteed that each land plot underwent at least two complete rotation periods, accommodating two-year and three-year rotation patterns. By considering key policy interventions such as the temporary maize storage policy introduced in 2009 and the subsequent initiatives to reinstate grain-legume rotations in Northeast China from 2016 onwards [38], this study identified 2009 and 2016 as significant time markers. The three rotation periods selected for analysis were 2002–2005, 2010–2013, and 2018–2021, respectively. These periods have provided insights into the differential factors influencing changes in cropping patterns within distinct policy contexts.
The theory of geo-information Tupu was used as a primary method for analyzing land use changes, providing an intuitive representation of the process information related to land use changes [39]. It represents an integrated analytical approach that fundamentally considers the spatiotemporal dynamics of land change processes. Geo-information Tupu offers a more intuitive and comprehensive visualization of the evolving patterns of diverse geoscientific elements across both spatial and temporal dimensions by amalgamating spectral qualitative analysis with graphical localization. Consequently, it is able to adeptly address the intricate challenges associated with the dynamic distribution and relative proportions of various spatial factors. The excellence of this approach is underscored by its capacity to encapsulate detailed temporal-evolutionary labels for diverse geographic features within a designated region. This holistic portrayal culminates in a dynamic spatio-temporal framework, which holistically embodies the intertwined aspects of space, time, and attributes. This study introduced the theory to investigate the spatio-temporal evolution of cropping patterns. A total of 12 crop classification datasets from three periods were assigned grid values, with rice, maize, and soybean being assigned values of 1, 2, and 3, respectively. Other crops and fallow land were uniformly assigned a value of 4. Using the “Map Algebra—Raster Calculator” function in ArcGIS 10.7, the crop classification data were overlaid and classified, resulting in the generation of raster data depicting seven cropping patterns for the three rotation periods in Wangkui County. Based on previous studies, the calculation formula for element type changes in geo-information Tupu can be expressed as follows:
C = A 1 × 10 n 1 + A 2 × 10 n 2 + + A i × 10 n i + + A n
where C represents the map coding for the changes in element types during the study period, A i represents the map coding for the element at the i-th time node, and n denotes the number of time nodes considered in the study (n > 1).

2.3.3. Temporal Dynamics of Cropping Patterns

The index of temporal dynamics in cropping patterns serves to quantify the degree of intensity in the variations of cropping patterns during the study period. The calculation formula for this index is as follows:
L K = U a U b U a × 1 T × 100 %
L C = a = 1 n Δ L U a b 2 a = 1 n L U a × 1 T × 100 %
where L K represents the dynamic resilience of a singular cropping pattern, while L C signifies the comprehensive adaptability of an integrated cropping pattern. U a and U b , respectively, indicate the initial and final areas (in km2) of a specific cropping pattern within the study area. T represents the time interval. L U a represents the area (in km2) occupied by the “a” category cropping pattern during the early stage of the study. L U a b represents the absolute value of the area (in km2) where the “a” category cropping pattern undergoes a transition to other cropping pattern types during the research period. n denotes the number of cropping pattern types observed within the study area.

2.3.4. Transition Matrix of Cropping Patterns

The transition matrix of cropping patterns offers a concise depiction of the spatial dynamics and directional transitions of various cropping pattern types throughout the study period. The calculation formula is derived as follows [40]:
S i j = S 11 S 12 S n 21 S 21 S 22 S n 22 S n 1 S n 2 S n n
where S i j represents the area of a specific cropping pattern type at the beginning and end of the study period, while n denotes the total number of cropping pattern types.

3. Results

3.1. Types of Cropping Patterns

Based on the geo-information Tupu method, the crop classification data were integrated, resulting in three distinct crop rotation periods with 255, 256, and 249 different crop change encodings, respectively. By carefully examining the concept of cropping patterns and analyzing the inherent characteristics of crop change information, we meticulously categorized these encodings into seven distinct cropping patterns (Figure 2 and Figure 3).
Notably, within the three periods, the encoding for continuous rice cropping comprised seven distinct types primarily concentrated in the county’s western region, exhibiting a noticeable southward expansion trend. While predominantly engaged in dryland agriculture, Wangkui County revealed a small portion of land that displayed a four-year rotational pattern between rice-maize and rice-soybeans. Our meticulous and rigorous field investigations determined that the surveyed area was closely adjacent to water channels, exhibiting a notable water-dry rotation phenomenon. Consequently, we classified the water-dry rotation types within this region into two distinct patterns: rice–maize rotation and rice-soybean rotation. Notably, both patterns were characterized by ten distinct encodings within the three periods.
Furthermore, the mixed cropping pattern displayed 204, 205, and 198 encodings across the three periods, highlighting the occurrence of disorderly crop planting practices in Wangkui County. Our investigation unveiled diverse cropping patterns in the studied region, encompassing tobacco rotation, mixed wheat rotation, and continuous ramie cultivation. The encoding for continuous maize cropping consisted of seven types, reflecting a spatial distribution pattern characterized by “more in the south, less in the north” and displaying a tendency towards clustering in the eastern region while expanding towards the northeast. Similarly, the encoding for continuous soybean cropping comprised seven types, primarily distributed in the northern part of the county, with a trend of expansion followed by contraction towards the north. Lastly, the maize-soybean rotation pattern exhibited encodings of ten types, mainly concentrated in the eastern and northern regions of the county.

3.2. Changes in Total Cropping Patterns

The statistical data presented in Table 2 revealed the changes in total cropping patterns in three consecutive periods in Wangkui County: period I (2002–2005), period II (2010–2013), and period III (2018–2021). The predominant cropping patterns observed were continuous maize, mixed cropping, maize-soybean rotation, and continuous soybean cropping. These patterns accounted for 95.28%, 94.66%, and 81.69% of the total land area within each period. Among them, continuous maize cropping was the primary type of continuous cropping pattern in the black soil region of Wangkui County. In each period, we accounted for proportions of the total planting area of 39.9%, 29.3%, and 24.6%, respectively. Maize-soybean rotation was the most important, with proportions of 25.8%, 32.5%, and 15.2% for 2002–2005, 2010–2013, and 2018–2021, respectively. As the rotation periods progressed, both the maize-soybean rotation and soybean continuous cropping exhibited a “rise and fall” trend in the planting area. Specifically, the total planting area of maize-soybean rotation experienced a slight increase during the earlier stage (period I to II), while the rate of decrease intensified during the later stage (period II to III) with a range of 3.2% to −8.6%. The planting area of continuous maize cropping showed a significant decrease during the earlier stage and remained relatively stable during the later stage, with changes ranging from −6.4% to −0.3%. The mixed cropping pattern remained relatively stable during the earlier stage and experienced a significant increase during the later stage, with changes ranging from −2.0% to −19.6%. Although the proportion of rice-based cropping patterns was relatively low, the rice-maize rotation pattern exhibited the most significant fluctuation among all the cropping patterns. It experienced a substantial decrease during the earlier stage and a significant increase during the later stage, with a dynamic change reaching 192.0%. The total planting area of the rice-soybean rotation pattern was consistently the lowest throughout all periods, and its cropping pattern layout underwent significant variations ranging from −11.4% to 93.6%. The comprehensive dynamic change in cropping pattern layout from period II to III (6.0%) was 2.2 times greater than that from period I to II (2.7%), indicating an intensified utilization of arable land during the later stage, with an accelerated rate of change in the subsequent stage. This context suggested an increased level of land utilization.

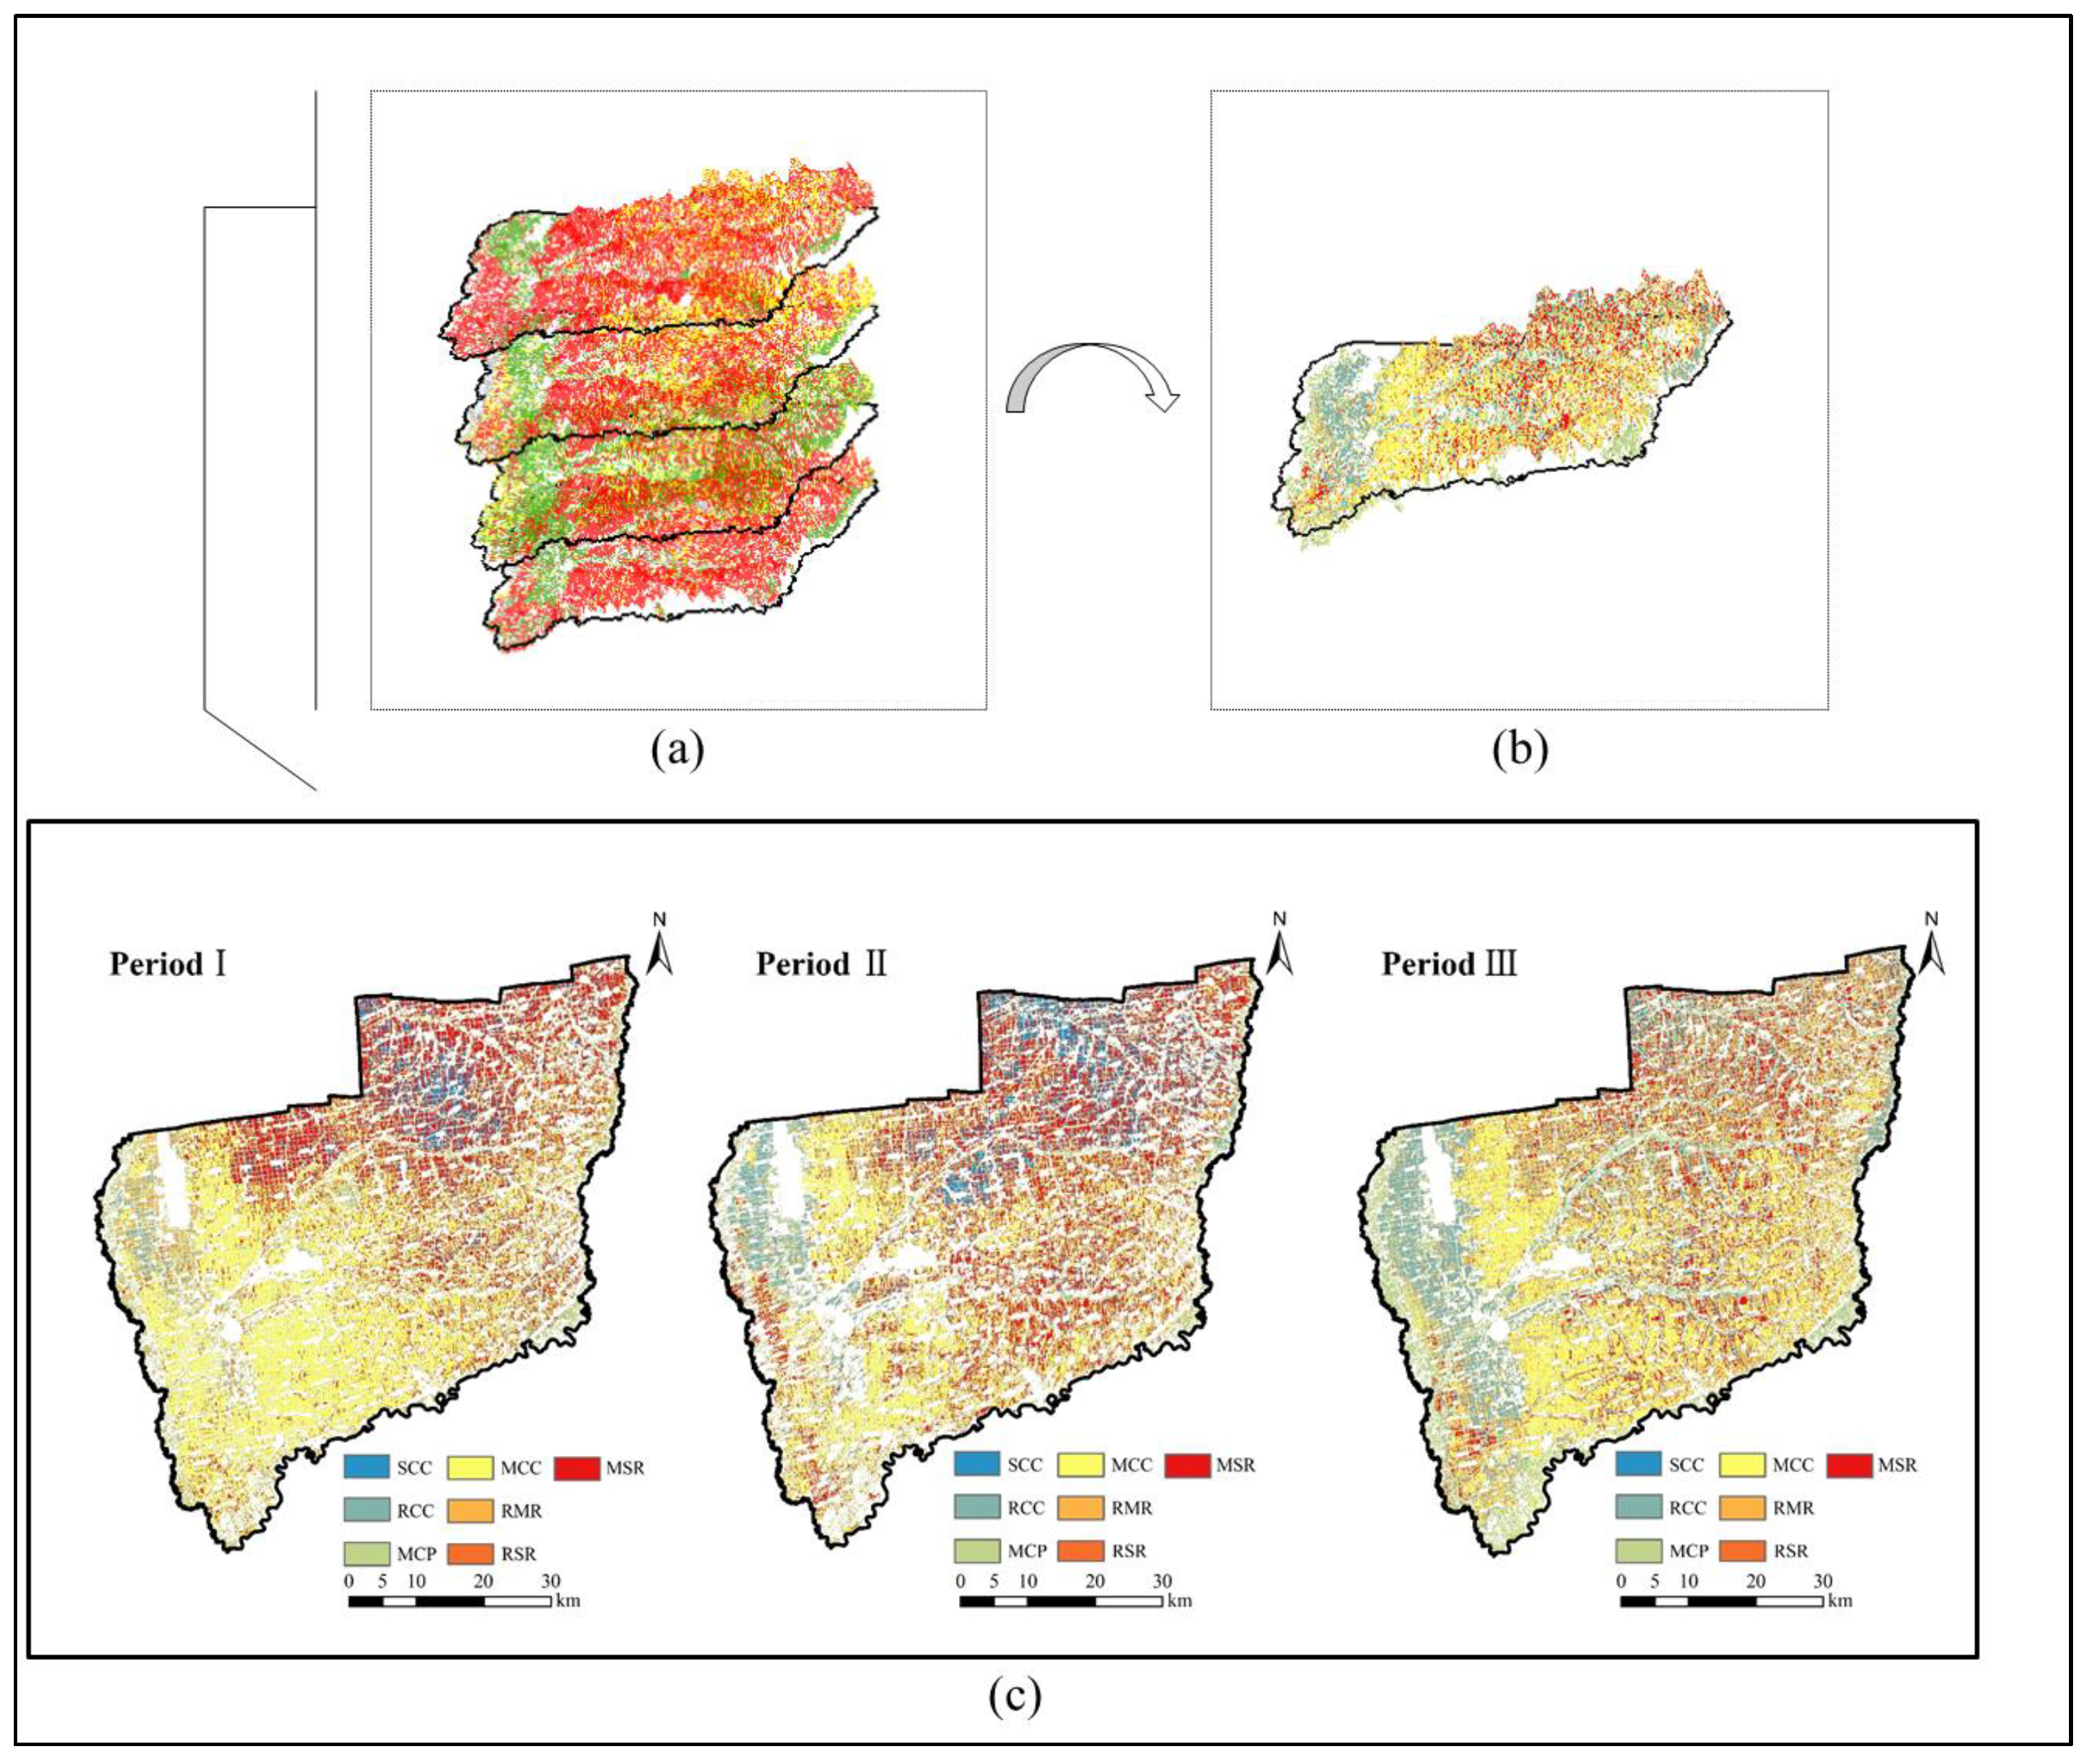
3.3. Spatial Dynamics of Cropping Patterns

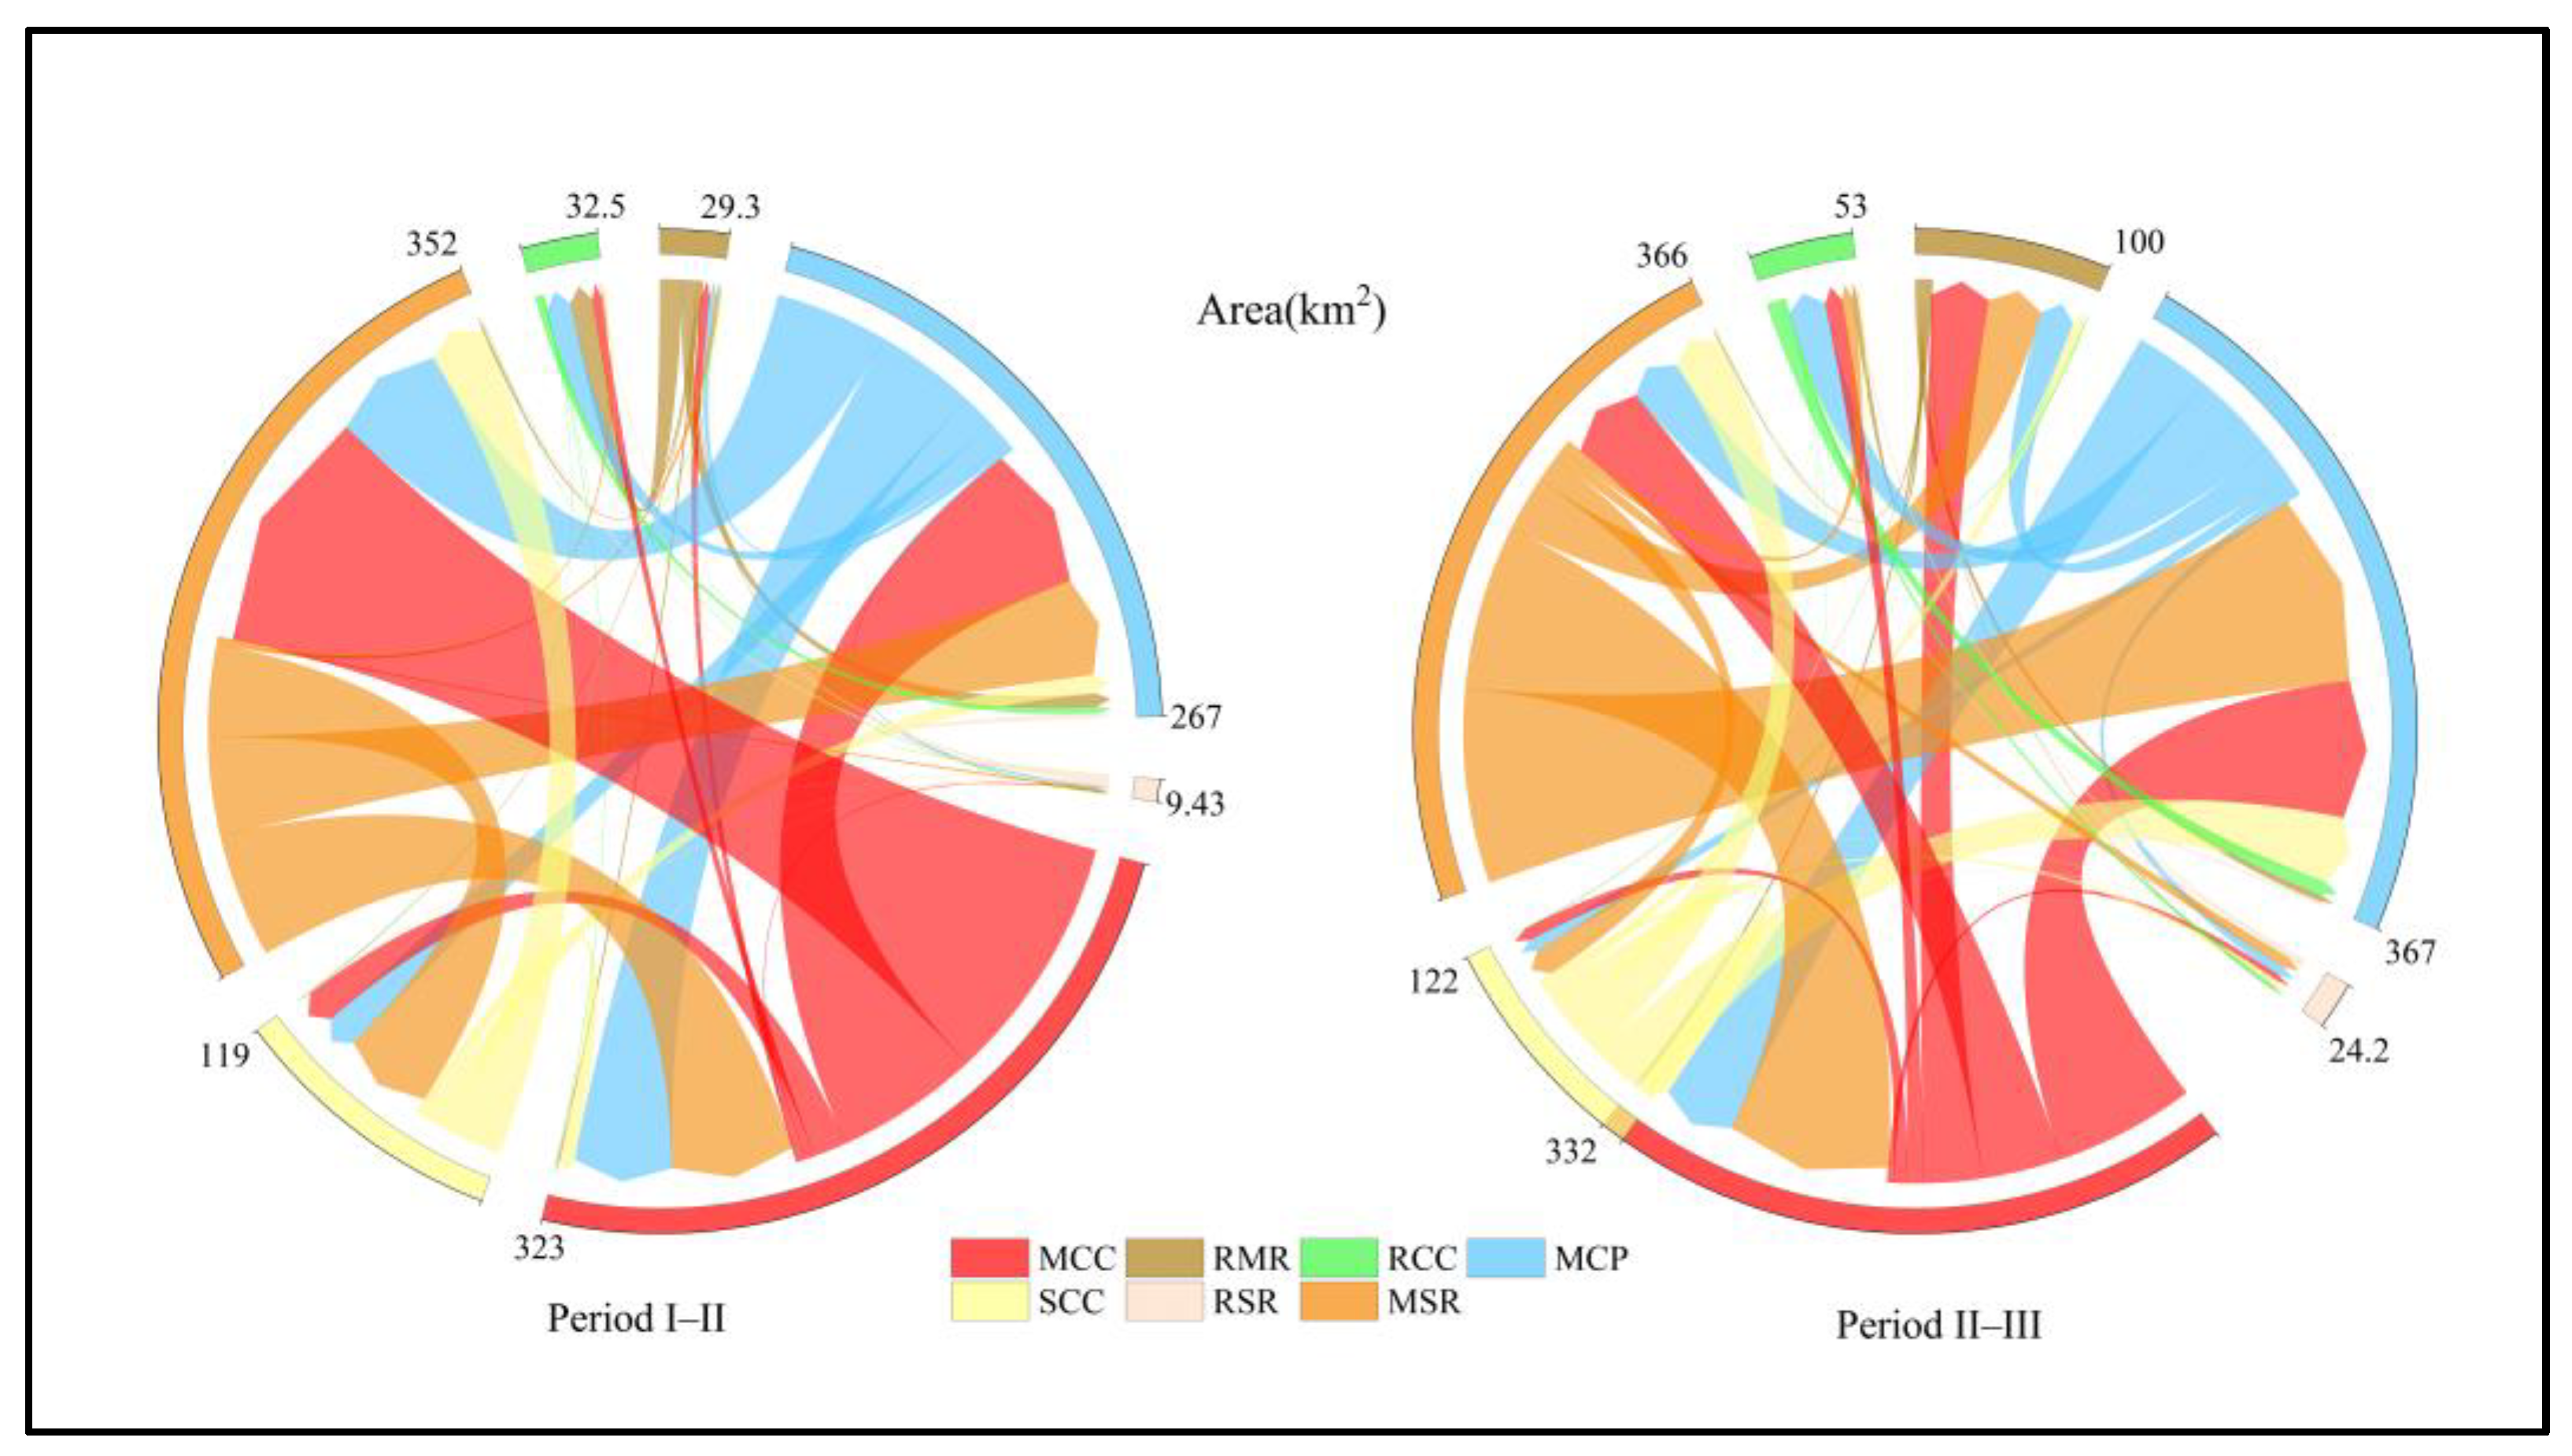
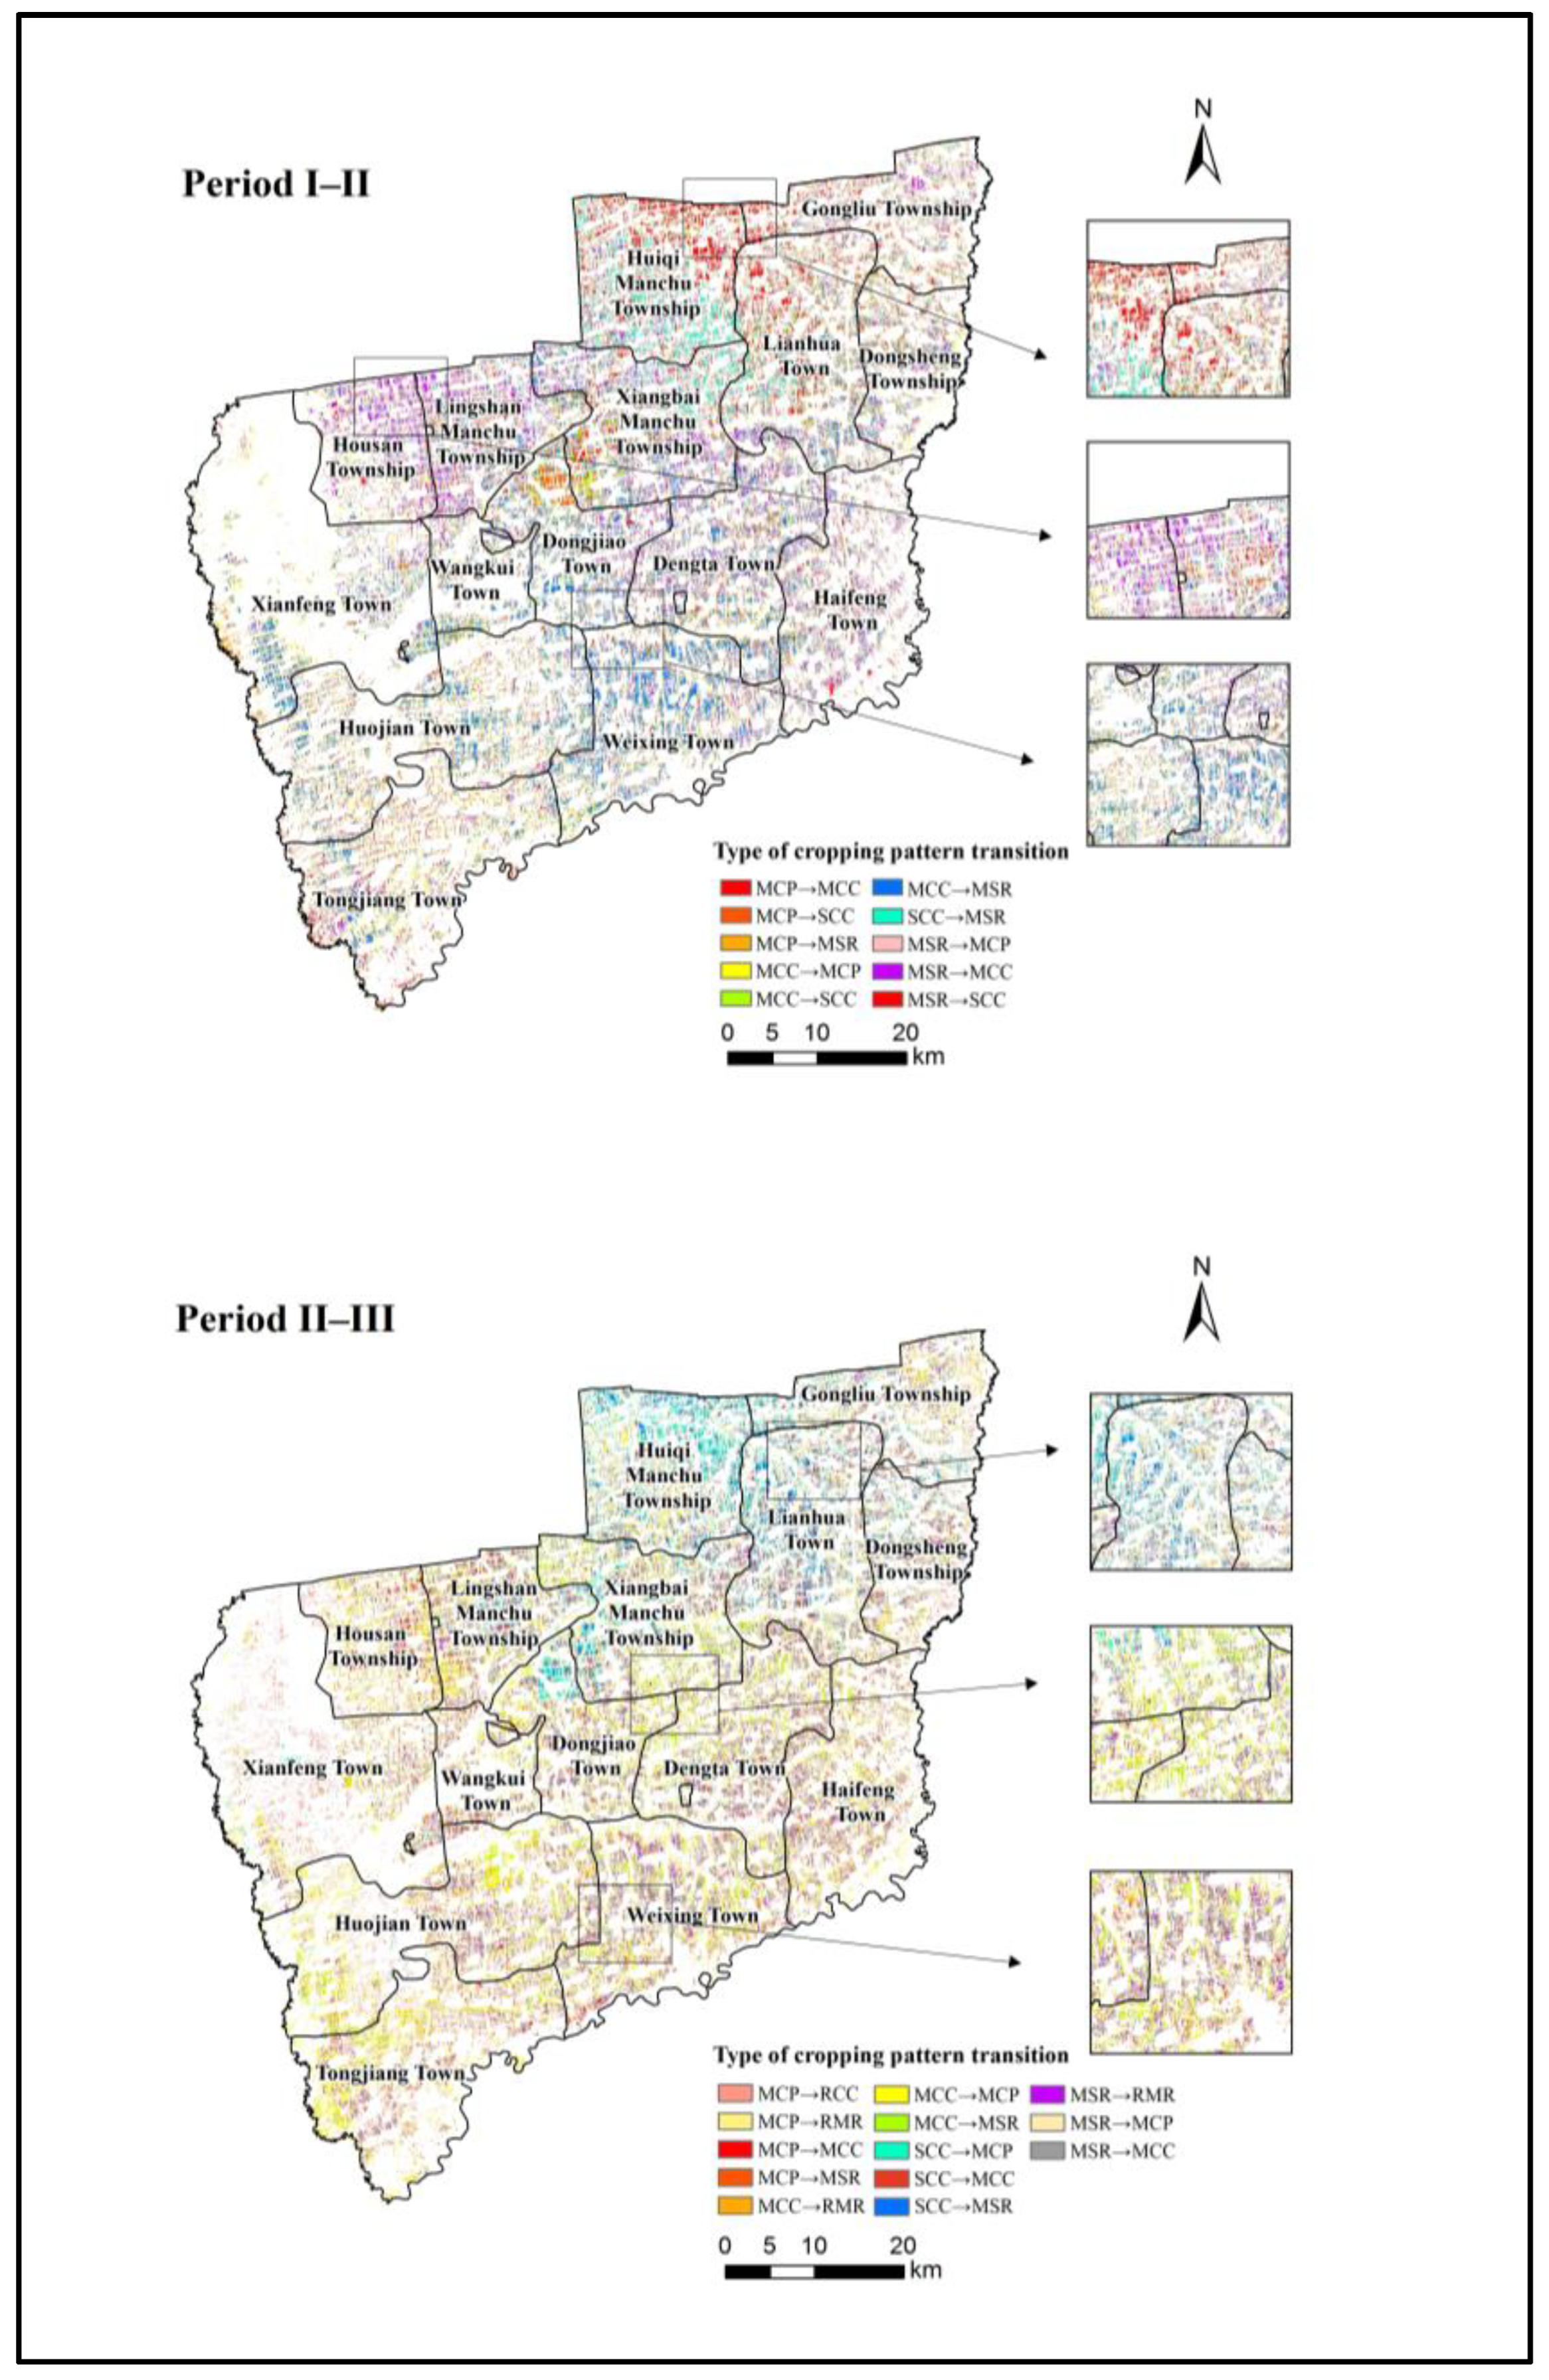
3.3.1. Transition of Cropping Patterns

An analysis was conducted on the transition of cropping patterns across different periods (Figure 4). The main evolutionary characteristics of cropping patterns in Wangkui County were the rotation of maize and soybean, continuous maize cropping, and mixed cropping as the three primary cropping patterns undergoing mutual conversions. There were significant variations in the changes of these cropping patterns. Wangkui County exhibited the highest conversion land area from continuous maize cropping, amounting to 209.03 km2, of which 55.98% transitioned into the rotation of maize and soybeans from period I to period II. The maize and soybean rotation received the highest conversion area, with 199.72 km2 transitioning into this pattern, of which 58.59% originated from the maize continuous cropping pattern. The conversion from the rotation of maize and soybean to mixed cropping was predominant, covering an area of 110.27 km2 in the transition from period II to period III. The essential conversion area during this period was mixed cropping, totaling 241.44 km2, of which 45.67% came from the maize-soybean rotation. A meticulous analysis of the mixed cropping during period III revealed that maize and soybeans predominantly constituted the mixed cropping pattern, with other crops being interplanted in a less organized manner. This situation indicated continuous maize cropping evolved into a maize-soybean rotation and even a mixed cropping pattern.
Visualization analysis was conducted on the transition types with cumulative transfer ratios [41] exceeding 85% for cropping patterns (Figure 5). The findings revealed a clear trend of transitioning from continuous maize and soybean continuous cropping in the southern regions towards a more balanced and sustainable maize-soybean rotation pattern in the northern areas. Furthermore, this rotation pattern exhibited a propensity to evolve into a maize-soybean intercropping method north of the region while gradually shifting towards continuous maize cultivation in the central county. On the other hand, the mixed cropping pattern approach demonstrated a tendency to transform into the maize-soybean rotation pattern in the northern regions while leaning towards continuous maize cultivation in the southern regions. Regarding stability, the continuous rice cultivation and rice-soybean rotation patterns showcased remarkable resilience against external disruptions and environmental fluctuations. The study area has long been committed to promoting the maize-soybean rotation pattern to ensure the sustainable utilization of farmland resources in the black soil region. Compared to the transition between the I-II cropping periods, the conversion of cropping patterns between the II–III periods was more pronounced and substantial.

3.3.2. Evolutionary Pattern of Plot Cropping Patterns

In accordance with the principles of Geographic Information Cartography, we employed the “Map Algebra—Raster Calculator” functionality within ArcGIS 10.7 software to superimpose and categorize the spatial distribution data of planting patterns during periods I to III. Through this methodology, we successfully uncovered further the spatial layout characteristics of cropping pattern changes in Wangkui County. This approach reconstructed the evolutionary pattern map of cropping patterns from the I to III periods (Figure 6), which was subsequently categorized into four different change types based on the characteristics of each stage (Table 3).
Overall, the southern region from Housan Township to the eastern part of Tongjiang Town exhibited a relatively flat terrain and stable changes in cropping patterns, with a predominant pattern of continuous maize cultivation. The plots categorized as “the whole period variation” were primarily situated along the principal branches of rivers and canals in the central part of the county, occupying the first-level terraces. Notably, these plots exhibited a remarkable diversity in their cropping patterns, with significant fluctuations observed in the distribution of the three major grain crops. The “early variation pattern” plots, representing the most widely dispersed category of cropping pattern transitions in the study area, displayed a distinctive characteristic of reciprocal shifts between maize and soybeans as the primary crops. In contrast, the “late variation pattern” plots were concentrated mainly in the county’s southwestern corner, encompassing Huojian Town and Tongjiang Town. Here, rice cultivation took precedence, gradually expanding southward along the rivers and canals as the later stages unfolded.

4. Discussion

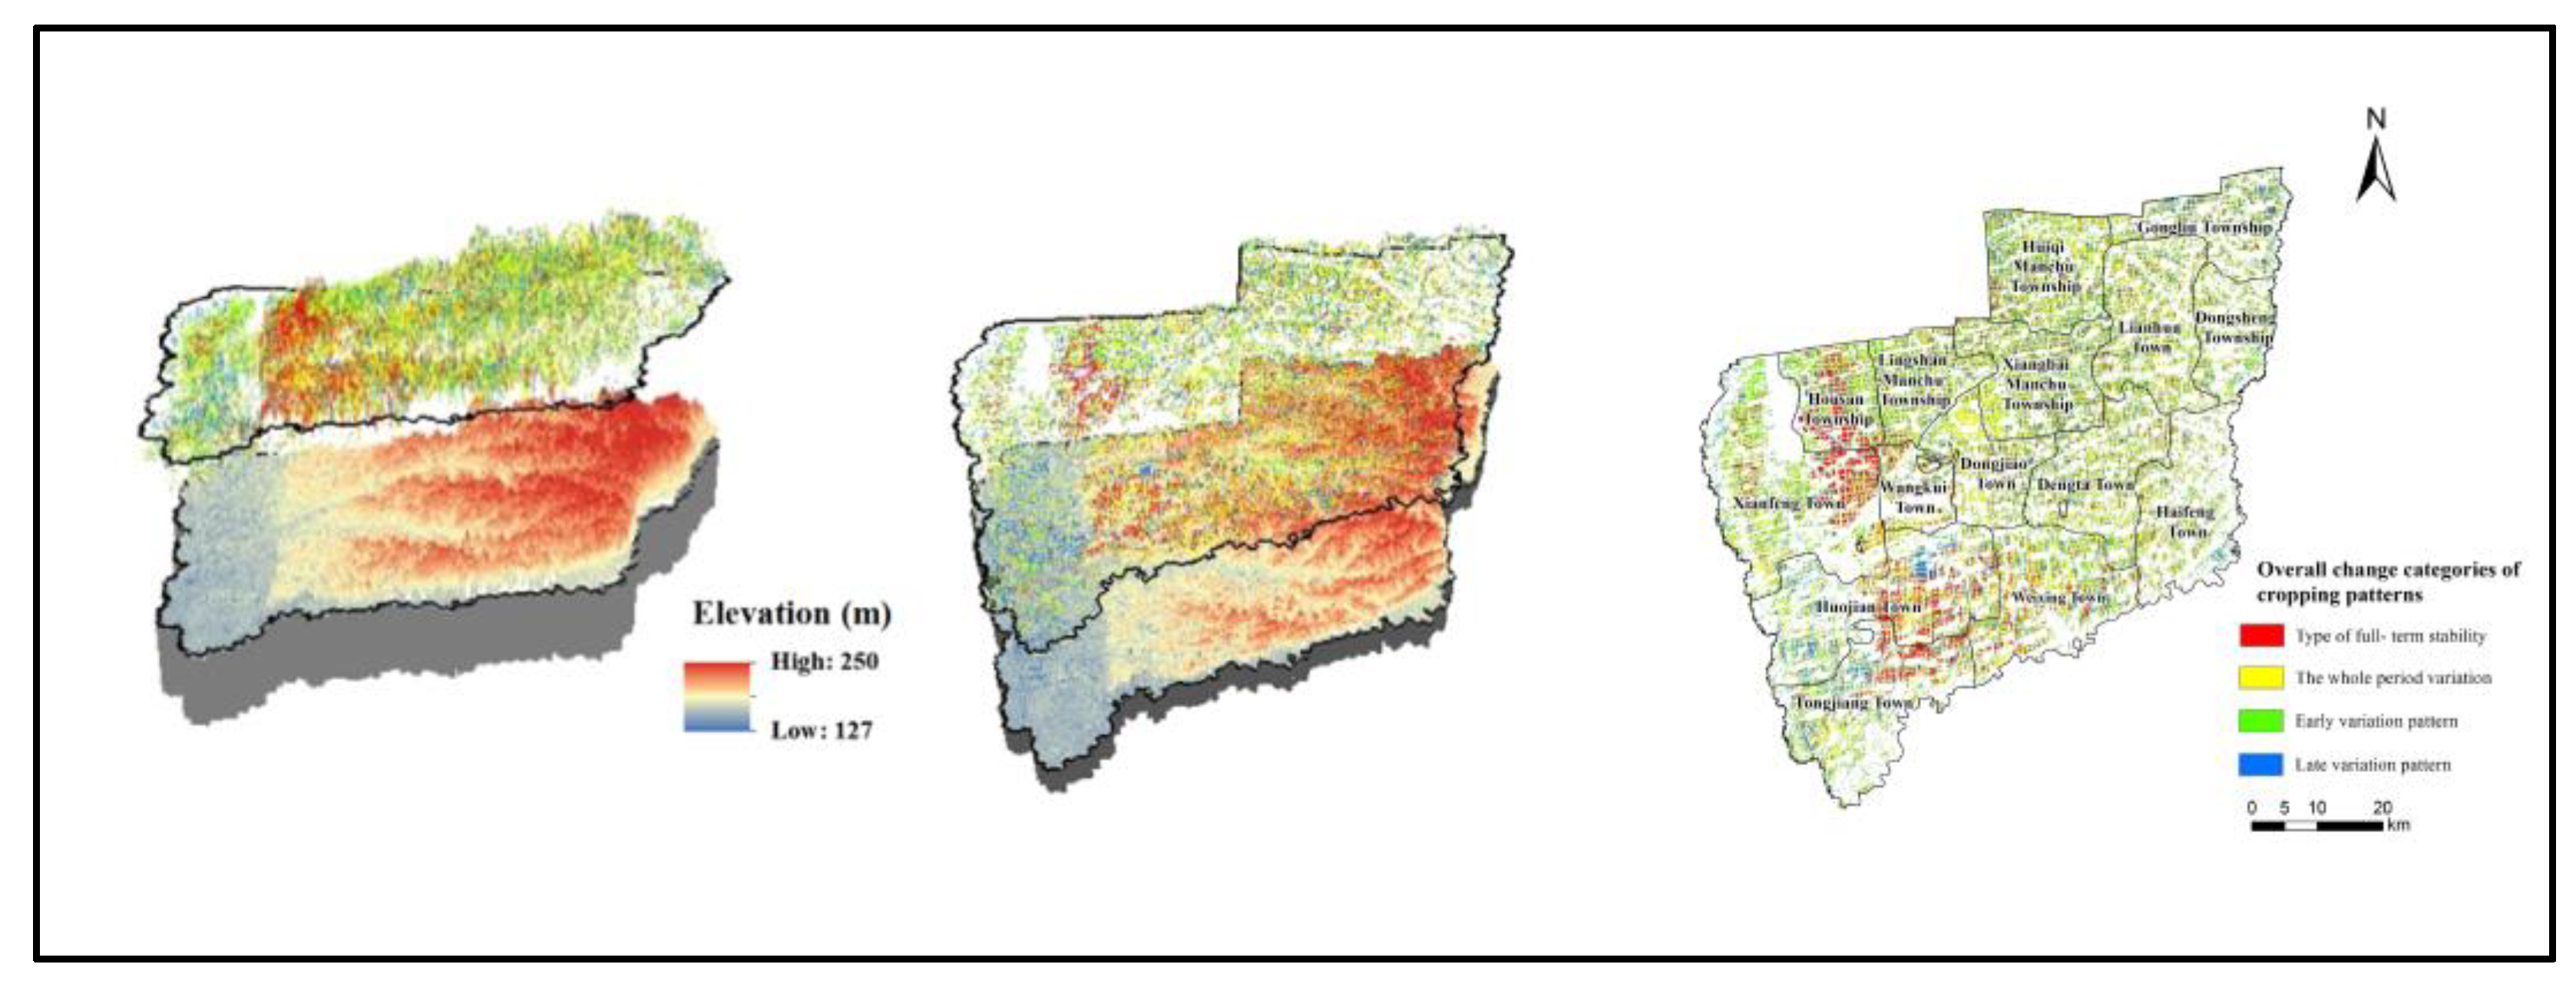
4.1. Natural Factors Effects on the Evolution of Cropping Patterns

Natural factors substantially influenced the spatio-temporal differentiation pattern of cropping patterns in Wangkui County. An intricate mosaic of maize-soybean rotation characterized the planting landscape, with the predominant cropping patterns of continuous maize cropping, continuous soybean cropping, and mixed cropping showing a discernible trend of shifting towards maize-soybean rotation cropping in the northern region during the study period. This transition was likely attributed to the influence of climate warming, which had brought about changes in the suitable zones for crop cultivation and alterations in cropping pattern boundaries [42]. Consequently, an increased occurrence of pest infestation and heightened instances of high-temperature stress on rice crops were observed [43]. In response, farmers in the northern area tended to prefer the most suitable maize-soybean rotation cropping pattern [44], thereby maximizing their chances of achieving bountiful yields.
Furthermore, the water retention capacity of the cultivated land, precipitation, and elevation played a significant role in shaping the spatial patterns of the local cropping patterns. With its low-lying terrain and intersecting rivers and canals, the county’s western region exhibited a stable and predominant cropping pattern focused on rice cultivation. This behavior could be attributed to the influence of water availability and temperature conditions, making it a highly suitable area for rice production [45]. The adjacent farmland within the optimal range for rice cultivation exhibited high moisture content. At the same time, maize, being more resilient to waterlogging than soybeans [46], dominated the planting practices in this region, establishing it as a favorable area for maize production. The secondary terraces in the eastern part of the county displayed a hilly and sloping topography with limited field space, which escalated the costs and challenges associated with conventional mechanized operations.
Moreover, due to their superior soil permeability compared to flat regions, these areas were better suited for soybean cultivation in terms of both natural suitability and economic benefits, consequently constituting an ideal zone for soybean planting. The primary terraces in the central county, situated near river and canal branches, served as the focal point of varied and fluctuating cropping patterns. Overall, farmers’ planting behaviors were significantly driven by natural factors, leading to the county’s spatial aggregation and regional development of tailored planting practices. These findings demonstrate notable scientific regularity and hold considerable potential for broader dissemination and implementation.

4.2. The Evolution of Cropping Patterns and Policy Implementation

The manifestation of the transformative effect of social factors, including national macroeconomic policies, on the decision-making behavior of farmers in Wangkui County, was evident. The dominant continuous maize cropping pattern was shifted to the maize-soybean rotation cropping pattern during the I–II periods. This situation led to a reduction in the maize continuous cropping area and an increase in the planting area of maize-soybean rotation. This shift may have resulted from the temporary maize storage policy implemented by the government in 2009, which subsequently increased maize prices and caused an overabundance of maize in the agricultural reclamation areas. In addition, the Northeast China region’s cold climate also posed significant climate risks, resulting in poor maize quality and severe stockpiling issues. The continuous maize cropping pattern gave rise to a series of ecological and economic problems in the local area. In response, the government advocated for the restoration of the grain-legume rotation in Northeast China in 2016, introducing the “one main crop (maize-soybean rotation as the main crop) with four supporting crops” rotation and the “three-zone rotation” model in pilot areas to safeguard the black soil [38]. A portion of the continuous maize cropping and maize-soybean rotation transitioned to continuous rice cropping, rice-maize rotation, and rice-soybean rotation during the II–III periods.
This shift could be attributed to the requirements outlined in the Ministry of Agriculture and Rural Affairs’ guidance on adjusting the maize structure in the “sickle-shaped bend” region in 2015. These requirements aimed to reduce the maize area and expand the scale of grain and legume rotations [47]. In the same period, the maize-soybean rotation and continuous soybean cropping exhibited a decreasing trend, with the lowest proportion of planting area observed in all cropping periods. The maize-soybean rotation was primarily converted into mixed cropping of maize and soybeans and continuous maize cropping. Simultaneously, the soybean continuous cropping pattern shifted to mixed maize and soybeans, rotation, and continuous maize cropping. This shift could be attributed to the sustained decline in soybean market prices since 2013, leading to weaker planting intentions among farmers. On the other hand, it could be attributed to implementation of the national temporary maize storage policy and the effective implementation of various agricultural subsidies. Therefore, cropping patterns may be impacted by adjustments to agricultural policy and technological advancements. As such, suitable implemented cropping patterns and agricultural policy adjustments may go hand in hand.
These market-driven factors resulted in a spatio-temporal evolution of the grain production structure in the black soil region of Northeast China, characterized by an increase in maize and a decrease in soybeans. Consequently, the traditional maize-soybean rotation pattern faced severe threats. The black soil region of Northeast China still confronts challenges related to imbalanced and inefficient allocation of land utilization factors. Against the backdrop of policies such as the “Law of the People’s Republic of China on the Protection of Black Soil” [48] and the “Pilot Program for Exploring the Implementation of the Cropland Fallow Rotation System” [49], guiding the replacement of rotation patterns based on local conditions holds profound practical significance. Ultimately, it is worth noticing that several factors can influence crop rotation, and stable cropland management rights are essential for implementing crop rotation [14]. Therefore, implementing a suitable crop rotation policy requires continuous socio-economic and political monitoring.

4.3. Measurement of the Evolution of Cropping Patterns

This study utilized Landsat series remote sensing image data from 2002 to 2005, 2010 to 2013, and 2018 to 2021 to investigate the spatial pattern and spatio-temporal differentiation characteristics of the agricultural cropping patterns in Wangkui County. The findings demonstrated the viability of employing multi-temporal Landsat imagery as a data source for supervised classification and utilizing the geo-information Tupu method to identify cropping patterns within this complex temporal-spatial framework. Furthermore, the analysis of the spatio-temporal differentiation characteristics of cropping patterns at a larger scale was deemed appropriate based on the results. The proposed research methodology provided valuable technical support for the recognition and spatio-temporal pattern analysis of crop rotation systems in the black soil region of Northeast China, particularly in the context of the cropping pattern identification and spatio-temporal pattern analysis in the region’s black soil region. Compared to the study conducted by Boryan [50], this research delved deeper into identifying cropping patterns by extracting the frequency of major crop cultivation.
In contrast to the study’s results of Zhang et al. [51], this article not only extracted the cropping patterns of crops but also meticulously measured the spatio-temporal differentiation characteristics of their evolutionary patterns. A unique correspondence between crops and cultivated land existed, and the spatio-temporal differentiation patterns of crops during the production process effectively reflected the transformative features of land use [32]. Although research on the spatio-temporal variation patterns of grain crops has been relatively limited, this study introduced a novel perspective by applying theories and methodologies of land use change to analyze the spatio-temporal evolutionary patterns of cropping patterns. The evolution of crops was more complex and diverse than the changes in land use due to the biological nature of crop cultivation and its relatively low stability in terms of layout. Consequently, a larger spatio-temporal scope was required to reveal the underlying patterns of its evolution.

5. Conclusions

Based on the identification of cropping patterns using the geo-information Tupu method, the temporal dynamics, and the transition matrix of the cropping patterns model, this paper elucidated the predominant cropping patterns and their characteristics evolution. In addition, this study examined the underlying driving forces that may shape the cropping patterns in Wangkui County. In the study area, the predominant cropping patterns encompassed maize continuous cropping, mixed cropping, maize-soybean rotation, and soybean continuous cropping. These cropping patterns exhibited varying degrees of change but maintained an overall stable trend. They accounted for proportions of 95.28%, 94.66%, and 81.69% for 2002–2005, 2010–2013, and 2018–2021, respectively.
Against the backdrop of global climate change, which has led to the relocation of suitable crop planting zones and the shifting of cropping patterns boundaries, Wangkui County underwent significant changes in its agricultural practices. Specifically, there had been a shift towards the maize-soybean rotation cropping in the northern part of the county, where the continuous maize cropping, continuous soybean cropping, and mixed cropping were gradually giving way to this new pattern. Moreover, the maize-soybean rotation evolved into a maize-soybean intercropping trend in the northern region. Natural and social factors jointly drove the spatiotemporal differentiation and evolution of the cropping patterns in Wangkui County. At a macro level, natural factors such as climate, topography, soil, and water resources may shape the spatial distribution patterns of the cropping patterns. Within the county, a mosaic of maize-soybean rotation characterized the agricultural landscape, with rice being suitable near rivers and canals, while adjacent flat areas served as the dominant zone for maize cultivation. The hilly and sloping areas in the eastern part of the county were deemed suitable for soybean cultivation. Simultaneously, social factors such as national macro-policies and market economy contributed to the transformation of farmers’ planting decisions. Agricultural operators’ responsiveness to national agricultural policies became evident throughout different periods, leading to diverse differentiation in cropping patterns. This situation reflected the multifaceted interplay of social factors within the agricultural sector.

Author Contributions

Conceptualization, G.D. and L.Y.; methodology, G.D.; validation, G.D., L.Y., L.H. and B.F.; formal analysis, L.H. and B.F.; resources, L.Y. and G.D.; data curation, L.Y.; writing—original draft preparation, L.Y.; writing—review and editing, G.D. and L.H.; visualization, L.Y. and L.H.; supervision, G.D. and B.F.; project administration, G.D.; acquisition of funding, G.D. All authors have read and agreed to the published version of the manuscript.

Funding

This research was funded by the National Social Science Foundation of China, grand No.21BJY209.

Informed Consent Statement

Informed consent was obtained from all subjects involved in the study.

Data Availability Statement

The data presented in this study are available on request from the corresponding author. The data are not publicly available due to privacy or other restrictions.

Acknowledgments

We thank our colleagues for their insightful comments on an earlier version of this manuscript.

Conflicts of Interest

The authors declare no conflict of interest.

References

  1. Li, B.; Liu, Z.; Huang, F.; Yang, X.; Liu, Z.; Wan, W.; Wang, J.; Xu, Y.; Li, Z.; Ren, T. Security by Strengthening High-Productivity Black Soil Granary in Northeast China. Bull. Chin. Acad. Sci. 2021, 36, 1184–1193. [Google Scholar]
  2. Black Soil Protection Law of China (2022)—China Justice Observer. Available online: https://www.chinajusticeobserver.com/a/black-soil-protection-law-of-china-2022 (accessed on 19 July 2023).
  3. Montanarella, L.; Panagos, P.; Scarpa, S. The Relevance of Black Soils for Sustainable Development. In Regenerative Agriculture; Springer: Berlin/Heidelberg, Germany, 2021; pp. 69–79. [Google Scholar]
  4. Hao, C.; Xiao, W.; Zhou, Y.; Wang, Y. Phosphorus Balance in Typical Rainfield of Black Soil Region in Northeast China. Geosci. J. 2019, 23, 637–648. [Google Scholar] [CrossRef]
  5. Tang, L.; Chen, W. Development Trend and Prospect of Geng Rice in Northeast China. China Rice 2021, 27, 1–4. [Google Scholar]
  6. Liu, Y.; Wang, J. Revealing Annual Crop Type Distribution and Spatiotemporal Changes in Northeast China Based on Google Earth Engine. Remote Sens. 2022, 14, 4056. [Google Scholar] [CrossRef]
  7. Bogužas, V.; Skinulienė, L.; Butkevičienė, L.M.; Steponavičienė, V.; Petrauskas, E.; Maršalkienė, N. The Effect of Monoculture, Crop Rotation Combinations, and Continuous Bare Fallow on Soil CO2 Emissions, Earthworms, and Productivity of Winter Rye after a 50-Year Period. Plants 2022, 11, 431. [Google Scholar] [CrossRef]
  8. AbdelRahman, M.A.E. An Overview of Land Degradation, Desertification and Sustainable Land Management Using GIS and Remote Sensing Applications. Rend. Lincei 2023, 1–42. [Google Scholar] [CrossRef]
  9. Jankauskas, B.; Jankauskiene, G.; Fullen, M.A. Erosion-Preventive Crop Rotations and Water Erosion Rates on Undulating Slopes in Lithuania. Can. J. Soil Sci. 2011, 84, 177–186. [Google Scholar] [CrossRef]
  10. Faye, B.; Du, G.; Mbaye, E.; Liang, C.; Sané, T.; Xue, R. Assessing the Spatial Agricultural Land Use Transition in Thiès Region, Senegal, and Its Potential Driving Factors. Land 2023, 12, 779. [Google Scholar] [CrossRef]
  11. Faye, B.; Du, G.; Chigbu, E.; Chen, R.; Ye, C. Agricultural Land Transition in the “Groundnut Basin” of Senegal: 2009 to 2018. Land 2021, 10, 996. [Google Scholar] [CrossRef]
  12. Cai, H. The Necessity and Technical Measures of Black Land Conservation. Jilin Agric. 2019, 18, 72. [Google Scholar]
  13. Wang, S.; Yang, L.; Su, M.; Ma, X.; Sun, Y.; Yang, M.; Zhao, P.; Shen, J.; Zhang, F.; Goulding, K.; et al. Increasing the Agricultural, Environmental and Economic Benefits of Farming Based on Suitable Crop Rotations and Optimum Fertilizer Applications. Field Crops Res. 2019, 240, 78–85. [Google Scholar] [CrossRef]
  14. Liang, C.; Du, G.; Faye, B. The Influence of Cultivated Land Transfer and Internet Use on Crop Rotation. Front. Sustain. Food Syst. 2023, 7, 1172405. [Google Scholar] [CrossRef]
  15. Scott, D.A.; Eberle, C.; Gesch, R.W.; Schneider, S.; Weyers, S.; Johnson, J.M.F. Yield, Nitrogen, and Water Use Benefits of Diversifying Crop Rotations with Specialty Oilseeds. Agric. Ecosyst. Environ. 2021, 317, 107472. [Google Scholar] [CrossRef]
  16. Zani, C.F.; Barneze, A.S.; Soratto, R.P.; Francis, C.A. The Effect of Crop Rotations on Soil; Reference Module in Earth Systems and Environmental Sciences; Elsevier: Amsterdam, The Netherlands, 2022. [Google Scholar]
  17. Breza, L.C.; Mooshammer, M.; Bowles, T.M.; Jin, V.L.; Schmer, M.R.; Thompson, B.; Grandy, A.S. Complex Crop Rotations Improve Organic Nitrogen Cycling. Soil Biol. Biochem. 2023, 177, 108911. [Google Scholar] [CrossRef]
  18. Aggarwal, S.; Srinivas, R.; Puppala, H.; Magner, J. Integrated Decision Support for Promoting Crop Rotation Based Sustainable Agricultural Management Using Geoinformatics and Stochastic Optimization. Comput. Electron. Agric. 2022, 200, 107213. [Google Scholar] [CrossRef]
  19. Wang, G.; Yang, Y. Practice Exploration and Strategy Optimization of Cultivated Land Resources Protection in Rural China—Focus on Black Land Protection and Others. Hebei Acad. J. 2021, 41, 117–124. [Google Scholar]
  20. Zhao, Q.; Teng, Y.; Huang, G. Consideration about Exploring Pilot Program of Farmland Rotation and Fallow System in China. Ecol. Environ. Sci. 2017, 26, 1–5. [Google Scholar]
  21. Wu, L.; Chen, F.; Ouyang, Z. Evolution of Cropping Systems and Research Progress. Tillage Cultiv. 2002, 22, 1–5+14. [Google Scholar]
  22. Almudena Martín Montero, M.A.C.S. Mapping Multi-Year Cropping Patterns in Small Irrigation Districts from Time-Series Analysis of Landsat TM Images—Dialnet. Eur. J. Agron. 2005, 23, 159–169. [Google Scholar]
  23. Zhu, Z.; Sun, L. Estimation of Regional Cotton-Rice and Rice-Cotton Rotation Periods Based on Satellite Remote Sensing Methodology. Acta Agron. Sin. 2006, 01, 57–63. [Google Scholar]
  24. Du, G.; Zhang, R.; Yu, F. Analysis of Cropping Pattern in Black Soil Region of Northeast China Based on Geo-Information Tupu. Chin. J. Appl. Ecol. 2022, 33, 694–702. [Google Scholar]
  25. Du, G.; Zhang, R.; Liang, C.; Hu, M. Remote Sensing Extraction and Spatial Pattern Analysis of Cropping Patterns in Black Soil Region of Northeast China at County Level. Trans. Chin. Soc. Agric. Eng. 2021, 37, 133–141. [Google Scholar]
  26. Nguyen, H.T.T.; Van Nguyen, L.; De Bie, C.A.J.M.K.; Ciampitti, I.A.; Nguyen, D.A.; Van Nguyen, M.; Nieto, L.; Schwalbert, R.; Nguyen, L.V. Mapping Maize Cropping Patterns in Dak Lak, Vietnam Through MODIS EVI Time Series. Agronomy 2020, 10, 478. [Google Scholar] [CrossRef] [Green Version]
  27. Zhang, X.; Jiao, Q.; Zhang, B.; Chen, Z. Preliminary Study on Cropping Pattern Mapping Using MODIS_EVI Image Time Series. Trans. Chin. Soc. Agric. Eng. 2008, 5, 161–165. [Google Scholar]
  28. Li, Z.; Yang, P.; Zhou, Q.; Wang, Y.; Wu, W.; Zhang, L.; Zhang, X. Research on Spatiotemporal Pattern of Crop Phenological Characteristics and Cropping System in North China Based on NDVI Ti Me Series Data. Acta Ecol. Sin. 2009, 29, 6216–6226. [Google Scholar]
  29. Zhu, K.; Yang, Z.; Huang, L.; Chen, Y.; Zhang, S.; Xiong, H.; Wu, S.; Lei, B. Coupling ITO3dE Model and GIS for Spatiotemporal Evolution Analysis of Agricultural Non-Point Source Pollution Risks in Chongqing in China. Sci. Rep. 2021, 11, 4635. [Google Scholar] [CrossRef]
  30. Wang, J.; Wang, X.; Du, G.; Zhang, H.; Temporal, S.; Wang, J.; Wang, X.; Du, G.; Zhang, H. Temporal and Spatial Changes of Rural Settlements and Their Influencing Factors in Northeast China from 2000 to 2020. Land 2022, 11, 1640. [Google Scholar] [CrossRef]
  31. Song, W.; Chen, B.; Zhang, Y. Land-Use Change and Socio-Economic Driving Forces of Rural Settlement in China from 1996 to 2005. Chin. Geogr. Sci. 2014, 24, 511–524. [Google Scholar] [CrossRef] [Green Version]
  32. Song, G.; Zhang, H. Spatial Reconstruction of Farmland Rotation and Fallow in the Typical Black Soil Region of Northeast China. J. Nat. Resour. 2022, 37, 2231–2246. [Google Scholar] [CrossRef]
  33. Dong, S.; Wang, X.; Chen, Y. Plant Production; Higher Education Press: Beijing, China, 2003. [Google Scholar]
  34. Ji, F.; Liu, J.; Wang, L. Summary of Remote Sensing Algorithm in Crop Type Identification and Its Application Based on GAOFEN SATELLITES. Chin. J. Agric. Resour. Reg. Plan. 2021, 42, 254–268. [Google Scholar]
  35. Li, Q.; Liu, W.; Du, G.; Faye, B.; Wang, H.; Li, Y.; Wang, L.; Qu, S. Spatiotemporal Evolution of Crop Planting Structure in the Black Soil Region of Northeast China: A Case Study in Hailun County. Land 2022, 11, 785. [Google Scholar] [CrossRef]
  36. Torrion, J.; Setiyono, T.D.; Cassman, K.; Specht, J. Soybean Phenology Simulation in the North-Central United States. Agron. J. 2011, 103, 1661–1667. [Google Scholar] [CrossRef]
  37. Chen, Y.; Zhang, Y. Filling Algorithm for Missing Pixels in Landsat-7 SLC-off Images Using No Reference Images. Sci. Geogr. Sin. 2021, 41, 1276–1284. [Google Scholar]
  38. Wang, Q.; Chen, Y.; Yi, X.; Yuan, M.; Tan, C. Rotation between Grain and Soybean in the Cold Area of Northeast China. Agric. Outlook 2018, 14, 48–52. [Google Scholar]
  39. Zewdie, W.; Csaplovics, E. Identifying Categorical Land Use Transition and Land Degradation in Northwestern Drylands of Ethiopia. Remote Sens. 2016, 8, 408. [Google Scholar] [CrossRef] [Green Version]
  40. Wei, S.; Lu, R.; Zhang, L.; Lin, X.; Lu, Y. Transition of Production-Living-Ecological Space and Carban Storage Effect in Guangxi Border Area under Carbon Neutrality Goal. Bull. Soil. Water Conserv. 2023, 43, 399–408. [Google Scholar]
  41. Yu, Y.; Li, Z.; Lin, J.; Liu, J.; Wang, S. TUPU Characteristics of Spatiotemporal Variation for Land Use in the Yihe River Basin. J. Nat. Resour. 2019, 34, 975–988. [Google Scholar] [CrossRef]
  42. Liu, X.; Liu, Y.; Liu, Z.; Chen, Z. Impacts of Climatic Warming on Cropping System Borders of China and Potential Adaptation Strategies for Regional Agriculture Development. Sci. Total Environ. 2021, 755, 142415. [Google Scholar] [CrossRef] [PubMed]
  43. Liang, S.; Wu, W.; Sun, J.; Li, Z.; Sun, X.; Chen, H.; Chen, S.; Fan, L.; You, L.; Yang, P. Climate-Mediated Dynamics of the Northern Limit of Paddy Rice in China. Environ. Res. Lett. 2021, 16, 064008. [Google Scholar] [CrossRef]
  44. Chen, N.; Fan, J.; Liu, S.; Lu, W.; Lian, T.; Mou, Y. Effects of Green Manure-Corn-Soybean Rotation System on the Crop Yield and Quality. Soybean Sci. 2020, 39, 555–563. [Google Scholar] [CrossRef]
  45. Wang, X.; Li, D.; Wu, S.; Xie, X.; Lu, J. Research on Comprehensive Suitability Evaluation Method of Rice Planting Environment. J. Geo-Inf. Sci. 2021, 23, 1484–1496. [Google Scholar]
  46. Nóia Júnior, R.d.S.; Sentelhas, P.C. Soybean-Maize off-Season Double Crop System in Brazil as Affected by El Niño Southern Oscillation Phases. Agric. Syst. 2019, 173, 254–267. [Google Scholar] [CrossRef]
  47. The Ministry of Agriculture and Rural Affairs of the People’s Republic of China Guidance of the Ministry of Agriculture on the Structural Adjustment of Maize in the “Sickle Bend” Area. Available online: https://kns.cnki.net/kcms/detail/detail.aspx?dbcode=CJFD&dbname=CJFDLASN2015&filename=GNZB201511002&uniplatform=NZKPT&v=RZYYHKjODzW5ajkn7Y_4wO858rn15J8JsSRlb_ZgLPo9K1ASGnMs5tkakFeshQIH (accessed on 27 June 2022).
  48. Law of the People’s Republic of China on the Protection of Black Soil. Agric. Compr. Dev. China 2022, 299, 4–7.
  49. Exploring the Implementation of a Pilot Program for Arable Land Rotation Fallow System. Available online: https://kns.cnki.net/kcms2/article/abstract?v=3uoqIhG8C45iO2vZ0jWu7b6KLB8DnSLpC6l_RBZ4ZmDhx_G_KjYCZcqLZBntmM_rKo5oWfQ4SyhKg9lzJi1htq_pZlLkUptOIqaALnbgLkw%3D&uniplatform=NZKPT (accessed on 12 June 2023).
  50. Boryan, C.G.; Yang, Z.; Willis, P.; Di, L. Developing Crop Specific Area Frame Stratifications Based on Geospatial Crop Frequency and Cultivation Data Layers. J. Integr. Agric. 2017, 16, 312–323. [Google Scholar] [CrossRef]
  51. Zhang, Z.; Hua, L.; Zheng, X.; Li, J. Extraction of Cropping Patterns in Jianghan Plain Based on GEE and Sentinel-NDVI Time Series Data. Trans. Chin. Soc. Agric. Eng. 2022, 38, 196–202. [Google Scholar]
Figure 1. Description of the study area: (a) the geographical location of the study area and (b) the topography and administrative border of WangKui County. In addition, (c) represented the current status of crop types in the study area. (Images collected from Google Chrome on 26 July 2023).
Land 12 01574 g001
Figure 2. Processes of cropping pattern recognition. (RCC: Rice continuous cropping. Rice was planted at least three consecutive years within four years; MCC: Maize continuous cropping. Maize was planted at least three consecutive years within four years; SCC: Soybean continuous cropping. Soybeans were planted within four years for at least three consecutive years; RMR: Rice-maize rotation. Rice and maize were alternated in one plot over four years; RSR: Rice-soybean rotation. Rice and soybeans were planted in alternating fields over four years; MSR: Maize-soybean rotation. One plot alternated between maize and soybeans for four years; MCP: Mixed cropping pattern. Unregulated planting on a plot over four years.).
Land 12 01574 g002
Figure 3. Maps showing (a) an overlay diagram of multi-period crop classification data, (b) a three-dimensional illustrative diagram of the cropping pattern in a singular period, and (c) the distribution of cropping patterns by crop rotation period in Wangkui County.
Land 12 01574 g003
Figure 4. Chord diagram of cropping pattern transition matrix in Wangkui County during the period I–III.
Land 12 01574 g004
Figure 5. Spatial distribution of the main trajectory codes for cropping pattern transition of Wangkui County in the I–III period.
Land 12 01574 g005
Figure 6. Evolutionary patterns of cropping patterns in plots of Wangkui County in the period I- III.
Land 12 01574 g006
Table 1. Statistics of remote sensing image information.
Landsat ImagesYearAcquisition DateResolution (m)Cloud Proportion (%)
Landsat7 ETM+200207-06305.21
Landsat7 ETM+200308-16307.63
Landsat5 TM200407-21304.33
Landsat5 TM200508-07305.35
Landsat7 ETM+201008-13306.16
Landsat7 ETM+201108-01300.99
Landsat7 ETM+201207-19302.67
Landsat8 OLI201307-30301.82
Landsat8 OLI201808-10300.7
Landsat8 OLI201908-15301.13
Landsat8 OLI202007-15302.69
Landsat8 OLI202107-24303.79
Table 2. Overall variation in cropping patterns of Wangkui County (Periods I–II and III).
Type of Cropping PatternPeriod IPeriod IIPeriod IIITemporal Dynamics of Cropping Patterns
Area
(km2)
Proportion (%)Area
(km2)
Proportion (%)Area
(km2)
Proportion (%)Period I–IIPeriod II–IIIPeriod I–III
SCC71.4905.2116.2859.148.9203.212.5−11.6−3.2
RCC18.2131.349.7943.9114.8837.434.726.153.1
MCP337.02324.4302.82123.8599.91238.7−2.019.67.8
MCC551.25339.9374.01229.3380.30724.6−6.40.3−3.1
RMR35.4922.613.3061.0141.0139.1−12.5192.029.7
RSR11.4210.84.9120.427.9121.8−11.493.614.4
MSR356.41325.8414.10932.5235.83115.23.2−8.6−3.4
Total1381.3051001275.2391001548.7781002.76.05.8
Table 3. Overall change categories of cropping patterns in Wangkui County during the period I- III.
Type of ChangeDefinition of Relevant ConceptsDescription
Type of full-term stabilityThere was no change in periods I–III.SCC-SCC-SCC
The whole period variationThe I–III periods were changing throughout the whole period.SCC-RCC-SCC
Early variation patternPeriods I–II were changing, and periods II–III were not changing.SCC-RCC-RCC
Late variation patternPeriods I–II were not changing; periods II–III were changing.SCC-SCC-RCC
Disclaimer/Publisher’s Note: The statements, opinions and data contained in all publications are solely those of the individual author(s) and contributor(s) and not of MDPI and/or the editor(s). MDPI and/or the editor(s) disclaim responsibility for any injury to people or property resulting from any ideas, methods, instructions or products referred to in the content.

