Article

Homogenization of Urban Forests across the Subtropical Zones of China

1
School of Art and Archaeology, Hangzhou City University, Hangzhou 310015, China
2
College of Life Sciences, Zhejiang University, Hangzhou 310058, China
3
Zhejiang Environmental Technology Co., Ltd., Hangzhou 311100, China
*
Author to whom correspondence should be addressed.
Land 2023, 12(8), 1559; https://doi.org/10.3390/land12081559
Submission received: 6 July 2023 / Revised: 29 July 2023 / Accepted: 4 August 2023 / Published: 6 August 2023
(This article belongs to the Topic Urban Forestry and Sustainable Environments)

Abstract

:
The composition of urban forests (UFs) exhibits homogenization among cities compared with rural forests (RFs) among different climate zones. However, the degree of homogenization in subtropical UFs and its difference from RFs remain unclear. In this study, we examined tree species composition and diversity in UFs in 19 cities in China’s subtropical zone with precipitation ranging from 458 to 1852 mm and compared them with RFs. We found that (1) the species composition similarity, Jaccard index (J~0.27), between UFs was significantly higher than that (J~0.15) of RFs, indicating biotic homogenization; (2) tree species richness, Simpson, Shannon–Wiener, and Pielou index of UFs converged along the precipitation gradient; (3) the similarity of tree composition between UFs increased as precipitation of the cities were more similar; (4) the UFs in the 19 cities contained a total of 932 tree species, among which the nonnative species were more prevalent than the native species, and the top 37 species with high frequency appeared in 80% of the cities; and (5) Salix babylonica, Ginkgo biloba, Platycladus orientalis, Juniperus chinensis, and other tree species were suitable for planting in UFs in subtropical zones, regardless of humidity. The findings contribute to the understanding of urban forest development and provide insights for implementing greening policies aimed at providing additional ecosystem services.

1. Introduction

Urban forests (UFs) play a pivotal role in providing essential regulatory services that contribute to creating a clean, safe, and secure living environment, fostering the sense of safety among urban inhabitants [1], such as climate control, air purification, and noise reduction [2]. Additionally, cultural services provided by urban green spaces, including recreational opportunities, eco-tourism potential, and enhanced aesthetics, are instrumental in promoting positive social relations and supporting the mental health of individuals and communities [3,4]. The expansion of built-up areas led to replacing natural habitats, resulting in significant changes in species abundance and composition [5]. Based on human preferences, the introduction of coexisting species and the construction of similar habitats in cities altered diversity patterns [6,7,8]. These factors caused the species composition of UFs in different climate regions to be more similar than that of natural vegetation, a process known as ‘biotic homogenization’ [9,10]. Furthermore, horticultural nurseries in different regions provide similar plants that also contribute to homogenization [11]. Previous studies on UF homogenization typically cover multiple climate factors [12,13], and the interaction between multiple factors may hinder an in-depth understanding. Analyzing a single variable can help explore the contribution of climate factors to the variation in species composition. A recent study quantified the degree of biotic homogenization of UFs along the temperature gradient as a single factor [14]. However, the relationship between homogenization and the precipitation has not been investigated.
Climate conditions are crucial determinants of the spatial distribution of natural vegetation in a region [15,16]. In areas with similar temperatures, water availability is the primary factor that determines the level of species diversity across different regions [13]. As we move from humid areas to arid areas, the number of tree species in natural vegetation decreases, and the vegetation type shifts from forest to grassland and ultimately to desert [17]. Nevertheless, green spaces in arid regions still maintain trees. Unlike natural vegetation, most UFs are created and managed by humans [14], and socioeconomic factors are crucial drivers of plant diversity in urban areas [2,18]. Recent studies on public green spaces in Chinese cities reveal that tree species diversity increases with population size and Gross Domestic Product (GDP) among cities, akin to the “luxury effect” [12,14]. In contrast to rural vegetation, supplementary irrigation can enhance plant diversity in UFs [18]. Thus, the response of plant diversity to water factors in UFs may differ from that in rural forests (RFs), and the extent of this deviation requires quantification.
Currently, studies on species composition homogenization predominantly utilize the Jaccard similarity index, which is based on species presence and absence data, to measure species composition similarity changes [7,9,11,14]. Homogenization of the species composition in UFs in different regions follows the “distance decay” effect [2,10]. For instance, the similarity in the species composition of UFs in the Yangtze River valley in China decreases with increasing distance between cities [10]. A study in the humid area of eastern China showed that the similarity of species composition between cities decreased with the increase in temperature difference between cities [14]. Thus, we presume that the similarity of tree composition also decreases with an increase in moisture difference between cities. In addition to exploring the homogenization of species composition, some studies examined whether species diversity converges by quantifying the diversity of plant species in UFs using the species diversity index [14,19]. For example, compared with natural grassland, although the grassland species composition among American cities is homogenized, the Shannon–Wiener diversity index does not converge [19]. Thus, the Jaccard similarity index and diversity index cannot substitute for each other. Therefore, both the species composition and species diversity index should be considered in UF homogenization studies. On the east coast of China, the Simpson index of tree species in UFs has been proven to converge along the temperature gradient [14]. Similarly, quantifying the deviation between UF diversity and natural vegetation along a precipitation gradient is critical to understanding UF homogenization.
In this study, we selected 19 cities located along a precipitation gradient in the subtropical zone of China as case studies. We compared changes in tree species composition, species richness, and Simpson, Shannon–Wiener, and Pielou indices in UFs and RFs along the precipitation gradient. We aimed to (1) examine whether the tree species composition of UFs is homogenized along the precipitation gradient and quantify similarity change, (2) analyze whether the tree diversity (indicated by species richness and biodiversity index) of UFs converges along the moisture gradient by comparison with RFs, and (3) explore the driver of homogenization of tree species in UFs. This study enhances our understanding of the biotic homogenization of UFs along precipitation gradient, offering valuable insights to inform policies concerning biodiversity conservation and the management of urban green spaces.

2. Materials and Methods

2.1. Study Area

The subtropical regions of China are influenced by monsoon and terrain factors, resulting in great precipitation gradients from east to west. Precipitation in the eastern coastal areas is relatively high due to the influence of the monsoon, while in the western areas, the terrain is high, the temperature is low, the water vapor content is low, and the precipitation is relatively low. The subtropical region is the most widely distributed in China and encompasses the Yangtze River Delta and Pearl River Delta regions, which are the most active economic areas in China. For this study, we selected 19 cities along the precipitation gradient from east to west in the subtropical region of China. The mean annual precipitation of these cities ranges from 458 mm to 1852 mm, with an average of 1221 mm and a median of 1155 mm (Figure 1).
The 19 cities chosen for this study are located along the precipitation gradient from east to west in China’s subtropical zone, with longitudes ranging from 91°06′ to 122°12′ E and latitudes ranging from 22°13′ to 31°16′ N. The number of residents for these cities ranges from 2.6 million people (Ankang City) to 28.8 million people (Chongqing City). The GDP of these cities ranges from 19.7 billion yuan (1 yuan = 0.14 US dollars on 8 June 2023) of Lhasa City to 2483.8 billion yuan of Shanghai City (Table S1). The rural forests of the 19 case cities are forest from humid type to summer humid (https://www.resdc.cn/, accessed on 15 May 2021) and were divided into 6 regions (Figure 1). The cities in the same region shared the features of the RFs (Figure 1).

2.2. Data Collection and Processing

2.2.1. Tree Community Data of Urban Forests

The UFs considered in this study were defined as clusters of trees in green spaces, including pocket parks and gardens with trees, trees on streets or in public squares, and any other green spaces with trees, such as riparian corridors and nurseries [3]. UFs are created and maintained by humans; thus, Ufs typically refer to artificial vegetation in built-up areas [11,14]. To study the tree communities of Ufs, we established 50–200 quadrats per city based on the size of the city’s built-up area. Each quadrat covered an area of 400 square meters, with dimensions of either 20 m × 20 m or 40 m × 10 m [20]. In each city, we established 4–6 transects running from the city center to the edge, with a width of 1 km in different directions on Google Earth. All 1144 quadrats of UFs were evenly distributed from the city center to the edge and investigated in the 19 cities. Field surveys were conducted between August 2017 and September 2020 to investigate various UF types, including residential green spaces, park green spaces, traffic green spaces, and other types, where artificial vegetation was the main type. All tree species within each of the 400 m2 quadrats and their corresponding abundances were recorded.
Given the potential limitations of our sampling data, this study has taken additional measures to strengthen the robustness of our subsequent analysis. To address this concern, we conducted further data collection by gathering relevant information from existing studies conducted in similar case cities. Literature data for the tree diversity index of UFs were also retrieved using the method developed by Chen et al. [14]. In September 2020, the China National Knowledge Infrastructure (CNKI; http://cnki.net, accessed on 12 September 2020) and ISI Web of Science (http://webofknowledge.com, accessed on 16 September 2020) databases were searched using the case city names and 10 keyword combinations related to urban green spaces, urban greening, and vegetation diversity. The retrieved literature was screened based on three criteria: (1) The research in the literature focused on either planted vegetation alone or a combination of planted vegetation and residual natural vegetation. When both types of vegetation are considered, the data pertaining to the residual natural vegetation can be clearly identified and then excluded from the analysis; (2) the literature contained tree species lists or diversity indices that were calculated using the same method as this study; and (3) a quadrat size of 400 m2. For studies with nondigitized results, data extraction and transformation were performed using GetData Graph Digitizer (Ver. 2.25) and Excel (Ver. 2021). The diversity data of 3533 forest quadrats were supplemented using the diversity index calculated in the literature (Table S2). The number of quadrats varied across cities due to differences in urban area and research intensity. In total, 4724 quadrats (1191 from the field survey and 3533 from the literature; Table S2) were analyzed across the 19 cities, with each city containing 70 to 457 quadrats.
The method developed by Yang et al. was utilized to estimate the relative standard error (RSE) of the sample and evaluate the reliability of the results [21]. According to the previous study, a decrease in RSE to 12% reduces the impact of increasing the sample size on sampling error reduction [22]. The analysis of the Simpson index revealed that the RSE was below 8% when the number of quadrats in Guangzhou was 50 (Figure S1). Given that the number of quadrats in all cities was greater than 50, it was concluded that these quadrats could accurately reflect the species diversity of UFs. The average tree species diversity of each city was calculated by aggregating the data from all quadrats to estimate the overall tree diversity.
Tree species identified in each study were documented and augmented by including data from the official websites of urban greening departments. The number of tree species observed in this study in each city closely aligned with the number reported by the government department responsible for urban greening (Table S3), indicating that the methodology identified most of the tree species present in each city. To verify the scientific names and taxonomic classifications of tree species, the Flora of China system (Flora of China Editorial Committee, 2013), published literature, and other studies were cross-referenced. Additionally, the occurrence of greenery species in the corresponding natural areas of the city was determined (Figure 1). A tree species was categorized as native if it naturally occurred in the city’s natural area, while nonnative species were those that did not. Furthermore, the planting of tree species in more than 80% of cities was noted to gain insight into the main tree species planted in various types of urban forests (Table S4).

2.2.2. Data for the Community Traits of Rural Forests

The term “rural forests” in this study did not encompass “rural vegetation outside the urban area” but rather referred to forests outside the urban area that were subject to fewer human disturbances. While grassland and desert are the predominant vegetation types in semiarid and arid areas, trees can also be found on shaded mountain slopes and near water sources in these regions. To gather data on tree species lists and diversity for RFs across different climate regions, we conducted literature searches using the China National Knowledge Infrastructure and Web of Science databases. In September 2020, we employed keywords such as “woodland” and “forests,” combined with other terms related to vegetation, tree community, plant diversity, species composition, community structure, and tree diversity. This allowed us to collect data on plant diversity in RFs located outside the 19 case cities. We screened the retrieved literature based on the following criteria: (1) the studies focused on natural vegetation in regions surrounding urban built-up areas or included planted vegetation that could be excluded; (2) the literature provided tree species lists or diversity indices calculated using the same method as our study; and (3) the quadrat size was specified. After gathering tree diversity data from 1439 rural quadrats, we grouped these quadrats into 26 field survey sites based on their locations (Table S3). The diversity index data reported in the literature, calculated using the same method as in our study, were used directly. By calculating the average tree species diversity across all quadrats within each climate region, we estimated the tree diversity of RFs located outside the urban area.

2.2.3. Socioeconomic Attributes

To assess the impact of socioeconomic characteristics on tree diversity, we obtained information on population, built-up area, GDP, and per capita GDP from China’s Urban Statistical Yearbook (China National Bureau of Statistics).

2.2.4. Data for Climate and Calculations

To obtain precipitation data, we calculated the averages of data from 1951 to 2011 from the China Meteorological Administration (http://www.cma.gov.cn/, accessed on 21 March 2021) for each city and climate region.

2.2.5. Data for Distance between Cities

Using ArcGIS, we calculated the geographical distance between pairs of cities based on the coordinates of their respective commercial centers with the highest land price. We also determined the distance between pairs of climate regions by using the coordinates of the geometric centers of the six climate regions.

2.3. Calculations

The similarity in tree species composition between pairs of cities or regions was assessed using the Jaccard similarity index (J), following the method described by McKinney [9]. Specifically, the Jaccard similarity index was computed for each pair of cities or climate regions,
J = c / ( a + b c )
where a is the number of tree species found at the first site, b is the number of tree species found at the second site, and c is the number of tree species shared by the two sites. The value of J ranges from 0 to 1, where 0 indicates that there are no common tree species between the two sites, while 1 indicates that the two sites share the same tree species composition.
After computing J for each pair of cities and climate regions, the Mann–Whitney U test was employed to compare the J of UFs and RFs [10]. The homogenization of species composition in the green spaces was considered when the J value in UFs exceeded that in RFs [11]. The homogenization index (H) established by Lososová et al. was utilized [23]:
H = J U F J R F
where JUF is the J of the species composition in UFs and JRF is the J of the species composition in RFs. The range of values for H is from −1 to 1, where a positive value of H indicates a homogenization effect in UFs, and a negative value of H indicates a differentiation effect.
The variation trend of J in UFs and RFs on the precipitation gradient was analyzed, and their relationship with the distance and difference in mean annual precipitation were examined. Furthermore, the relationship between the J of tree composition in UFs and socioeconomic factors was investigated.
To evaluate tree community diversity, we computed the Simpson, Shannon–Wiener, and Pielou indices using the tree species and abundance data obtained from field investigations. The Simpson index is used to measure the concentration or dominance of a species and reflects changes in the abundance of common species [11]:
D = 1 i = 1 s P i 2
where S is the total number of tree species present in each community or quadrat, and Pi is the proportion of individuals belonging to the i-th tree species relative to the total number of individuals present in the community or quadrat. The Shannon–Weiner index is calculated as
S W = i = 1 s P i l n P i
where the meaning of the above parameters is the same as that of Formula (3). The Pielou index describes the evenness of the individual number distribution among species in an ecosystem and is calculated as
P = S W / l n S
where H is the Shannon–Weiner index and S is the number of species.
Linear regression was conducted to explore the potential relationship between tree diversity in UFs and ecological and socioeconomic factors. All statistical analyses were performed using R version 4.2.3 [24].
The degree of deviation in tree diversity was measured by the coefficient of variation (CV) for tree community diversity:
C V % = s / x ¯ × 100
where s is the standard deviation of the diversity index in UFs or RFs, and x ¯ is the mean value of the diversity index in UFs or RFs. If the CV of UF tree diversity is smaller than that of RFs, it indicates that UF diversity is converging.

3. Results

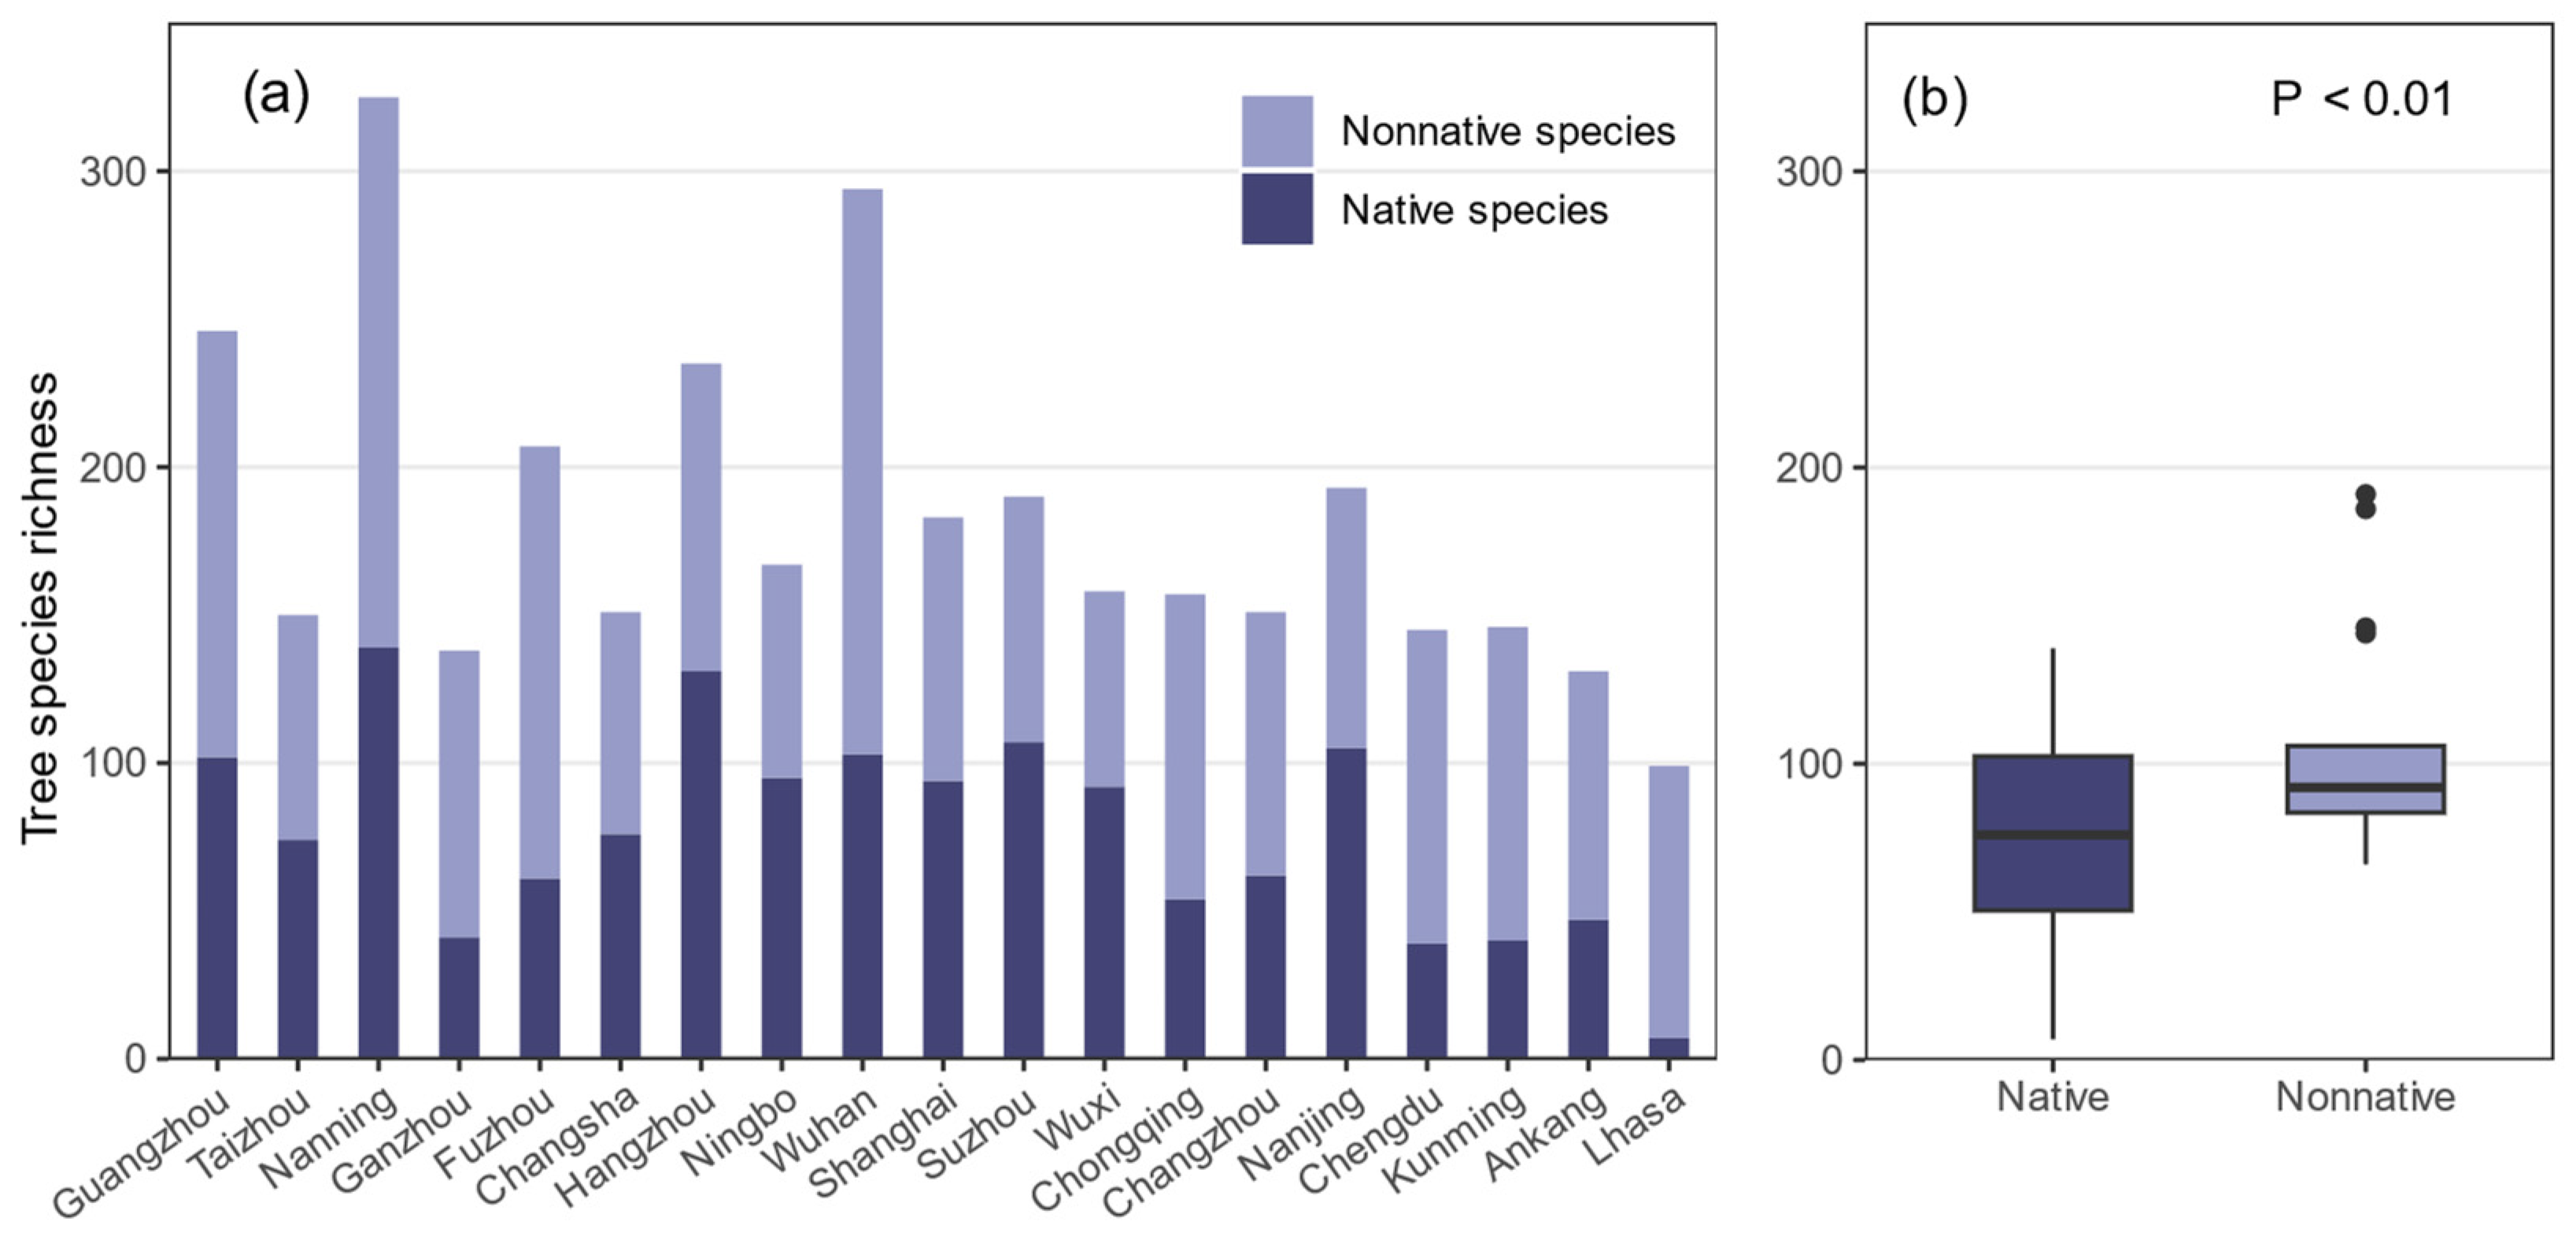
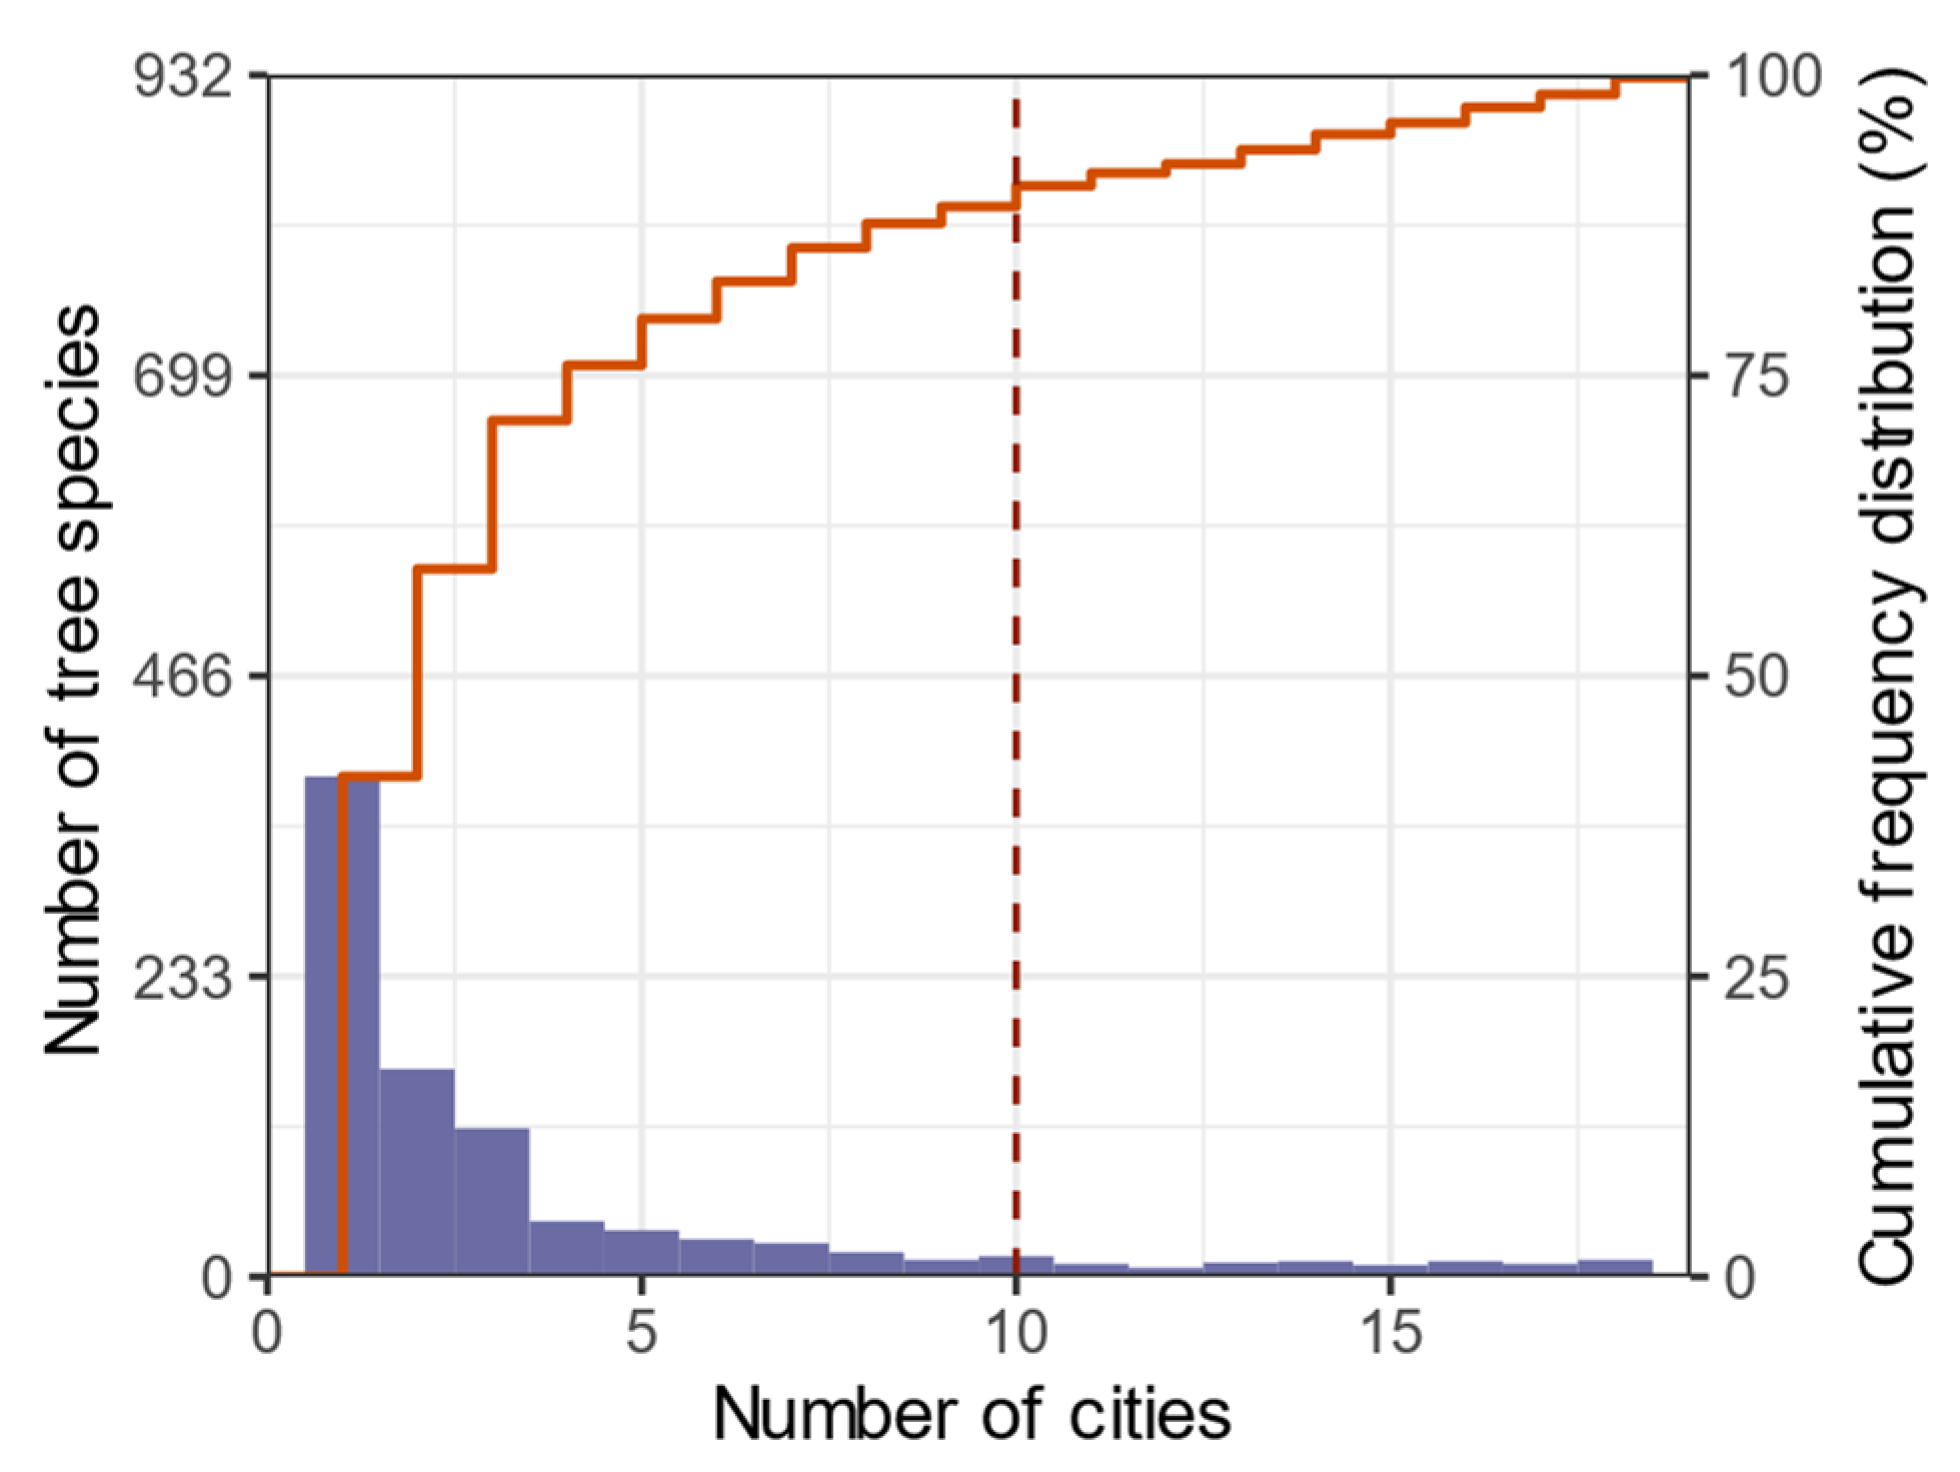
3.1. Tree Species Richness in Urban Forests

The UFs in the 19 cities had a total of 932 tree species, ranging from 99 to 325 species (Figure 2a). The proportion of native tree species in UFs ranged from 7.1% to 58.2%, with an average of 41.3%. Paired t tests showed that the number of native tree species were significantly fewer than that of nonnative tree species (Figure 2b). Among them, 664 species (71%) were observed in UFs in no more than three cities, and 388 species (42%) were exclusively found in a single city. Additionally, 102 species (11%) of tree species were planted in over half of the case cities, with 37 of these species planted in over 80% of the case cities (Figure 3, Table S4). The frequently planted tree species were mostly characterized by colorful foliage, such as Ginkgo biloba and Acer palmatum, and distinctive shapes, such as Pinus tabuliformis and Platycladus orientalis. These trees were the most used in park green spaces (Table S4).

3.2. Variations in Tree Diversity in Urban Forests and Rural Forests along the Precipitation Gradient

Tree species richness in the RFs along the mean annual precipitation (MAP) gradient ranged from 22 to 675 species (Table 1), with an increasing slope of 3.04 species per cm precipitation (Figure 4a). In contrast, tree species richness ranged from 99 to 325 and almost did not increase with MAP in UFs with a slope of only 1.02 (Figure 4a). The Simpson index of tree communities in RFs ranging from 0.12 to 0.74 was significantly higher than that in UFs ranging from 0.33 to 0.68 (Figure 4b). Moreover, the Shannon–Wiener index of tree communities in RFs ranging from 0.19 to 2.23 was significantly higher than that in UFs ranging from 0.40 to 1.29 (Figure 4c). Furthermore, the Pielou index of tree communities in RFs and UFs was positively correlated with MAP (slope: 0.003 and 0.002, respectively), ranging from 0.13 to 0.78 and 0.43 to 0.82, respectively (Figure 4d).

3.3. Similarities in Tree Species Composition between Urban Forests or Rural Forests along the Precipitation Gradient

The Jaccard similarity index of tree species composition in UFs summarized by cities ranged from 0.13 to 0.34, with Suzhou having the highest similarity and Lhasa having the lowest among the 19 cities (Figure 5a). However, the J of RFs summarized by region ranged from 0 to 0.22, with Region 3 having the highest similarity and Region 6 having the lowest among the six climate regions (Figure 5a). Along the precipitation gradient from east to west in China’s subtropical zone, the similarity in tree species composition between UFs (mean J = 0.27) was significantly higher than that between RFs outside the city with mean J = 0.15 (Figure 5b). Among 171 paired UFs, the J tree species composition varied between 0.03 and 0.52, with over 70% of these pairs having a J greater than 0.20 (Figure S2). The J of tree species composition between RFs in 15 paired climate regions ranged from 0 to 0.36, with over 67% of these regions having a J less than 0.20 (Figure S3).
Summarized by cities, the tree species richness of cities showed a declining trend with increasing J of the tree species composition of paired UFs (p < 0.05, Figure 5c). According to statistics, the J of tree species composition in UFs was consistently higher than that in RFs along the gradients of distance and difference in MAP (Figure 5d,e). The J of the tree species composition in both UFs and RFs significantly decreased as the distance gradient increased (slope = −0.092/103 km for UFs and −0.147/103 km for RFs) and as the difference in annual precipitation increased (slope = −0.002/cm for UFs and −0.003/cm for RFs) (Figure 5d,e).

3.4. Relationships between Tree Diversity of Urban Forests and Socioeconomic Factors

In the 19 cities, the Shannon–Wiener index of tree species in UFs showed a positive relationship with the built-up area of cities, with a slope of 0.3/1000 km2 (Figure 6j). Furthermore, as the GDP of the cities increased, the Shannon–Wiener index of tree species in UFs also significantly increased, with a slope of 0.01/100 billion yuan (Figure 6k). However, no significant correlation was observed between the richness index (Figure 6a–d), Simpson index (Figure 6e–h), or Pielou index (Figure 6m–p) of tree species in UFs and the socioeconomic factors of cities.
In the 19 case cities, no significant correlation was observed between the J of tree species composition in paired UFs and the differences in population size, built-up area, GDP, or per capita GDP between cities (Figure 7).

4. Discussion

4.1. The Tree Species Composition Homogenized along the Precipitation Gradient in Subtropical China

Urbanization has altered the spatial pattern of species diversity, resulting in greater similarity between tree species in green spaces than in rural vegetation, indicating biotic homogenization [7,19,25]. Along the precipitation gradient in subtropical China, the ratio of similarity of the tree species composition in UFs (J = 0.27) to RFs (J = 0.15) for paired cities was approximately 1.8 (Figure 5a). However, along the temperature gradient from tropical to middle temperate areas and the moisture gradient from humid to arid areas in the temperate zone of China, that ratio was 1.5 [14] and 4.3 [11], respectively. The difference in J was even lower than that in UFs along the moisture gradient from humid to arid areas in China’s temperate zone [11], which was 4.3-fold, because trees can establish and thrive in all the studied cities in subtropical China (Flora of China Editorial Committee, 2013). For other factors, the J in UFs along the temperature gradient from south to north areas in the humid zone of China was 1.5-fold, which was also higher than that in UFs in this study [14]. The difference in J was lower than that along the Yangtze River, and Qian et al. found that the J in UFs was 3.7-fold than in RFs [10]. Similar results have been observed in cities across Europe or across the United States, where species similarity in urban green spaces tends to be higher than that in natural habitats [6,25]. These findings highlight that the higher degree of biotic homogenization in UFs may appear at the region with wider differences in ecological conditions. In other words, the greater difference in climate between cities results in a higher degree of biotic homogenization.
The homogenization index of tree species in UFs along the precipitation gradient in subtropical China was H~0.12, which was half of that along the precipitation gradient (H~0.23) in temperate China [11]. This difference can be attributed to the fact that the precipitation in subtropical China is greater than 400 mm, which supports forests, and trees can be distributed in all areas of the zone. In contrast, in temperate China, the precipitation gradient ranges from 184 to 861, trees are limited to humid areas in rural areas, and the vegetation type is grasslands in semiarid areas and deserts in arid areas. This reveals that the homogenization of UFs is more pronounced in gradients with greater differences in the original city vegetation types.
This study revealed that the similarity between tree species in paired UFs decreased by J~0.09 per thousand km in China’s the subtropical zone (Figure 5e), similar to that in the temperature zone (J~0.08 per thousand km) [11]). However, along the Yangtze River, which is also in the subtropical region, there is a nonlinear decrease in similarity with distance [10]. The similarity between tree species in RFs decreased at a faster rate than in UFs with increasing distance (Figure 5e). The similarity of species composition tended to decline with increasing distance [15], as greater distances often correspond to greater climate differences [2]. This suggests that urban human activities and management have facilitated a stable environment for ecosystems, while UF still responds to the natural city environment. Additionally, it is important to take into account that the case cities exhibit a relatively high economic level, and there is no distinct economic gradient established, which may explain the lack of statistical significance.
The biodiversity within UFs is influenced by a range of socioeconomic factors, as indicated by several studies [6,26,27]. However, in our study, we did not find a significant relationship between the similarity of tree species in UFs and differences in socioeconomic factors (Figure 7). Previous studies reported that cities with higher economic levels tend to allocate greater budgets to enhancing UFs, leading to increased biodiversity [14,28], and have shown a correlation between the homogenization of tree species in UFs and socioeconomic differences between cities [29]. This finding does not suggest that socioeconomic factors have no influence on homogenization. Instead, several factors may contribute to this result. First, the cities in our study exhibited a MAP range of 458 mm to 1852 mm (with an average of 1221 mm; Table S1), which was significantly higher than the MAP of cities in the temperate zone (525 mm) [11]. The relatively abundant precipitation in our study area may reduce the impact of economic disparities on tree species diversity in UFs.

4.2. The Biotic Homogenization of Urban Forests in Humid Areas Due to Removal More than the Introduction

Human activities have facilitated species dispersal beyond natural barriers, leading to an increasing establishment of species outside their native range [15]. This study revealed that nonnative tree species accounted for a considerable proportion of UFs, ranging from 42% to 93%, with an average of 59% (Figure 2a, Table 1), and the number of nonnative tree species was significantly higher than that of native species in UFs (Figure 2b). The proportion of non-native tree species was negatively correlated with the annual precipitation (Pearson coefficient, r = −0.41). This confirmed the conclusion that the proportion of introduced species in UFs increases with drought [8]. In China’s temperate zone, approximately 24% of the 462 tree species recorded in UFs across the 19 cities were cultivars or introduced species [11]. The expansion of urbanized areas has resulted in the displacement of natural habitats, leading to notable alterations in species abundance and composition [5]. Despite the introduction of many tree species into urban environments, this study demonstrated that tree species richness in UFs was significantly lower than that in RFs, primarily due to the loss of native species (Table 1, Figure 4a). Consequently, while the introduction of tree species contributes to homogenization, the removal of native species remains the primary driving force behind homogenization in subtropical regions.
Considering the introduction of non-native species, the decline in native species may not mean a systematic loss of biodiversity [30]. In this study, the number of non-native species in 19 case cities ranged from 99 to 294, with an average of 174 (Table S3). However, even without significant changes in local species richness, strong temporal species turnover may occur [15,31]. This means that even if the richness of tree species in UFs remains unchanged in the future, the beta diversity of green spaces may continue to change. In addition, species richness may affect the similarity of species composition. In a study of urban spontaneous plants, species richness accounted for more than 71% of the variation in beta diversity [7]. In another study of the Palaearctic biogeographic realm, species richness and beta diversity for vascular plants showed a U-shaped trend and explained only 11% of the variation [32]. In this study, we identified an inverted negative correlation between the J summarized by cities and tree species richness of UFs, which explained 37% of the variation in similarity (Figure 5c). Therefore, evaluating the trends of J of tree species should not ignore the effect of species richness. The relationship between similarity and richness is inversely proportional, indicating that homogenization diminishes species diversity. Interestingly, the city with the highest tree species richness was not the city with the highest precipitation but the city with the most favorable precipitation (Figure 5c, Table S1). This finding supported the tolerance hypothesis [13], which suggests that benign climates are more conducive to higher diversity, while extreme climates act as abiotic filters that exclude species lacking tolerance to stress.
Based on human preferences, the introduction of coexisting species and the construction of similar habitats in cities have altered diversity patterns and driven biotic homogenization [6,7,8]. There were 102 tree species planted in over half of the studied cities, with 37 of these species planted in over 80% of these cities (Figure 3, Table 1). Currently, horticultural nurseries in China are continuously introducing species and varieties outside their original distribution range, such as Salix babylonica, Pinus tabuliformis, Platanus orientalis, Ulmus pumila, etc. These species are prevalent in nurseries in cities within China’s temperate zone [11]. The coexisting species contributed to the composition similarity among UFs. Moreover, 91 woody plant species were found in all 11 cities near the Yangtze River basin [10], and 45 tree species appeared to coexist in more than 20 cities along the temperature gradient of humid regions in eastern China [14]. The commonly used tree species in UFs have attractive shapes or ornamental leaves, flowers, and fruits. Notably, 71% of tree species were observed in no more than three UFs, and 42% of these species were found exclusively in a single city (Figure 3). Thus, the removal of native species and the introduction of nonnative species may cause the loss of a sense of locality.

4.3. The Tree Diversity of Urban Forests Tends to Converge along the Precipitation Gradient

The numbers of species and the diversity patterns of plant communities are governed by water availability [33]. The Simpson, Shannon–Wiener, and Pielou indices of tree species in both RFs and UFs significantly increased with precipitation (Figure 4). The range of variation for each diversity index along precipitation was smaller for UFs than for RFs (Table 1), which was consistent with previous studies conducted for temperature and moisture gradients in China [11,14]. The slopes of the Shannon–Wiener and Pielou diversity indices of trees in RFs along the precipitation gradient were 2-fold and 1.5-fold higher than those in UFs, respectively (Figure 4c,d). The Simpson and Shannon–Wiener indices of tree species in UFs were significantly lower than those in RFs (Figure 4b,c). These findings confirmed that the convergence of urban tree species diversity deviates from that of RFs along the precipitation gradient. The observed trends of the three diversity indices along the precipitation gradient did not demonstrate complete consistency (Figure 4c,d). This inconsistency arose primarily due to the unique properties of each index. Specifically, Simpson index quantifies species richness while considering the abundance weight of each species [34], Pielou index evaluates species evenness, and the Shannon–Wiener index provides a comprehensive assessment of both species evenness and richness [35]. Upon conducting a comparative analysis, it became evident that RFs exhibited a higher species richness than UFs along the precipitation gradient. However, UFs showcased a significant improvement in species evenness. This enhanced evenness contributes to the greater well-being of local residents by offering a wider array of ecosystem services.
The diversity of tree species in UFs is also influenced by socioeconomic factors [36]. In this study, the built-up area and GDP showed a positive impact on tree species diversity in UFs (Figure 6j,k). This finding corresponded to the ‘luxury effect’ previously discovered within cities [36,37]. Cities with a greater economy can afford to enhance their UFs. However, no single socioeconomic factor can explain the tree species richness in UFs (Figure 6a–d). When a city reaches a certain level of economic development, the construction of UFs may already meet human preferences for trees [12,26], and further economic growth may contribute less to UF diversity. Therefore, natural factors and human activities jointly shape the diversity patterns of UFs.

4.4. Implications of Biotic Homogenization in Urban Forests to Sustainable Cities

The human-dominated urban environment, which contains a greater variety of heterogeneous microhabitats in UFs [32], is increasingly being recognized as a valuable target for species conservation and biodiversity management [36]. The field investigation in this study confirmed that UFs contribute to the conservation of endangered plants by serving as microshelters (Table S4). The introduction of many non-native species led to the complementarity of local species in the ecological niche (Figure 2, Table 1). For instance, native and non-native plants can attract more pollinators due to differences in flowering periods, thereby supporting a diverse and functionally varied insect community [38]. Simultaneously, urban managers should designate specific areas within the city to protect local unique plant species, preventing them from being displaced by foreign species and preserving a distinct sense of locality. Despite the inevitable urban expansion that may adversely affect natural ecosystems and threaten global biodiversity [2], adopting a systematic approach to the planning and design of UFs can help safeguard regional biodiversity. This commitment to preserving regional biodiversity is vital for ensuring the sustainable provision of ecosystem services.
Numerous studies demonstrated that biodiversity drives the supply of ecosystem services [4]. In China’s subtropical region, cities with lower precipitation, such as Lhasa, non-native tree introductions led to higher species richness in UFs (n = 99) compared to RFs (n = 22; Figure 2). Additionally, most of the introduced trees were ornamental species (Table 1), further enhancing UF cultural services [1]. Access to green spaces with high biodiversity can have potential benefits for both physical and psychological health in humans [39]. Therefore, the biotic homogenization of tree species in UFs may promote cultural ecosystem service equality among cities with different climate conditions. However, the greening process may also contribute to green gentrification in certain situations, leading to new inequalities within cities [18]. Moreover, it is essential to regulate the level of urban homogenization to prevent diminishing people’s emotional attachment to the place and, consequently, reducing their inclination to participate in community activities [40]. Therefore, city planners should take great care in striking a balance between biodiversity conservation and addressing social equality concerns.

5. Conclusions

This study aimed to quantify the homogenization degree of tree species composition and diversity convergence within UFs along a precipitation gradient in a warm climate zone. The homogenization of tree species composition in UFs was relatively mild compared with the precipitation gradient in the temperate zone, and the effect of homogenization was more pronounced in gradients with greater differences in climate and vegetation types. The convergence of tree diversity along the moisture gradient was also less pronounced than that along the temperature gradient. While human preferences can influence the composition of artificial green spaces, there was no significant relationship between tree species similarities in UFs and socioeconomic factors. As a result, dwellers in different cities were found to have similar well-being regardless of the different climate and socioeconomic conditions. The negative correlation between tree species richness and the similarity of UFs between cities revealed that local tree species removal contributes the majority of homogenization among cities in humid areas. Additionally, the introduction of numerous nonnative species contributed to the complementarity of local species in ecological niches.

Supplementary Materials

The following supporting information can be downloaded at: https://www.mdpi.com/article/10.3390/land12081559/s1, Figure S1: Estimated value and relative standard deviation of tree species diversity of green space quadrats in Guangzhou; Figure S2: Jaccard similarity index between urban forests for pairs of cities; Figure S3: Jaccard similarity index between urban forests for pairs of natural regions; Table S1: Summary of socio-economic characteristics and climatic conditions of 19 case cities on the precipitation gradient from east to west in the subtropical zone of China; Table S2: The number of transects and quadrats established in each case city. Table S3: Comparison between the number of tree species in green spaces of each city counted in this study and that counted based on the information provided by the government departments responsible for urban greening; Table S4: Commonly used greening tree species in different types of green spaces in 19 case cities, Refs [41,42,43,44,45,46,47,48,49,50,51,52,53,54,55,56,57,58,59].

Author Contributions

Conceptualization, J.C. and Y.G.; methodology, J.C.; software, G.Y.; validation, Y.O. and Y.W.; formal analysis, G.Y.; investigation, T.Z., X.H. and Y.O.; writing—original draft preparation, G.Y. and Y.O.; writing—review and editing, G.Y. and Y.L.; visualization, G.Y.; supervision, J.C. and Y.G.; funding acquisition, J.C. and Y.L. All authors have read and agreed to the published version of the manuscript.

Funding

This research was funded by the National Natural Science Foundation of China, grant number 31870307; Humanities and Social Sciences Research Project of the Ministry of Education, grant number 21YJA760040.

Data Availability Statement

The data presented in this study are available in the Supplementary Materials.

Acknowledgments

We are grateful to Yi Chen, Shuonan He, and Zhaoping Wu for helping the investigation of urban forests.

Conflicts of Interest

The authors declare no conflict of interest.

References

  1. Chang, J.; Qu, Z.; Xu, R.; Pan, K.; Xu, B.; Min, Y.; Ren, Y.; Yang, G.; Ge, Y. Assessing the ecosystem services provided by urban green spaces along urban center-edge gradients. Sci. Rep. 2017, 7, 11226. [Google Scholar] [CrossRef] [Green Version]
  2. Portner, H.-O.; Scholes, R.J.; Arneth, A.; Barnes, D.K.A.; Burrows, M.T.; Diamond, S.E.; Duarte, C.M.; Kiessling, W.; Leadley, P.; Managi, S.; et al. Overcoming the coupled climate and biodiversity crises and their societal impacts. Science 2023, 380, eabl4881. [Google Scholar] [CrossRef]
  3. Endreny, T.A. Strategically growing the urban forest will improve our world. Nat. Commun. 2018, 9, 1160. [Google Scholar] [CrossRef] [Green Version]
  4. Le Provost, G.; Schenk, N.V.; Penone, C.; Thiele, J.; Westphal, C.; Allan, E.; Ayasse, M.; Blüthgen, N.; Boeddinghaus, R.S.; Boesing, A.L.; et al. The supply of multiple ecosystem services requires biodiversity across spatial scales. Nat. Ecol. Evol. 2023, 7, 236–249. [Google Scholar] [CrossRef]
  5. Simkin, R.D.; Seto, K.C.; McDonald, R.I.; Jetz, W. Biodiversity impacts and conservation implications of urban land expansion projected to 2050. Proc. Natl. Acad. Sci. USA 2022, 119, e2117297119. [Google Scholar] [CrossRef]
  6. Delgado-Baquerizo, M.; Eldridge, D.J.; Liu, Y.-R.; Sokoya, B.; Wang, J.-T.; Hu, H.-W.; He, J.-Z.; Bastida, F.; Moreno, J.L.; Bamigboye, A.R.; et al. Global homogenization of the structure and function in the soil microbiome of urban greenspaces. Sci. Adv. 2021, 7, eabg5809. [Google Scholar] [CrossRef]
  7. Gao, Z.; Pan, Y.; Van Bodegom, P.M.; Cieraad, E.; Xing, D.; Yang, Y.; Xia, T.; Luo, X.; Song, K.; Da, L.; et al. Beta diversity of urban spontaneous plants and its drivers in 9 major cities of Yunnan province, China. Landsc. Urban Plan. 2023, 234, 104741. [Google Scholar] [CrossRef]
  8. Wang, X.; Svenning, J.-C.; Liu, J.; Zhao, Z.; Zhang, Z.; Feng, G.; Si, X.; Zhang, J. Regional effects of plant diversity and biotic homogenization in urban greenspace—The case of university campuses across China. Urban For. Urban Green. 2021, 62, 127170. [Google Scholar] [CrossRef]
  9. McKinney, M.L. Urbanization as a major cause of biotic homogenization. Biol. Conserv. 2006, 127, 247–260. [Google Scholar] [CrossRef]
  10. Qian, S.; Qi, M.; Huang, L.; Zhao, L.; Lin, D.; Yang, Y. Biotic homogenization of China’s urban greening: A meta-analysis on woody species. Urban For. Urban Green. 2016, 18, 25–33. [Google Scholar] [CrossRef]
  11. Ouyang, Y.; Chen, Y.; Yang, G.; Ren, Y.; Yu, M.; Chang, J.; Ge, Y. Homogenization of trees in urban green spaces along the moisture gradient in China. Urban For. Urban Green. 2023, 83, 127892. [Google Scholar] [CrossRef]
  12. Groffman, P.M.; Avolio, M.; Cavender-Bares, J.; Bettez, N.D.; Grove, J.M.; Hall, S.J.; Hobbie, S.E.; Larson, K.L.; Lerman, S.B.; Locke, D.H.; et al. Ecological homogenization of residential macrosystems. Nat. Ecol. Evol. 2017, 1, 0191. [Google Scholar] [CrossRef] [Green Version]
  13. Harrison, S.; Spasojevic, M.J.; Li, D. Climate and plant community diversity in space and time. Proc. Natl. Acad. Sci. USA 2020, 117, 4464–4470. [Google Scholar] [CrossRef]
  14. Chen, Y.; Ge, Y.; Wu, Z.; Ouyang, Y.; Yang, G.; Du, Y.; Pan, K.; Chang, J. Homogenization of tree species diversity in urban green spaces along a temperature gradient in eastern China. Urban For. Urban Green. 2021, 66, 127388. [Google Scholar] [CrossRef]
  15. Capinha, C.; Essl, F.; Seebens, H.; Moser, D.; Pereira, H.M. The dispersal of alien species redefines biogeography in the Anthropocene. Science 2015, 348, 1248–1251. [Google Scholar] [CrossRef]
  16. Ossola, A.; Hopton, M.E. Climate differentiates forest structure across a residential macrosystem. Sci. Total Environ. 2018, 639, 1164–1174. [Google Scholar] [CrossRef]
  17. Qian, H.; Ricklefs, R.E. A latitudinal gradient in large-scale beta diversity for vascular plants in North America. Ecol. Lett. 2007, 10, 737–744. [Google Scholar] [CrossRef]
  18. Anguelovski, I.; Connolly, J.J.T.; Cole, H.; Garcia-Lamarca, M.; Triguero-Mas, M.; Baró, F.; Martin, N.; Conesa, D.; Shokry, G.; Del Pulgar, C.P.; et al. Green gentrification in European and North American cities. Nat. Commun. 2022, 13, 3816. [Google Scholar] [CrossRef]
  19. Wheeler, M.M.; Neill, C.; Groffman, P.M.; Avolio, M.; Bettez, N.; Cavender-Bares, J.; Roy Chowdhury, R.; Darling, L.; Grove, J.M.; Hall, S.J.; et al. Continental-scale homogenization of residential lawn plant communities. Landsc. Urban Plan. 2017, 165, 54–63. [Google Scholar] [CrossRef]
  20. Hutyra, L.R.; Yoon, B.; Alberti, M. Terrestrial carbon stocks across a gradient of urbanization: A study of the Seattle, WA region. Glob. Chang. Biol. 2011, 17, 783–797. [Google Scholar] [CrossRef]
  21. Yang, G.; Xu, R.; Chen, Y.; Wu, Z.; Du, Y.; Liu, S.; Qu, Z.; Guo, K.; Peng, C.; Chang, J.; et al. Identifying the greenhouses by Google Earth Engine to promote the reuse of fragmented land in urban fringe. Sustain. Cities Soc. 2021, 67, 102743. [Google Scholar] [CrossRef]
  22. Nowak, D.J.; Walton, J.T.; Stevens, J.C.; Crane, D.E.; Hoehn, R.E. Effect of Plot and Sample Size on Timing and Precision of Urban Forest Assessments. Arboric. Urban For. 2008, 34, 386–390. [Google Scholar] [CrossRef]
  23. Lososová, Z.; Chytrý, M.; Tichý, L.; Danihelka, J.; Fajmon, K.; Hájek, O.; Kintrová, K.; Láníková, D.; Otýpková, Z.; Řehořek, V. Biotic homogenization of Central European urban floras depends on residence time of alien species and habitat types. Biol. Conserv. 2012, 145, 179–184. [Google Scholar] [CrossRef]
  24. R Core Team. R: A Language and Environment for Statistical Computing; R Foundation for Statistical Computing: Vienna, Austria, 2023; Available online: https://www.R-project.org (accessed on 29 April 2023).
  25. Groffman, P.M.; Cavender-Bares, J.; Bettez, N.D.; Grove, J.M.; Hall, S.J.; Heffernan, J.B.; Hobbie, S.E.; Larson, K.L.; Morse, J.L.; Neill, C.; et al. Ecological homogenization of urban USA. Front. Ecol. Environ. 2014, 12, 74–81. [Google Scholar] [CrossRef] [Green Version]
  26. Qian, S.; Qin, D.; Wu, X.; Hu, S.; Hu, L.; Lin, D.; Zhao, L.; Shang, K.; Song, K.; Yang, Y. Urban growth and topographical factors shape patterns of spontaneous plant community diversity in a mountainous city in southwest China. Urban For. Urban Green. 2020, 55, 126814. [Google Scholar] [CrossRef]
  27. Seto, K.C.; Güneralp, B.; Hutyra, L.R. Global forecasts of urban expansion to 2030 and direct impacts on biodiversity and carbon pools. Proc. Natl. Acad. Sci. USA 2012, 109, 16083–16088. [Google Scholar] [CrossRef]
  28. Hope, D.; Gries, C.; Zhu, W.; Fagan, W.F.; Redman, C.L.; Grimm, N.B.; Nelson, A.L.; Martin, C.; Kinzig, A. Socioeconomics drive urban plant diversity. Proc. Natl. Acad. Sci. USA 2003, 100, 8788–8792. [Google Scholar] [CrossRef]
  29. Stuhlmacher, M.; Georgescu, M.; Turner, B.L.; Hu, Y.N.; Goldblatt, R.; Gupta, S.; Frazier, A.E.; Kim, Y.; Balling, R.C.; Clinton, N. Are global cities homogenizing? An assessment of urban form and heat island implications. Cities 2022, 126, 103705. [Google Scholar] [CrossRef]
  30. Dornelas, M.; Gotelli, N.J.; McGill, B.; Shimadzu, H.; Moyes, F.; Sievers, C.; Magurran, A.E. Assemblage Time Series Reveal Biodiversity Change but Not Systematic Loss. Science 2014, 344, 296–299. [Google Scholar] [CrossRef] [Green Version]
  31. Dehling, D.M.; Dehling, J.M. Elevated alpha diversity in disturbed sites obscures regional decline and homogenization of amphibian taxonomic, functional and phylogenetic diversity. Sci. Rep. 2023, 13, 1710. [Google Scholar] [CrossRef]
  32. Dembicz, I.; Dengler, J.; Steinbauer, M.J.; Matthews, T.J.; Bartha, S.; Burrascano, S.; Chiarucci, A.; Filibeck, G.; Gillet, F.; Janišová, M.; et al. Fine-grain beta diversity of Palaearctic grassland vegetation. J. Veg. Sci. 2021, 32, e13045. [Google Scholar] [CrossRef]
  33. Fan, K.; Chu, H.; Eldridge, D.J.; Gaitan, J.J.; Liu, Y.-R.; Sokoya, B.; Wang, J.-T.; Hu, H.-W.; He, J.-Z.; Sun, W.; et al. Soil biodiversity supports the delivery of multiple ecosystem functions in urban greenspaces. Nat. Ecol. Evol. 2023, 7, 113–126. [Google Scholar] [CrossRef]
  34. Hosokawa, S.; Momota, K.; Chariton, A.A.; Naito, R.; Nakamura, Y. The use of diversity indices for local assessment of marine sediment quality. Sci. Rep. 2021, 11, 14991. [Google Scholar] [CrossRef] [PubMed]
  35. Strong, W.L. Biased richness and evenness relationships within Shannon–Wiener index values. Ecol. Indic. 2016, 67, 703–713. [Google Scholar] [CrossRef]
  36. Lambert, M.R.; Donihue, C.M. Urban biodiversity management using evolutionary tools. Nat. Ecol. Evol. 2020, 4, 903–910. [Google Scholar] [CrossRef] [PubMed]
  37. Leong, M.; Dunn, R.R.; Trautwein, M.D. Biodiversity and socioeconomics in the city: A review of the luxury effect. Biol. Lett. 2018, 14, 20180082. [Google Scholar] [CrossRef] [PubMed] [Green Version]
  38. Zaninotto, V.; Thebault, E.; Dajoz, I. Native and exotic plants play different roles in urban pollination networks across seasons. Oecologia 2023, 201, 525–536. [Google Scholar] [CrossRef]
  39. Remme, R.P.; Frumkin, H.; Guerry, A.D.; King, A.C.; Mandle, L.; Sarabu, C.; Bratman, G.N.; Giles-Corti, B.; Hamel, P.; Han, B.; et al. An ecosystem service perspective on urban nature, physical activity, and health. Proc. Natl. Acad. Sci. USA 2021, 118, e2018472118. [Google Scholar] [CrossRef]
  40. Grêt-Regamey, A.; Galleguillos-Torres, M. Global urban homogenization and the loss of emotions. Sci. Rep. 2022, 12, 22515. [Google Scholar] [CrossRef]
  41. Bureau of Forestry and Landscape of Changchun, Landscape Plants in Changchun. 2016. Available online: http://ccylj.changchun.gov.cn/ylkp/ylkpej/201612/t20161222_793304.html (accessed on 13 September 2021). (In Chinese)
  42. Chen, D.; Fan, R.; Bai, S.L.; Ci, Z.L. Application Situation and Analysis of Garden Afforestation in the City of Huhhot. Tianjin Agric. Sci. 2009, 15, 61–64, (In Chinese, with English Summary). [Google Scholar]
  43. Fan, Q. A Comparative Study on the Change of Landscape Pattern and Biodiversity in Moderate-temperate Steppe Cities and Warm-temperate Steppe Cities in Inner Mongolia. Master’s Thesis, Inner Mongolia University, Hohhot, China, 2017. (In Chinese with English Summary). [Google Scholar]
  44. Guo, L.; Zhou, Z.L.; He, Y. Changes of landscape plants in Beijing in the past 60 years. In Beijing landscape architecture society, Beijing Bureau of Landscape Architecture; Beijing Park Management Center, Ed.; Beijing Ecological Garden City Construction; China Forestry Publishing House: Beijing, China, 2010; pp. 201–208. (In Chinese) [Google Scholar]
  45. Guo, Y. Design and Application of Landscape Plants; Heilongjiang Fine Art Press: Harbin, China, 2011. (In Chinese) [Google Scholar]
  46. Li, J. Study on Necessity and Feasibility of Urban Forestry Construction in Xi’an. Master’s Thesis, Northwest A&F University, Xianyang, China, 2009. (In Chinese, with English Summary). [Google Scholar]
  47. Li, N. The Present Evolution of Plant Diversity in Urumqi. Master’s Thesis, Xinjiang Agricultural University, Urumqi, China, 2009. (In Chinese, with English Summary). [Google Scholar]
  48. Li, P.B. Investigation, Evaluation and Planning of Landscape Woody Plants of Taian City. Master’s Thesis, Shandong Agricultural University, Taian, China, 2002. (In Chinese, with English Summary). [Google Scholar]
  49. Qingdao Bureau of Landscape Architecture and Forestry, Two Books, “The Monographs of Trees in Qingdao” and “Atlas of Qingdao Main Greening Trees”, Were Published. 2016. Available online: http://ly.qingdao.gov.cn/n32205788/n32205856/160122091229024186.html (accessed on 10 September 2021). (In Chinese)
  50. Shijiazhuang Bureau of Landscape Architecture, Procurement of Landscape Plants. 2020. Available online: http://ylj.sjz.gov.cn/col/1526374018015/index.html (accessed on 10 September 2021). (In Chinese)
  51. Tao, L. Investigation and construction of greening in Taiyuan. Inn. Mong. For. Sci. Technol. 2010, 36, 86–88, (In Chinese, with English Summary). [Google Scholar]
  52. Tianjin Municipal Commission of Urban Management, List of Trees and Other Plants Suitable for Planting in Tianjin. 2014. Available online: http://csgl.tj.gov.cn/zwgk_57/xzcwj/scsglw/CGWWJ/202011/t20201111_4052654.html (accessed on 13 September 2021). (In Chinese)
  53. Wang, H.J. Study on Community Structure, Ecological Benefits and Optimized Models of Waterfront Green Space in Jilin City. Ph.D. Thesis, Northeast Forestry University, Harbin, China, 2014. (In Chinese, with English Summary). [Google Scholar]
  54. Wei, Z.H. Study on the Geographical Composition of the Flora of Woody Garden Plants in Anyang City. Master’s Thesis, Henan Agricultural University, Zhengzhou, China, 2006. (In Chinese, with English Summary). [Google Scholar]
  55. Wu, Z.Y. China Vegetation; Science Press: Beijing, China, 1980. (In Chinese) [Google Scholar]
  56. Xin, Q.R. Atlas of Woody Plants in Xilingol League, Inner Mongolia Autonomous Region; China Machine Press: Beijing, China, 2016. (In Chinese) [Google Scholar]
  57. Yu, J.Q.; Su, X.C.; L, L. Planning of greening tree species in Jinan City. Sci. Technol. Landsc. Archit. 2007, 1, 32–37. (In Chinese) [Google Scholar]
  58. Zhang, N.N. Zhengzhou City Park Green Plant Diversity and Landscape Research. Master’s Thesis, Northwest A&F University, Xianyang, China, 2013. (In Chinese, with English Summary). [Google Scholar]
  59. Zhang, Y.; Zhao, F.; Wu, Y.H.; Huang, R. Selection and quantitative evaluation of main suitable ornamental tree species for gardens in Lanzhou City. J. Northwest For. Univ. 2019, 34, 255–267, (In Chinese, with English Summary). [Google Scholar]
Figure 1. The 19 case cities on the precipitation gradient in the subtropical zone of mainland China. A yellow dot represents a case city; the red border area represents the climate regions (for details, see Table S1). Cities in the same climate region share the same rural forest data. White areas were not considered in this study.
Land 12 01559 g001
Figure 2. Trees in urban forests of 19 case cities. (a) Species richness. (b) Difference in native and nonnative tree species numbers. The cities were sorted from high to low by mean annual precipitation.
Land 12 01559 g002
Figure 3. Frequency of tree species used in urban forests of 19 case cities. Bar is the count of tree species, line is the cumulative frequency, dashed line denotes the half case cities.
Land 12 01559 g003
Figure 4. Response of the tree diversity index of urban and rural forests to the annual precipitation in 19 cases. Species richness (a), Simpson index (b), Shannon–Wiener index (c), and Pielou index (d) with mean annual precipitation. A point indicates the mean value of quadrats, with a standard error bar. The green point shows rural forests, and the purple point shows urban forests. The green line indicates regression in rural forests, and the purple line indicates regression in urban forests. The shaded area indicates the 95% confidence interval band. All regressions are significant (p < 0.05).
Land 12 01559 g004
Figure 5. Similarity of tree composition in urban and rural forests. (a) Jaccard index summarized by cities and in rural forests summarized by regions; bars are sorted descending by MAP from high to low. (b) The violin is the frequency distribution of the Jaccard index, and the center of the box and whisker plot shows the median value and the range. (c) Summarized by cities, the Jaccard index and tree species richness of urban forests. Size and color from light to dark denote the precipitation of cities, and the orange line shows the polynomial curve of urban forests. (d) Jaccard index of tree composition of paired urban forests between 19 cities and rural forests along with the precipitation difference. (e) Jaccard index of tree composition paired urban forests and rural forests along with the distance between cities.
Land 12 01559 g005
Figure 6. Relationships between the tree diversity index and socioeconomic factors in 19 cities. (ad) Tree species richness; (eh) Simpson index; (il) Shannon–Wiener index; (mp) Pielou index. Each point represents the average and standard error of the quadrats in urban forests. The solid line represents the tree diversity index that significantly responded to that factor (p < 0.05).
Land 12 01559 g006
Figure 7. Relationships of the J of tree composition in urban forests and the difference in socioeconomic factors between paired cities. (a) J and population difference; (b) J and difference in built-up area; (c) J and GDP difference; (d) J and per capita GDP difference.
Land 12 01559 g007
Table 1. Tree diversity indices of urban and rural forests of 19 case cities.
Species RichnessSimpson IndexShannon–Wiener IndexPielou Index
UFsRFsUFsRFsUFsRFsUFsRFs
MIN99220.330.120.400.190.430.13
MAX3256750.680.741.292.230.820.78
MEAN1824840.530.670.841.840.660.68
SD57.33129.250.100.140.180.420.110.14
CV (%)26.7031.4318.8720.2321.6723.1216.6020.75
UFs—urban forests; RFs—rural forests; SD—standard deviation; CV—coefficient of variation.
Disclaimer/Publisher’s Note: The statements, opinions and data contained in all publications are solely those of the individual author(s) and contributor(s) and not of MDPI and/or the editor(s). MDPI and/or the editor(s) disclaim responsibility for any injury to people or property resulting from any ideas, methods, instructions or products referred to in the content.

