Article

Spatial Distributions of Yield Gaps and Production Increase Potentials of Spring Wheat and Highland Barley in the Qinghai-Tibet Plateau

1
State Key Laboratory of Environmental Criteria and Risk Assessment, Chinese Research Academy of Environmental Sciences, Beijing 100012, China
2
State Key Laboratory of Environmental Protection for Regional Eco-Process and Function Assessment, Chinese Research Academy of Environmental Sciences, Beijing 100012, China
3
Institute of Ecology, Chinese Research Academy of Environmental Sciences, Beijing 100012, China
4
Institute of Geographical Sciences and Natural Resources Research (CAS), Beijing 100101, China
5
College of Resources and Environment, University of Chinese Academy of Sciences, Beijing 100049, China
*
Author to whom correspondence should be addressed.
Land 2023, 12(8), 1555; https://doi.org/10.3390/land12081555
Submission received: 13 July 2023 / Revised: 2 August 2023 / Accepted: 3 August 2023 / Published: 5 August 2023

Abstract

:
Low grain yield caused by high altitude; cold climate; small, cultivated land area, and poor soil fertility is the critical factor posing a potential risk to local food security in the Qinghai-Tibet Plateau (QTP). Analyzing spatial distribution of the increase potential of grain production in the QTP could be contributable to developing a regional increase in the space of grains to ensure food security. Taking spring wheat and highland barley as objectives, this study simulated the annual potential yields of spring wheat and highland barley at the site level. They estimated their yield gaps and production increase potentials at the regional and county level and mapped their spatial distribution in 2020, based on the methodologies of the literature data collection, using the WOFOST model and GIS analysis. The yield gaps of spring wheat and highland barley were 3.7 and 2.4 t ha−1 for the whole QTP, accounting for 51.4% and 39.5% of their potential yields, respectively. At the county level, the yield gap ranges of spring wheat and highland barley were 1.5–7.0 t ha−1 and 0.3–5.9 t ha−1 across the QTP, respectively. When the yield gap was fully developed, spring wheat and highland barley productions had the potentials of 497.4 and 717.4 Kt for the whole QTP, equal to 118.2% and 75.2% of their current total production, respectively. Spatially, the counties with a large increase potential of spring wheat were mainly distributed in Haidong, Hainan, Xining, Shannan, Nyingchi, and Lhasa, while those with low potential were located in Xigaze and Shannan. Regarding highland barley, Lhasa, Shannan, Xigaze, Yushu, and Hainan had a larger potential to increase. To increase grain production in the QTP, the priority should be given to the shrinkage of the yield gap in the counties with larger potentials to increase, such as Hainan, Shannan, Lhasa, etc., through improving the irrigation rate and fertilizer usage in the farmland.

1. Introduction

In the Qinghai-Tibet Plateau (QTP), the arable land suitable for cultivation is scarce due to the characteristics of high terrain and cold climate. Spatially, arable lands are mainly distributed in the valley area below 4600 m, while in extensive pastoral areas, crop planting is limited due its low effective accumulated temperature [1]. Food security has been a major concern for governments, and the authorities have been working to transport grain foods from inland provinces to pastoral regions to supply food for local residents. However, long-distance transportation caused a great burden on finance and transportation due to the remote location of the QTP [2,3]. In recent years, grain consumption increased obviously with the rapid adjustment of the diet structure and continuous increase of population, especially the tourist population [4]. From 1985 to 2015, for instance, the population in the QTP increased from 6.02 million to 9.02 million, and the demand for grain increased from 2.16 to 3.22 Mt, with an increased amplitude of 49.6%. During this period, although grain production in the QTP increased from 1.54 to 2.08 Mt, the increased amplitude was only 35.0%, far less than that of grain demand. The difference between the growths of grain production and demand leads to a decline in regional food self-sufficiency rate, and an obvious grain gap occurred in some regions. In 2015, the grain gap for the entire QTP approached 1.15 Mt, posing potential risks to local food security and social stability [4,5].
Spring wheat and highland barley are major grain crops in the QTP, and their sown area in 2015 accounted for 45% and 30% of the total crop sown area, respectively [6,7]. Therefore, it is of guiding significance to accurately assess the increase potential of their total production in different regions of the QTP for improving grain yields and ensuring regional food security. The crop yield gap, as the difference between actual yield and potential yield, is the key to identifying crop yield potential for increase and has attracted wide attention throughout the world [8,9,10,11]. The yield gap originated from the study on limiting factors of rice productivity in 1974 [12], and it was defined as the difference between the actual yield harvested in the field and that at the experimental station. With the deepening of related research, the crop yield gap has been divided into three levels according to the influencing factors, including natural factors, management measures, and policy factors [13,14,15,16]. Previous studies on the yield gap mainly focused on the national, regional, and household levels, and the objective crops were generally rice, wheat, maize, and soybean [17,18]. In China, the study sites were concentrated in major grain-producing areas such as Northeast China and North China [19,20,21]. However, there are only a few studies on the yield gaps of highland barley or spring wheat in the QTP so far, and most of them were conducted at the site level. For instance, Gong et al. simulated the potential yield of highland barley using the DSSAT-CERES-barley model and analyzed its yield gap at seven stations [22].
Generally, the methods for assessing crop potential yield mainly include a statistical model, photosynthetic efficiency model, and mechanistic model [12,23]. The mechanistic model has higher accuracy due that it integrates physiological processes such as photosynthesis, respiration transpiration, and dry matter distribution, in addition to considering the effects of climate and soil properties [11,24]. The WOFOST is a classical mechanism model and can simulate daily crop physiological processes. So far, WOFOST has been used to quantitatively assess crop potential yield in many regions throughout the world [25,26,27]. However, the application of the WOFOST model to the potential yield simulations of spring wheat and highland barley in the QTP has not been found. In addition, as a means of spatio–temporal analysis, GIS is contributable to grasping the spatial pattern of regional crop yield or environmental factors, but few studies use GIS to analyze crop production potential in the QTP, so there is a lack of effective guidance for crop production layout in the plateau.
Therefore, this paper firstly simulated the annual potential yields of spring wheat and highland barley at the site level from 1958 to 2017. Then, their yield gaps and production increase potentials for the whole plateau and the available counties were assessed, based on their actual yields and sown area at the county level. Further, their spatial distributions were mapped under different scenarios of potential yield development using ArcMap 10.7 software, which could help to understand and develop grain increase potentials in different regions to ensure regional food security.

2. Materials and Methods
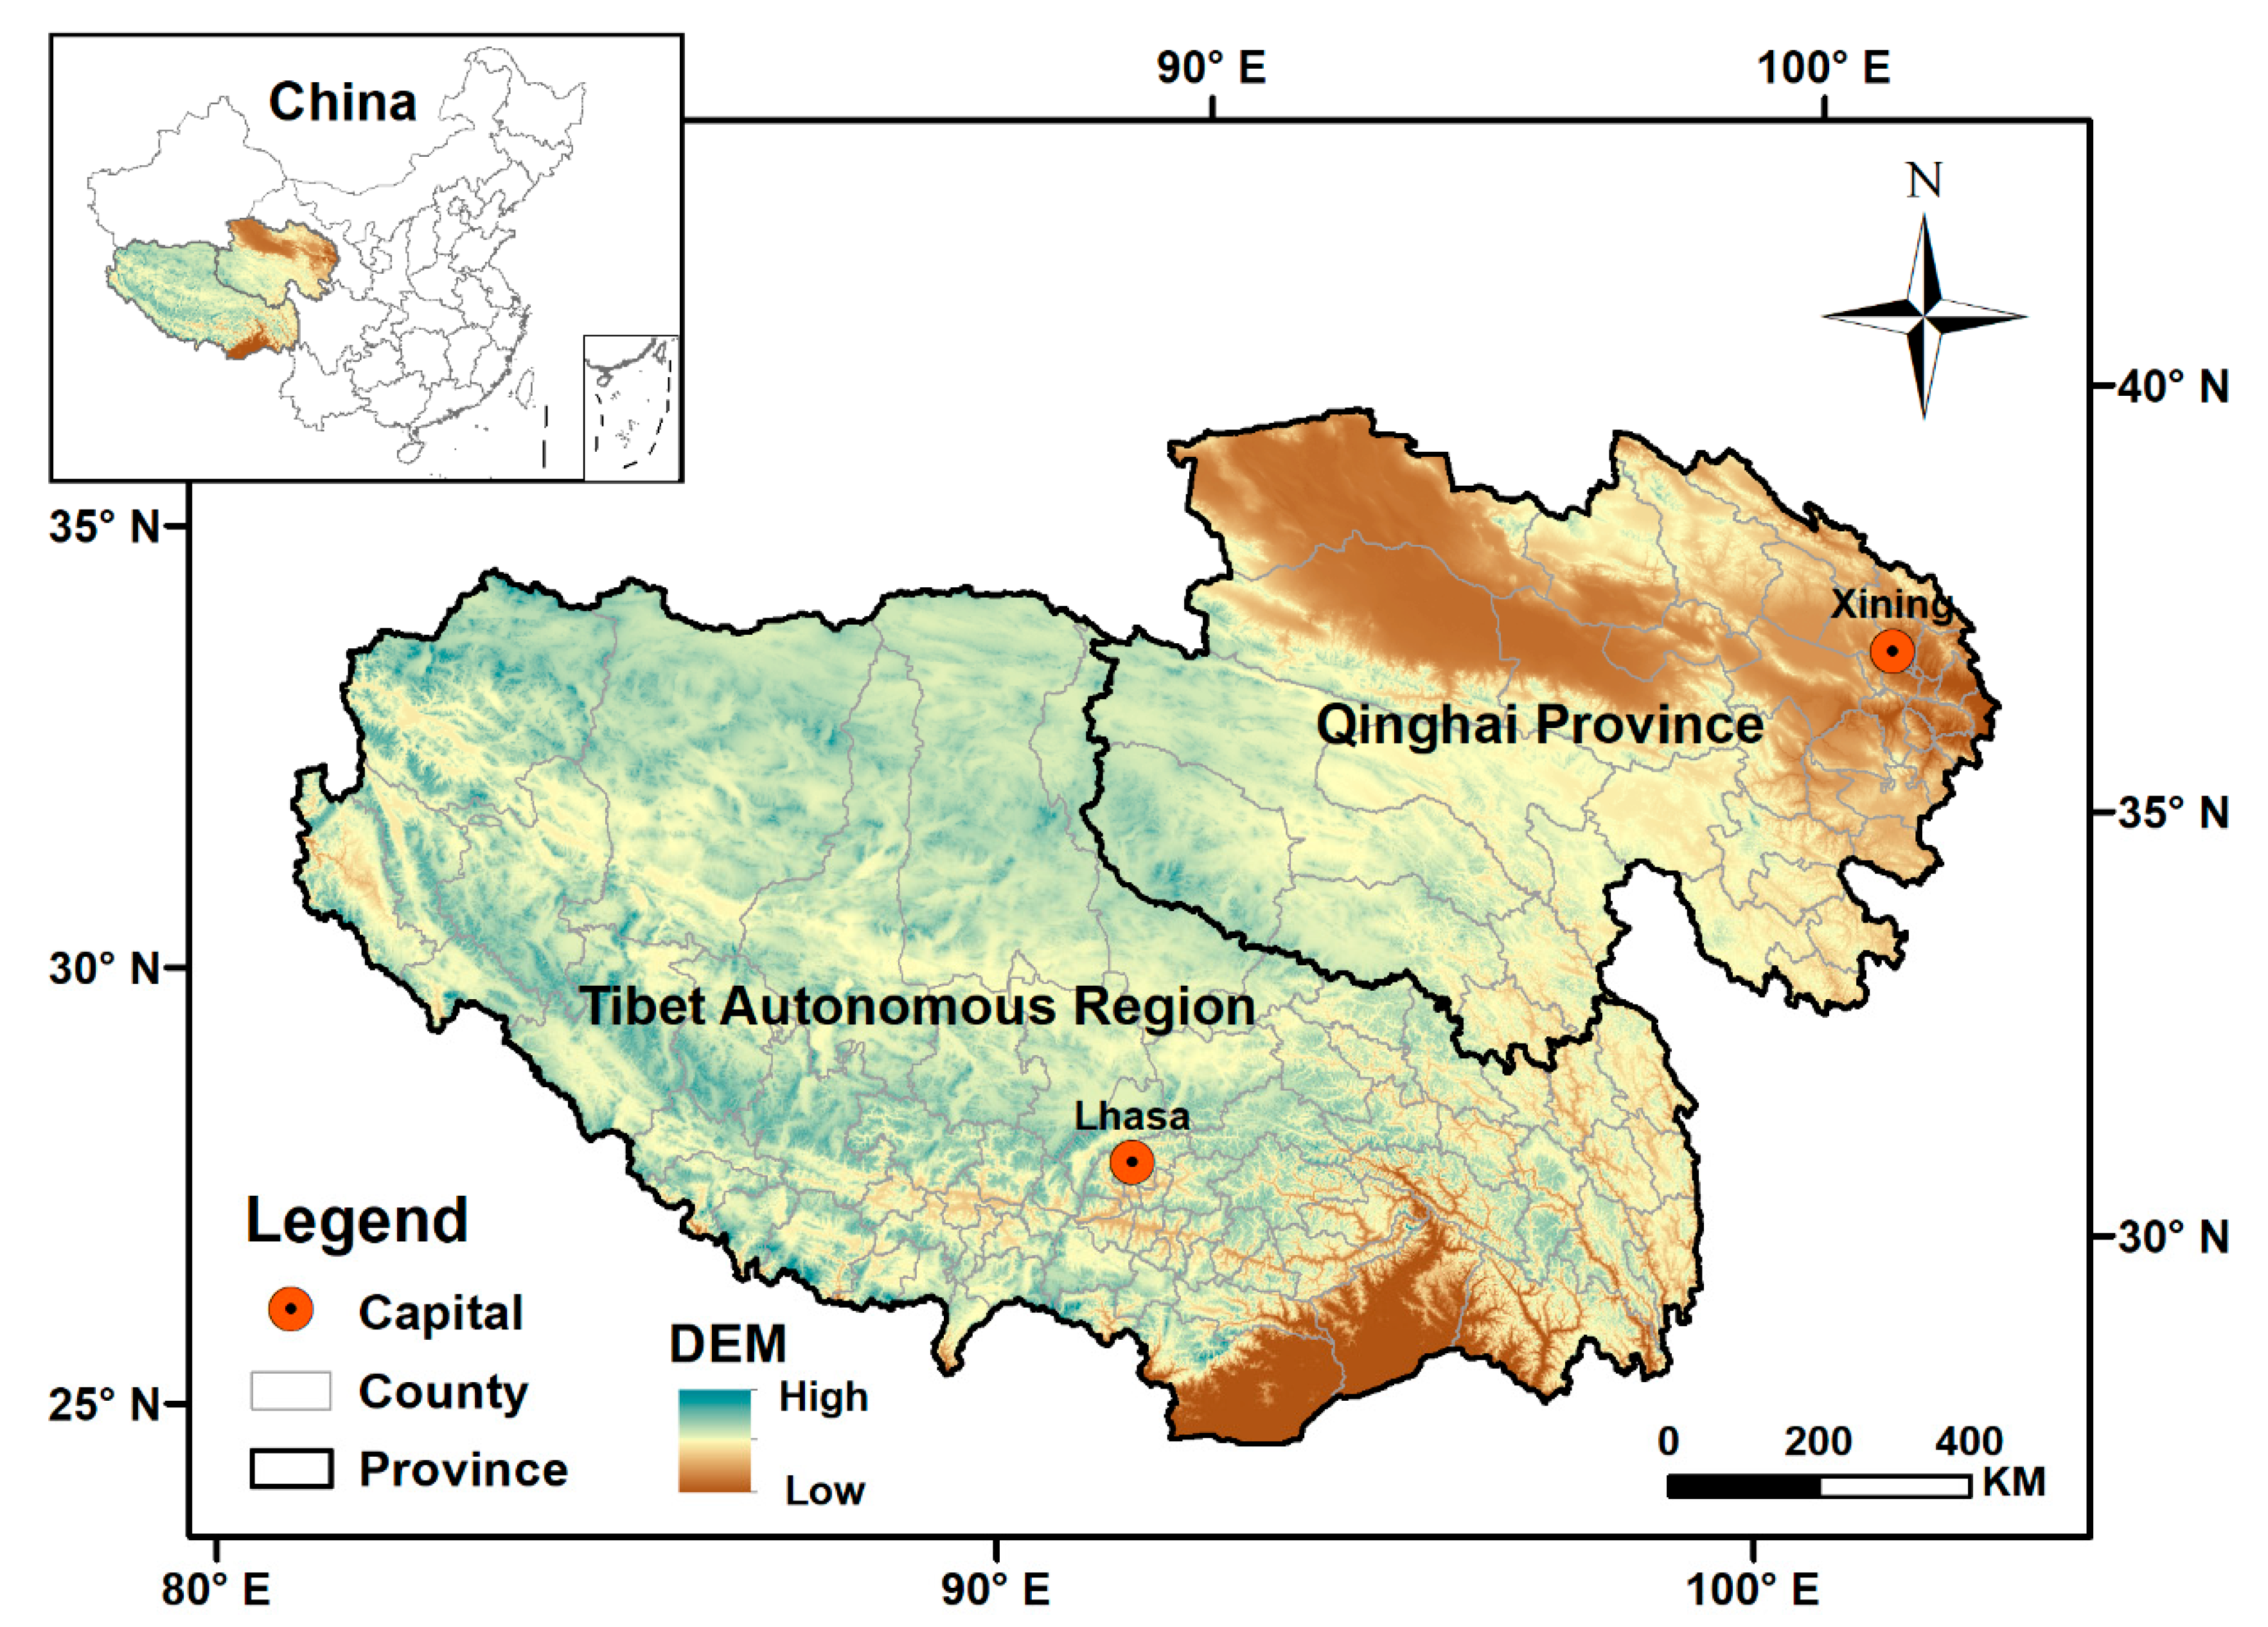
2.1. Study Area

The QTP is located in Southwestern China (26°00′–39°47′ N, 73°19′–104°47′ E). It is known as the “roof of the world”, and its highest altitude can reach over 8800 m, averaging from 2600 to 4500 m [28,29]. In this study, the QTP mainly covers Qinghai Province and the Tibet Autonomous Region, comprising 118 counties or cities, with a total land area of 1.95 million km2 and accounting for 20.3% of China’s total land area (Figure 1). The plateau is characterized by a cold climate and very little land could be arable. The cultivated area of the two provinces is 1.01 million hectares, accounting for only 0.52% of the total land area, according to the China Statistical Yearbook 2022. Spatially, the cultivated area is mainly distributed in the southern part of Tibet and the eastern part of Qinghai with an altitude of less than 4600 m [30]. The annual average temperature during 1978–2017 was between −2.4 °C and 15.8 °C, the rainfall was between 16.9 mm and 1170.5 mm, and the total solar radiation was between 4212.0 and 7953.7 MJ/m2. The main agricultural crops are highland barley, spring wheat, rapeseed, potato, and pea. They are usually grown from early April to late September. The total population of the QTP is 9.58 million according to the seventh national census of China, which accounts for 0.68% of the total population of China.

2.2. Data Sources and Preprocessing

Climatic data covering daily average, maximum, and minimum temperatures, average wind speed, sunshine hours, precipitation, and relative humidity during 1958–2017 were obtained from the data center of resources and environment science of the Chinese Academy of Sciences (http://www.resdc.cn/Default.aspx (accessed on 20 June 2019)). More detailed data processing information can be found in references [7,30].
The actual yield and the sown area of crops were mainly obtained from the published data of the statistical yearbook. On the basis of the availability of the production data, the planting situation of spring wheat and highland barley in 61 counties of Tibet and 25 counties of Qinghai Province was obtained. The crop production data at the county level in Tibet and Qinghai were obtained from the Statistical Yearbook 2020 of the Tibet Autonomous Region and Statistical Yearbook 2018 of the Qinghai Province.
Furthermore, we found that the yields of spring wheat and highland barley recorded in the Tibetan statistical yearbook were obviously higher than in our field surveys and even exceeded 10 t ha−1 in some counties. In our field surveys in the southern and eastern parts of Tibet in 2018, 2020, and 2021, the actual yield of highland barley was generally between 2.0–3.75 t ha−1 at the farmland level (Table 1), and the average yields of spring wheat in Xigaze and Shannan, which have better resource conditions, were around 6 t ha−1. The reason for this could be that the small plots of arable land were not counted into the statistical data. For instance, Wei and Lu interpreted the cultivated land area in the QTP based on the field surveys and the sub-meter scale satellite images of Google Earth in 2018. It was found that the statistical arable area was much smaller than the actual area through comparisons of the interpreted and statistical arable area of the counties [31]. In some counties, the gap even approached 80%. So, the statistical area of spring wheat and highland barley was corrected by the interpreted area using Equation (1). Taking highland barley as an example, we used the actual yield data observed in field surveys to verify the processing results with this method through relative root mean square error (RRMSE). The RRMSE value was 3.84%, indicating good consistency.
Y c = P y S y · S a y S a c    
Here, Yc represents the corrected sown area of spring wheat or highland barley, Py and Sy are the total production and sown area based on the statistical yearbook, Say is the arable area based on the statistical yearbook, and Sac is the arable area interpretated using a sub-meter scale remote sensing image of Google Earth in 2018.

2.3. Simulation of Potential Crop Yields

Potential yields of spring wheat and highland barley were simulated using the WOFOST model, which needs basic crop parameters and daily climatic data, including maximum and minimum temperatures, radiation intensity, water vapor pressure, average wind speed, and soil data such as soil texture, organic matter content, and water conductivity [32,33]. Before the simulation in the QTP, main crop parameters were calibrated based on the validation dataset, which includes crop variety, emergence date, growing duration, and yield at experimental stations. The simulated results were generally well matched with the observed data. The results showed that R2 of spring wheat and highland barley potential yield were 0.82 and 0.75, and their RRMSE values were 4.03% and 10.85%, respectively. In the simulation process of crop potential yield, we assumed the sown dates of crop remained unchanged during the study period, due to the lack of phenological data at some meteorological stations. Then, the annual potential yields of spring wheat and highland barley were simulated using the calibrated WOFOST model at 113 stations during 1958–2017 and 72 stations during 1978–2017. More detailed information on model calibration could be found in references [7,30].

2.4. Calculation of Crop Yield Gap and Increase Potential

Crop yield gap is the difference between a crop’s potential yield and actual yield. The absolute yield gap (Yg) of spring wheat and highland barley can be obtained by subtracting their actual yield using potential yield. The relative yield gap can be obtained by dividing yield gap by potential yield, that is, the percentage of yield gap in the potential yield (Ygp) (Equations (2) and (3)). The potential yield used for calculating yield gap in each county was obtained from the average potential yield of all stations within its county boundary. Regarding individual counties without meteorological stations, crop potential yield at its adjacent or nearest stations was adopted.
Y g = Y p Y a
Y g p = Y p Y a Y p · 100 %
Here, Yg, Yp, and Ya are a yield gap, potential yield, and actual yield of spring wheat or highland barley; Ygp is the percentage of yield gap to potential yield.
The potential to increase crop yield is mainly determined with the yield gap, the lower threshold of yield gap, and sown area [14,34]. Regarding the lower yield gap threshold, related studies by Lobell et al. showed that when the cereal yield gap of grain crops approached 10–20% of their potential yields, crop yields would stagnate [11]. According to the current yield gap level of spring wheat and highland barley in the QTP, three scenarios were set in this study, including scenarios where the potential yield was fully developed (Ygp = 0) and the yield gap shrunk to 10% and 20% of the potential yield (Ygp= 10% and 20%). The total production increase potential of these two crops in the main production areas of the QTP was evaluated at the county level. The formula for calculating the increase potential of total production for each county under different scenarios is as follows:
I C j = [ S · Y g p α j ]
where ICj is the increase potential of crop total production, S is the sown area of crop in 2020, Ygp is the ratio of crop yield gap to potential yield; αj is the lower threshold of yield gap in scenario j, i.e., 0, 10%, and 20%.

3. Results

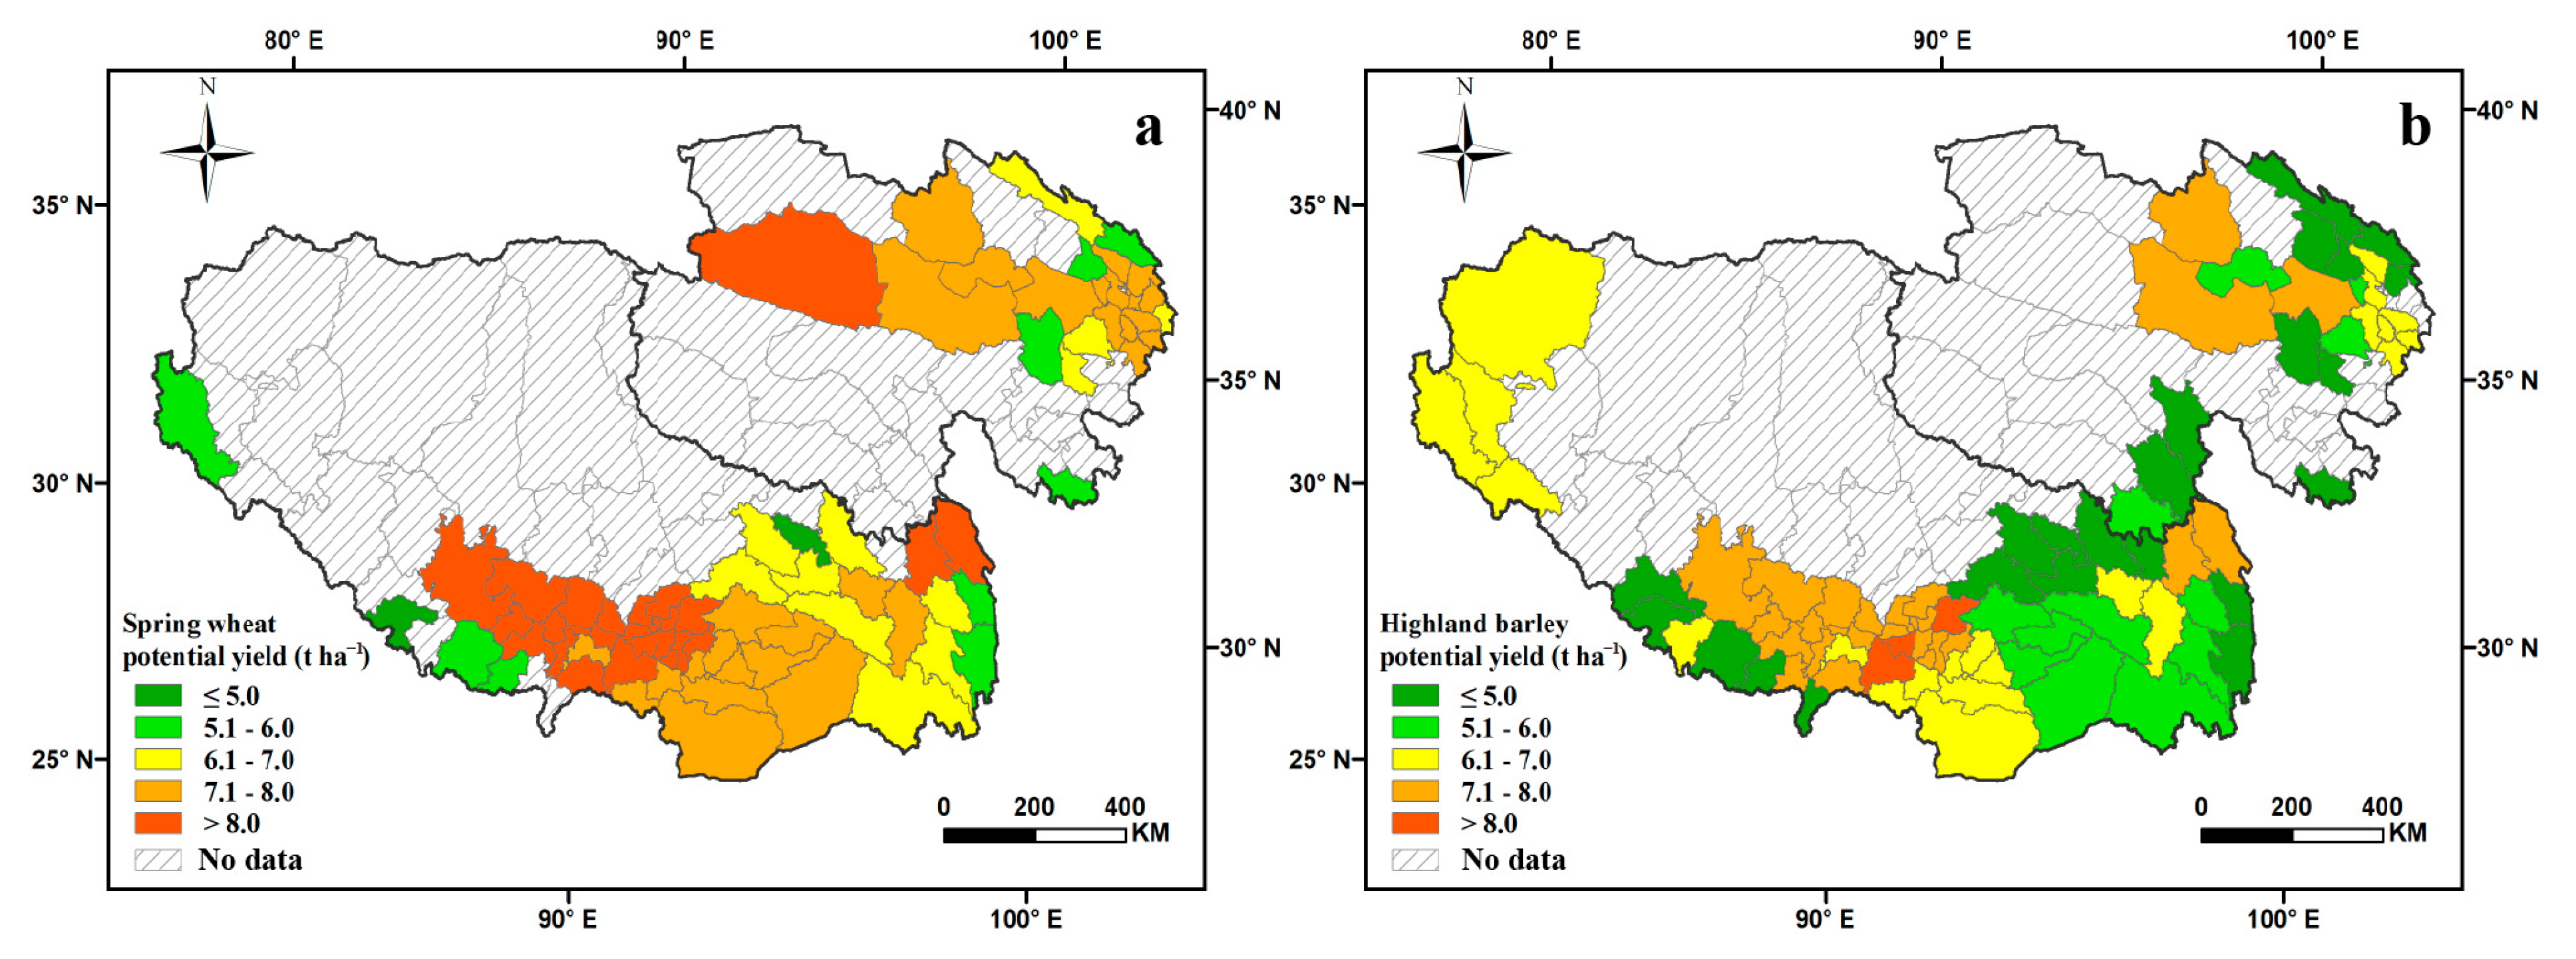
3.1. Potential Yields of Spring Wheat and Highland Barley

For the whole QTP, the annual average potential yield of spring wheat and highland barley was 7.4 and 6.2 t ha−1, respectively. Spatially, spring wheat potential yield ranged from 4.8 to 8.6 t ha−1 throughout the QTP. The 25 counties with spring wheat potential yield above 8.0 t ha−1 were mainly concentrated in Shigatse, Shannan, and Lhasa. In 11 counties scattered throughout the QTP, spring wheat potential yield was less than 6.0 t ha−1. In 44 other counties, the potential yield of spring wheat was between 6.0 and 8.0 t ha−1 (Figure 2a). The potential yield of highland barley was overall lower than that of spring wheat. Specifically, only three counties (Mozhu Gongka, Longkazi, and Gongga) had a potential yield over 8.0 t ha−1. There were as many as 35 counties with highland barley potential yield below 6.0 t ha−1, and they were mainly located in Shigatse, Naqu, Haibei, Linzhi, and Qamdo. In 48 other counties, the potential yield of highland barley was among 6.0–8.0 t ha−1 (Figure 2b).

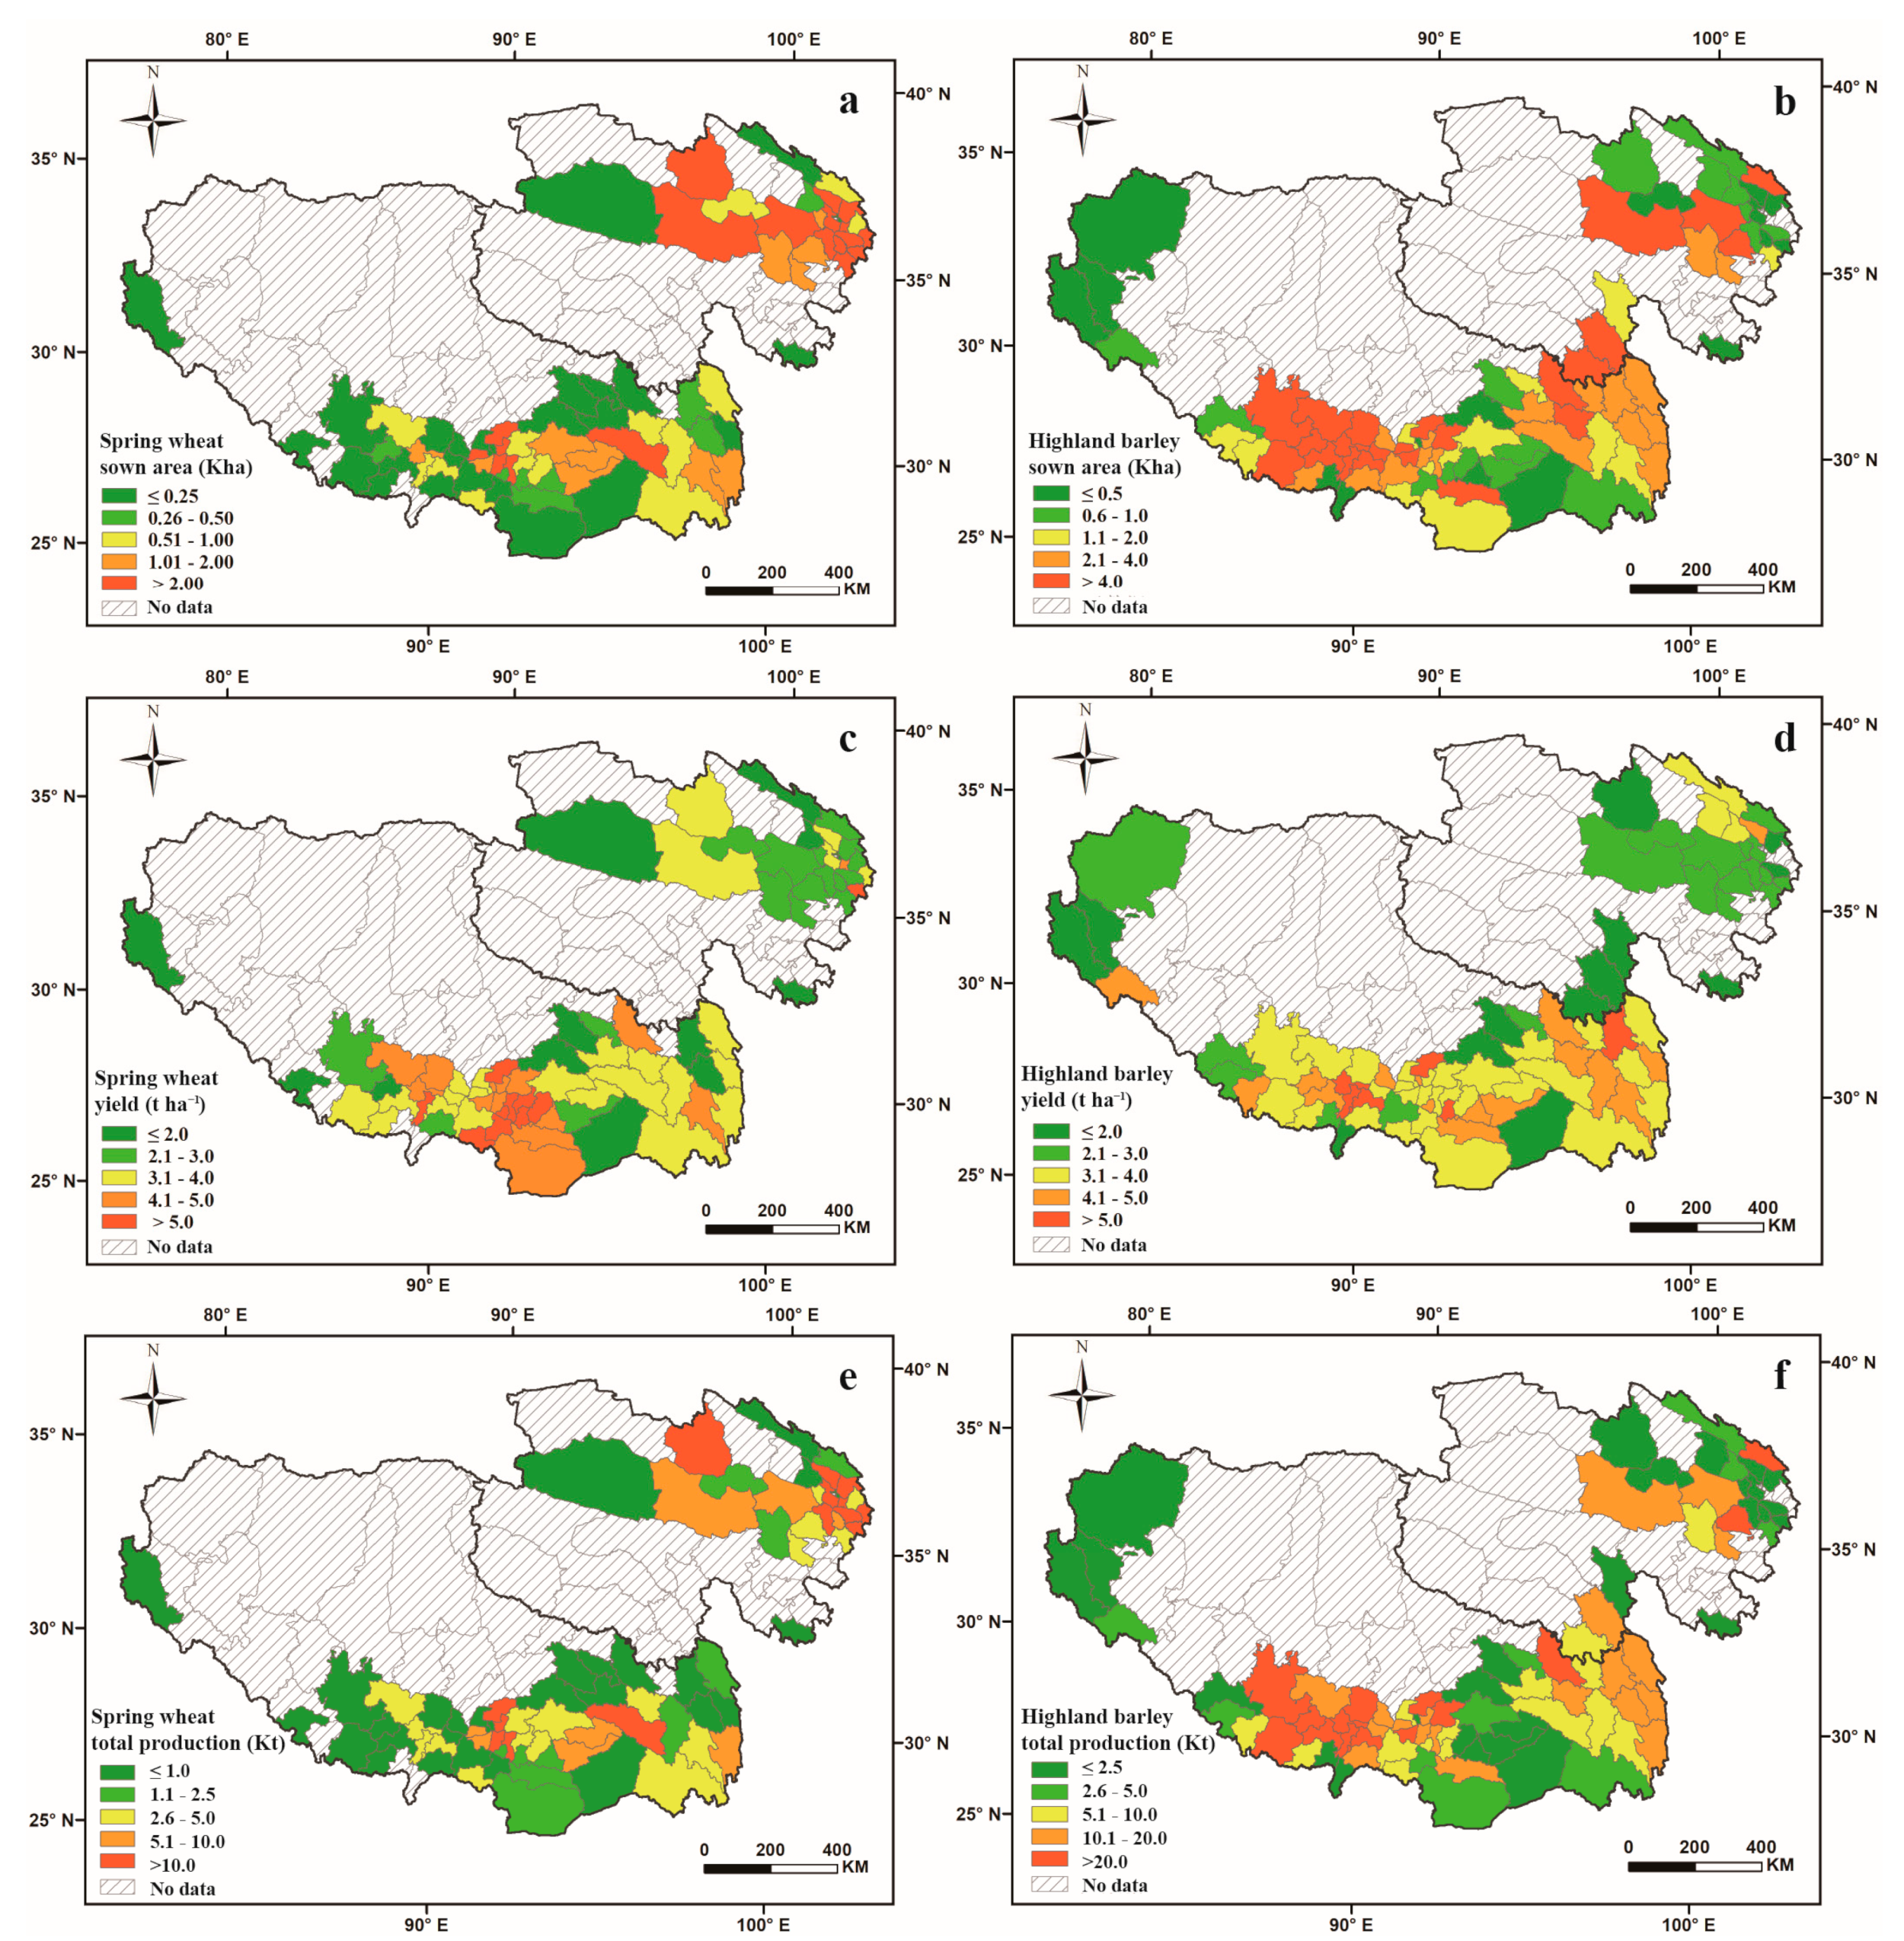
3.2. Sown Area, Actual Yield, and Total Productions of Spring Wheat and Highland Barley

In 2020, the sown areas of spring wheat and highland barley in the QTP were 121.21 and 253.01 Kha, with total production of 0.42 and 0.95 Mt and average yields of 3.74 and 3.45 t ha−1, respectively. At the county level, there were large differences in spring wheat sown area across the QTP. Huangzhong and Metuo had the largest and smallest areas sown of spring wheat in the whole plateau, reaching 12.6 Kha and 3.86 ha, respectively. The sown area of spring wheat exceeded 2.0 Kha in 19 counties concentrated in Qinghai, and 28 counties with less than 0.25 Kha were mainly distributed in Xigaze and scattered in Naqu, Shannan, Lhasa, Qamdo, and Xining. The largest and the smallest sown area of highland barley were 6.67 ha in Sangzhuzi District of Xigaze and 11.8 Kha in Chengzhong District of Xining, respectively. A total of 23 counties with a sown area of more than 4.0 Kha were mainly located in Xigaze and Shannan, Qamdo, Lhasa, Haixi, and Hainan, and the 17 counties with a sown area of less than 0.5 Kha were mainly distributed in Ngari, Xining, and Haidong (Figure 3a,b).
The yield of spring wheat ranged from 1.0 to 6.2 t ha−1 in all counties, among which it was over 5.0 t ha−1 and was below 2.0 t ha−1 in 11 counties around Shannan and 14 counties scattered in the eastern parts of Tibet and Qinghai, respectively. The yield of highland barley was slightly lower than that of spring wheat, ranging from 0.8 to 6.1 t ha−1. In 6 counties concentrated in Xigaze and the surrounding areas, the yield was larger than 5.0 kg ha−1, while in 14 counties scattered in Ali, Yushu, and Naqu, the yield was less than 2.0 t ha−1 (Figure 3c,d).
The total production of spring wheat ranged from 0.4 Kt to 42.0 Kt at the county level. In 14 counties mainly distributed in Haidong, Xining, Lhasa, Shannan, and Nyingchi, the production exceeded 10 Kt. The 30 counties producing less than 10 Kt were mainly concentrated in Xigaze, Qamdo, Lhasa, Nagqu, Haibei, and Xining. Regarding the highland barley, there was a range of total production from 0.84 to 69.0 Kt in all counties of the QTP. There were 28 counties with a total production of highland barley of less than 2.5 Kt, mainly distributed in Nyingchi, Naqu, Ngari, Xining, Haidong, and Haixi. In 14 counties of Xigaze, Lhasa, Haibei, and Hainan, it was more than 20.0 Kt (Figure 3e,f).

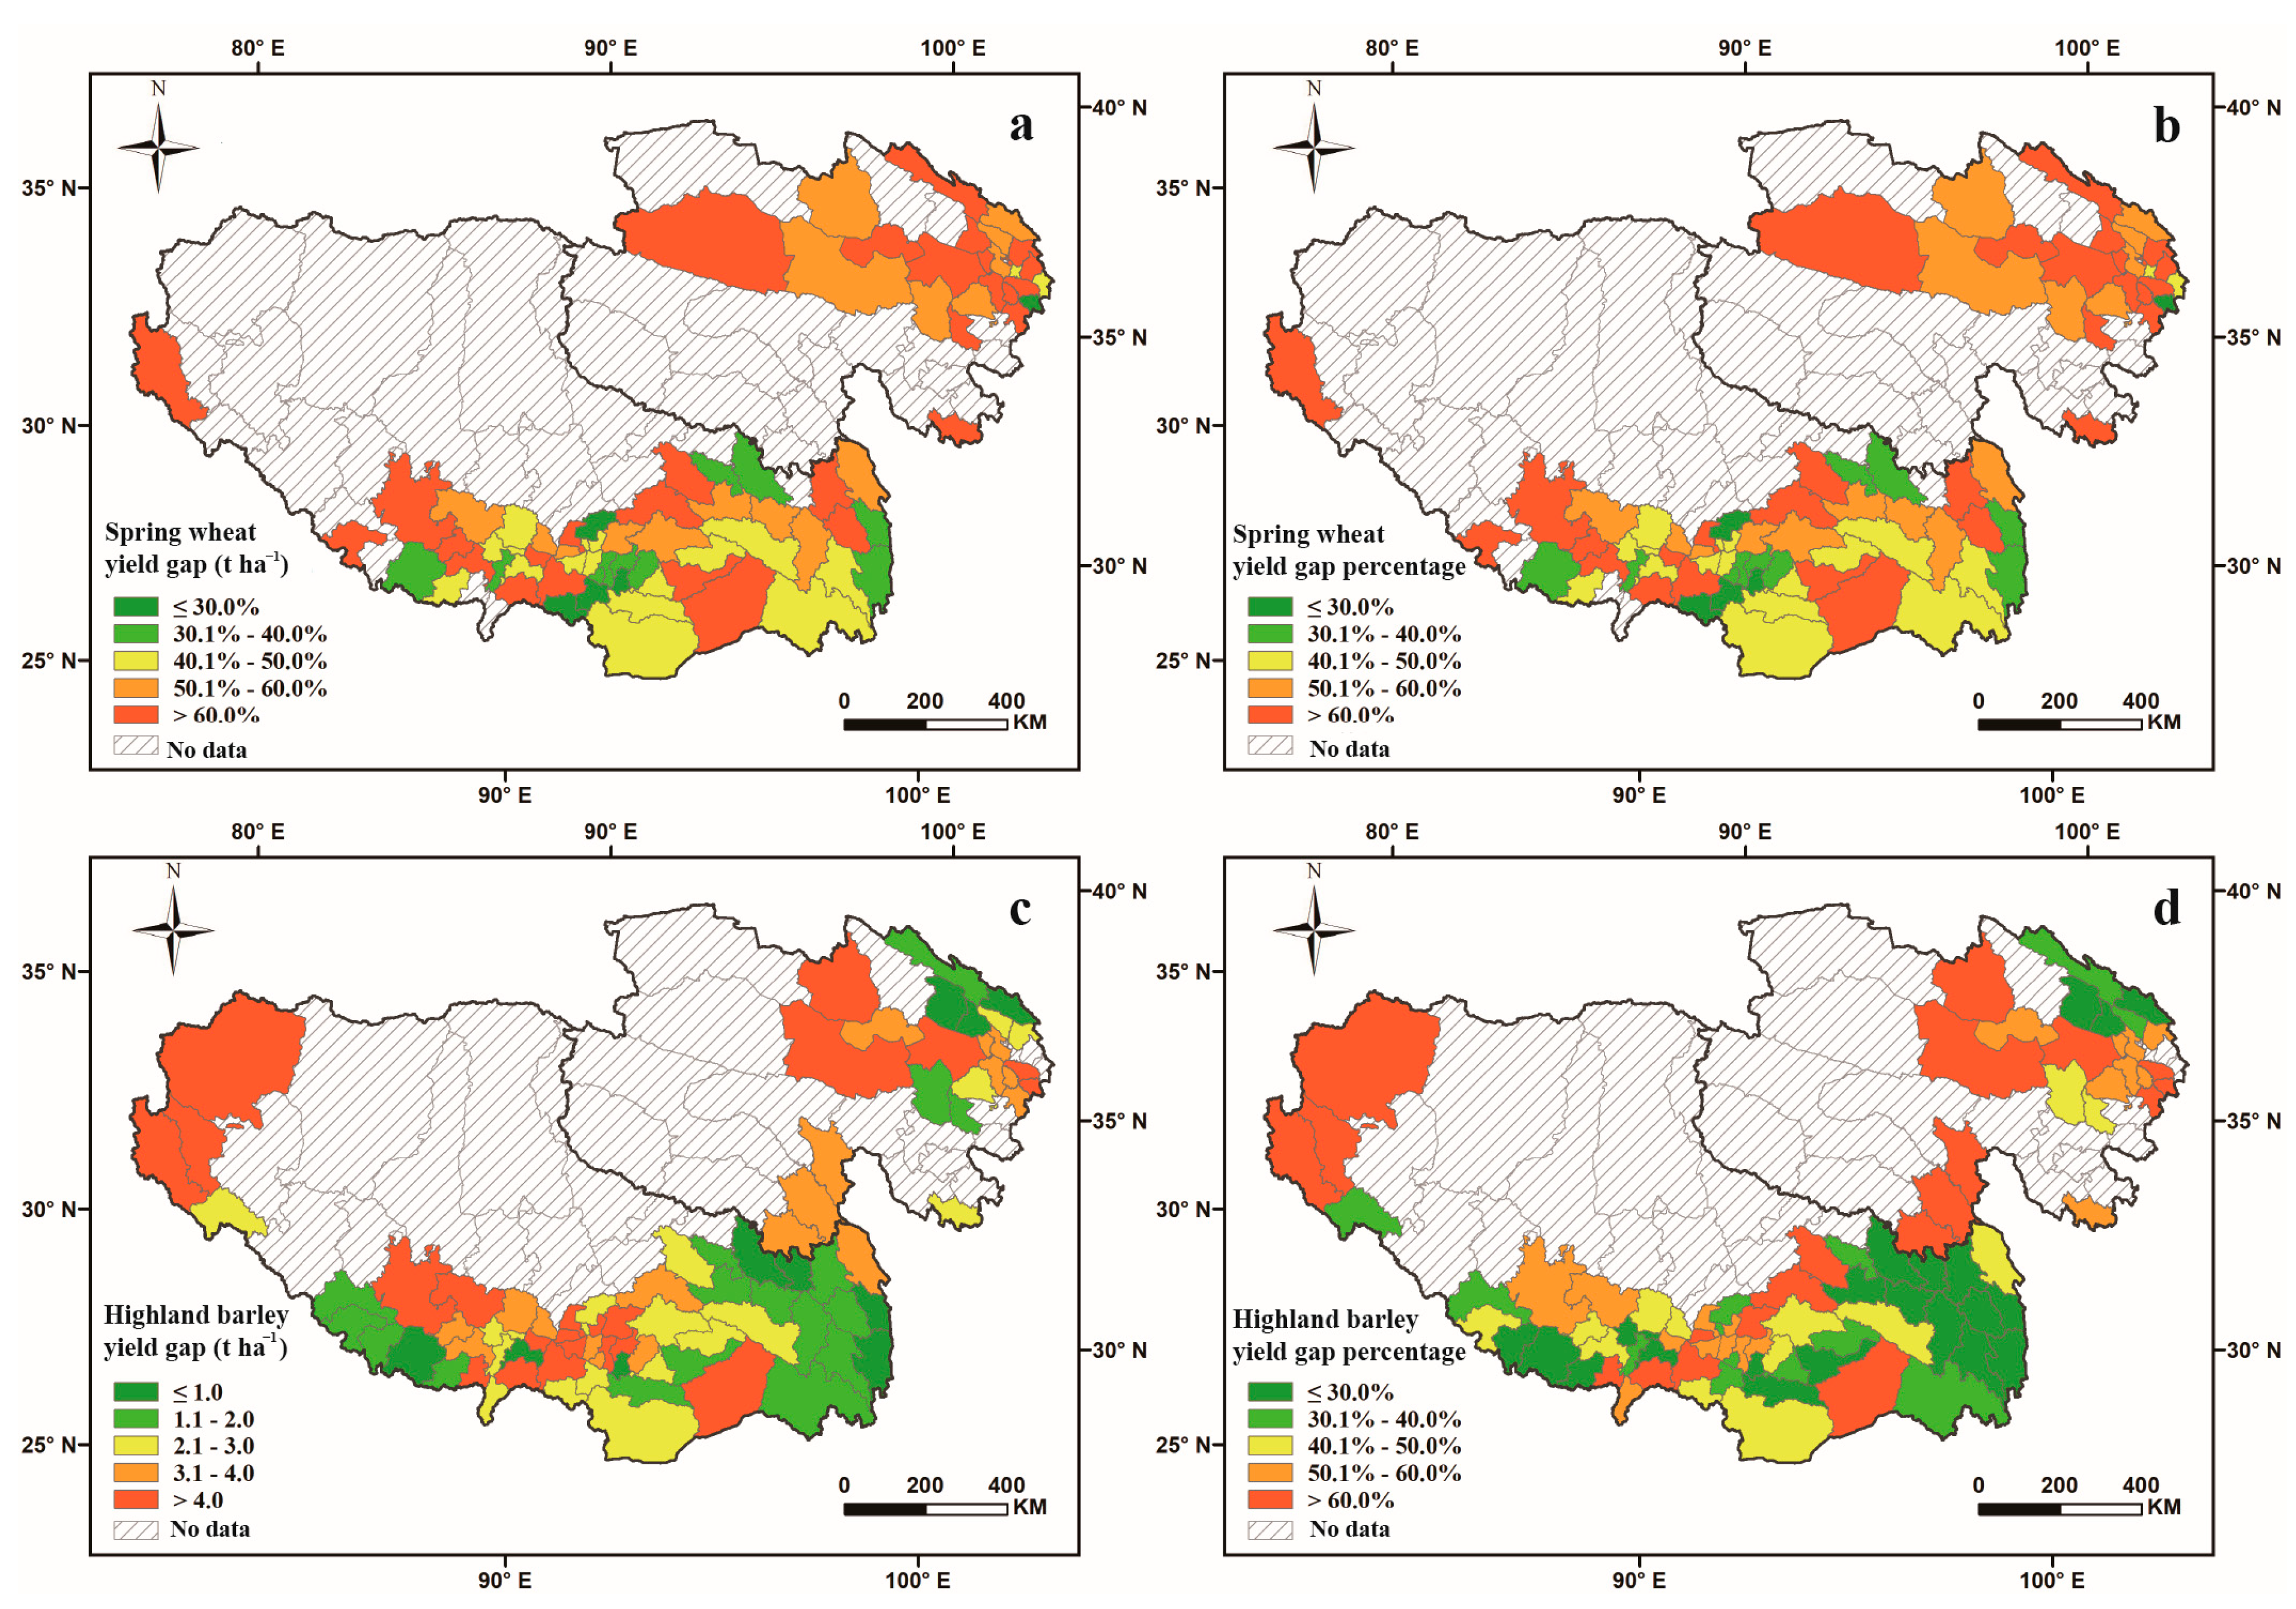
3.3. Yield Gaps of Spring Wheat and Highland Barley

For the whole QTP, the yield gaps of spring wheat and highland barley were 3.7 and 2.4 t ha−1, respectively, accounting for 51.4% and 39.5% of their potential yields. At the county level, the yield gap of spring wheat ranged from 1.5 to 7.0 t ha−1, accounting for 19.9% to 85.8% of its potential yield. There were five counties where the yield gap was less than 2.0 t ha−1, i.e., less than 40.0% of the potential yield. These counties, such as Qusong, Loza, and Xunhua, were located in the southern part of Tibet and generally had relatively high yields (>7.0 t ha−1). The yield gap was more than 5.0 t ha−1 in 20 counties scattered throughout the plateau and accounted for 58.2–85.8% of its potential yield. These counties, such as Nimu, Qushui, and Lazi, generally had a higher potential yield (>8.0 t ha−1) (Figure 4a,b).
Overall, the yield gap of highland barley was smaller than that of spring wheat, ranging from 0.3 to 5.9 t ha−1. In 10 counties mainly located in the southern part of Tibet and eastern part of Qinghai, with low potential yields or high actual yields, the yield gap was below 1.0 t ha−1 or accounted for less than 30% of potential yield. The yield gap was rather large (>4.0 t ha−1) in 22 counties, where there were relatively high potential yields but low actual yields. These counties were mainly distributed in the western and southern parts of Tibet and western parts of Qinghai, such as Qushui, Mozhugongka, Renbu, and Dulan County (Figure 4c,d).

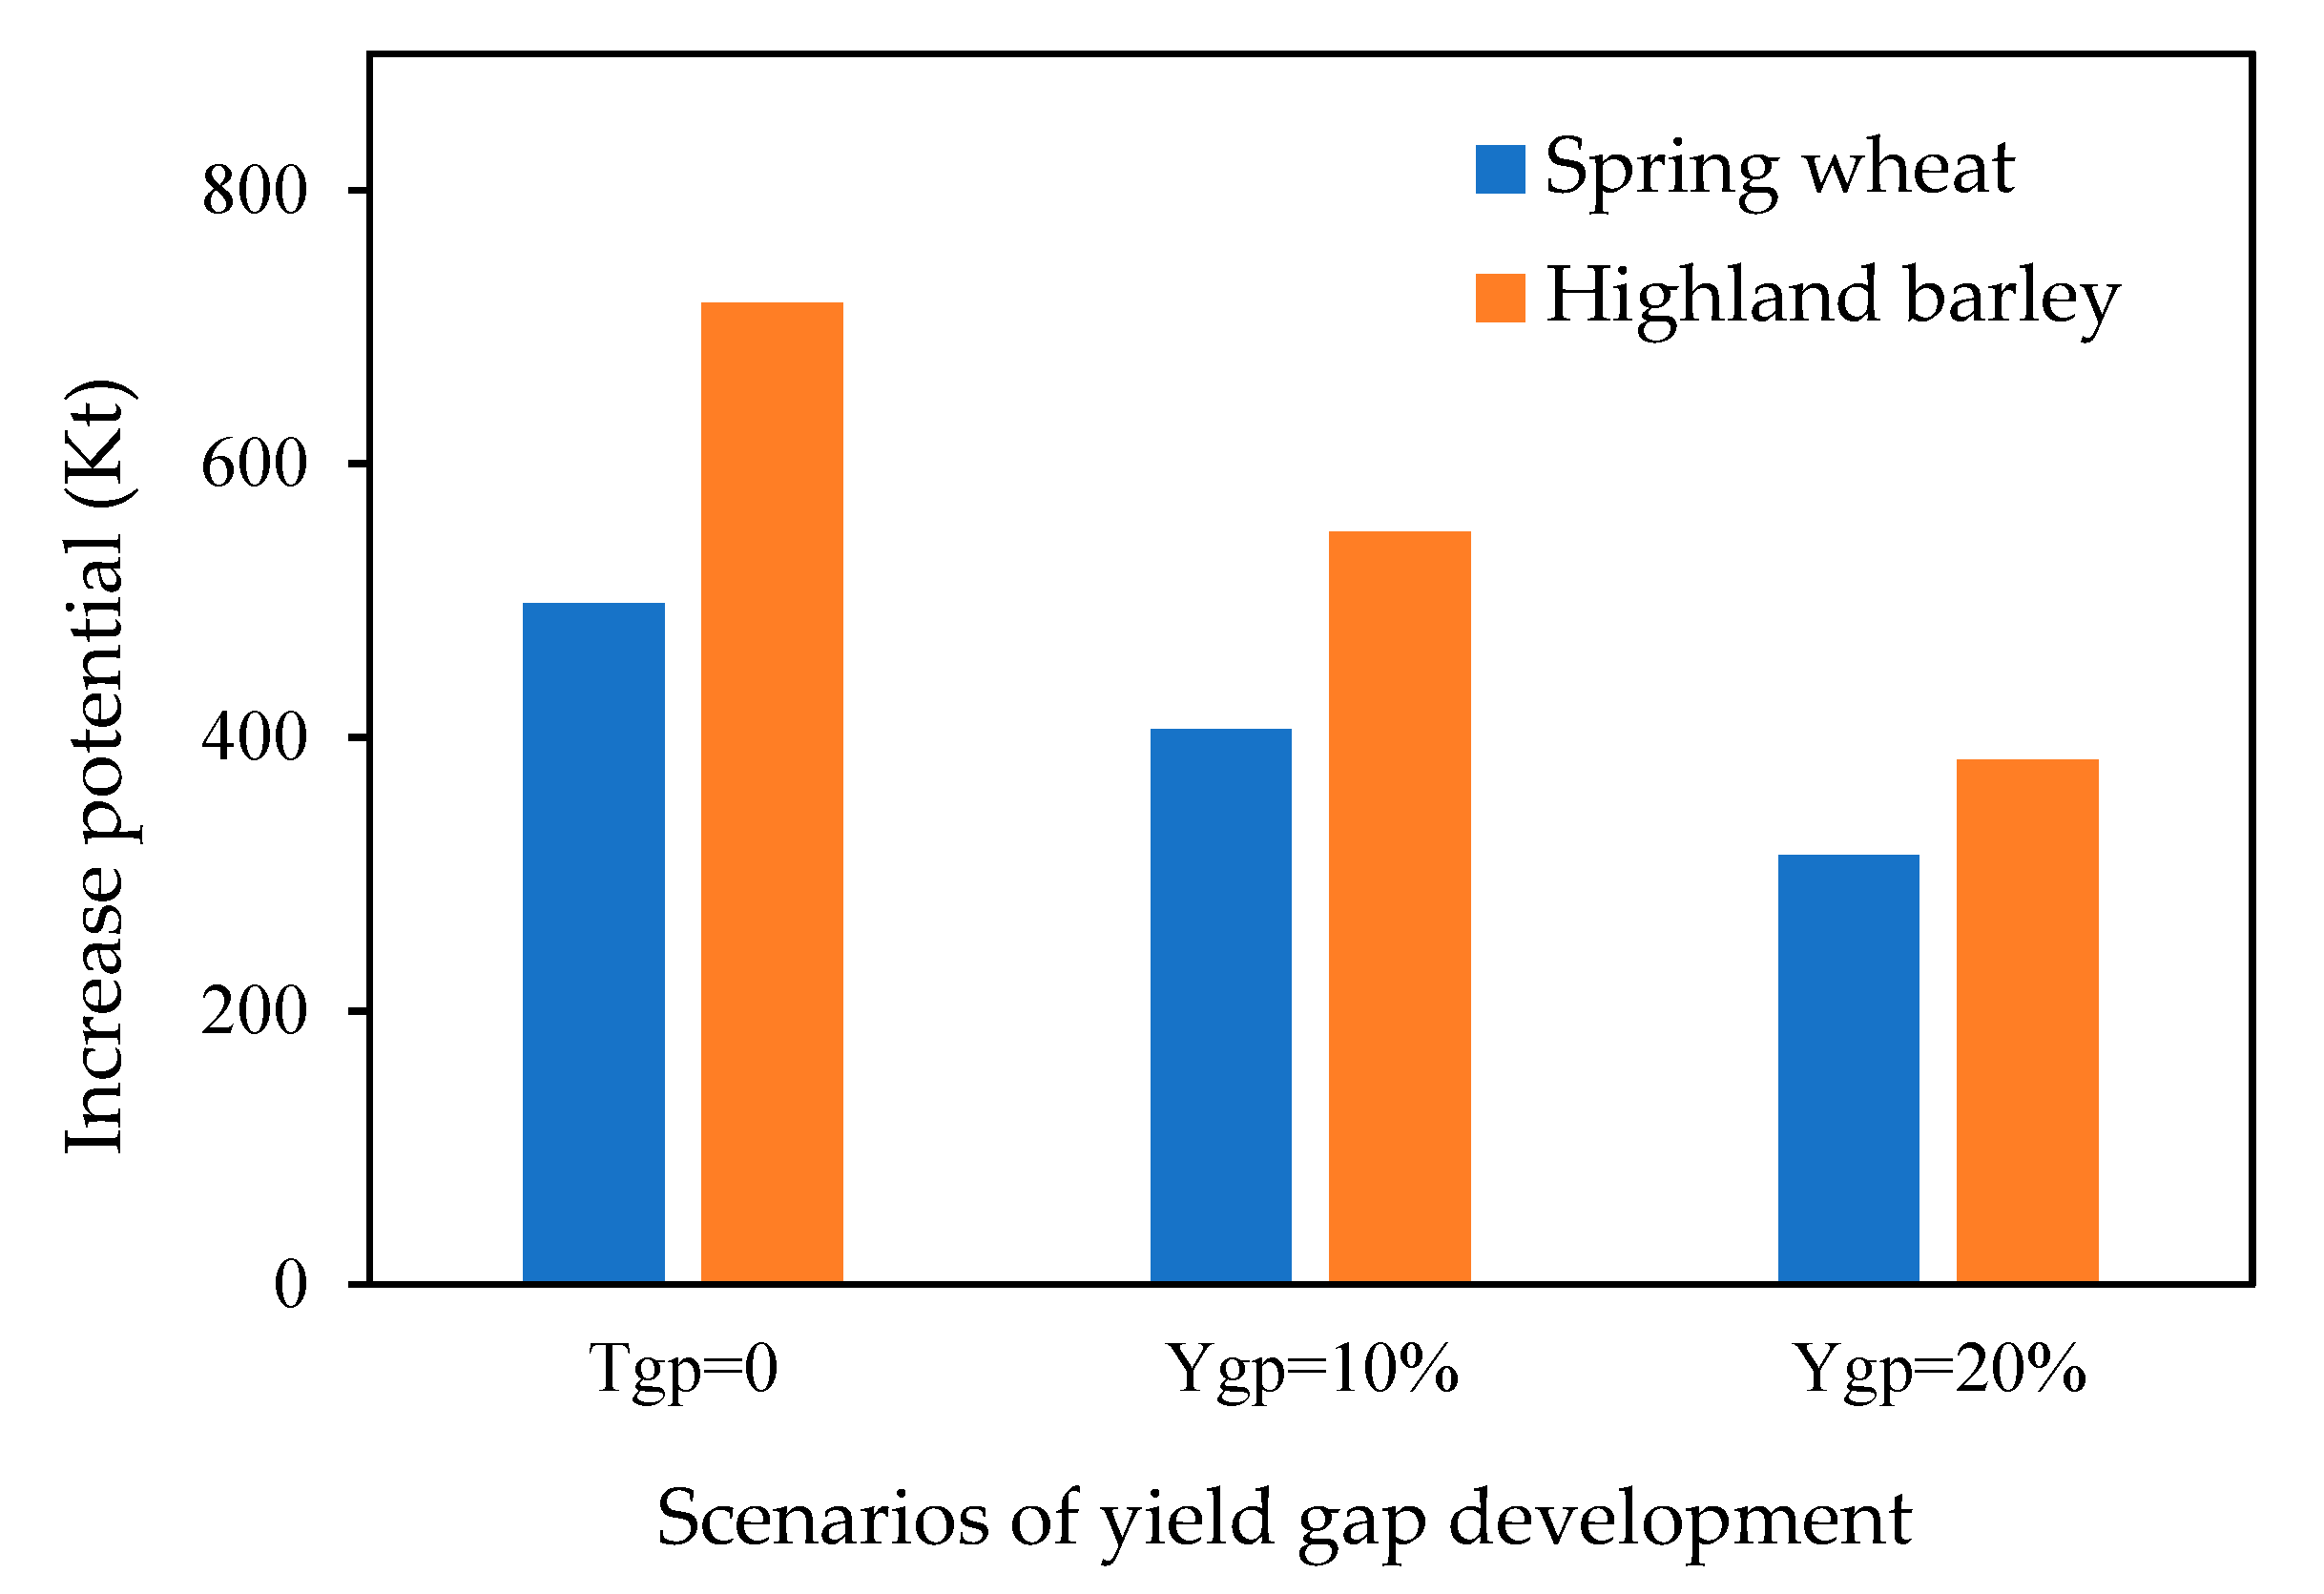
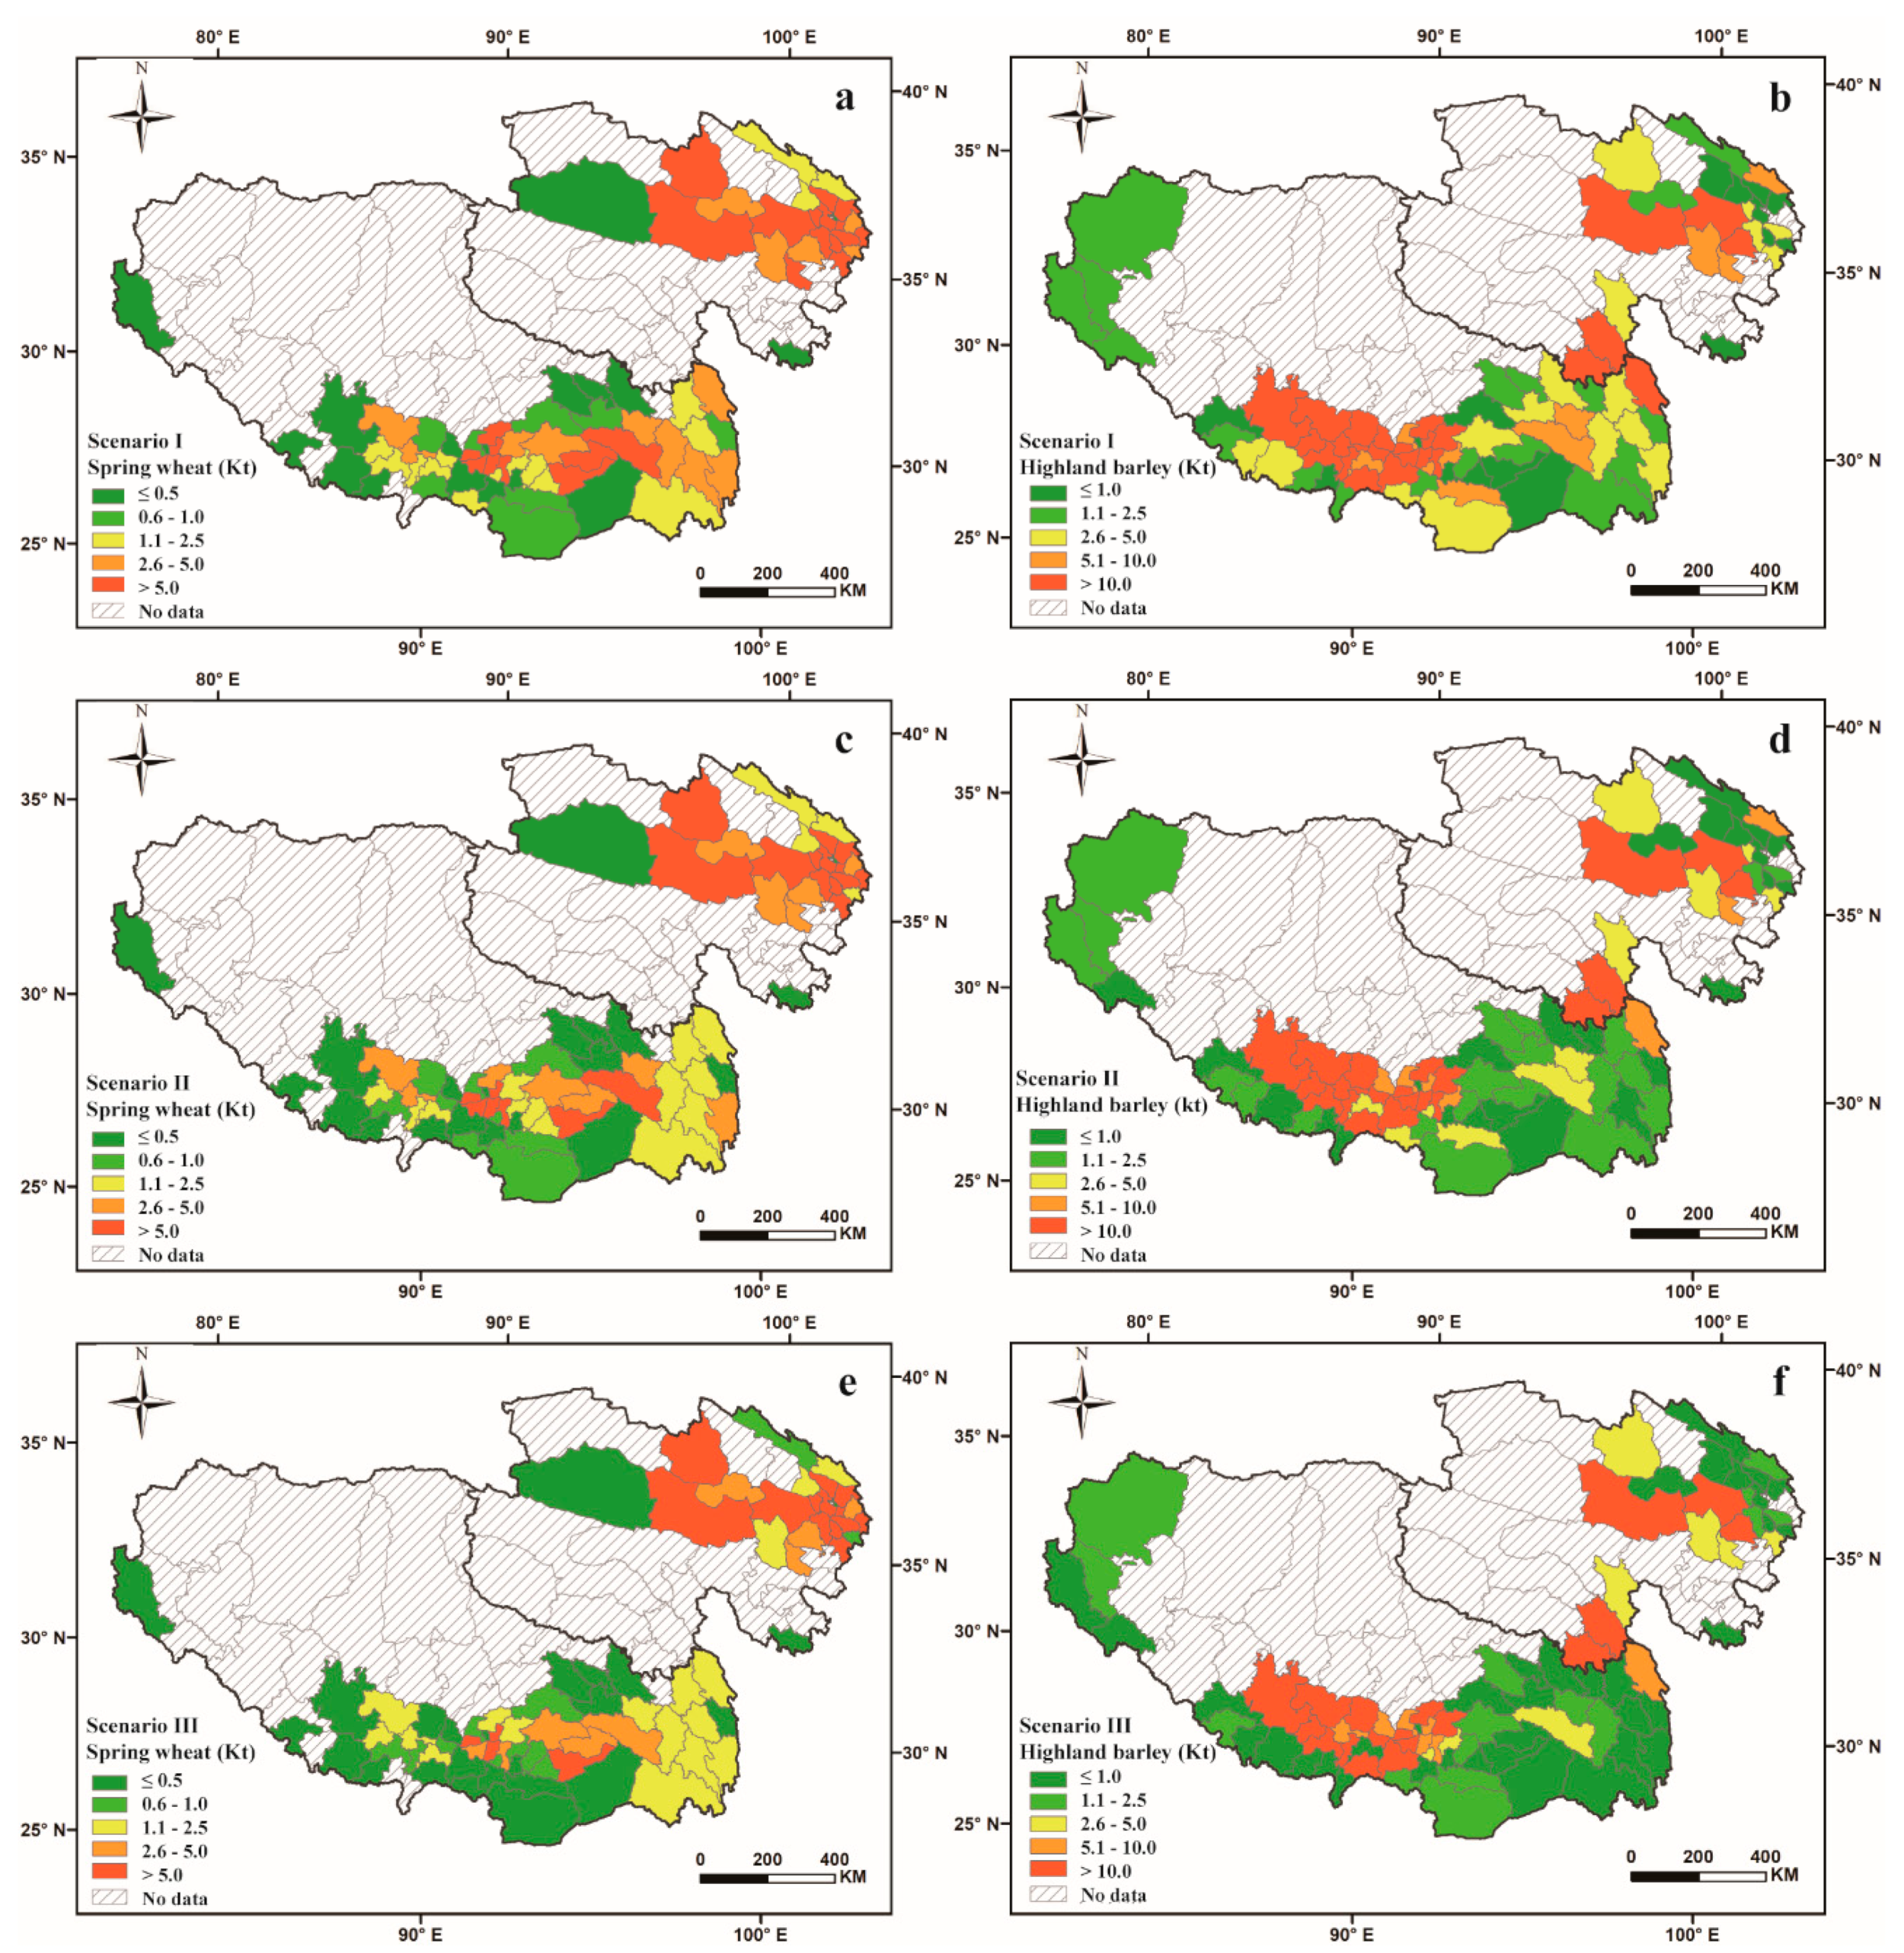
3.4. Production Increase Potentials of Spring Wheat and Highland Barley

In the scenario where the yield gap is fully developed, the total production increase potential of spring wheat and highland barley in the QTP are 497.4 Kt and 717.4 Kt, respectively. At present, the total production of spring wheat and highland barley in the QTP are 420.9 and 953.9 Kt, respectively, and there are potentials to increase by 118.2% and 75.2%, respectively. In the scenario where yield gap is reduced to 10% of the potential yield, the increase potential of spring wheat and barley are 405.6 Kt and 550.3 Kt, and the increase potential of these two crops are reduced to 96.4% and 57.7%, respectively. In the scenario where the yield gap is reduced to 20% of potential yield, the increase potentials are 313.8 and 383.1 Kt, respectively, with a 74.6% and 40.2% potential to increase for these two crops, respectively (Figure 5).
When the yield gap is fully developed, there are obvious differences in potential to increase the total production of spring wheat in different counties in the QTP. For instance, the increase potential of total spring wheat production is more than 50.0 Kt in the Huzhu, Datong, and Huangzhong counties, while it is less than 30 t in the Seda and Metuo counties. Spatially, 23 counties with over 5.0 Kt are mainly distributed in Haidong, Hainan, Xining Shannan, Nyingchi, and Lhasa. A total of 18 counties below 0.5 Kt are mainly located in Xigaze and Shannan. In 39 other counties, the increase potential is between 0.5 and 5.0 Kt. The potential for increasing the production of highland barley is much larger than spring wheat at the county level. It is more than 10 Kt in 24 counties, mainly in Lhasa, Shannan, Xigaze, Hainan, Yushu, and Hainan. The 18 counties with less than 1.0 Kt are mainly located in Nyingchi, Nagqu, Xigaze, Haibei, Haidong, and Xining. In the other 45 counties, it is in the range of 1.0 and 10 Kt (Figure 6a,b).
In the scenario when the yield gap reduces to 10% of potential yield, there are 20 and 21 counties with an increase in spring wheat production potential of more than 5.0 Kt and less than 0.5 Kt, respectively. The number of counties with the potential to increase highland barley production by more than 10 Kt decreases slightly to 21, while the number of counties with the potential to increase by less than 1.0 Kt increases significantly to 27, of which 3 counties have almost no potential to increase, namely Gongjue, Qusong, and Haiyan counties. The number of counties with an increase potential of 1.0–10.0 Kt decreases to 39 (Figure 6c,d).
When the yield gap is shrunk to 20%, the number of counties with more than 5.0 Kt of spring wheat production increased to 17, and the number of counties with less than 0.5 Kt increases to 25. The numbers of counties with an increase potential of more than 10.0 Kt and less than 10.0 Kt for highland barley decrease and increase to 18 and 39, respectively. The number of counties with no potential for increase expands to 10, including the Kaluo District, Gongjue, Jiaowuqi, Dingqing, Zuogong in the Chamdo Prefecture, Gyantse and Dingri in the Xigaze Prefecture, Qusong in Shannan, and Gangcha and Haiyan in the Haibei Prefecture. In the remaining 30 counties, their potentials to increase range from 1.0 to 10.0 Kt (Figure 6e,f).

4. Discussion

4.1. Crop Potential Yields

The QTP has a complex topography and large latitude and longitude spans, so there are obvious differences in crop potential yield throughout the plateau, which is quite different from the plain regions such as the North China Plain and Northeastern Plain [23,35]. Our results showed that the average annual potential yields of spring wheat and highland barley in the QTP were 7.4 and 6.2 t ha−1, respectively, lower than the results of other related studies. One of the reasons for this could be that in other studies, potential crop yields were mostly obtained based on photosynthetic efficiency models for simulation and were not verified by experimental yields [6,36,37,38]. In this study, the parameters of the WOFOST model were verified based on the observed data at 13 and 17 meteorological stations, and the simulation accuracy was estimated [7,30]. In the simulation process of crop potential yield, we assumed the sown dates of crop remained unchanged during the study period due to the lack of phenological data at some meteorological stations, which might cause some uncertainties to the simulated results at some stations. Nevertheless, the verification results showed that the simulated potential yields were in agreement with the validation dataset, implying the WOFOST model had the ability to give rather accurate estimates of spring wheat and highland barley potential yields in the QTP.
Another reason might be that other related studies obtained the potential yield of spring wheat and highland barley at a small number of sites. For instance, Gong et al. selected seven stations to simulate the photo-temperature potential yield of highland barley, while Mu et al. simulated the wheat potential yield at eight stations [22,39]. These selected stations were mainly located in major agricultural producing areas in the QTP, where the climate resources were relatively conductive for crop growth, so crop potential yield was relatively high. In this study, however, the average potential yields of spring wheat and highland barley were obtained based on the simulated results at 113 and 72 stations, which includes some stations without conductive resource conditions.

4.2. Crop Actual Yields, Yield Gaps, and Increase Potentials

According to previous results, the farmland area in the Three River Region of Tibet was 199.89 Kha in 2018, through visual interpretation based on the Google Earth 0.51–1.02 m high resolution satellite images [31]. The randomly collected 55 plots in field surveys were checked during 2018–2021, and 96.36% of the farmland parcels in 2018 were correctly identified, implying that the dataset of farmland generally has a good quality and could reveal the actual farmland distribution. Compared with the interpreted data in Tibet, the officially reported statistical farmland was under reported by 96.13 Kha (48.09%). In some counties, the gap even approached 80%. This is because the statistical farmland in Tibet is still sourced from history data, which are often largely under-recorded [40]. So, we adopted a method (Equation (1)) to correct the statistical planting area of spring wheat and highland barley based on the interpreted area and to further calculate their actual yields. Nevertheless, this correction method might also provoke some uncertainty in some counties with overstated disparity.
Our results indicated that the yield gap of highland barley accounted for 39.5% of its potential yields for the whole QTP, which was agreement with the average value of 34.5% during 2007–2017 by Gong et al. [22]. The yield gaps of cereal crops depend on actual yields and potential yields, and the areas with a larger yield gap are mainly those counties with a high potential yield but a low actual yield at present. Given the warming and wet trend in the main planting area of spring wheat and highland barley in the QTP, their potential yields will increase in the future, especially in the areas with relatively low accumulated temperatures [41,42,43]. Therefore, the yield gap will increase when crop actual yields remain unchanged or their change rates are lower than that of potential yield induced by climate change. Furthermore, climate warming will also increase the upper limit of suitable altitude for growing cereals [43]. The area suitable for growing spring wheat and highland barley has expanded to higher altitudes, for instance, Zhang et al. indicated that the land area suitable for single and double cropping increased from 19,110 and 9 km2 to 19,980 and 2015 km2 from 1970 to 2000, increasing by 4.6% and 2228.9%, respectively [44]. As a result, the increases in potential yield and planting area of spring wheat and highland barley in the QTP will further enhance the potential to increase total cereal production.

4.3. Implications

Our field survey showed that the agricultural infrastructure and field management levels in the QTP were relatively backward, and the limiting factors differed in different regions. Related studies indicated that the main factors limiting the improvement of cereal yields in the QTP were the application of fertilizers and pesticides [45,46,47]. According to the statistical yearbooks, the amounts of fertilizers per unit of cultivated land area in Qinghai and Tibet were only 97.4 and 99.5 kg ha−1, respectively, which are much lower than that of inland provinces (e.g., 862.4 kg ha−1 in Henan and 589.5 kg ha−1 in Shandong). The uses of pesticides were 3.3 and 2.4 kg ha−1, respectively, which is also far lower than 21.8 kg ha−1 in Shandong and 16.1 kg ha−1 in Henan (China Statistical Yearbook). Additionally, the low irrigation rate was another key factor that influenced cereal yields in the QTP [48]. In Qinghai Province, particularly, most of the arable land consists of hillside terraces, and in 2020 the guaranteed irrigation rate is expected to reach only 38.9% (China Statistical Yearbook).
To improve the crop yields of spring wheat and highland barley in the QTP, the fertility of the farmland should be improved by increasing the uses of fertilizers or farm manure in a moderate way. In Qinghai, the construction of basic farmland should be strengthened, especially, the irrigation rate should be improved. Meanwhile, it is also necessary to develop or introduce new varieties that can adapt to the current climate change. This will mitigate the impact of the warming trend on crop yield in areas with high accumulated temperature areas. Furthermore, conducting more field investigations is also necessary to understand other ways of improving crop production in the QTP.

5. Conclusions

This paper analyzed the spatial distribution of sown area, actual yield, and total production of spring wheat and highland barley at the regional and county level in the QTP, and then, it evaluated their yield gap and total production increase potential. The results showed that there were 51.4% and 39.5% of the potential yield for spring wheat and highland barley for developing for the whole QTP. At the county level, the yield gap of spring wheat accounted for 19.9–89.8% of the potential yield, while for highland barley, it was from 10.7% to 86.7%. Regarding the total production, both spring wheat and highland barley have potential to increase by 118.2% and 75.2%, respectively, on the basis of the the current total production. At present, low irrigation guarantee rates and low fertilizers application are the main reasons for the limitation of actual crop yield improvement in the QTP. Therefore, it is necessary to improve the irrigation rate and fertilizer usage of farmland in the counties with larger crop yield gaps such as Hainan, Shannan, Lhasa, etc., as to develop the increase potentials of spring wheat and highland barley.

Author Contributions

Conceptualization, Z.Z. and C.L.; methodology, Z.Z.; writing—original draft preparation, Z.Z.; writing—review and editing, C.L. and X.G.; visualization, Z.Z.; project administration, Z.Z. and X.G.; funding acquisition, Z.Z. and X.G. All authors have read and agreed to the published version of the manuscript.

Funding

This research was jointly founded by the Joint Research on Ecological Conservation and High-Quality Development of the Yellow River Basin program (Grant number 2022-YRUC-01-0102), the Strategic Priority Research Program of the Chinese Academy of Sciences (Grant number XDA20040301), and the National Natural Science Foundation of China (Grant number 42101266).

Data Availability Statement

The associated dataset of the study is available upon request to the corresponding author.

Conflicts of Interest

The authors declare that they have no conflict of interest.

References

  1. Zhang, Y.; Liu, L.; Wang, Z.; Bai, W.; Ding, M.; Wang, X.; Yan, J.; Xu, E.; Wu, X.; Zhang, B.; et al. Spatial and temporal characteristics of land use and cover changes in the Tibetan Plateau. China Sci. Bull. 2019, 64, 2865–2875. [Google Scholar]
  2. Liu, J.; Li, X.; Zhong, X. Consumption Structure of Food and the Countermeasure of Grain in Tibet. J. Mt. Sci. Engl. 2004, 22, 286–291. [Google Scholar]
  3. Gao, L.; Xu, Z.; Cheng, S.; Xu, S.; Zhang, X.; Yu, C.; Sun, W.; Wu, J.; Qu, Y.; Ma, J. Food Security Situation and Major Grain Supply and Demand in Tibetan Region. J. Nat. Resour. 2017, 32, 951–960. [Google Scholar]
  4. Shi, W.; Lu, C.; Shi, X.; Cui, J. Patterns and trends in grain self-sufficiency on the Tibetan Plateau during 1985–2016. J. Geogr. Sci. 2020, 30, 1590–1602. [Google Scholar] [CrossRef]
  5. Duan, J.; Xu, Y.; Sun, X. Spatial patterns and their changes of grain production, grain consumption and grain security in The Tibetan Plateau. J. Nat. Resour. 2019, 34, 673–688. [Google Scholar] [CrossRef]
  6. Qiang, X.; Chi, D.; Feng, J. Development status of highland barley production in the Qinghai-Tibet Plateau. Tibet Sci. Technol. 2008, 3, 11–17. [Google Scholar]
  7. Zhang, Z.; Lu, C. Photo-temperature potential yield of spring wheat at different accumulated temperature ranges and its response to climate change in Qinghai-Tibet Plateau. Sci. Agric. Sin. 2022, 55, 2135–2149. [Google Scholar]
  8. Neumann, K.; Verburg, P.H.; Stehfest, E.; Müller, C. The yield gap of global grain production: A spatial analysis. Agric. Syst. 2010, 103, 316–326. [Google Scholar] [CrossRef]
  9. Hochman, Z.; Gobbett, D.; Horan, H.; Garcia, J.N. Data rich yield gap analysis of wheat in Australia. Field Crops Res. 2016, 197, 97–106. [Google Scholar] [CrossRef]
  10. Wang, H.; Ren, H.; Zhang, L.; Zhao, Y.; Liu, Y.; He, Q.; Li, G.; Han, K.; Zhang, J.; Zhao, B.; et al. A sustainable approach to narrowing the summer maize yield gap experienced by smallholders in the North China Plain. Agric. Syst. 2023, 204, 103541. [Google Scholar] [CrossRef]
  11. Lobell, D.B.; Cassman, K.G.; Field, C.B. Crop Yield Gaps: Their Importance, Magnitudes, and Causes. Annu. Rev. Env. Resour. 2009, 34, 179–204. [Google Scholar] [CrossRef] [Green Version]
  12. Barker, R.K.; Gomez, A.; Herdt, R.W. Farm-Level Constraints to High Rice Yields in Asia: 1974–77; IRRI: Los Banos, Philippines, 1979. [Google Scholar]
  13. de Datta, S.K. Principles and Practices of Rice Production; Wiley-Interscience Productions: Hoboken, NJ, USA, 1981. [Google Scholar]
  14. Aramburu Merlos, F.; Pablo Monzon, J.; Mercau, J.L.; Taboada, M.; Andrade, F.H.; Hall, A.J.; Jobbagy, E.; Cassman, K.G.; Grassini, P. Potential for crop production increase in Argentina through closure of existing yield gaps. Field Crops Res. 2015, 184, 145–154. [Google Scholar] [CrossRef]
  15. Henderson, B.; Godde, C.; Medina-Hidalgo, D.; van Wijk, M.; Silvestri, S.; Douxchamps, S.; Stephenson, E.; Power, B.; Rigolot, C.; Cacho, O.; et al. Closing system-wide yield gaps to increase food production and mitigate GHGs among mixed crop-livestock smallholders in Sub-Saharan Africa. Agric. Syst. 2016, 143, 106–113. [Google Scholar] [CrossRef]
  16. Xu, X.; He, P.; Pampolino, M.F.; Li, Y.; Liu, S.; Xie, J.; Hou, Y.; Zhou, W. Narrowing yield gaps and increasing nutrient use efficiencies using the Nutrient Expert system for maize in Northeast China. Field Crops Res. 2016, 194, 75–82. [Google Scholar] [CrossRef]
  17. Hengsdijk, H.; Langeveld, J. Yield Trends and Yield Gap Analysis of Major Crops in the World; WOt-werkdocument 170 2009; Wettelijke Onderzoekstaken Natuur & Milieu: Wageningen, The Netherlands, 2009. [Google Scholar]
  18. Liu, B.; Chen, X.; Cui, Z.; Meng, Q.; Zhao, M. Research advance in yield potential and yield gap of three major cereal crops. Chin. J. Eco-Agric. 2015, 23, 720–733. [Google Scholar]
  19. Cui, Z.; Yue, S.; Wang, G.; Meng, Q.; Wu, L.; Yang, Z.; Zhang, Q.; Li, S.; Zhang, F.; Chen, X. Closing the yield gap could reduce projected greenhouse gas emissions: A case study of maize production in China. Glob. Chang. Biol. 2013, 19, 2467–2477. [Google Scholar] [CrossRef]
  20. Gou, F.; Yin, W.; Hong, Y.; van der Werf, W.; Chai, Q.; Heerink, N.; van Ittersum, M.K. On yield gaps and yield gains in intercropping: Opportunities for increasing grain production in northwest China. Agric. Syst. 2017, 151, 96–105. [Google Scholar] [CrossRef]
  21. Lv, S.; Yang, X.; Lin, X.; Liu, Z.; Zhao, J.; Li, K.; Mu, C.; Chen, X.; Chen, F.; Mi, G. Yield gap simulations using ten maize cultivars commonly planted in Northeast China during the past five decades. Agric. Forest Meteorol. 2015, 205, 1–10. [Google Scholar] [CrossRef]
  22. Gong, K.; He, L.; Wu, D.; Lu, C.; Li, J.; Zhou, W.; Du, J.; Yu, Q. Spatial-Temporal Variations of Photo-Temperature Potential Productivity and Yield Gap of Highland Barley and Its Response to Climate Change in the Cold Regions of the Tibetan Plateau. Sci. Agric. Sin. 2020, 53, 720–733. [Google Scholar]
  23. Zhang, Z.; Lu, C. Assessing changes in potential yields and yield gaps of summer maize in the North China Plain. Food Energy Secur. 2023, e489. [Google Scholar] [CrossRef]
  24. Salo, T.J.; Palosuo, T.; Kersebaum, K.C.; Nendel, C.; Angulo, C.; Ewert, F.; Bindi, M.; Calanca, P.; Klein, T.; Moriondo, M.; et al. Comparing the performance of 11 crop simulation models in predicting yield response to nitrogen fertilization. J. Agric. Sci. 2016, 154, 1218–1240. [Google Scholar] [CrossRef] [Green Version]
  25. Wu, D.; Yu, Q.; Lu, C.; Hengsdijk, H. Quantifying production potentials of winter wheat in the North China Plain. Eur. J. Agron. 2006, 24, 226–235. [Google Scholar] [CrossRef]
  26. Boogaard, H.; Wolf, J.; Supit, I.; Niemeyer, S.; van Ittersum, M. A regional implementation of WOFOST for calculating yield gaps of autumn-sown wheat across the European Union. Field Crops Res. 2013, 143, 130–142. [Google Scholar] [CrossRef]
  27. de Wit, A.; Boogaard, H.; Fumagalli, D.; Janssen, S.; Knapen, R.; van Kraalingen, D.; Supit, I.; van der Wijngaart, R.; van Diepen, K. 25 years of the WOFOST cropping systems model. Agric. Syst. 2019, 168, 154–167. [Google Scholar] [CrossRef]
  28. Tang, Y.; Wan, S.; He, J.; Zhao, X. Foreword to the special issue: Looking into the impacts of global warming from the roof of the world. J. Plant Ecol 2009, 2, 169–171. [Google Scholar] [CrossRef] [Green Version]
  29. Li, L.; Zhang, Y.; Wu, J.; Li, S.; Zhang, B.; Zu, J.; Zhang, H.; Ding, M.; Paudel, B. Increasing sensitivity of alpine grasslands to climate variability along an elevational gradient on the Qinghai-Tibet Plateau. Sci. Total Environ. 2019, 678, 21–29. [Google Scholar] [CrossRef]
  30. Zhang, Z.; Lu, C. Assessing Influences of Climate Change on Highland Barley Productivity in the Qinghai-Tibet Plateau during 1978–2017. Sci. Rep. 2022, 12, 7625. [Google Scholar] [CrossRef]
  31. Wei, H.; Lu, C. Farmland change and its implications in the Three River Region of Tibet during recent 20 years. PLoS ONE 2022, 17, e265939. [Google Scholar] [CrossRef]
  32. Boogaard, H.L.; Diepen, C.A.V.; Rotter, R.P.; Cabrera, J.M.C.A.; Laar, H.H.V. User’s Guide for the WOFOST 7.1 Crop Growth Simulation Model and WOFOST Control Center 1.5; Technical document 52; SC-DLO: Wageningen, The Netherlands, 1998; p. 127. [Google Scholar]
  33. Kalra, N.; Chakraborty, D.; Kumar, P.R.; Jolly, M.; Sharma, P.K. An approach to bridging yield gaps, combining response to water and other resource inputs for wheat in northern India, using research trials and farmers’ fields data. Agric. Water Manag. 2007, 93, 54–64. [Google Scholar] [CrossRef]
  34. Chapagain, T.; Good, A. Yield and Production Gaps in Rainfed Wheat, Barley, and Canola in Alberta. Front. Plant Sci. 2015, 6, 990. [Google Scholar] [CrossRef] [Green Version]
  35. Liu, Z.; Yang, X.; Lin, X.; Hubbard, K.G.; Lv, S.; Wang, J. Maize yield gaps caused by non-controllable, agronomic, and socioeconomic factors in a changing climate of Northeast China. Sci. Total Environ. 2016, 541, 756–764. [Google Scholar] [CrossRef]
  36. Quzhen, G.; Ciren, P.; Hu, X. Effect of climate change on yield potential of crops in Tibet. Agric. Resour. Arid. Areas 2015, 33, 266–271. [Google Scholar]
  37. Wu, R.; Zhou, B. Study on the influence of plateau climate change on the potential of grain production in Qinghai province. Qinghai Sci. Technol. 2011, 18, 34–38. [Google Scholar]
  38. Zhao, X.; Wang, W.; Wan, W.; Li, H. Influence of climate change on potential productivity of naked barley in the Tibetan Plateau in the past 50 years. Chin. J. Eco-Agric. 2015, 23, 1329–1338. [Google Scholar]
  39. Mu, Q.; Li, J.; He, L.; Wu, D.; Zhu, T.; Lu, C.; Yu, Q. Potential yield of winter wheat in Oinghai—Tibet Plateau and its response toclimate change. J. Arid. Land Resour. Environ. 2021, 35, 92–99. [Google Scholar]
  40. Zhu, Q. Discussion on statistical methods of farmland area. Tibet. Sci. Technol. 2007, 9, 10–12. [Google Scholar]
  41. Zhang, Z.; Lu, C. Spatiotemporal Changes in Frost-Free Season and Its Influence on Spring Wheat Potential Yield on the Qinghai–Tibet Plateau from 1978 to 2017. Int. J. Environ. Res. Public Health 2023, 20, 4198. [Google Scholar] [CrossRef] [PubMed]
  42. Dan, Z.; Wenhui, X.; Jiayun, L.; Zhe, C.; Di, A. Frost-free season lengthening and its potential cause in the Tibetan Plateau from 1960 to 2010. Theor. Appl. Climatol. 2014, 115, 441–450. [Google Scholar]
  43. Song, Y.; Wang, C.; Linderholm, H.W.; Tian, J.; Shi, Y.; Xu, J.; Liu, Y. Agricultural Adaptation to Global Warming in the Tibetan Plateau. Int. J. Environ. Res. Public Health 2019, 16, 3686. [Google Scholar] [CrossRef] [Green Version]
  44. Zhang, G.; Dong, J.; Zhou, C.; Xu, X.; Wang, M.; Ouyang, H.; Xiao, X. Increasing cropping intensity in response to climate warming in Tibetan Plateau, China. Field Crops Res. 2013, 142, 36–46. [Google Scholar] [CrossRef]
  45. Li, W.; Huang, X.; Xi, Y.; Li, F.; Hu, J.; Pu, Q.; Zhao, G. Current situation of fertilizer and pesticide use in highland barley crops in Tibet and suggestions on countermeasures. Tibet. Sci. Technol. 2019, 3–5. [Google Scholar]
  46. Ma, R.; Nima, Z.; Gao, X.; Dai, X.; Bianba, Z. Effects of Organic Fertilizers Combined with Chemical Fertilizers on the Growth and Yield of Tibetan Hulless Barley. Barley Cereal Sci. 2018, 35, 17–23. [Google Scholar]
  47. Wei, W.; Zhaxi, L.; Gan, Y.; Liu, R.; Dawa; Deqing, Z. Effects of Different Planting Density and Fertilizer Treatment on Barley Yield and Agronomic Characters. Tibet. J. Agric. Sci. 2022, 18–20. [Google Scholar]
  48. Liu, Y.; Lyu, S.; Chen, J.; Zhang, J.; Qiu, S.; Hu, Y.; Ge, Q. Spatio-temporal differentiation of agricultural modernization and its driving mechanism on the Qinghai-Tibet Plateau. Acta Geogr. Sin. 2022, 77, 214–227. [Google Scholar]
Figure 1. Location and boundaries of the Qinghai-Tibet Plateau.
Land 12 01555 g001
Figure 2. Annual average potential yields of spring wheat (a) and highland barley (b) at the county level in the Qinghai-Tibet Plateau.
Land 12 01555 g002
Figure 3. Sown area, yields, and total productions of spring wheat and highland barley at the county level in the Qinghai-Tibet Plateau. (a,b) indicate sown area of spring wheat and highland barley respectively; (c,d) indicate the yields of spring wheat and highland barley respectively; (e,f) indicate the total productions of spring wheat and highland barley respectively.
Land 12 01555 g003
Figure 4. Yield gaps of spring wheat and highland barley at the county level in the Qinghai-Tibet Plateau. (a,b) indicate yield gap of spring wheat and its percentage to potential yield respectively; (c,d) indicate yield gap of highland barley and its percentage to potential yield respectively.
Land 12 01555 g004
Figure 5. Total production increase room of spring wheat and highland barley under different scenarios in the Qinghai-Tibet Plateau.
Land 12 01555 g005
Figure 6. Total production increase potentials of spring wheat and highland barley at the county level in the Qinghai-Tibet Plateau. Scenario I, II, and III indicate the scenarios where the potential yield is fully developed (Ygp = 0), and the yield gap is shrunk to 10% and 20% of the potential yield (Ygp = 10% and 20%). (a,b) indicate increase potentials of spring wheat and highland barley in the scenario I respectively; (c,d) indicate increase potentials of spring wheat and highland barley in the scenario II respectively; (e,f) indicate increase potentials of spring wheat and highland barley in the scenario III respectively.
Land 12 01555 g006
Table 1. The actual yield of highland barley was obtained based on statistical yearbook, data processing, and field survey.
CountyYa-1 (kg ha−1)Ya-2 (kg ha−1)Ya-3 (kg ha−1)
Pulan506040873750
Ritu241223662400
Zhada224921662250
Dingjie453735633600
Dingri610338283600
Gangba345828252900
Jilong564625892750
Yadong310819092100
Cuomei481738103600
Cuona451535843200
Luozha569135683600
Note: Ya-1, Ya-2, and Ya-3 indicate the actual yields of highland barley obtained based on statistical yearbook, data processing, and field survey, respectively.
Disclaimer/Publisher’s Note: The statements, opinions and data contained in all publications are solely those of the individual author(s) and contributor(s) and not of MDPI and/or the editor(s). MDPI and/or the editor(s) disclaim responsibility for any injury to people or property resulting from any ideas, methods, instructions or products referred to in the content.

