1. Introduction
The concept of green infrastructure (GI) is gaining prominence in public policies and is becoming consolidated as a recurring theme within city and regional planning theory and practice [
1,
2]. GI can be defined as a planned network of natural and semi-natural spaces that, in combination with other environmental elements, provide ecosystem services and protect both urban and rural biodiversity [
3]. Their typologies are multiple (urban green areas, peri-urban green areas, ecological corridors, and natural areas of special protection) and so are their functionalities [
4].
GI contributes to maintaining the integrity of habitats and supports broader ecological networks [
5]. By increasing vegetation cover (natural, semi-natural, and artificial), GI promotes biodiversity and more sustainable landscapes [
6]. It also expands the availability of natural resources, aids in preventing natural disasters, and improves water management, among other benefits [
7,
8]. GI increases the resilience of urban areas to climate change by improving flood management, reducing heat stress, favoring greater coastal protection, improving water management, favoring carbon sequestration and storage, reducing energy use, or providing renewable energy, among other factors [
9,
10]. GI also yields economic and social advantages [
5,
8,
10,
11]. It can boost investments, revalue nearby real estate, generate employment, and promote economic activities related to leisure and tourism [
8].
Access to green spaces has also been linked to favorable public health outcomes [
12]. Studies have found significant associations between green space exposure and various health indicators, including cortisol levels, heart rate, blood pressure, cholesterol, heart rate variability, diabetes, mortality rates, and pregnancy outcomes. GI provides a wide range of ecosystem services that sustain and promote public health, such as improving water quality, supporting local agriculture, and providing adequate spaces for greater physical activity and social interaction, with a positive impact on physical and mental health [
5,
11]. GI also brings benefits in terms of population well-being and crime reduction [
13]. The benefits of green space are more pronounced among groups with low socioeconomic status and in deprived areas [
12]. Strategies and interventions should be developed to maximize green space advantages for those most in need.
Mechanisms explaining the positive impacts of green spaces on life expectancy and mortality include the inherent qualities of natural environments, a salubrious setting with reduced air pollutants, temperature and noise, opportunities for physical activity, and enhanced social interactions [
14]. Both surrounding greenery and access to green areas contribute to these effects. Moreover, planning that maximizes accessible green space promotes public health, especially given that extensive evidence suggests that exposure to natural environments reduces stress and chronic diseases [
15].
In this vein, Louv [
16] introduced the concept of Nature Deficit Disorder, highlighting the adverse impacts of reduced outdoor time for children and linking it to behavioral problems and health issues. This speaks to the concerning disconnection from nature in modern society, which contributes to global ecosystem degradation. Efforts must promote direct experiences in nature to foster environmental awareness and reverse this trend. However, some critique the emphasis on individual responsibility, arguing it distracts from underlying political and economic drivers of ecological decline [
17]. A political ecology perspective challenges the concept of nature and explores alternative ways of understanding human–nature relationships. As Dickinson [
18] argues, addressing root causes is crucial, since attributing child–nature alienation to insufficient exposure and technology overlooks deeper contributing factors and disregards individual nature choices.
Accessible urban green infrastructure is essential for equitable cities, providing health and community benefits that should extend to all residents [
19]. Shared parks, gardens, and nature spaces enable recreation, relaxation, and social connection while promoting mental and physical well-being. These numerous benefits highlight the need to ensure equity of access to GI among the population. [
7,
20,
21]. However, inequitable access excludes and isolates vulnerable populations, deepening environmental injustice [
15,
22]. Cities must ensure green spaces are reasonably accessible in all neighborhoods, regardless of income level. Doing so enhances quality of life for all while enabling inclusive development where everyone can access urban amenities. Thus, it is important to promote and ultimately provide greater GI accessibility, especially for pedestrians, as walking is the most inclusive and sustainable transportation mode.
However, it is worth questioning what we consider accessibility. Thus, accessibility to urban green spaces is often measured by distance, with standards recommending access within a 5–15 min walk [
7]. In the field of urban planning, two concepts advocating for proximity and accessibility to amenities have emerged in recent years: the 15 min city and the 3-30-300 rule. The 15-min city concept, originally proposed by Carlos Moreno [
23], advocates for urban areas where residents can access daily necessities within a 15 min walk or bike ride. This model utilizes the principles of chrono-urbanism and chronotopia to reimagine neighborhood-level urban planning, aiming to organize infrastructure and environments for greater accessibility, proximity, and human-centric design. By maximizing proximity, diversity, density, and ubiquity, it allows residents to prioritize time for social activities rather than lengthy commutes while weaving neighborhoods into a cohesive urban fabric. This approach constructs livable and sustainable communities where essentials are accessible through active mobility. Advocates present this adaptable framework as optimizing land use and balancing livability with ecology [
24]. However, critics like Glaeser [
25] argue it restricts the diversity of interactions and exchanges within cities, hindering social mobility and economic dynamism and confining advantages mainly to already privileged areas.
To ensure a fair and accessible distribution of trees and green spaces, urban planners are increasingly advocating for the implementation of the 3-30-300 rule, which was first proposed in early 2021 by Cecil Konijnendijk, a professor of urban forestry at the University of British Columbia [
26]. Konijnendijk introduced the rule as a simple, evidence-based target to guide the planning and expansion of urban forests and green spaces. Since its introduction, the rule has gained support from cities and organizations as an impactful, evidence-based target to expand urban forests and green infrastructure [
27].
This rule sets specific thresholds aimed at maximizing the benefits of proximity to nature. It entails ensuring that every home has a minimum of three trees within view, that a minimum tree canopy coverage of 30% is achieved in each district, and that no residence is located more than 300 m away from the nearest park or green space. The promotion of this rule aims to create a more equitable environment with enhanced access to nature for all residents [
28,
29]. Evidence also shows that adherence to the rule is associated with improved mental health, especially for women and young people [
28,
29].
Along with this, the 3-30-300 rule is, at the same time and thanks to its simplicity, a powerful communication tool and a straightforward instrument that local administrations can implement and adapt to each territorial context, bringing visibility to the importance of urban greening. Implementation requires adjustments to context. The rule provides clear greening targets, enabling progress tracking. Its memorable format galvanizes stakeholder support. Both evidence-based and adaptable, this straightforward guideline can drive strategic urban greening to enhance well-being [
29].
However, green space availability differs geographically, with more access for higher compared to lower socioeconomic groups. This constitutes an environmental justice issue [
7]. Moreover, urban greening projects intended to increase access can paradoxically lead to “green gentrification” by displacing lower-income original residents who lose access. Evaluating and addressing these accessibility inequities is crucial for cities to provide green space benefits to all. Research must examine how conditions and redevelopment contexts can promote or obstruct access to quality green spaces regardless of housing or income. Identifying the specific qualities of green spaces that meet community needs is key, as is uncovering any exclusion or displacement from new amenities. Analyses of how diverse residents’ use and value of urban nature is should inform the planning of inclusive, responsive infrastructure available to all. The goal should be maximizing equitable access, not enabling gentrification [
30].
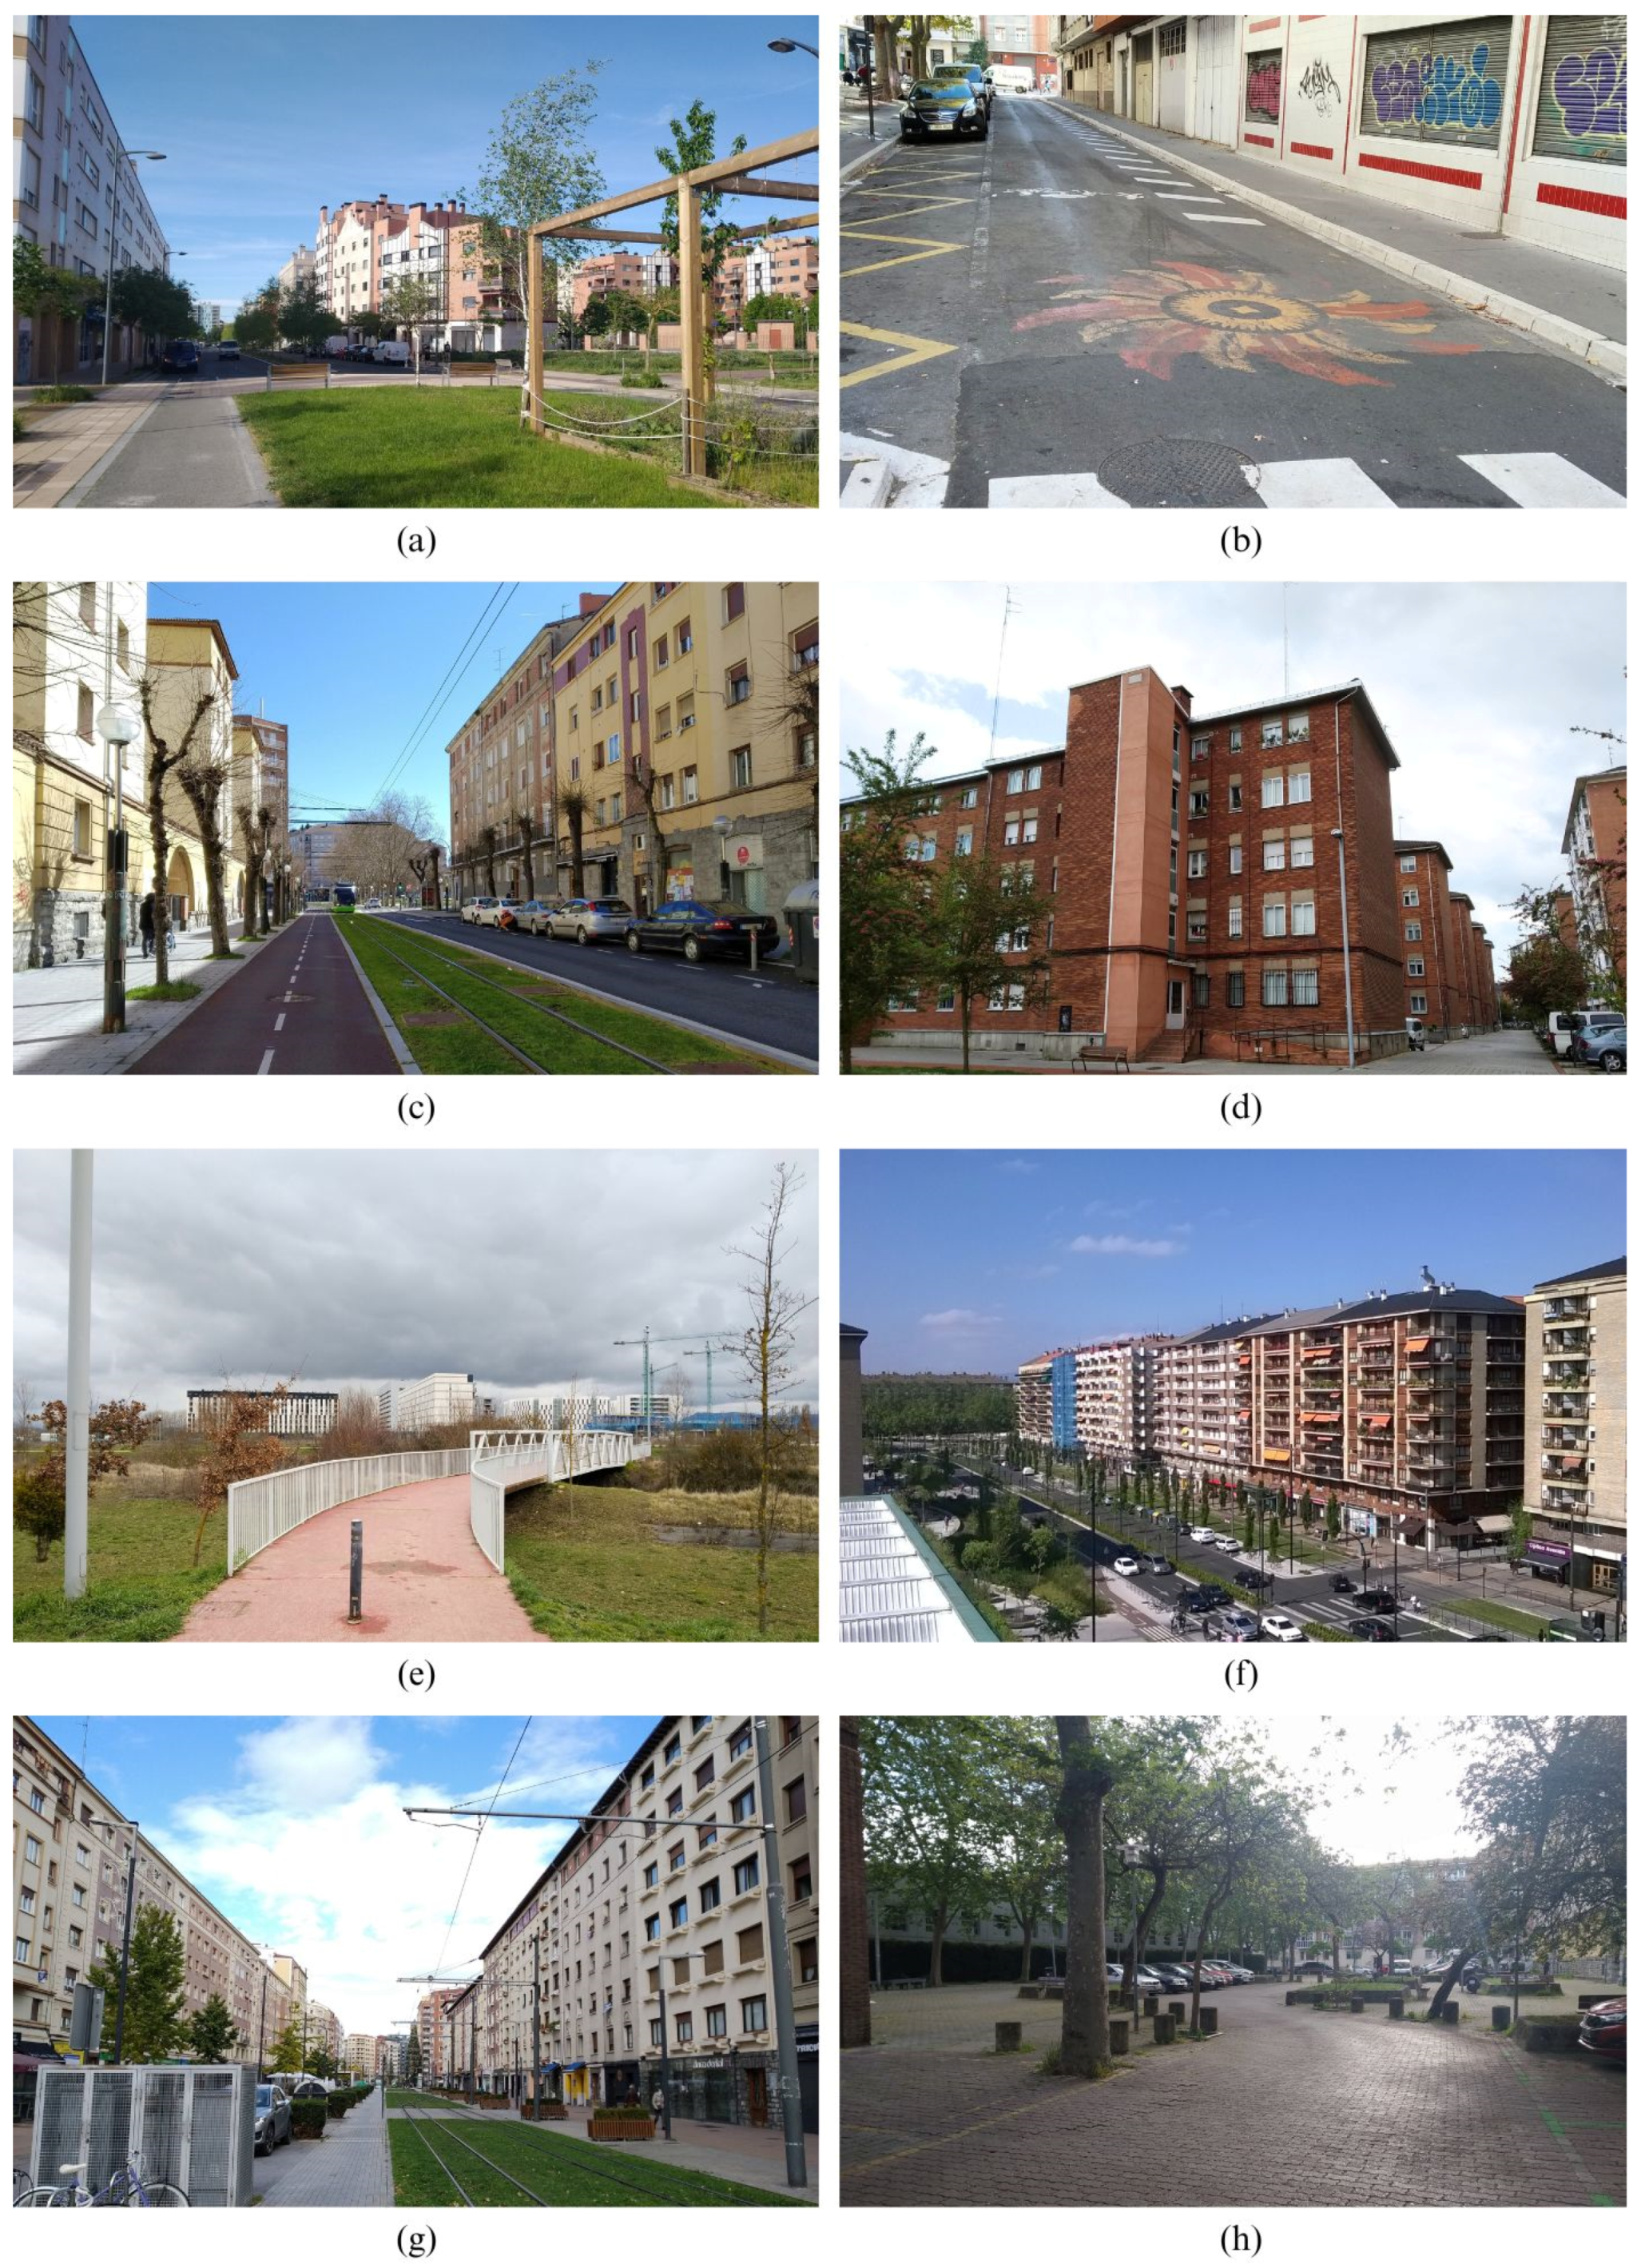
Our study aims to investigate whether the design of the urban layout, influenced by the city’s morphology and the choice of a compact urban model, can affect accessibility to green areas. We will propose a methodology based on space syntax to measure accessibility to green infrastructure, selecting Vitoria-Gasteiz as our case study due to its characteristics as a medium-sized city that has recently prioritized the enhancement of its green infrastructure. Moreover, over the past two decades, the city has experienced significant expansion, giving rise to new peripheral neighborhoods that adhere to a less dense urban development model in contrast to the traditional compact urbanism that characterized its historical evolution. By applying this methodology, we seek to uncover how the urban model may influence accessibility to green spaces, potentially leading to unequal access for the entire population. The city of Vitoria-Gasteiz, in Spain has stood out for its actions in favor of sustainable development, which has earned it international recognition for its good practices (2012 European Green Capital and 2019 Global Green Capital). One of its most emblematic projects is the so-called green belt, intended as the backbone of the city’s GI network. It aims to connect with (a) most of the green areas within the city, (b) the so-called yellow belt that includes the agricultural lands around the city, and (c) the currently paused highlands belt project, which would have linked more peripheral natural spaces via ecological corridors [
31,
32]. The highlands belt project was halted due to insufficient political will for implementation.
The aim of this investigation is to analyze pedestrian accessibility to the green belt and the most relevant components of the urban GI within the whole city of Vitoria-Gasteiz by focusing both on the spatial configuration of the walkable street and public space network to identify differences in GI accessibility across the municipality, with the further aim of examining potential disparities in access among the population. We address those objectives from environmental justice approaches [
33], considering that the entire population has the right to live in areas with a sufficient degree of accessibility to GI given the benefits it brings.
The paper is structured following the Introduction, Methods, Results, and Discussion model (IMRaD model) with a further conclusive section. After the introduction that includes the abovementioned research objectives, in the next section we describe the case study, the research methods and tools, as well as our sources of information. Next, we present the results derived from the analysis. In the
Section 4, we thoroughly discuss the results and identify the main limitations of the research. Lastly, in the
Section 5, we synthesize the key contributions of the Space Syntax methodology and propose future research directions.
3. Results
3.1. Global Integration of the Pedestrian Network
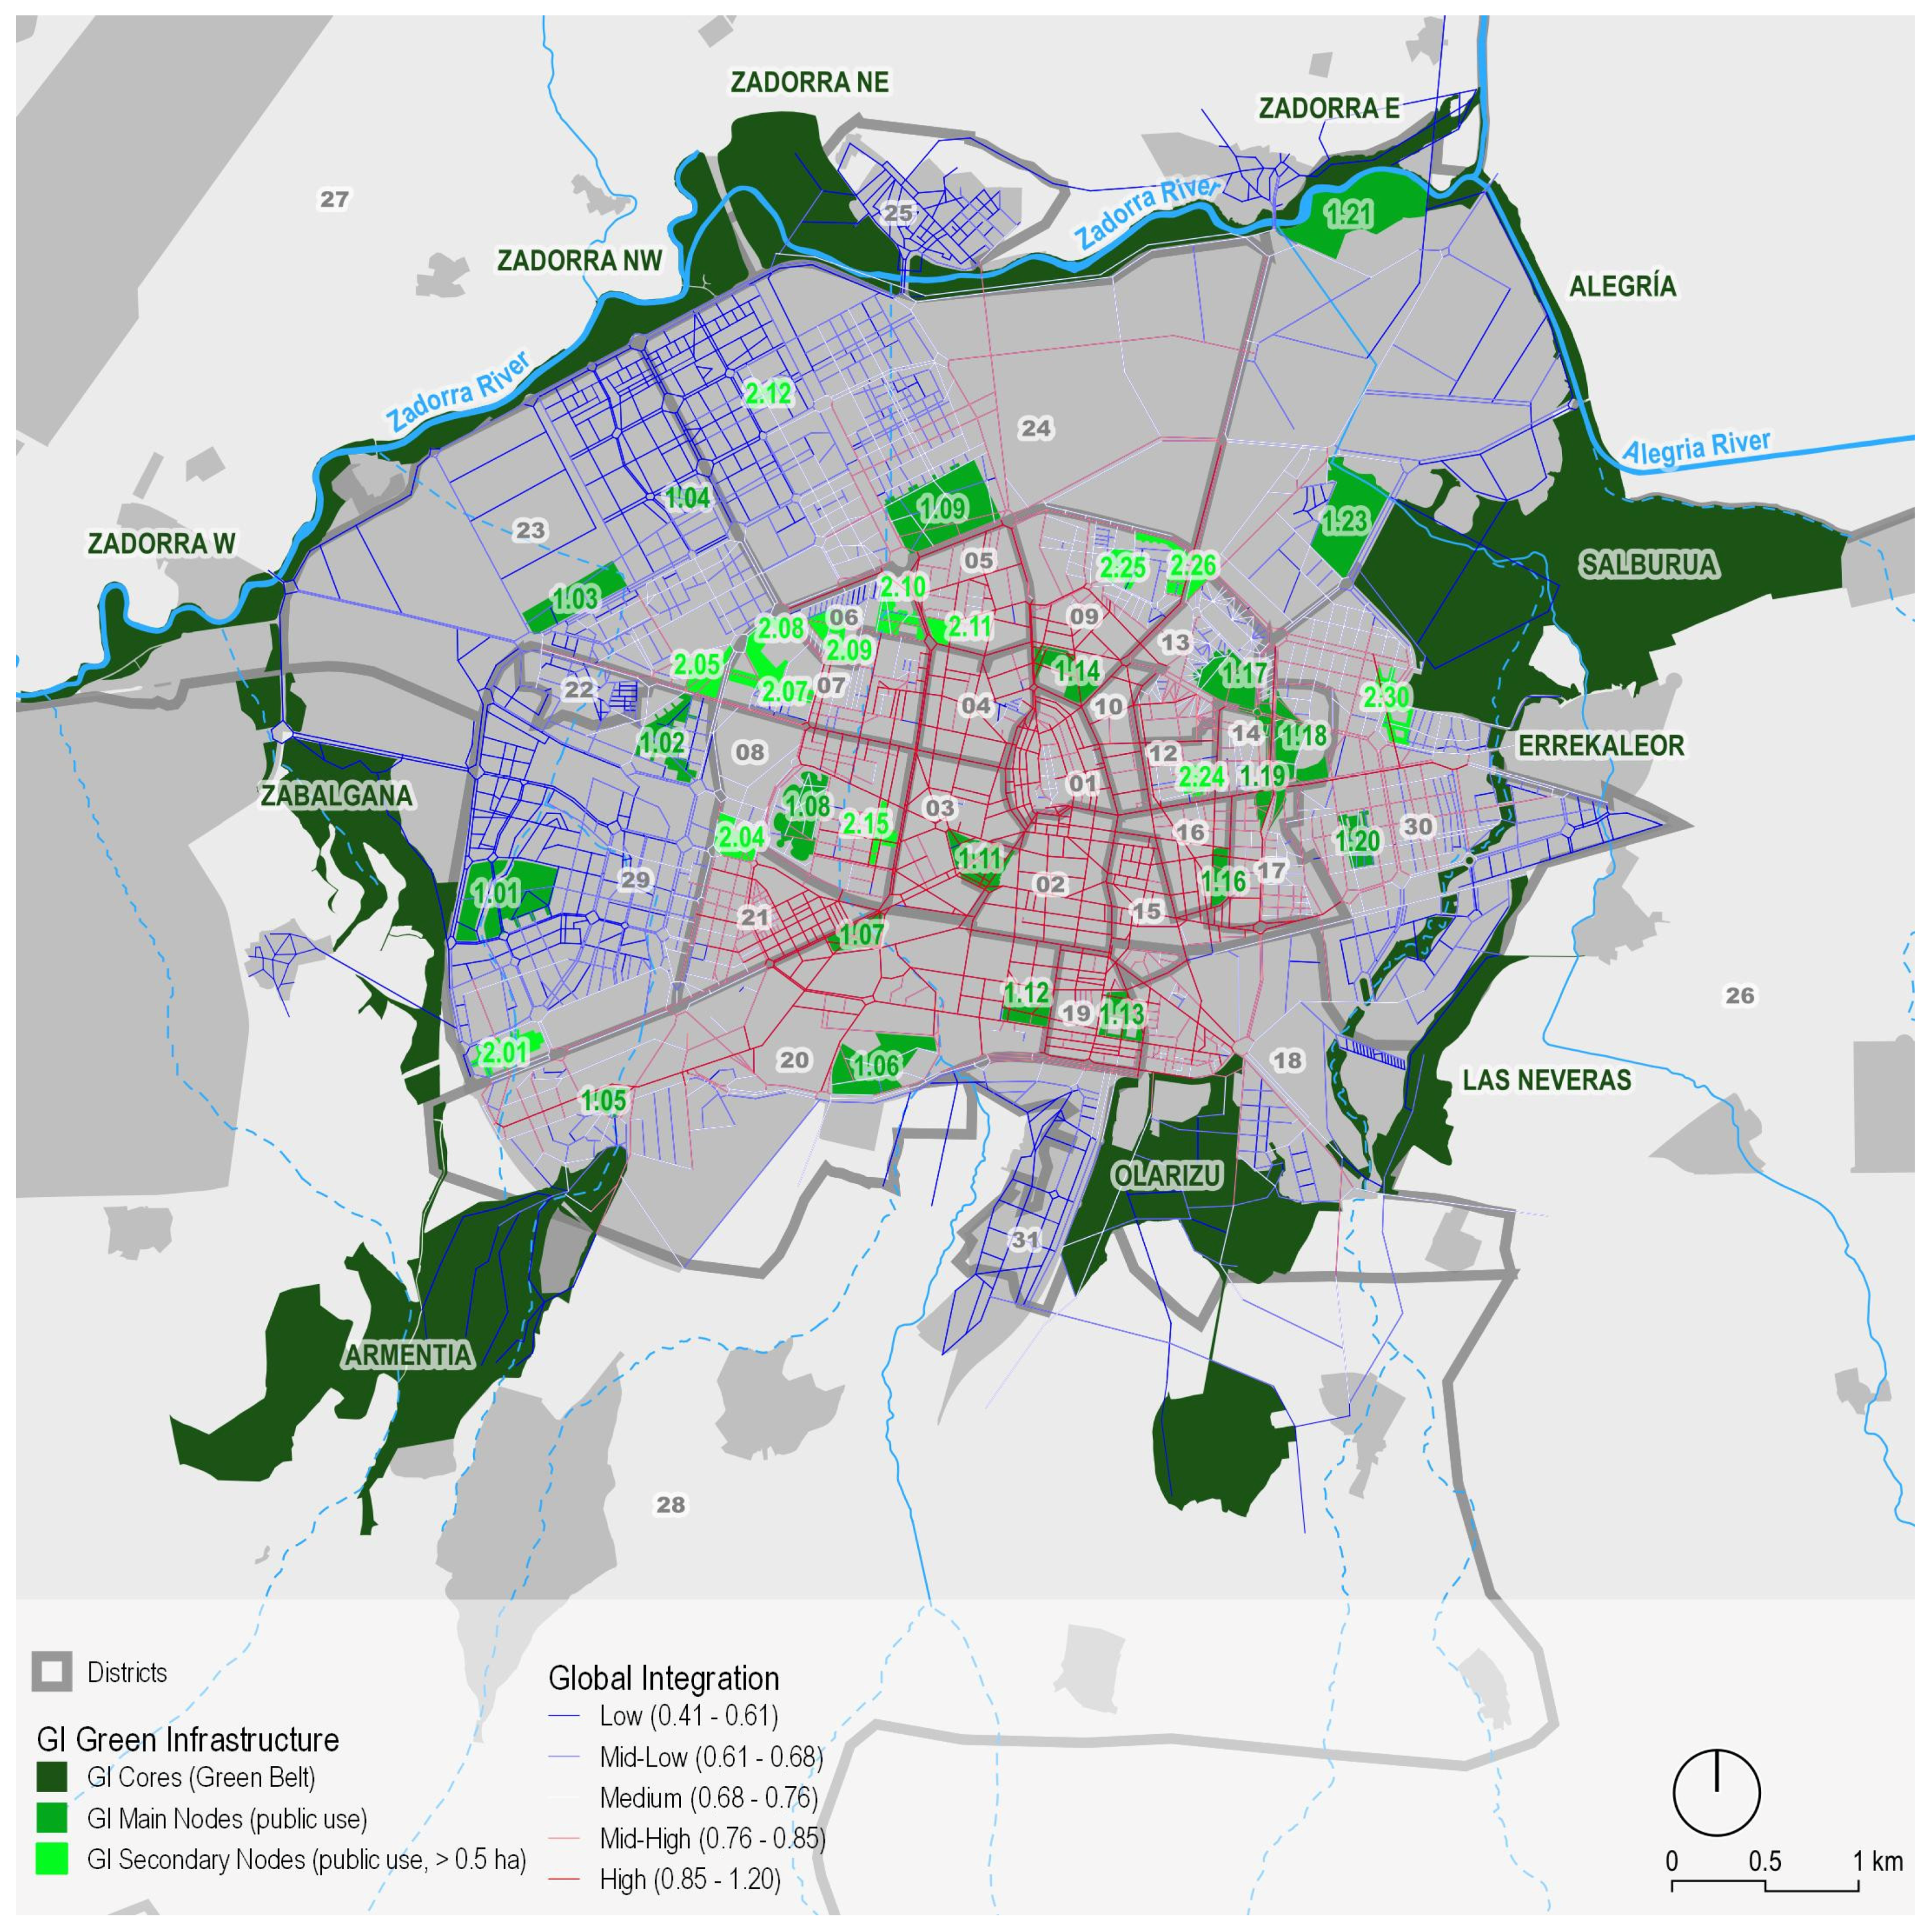
Once the global integration of each element of the pedestrian network of Vitoria-Gasteiz had been analyzed, the elements were grouped into five categories (high, mid-high, medium, mid-low, and low), which correspond to quintiles based on their degree of global integration.
Figure 8 shows those with higher values (higher spatial accessibility) in red and those with lower values (lower spatial accessibility) in blue. Generally, central areas show the most integration, while peripheral zones exhibit lower global integration. However, some notable exceptions exist. The main radial arteries along which Vitoria-Gasteiz expanded demonstrate high or mid-high values, indicating greater integration than adjacent segments even in peripheral areas. The industrial areas in the northeast and southeast parts of the city show low integration, but higher than the residential districts in the western and northwestern areas.
While the central part has high global integration, Old Town’s core (02) does not.Part of the historic district has medium integration, and several segments appear in white. The medieval city was founded on top of a hill in the style of the French bastides with three almost parallel longitudinal north–south streets. Over the following centuries, it expanded first towards the west through the construction of three new streets and later towards the eastern slope with the addition of three more streets. The east–west connections made through the narrow alleys are limited and have a great distance between them, resulting in low accessibility in this part of the Old Town. The lower presence of cantons on the eastern side of the hill leads to even lower integration.
In the analysis of global integration, some wide streets or large avenues that function as articulators of the city’s road network show a high level of integration. This is the case of Avenida de Vitoria-Gasteiz, which marks the division between the districts of El Pilar (05) and Gazalbide (06), Coronación (04) and Txagorritxu (07), and Lovaina (03) and San Martín (08). In the periphery, the districts with the lowest global integration are Arriaga-Lakua (24), Ali Gobeo (22), Zabalgana (29), Goikolarra (31), and the outermost area of Salburua (30). On the contrary, the adjacent part of Salburua (30) to the Santa Lucía district (17) shows a good level of integration.
Furthermore, it can be observed that the major avenues that have served as articulating axes for the city’s growth exhibit a high level of integration. This is evident, for instance, in the case of Avenida de Santiago, which acts as the northern boundary of the Santa Lucía district (17) and extends into the Salburua district (30).
The smaller local entities on the periphery also show very low integration. In the case of the northern ones, their location on the other side of the Zadorra River, which constitutes a geographical barrier with very few crossing points, diminishes their spatial accessibility. In the case of those in the east (such as Ali-Gobeo (22)), the most recent developments in the Zabalgana district (29), adjacent to the previous urban fabric of the historic original settlement, are quite disconnected. While Ali-Gobeo preserves the formal characteristics of a small rural settlement with a series of housing developments built during the expansion period of Vitoria-Gasteiz in the 1960s, the contemporary developments present a low-density urban fabric with open blocks of medium-height buildings and large unconsolidated interstitial spaces.
The Errekaleor area, situated within the Adurza district (18), has remarkable characteristics. This old residential zone between the Errekaleor River and Las Neveras was originally built in the 1960s with the purpose of accommodating the immigrant population. A narrow access road also connects it to the Uritiasolo Industrial Park. Errekaleor is now Spain’s largest squatted district, comprised of elongated, narrow, three-story freestanding blocks aligned and separated by small open spaces. It also features a central square and a minor green area and borders a small southern boulevard. Due to its configuration and morphology, Errekaleor has poor global integration.
3.2. Local Integration of the Pedestrian Network
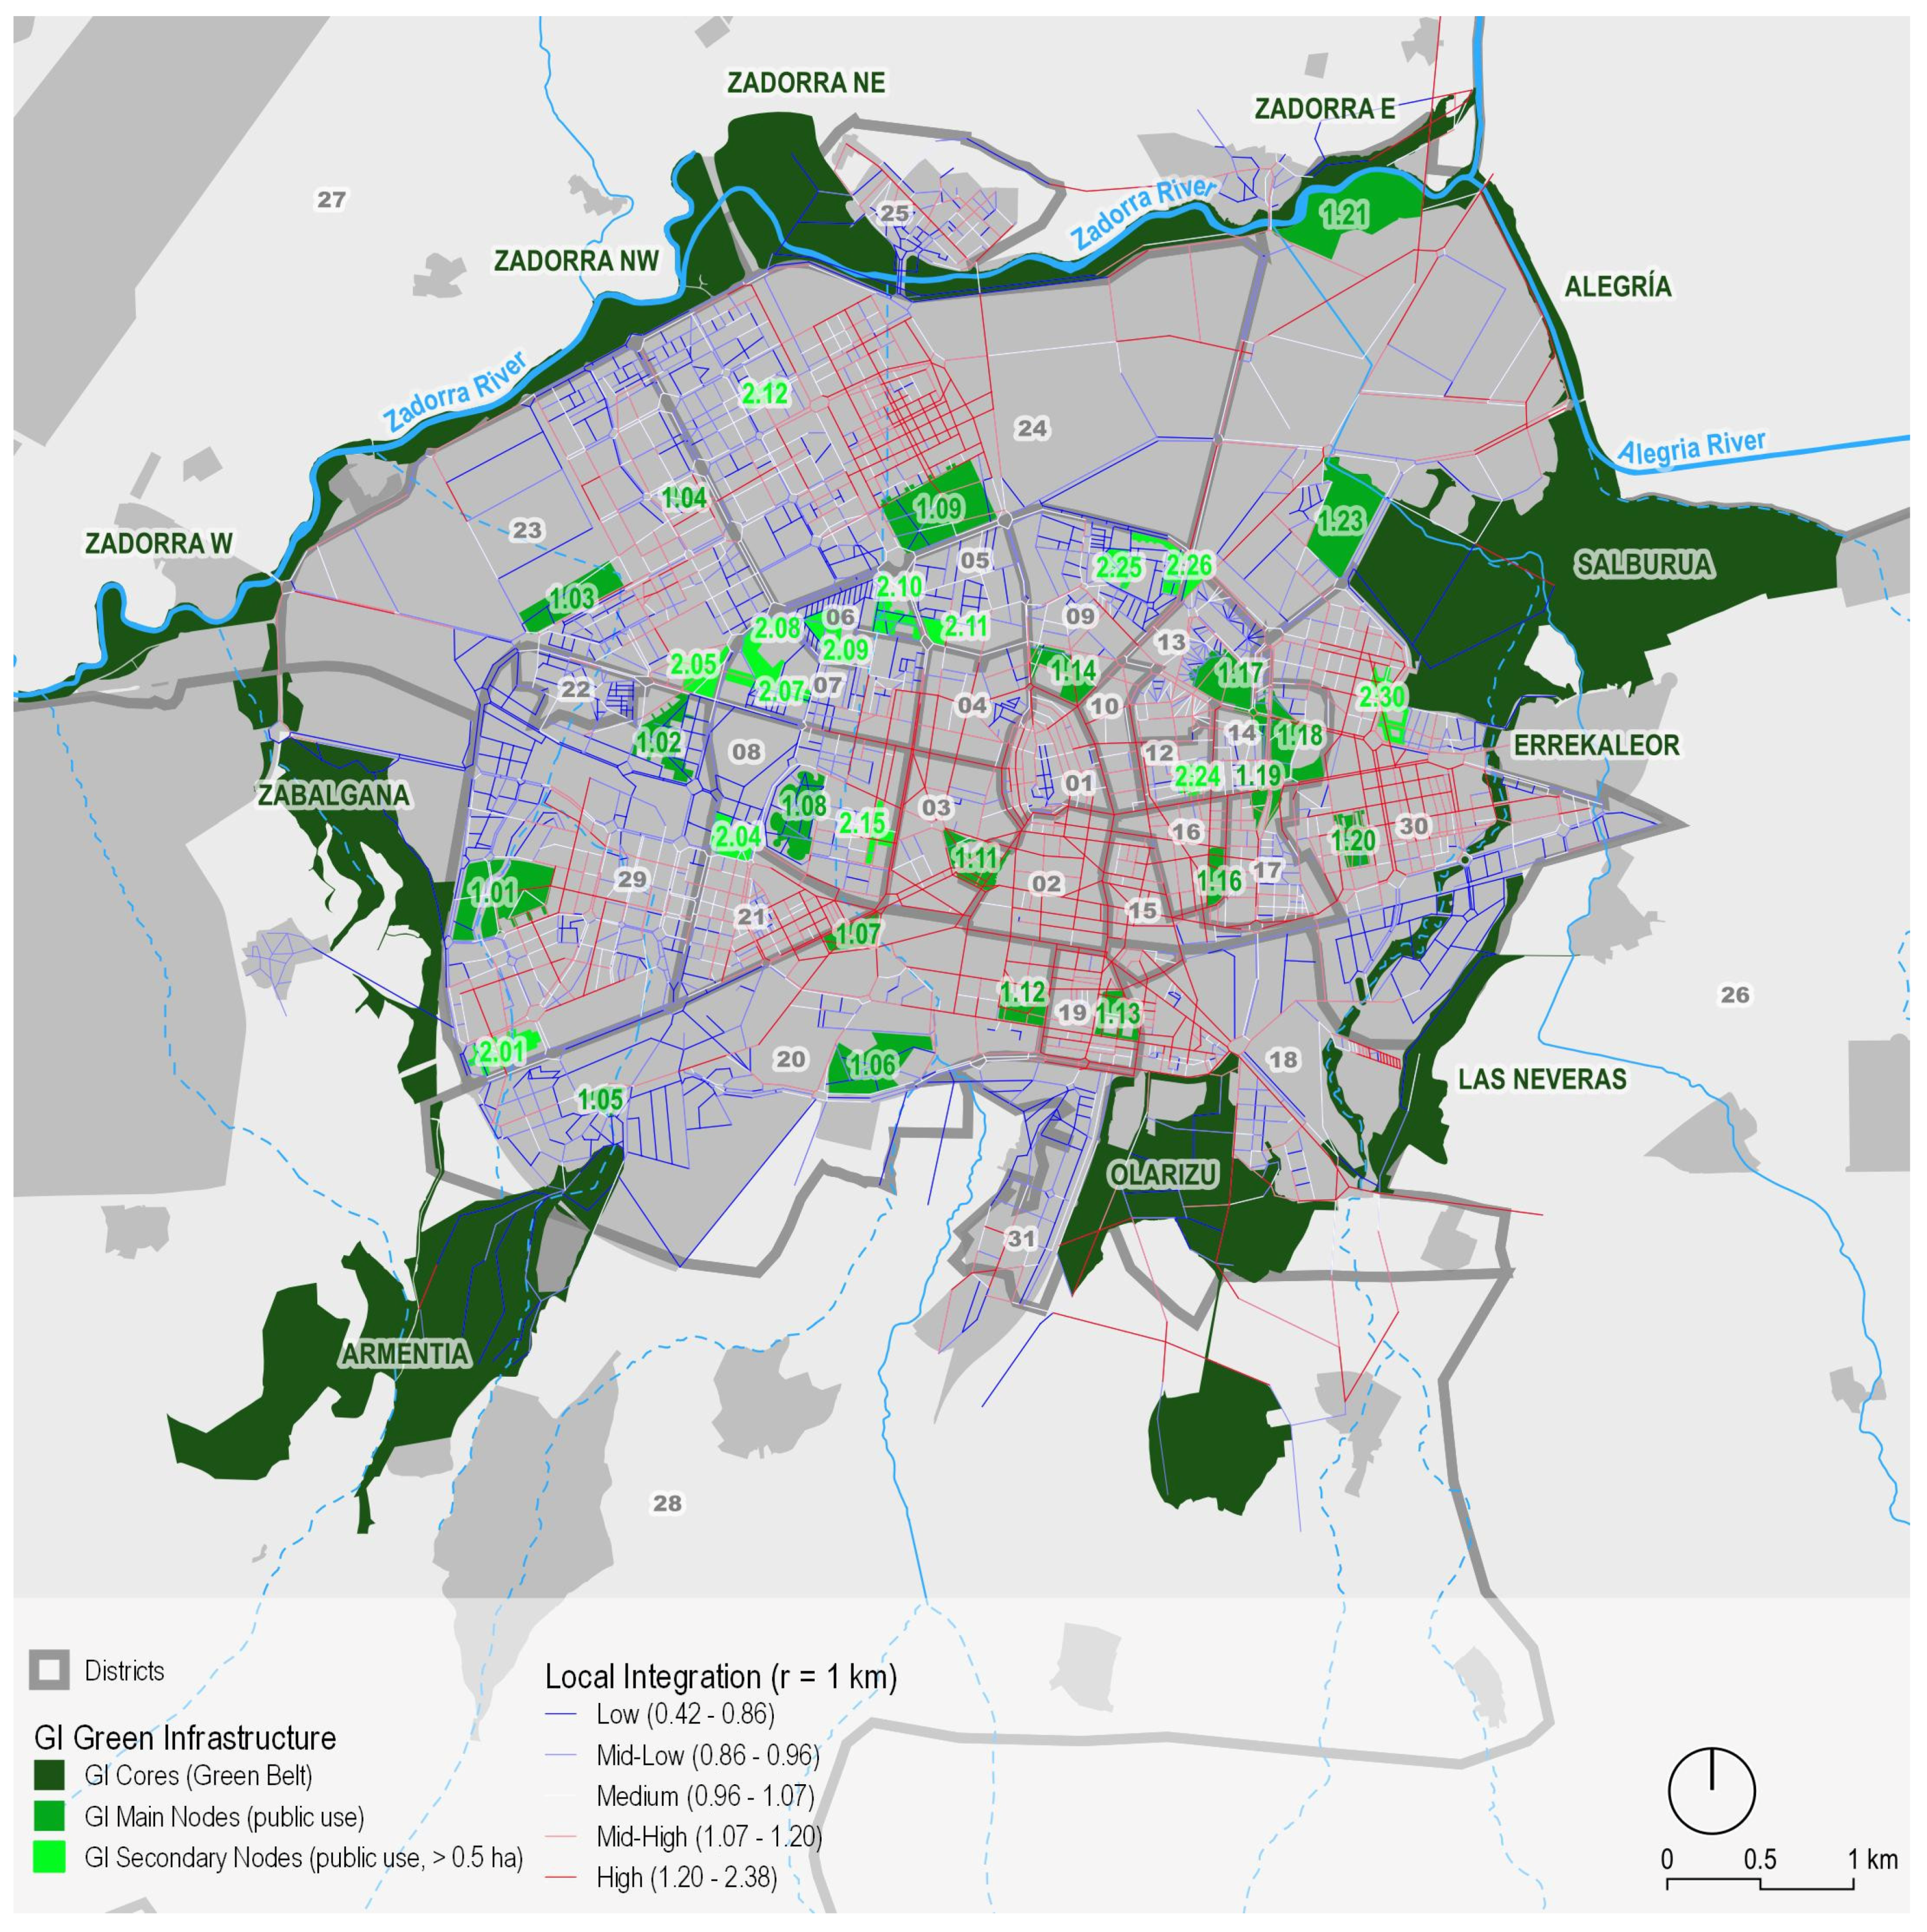
The analysis of local integration (which includes the elements within 1 km of each element of the network, as described in the
Section 2) shows, in general, that the eastern part of the city is more integrated than the western part (
Figure 9). The western districts (e.g., Desamparadas (15), El Anglo (10), Judimendi (16), Santiago (12), Arana (14), and Santa Lucía (17)) are comparatively more compact, which allows for a greater number of street intersections and a more accessible configuration. In contrast, the more peripheral areas and, especially, the industrial parks, which showed low global integration, also show low levels of local accessibility. In contrast, the residential areas of the new districts (also peripheral) are more accessible at the local level. This is especially visible in the Zabalgana district (29), where there are areas with very low global integration but very high local integration. Something similar occurs in Salburua and Arriaga-Lakua (24), where several areas with high local integration are identified.
The analysis of local integration in Arriaga-Lakua (24) highlights the contrasts between its eastern and western parts. The eastern part, characterized by older constructions, a higher density of houses, and taller rationalist blocks, differs from the western part, which was built more recently and features a greater abundance of open spaces and houses arranged in blocks.
Notably, the Errekaleor sector stands out due to a significant disparity between local and global integration, with local integration surpassing global integration. As previously mentioned, this discrepancy can be attributed to the aligned arrangement of housing blocks and the layout of streets and interior open spaces, which facilitates the attainment of these elevated levels of local integration.
Around the Old Town, the western streets present a low local of accessibility, while the eastern ones show greater integration. The heart of the Old Town, which presents low global integration, also turns out to be barely accessible from a local perspective. In the western part of the Ensanche, a housing state known as Las Conchas (1.08) at the end of the San Martín district (21) also shows a lower level of local accessibility than global accessibility. This area of the city has a rather unique configuration, with a set of open blocks that form a semicircle in the San Martín Park.
Other areas, such as Errekaleor, Abetxuko, the San Prudencio housing group in Armentia, and the IMOSA workers colony in Ali-Gobeo (a local entity that has been absorbed by the Zabalgana district (29)), which emerged as marginal enclaves on the outskirts of Vitoria-Gasteiz in the 1950s and 1960s [
52], have very low global and local accessibility. These urban developments were located in poorly connected and distant areas from the city, with planners seeking cheap land prices to enable the construction of affordable housing for the new immigrant workers arriving in the city. Even today, they all still share this poor integration despite the notable differences in their urban fabric, which ranges from garden suburbs dominated by semi-detached houses to modernist residential districts where blocks prevail.
In this case, the Abetxuko district (25), which emerged in the 1960s on the other side of the Zadorra River with the intention of accommodating the immigrants welcomed by the city, demonstrates relatively better local integration compared to global integration. Specifically, El Cristo Street, one of the widest streets in the district and the route taken by the tram, plays a significant role in achieving a high level of local integration.
Aside from this exception, the analysis of local integration shows that the configurations of the street and pedestrian networks are interconnected in terms of the types and forms of the buildings and blocks; thus, there is a relationship between the latter and the spatial accessibility of different urban patterns. In general, the areas with greater integration show enclosed city blocks and higher buildings, while in the areas with lower local integration, single-family dwellings and building blocks of less than five floors predominate. The industrial areas on the periphery, i.e., districts 18, 22, 23, and 24, have worse local accessibility than the residential areas in the same districts, mainly due to the higher density of streets and pedestrian pathways in the residential areas.
In sum, considering the results of the integration analysis both at a global and local level, the most integrated areas are the districts that occupy central locations, especially those to the east. These districts have gradually grown from their more central part towards the periphery during the second half of the 20th century. They are dominated by closed blocks of mid-rise buildings, although there are also higher modernist blocks in those districts that were built in the 1980s.
In contrast, the least integrated areas, locally and globally, are the most recent suburbs and those settlements with lower housing density. Many of these areas have abundant public housing, such as in Sansomendi (23) and Zabalgana (29), where a significant number of social housing units are concentrated in the farthest and adjacent ends of both neighborhoods. However, the borders between Zabalgana and Sansomendi and the outer edges of the city in those neighborhoods have the lowest integration. The garden suburb of Armentia in the Mendizorrotza district (20), home of the upper classes, is a significant exception.
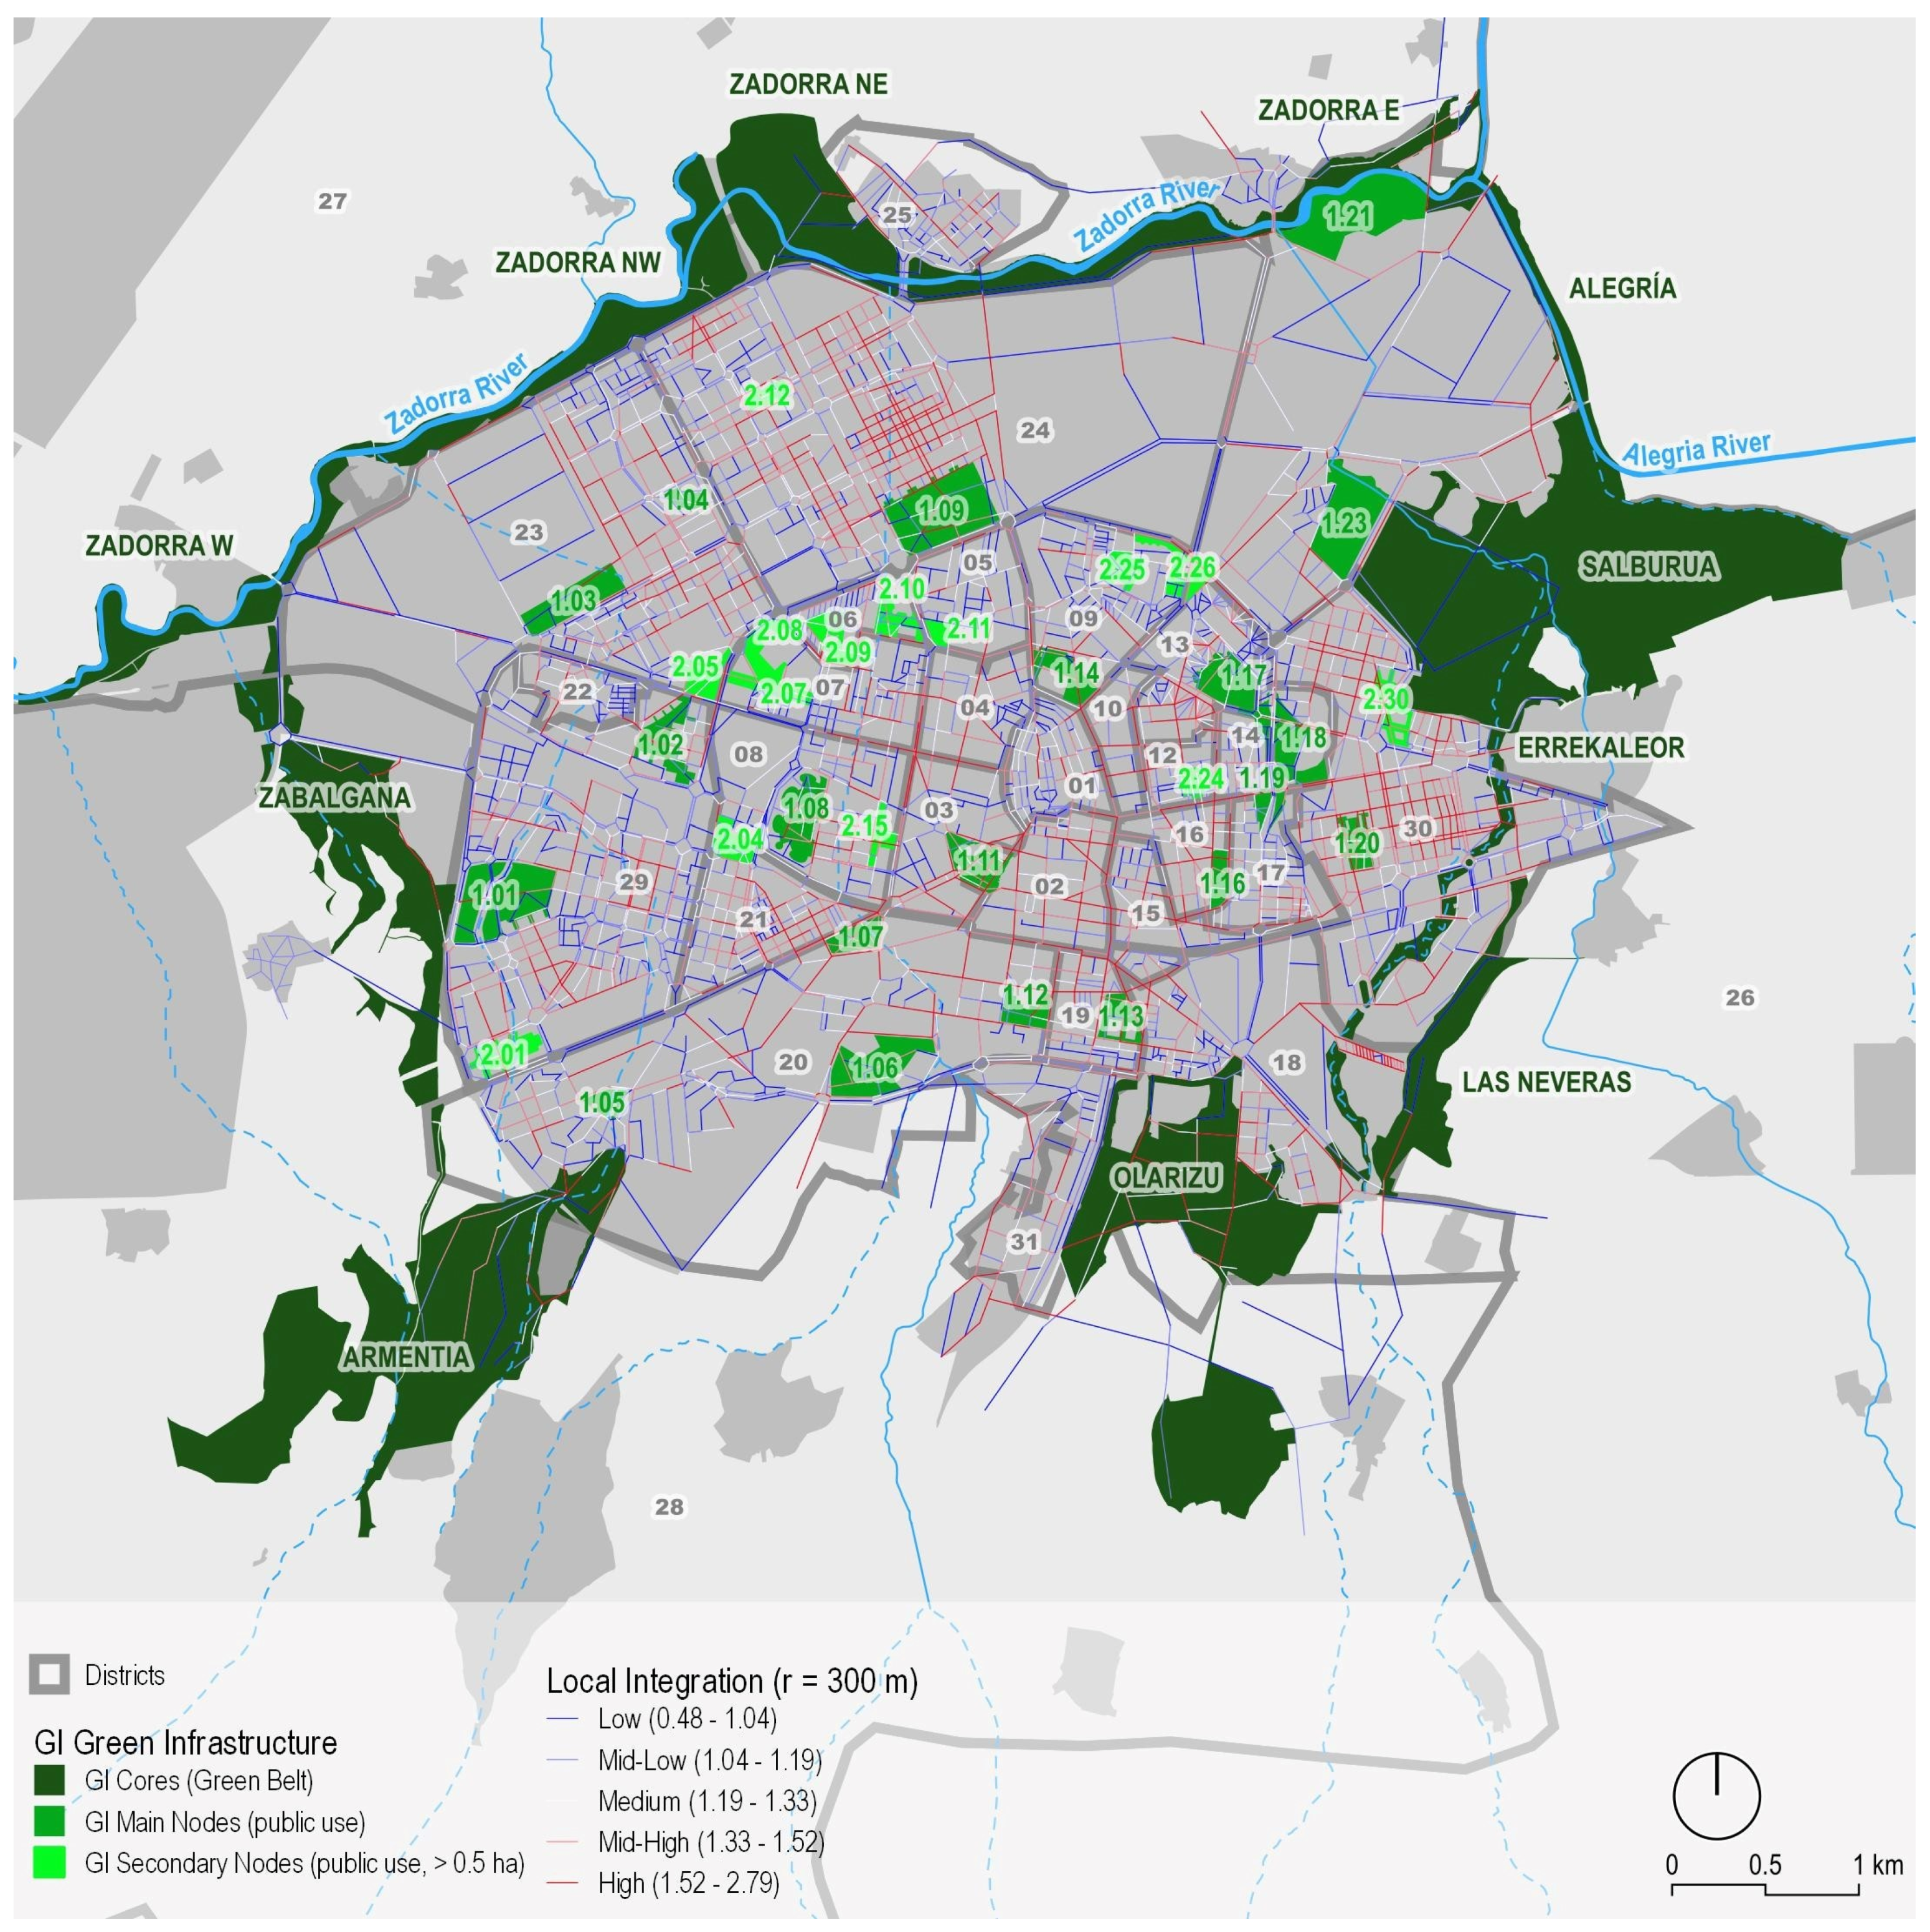
When we analyze local integration with a 300 m radius (
Figure 10), the importance of the density and connectivity of the pedestrian network in enhancing configurational accessibility shows its relevance. This is particularly notable in the densely populated inner areas. In this sense, districts like the Old Town (01) yield lower local integration with a 300 m radius than with a 1 km radius. Conversely, districts like Arriaga-Lakua (24) and Sansomendi (23), situated in the northern part of the city, show better results with a 300 m radius than with a 1 km radius. However, in general, there is a decrease in integration when considering the 300 m radius. In addition, a more detailed analysis can be conducted under the 300 m criterion, revealing that different sections of the same street can exhibit varying levels of integration.
3.3. Spatial Accessibility of the Cores, Main Nodes,, and Secondary Nodes of Vitoria-Gasteiz’s GI
Table 2 provides the dimensions of the 300 m areas of influence around each considered element of the urban GI system of Vitoria-Gasteiz, as well as their global and local (for 1 km and 300 m radii) spatial accessibility. Data analysis shows that the main nodes and secondary nodes have higher integration coefficients compared to the core elements. This finding suggests that these nodes are more extensively connected and integrated within the network.
Overall, the data suggest varying levels of integration for the different green areas, with some areas exhibiting higher integration at both local scales (1 km and 300 m). The comparison between main nodes and core elements reveals that the former, which include parks and primary green areas within the urban fabric, exhibit higher levels of integration compared to the latter, which are the most relevant parks and green areas that constitute the green belt. This higher integration is observed at both a global and local scale. The mean global and local integration values of the cores (iG = 0.73; i1.0 = 1.13; i0.3 = 1.42) are considerably lower than those of the main nodes (iG = 1.77; i1.0 = 2.43; i0.3 = 2.92).
However, Armentia Park (iG = 1.02; i1.0 = 1.19; i0.3 = 1.72) and the central sections of the Zadorra River Linear Park (Zadora NE: iG = 0.99; i1.0 = 1.58; i0.3 = 2.05 and Zadorra NW: iG = 0.85; i1.0 = 1.38; i0.3 = 1.83) demonstrate a notable level of integration both globally and locally. In contrast, Zabalgana Park (iG = 0.43; i1.0 = 0.67; i0.3 = 0.86) exhibits the weakest integration at both the global and local level. These findings are attributed to the limited local integration of Zabalgana on a global scale, as well as the inadequate integration of the residential areas situated west of the Old Town in the analysis of local accessibility. Additionally, the less compact configuration and form of the Zabalgana district (29) can play an important role in conditioning its accessibility,
The main nodes consistently exhibit higher integration levels compared to the core elements. When examining the main nodes, Aranbizkarra (iG = 2.76), Maurice Ravel Gardens (iG = 2.40), Judimendi Park (iG = 2.31), Santa Lucía (iG = 2.24), and El Prado Park (iG = 2.19) stand out as the nodes with the highest global integration. Conversely, Gamarra (iG = 0.42), Michelin (iG = 0.97), Mendizabala (iG = 1.19), Lakuabizkarra (iG = 1.29), and Armentia Fields (iG = 1.33) are the main nodes with the lowest global accessibility, with these areas mainly located in peripheral areas.
The integration levels of the secondary nodes reliably surpass those of the core elements. Their global integration values range from 1.56 to 2.22, indicating further increased integration in the local analysis measures.
In sum, the analysis reveals that parks and green areas situated in the southeastern and eastern parts of the city, along with those in central locations, exhibit higher levels of integration, both on a global and local scale. Additionally, the accessibility of these elements is influenced by their configuration. Larger surface areas in contact with the urban fabric result in greater accessibility. This is exemplified by the Zadorra River Linear Park (0.08–0.11), which borders the northern part of the city. Conversely, elements with a smaller contact area demonstrate lower accessibility, as observed for Armentia Fields (1.05) located in the southwestern region of the city.
3.4. Accessibility to Vitoria-Gasteiz GI
Based on the geographic and demographic data in
Figure 7,
Table 3 provides comprehensive information on GI elements, including details on green areas, 300 m areas of influence, residents served, and residential density. The data are categorized based on different green areas and areas of influence, offering insights into the residential land within each influence area. The color-coded classification further aids in visualizing the distribution of values, classifying them into high, mid-high, medium, mid-low, and low categories based on quintiles.
Analysis of the data reveals significant variations in the characteristics of the GI elements. The range of green areas spans from 0.01 to 218.82 ha, displaying the diversity in size among the green spaces. The 300 m areas of influence also exhibit considerable variability, ranging from 14.7 to 277.8 ha, providing valuable insights into the extent of impact surrounding each GI element. Moreover, the number of residents served by the GI elements shows substantial variation, with a range of 0 to 14,510 individuals, highlighting the varying levels of population impact. The observed differences in residential density further contribute to the overall variations, reflecting distinct values for green areas, influence areas, and residential areas, thereby indicating the varying concentration of residents in relation to these parameters. These findings underscore the complexity and diversity of the GI elements within the studied area, emphasizing the need for a nuanced understanding of their characteristics and implications.
Regarding the secondary nodes, Gerardo Armesto Park (2.14) stands out as the one with the highest residential density in various categories. Notably, it exhibits the highest residential density by green area, with a substantial value of 14,484. Furthermore, it also attains the highest residential density by influence area, recording a notable value of 280. Moreover, in terms of residential density by residential area, Simón Bolivar Square (2.24) emerges as the frontrunner, boasting a significant value of 299. These findings shed light on the concentrated population and the presence of high residential density within these specific secondary nodes.
Finally, when considering the influence areas of the cores and main nodes (
Figure 11), it becomes apparent that most of the city enjoys accessibility within a fifteen-minute distance. Upon closer examination of the influence areas of various GI elements, it is evident that a 1 km radius, adhering to the principles of the 15 min city, would ensure extensive coverage and accessibility to the key features of the green belt throughout most of the city. Nevertheless, there are specific areas that lie beyond this coverage. These include a small portion of the Arkaiate sector located on the outskirts of the Salburua district (30), a significant segment of the recently developed Goikolarra district (31), and a minor section of the Abetxuko district (25).
When considering a closer level of accessibility, specifically within a 300 m radius, the coverage significantly decreases, highlighting the importance of secondary and primary nodes in ensuring proximity to GI within the city. These nodes play a critical role in providing residents with access to green spaces within a shorter distance, thereby contributing to a more sustainable and livable urban environment.
In this case, a substantial portion of the Ariznabarra (21) and Zabalgana (29) districts, as well as sections of the Old Town (01) and Ensanche (02), lack convenient access to nearby green spaces. Furthermore, specific areas within the Coronación (04), Arriaga-Lakua (24), and Sansomendi (23) districts exhibit below-average levels of accessibility to green areas.
Table 4 provides valuable insights into the level of integration within the Vitoria-Gasteiz urban area by examining the proximity of residents to different types of GI nodes. It provides the areas and the amount of the population that are not within 300 m and 1 km from the most relevant elements of the GI, both in absolute numbers and in the percentage they represent over the total urban area and total population, respectively.
Regarding population, the analysis revealed that 89.2% of the population lives more than 300 m away from a core element, indicating limited proximity to the green belt parks for most residents. Conversely, almost half of the people (47.6%) live close to a GI main node, making them one of the most accessible GI elements. The secondary nodes, which are within close reach of only 28.5% of the residents, do complement the main nodes quite well, as only one third of the population (33.7%) does not live within 300 m of any of them. The core elements do not work as effectively in combination with the main nodes, as almost half of the people (44.8%) are not close enough to any of them. Actually, the peripheral condition of the green belt means that when added to the main and secondary nodes, the population that is not close enough to a green area is not significantly diminished, being reduced from 33.7% to 27.7%, i.e., only five percentage points.
These statistics serve as a valuable tool to evaluate the actual proximity of residents to the different elements of the GI (cores, main nodes, and secondary nodes), thereby indicating their effectiveness in serving the people. It is relevant to compare the percentage of the population without access to green infrastructure within a distance of less than 300 m or 1 km, and the percentage of areas located at a distance greater than 300 m or 1 km from green infrastructure. The discrepancies are significant in most cases, showing differences ranging from 15 to 27 percentage points. Conversely, both the areas and the amount of the population that are not within 300 m of a GI core/main node (42.2% and 44.8%, respectively) and the areas and population not within 300 m from a GI core/main/secondary node (33.6% and 27.7%, respectively) show relatively similar percentages. However, these generally significant differences between the percentages of underserved areas and the underserved population stress the importance of considering the distribution of residents to evaluate their actual accessibility to green areas.
The generation of maps such as the one shown in
Figure 11 is very useful to orientate future planning and development of the GI. It not only identifies the urban areas that are not within 300 m from a relevant GI element, but also, thanks to the residential densities displayed, allows planners and decision makers to anticipate where would be more relevant to introduce new green areas or expand or intensify already existing ones, such as central and densely populated districts like the Old Town (01), Ensanche (02), Coronación (04), and Desamparadas (15).
4. Discussion
The primary objective of this study was to examine the accessibility of Vitoria-Gasteiz’s GI network by focusing on its key elements, such as cores and main nodes. By employing quantitative and cartographic analysis based on the pedestrian mobility network, the study investigated configurational accessibility at both global and local scales, as well as distance-based accessibility. The identification of green area accessibility in different parts of the city, along with variations in the level of accessibility, provides valuable insights for future city planning. Given the direct impact of access to green spaces on citizens’ quality of life, proper planning and development of this infrastructure and of public spaces is crucial for achieving greater spatial justice.
The analysis highlights the influence of urban form on the accessibility of the GI system, particularly the configuration of the pedestrian network. Generally, on a global scale, the city center demonstrates higher integration (except for the core of the medieval Old Town) compared to the peripheral districts, as expected. However, the analysis reveals the relative inaccessibility of the medieval Old Town core and the greater integration of the eastern part of the city compared to the west side. This disparity can be attributed to the denser and more connected urban fabric in the east, as well as the presence of large urban blocks and areas that impede pedestrian flow, such as the Seminary and Txagorritxu Hospital, and the network configuration of certain western parts, including the C-shaped blocks in polygon 8 of San Martín (08) and the design of San Martín Park (1.08) itself.
The substantial number of main nodes distributed evenly throughout the city ensures that almost every resident of Vitoria-Gasteiz lives within less than 1 km of an urban green area. However, when considering their local integration, significant differences arise. It is essential to understand these spatial accessibility variations because spaces located at the same distance can differ significantly in terms of their actual reachability to people.
The analysis has identified two peripheral residential areas in the city, namely the Arkaiate sector in the Salburua district (30) and the more exterior district of Goikolarra (31), which face limited pedestrian accessibility to nearby green spaces. To address this issue, it is recommended that future development plans take into consideration the establishment of the green belt or the creation of new green areas near these locations. The findings of this analysis provide valuable guidance for public decision makers to optimize the design of the GI network. For instance, the planned Larragorri Park, located in the southern part of the city and adjacent to the recently developed Goikolarra district (31), is expected to mitigate limitations in GI access within that area. However, it is important to acknowledge that the Arkaiate sector, located farther away from the center within the Salburua neighborhood (30), will still require the provision of nearby green areas.
It is noteworthy that the green areas with lower integration are typically concentrated in districts with lower incomes, except for the Mendizorrotza district (20) in the southwest. This district primarily consists of single-family homes with gardens and gated communities that cater to the upper classes. Despite the income disparity, evaluation of GI accessibility reveals that the district has high accessibility to both the green belt and other main nodes. Furthermore, it is essential to consider that the study does not account for the private gardens of homes in the area or the concentration of sports centers, which further contribute to residents’ access to green spaces and recreational areas.
The distribution of green spaces in Vitoria-Gasteiz is not equitable, resulting in unequal opportunities for the population to access and enjoy these spaces, as happens in other cities [
7,
15,
19]. Access to services plays a crucial role in understanding equity from a social perspective, and the level of accessibility to GI serves as an important indicator of its effectiveness [
53]. To address the potential degradation and marginalization of lower-income districts, it is essential to focus on areas with lower integration, as spatial segregation often reinforces barriers to accessing public spaces [
54]. Moreover, considering the benefits offered by GI [
5,
8,
11,
20], ensuring equitable access to these green spaces is crucial due to their direct impact on the quality of life of the population [
55].
While areas with poorer street integration have been identified, such as industrial estates or peripheral residential sectors, Vitoria-Gasteiz overall provides adequate accessibility to its GI. In fact, despite some imbalances, nearly all residential areas have access to green spaces. Spatial syntax tools can be employed to address these imbalances and offer recommendations or guidelines for urban design [
56]. In certain areas, interventions can be made in the street network to create new intersections or improve pedestrian passage where it is currently limited. The implementation of traffic-calming measures, the introduction of additional crosswalks, and the implementation of planned superblocks are measures that can reconfigure the street grid and enhance the integration of GI elements.
Furthermore, considering the impact of the urban fabric configuration on accessibility, it is essential to acknowledge that future urban developments in the city may lead to transformations in street integration and, consequently, accessibility. In fact, future urban planning actions that reshape the accessibility model can result in functional, social, and economic changes in the short, medium, or long term. Therefore, incorporating spatial syntax analysis as a preliminary step in urban planning is a perspective that should be considered [
42].
One limitation of this study is the omission of sociodemographic variables that would have allowed us to not only investigate the number of residents with and without access to relevant green areas, but also to better characterize those groups. The pedestrian network model includes all segments that are available to pedestrian movement but does not consider characteristics that might affect their walkability, such as slope or surface conditions. Walkability to a green area, and thus its actual accessibility for each person, might also depend on individual personal factors like feelings of insecurity or comfort that can contribute to lower visitation rates. Future research could incorporate these perspectives to gain a better understanding of the accessibility and utilization of different elements within the GI system.
5. Conclusions
This study analyzed the accessibility of Vitoria-Gasteiz’s GI network and key components through quantitative and cartographic analysis focusing on pedestrian mobility. Disparities in green area distribution were identified, highlighting the need for equitable access. Urban design recommendations were proposed to improve GI integration in areas with limited accessibility.
Overall, Vitoria-Gasteiz provides adequate GI access, though imbalances exist, particularly in industrial and peripheral residential areas. The analysis provided here demonstrates how the layout of the urban environment, especially the pedestrian network, affects GI accessibility. Reconfiguring the street network and promoting greater integration of GI elements through spatial syntax tools and urban design interventions can address these disparities.
Although most residents live within 1 km of green areas, variations in local integration were observed. Two peripheral residential areas were identified as lacking pedestrian accessibility, highlighting the need for new green areas nearby. It is crucial to ensure equitable access to GI to prevent the degradation and marginalization of lower-income districts. Future urban planning should recognize the transformative potential of accessibility models in order to realize functional, social, and economic changes. Further research incorporating sociodemographic factors and sustainable transportation modes could deepen understanding of GI accessibility and guide future development.
This study underscores the significance of considering GI accessibility in urban planning processes. Access to green areas directly affects residents’ quality of life and well-being, emphasizing the need for proper infrastructure planning and design. The findings reveal variations in accessibility across different areas of Vitoria-Gasteiz, with the city center demonstrating higher integration and the medieval Old Town core presenting challenges. This research provides valuable insights towards achieving spatial justice by guiding future planning initiatives to improve accessibility to green spaces and ensure equitable distribution throughout the city. Furthermore, the study highlights the importance of incorporating sociodemographic variables, analyzing all elements of the GI network, and exploring alternative modes of sustainable transportation in future research.
Future research could explore the significance of considering impervious space alongside green space when assessing urban environmental needs. Additionally, investigating the diverse types of green spaces (including private gardens) and their respective impacts is crucial. Understanding how subjective factors such as feelings of insecurity or unfamiliarity influence green space accessibility is also an important area for further investigation. Investigating green space accessibility from both a physical distance perspective and the perceived safety aspect is another avenue for future research. Moreover, examining how sociodemographic characteristics such as age, income, and race/ethnicity influence the perception and use of green space can contribute to a more comprehensive understanding of urban environmental dynamics. To achieve these goals, utilization of ArcGIS Network Analyst to incorporate demographic, economic, and road/path quality factors in green space studies could provide valuable insights.
Finally, to complement this study, another potential research direction could explore other sustainable modes of transportation, such as public transportation and bicycles. Vitoria-Gasteiz boasts a dense network of bicycle paths that connect the parks of the green belt. Analyzing the integration of this network of routes and paths within the parks would provide valuable insights for future development and retrofitting initiatives. To promote sustainable mobility in Alava and encourage recreational and active tourism activities in rural areas, it is important to consider the broader-scale connection of the GI.


