Article

War and Deforestation: Using Remote Sensing and Machine Learning to Identify the War-Induced Deforestation in Syria 2010–2019

by
Angham Daiyoub
1,
Pere Gelabert
2,3,
Sandra Saura-Mas
1,4 and
Cristina Vega-Garcia
2,3,*
1
CREAF (Center for Ecological Research and Forestry Applications), 08193 Cerdanyola del Vallès, Spain
2
Department of Agricultural and Forest Engineering, University of Lleida, Avenida Alcalde Rovira Roure 191, 25198 Lleida, Spain
3
Joint Research Unit CTFC-Agrotecnio, Ctra. Sant Llorenç km.2, 25280 Solsona, Spain
4
Ecology Unit, Department Animal Biology, Plant Biology and Ecology, Autonomous University Barcelona, Building C, UAB Campus, 08193 Cerdanyola del Vallès, Spain
*
Author to whom correspondence should be addressed.
Land 2023, 12(8), 1509; https://doi.org/10.3390/land12081509
Submission received: 3 July 2023 / Revised: 24 July 2023 / Accepted: 26 July 2023 / Published: 28 July 2023
(This article belongs to the Special Issue Feature Papers for Land Planning and Architecture Section)

Abstract

:
Armed conflicts and other types of violence are key drivers of human-induced landscape change. Since March 2011, Syria has been embroiled in a prolonged and devastating armed conflict causing immense human suffering and extensive destruction. As a result, over five million people have been forced to seek refuge outside the country’s borders, while more than six million have been internally displaced. This study focuses on examining the impact of this conflict on forest cover by identifying the drivers of forest change. To assess this change, Landsat and PALSAR imagery were used to differentiate between forested and non-forested areas. Spectral information was synthetized using the Tasseled Cap transformation and the time series data was simplified and despiked using the LandTrendr algorithm. Our results show that between 2010 and 2019 there was a substantial decrease of 19.3% in forest cover, predominantly concentrated in the northwestern region of Syria. This decline was induced by the armed conflict, with several key drivers contributing to the decline, such as illegal logging activities conducted by both locals and refugees living in nearby forest areas. Drivers such as proximity to refugee camps, roads, and settlements played an important role in producing this change by facilitating access to forests. In addition, the occurrence of explosive events such as bombings and shelling near forests also contributed to this decline by causing forest fires. To mitigate further deforestation and reduce dependence on forests for fuel, it is crucial for local governments in the post-conflict period to offer sustainable alternatives for heating and cooking to both the local populations and refugees. Additionally, governments are recommended to enforce strict laws and regulations to protect forests and combat illegal logging activities. These measures are essential for preserving and restoring forests, promoting environmental sustainability, and ensuring the well-being of both displaced populations and local communities.

1. Introduction

Landscape dynamics are triggered by both ecological and anthropologic factors; as a result, they can be thought of as the combined effect of natural events and human activities on the environment. Changes in vegetation cover can generally be attributed to human-caused climate change, as well as land-use change drivers such as fires and overgrazing, both of which might have a substantial impact on the world’s ecosystems [1,2,3,4,5].
Armed conflicts and warfare are among the most intensive and far-reaching human activities that can contribute to environmental damage and are key factors of human-caused landscape change [6,7]. Several studies have been conducted to highlight the impacts of armed conflicts and warfare on landscape change and to raise the concerns about the environmental repercussions of wars. For example, warfare activities such as the ruin of the landscape through carpet bombing, the slaughter of wildlife, and the use of biocides can all have disastrous environmental consequences and cause human suffering [8,9,10]. Warfare training activities, while essential for military readiness, can have severe environmental consequences, including vegetation removal and alteration, accelerated rates of soil erosion, increased soil compaction, and loss of wildlife habitats [8,9,10].
The role of armed conflicts in forest degradation is still not clear. Although wars almost always have devastating effects on people, they might also have negative and positive impacts on forests [11,12]. For example, armies burn forests to clear space and improve visibility to spot enemies and for soldiers to hunt wildlife for food [13,14]. Modern wars, particularly intranational conflicts, often play out in remote areas where armed factions seek the cover offered by deep forests, mountains, and other landscapes [12,15]. Protected-area boundaries lose effectiveness in this context, usually resulting in the evacuation of field staff and the suspension of conservation activities [16].
Some of the examples of positive consequences of wars on forests are that they may discourage the conversion of forests into pastures, as ranchers may fear being abducted or losing their livestock. Similarly, timber companies may limit their investment in such areas to avoid risking damage or loss to their expensive machinery [12,15].
Large concentrations of refugees and displaced people can put huge pressure on the local environment as they move to new areas to hunt, fish, and remove trees for building their houses and firewood, rapidly depleting such resources [13,17]. The impacts appear to be shaped by the use of natural resources near settlements, following large displacements of residents who had previously dispersed across the landscape during the war [18].
In Afghanistan and during the Afghan–Soviet war, numerous air raids caused massive and long-lasting wildfires in the woods of Paktia and Kunar [19,20]. Overall, the destruction of the forests was the worst environmental consequence of this conflict, with the forest area declining from 3.4% to 2.6% of the land area in less than ten years [19,21]. Refugees and displaced people in Sudan and South Sudan cut down vast areas of forest to obtain fuel supplies and construction materials in the subhumid zones in southern Darfur and Kordofan and over 1 million hectares of forest land were cleared between 2005 and 2010 [14,22,23].
The Mediterranean region has historically been a center of geopolitical warfare. Its distinctive geographical landscape at the crossroads of three continents has connected and divided the domains of influence of major powers in Europe, Africa, and Asia since ancient times. Securitization persisted beyond the East–West conflict and into the twenty-first century, with its complex geopolitical landscapes and shifts connecting numerous scales, players, and security elements [24]. The Mediterranean region experienced about 18 armed conflicts between 1952 and 1995, with 12 of them taking place in North Africa and the Middle East [6]. Several long-term conflicts have made the Middle East and North Africa two of the most unstable areas in the world [25]. Some of these conflicts had an impact on landscape change. For example, Algeria lost about 2 million hectares of forests during the French occupation and 650 thousand hectares of forest were burned between 1956 and 1960 [26,27]. The repetitive armed conflicts in the North of Lebanon were associated with the degradation of 1020 hectares of vegetation. The rate of negative change in plant cover between 2006 and 2007 was at its highest [28].
In March 2011, the devastating armed conflict that erupted in Syria left more than 13 million people in need of assistance, causing the migration abroad of more than 5 million people and displacing more than 6 million people internally in the country [29]. About 1.4 million refugees fled to the Syrian coastline region [30], which comprises 90% of the country’s forests, with forest ecosystems that are vital for carbon storage, timber, biodiversity, and recreational uses [31,32].
Remote sensing technology has become a vital tool in mapping, monitoring, and managing forest resources due to advanced data analysis techniques and improvements in remote sensing science and ecosystem modeling [33]. Prior to the launch of the first satellite in 1972, ecologists were restricted to field-based methods for addressing degradation in tropical forests [34]. Even in the early stages of satellite imagery programs, data accuracy was limited, but, by 1980, satellite imagery was able to differentiate between tree species and forest stands with similar spectral characteristics based on individual habitat preferences [35]. Machine learning approaches, such as the Random Forest (RF) and Support Vector Machine (SVM) algorithms, which can predict target variables with high accuracy, are powerful and commonly used ML techniques in this field. Combining remotely sensed data with field inventories provides the most consistent estimates [36,37,38,39,40].
Remote sensing can be used as a cost-efficient option for assessing degradation through proxies such as canopy cover percentage, with a decreasing trend indicating forest degradation [41]. In conflict areas such as Syria, where field-based methods are challenging due to war conditions, remote sensing by satellite images is an appropriate instrument for analyzing the impact of the conflict on the landscape. Land cover classification with satellite imaging time series has been shown to be effective for mapping forest, grassland, and agricultural dynamics [42,43,44,45,46].
In this study, our main objective is to analyze the change in forest cover in western Syria and quantify the recent changes in forest dynamics due to conflict-related drivers, answering the following questions: (a) Has the forest cover of Syria changed during the ongoing armed conflict (2010–2019)? (b) What are the patterns and spatial distribution of the forest cover change? (c) What impact do conflict-related drivers, such as refugee displacement, explosives, wildfires, and proximity to roads and settlements, have on the dynamics of forest cover?

2. Materials and Methods
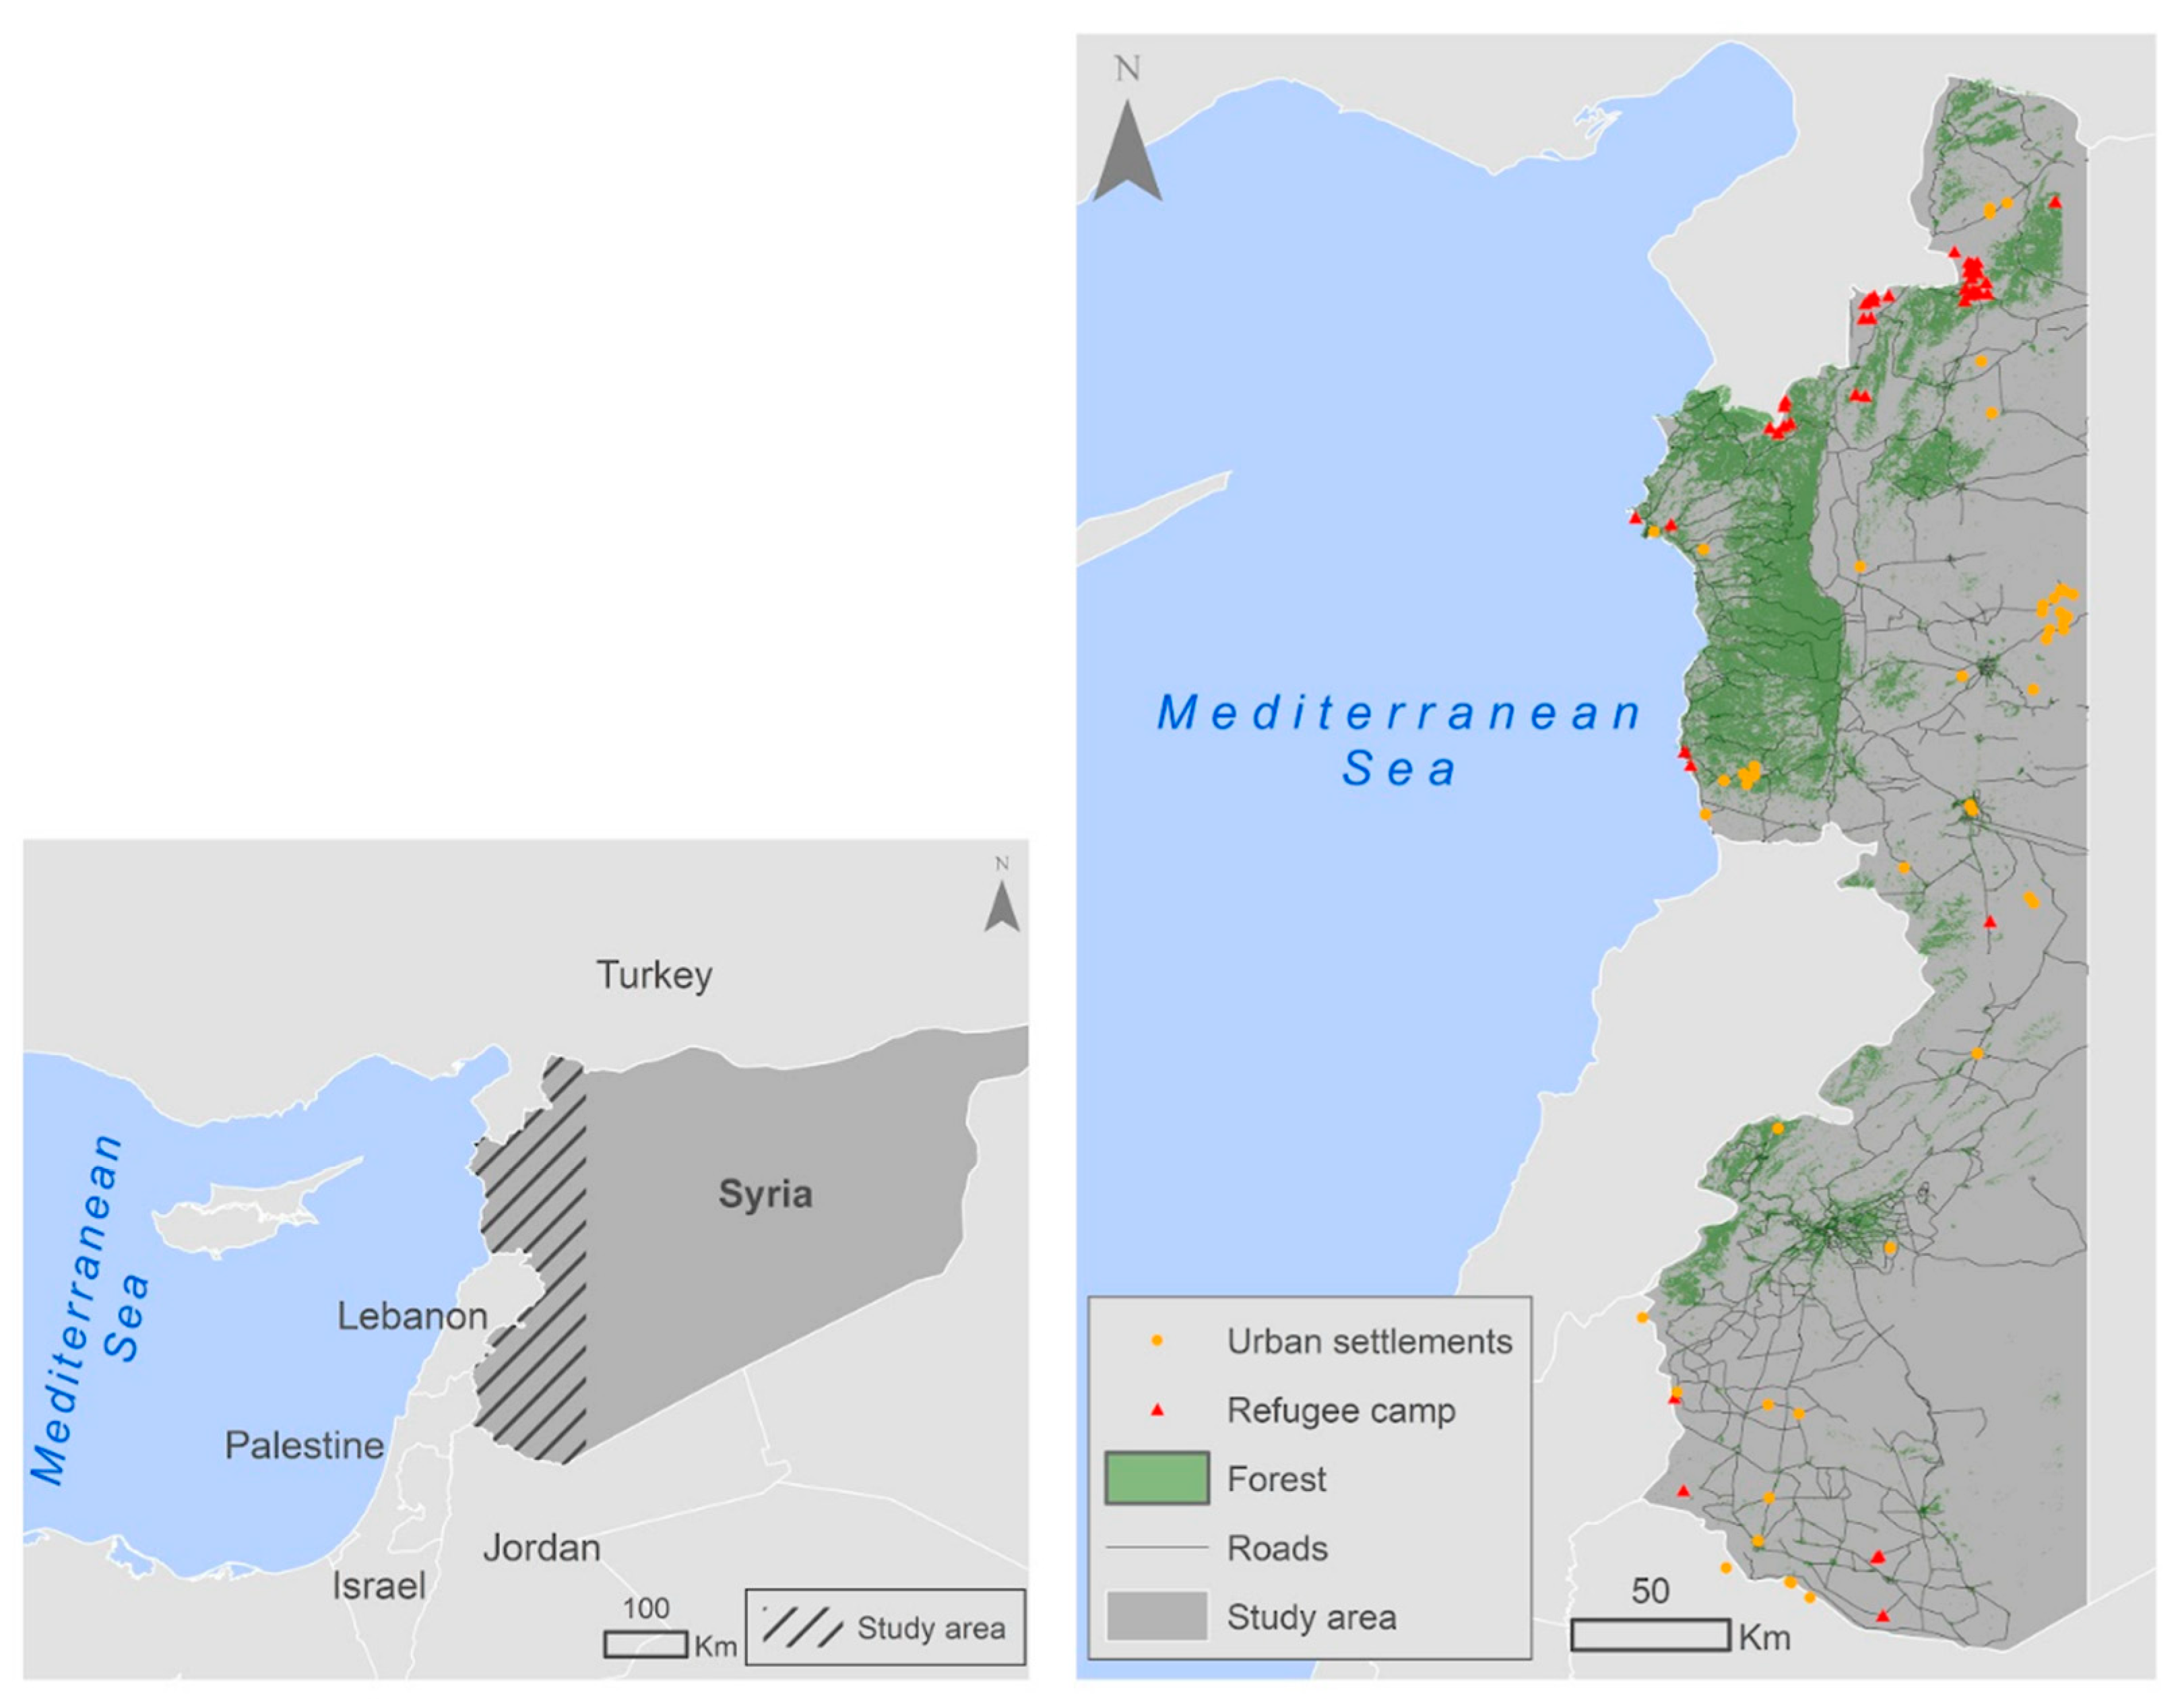
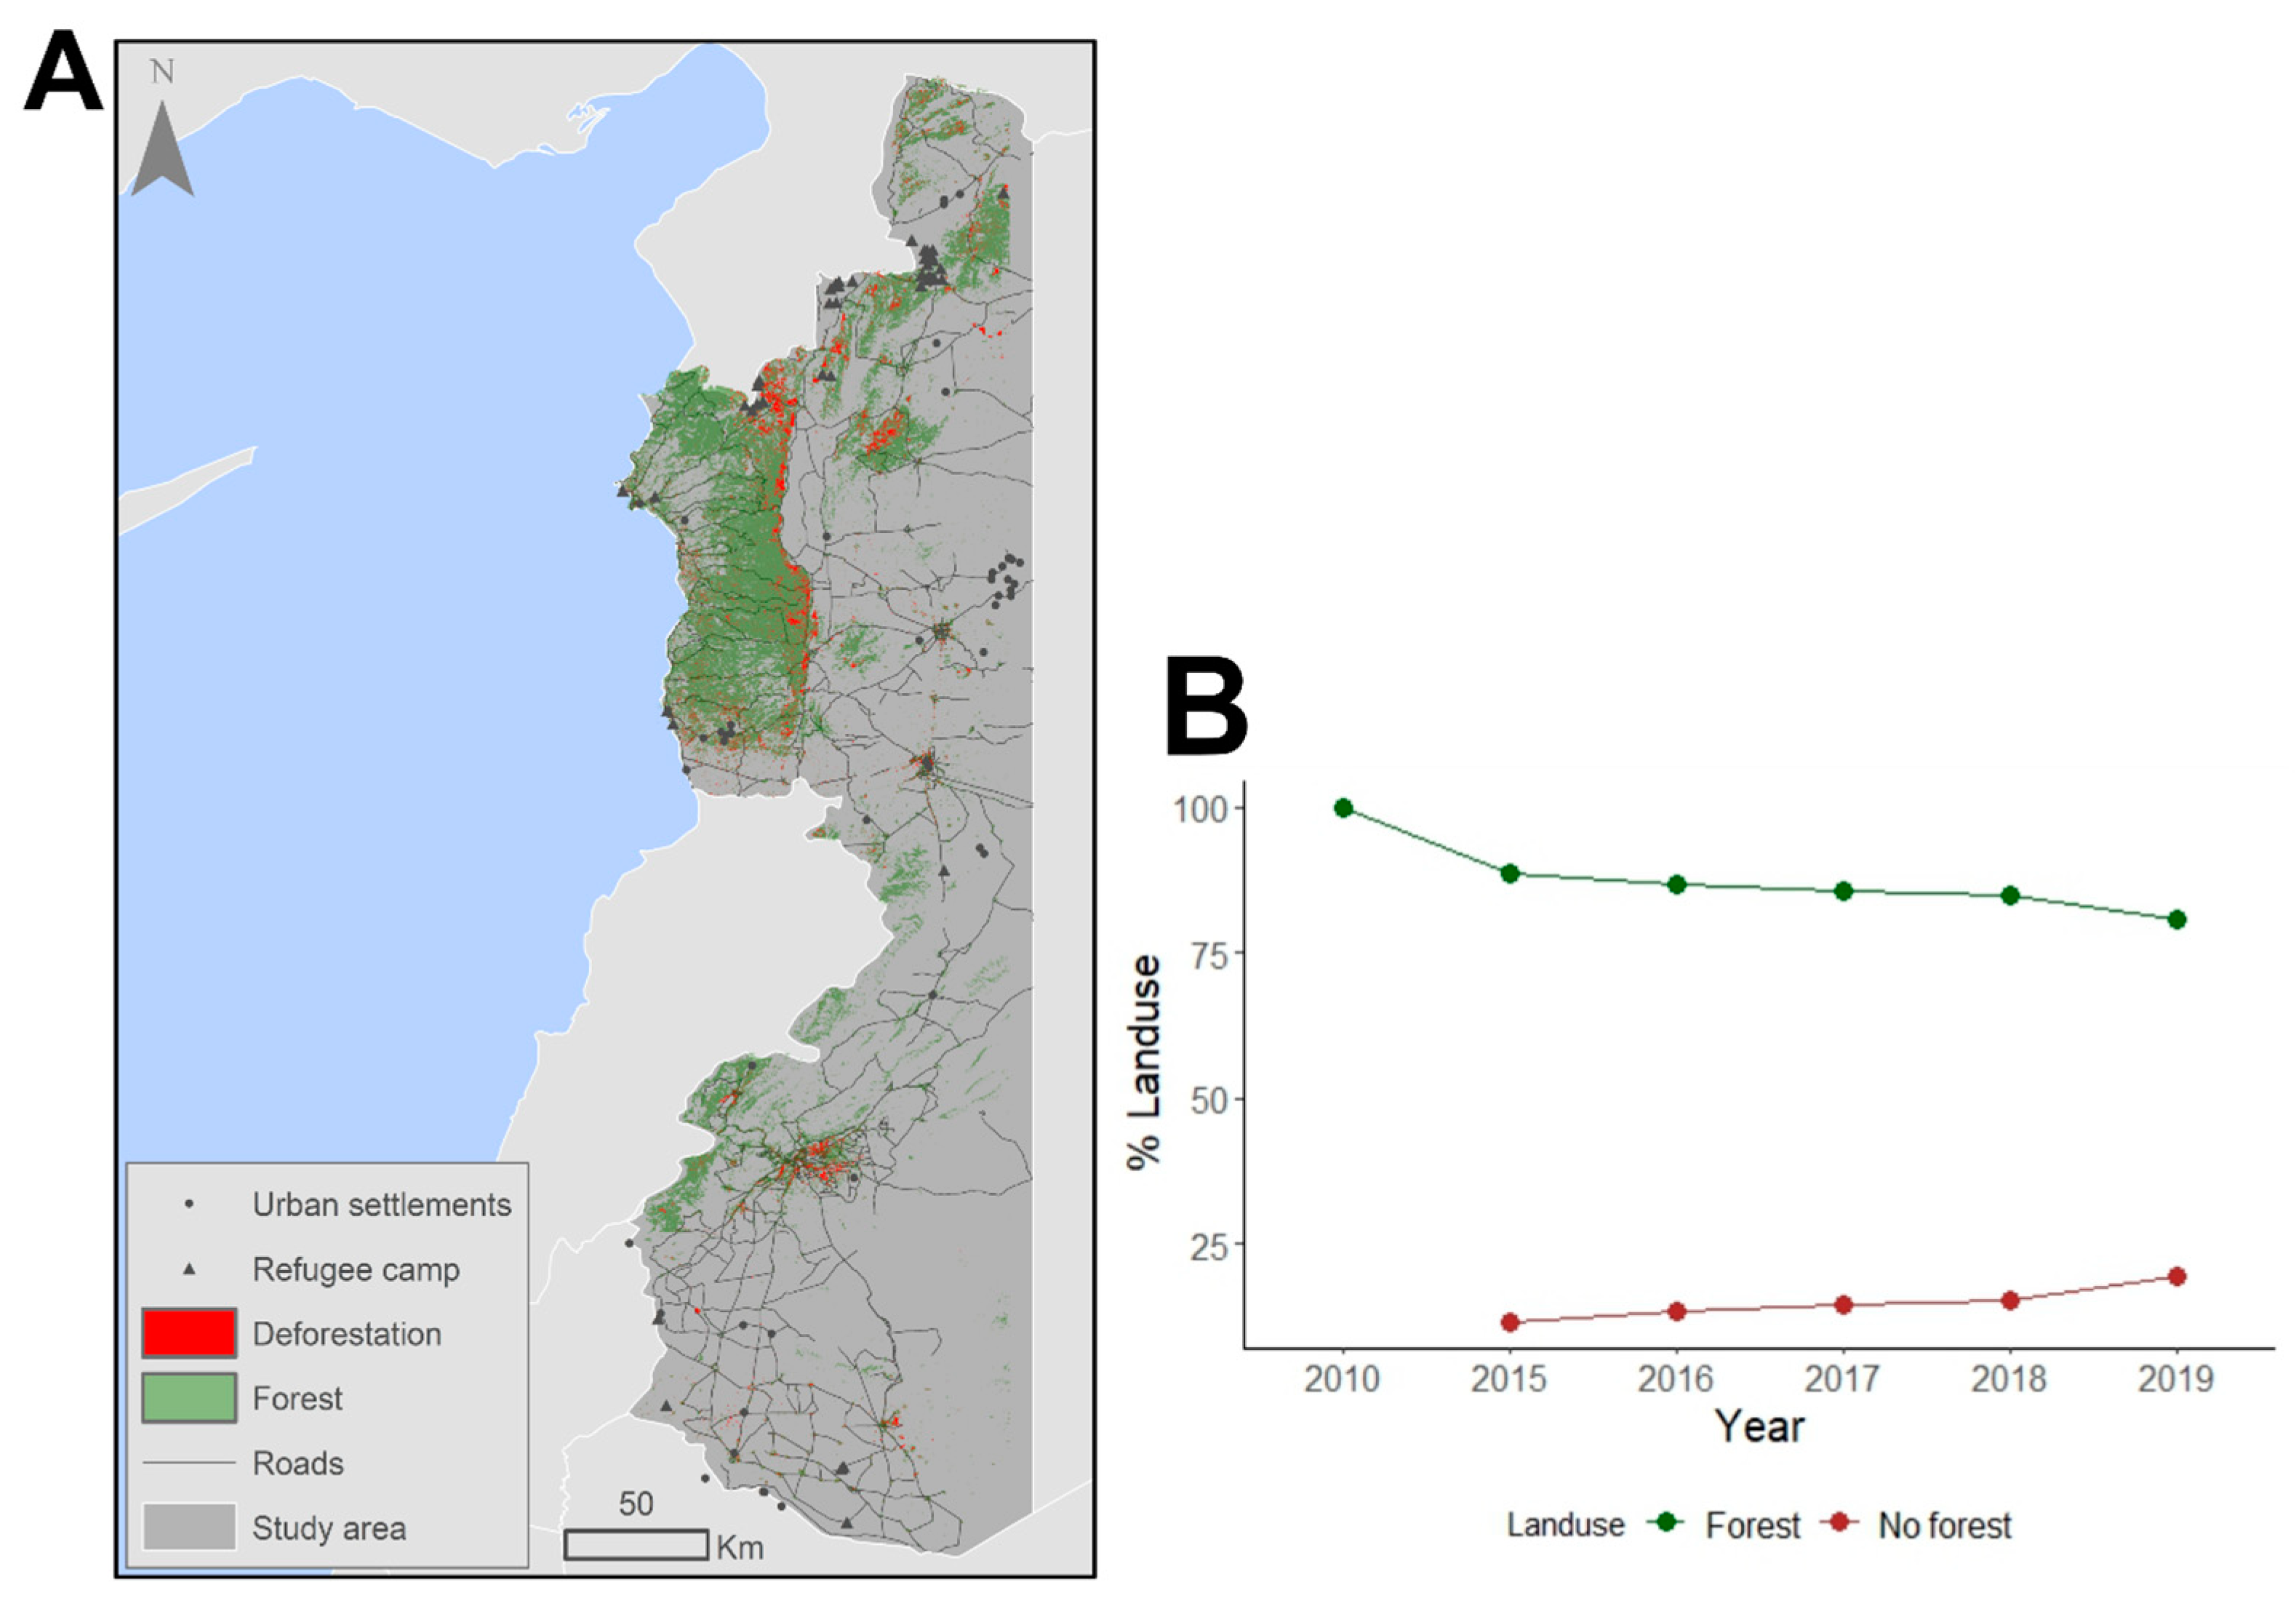
2.1. The Study Area

2.1.1. Location

The study area includes the western part of Syria, which extends over an area of 37.512 km2 and lies between 32°31′ to 36°84′ N and 35°71′ to 36°97′ E, with a coastline that extends for 183 km along the Mediterranean Sea (Figure 1). It is important to note that the study area excludes the Golan Heights in the southwestern part. This region is recognized by the United Nations as Syrian territory occupied by Israel for over 39 years.

2.1.2. Climate

The climate in western Syria is considered a Mediterranean climate, characterized by dry hot summers, cold winters, and concentrated rain periods in spring and autumn [47]. Average temperatures in winter are moderate to cold, with precipitation between 100 and 1400 mm/year. In summer, the temperatures can rise up to 30 °C in most regions and, in some places, can go above 40 °C depending on the bioclimatic range [47].

2.1.3. Forests

According to data provided by the Syrian Ministry of Agriculture in 2005, the combined forest and woodland areas in the country cover approximately 0.6 million hectares, representing 3% of the total land use [48]. Among the various types of forest vegetation, oak forests dominate, with 59% of the total forested area, followed by coniferous forests, with approximately 27.5% [48]. The remaining species are considered associated species [48].
Ref. [49] classified the forest vegetation in five ecoregions according to the different geoclimatic zones in the country: the coastal mountains, the Baer and Basit Mountains, the Aleppo Mountain range, Hermon Mountain, and Jabal al-Arab Mountain; four of which fall within our study area:
  • Most of the forest cover in Syria is located in the western coastal mountains, which are divided into two parts due to the variation of precipitation that they receive annually:
    • The western part, ranges between 0 and 1570 m above sea level, with dominant species such as Quercus calliprinos, Pistacia palaestina, Abies cilicica, Ceratonia siliqua, Pistacia lentiscus, and Quercus infectoria.
    • The eastern part ranges between 300 and 1570 m above sea level, with dominant species such as Quercus calliprinos, Pistacia palaestina, Cedrus libani, and Quercus cerris.
  • The Baer and Basit Mountains: ranging from 0 to 900 m above sea level, with the main species Ceratonia siliqua, Pistacia lentiscus, Quercus cerris, and Pinus brutia.
  • Aleppo Mountain ranging from 400 to 1200 m above sea level; its dominant species are Quercus infectoria, Quercus cerris, and Quercus calliprinos.
  • Jabal al-Arab Mountain: ranges between 850 and 1700 m above sea level, with the main species Quercus calliprinos, Quercus infectoria, Quercus cerris, and Pistacia atlantica.

2.2. Landsat Imagery

Models to identify forested and non-forested areas were trained from photointerpretation train samples and the spectral signal of the land cover. A set of Landsat TM, ETM+, and OLI surface reflectance images acquired during the spring season were retrieved and images were processed via the GEE environment [50]. We utilized the LandTrendr algorithm to aggregate data on a yearly basis using the annual medoid approach. By fitting a segmented model, we achieved a significant reduction in noise caused by variations in illumination conditions, phenological changes, atmospheric conditions, and geometric registration, offering an enhanced change detection capability [51,52]. We used the algorithm LandTrendr to aggregate data on a yearly basis, by means of annual medoid, and fit a segmented model. The LT consisted of a set of spectral temporal segmentation algorithms that isolated changes in time series. In general, the original time series trajectories were repeatedly simplified by identifying the most significant vertices of change. After potential vertices were identified and linked using flexible fitting rules, various segments of the updated trajectory were removed and remodeled to finally select the best model [51,53].
A smaller subset of variables was created by synthesizing the initial set of 6 spectral bands using the Tasseled Cap (TC) transformation [54]. TC is an orthogonal transformation of spectral data that is based on the three resultant axes, brightness (TCB), greenness (TCG), and wetness (TCW) and, concretely, TCW and TCB are highly correlated with forest structure [52,55]. The three components were transformed using [56] weighting coefficients. Also to mention is that the OLI data were homogenized with TM and ETM+ spectral data using the coefficients described in [57].

2.3. Palsar Data

For a better definition of forest areas, we used data from the L-band radar sensor PALSAR and PALSAR2, with 25 m spatial resolution. Concretely, the aggregated annual mosaics were available in GEE [58]. As only mosaics for the years 2010 and from 2015 to 2019 were available, then the base year was set as 2010 and we assessed the changes from 2015 to 2019. The product was provided in digital numbers (DN) and without speckle reduction. Image preprocessing was required to convert DN to gamma naught values in decibel units (dB) (Equation (1)) and a despeckling process using the refined Lee speckle filter [59].
Υ 0 = 10 l o g 10 D N 2 83 d B
Then, the available polarizations Horizontal–Horizontal (HH) and Horizontal–Vertical (HV) were selected and Gray Level Co-occurrence Matrix (GLCM) statistics were applied in order to compute textural metrics and identify patterns [60]. From the set of available metrics, we selected sum average, entropy, correlation, and variance applied in an array of 4 × 4 neighbors. Finally, all HH and HV original and textural bands were resampled to 30 m, using bilinear interpolation, and snapped with Landsat imagery.

2.4. Response Variable

In order to obtain “ground truth” information to discriminate forested and non-forested areas, we carried out a photointerpretation of the available imagery in Google Earth for the year 2019 and we restricted forest samples to where the trees were higher than 3 m, using a global forest height map [61]. The main goal was identifying those areas to serve as train and test samples for the evaluation of model performance. From the collection of imagery, we were able to identify a set of 3000 locations, including 3600 sites of forested areas and 2400 non-forested locations. Please see (Table A1, Appendix A) for more detailed information about the train and test subsamples.

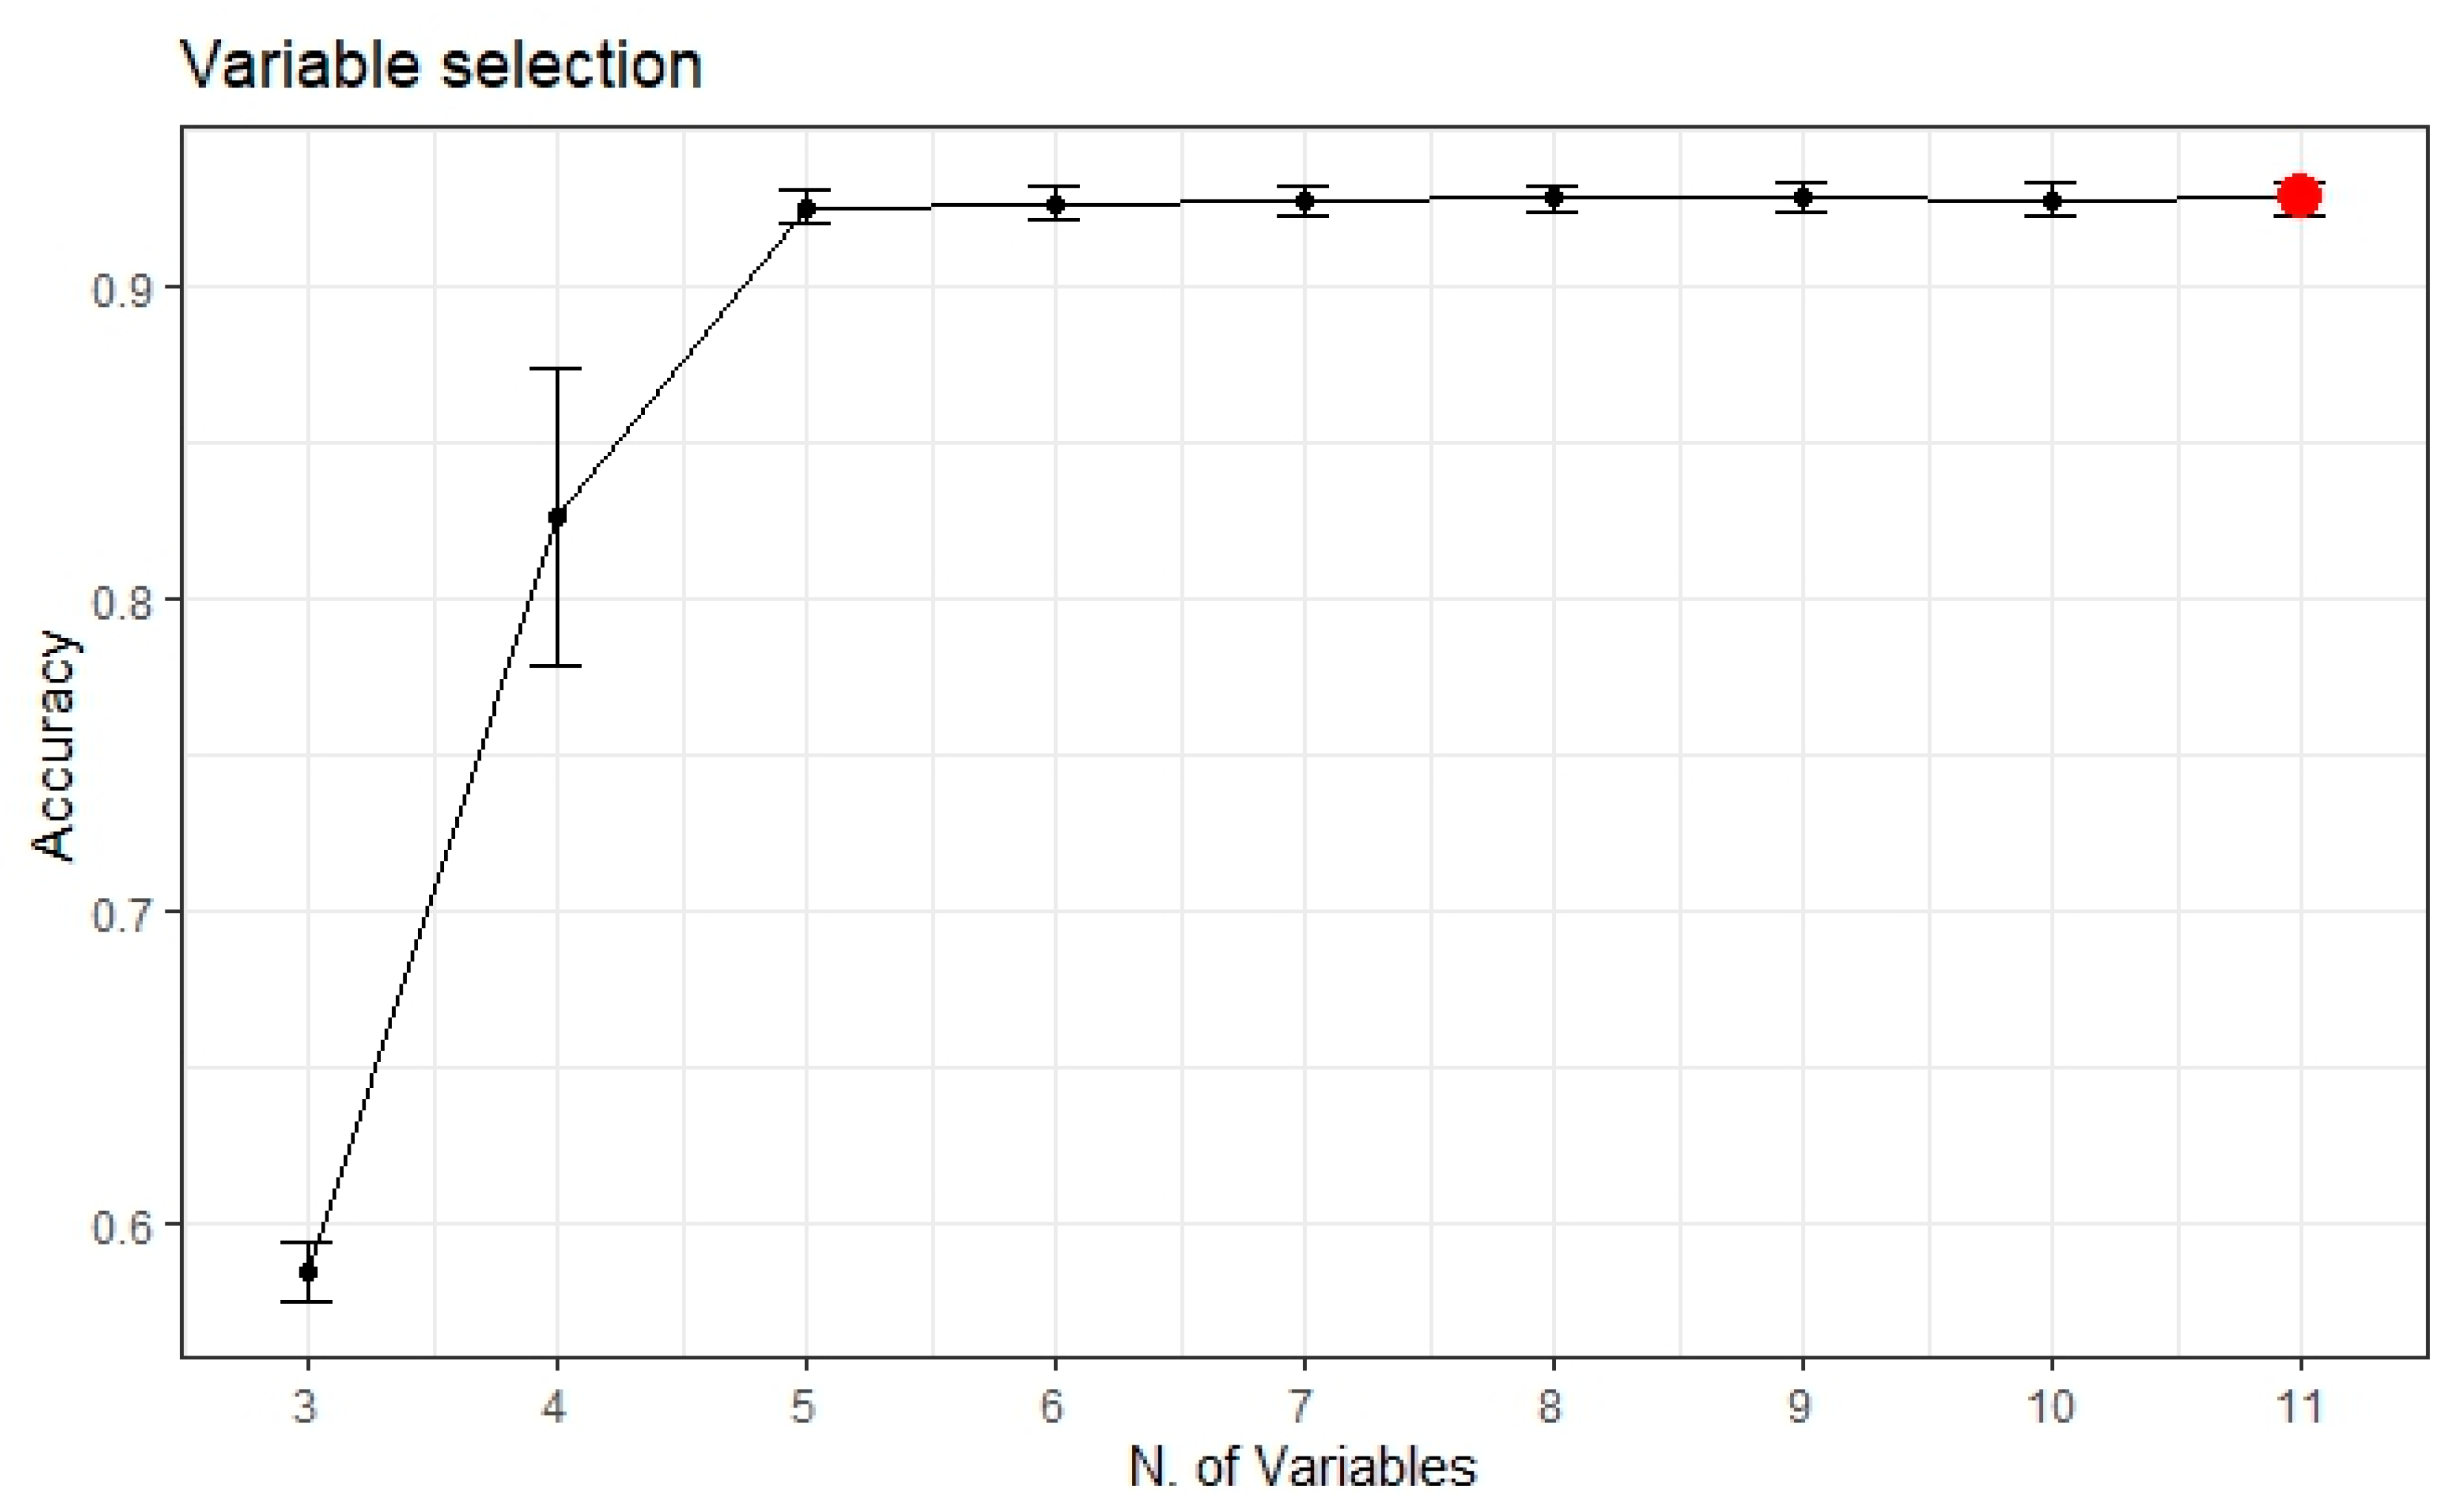
2.5. Variable Selection and Modeling

To avoid redundancy and collinearity between spectral variables, we performed a variable selection analysis. To do so, we used the strategy based on the recursive variable elimination. This method refits Random Forest models [62] by eliminating variables one by one. Then, whichever number of variables yields the lowest error is evaluated and ranked by variable importance. The final selection results from a bootstrap process where the variable selection strategy is repeated and aggregated with 30 different subsamples to ensure the reliability of the variable selection.
To identify and detect forested and non-forested areas, we applied the Support Vector Machine (SVM) classification algorithm with previously selected spectral and derived variables from the year 2019. SVM is a non-parametric machine learning algorithm that has been specifically designed to analyze and recognize patterns based on building a series of hyperplanes in a high-dimensional space in an effort to find the greatest separability across classes [63,64]. SVM, concretely, the SVM-Radial Basis Function (RBF) kernel, is widely used in land cover classification models due to its good performance [65,66]. Cost and gamma parameters were adjusted by experimenting with all possible values between 1 and 700 and 0.001 and 1, respectively. A 10-fold cross validation was performed for model optimization using the “Caret” R-package [67]. Additionally, we produced spatial predictions and outputs using the “raster” package [68] and evaluated their performance using Cohen’s Kappa index [69] and the accuracy percentage.

2.6. Deforestation Detection

Deforestation was detected by predicting with the model over the previous years and obtaining an annual mapping of forested and non-forested areas. We defined deforestation as a pixel where there was change from forest in the year 2010 to non-forested in a later year and, furthermore, continued to be detected as non-forested until the end of the time series in 2019. This filtering process avoided overestimating the phenomenon when detection was mainly produced by noise during data acquisition. This procedure provided a yearly mapping of deforestation.

2.7. Auxiliary Analyses

Deforestation is induced by human activity and is a consequence of war. For this reason, we described the spatial relationship between locations and infrastructures that can facilitate access to forests and lead to deforestation such as urban settlements, refugee camps, and roads by calculating the Euclidean distance between deforested areas and these areas. We summarized this information by means of the distribution of different ranges of distance and descriptive statistics. Additionally, forest fires from natural causes or induced by the explosions of war can contribute to deforestation. For that potential driver, we analyzed the relationship between deforested areas and forest fires. Furthermore, we analyzed whether deforestation occurred mostly in areas with higher or lower explosion activity. All of these auxiliary data were retrieved from different sources. Urban settlements and roads were extracted from OpenStreetMap [70] and refugee camp locations from data collected by U.S. Department of State (U.S. Department of State Humanitarian Information Unit, 2016), Humanitarian Information Unit [71]. For the forest fires database, we retrieved all images between 2015 and 2019 from MCD64A1 version 6 Modis product [72]. Explosion intensity data were retrieved from georeferencing, followed by an unsupervised 4-class classification that grouped the different colors in figure (Intensity of Explosive Incidents) published in the United Nations humanitarian needs report [73].

3. Results

3.1. Land Cover Models Performance

SVM models usually perform well in deforestation monitoring; our most successful variable combination was obtained selecting all variables, but, as can be observed in Figure 2, the accuracy values were stabilized using five variables. To simplify and reduce the model complexity, we used the five most influential variables: TCW, SAR HV polarization GLCM correlation, SAR HH polarization GLCM correlation, SAR HH polarization GLCM variance, and HV polarization GLCM sum average (Table A3, Appendix A). SVM land cover model attained a predictive overall accuracy of 0.91 and a Kappa index of 0.83 (Table A2, Appendix A). This high performance allowed us to make reliable predictions for different years and then to synthesize all the temporal information about deforestation.

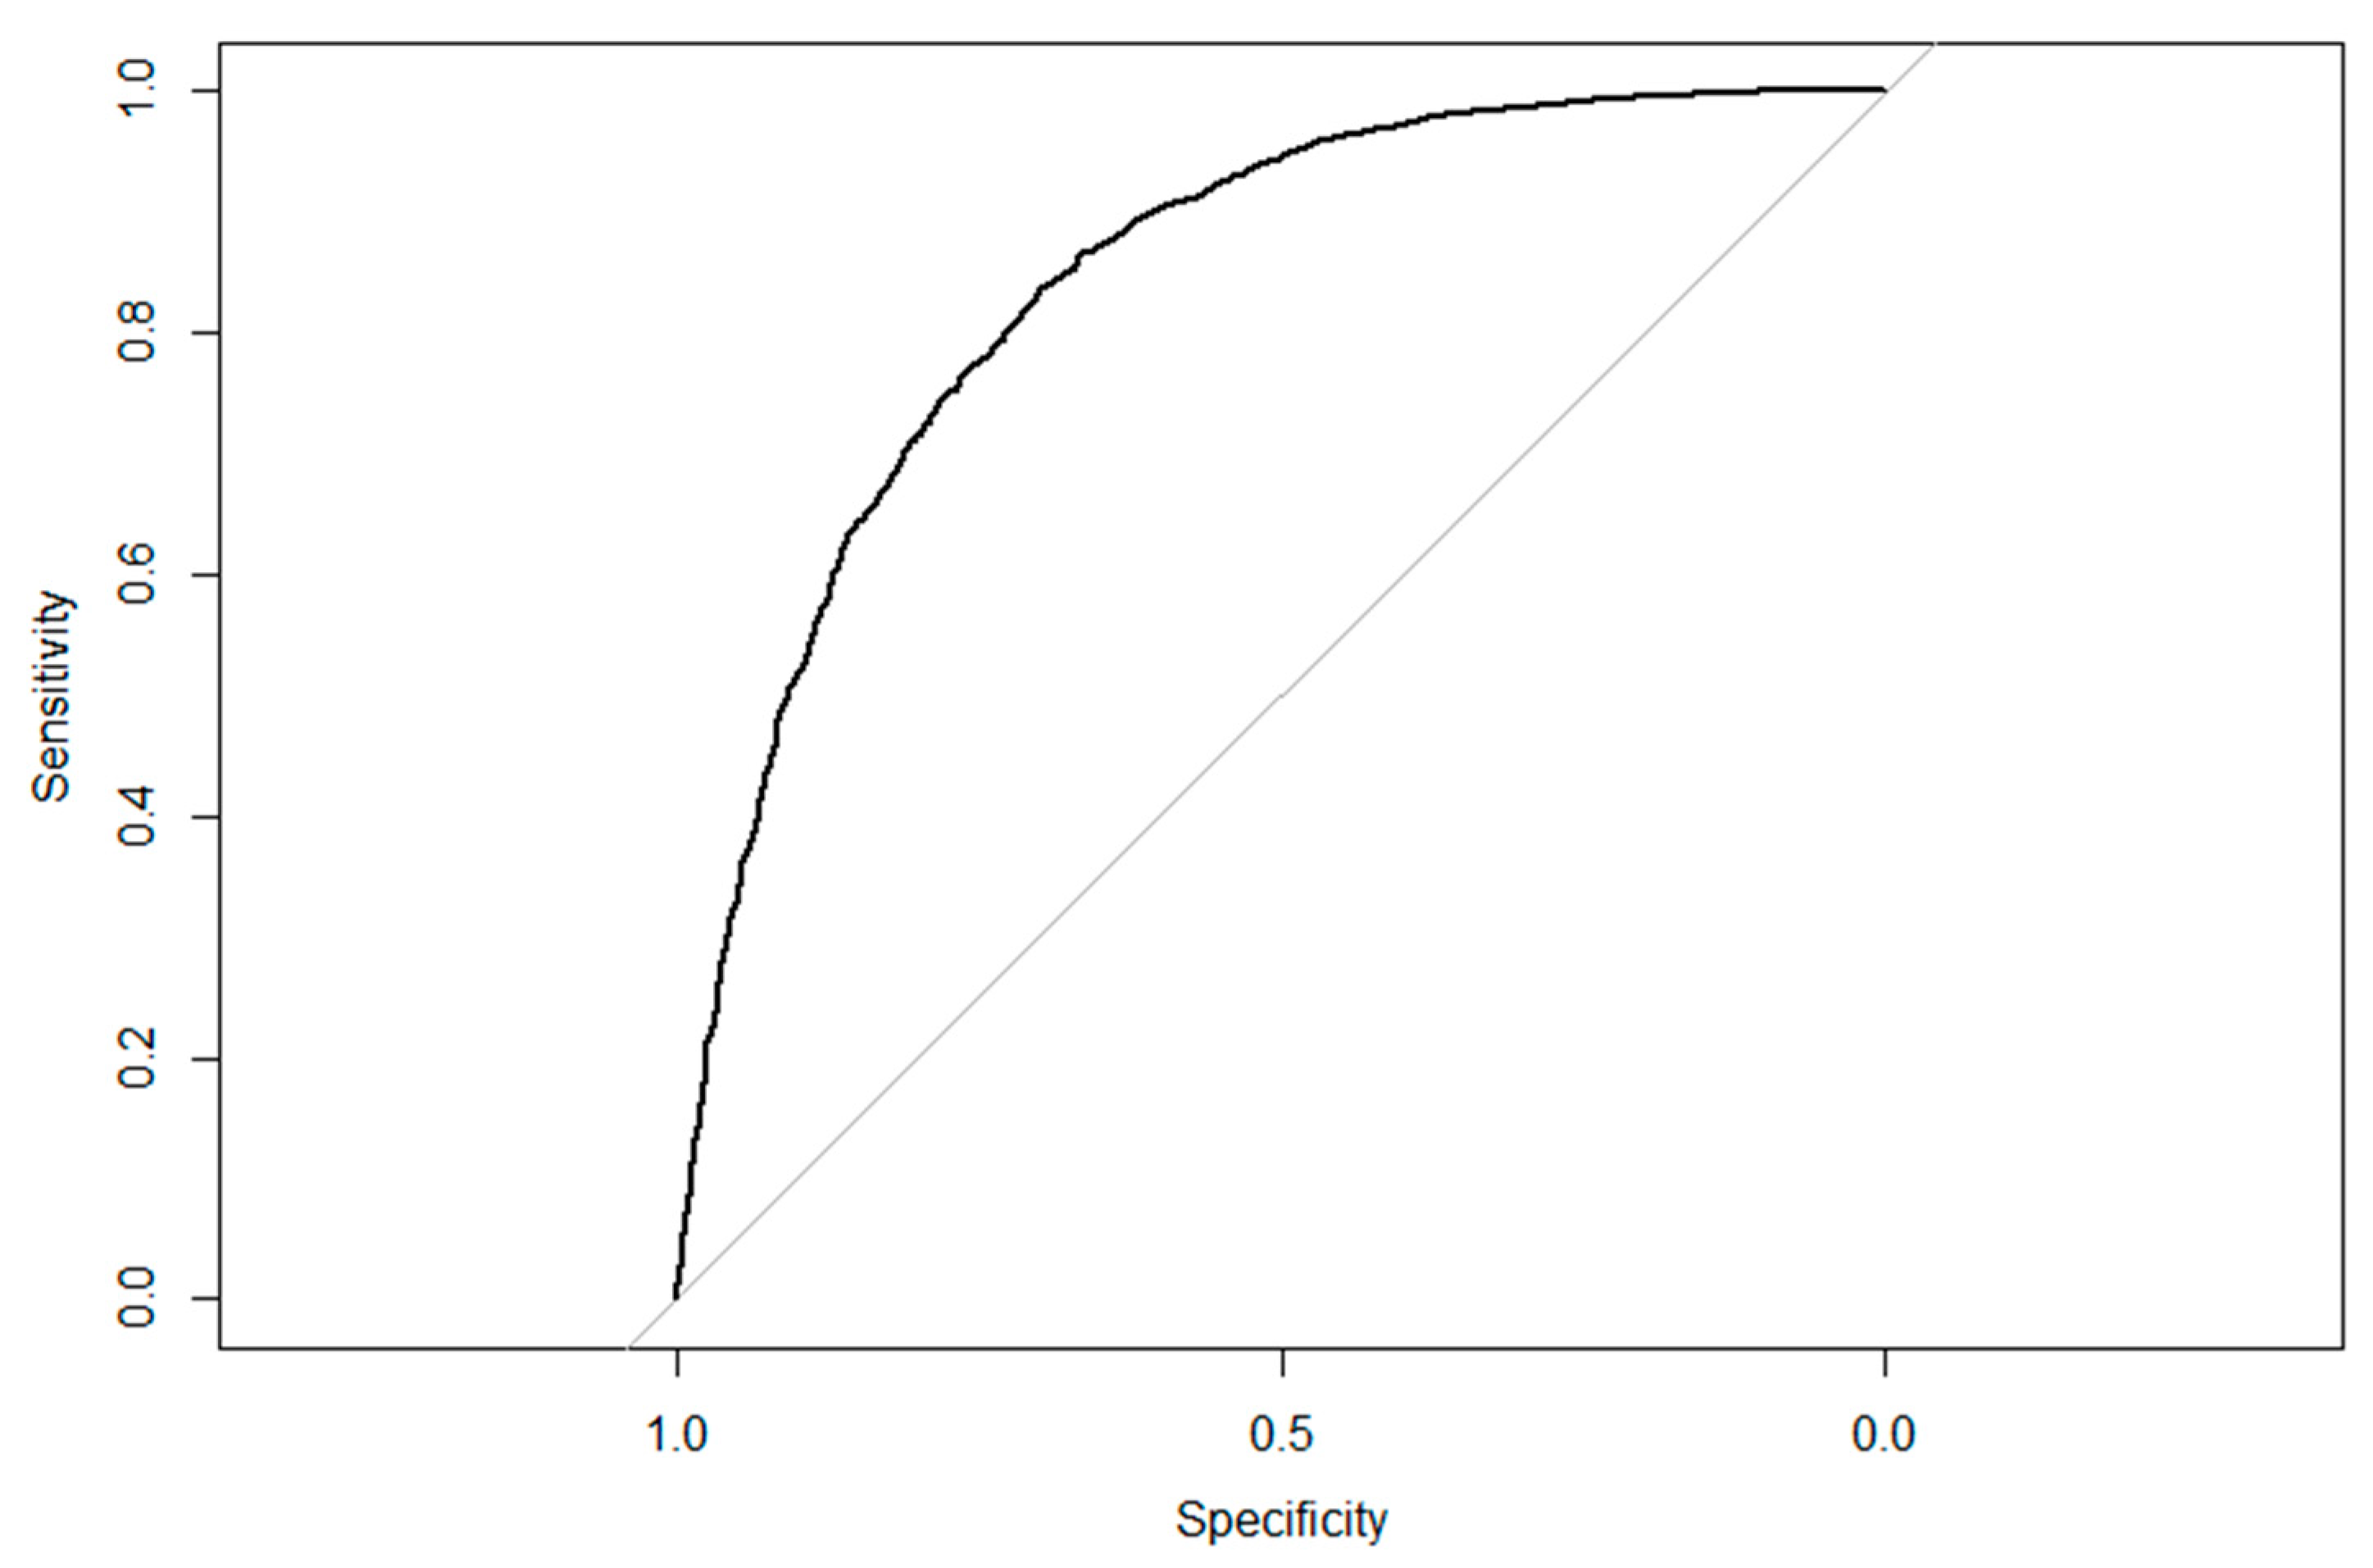
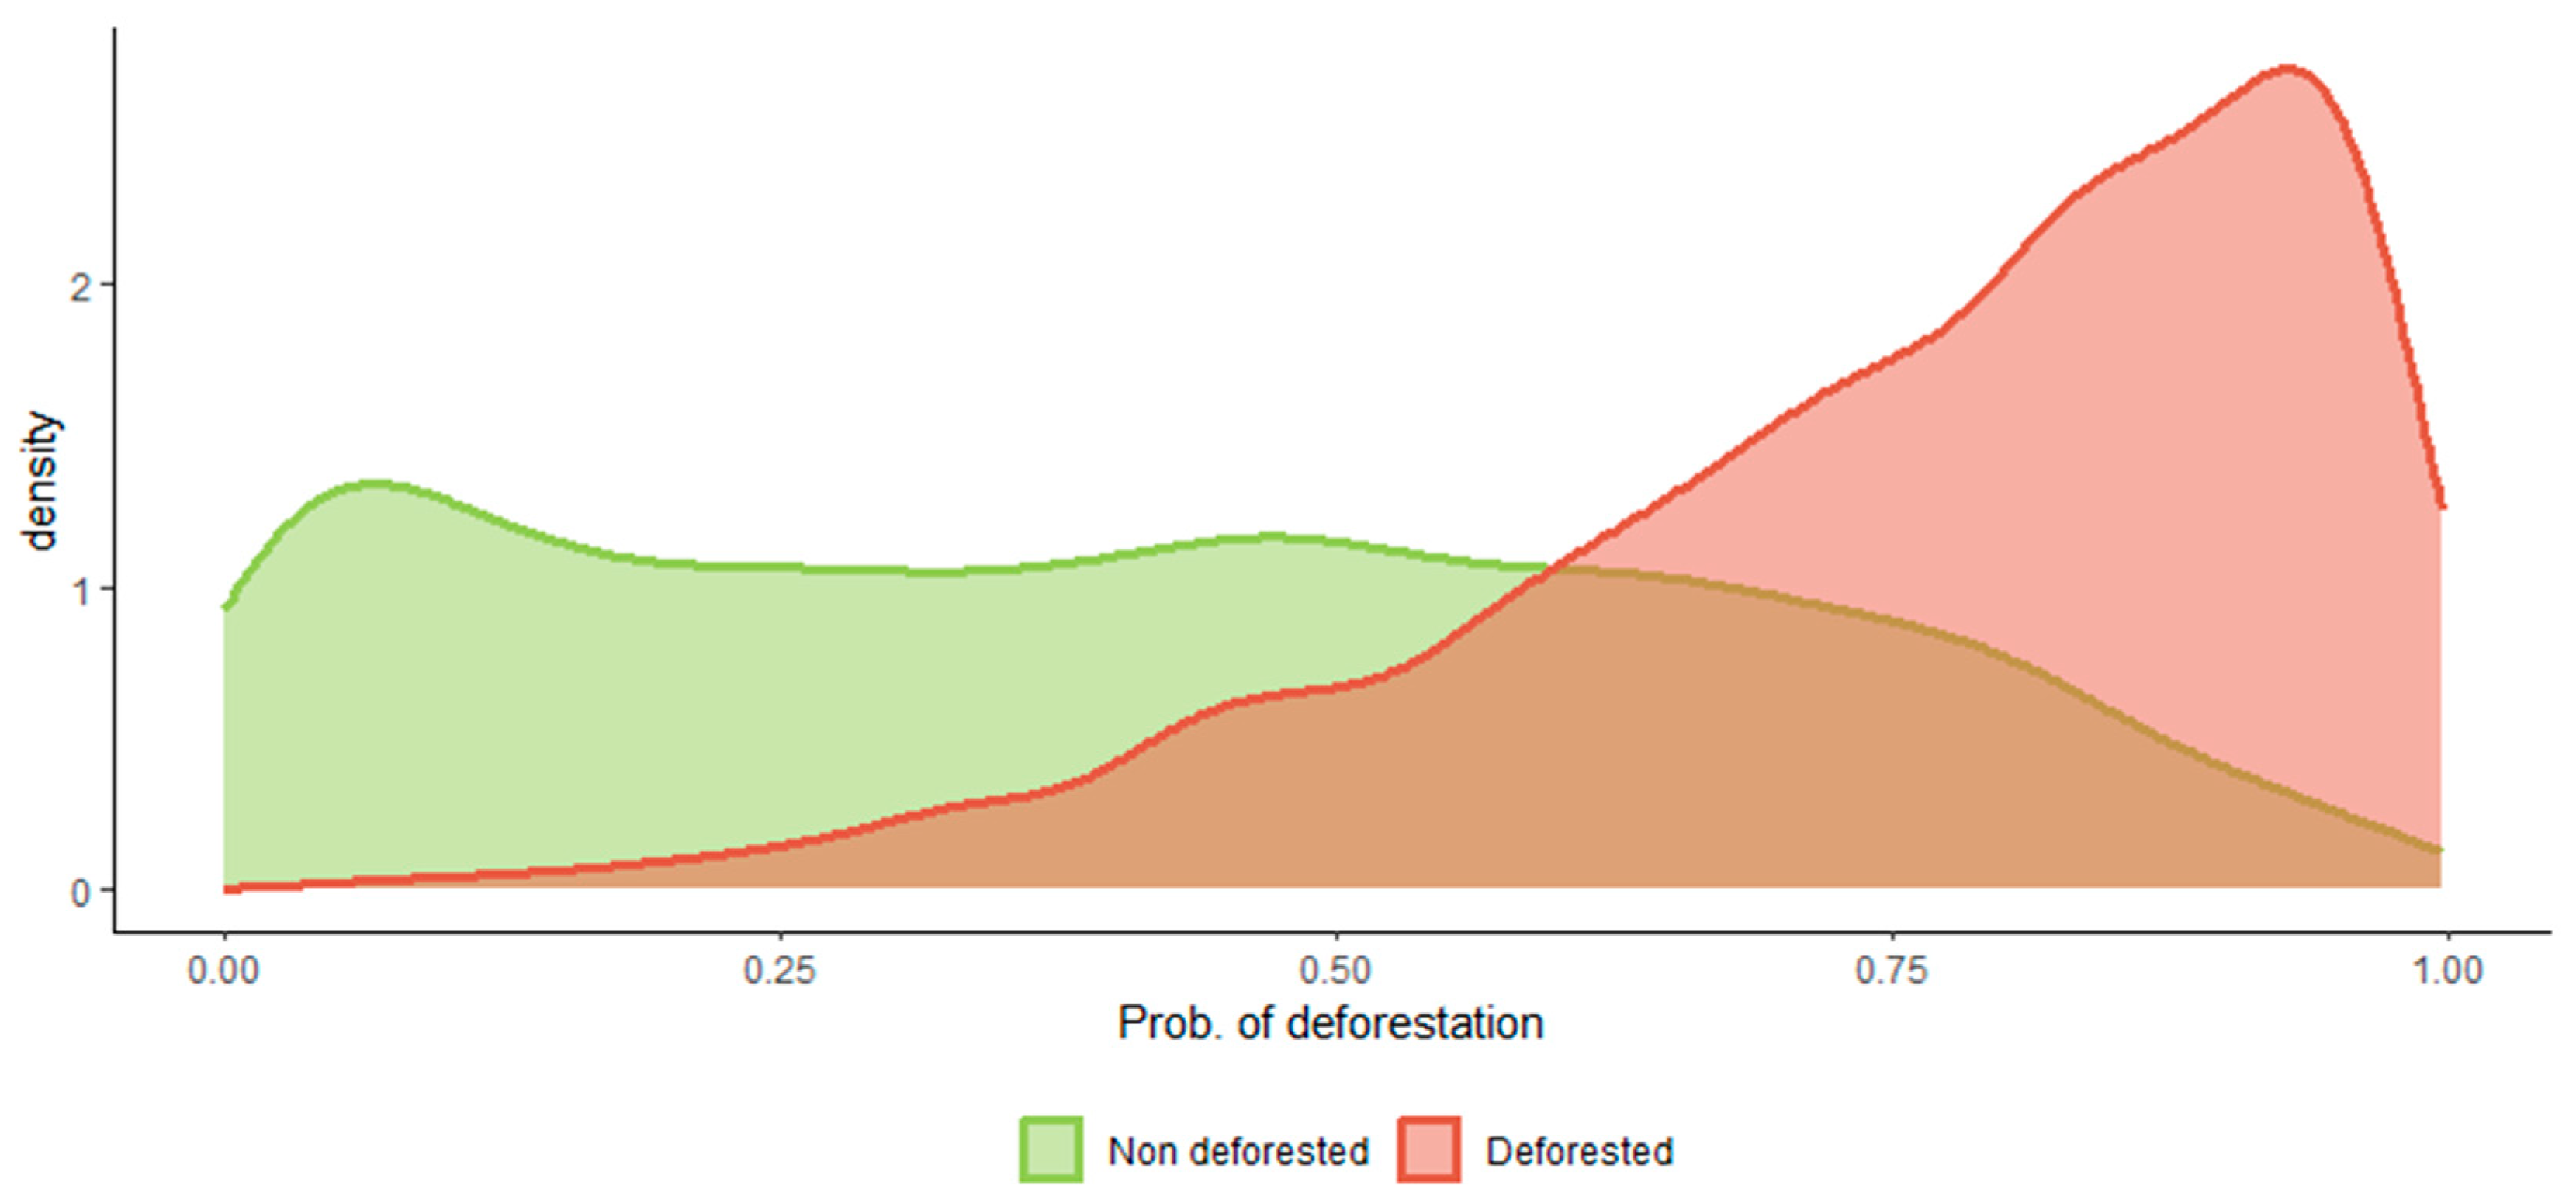
3.2. Predictive Performance of the RF Models

The predictive performance of the model was satisfactory; the SVM model yielded a high AUC 0.84 (Figure 3). We observed a clear gap (Kruskal–Wallis test significant; p < 0.05) (Figure 4) that separated the predicted probability between deforested and non-deforested observations. The density plots corroborated the high contrast between categories (Figure 4). In non-deforested locations, we found a frequency peak close to 0.1, after which the curve flattened. In deforested locations the probability peaked near 0.9, decreasing fast into low density values below the 0.8 threshold. Overall, all diagnoses provided proof of the satisfactory performance of the models, which supported our findings.

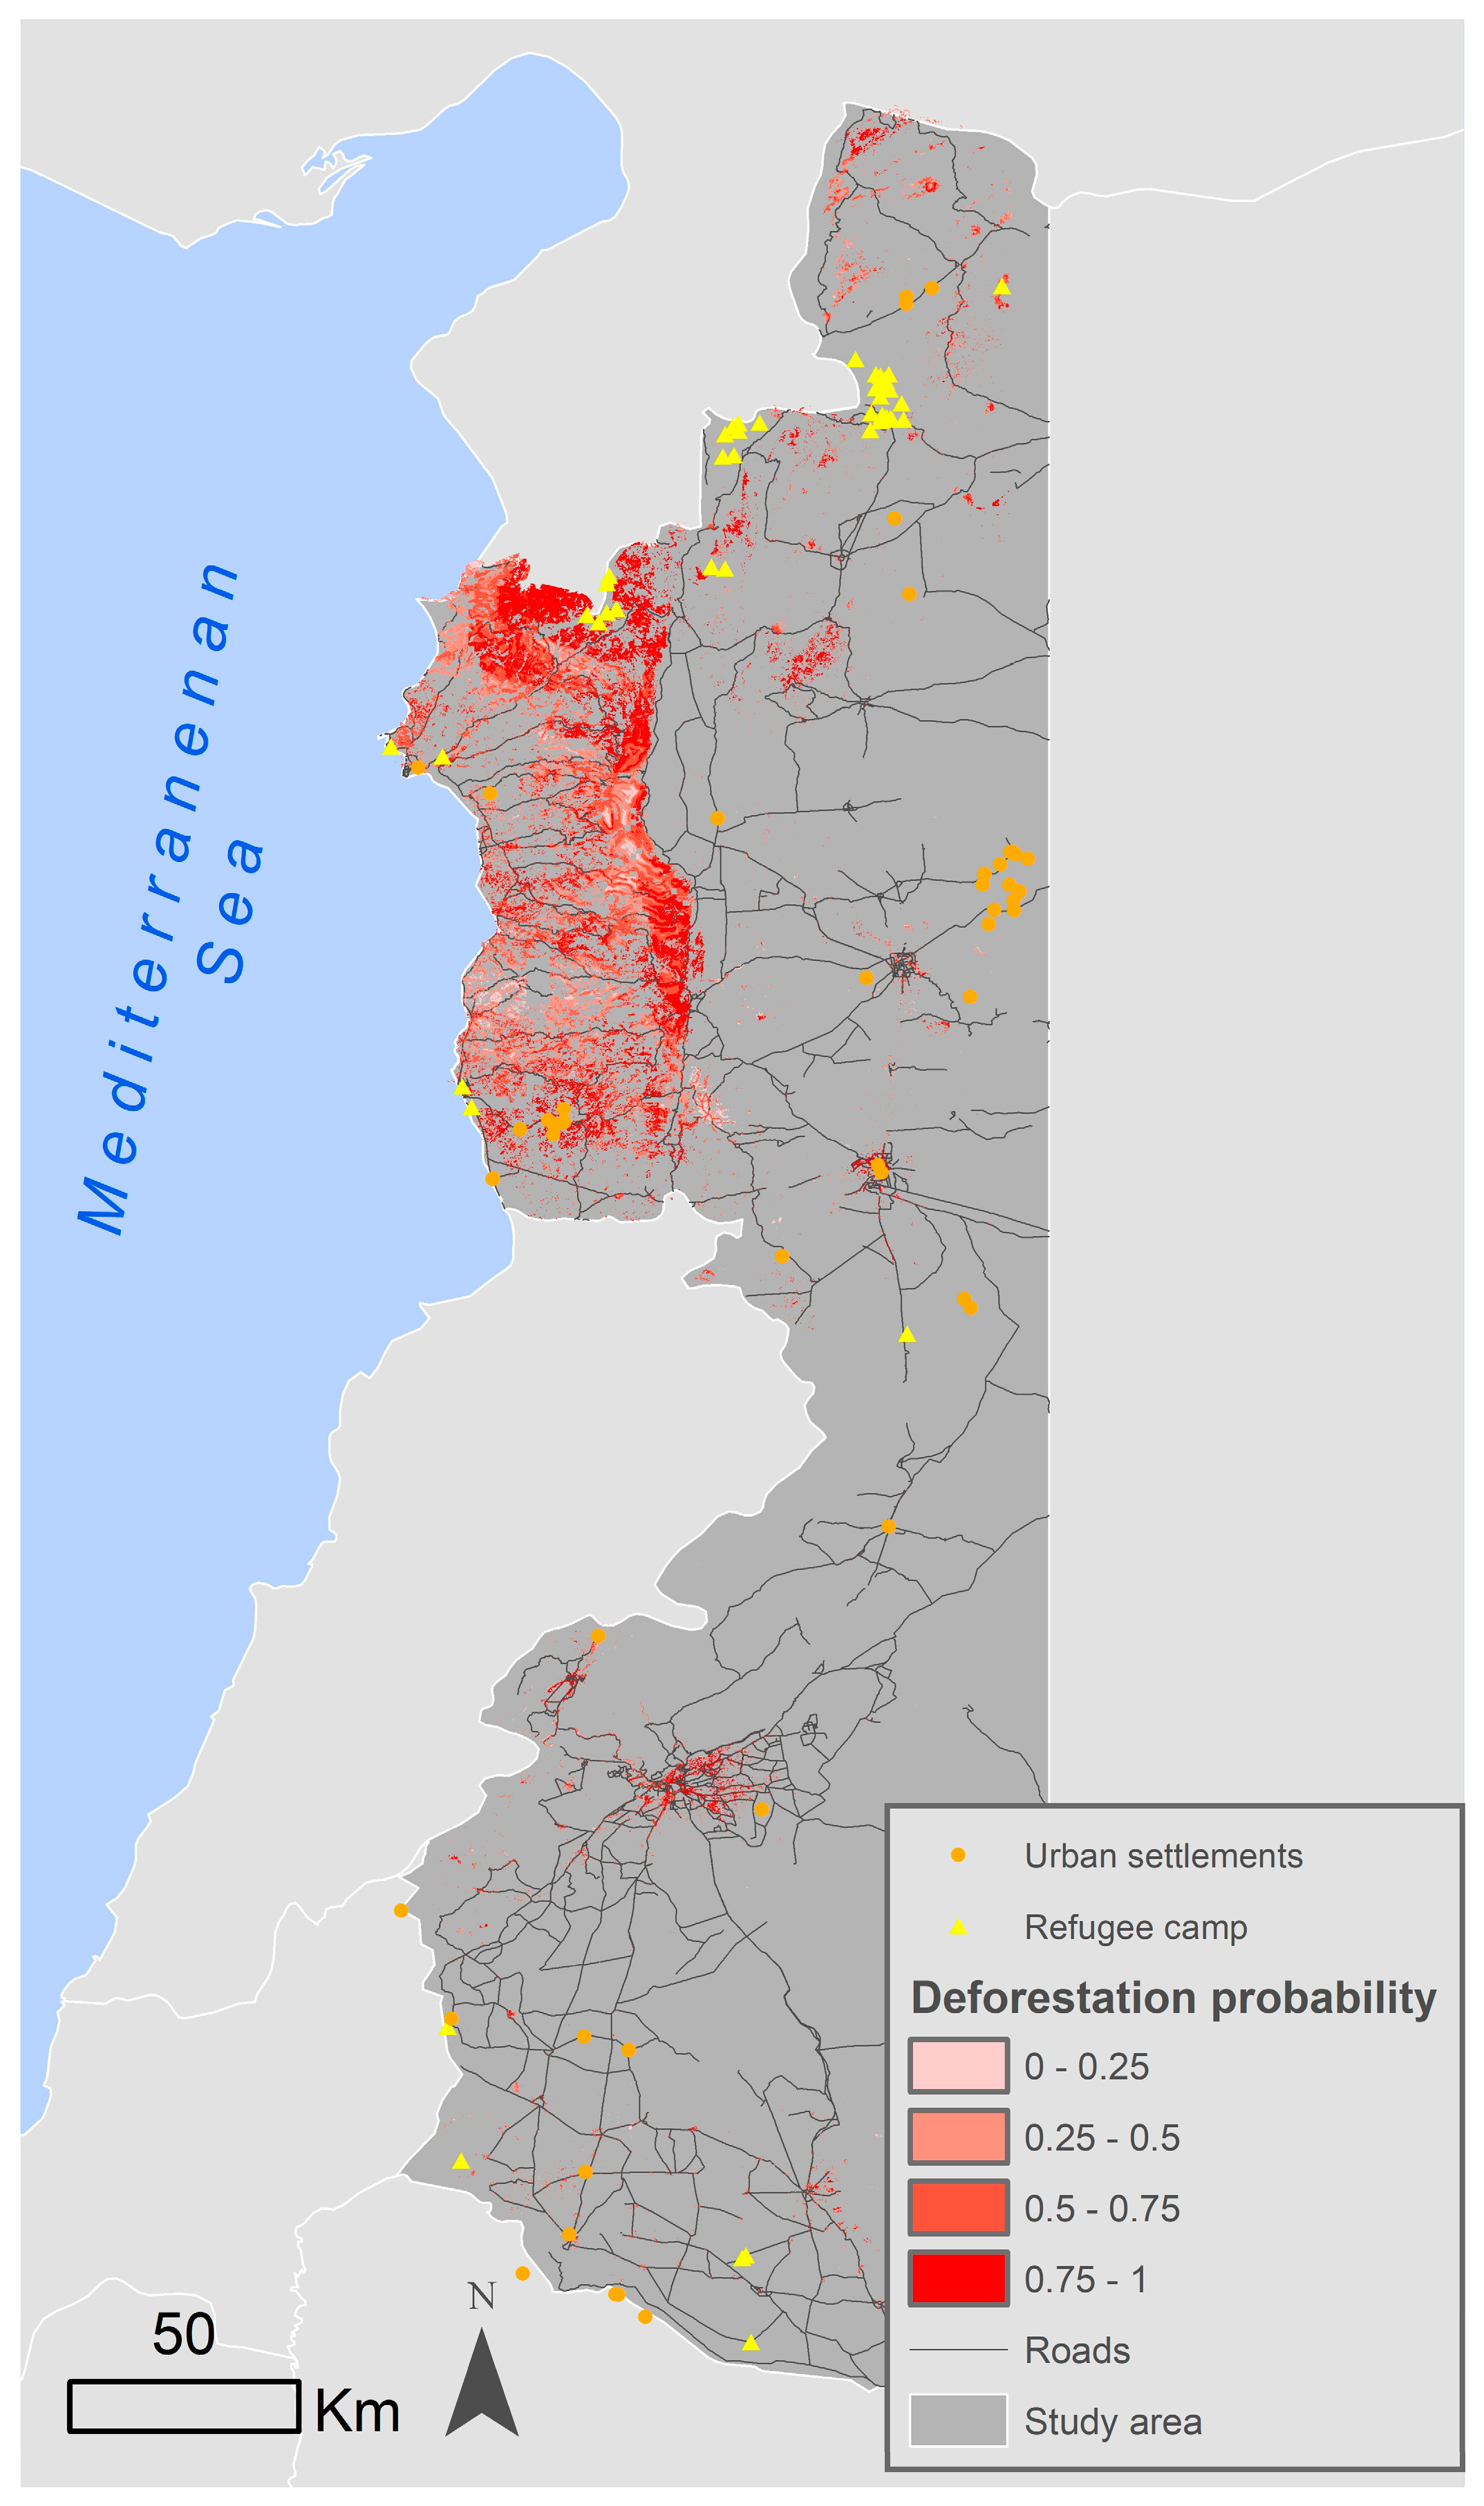
3.3. Overall Deforestation Patterns

The total loss of forest cover over the study period (2010–2019) was 19.3%, corresponding to a loss of 63.7 thousand hectares. The highest rate of forest decline was observed between 2010 and 2015, during which the total forest cover dropped by 11.5% (or 37.9 thousand hectares). During the period 2015-2018, a gradual but consistent decline was also observed, accounting for an accumulated reduction in forest area of 7.8% (See Table 1 and Figure 5). The analysis of satellite images from nine different years spanning from 2010 to 2019, with 2010 being the reference year, revealed a persistent decline in forest cover in the study area. Deforestation occurred mainly in the northwestern area, especially the coastal mountain range, and around Damascus in the South.

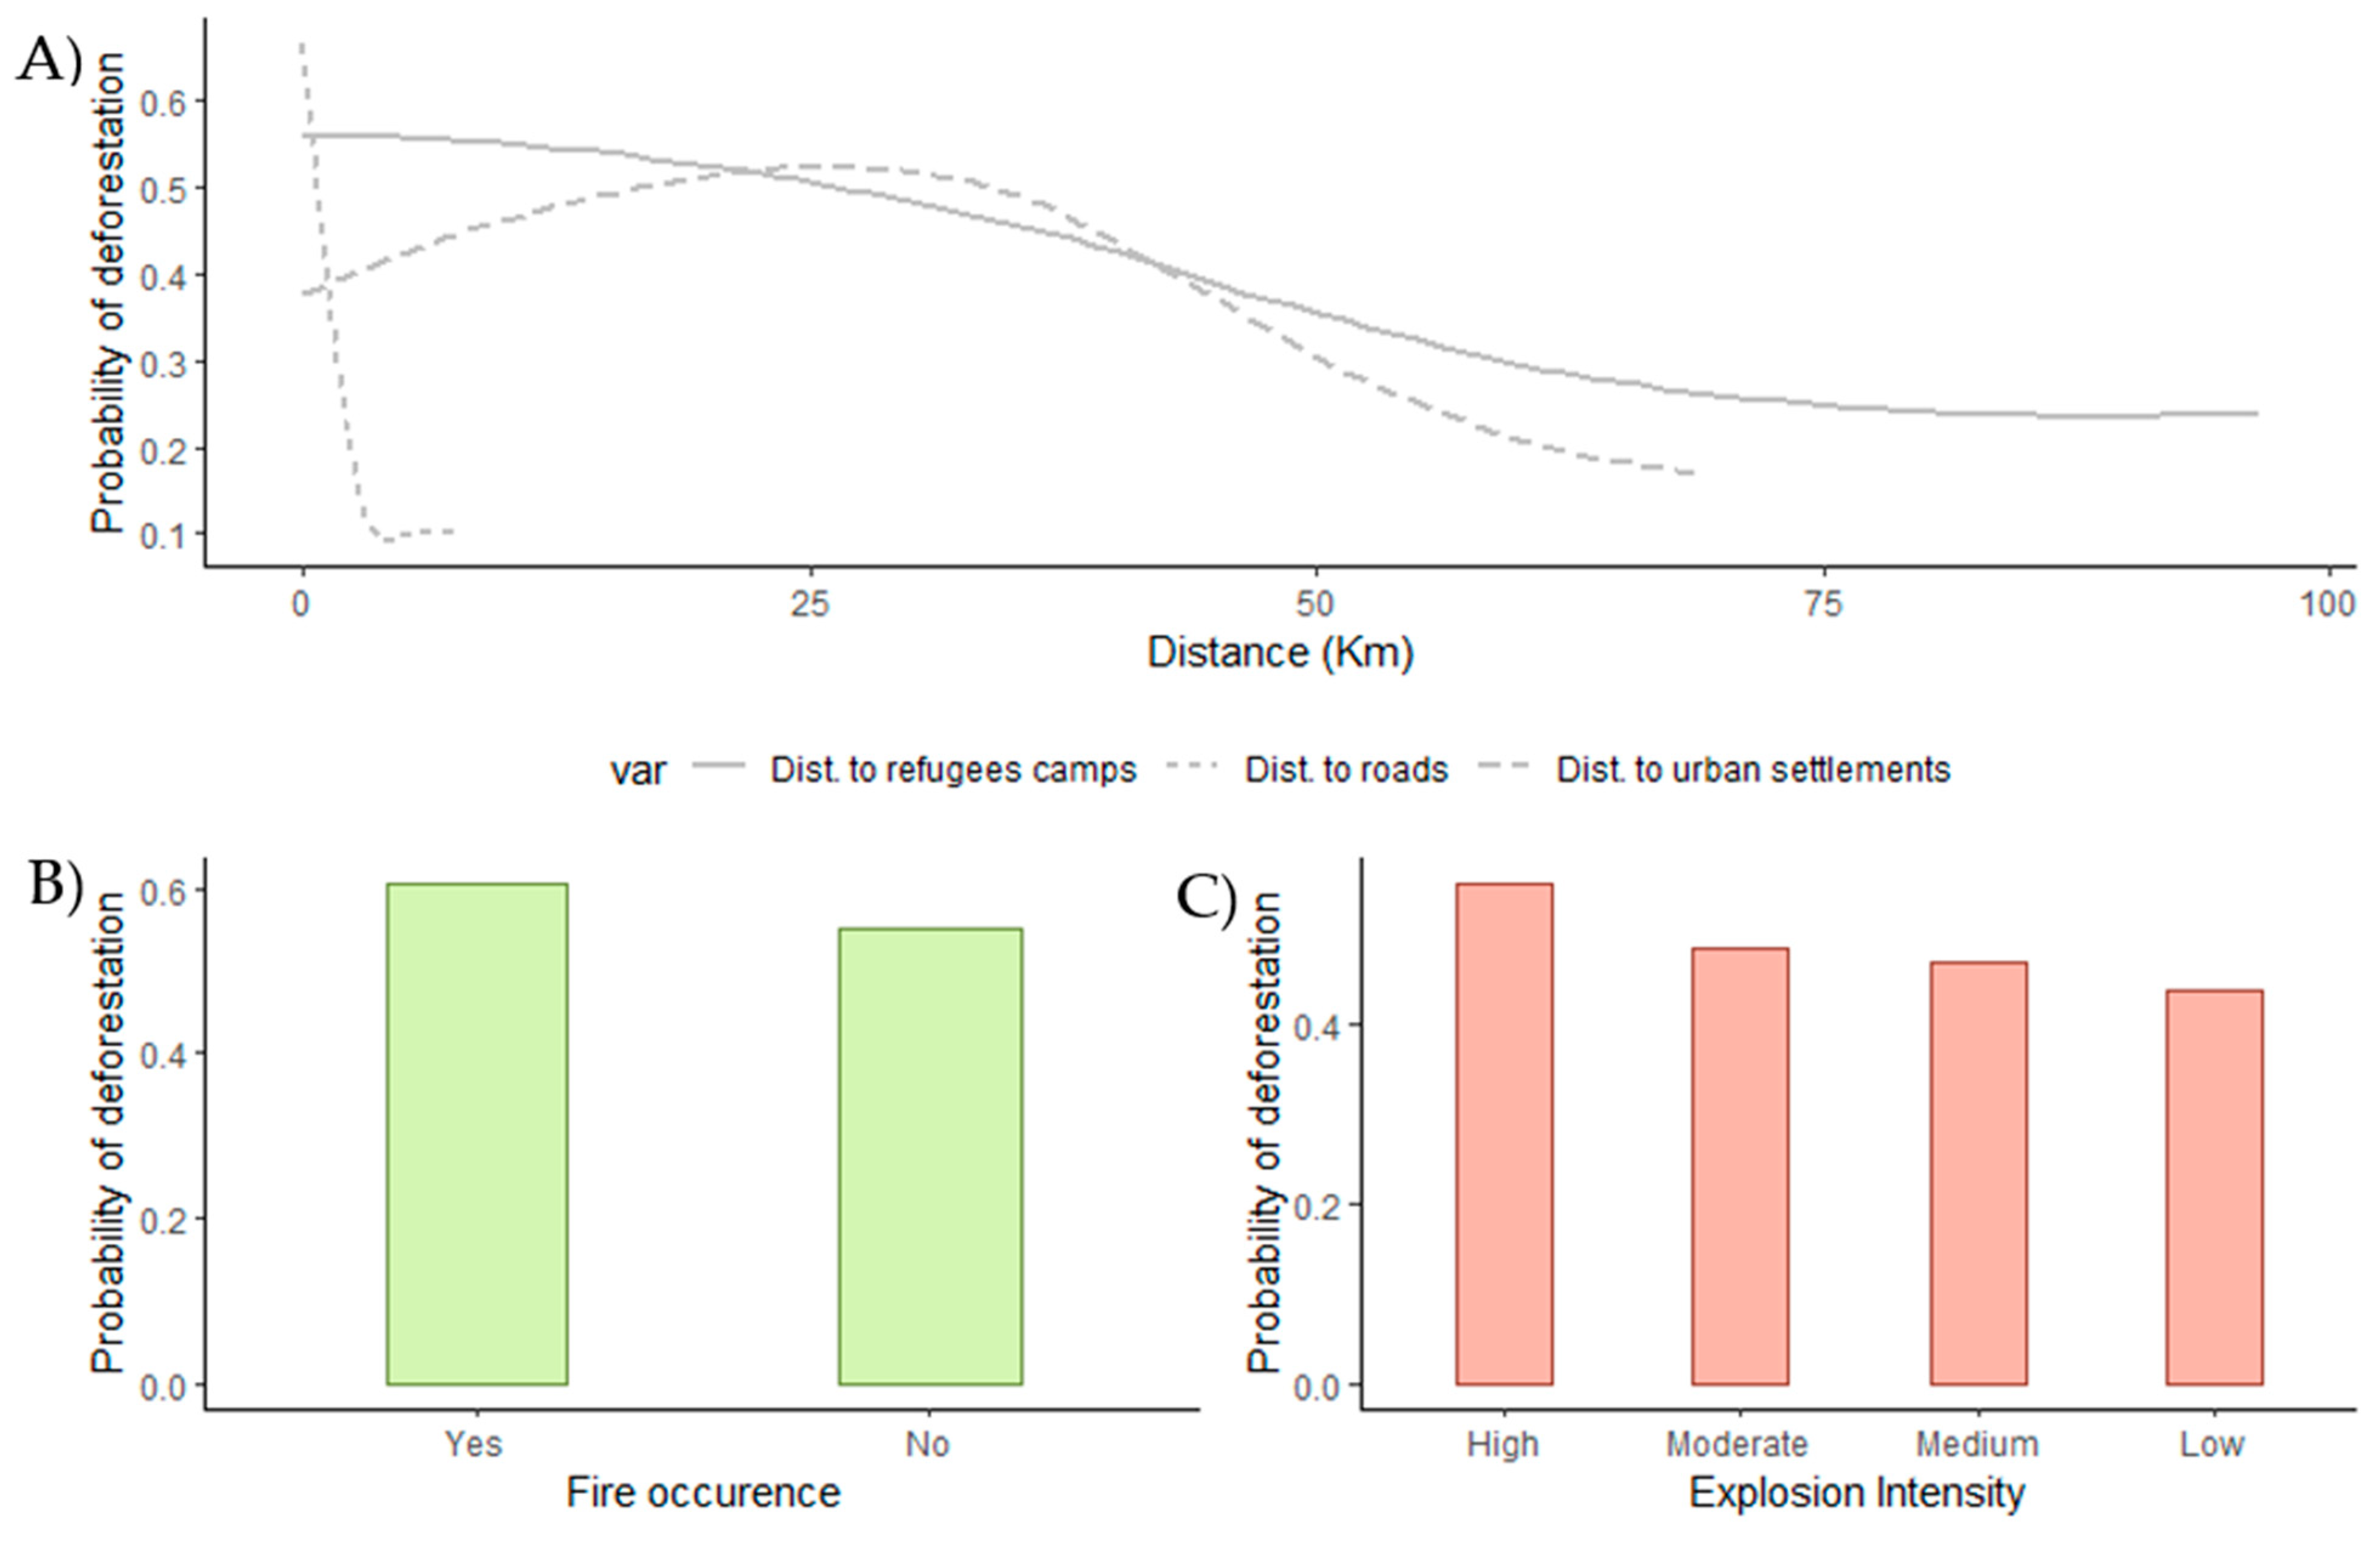
3.4. Continuous Variables: Distance to Roads, Urban Settlements, and Refugee Camps

We examined the relationship between road proximity to forests and deforestation. Results showed that the average distance between the deforested areas and the roads was 0.25 km and that the majority of deforested areas were within 0.04 to 0.39 km away from roads. A graph was created to show the marginal effect of road distance on deforestation probability (Figure 6). According to the findings, the probability of deforestation was higher in areas where forests were closer to roads.
For urban settlements, the average distance of the deforested areas was found to be 21.62 km and the majority of the deforested areas were between 12.6 and 30 km away from urban settlements. This indicated that the deforested areas were located much further away from urban settlements, with a wider variability in distance compared with roads.
For refugee camps, the average distance of deforested areas from the refugee camps was determined to be 28.55 km. However, higher rates of deforestation were observed to occur within a much smaller radius. The probability of deforestation was higher in areas that were located closer to refugee camps.

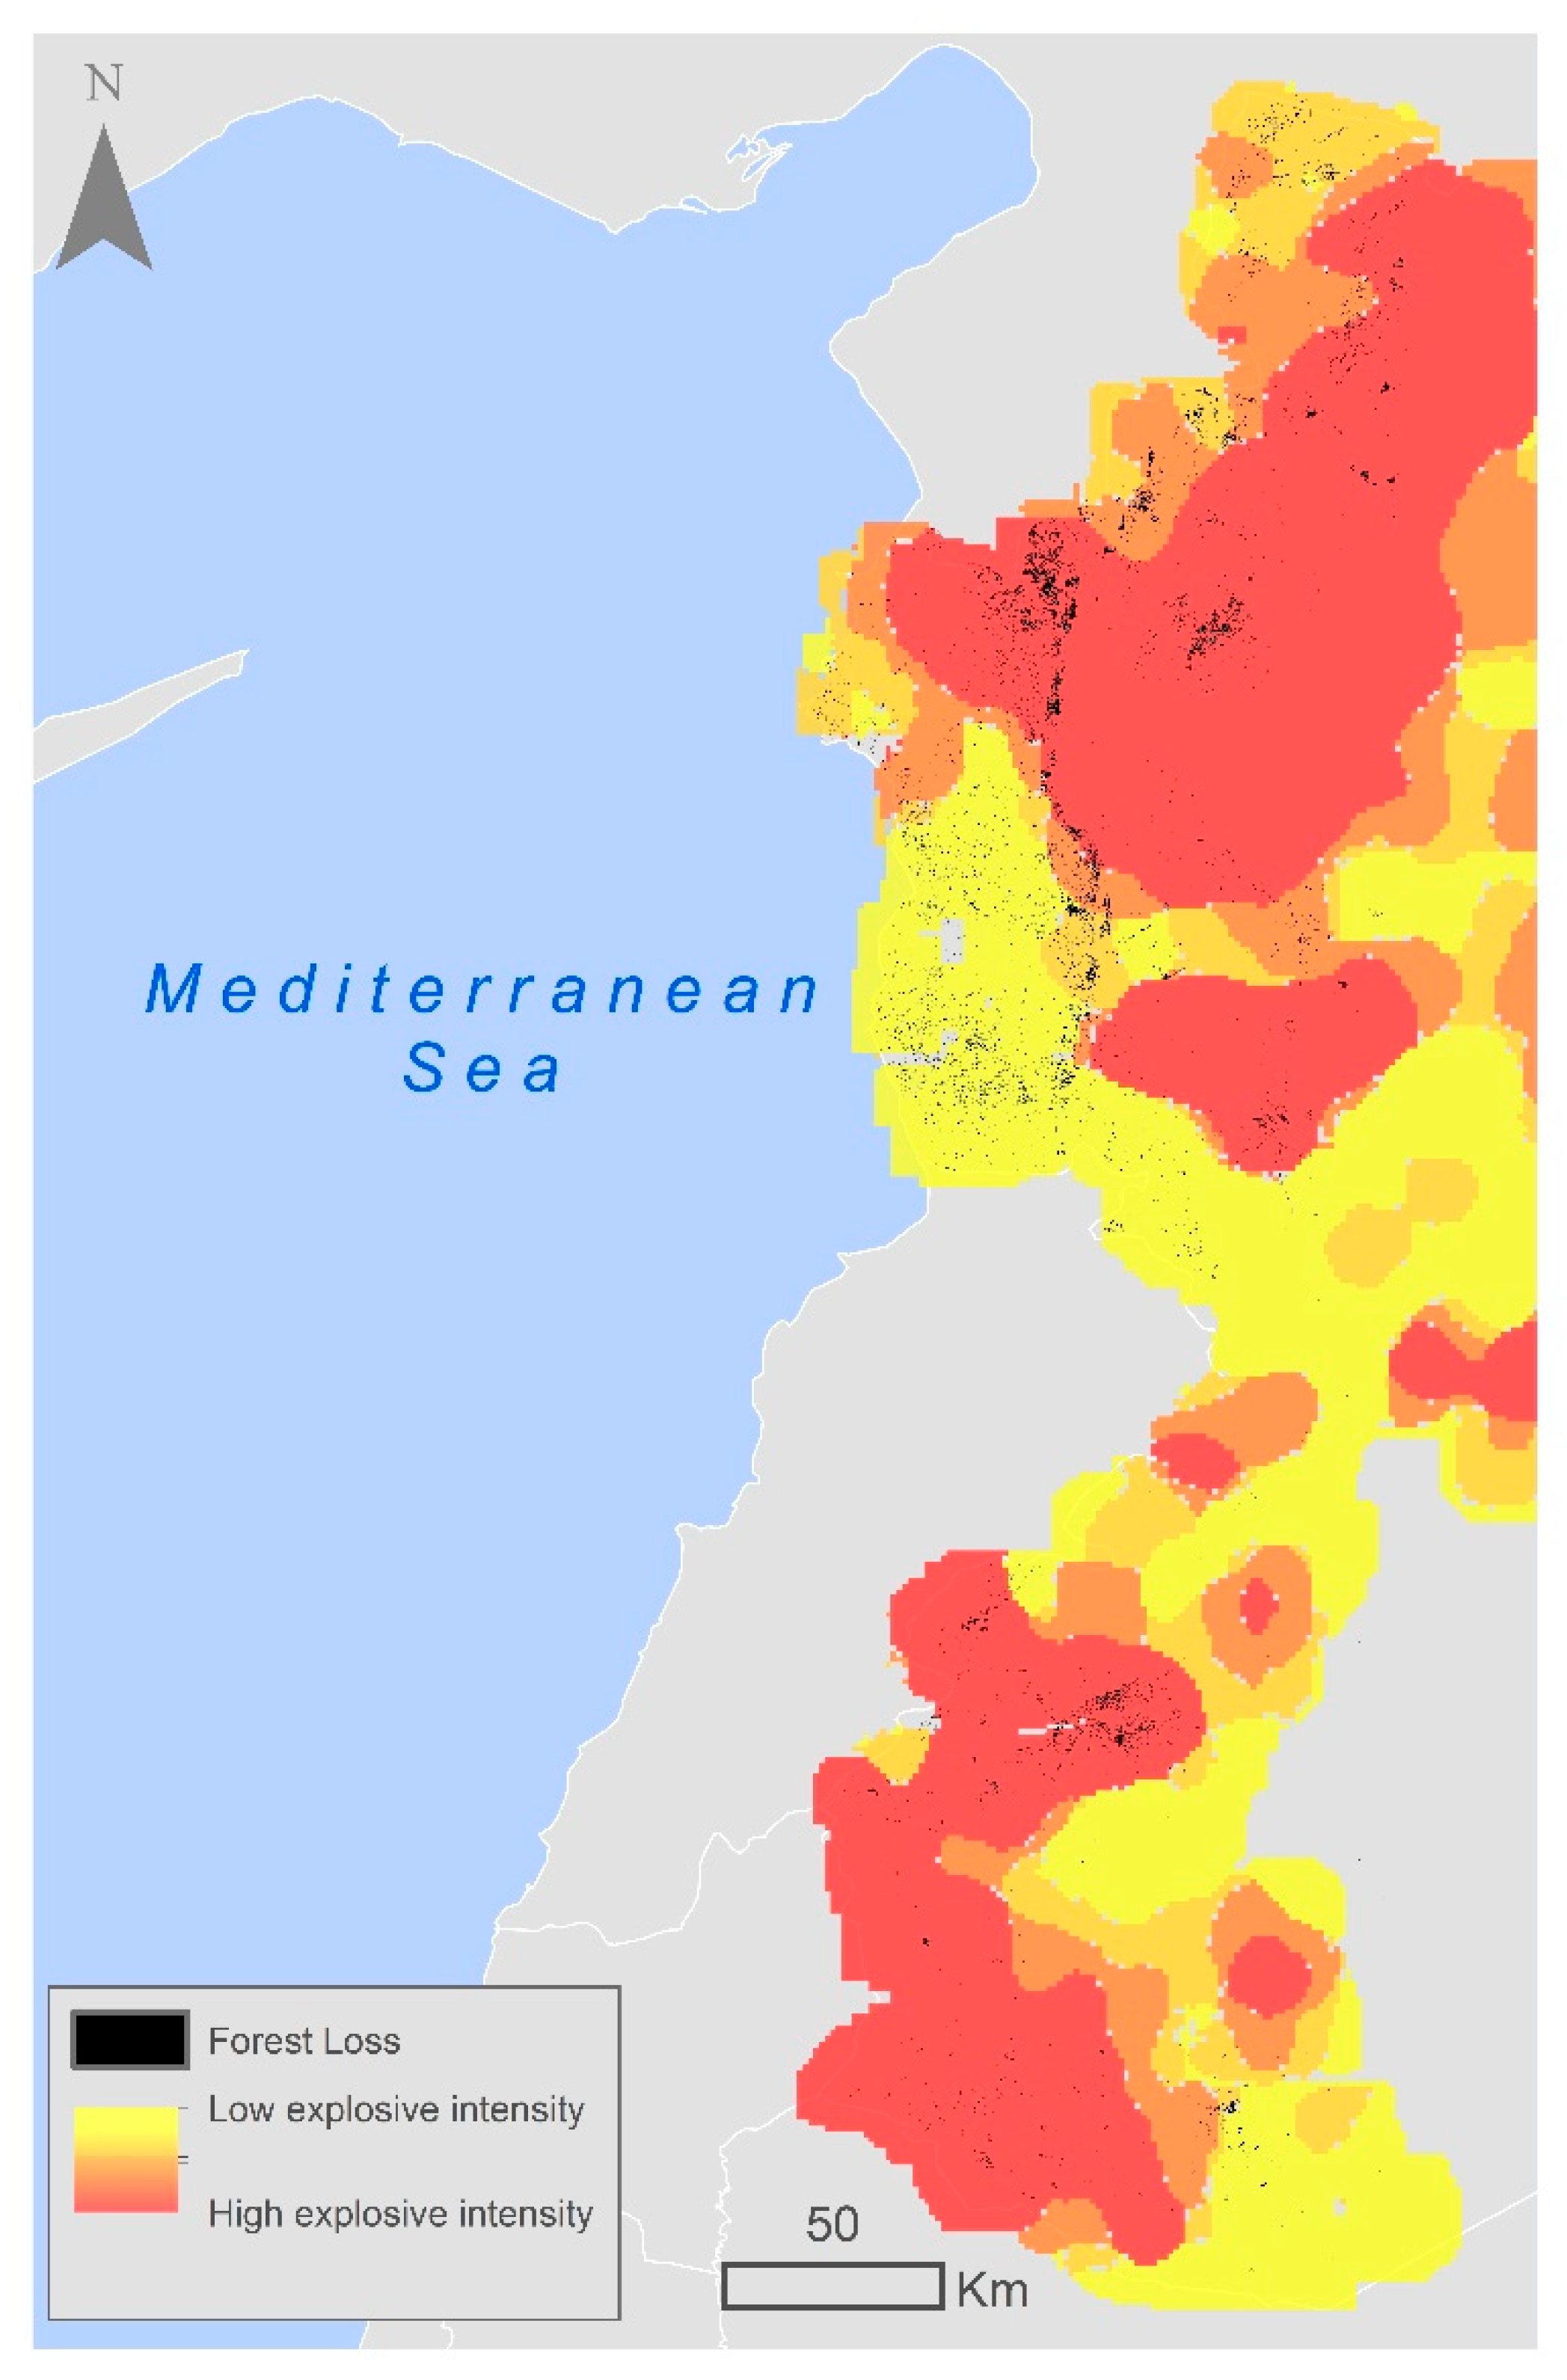
3.5. Discrete Variables: Intensity of Explosive Events

By overlaying the distribution of the deforested areas with the areas that experienced explosive events such as bombing and shelling, we found that over half of the total deforested land (53.7%) was located within the areas that experienced the highest level of explosive intensity, mainly in the north and northwestern parts of the study area. Additionally, 12.5% and 10.9% of the deforested area were found in regions with medium-intensity explosive events, while 20.3% of the deforested land was found in regions with low-intensity explosive events. Only 2.62% of the deforested land was found in areas that did not experience any explosive events during the study period (see Figure 7).
According to the analysis of MODIS fire data spanning from 2010 to 2019, a total of 15.24 thousand hectares of forest cover were burned, which constituted 23.4% of the overall decline in the forest cover in the study area (See Figure A2, Appendix A). The wildfire incidents were mainly concentrated in the northern and northwestern parts of the study area, corresponding to the regions with the highest deforestation rates, as shown in Figure 7.

4. Discussion

The models used in this study proved to be highly accurate in predicting deforestation, with an AUC value of 0.84 and density plots showing a clear distinction between deforested and non-deforested areas. The SVM land cover model achieved an overall predictive accuracy of 0.91 and a Kappa index of 0.83, which was consistent with previous studies that used machine learning algorithms such as Random Forests to predict deforestation. For instance, ref. [74] used SVM and MD classifiers to detect the deforestation caused by oil palm plantations in two locations in Peninsular Malaysia. The results indicated that combined Landsat and PALSAR data provided better accuracies than either data source alone for both study areas. Additionally, ref. [40] found that the SVM algorithm was more accurate than other machine learning models, as evidenced by its high AUC value of 0.90.
Our results indicated that, during the period of the armed conflict, the study area underwent a severe reduction in forest cover, resulting in a loss of 19.3% in 9 years from 2010 to 2019. In contrast, prior to the armed conflict, the forested areas in Syria exhibited a positive trend, with annual growth rates indicating a positive increase of 0.48% from 1997 to 2007, as reported by the Syrian Monitoring of Agricultural Resources [75]. The Food and Agriculture Organization also reported an increase of 119 thousand hectares in the forest cover in Syria from 1990 to 2010; this increase was mainly caused by the afforestation efforts made by the government to expand the forest cover in the country [76].
Before 2011, Syria used to produce around 30 million tree seedlings annually and the seedlings were dedicated to afforestation campaigns around the country. However, due to the conditions of the war, this number has decreased significantly to 1.5 million seedlings according to statistics from the Ministry of Agriculture [77].
The ongoing armed conflict has resulted in widespread poverty and increased financial strain on individuals, as well as a significant impact on the ability of the population to access basic necessities such as food and other essential items due to the sharp and unprecedented increase in prices [78]. This has created an economic crisis at both the local and national levels in Syria [78]. As a consequence of this economic crisis, sustained pressure has been applied on forest cover for several years, primarily due to the heavy logging needed to meet the high demand for firewood and charcoal from the local populations and surrounding urban areas. Oaks are the preferred tree species for logging according to loggers, as they prefer oak wood due to its high density and suitability for charcoal production [79]. This demand has increased due to the high cost of fuel and the severe cold during the winter months, which further has exacerbated the economic struggles of the population [80]. The relationship between poverty and deforestation has been extensively studied by researchers. Ref. [81] found that illegal logging in Central and Eastern Europe was explained by poverty, as well as weak law enforcement and land ownership reforms. In Cameroon, poverty was also identified as one of the factors underpinning illegal logging, along with conflicts and systemic corruption [82]. The informal sanctioning of logging activities of the rural poor, known as “humanizing the law”, has been observed in the Philippines as a strategy to avoid aggravating rural poverty and fueling civil insurgency [83,84]. The lack of alternative livelihood projects has been identified as a factor contributing to illegal logging and providing such projects has been suggested as a means of controlling it [84].
Our results also suggested that the areas with higher deforestation rates were found to be closer to the roads. This result may have several possible explanations. One possible reason is that roads provide more access to forested areas, making it easier and more efficient for people to cut down trees for firewood, charcoaling, or agricultural expansion. Another reason could be that the presence of roads leads to increased development and population growth, which in turn leads to more demand for resources and land use. This could be particularly true in the western coastal part of the study area, which has received more than 1.4 million internal migrants since the beginning of the conflict [80].
Ref. [85] found that deforestation rates were significantly higher near roads and rivers compared with other areas in the Amazon, with nearly 95% of all deforestation occurring within 5.5 km of roads. This result was consistent with our study, but our areas with higher deforestation rates were located in the most accessible areas (0.25 km on average, 0.04 to 0.39 km away from roads). Similarly, ref. [86] found a positive and significant correlation between road proximity and deforestation, indicating that the closer a forested area was to a road the more likely it was to be deforested. This relationship has often been driven by the reduced transportation costs associated with roads, which can incentivize increased economic activities and attract newcomers to the area, leading to further deforestation.
On the other hand, our study revealed that deforestation was more likely at greater distances from urban areas compared with roads. The highest rates of deforestation occurred between 12.6 and 30 km away from urban settlements. Interestingly, the majority of the deforestation was concentrated in the western part of the study area, where forests are located far from urban centers, especially on the western coastal mountain range. We suggest that this pattern may be attributed to the fact that loggers harvest wood in these remote forests and transport it to be sold in the city centers. It is also possible that the distance to urban settlements cannot be seen as an isolated factor contributing to the deforestation but is combined with other drivers such as roads that provide accessibility to transport from the forests to the wood markets.
The presence of refugees in camps can lead to deforestation, especially due to the demand for firewood. The collection of firewood for cooking and heating can result in the degradation of forest areas; firewood collection is often driven by income constraints and when the availability of substitutes for cooking fuel is limited [87]. For example, in the Rohingya camps in the southeastern border region of Bangladesh, the dense forest area decreased from 8.53 ha in 2016 to 4.49 ha in 2018 and the refugee settlement area increased from 271 ha in 2016 to 2679 ha in 2018 [88].
The use of firewood as an energy source has been a major issue in Syria, especially in besieged areas such as Idlib (northwest Syria). Nearly 90% of displaced people lack access to energy, which leads to numerous problems. The lack of access to energy makes it challenging for Internally Displaced People (IDPs) to meet their basic needs, including cooking and heating, which can lead to further environmental degradation as people turn to sources such as wood and use it in an unsustainable manner. The combination of these factors has resulted in widespread and illegal deforestation in the region, causing long-term environmental and humanitarian consequences [89]. The situation in Idlib and parts of Aleppo is complex and displacement appears to be a significant factor contributing to illegal logging. The massive influx of Internally Displaced People (IDPs) into the northwest provinces has resulted in the clearing of trees and the conversion of agricultural lands into temporary camps. Moreover, IDPs have resorted to cutting down trees to provide themselves with heating due to the soaring fuel prices and the bitterly cold winters that are prevalent in northern Syria [90].
The results of our study are consistent with previous research, indicating that deforestation rates are highest in areas closest to refugee camps (<9 km). Additionally, we found high deforestation values 28.5 km away from the refugee camps. Furthermore, we observed that refugee encroachment is unlikely to be the only factor causing deforestation, as the impacts extend beyond 28.5 km to up to 40 km from the camp. Hence, we suggest that other factors may contribute to deforestation, highlighting the complexity of this relationship between refugee camps and land-use change.
According to the United Nations Mine Action Service (UNMAS), Explosive Ordinance (EO) has been used in Syria through air and artillery strikes with rockets and mortars, as well as Improvised Explosive Devices (IEDs) and landmines, which have negatively impacted the civilian population [91]. Explosives not only have a negative impact on civilians, but they can also lead to forest fires. For example, the conflict in Ukraine has resulted in forest fires due to artillery shelling and bombing; in 2014, over 200 forest fires were caused by these actions in the Donbas region [92]. During the First World War, Germany, France, and Britain fired 1.45 billion shells, leading to massive deforestation in France, Belgium, and the surrounding regions [93]. Turkish forces have also set deliberate forest fires to diminish coverage for Kurdish fighters in the ongoing conflict with the Kurdistan Workers’ Party (PKK) [94].
Ref. [95] also reported that forest fires in the northern Al-Kabeer River basin of the northern Province of Latakia in Syria in 2012–2014 were mainly caused by the war and the firing of shells and bombs in the area. These findings support our conclusion that shelling and bombing can be major causes of forest fires and deforestation.
In addition to these causes, charcoal production by locals in forested areas could be another contributor to forest fires. This process involves “charring” or partially burning tree branches and firewood in a shallow pit covered with insulating cloth, which can be dangerous as it may lead to the spread of fire due to sparks generated by the lit wood, especially during the dry season [79]. Over 1500 licensed and unlicensed charcoal fire pits are believed to exist in the countryside of the coastal region in Syria, with profits that can reach 300%. This illegal trade serves as a vital source of income for the local population [96].
Based on our findings, forest fires were responsible for 23.4% of the forest cover decline in the study area, mainly concentrated in the northwest. Over 50% of the deforestation occurred in high-intensity explosive event zones. Shelling, bombing, and charcoaling were possibly associated with forest fires and deforestation in the study area.
While this study identified the most important war-related drivers of forest cover change, it did not fully explore the social and political factors that contribute to this phenomenon, as it lacked the possibility to acquire field data due to the ongoing conflict.

5. Conclusions

We used remote sensing and machine learning methods to quantify the spatial and temporal change of the forest area over the course of nine years (2010–2019) of war in Syria. According to our results, a substantial decline in forest cover in the study area was found during the armed conflict, with a total loss of 19.3%.
The armed conflict has had both direct and indirect effects on deforestation. The direct effect of the conflict on deforestation was driven by an escalation of violence, resulting in a high number of internally displaced individuals who relied on the forest for heating and cooking, given the absence of other energy sources. The intensity of explosive events in forested areas contributed to deforestation by causing fires, resulting from artillery shelling and bombing.
Indirectly, the conflict drove deforestation by increasing poverty, which led to greater reliance on the forest as a more affordable alternative fuel source and an additional source of income for local communities, with the absence of forest guards and forest law enforcement during the war. Furthermore, the roads played an important role by facilitating the access to forest resources by linking people to the forest and local wood markets in adjacent urban settlements.
This study provides valuable insight into the impact of armed conflicts on forest cover. It highlights the need to understand the role of war in post-war restoration and conservation efforts. In the post-war period, it is crucial for local governments to provide sustainable substitutions for heating and cooking. This would reduce the reliance on forests for fuel and prevent further deforestation. Governments should also enforce laws and regulations to protect forests and combat illegal logging. Additionally, reforestation efforts should be prioritized to restore damaged areas and promote the growth of new forests. This could include the planting of native species and the establishment of protected areas. The involvement of local communities in these efforts is also important, as they have a vested interest in the preservation of their local environment.

Author Contributions

A.D.: Writing—Original Draft, Investigation, Conceptualization. P.G.: Writing—Review and Editing, Methodology, Data Curation, Conceptualization. S.S.-M.: Writing—Review and Editing, Conceptualization. C.V.-G.: Writing—Review and Editing, Conceptualization. All authors have read and agreed to the published version of the manuscript.

Funding

This research was funded by Erasmus + program of the European Union, Mediterranean Forestry and Natural Resources Management program (MEDFOR), through a MSc grant to Angham Daiyoub.

Data Availability Statement

All data generated or analyzed during this study are included in this published article.

Conflicts of Interest

The authors declare no conflict of interest.

Appendix A

Table A1. Training and test data set for forest and non-forest classification.
TrainTest
Forest18001200
Non-Forest18001200
Table A2. SVM land cover classification accuracy assessment.
Reference
PredictionForestNon-forest
Forest1157158
Non-forest431042
Ov. Acc.: 91%Kappa: 0.83
Table A3. Aggregate precision metrics for each model size. Selected variables are highlighted in light yellow.
VariableAverage InfluenceSD Influence
TCW96.043.34
HV_corr45.832.77
HH_corr43.882.22
HH_var36.472.26
HV_savg34.651.45
HH_savg22.161.46
HV21.211.46
HH20.902.33
HV_var19.871.09
HV_ent19.580.91
HH_ent19.461.79
Figure A1. Deforestation probability in the study area.
Land 12 01509 g0a1
Figure A2. Deforestation and burned areas.
Land 12 01509 g0a2

References

  1. Midgley, G.F.; Thuiller, W. Potential responses of terrestrial biodiversity in Southern Africa to anthropogenic climate change. Reg. Environ. Chang. 2011, 11 (Suppl. S1), 127–135. [Google Scholar] [CrossRef]
  2. Naveh, Z.; Lieberman, A.S. The Evolution of Landscape Ecology. In Landscape Ecology; Springer: New York, NY, USA, 1994. [Google Scholar]
  3. Schaphoff, S.; Lucht, W.; Gerten, D.; Sitch, S.; Cramer, W.; Prentice, I.C. Terrestrial biosphere carbon storage under alternative climate projections. Clim. Chang. 2006, 74, 97–122. [Google Scholar] [CrossRef]
  4. Scholze, M.; Knorr, W.; Arnell, N.W.; Prentice, I.C. A climate-change risk analysis for world ecosystems. Proc. Natl. Acad. Sci. USA 2006, 103, 13116–13120. [Google Scholar] [CrossRef] [PubMed]
  5. Schulz, J.J.; Cayuela, L.; Rey-Benayas, J.M.; Schröder, B. Factors influencing vegetation cover change in Mediterranean Central Chile (1975–2008). Appl. Veg. Sci. 2011, 14, 571–582. [Google Scholar] [CrossRef] [Green Version]
  6. Hanson, T.; Brooks, T.M.; DA Fonseca, G.A.B.; Hoffmann, M.; Lamoreux, J.F.; Machlis, G.; Mittermeier, C.G.; Mittermeier, R.A.; Pilgrim, J.D. Warfare in biodiversity hotspots. Conserv. Biol. 2009, 23, 578–587. [Google Scholar] [CrossRef] [PubMed]
  7. Gbanie, S.; Griffin, A.; Thornton, A. Impacts on the Urban Environment: Land Cover Change Trajectories and Landscape Fragmentation in Post-War Western Area, Sierra Leone. Remote Sens. 2018, 10, 129. [Google Scholar] [CrossRef] [Green Version]
  8. Dudley, J.P.; Ginsberg, J.R.; Plumptre, A.J.; Hart, J.A.; Campos, L.C. Effects of war and civil strife on wildlife and wildlife habitats. Conserv. Biol. 2002, 16, 319–329. [Google Scholar] [CrossRef] [Green Version]
  9. Quist, M.C.; Fay, P.A.; Guy, C.S.; Knapp, A.K.; Rubenstein, B.N. Military training effects on terrestrial and aquatic communities on a grassland military installation. Ecol. Appl. 2003, 13, 432–442. [Google Scholar] [CrossRef]
  10. Hutchinson, J.M.S.; Jacquin, A.; Hutchinson, S.L.; Verbesselt, J. Monitoring vegetation change and dynamics on U.S. Army training lands using satellite image time series analysis. Anal. J. Environ. Manag. 2015, 150, 301–4797. [Google Scholar] [CrossRef]
  11. Collier, P. Breaking the Conflict Trap: Civil War and Development Policy; Wold Bank Publications: Washington, DC, USA, 2003; Volume 41181. [Google Scholar]
  12. McNeely, J.A. Biodiversity, War, and Tropical Forests. J. Sustain. For. 2003, 16, 1–20. [Google Scholar] [CrossRef]
  13. Hart, T.; Mwinyihali, R. Armed Conflict and Biodiversity in Sub-Saharan Africa: The Case of the Democratic Republic of Congo (DRC); Biodiversity Support Programme (BSP): Washington, DC, USA, 2001. [Google Scholar]
  14. FAO. Global Forest Resources 2005 Assessment: Progress towards Sustainable Forest Management. 2006. Available online: https://www.fao.org/publications/card/es/c/4821656d-4806-5c6f-9a7d-ec5d702c29a6/ (accessed on 7 May 2023).
  15. Nietschmann, B. Conservation by conflict in Nicaragua.social analysis: Rethinking Some West African Environmental Natural History. Nat. Hist. 1990, 11, 42–49. [Google Scholar]
  16. Hart, T.; Hart, J.; Fimbel, C.; Fimbel, R. Conservation and civilstrife: Two perspectives from Central Africa. Onservation Biol. 1997, 11, 308–310. [Google Scholar] [CrossRef]
  17. Plumptre, A.J. Lessons learned from on-the ground conservation in Rwanda and the Democratic Republic of the Congo. J. Sustain. For. 2003, 16, 71–92. [Google Scholar] [CrossRef]
  18. Ordway, E.M. Political shifts and changing forests: Effects of armed conflict on forest conservation in Rwanda. Glob. Ecol. Conserv. 2015, 3, 448–460. [Google Scholar] [CrossRef] [Green Version]
  19. Formoli, T.A. Impacts of the Afghan–Soviet War on Afghanistan’s Environment. Environ. Conserv. 1995, 22, 66–69. [Google Scholar] [CrossRef]
  20. Esmail, M.; Zurmati, G.Y. Request for Protection and Surveillance of Afghanistan’s Forests; Afghanistan Forest Protect Project MADERA: Peshawar, Pakistan, 1991; Volume 12. [Google Scholar]
  21. Mcpherson, N.; Fernando, B.K. Opportunities for Improved Environmental Management in Afghanistan: Report of a Mission under Contract to UNOCA; World Conservation Union (IUCN): Gland, Switzerland, 1991; Volume 66. [Google Scholar]
  22. Siddig, A.A.H. Biodiversity of Sudan: Between the harsh conditions, political instability and civil wars. Biodivers. J. 2014, 5, 545–555. [Google Scholar]
  23. Gaafar, A. Forest plantations and woodlots in Sudan. African For. Forum Ser. 2011, 1, 15–20. [Google Scholar]
  24. Ehteshami, A.; Huber, D.; Paciello, M.C. The Mediterranean Reset: Geopolitics in a New Age. In Global Policy; John Wiley: Hoboken, NJ, USA, 2017. [Google Scholar]
  25. MEDSEC. Environment and Security Issues in the Southern Mediterranean Region. 2009, p. 52. Available online: https://www.grida.no/resources/8337 (accessed on 7 May 2023).
  26. Zaimeche, S.E. The Consequences of Rapid Deforestation: A North African Example. Ambio 1994, 23, 136–140. Available online: http://www.jstor.org/stable/4314180 (accessed on 7 May 2023).
  27. Ministère de l’agriculture et de la réforme agraire (MAR). Statistique Agricole Volume 1 de Etudes et Enquêtes; Ministère de l’Agriculture et de la Réforme Agraire: Paris, France, 1966. [Google Scholar]
  28. Mitri, G.; Nader, M.; Van der Molen, I.; Lovett, J. Evaluating exposure to land degradation in association with repetitive armed conflicts in North Lebanon using multi-temporal satellite data. Environ. Monit. Assess. 2014, 186, 7655–7672. [Google Scholar] [CrossRef]
  29. United Nations. UN News. 2023. Available online: https://news.un.org/en/focus/syria (accessed on 20 April 2023).
  30. OCHA. Annual Report. 2017. Available online: https://www.unocha.org/publication/ocha-annual-report/ocha-annual-report-2017 (accessed on 3 April 2023).
  31. Abdo, H.G. Impacts of war in Syria on vegetation dynamics and erosion risks in Safita area, Tartous, Syria. Reg. Environ. Chang. 2018, 18, 1707–1719. [Google Scholar] [CrossRef]
  32. Barakat, M.; Mahfoud, I.; Kwyes, A. Study of soil erosion risk in thebasin of Northern Al-Kabeer river at Lattakia-Syria using remotesensing and GIS techniques. Mesopotamian J. Mar. Sci. 2014, 29, 29–44. [Google Scholar] [CrossRef]
  33. Boyd, D.S.; Danson, F.M. Satellite remote sensing of forest resources: Three decades of research development. Prog. Phys. Geogr. 2005, 29, 1–26. [Google Scholar] [CrossRef]
  34. Joseph, S.; Murthy, M.S.R.; Thomas, A.P. The progress on remote sensing technology in identifying tropical forest degradation: A synthesis of the present knowledge and future perspectives. Environ. Earth Sci. 2011, 64, 731–741. [Google Scholar] [CrossRef]
  35. Myers, N. Tropical deforestation and remote sensing. For. Ecol. Manag. 1988, 23, 215–225. [Google Scholar] [CrossRef]
  36. Bhattacharya, M. Machine Learning for Bioclimatic Modelling. Int. J. Adv. Comput. Sci. Appl. 2013, 4, 1–8. [Google Scholar] [CrossRef] [Green Version]
  37. Devasena, L. Comparative Analysis of Random Forest, REP Tree and J48 Classifiers for Credit Risk Prediction. Int. J. Comput. Appl. 2014, 975, 975–8887. [Google Scholar]
  38. Hsieh, W.W. Machine Learning Methods in the Environmental Sciences: Neural Networks and Kernels; Cambridge University Press: Cambridge, UK, 2009. [Google Scholar]
  39. Huang, Y.; Zhao, L. Review on landslide susceptibility mapping using support vector machines. Catena 2018, 165, 520–529. [Google Scholar] [CrossRef]
  40. Saha, S.; Bhattacharjee, S.; Shit, P.K.; Sengupta, N.; Bera, B. Deforestation probability assessment using integrated machine learning algorithms of Eastern Himalayan foothills (India). Resour. Conserv. Recycl. Adv. 2022, 14, 200077. [Google Scholar] [CrossRef]
  41. Khan, S.A.; Gulfishan, M.; Mir, R.A.; Andrabi, A.H. Forest cover change detection through modern applications and its environmental impacts, A review. Int. J. Ecol. Environ. Sci. 2022, 4, 75–82. [Google Scholar]
  42. Gorsevski, V.B. Impacts of Conflict on Land Use and Land Cover in the Imatong Mountain Region of South Sudan and Northern Uganda. Ph.D. Thesis, University of Maryland, College Park, MD, USA, 2012. [Google Scholar]
  43. Eklund, L.; Persson, A.; Pilesjö, P. Cropland changes in times of conflict, reconstruction, and economic development in Iraqi Kurdistan. Ambio 2016, 45, 78–88. [Google Scholar] [CrossRef] [Green Version]
  44. Estel, S.; Kuemmerle, T.; Alcántara, C.; Levers, C.; Prishchepov, A.; Hostert, P. Mapping farmland abandonment and recultivation across Europe using MODIS NDVI time series. Remote Sens. Environ. 2015, 163, 312–325. [Google Scholar] [CrossRef]
  45. Estel, S.; Kuemmerle, T.; Levers, C.; Baumann, M.; Hostert, P. Mapping cropland-use intensity across Europe using MODIS NDVI time series. Environ. Res. Lett. 2016, 11, 024015. [Google Scholar] [CrossRef] [Green Version]
  46. Alcantara, C.; Kuemmerle, T.; Baumann, M.; Bragina, E.V.; Griffiths, P.; Hostert, P.; Knorn, J.; Müller, D.; Prishchepov, A.V.; Schierhorn, F.; et al. Mapping the extent of abandoned farmland in Central and Eastern Europe using MODIS time series satellite data. Environ. Res. Lett. 2013, 8, 035035. [Google Scholar] [CrossRef]
  47. Ghazal, A. Landscape Ecological, Phytosociological and Geobotanical Study of Eu-Mediterranean in West of Syria; University of Hohenheim, Faculty of Agricultural Sciences: Stuttgart, Germany, 2008. [Google Scholar]
  48. Forestry Statistics. Syrian National Forestry Statistics; The Syrian Ministry of Agriculture: Damascus, Syria, 2005.
  49. Nahal, I. The Mediterranean climate from a biological viewpoint. In Mediterranean-Type Shrublands of the World; di Castri, F., Goodall, D.W., Specht, R.L., Eds.; Elsevier: Amsterdam, The Netherlands, 1981. [Google Scholar]
  50. Gorelick, N.; Hancher, M.; Dixon, M.; Ilyushchenko, S.; Thau, D.; Moore, R. Google Earth Engine: Planetary-scale geospatial analysis for everyone. Remote Sens. Environ. 2017, 202, 18–27. [Google Scholar] [CrossRef]
  51. Kennedy, R.E.; Yang, Z.; Cohen, W.B. Detecting trends in forest disturbance and recovery using yearly Landsat time series: 1. LandTrendr—Temporal segmentation algorithms. Remote Sens. Environ. 2010, 114, 2897–2910. [Google Scholar] [CrossRef]
  52. Gelabert, P.J.; Rodrigues, M.; de la Riva, J.; Ameztegui, A.; Sebastià, M.T.; Vega-Garcia, C. LandTrendr smoothed spectral profiles enhance woody encroachment monitoring. Remote Sens. Environ. 2021, 262, 112521. [Google Scholar] [CrossRef]
  53. Kennedy, R.E.; Yang, Z.; Gorelick, N.; Braaten, J.; Cavalcante, L.; Cohen, W.B.; Healey, S. Implementation of the LandTrendr algorithm on Google Earth Engine. Remote Sens. 2018, 10, 691. [Google Scholar] [CrossRef] [Green Version]
  54. Crist, E.P.; Cicone, R.C. A Physically-Based Transformation of Thematic Mapper Data—The TM Tasseled Cap. IEEE Trans. Geosci. Remote Sens. 1984, GE-22, 256–263. [Google Scholar] [CrossRef]
  55. Matasci, G.; Hermosilla, T.; Wulder, M.A.; White, J.C.; Coops, N.C.; Hobart, G.W.; Bolton, D.K.; Tompalski, P.; Bater, C.W. Three decades of forest structural dynamics over Canada’s forested ecosystems using Landsat time-series and lidar plots. Remote Sens. Environ. 2018, 216, 697–714. [Google Scholar] [CrossRef]
  56. Crist, E.P. A TM Tasseled Cap equivalent transformation for reflectance factor data. Remote Sens. Environ. 1985, 17, 301–306. [Google Scholar] [CrossRef]
  57. Roy, D.P.; Kovalskyy, V.; Zhang, H.K.; Vermote, E.F.; Yan, L.; Kumar, S.S.; Egorov, A. Characterization of Landsat-7 to Landsat-8 reflective wavelength and normalized difference vegetation index continuity. Remote Sens. Environ. 2016, 185, 57–70. [Google Scholar] [CrossRef] [PubMed] [Green Version]
  58. Shimada, M.; Itoh, T.; Motooka, T.; Watanabe, M.; Shiraishi, T.; Thapa, R.; Lucas, R. New global forest/non-forest maps from ALOS PALSAR data (2007–2010). Remote Sens. Environ. 2014, 155, 13–31. [Google Scholar] [CrossRef]
  59. Sen Lee, J. Refined filtering of image noise using local statistics. Comput. Graph. Image Process. 1981, 15, 380–389. [Google Scholar] [CrossRef]
  60. Haralick, R.M.; Shanmugam, K.; Dinstein, I.H. Textural Features for Image Classification. IEEE Trans. Syst. Man Cybern. 1973, 165, 520–529. [Google Scholar] [CrossRef] [Green Version]
  61. Potapov, P.; Li, X.; Hernandez-Serna, A.; Tyukavina, A.; Hansen, M.C.; Kommareddy, A.; Pickens, A.; Turubanova, S.; Tang, H.; Silva, C.E.; et al. Mapping global forest canopy height through integration of GEDI and Landsat data. Remote Sens. Environ. 2021, 253, 112165. [Google Scholar] [CrossRef]
  62. Breiman, L. Random forests. Mach. Learn. 2001, 45, 5. [Google Scholar] [CrossRef] [Green Version]
  63. Cortes, C.; Vapnik, V. Support-Vector Networks. Mach. Learn. 1995, 20, 273–297. [Google Scholar] [CrossRef]
  64. Vapnik, V. The Nature of Statistical Learning Theory; Springer: New York, NY, USA, 1995. [Google Scholar] [CrossRef]
  65. Kavzoglu, T.; Colkesen, I. A kernel functions analysis for support vector machines for land cover classification. Int. J. Appl. Earth Obs. Geoinf. 2009, 11, 352–359. [Google Scholar] [CrossRef]
  66. Noi, P.T.; Kappas, M. Comparison of random forest, k-nearest neighbor, and support vector. Sensors 2017, 18, 18. [Google Scholar]
  67. Kuhn, M. Building predictive models in R using the caret package. J. Stat. Softw. 2008, 28, 1–26. [Google Scholar] [CrossRef] [Green Version]
  68. Hijmans, R.J. Raster: Geographic Data Analysis and Modeling. 2019. Available online: https://cran.r-project.org/web/packages/raster/index.html (accessed on 13 October 2022).
  69. McHugh, M.L. Interrater reliability: The kappa statistic. Biochem. Medica 2012, 22, 276–282. [Google Scholar] [CrossRef]
  70. OpenStreetMap Contributors. Planet Dump. 2023. Available online: https://planet.osm.org (accessed on 13 October 2022).
  71. U.S. Department of State Humanitarian Information Unit. Syria IDP Sites. Available online: https://data.humdata.org/dataset/syria-idp-sites (accessed on 13 October 2022).
  72. Giglio, L.; Boschetti, L.; Roy, D.P.; Humber, M.L.; Justice, C.O. The Collection 6 MODIS. Remote Sens. Environ. 2018, 217, 72–85. [Google Scholar] [CrossRef]
  73. UNOCHA. Syrian Arab Republic—Humanitarian Needs Overview; UNOCHA: New York, NY, USA, 2021; p. 53. [Google Scholar]
  74. Cheng, Y.; Yu, L.; Cracknell, A.P.; Gong, P. Oil palm mapping using Landsat and PALSAR: A case study in Malaysia. Int. J. Remote Sens. 2016, 37, 5431–5442. [Google Scholar] [CrossRef]
  75. Martini, G. Forest Sector Policy and Institutional Development; Forest Institutions in Syrian Forestry Sector: Latakia, Syria, 2009. [Google Scholar]
  76. FAO. Global Forest Resources Assessment 2015: Country Report—Syrian Arab Republic; FAO: Rome, Italy, 2014; Available online: https://www.fao.org/documents/card/en?details=c700748b-7581-4394-a946-3d9e7540f2db%2F (accessed on 12 November 2022).
  77. SANA. Ministry of Agriculture: The Production of Forest Seedlings Is Gradually Regaining Its Size, and Most of the Forest FIRES Were Intentional; Syrian Arab News Agency: Damascus, Syria, 2020; Available online: https://sana.sy/?p=1124278 (accessed on 5 June 2023).
  78. ReliefWeb. Syria: Unprecedented Rise in Poverty Rate, Significant Shortfall in Humanitarian Aid Funding. 2022. Available online: https://reliefweb.int/report/syrian-arab-republic/syria-unprecedented-rise-poverty-rate-significant-shortfall-humanitarian-aid-funding-enar (accessed on 5 June 2023).
  79. Raseef22. Random Loggers Turn Syria’s Oak Tree Forests to Charcoal. 2022. Available online: https://raseef22.net/english/article/1090178-random-loggers-turn-syrias-oak-tree-forests-to-charcoal (accessed on 5 April 2023).
  80. Mohamed, M.A. An assessment of forest cover change and its driving forces in the syrian coastal region during a period of conflict, 2010 to 2020. Land 2021, 10, 191. [Google Scholar] [CrossRef]
  81. Bouriaud, L. Causes of illegal logging in Central and Eastern Europe. Small-Scale For. Econ. Manag. Policy 2005, 4, 269–291. [Google Scholar] [CrossRef]
  82. Cunningham, A.B.; Tientcheu, M.L.A.; Anoncho, V.F.; Nkuinkeu, R.; Sunderland, T. Power, profits and policy: A reality check on the Prunus africana bark trade. CIFOR Work. Pap. 2014, 153, 17. [Google Scholar]
  83. van den Top, G.M. The Social Dynamics of Deforestation in the Sierra Madre, Philippines; Leiden University: Leiden, The Netherlands, 1998. [Google Scholar]
  84. van der Ploeg, J.; Araño, R.R.; Van Weerd, M. What local people think about crocodiles: Challenging environmental policy narratives in the Philippines. J. Environ. Dev. 2011, 20, 303–328. [Google Scholar] [CrossRef]
  85. Barber, C.P.; Cochrane, M.A.; Souza, C.M.; Laurance, W.F. Roads, deforestation, and the mitigating effect of protected areas in the Amazon. Biol. Conserv. 2014, 177, 203–209. [Google Scholar] [CrossRef]
  86. De Luca, G. Roads, Development and Deforestation: A review. At Loggerheads? Agricultural Expansion, Poverty Reduction, and Environment in the Tropical Forests. 2006, p. 308. Available online: https://elibrary.worldbank.org/doi/abs/10.1596/978-0-8213-6735-3 (accessed on 12 November 2022).
  87. Salemi, C. Refugee camps and deforestation in Sub-Saharan Africa. J. Dev. Econ. 2021, 152, 102682. [Google Scholar] [CrossRef]
  88. Ahmed, N.; Islam, M.N.; Hasan, M.F.; Motahar, T.; Sujauddin, M. Understanding the political ecology of forced migration and deforestation through a multi-algorithm classification approach: The case of Rohingya displacement in the southeastern border region of Bangladesh. Geol. Ecol. Landsc. 2019, 3, 282–294. [Google Scholar] [CrossRef]
  89. Syria Untold. War on the Forests of the Syrian Coast. 2019. Available online: https://syriauntold.com/2019/06/06/war-on-the-forests-of-the-syrian-coast/ (accessed on 15 April 2023).
  90. Christou, W. Looting, Burning, Cutting: How a Decade of War Has Shrunk Syria’s Forests. Syria Direct. 2020. Available online: https://syriadirect.org/looting-burning-cutting-how-a-decade-of-war-has-shrunk-syrias-forests/ (accessed on 20 April 2023).
  91. ReliefWeb. Explosive Ordnance in Syria: Impact and Required Action. 2022. Available online: https://reliefweb.int/report/syrian-arab-republic/explosive-ordnance-syria-impact-and-required-action-report-may-2022 (accessed on 10 January 2023).
  92. Ministry of Ecology and Natural Resources of Ukraine (MENR). Regulation on the Project for Planning the Territory of the National Nature Park, Conservation, Restoration and Recreational Use of Its Natural Systems and Sites; Decree of MENR No. 273 of 21.08.2014; MENR: Kyiv, Ukraine, 2014. [Google Scholar]
  93. Heiderscheidt, J.A. The Impact of World War One on the Forests and Soils of Europe. Ursidae Undergrad. Res. J. Univ. North. Color. 2018, 7, 3. Available online: https://digscholarship.unco.edu/urjAvailableat:https://digscholarship.unco.edu/urj/vol7/iss3/3 (accessed on 12 November 2022).
  94. Hanson, T. Biodiversity conservation and armed conflict: A warfare ecology perspective. Ann. N. Y. Acad. Sci. 2018, 1429, 50–65. [Google Scholar] [CrossRef] [PubMed]
  95. Almohamad, H. Impact of land cover change due to armed conflicts on soil erosion in the basin of the northern al-kabeer river in syria using the rusle model. Water 2020, 12, 3323. [Google Scholar] [CrossRef]
  96. Kassioun. Wildfires in Syria: What Is the Accurate Number and What Is the Actual Cause? 2020. Available online: https://kassioun.org/en/articles/item/65965-wildfires-in-syria-what-is-the-accurate-number-and-what-is-the-actual-cause (accessed on 20 April 2023).
Figure 1. The study area.
Land 12 01509 g001
Figure 2. Model accuracy across different model sizes. Red dot represents the optimum number of variables.
Land 12 01509 g002
Figure 3. Receiver curve operator (ROC).
Land 12 01509 g003
Figure 4. Density histograms of predicted probability classified as deforested (red) and non-deforested (green).
Land 12 01509 g004
Figure 5. (A) Map showcasing the extent of deforestation between 2010 and 2019, highlighting areas of forest loss. (B) Graph illustrating the trends in forest and non-forest areas from 2010 to 2019, depicting changes over the decade.
Land 12 01509 g005
Figure 6. Partial dependence plots. (A) Represents the marginal effect of continuous variables (the Euclidean distance to the refugee camp, the Euclidean distance to the nearest road, and the Euclidean distance to the nearest village) in deforestation probability. (B) Represents the marginal effect of binary variables (fire occurrence). (C) Represents the marginal effect of categorical variables (weapons explosion intensity) on deforestation probability.
Land 12 01509 g006
Figure 7. The distribution of deforested areas in different intensities of explosive events.
Land 12 01509 g007
Table 1. Trends in accumulated forest loss, remaining forest area, and lost forested area from 2010 to 2019.
YearAccumulated Loss (%)Remaining Forest Area (ha)Lost Forested Area (ha)
20100337,5000
201511.5298,687.538,812.5
201613.4292,27545,225
201714.3289,237.548,262.5
201815.2286,20051,300
201919.3272,362.565,137.5
Total Burned Forest Area 2010–2019 (ha)15,242.49
Total Loss by Burning (%)23.4
Disclaimer/Publisher’s Note: The statements, opinions and data contained in all publications are solely those of the individual author(s) and contributor(s) and not of MDPI and/or the editor(s). MDPI and/or the editor(s) disclaim responsibility for any injury to people or property resulting from any ideas, methods, instructions or products referred to in the content.

