Article

Citizen Sensing within Urban Greenspaces: Exploring Human Wellbeing Interactions in Deprived Communities of Glasgow

by
Richard leBrasseur
The Green Infrastructure Performance Lab (gipl.land), Landscape Architecture, Dalhousie University, Bible Hill, NS B29 2R8, Canada
Land 2023, 12(7), 1391; https://doi.org/10.3390/land12071391
Submission received: 24 May 2023 / Revised: 26 June 2023 / Accepted: 28 June 2023 / Published: 12 July 2023
(This article belongs to the Special Issue Geospatial Data for Landscape Change)

Abstract

:
The relationship between urban greenspaces and the benefits to psychological, social, and physical aspects of human wellbeing are important to study, particularly in rapidly urbanizing areas and underrepresented communities. This interaction was theorized, analyzed, and measured in this paper through the transactional paradigm and operationalized through the use of a volunteer geographic information questionnaire, SoftGIS, which activated the urban greenspace–human wellbeing interaction through its map-based data collection. Over 450 unique place-based relationships were statistically analyzed within the Greater Glasgow Urban Region of Paisley, Scotland, a vulnerable community. This study revealed that multiple components of human wellbeing are supported through interactions with urban greenspaces. The Paisley region’s respondents visited greenspaces, generally, and most often to receive psychological benefits such as reduction of stress and mental relaxation through interactions which included sitting and relaxing in quiet spaces, enjoying natural surroundings, and viewing nature and wildlife. The physical and social wellbeing benefits were not as frequent in these urban greenspace interactions but were distinctly present. The results imply pathways towards management and multifunctional greenspace design responses in urbanizing regions and indicate strategies for public policy, human health, and urban planning, which deliver wellbeing benefits to communities.

1. Introduction

The expansion of metropolitan areas continues to bring a myriad of environmental and socio-economic impacts to residents. Studies of urban development have revealed patterns of inequality globally, including less access to and use of greenspaces [1]. The literature is well supported in documenting the many benefits urban greenspaces provide humans, yet vulnerability and environmental risk within marginalized and underserved communities continue. An integral factor of human wellbeing is contact with the natural environment, including urban greenspace [2]. This important greenspace function must be better understood in order to synergize human wellbeing pathways, thereby enabling healthier communities. Urban planning and effective decision making require an integrated approach to information gathering from those citizens which better acknowledges their circumstances and concerns.
Research methodologies that include locally meaningful contexts and real-life concerns are critical to shaping healthy, resilient communities. Both ecological and socio-economic knowledge must be understood when studying the human–nature relationship of greenspaces [3]. Inclusive approaches within land use planning require diverse user perspectives, engaging community data collection, and accurate depictions of greenspace benefits and functions [4]. Human wellbeing is ostensibly related to the environment, yet how greenspaces specifically advance human health and wellbeing through engagement is challenging to determine [5,6,7,8,9]. Conferring what will have the maximum impact for urban residents is contextual, subjective, and ultimately problematic within spatial planning decisions.
Urban areas will place more pressure on their greenspaces for multifaceted requirements, particularly in underserved communities. This paper synthesizes the literature, provides a conceptual transactional framework, and applies novel methods to study the important relationship between humans and urban greenspaces within the human wellbeing perspective. Questions include the following:
  • What are the most effective theoretical paradigms used to articulate the human and urban greenspace relationship?
  • Which approaches can be applied to best integrate spatial data and citizen knowledge specifically to measure human wellbeing and life satisfaction within underserved communities?
  • What categories of residents receive which type of human wellbeing benefits through urban greenspace interactions?
  • How can landscape planning and urban greenspace strategies contribute to improving the physical, social, and psychological aspects of human wellbeing in urban environments?
The town of Paisley, Scotland, near the urban centre of Glasgow was the focus of this study. Paisley contains some of the most deprived areas in Scotland, and over 25% of the population in Paisley is considered income deprived [10]. The purpose of this research was to expand the understanding of this community’s relationship to their greenspaces and natural areas. Through a participatory approach, interactional wellbeing benefits such as physical health, social connectedness, and stress reduction were collected. These data were used to document the socio-cultural use of greenspaces and served to identify future municipal planning strategies for greenspace provision in the face of human development and underserved communities.

1.1. Urbanizing Landscapes and Vulnerable Communities

Human wellbeing (HWB) and life satisfaction (LS) are difficult concepts to define, as they have many disciplinary and contextual meanings (e.g., [11]). In the literature, LS and HWB are measured through objective and subjective evaluations, where objective measures are conducted through economic, social, and environmental statistics, and subjective measures are conducted through an individual’s feelings or experiences [12]. Subjective measures are often simple and direct—assessing an individual’s thoughts and feelings about one’s life and circumstances and the level of satisfaction with those components.
HWB is a multidimensional concept. The literature has attempted to qualify HWB through concepts of a person’s “happiness”, “quality of life”, and “life satisfaction”, where wellbeing is being “healthy in a way that includes physical, mental, spiritual and emotional health” [4]. Hagerty et al. [13] reviewed over 22 studies and summarized the following seven broad HWB components included in most research frameworks: relationships with family and friends; emotional well-being; material-wellbeing; health; work and productive activity; feeling part of one’s community; and personal safety. The research has also tended to simply summarize these categories into one overall measure, thereby reducing their inherent diversity and interrelations [14].
Life satisfaction is a term commonplace within the HWB literature, and many define subjective wellbeing in terms of life satisfaction [15]. As noted by Andrews and Withey [16], LS is evaluated based on satisfaction with various aspects of life within HWB components. LS includes concepts of wellbeing, and wellbeing is an integral component of LS; LS often serves as an indicator of HWB that individuals have adapted to their situation in life. In this research, LS is a distinct construct of the four HWB domains: physical, psychological, social, and economic. Keyes [17] supports this, stating that LS requires the combined presence of high levels of emotional, psychological, and social wellbeing through the lens of functioning, both individually and in society. Psychological wellbeing includes concepts of mental, emotional, and socio-emotional wellbeing [18]. Social wellbeing allows relationships and social interactions at family and community levels. Physical wellbeing is often similar to physical health measures and includes the functioning of the physical body, considering disease and injury. This research thus refers to these interrelated constructs simply as HWB.

1.2. Human Wellbeing and Urban Greenspaces

The positive relationship between greenspaces and HWB is well researched across multiple disciplines, with a distinct subset, urban greenspaces (UGs), providing a unique context for the people–nature relationship in urban environments and cities. Matsuoka and Kaplan [12] documented strong evidence that greenspace within the urban landscape is important for HWB, including physical, emotional, and mental aspects. This was supported by more recent studies [19,20,21,22]. The World Health Organization describes an urban greenspace as a “necessary component for delivering healthy, sustainable, livable conditions” [23].
This research centers on the physical, social, and psychological wellbeing aspects of UG interactions, and their associated benefits encompass the range of the literature’s UG and HWB relations to the best degree possible. The human physical health benefits from use and interaction are well studied and include concepts of biological health, obesity reduction, reduced mortality, increased recovery rates, reduced biophysical stress, and others (e.g., [2,24,25,26,27,28]).
Another important HWB outcome of UG interactions are the social and socio-cultural benefits [29,30] such as providing a sense of connectedness and community [31], increasing social health [32], and positively reflecting one’s meaning and purpose, thus reducing depressive symptoms [33]. UGs supply spaces in which social connections can be enhanced [34] through interaction or exchange between groups or individuals such as picnic gatherings, outdoor games, or just meeting and talking [35], including informal social contact [36]. UGs are also associated with higher levels of social contact and increased feelings of social support among neighbors [37] including social inclusion [38] and “social cohesion” [39]. Social cohesion has been shown to impact individual wellbeing and that of the larger community [40]. Research also indicates that interactions among differing cultures and age groups are more likely with the provision of UGs [41]. UGs that facilitate these benefits include community gardens and pocket parks [42,43], public parks [44], and natural spaces such as woodlands and forests [45].
Lastly, evidence suggests that UG interactions not only reduce psychological fatigue but also restore a person’s mental capacity to better cognitively function and pay attention [46,47] and reduce depressive symptoms [48]. Studies also report that more UG interactions result in increased mental health and lower levels of stress [49,50]. UGs that furnish these psychological benefits include green streets and urban forests.
Place-based research has challenges in establishing clear relationships—which specific benefits from what type of environments such as UGs and for whom is complex. A broader range of factors is needed to better understand the causal mechanisms within UGs’ multi-faceted benefits [51]. Most research to date has only focused on UG preference in assessing subjective wellbeing measures.

1.3. Transactionalism as a Framework for Studying Human Wellbeing and Urban Greenspace Interactions

There is much evidence that UG interactions positively affect HWB, but research is not clear on the mechanisms and processes that enable the relationship (e.g., [33,51,52,53]). The philosophical theory of transactionalism was founded by William James and John Dewey, among others [54]. This paradigm includes an “interactional” approach where the interaction between person and environment is deconstructed into discrete elements and analyzed through the interplay between psychological variables and natural features, modified by distinct personal, situational, and temporal factors. A “transactional” approach, however, studies more closely the person–environment systems, formed and defined by the simultaneous and combined action of their aspects [55], where benefits are only evident within interacting systems.

1.4. Measuring Wellbeing Transactional Benefits through Citizen Sensing

In urban planning, there is an increasing need for a contextualized and transactional approach to decision making, in which the focus of the study is directed toward a real-life event and embedded in a locally meaningful context [56]. Only relatively recently, however, has technology provided a more explicit means to express relationships between humans and place [57,58]. Citizen sensing is a co-creative or an interactional practice which gathers meaningful participatory (i.e., human) information, considered “research data” [59].
Community-based citizen science is an effective means to gather information about an area or group of people and highlight salient issues. Maps and volunteer geographic information (VGI) [60] provide accessible citizen-based tools which address community concerns and enable local representation [61,62], particularly in marginalized communities [57]. Participatory geographical information systems’ (PGISs’) and public participation geographical information systems’ (PPGISs’) [63] common use of map based-questionnaires enables a spatiotemporal, interactional approach to enable citizen-based planning and the communication of subjective, relational information. Specifically, participatory mapping has been applied within spatial planning to attach human preferences and value to place [64,65,66].
A prominent map-based questionnaire and citizen-sensed data collection tool, SoftGIS [3], is a web-based, interactive method that allows participants to map and evaluate their interaction or experience with that space. SoftGIS’s empirical, geospatial data are accrued simultaneously with human-based subjective data, which better clarify the humanurban greenspace relationship. However, interpreting and physically mapping HWB within urban landscape analysis and planning, which comprehensively and effectively capture public knowledge, is lacking [67,68,69,70,71]. Most citizen-based research applying HWB valuation methods are exploratory [67], conceptual [72], and do not provide pathways to effectively apply benefits to urban planning actions [73,74]. This study applies a unique VGI framework to capture spatial interactions that quantify HWB benefits within marginalized communities. The results of this study, particularly though its citizen science approach to data collection and analysis, serve to influence planning and policy development [75] within the Paisley community.

2. Materials and Methods
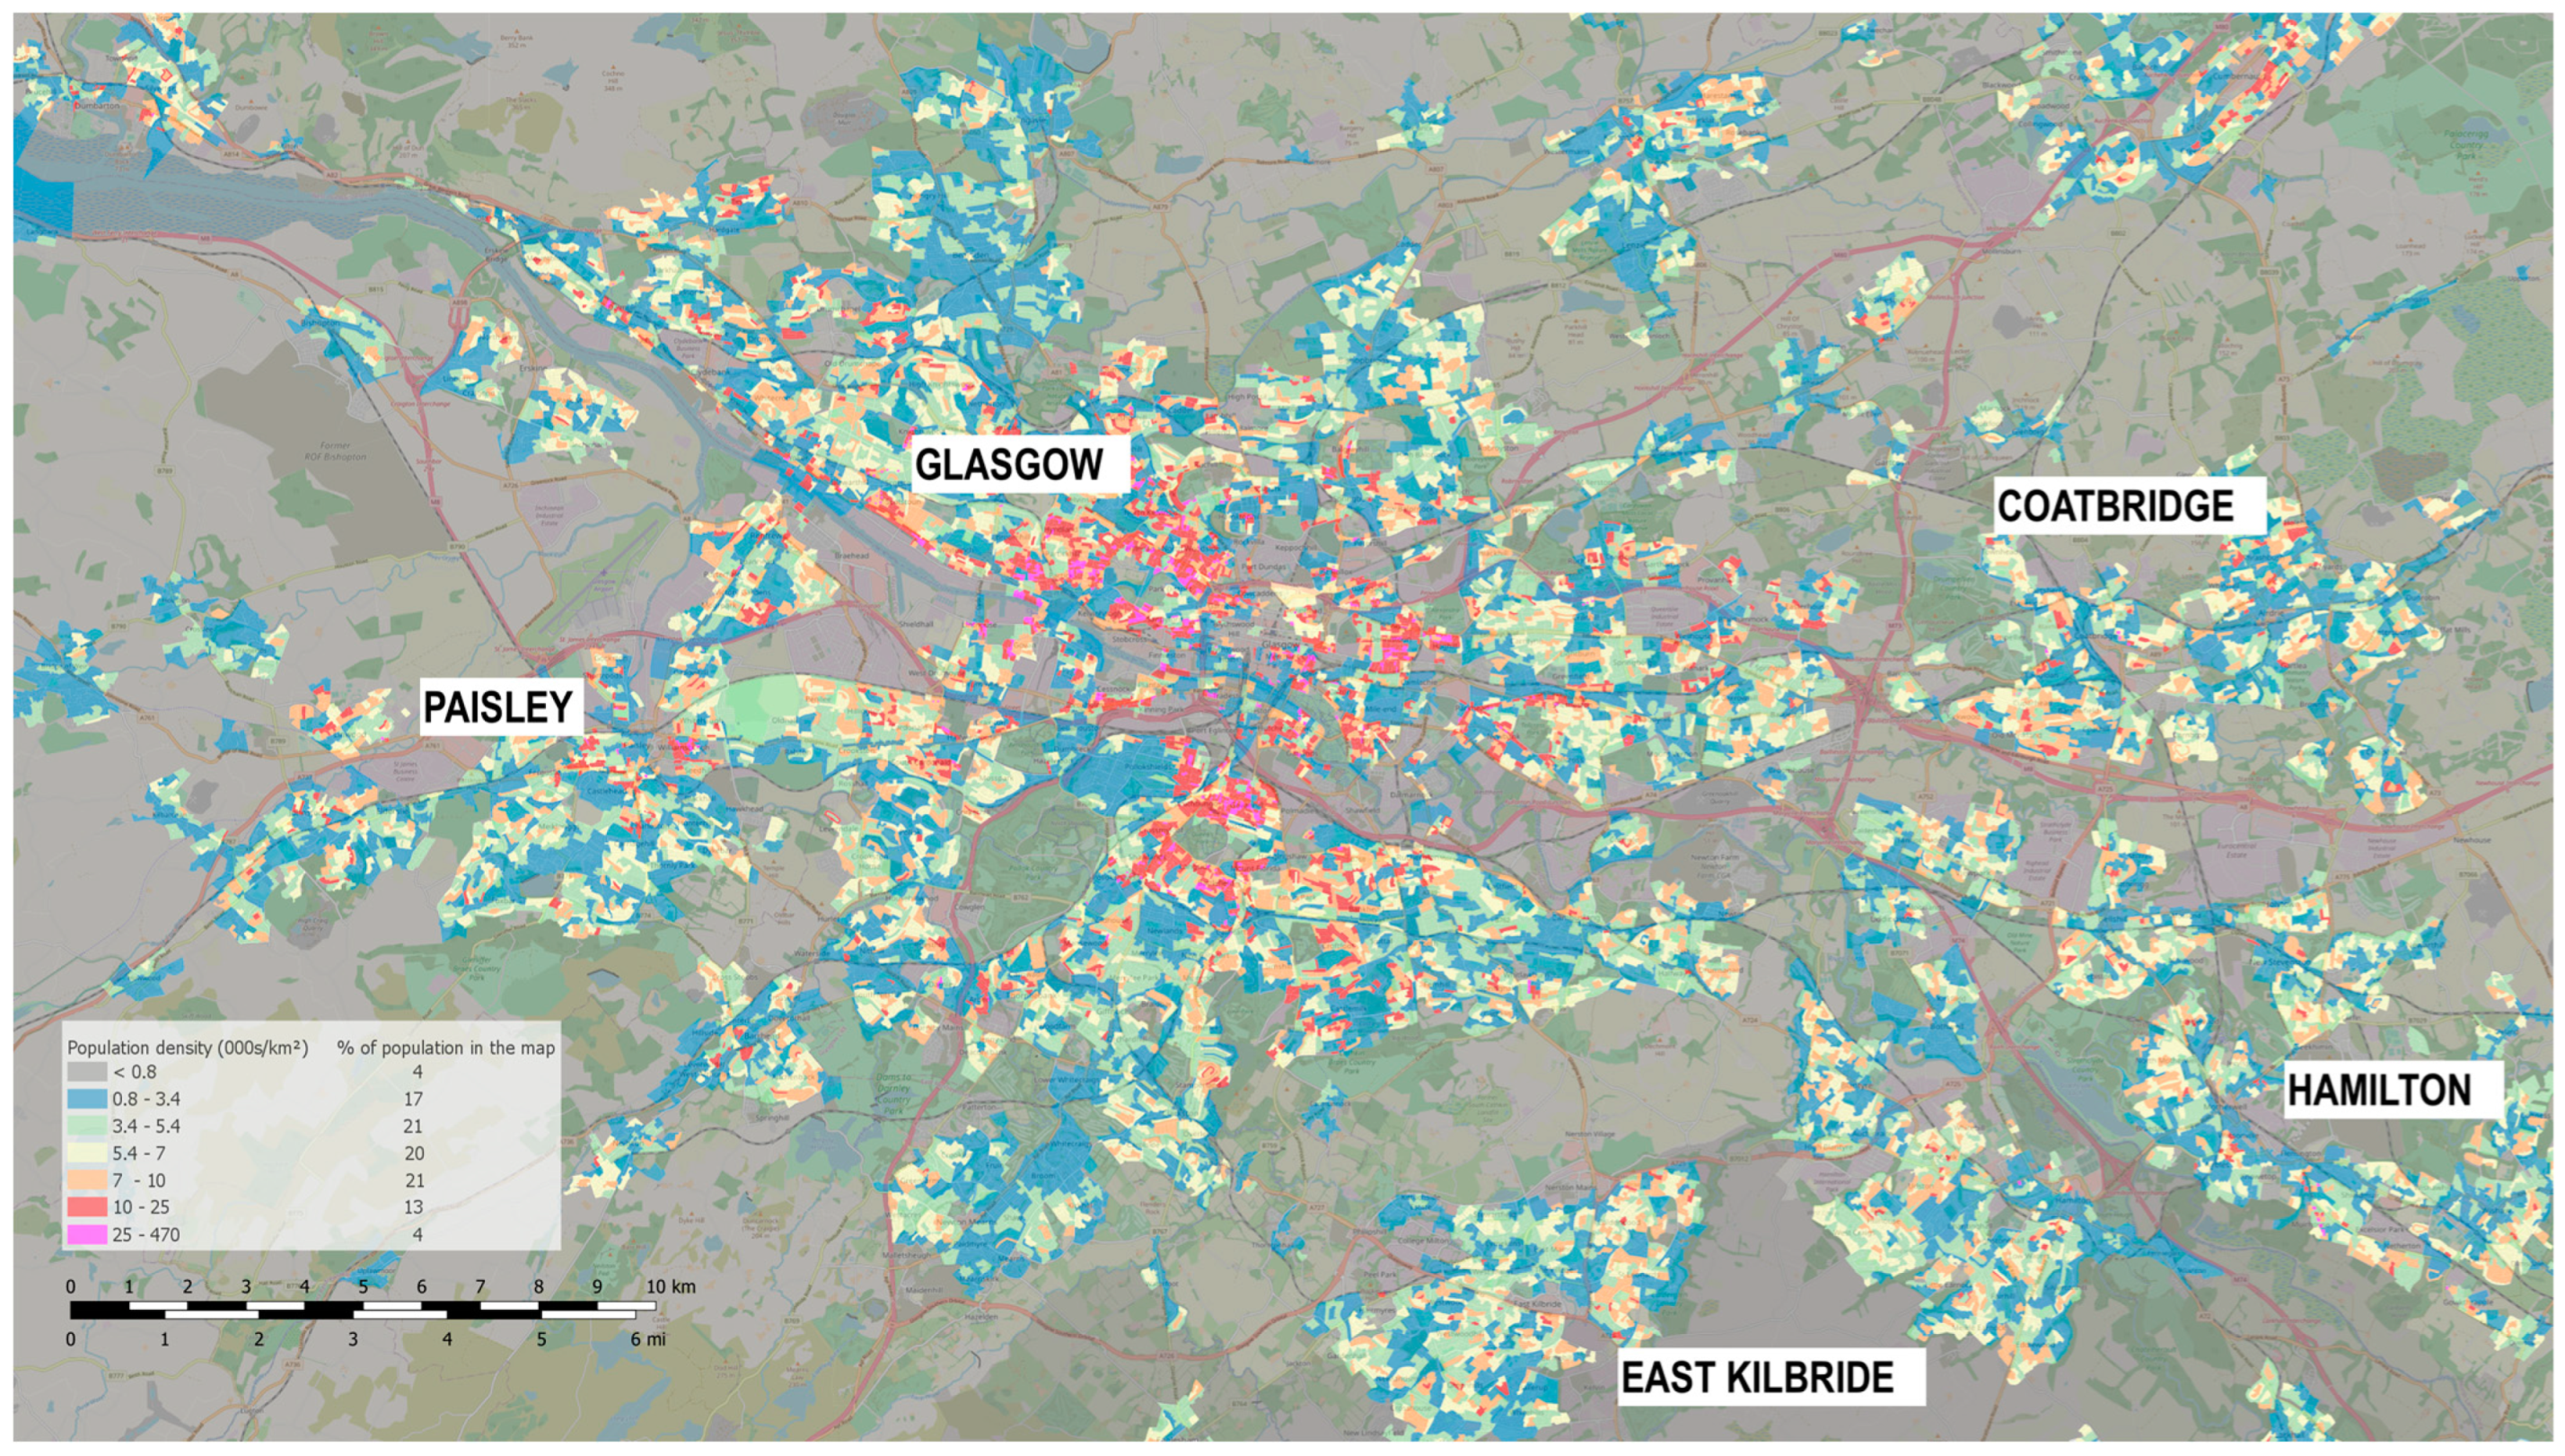
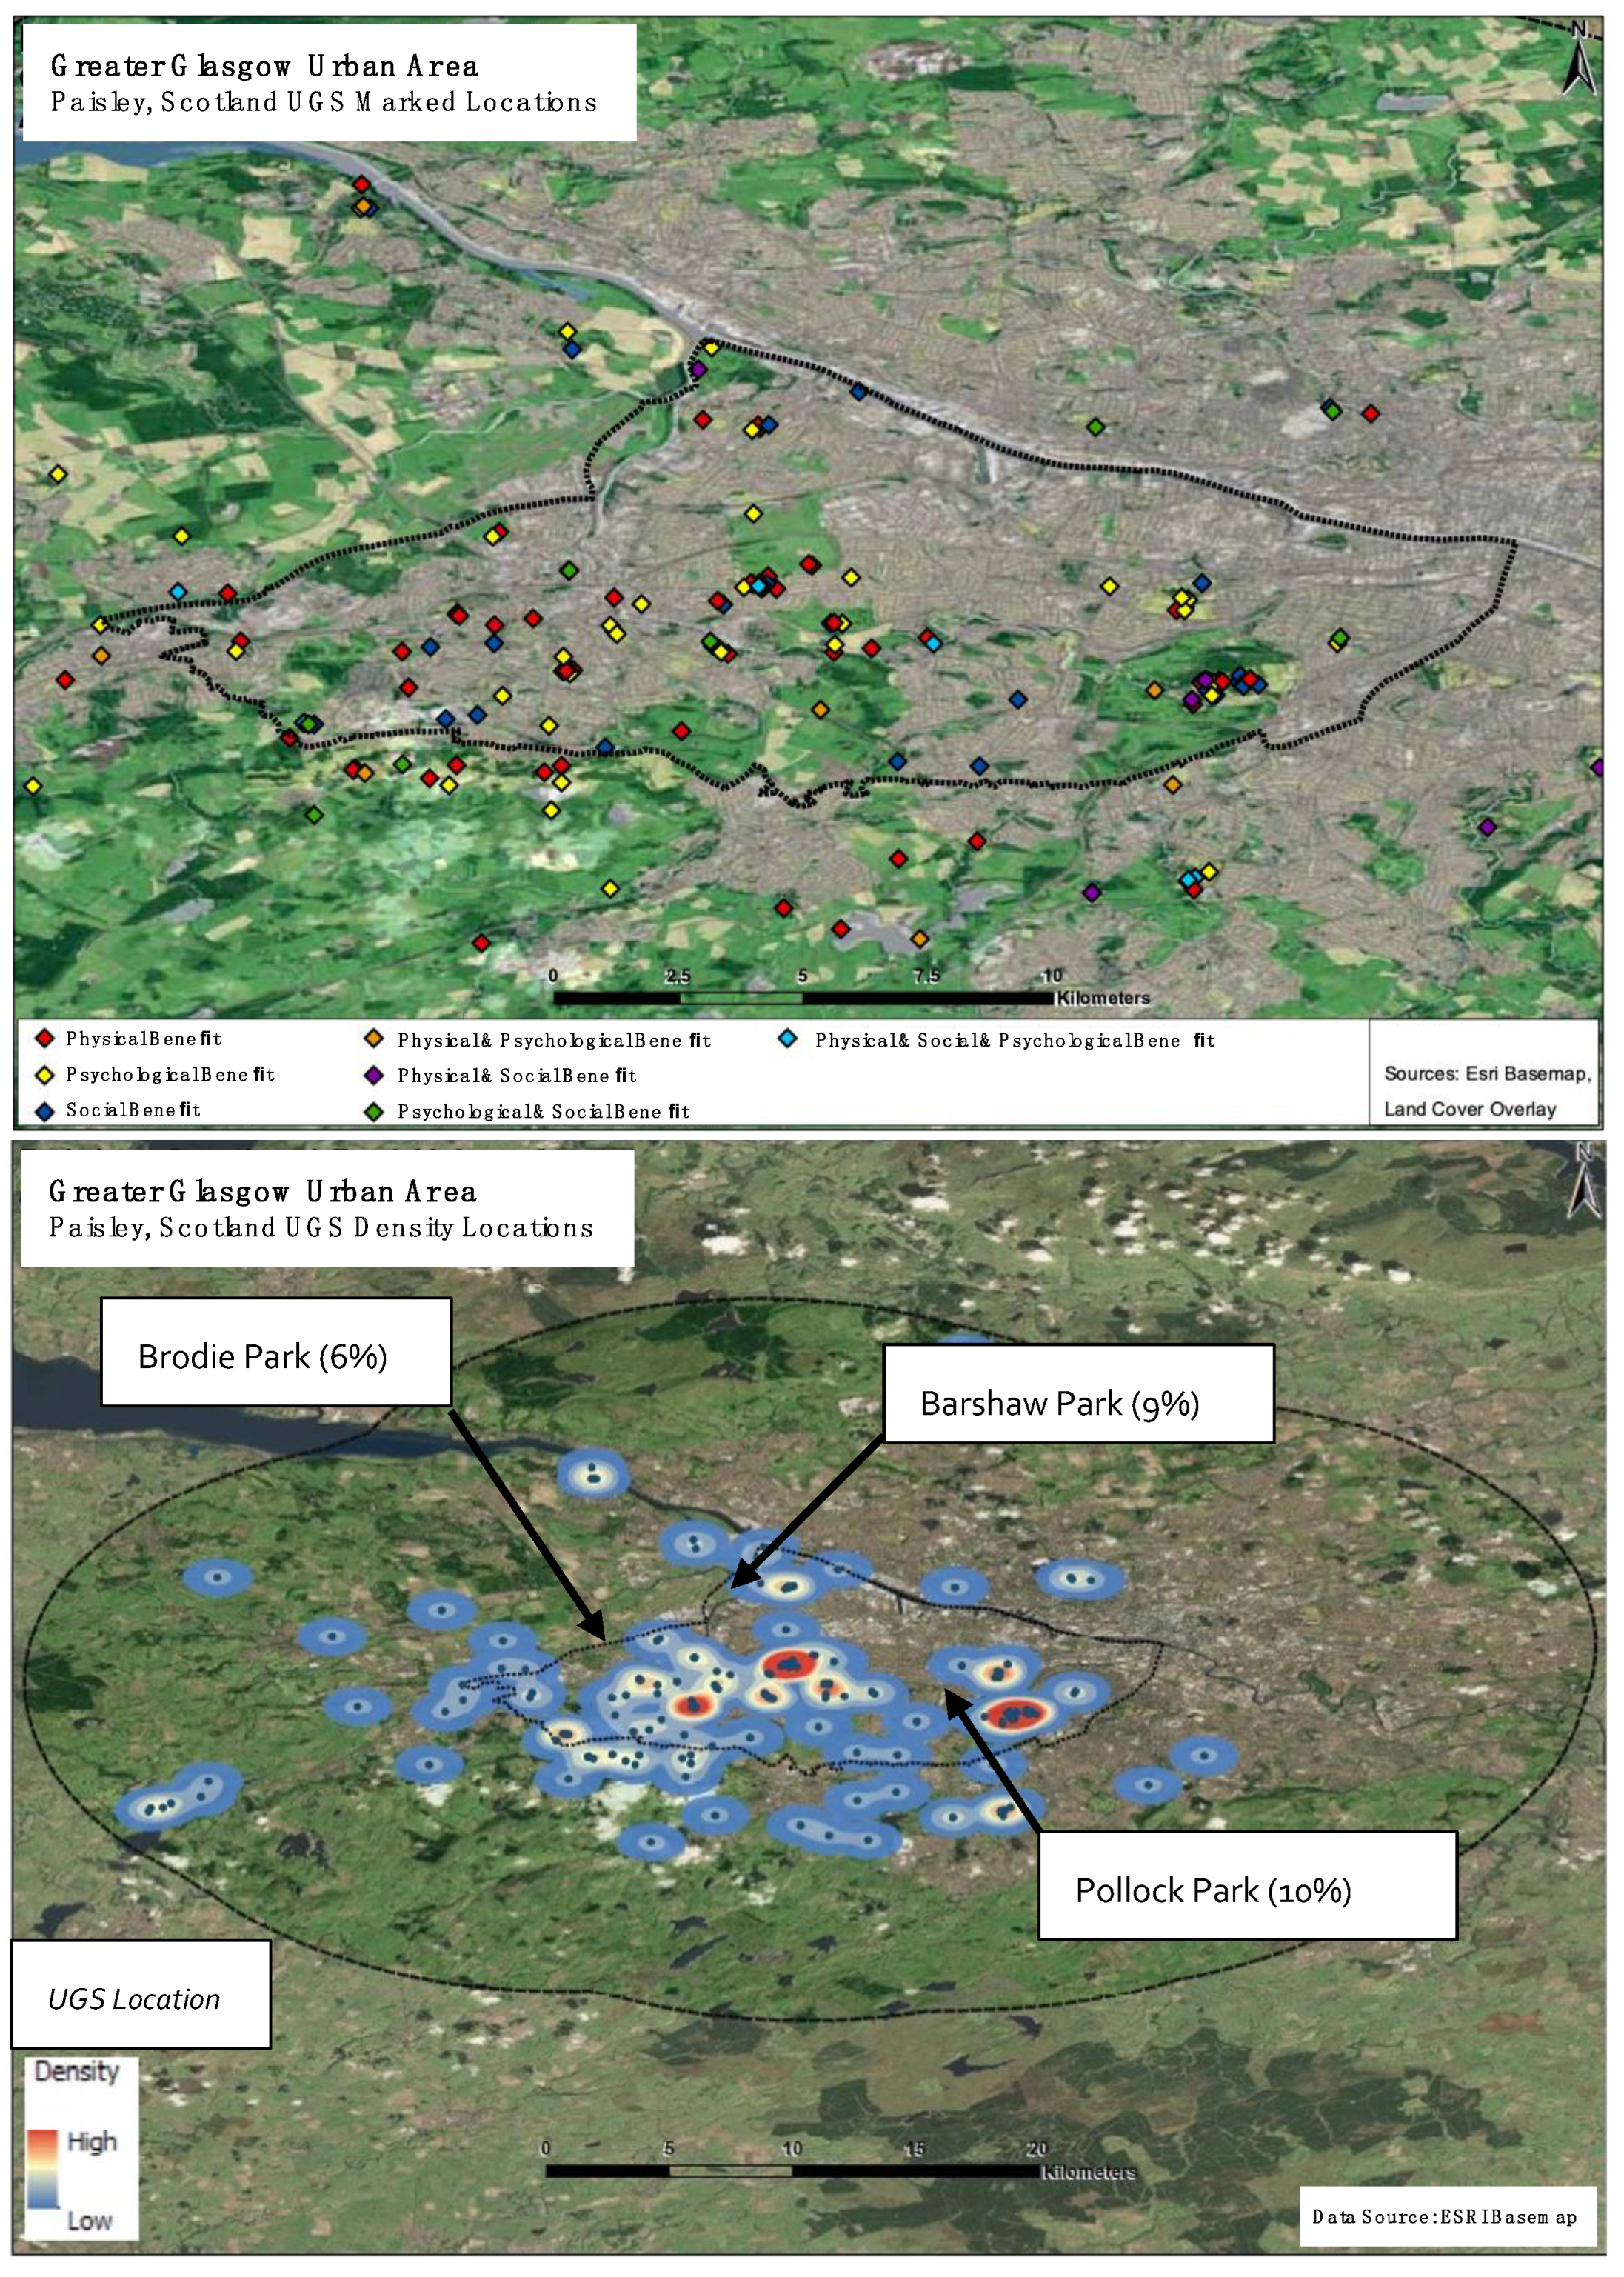
2.1. Study Area

Glasgow is the largest and most dense city in Scotland, and it forms the core of the Greater Glasgow Urban Area (GGUA), which is the third largest urban area in the United Kingdom after London and Birmingham. The GGUA, based on Council boundaries, has a total population of 1,698,088 [76] inhabitants, a land area of 504.2 km2, and a population density of 3367.9/km [77]. The GGUA contains the following four sub-centres: Paisley (77,260 inhabitants), East Kilbride (75,350 inhabitants), Hamilton (53,200 inhabitants), and Coatbridge (43,950 inhabitants) (as of 2023). These four sub-centres represent the first, second, third, and fifth largest town-designated areas in Scotland, respectively (see Figure 1).
The GGUA suffered and is still suffering from the effects of post-industrialization, specifically exurban migration, and is frequently cited as one of the major underlying reasons behind the poor health profile of Scotland [78]. In November 2019, Glasgow was judged the second worst Scottish city in a report grading cities on economic success and quality of life [79]. Glasgow has the lowest life expectancy and higher levels of obesity, diabetes, and alcohol consumption than the rest of the country [80]. In 2022, a study reported that Glasgow was ranked 42nd out of 50 of the UK’s largest population centres based on jobs, health, and income [35]. Unique to this city is the “Glasgow Effect”, a term to describe the poor health status of Glasgow over-and-above that attributable to the region’s high levels of socio-economic deprivation. Only 35.9% of Glasgow residents rated their neighborhood as a very good place to live in 2011 [36]. In a 2021 study, only 51% of Scots reported feeling broadly positive about their lives; the same study also reported that 55% are “broadly satisfied’ with their lives, with 14% “not satisfied” [81].
Other studies highlight that the most deprived neighborhoods within and around Glasgow often lack greenspaces or have relatively poor access to greenspaces [82]. The Central Scotland study also reported that 40% of people think the quality of their local greenspace has reduced in the last 5 years; this figure rose to 50% for people living in the 15% most deprived areas. Importantly, the study also found that local greenspaces continue to fall short of people’s expectations for them to be good places for children to play, safe spaces for physical activity, and somewhere to relax and unwind. Of respondents from the 15% most deprived areas, two-thirds (65%) considered that their local greenspace did not meet their needs.
This research selected Paisley as the case study area, specifically because it physically borders the Glasgow City boundary and has a greater quantity and more access to local UGs than the City of Glasgow. Paisley is the largest town in the Renfrewshire council area. For this research, the Paisley, Scotland case study boundary is 79.293 km2 (79,289,503 m2) and includes all municipal boundaries of Paisley and partial municipal areas of Glasgow (see Figure 2).
By the mid 19th century, like Glasgow and many other industrial towns around the UK, a sharp manufacturing decline led to high unemployment. Significant inequalities developed across Renfrewshire’s communities in term of health and poverty, with some areas being recognized as amongst the most deprived in Scotland [80]. The most recent Scottish Index of Multiple Deprivation (SIMD) [83] reports that levels of deprivation have fallen in Renfrewshire compared to 2016 but remain high. The majority of Renfrewshire’s 225 data zones improved on their 2016 ranking, and fewer of Renfrewshire’s data zones are now identified as the most deprived in Scotland (from 61 in 2016 to 56 in 2020 within the 20% most deprived in Scotland). Over 25% of the population in Paisley is considered income deprived. In 2012, 2016, and 2021, the most socio-economic deprived area in Scotland was Ferguslie, in Paisley.
Deprivation in Scotland considers 7 domains: income, employment, education, health, access to services, crime, and housing [84]. The concept of deprivation relates to Scottish residents not only having low income but poorer health overall, including physical and mental health [85], and has a significant influence on overall wellbeing and allows people to participate in family life and in their community [86]. Deprivation has been applied in research as a primary measure of Scotland’s wellbeing framework [82]; life satisfaction and mental wellbeing are closely related to deprivation [87].

2.2. Data Collection

This study operated a VGI questionnaire in order to analyze and measure the HWB–UG relationship through its geo-coded data collection. The transactional, map-based methodology provided a spatially explicit, geo-coded social survey that effectively captured behavioral interactions. The questionnaire explored the individual relationship between UGs and HWB: firstly, HWB as compared to demographic and socio-economic factors, and, secondly, HWB in relation to current interactions within nearby UGs.
Many individual factors have been identified as affecting human interaction with the environment, and specific to UGs, the literature has noted gender [88], socio-economics [53], age [89], ethnicity [90], education level [91], marital status and employment status [92], car ownership [93], dog ownership [94], and home ownership [95]. This research utilized the following individual factors in its experimental design: age; gender; dog ownership; car ownership; household income; education level; and life satisfaction.
Data collection was operationalized through the digital-based questionnaire provided by Maptionnaire. Maptionnaire’s SoftGIS tool is web-based, interactive, and allowed respondents to map (i.e., geolocate) and qualify (i.e., answer questions) their experiences with that urban greenspace. It collected both qualitative and quantitative data including demographic, self-reported life satisfaction, UG use interactions and those benefits achieved, and the UG physical locations for those interactions (i.e., geocoded). Survey participants provided specific locations of UGs they visited and interacted with, followed by descriptive attributes of what HWB benefit(s) they received from the interactions. In this regard, the transactional perspective could be documented.
The first portion of the questionnaire collected demographic data. In order to limit respondent fatigue and asking standard survey questions, the included questions provided data that could not be collected through other means (i.e., secondary data collection). Question 1 asked respondents to geo-locate or drop a map-marker icon on the location of their “home” in the web-based ortho-photo map. Once placed, a question then asked respondents for their age, gender, household car use, and dog ownership (see Figure 3).
The next series of questions were used to relate geo-coded UG locations to HWB interaction benefits received. Respondents again geo-marked three greenspaces they most often visited in and around Paisley and then selected activities they did within the UGs from a list. These activities identified the transactional benefits achieved through the interactions and were literature-supported to correlate to physical wellbeing, social wellbeing, and/or psychological wellbeing outcomes (see Table 1).
The self-reported life satisfaction questionnaire, similar to the Institute of Medicine [96], provided a simple composite indicator for a number of complex subjective and objective variables found within HWB measures. This questionnaire asked a single, simple 5-point Likert scale response-based question on their current self-reported level of life satisfaction (see Table 2).
Further data collection included socio-economic data not requested within the questionnaire; readily available datasets and official statistics such as census and public health data supplemented the primary data, specifically, household income level (average per postal code), education level (average per postal code), and deprivation ranking (per geo-location).

2.3. Questionnaire Distribution

The SoftGIS questionnaire was administered through three primary methods: direct email, Facebook pages, and on-site solicitation, in order to maximize distribution. The direct email (n = 162, council departments/city councils, NGOs) included the questionnaire survey URL and asked them to forward the link to others. A specific Facebook page titled the “Greenspace Study Group” was created and shared among the platform and posted on other groups (n = 38). Lastly, to not exclude those without internet access, a series of survey engagement tables was provided at regional community centers. The questionnaire was anonymous and confidential and received ethics approval. The survey participant could opt-out at any time. The survey was available during the late summer for 4 weeks. No “hard-copy” or paper questionnaire was offered. The questionnaire was available for anyone over the age of 17. It was estimated to have taken 6–10 min to complete.

3. Results

A series of post-data collection adjustments ensured consistent and valid analysis, which included removing incomplete data and geo-markers. The data were processed using Mapita software and then imported to SPSS (Statistical Package for the Social Sciences) and analyzed using version 26.0.0. The respondent sample size was n = 155. The UG sample size was n = 282 or the total # of UG markers placed.
A series of inter-relational analyses was completed using cross-tabulation strategies and bivariate analyses. Each statistical analysis provided descriptive statistics such as frequencies and percentages and evaluated the data in two distinct characteristic profiles: (1) a profile of the respondents, and (2) a profile of the HWB benefits received through UG interactions.
The statistical results for the 155 individual responses are shown in Table 3. The highest frequencies resulted in 53% males, 42% within the 45–54 age range; 89% had access to a car, and 19% of respondents owned a dog.
For the life satisfaction question, the 5-point Likert results provided the following, where a score of 1 = highly satisfied and 5 = highly unsatisfied: The mean was 1.75 (between “highly satisfied” and “satisfied”) with a standard deviation of 1.46. This variable was then grouped and recoded to three levels. In total, 67% of respondents reported a life satisfaction level of “satisfied” or “highly satisfied” (see Table 4).
The respondent’s home geolocations were overlaid with a postal code map within Arcmap GIS and manually reviewed to determine their primary postal code and added into the SPSS dataset. Then a geo-demographic database, Censation by AFD Software Inc., was applied to correlate the selected socio-economic datasets to the respondent’s home postcode. The statistical results for the 155 individual postcodes are shown in Table 5.
The levels of data measurement for household income level follow the Net Annual Household Income levels of the Scottish Household Survey (SHS) Annual Report 2021 [66]. The education levels follow the Scotland Census 2022. The Scottish Index of Multiple Deprivation (SIMD) in the GGUA follow the SIMD levels of the Scottish Neighbourhood Statistics (SNS). This metric provided a simple, thorough overview of multiple socio-economic characteristics. The quintile ranking focused on the “most deprived” locations within Scotland and the GGUA. This SIMD gradient utilized the data zones as 0–5% (most deprived), 5–10%, 10–15%, 15–20%, and 20–100% (least deprived), and the overall SIMD median was 20–100% of Scottish income levels.
In summary, overall and generally, the respondents had the following profile:
  • Aged 45–54;
  • Do not own a dog;
  • Household use of car;
  • Live in postal code PA1;
  • Live in a household annual income level of 20,001–30,000 GBP;
  • Live in a household with a 20–100% Household Income of the Deprivation Quintile Ranking (both the mean and median SIMD%);
  • Possess a post-qualification education level;
  • Reported highly satisfied or satisfied with life.

3.1. Greenspace Interaction and Human Wellbeing Transaction Results

The SoftGIS questionnaire responses allowed for the multiple HWB benefits to be allocated to the same geo-marker. This simply means each marker was allowed to have multiple responses for an individual’s activities or interactions with the selected UGs as part of the questionnaire format. There was no limit as to the selections they could make. Post data collection, these interactions were coded to specific HWB benefits—physical, social, or psychological. This approach allowed the UGs to have multiple uses or HWB benefits assigned to it, similar to the way UGs function for people in the real world. For example, although there were 364 individual UG locations provided by respondents, the total number of HWB markers analyzed was 454 (n = 454). Results showed that out of the total 155 respondent’s 454 markers, 152 visited UGs for physical HWB benefits (41%), 114 for social benefits (25%), and 188 for psychological benefits (34%) (see Table 6).
Table 7 presents the respondent age and Table 8 their gender and car availability correlated to HWB interaction benefits of their geo-markers.
A cross-tabulation analysis reported the following results: Table 9 summarizes the life satisfaction responses and respondent gender, Table 10 the life satisfaction and age, and Table 11 the overall statistics for the self-reported life satisfaction question as related to the respondents’ HWB benefit interactions with UGs.

3.2. Human Wellbeing Benefits and Urban Greenspace Interactions

The geo-data of the Soft-GIS questionnaire was integrated with the questionnaire response data to produce “heat maps”. These density maps or cluster heat maps provide a graphic illustration of the data’s geographic values and is a statistical analysis technique utilized in human geography, citizen mapping, and urban planning.
In Figure 4 (top), the diamond symbol indicates the respondent’s geo-marker and is colorized to specific HWB benefits (see map key within Figure 4). Figure 4 (bottom) illustrates those same geo-markers as distributed by concentration or intensity. Figure 5, Figure 6 and Figure 7 illustrates the three respective HWB benefits and their locations and intensity maps. Table 12 summarizes the relationships. Overall, these maps communicate the geographical location of specific HWB benefits received though UG interactions; they help visualize the spatial distribution and frequencies of the respondents’ various UG geo-markers and interaction patterns for HWB benefits.
(a)
Psychological wellbeing benefits
As shown in Figure 7 and Table 12, there was a total of 188 geo-markers indicating a UG that provided a psychological wellbeing benefit; 73% of those were unique to only a psychological wellbeing benefit. The highest multi-functional psychological wellbeing UG interaction also provided was a social wellbeing benefit (n = 17, 9%). Psychological and physical wellbeing benefits of a UG interaction were the least, overall, with multi-functional UGs only accounting for 16 geo-markers or 8%.
(b)
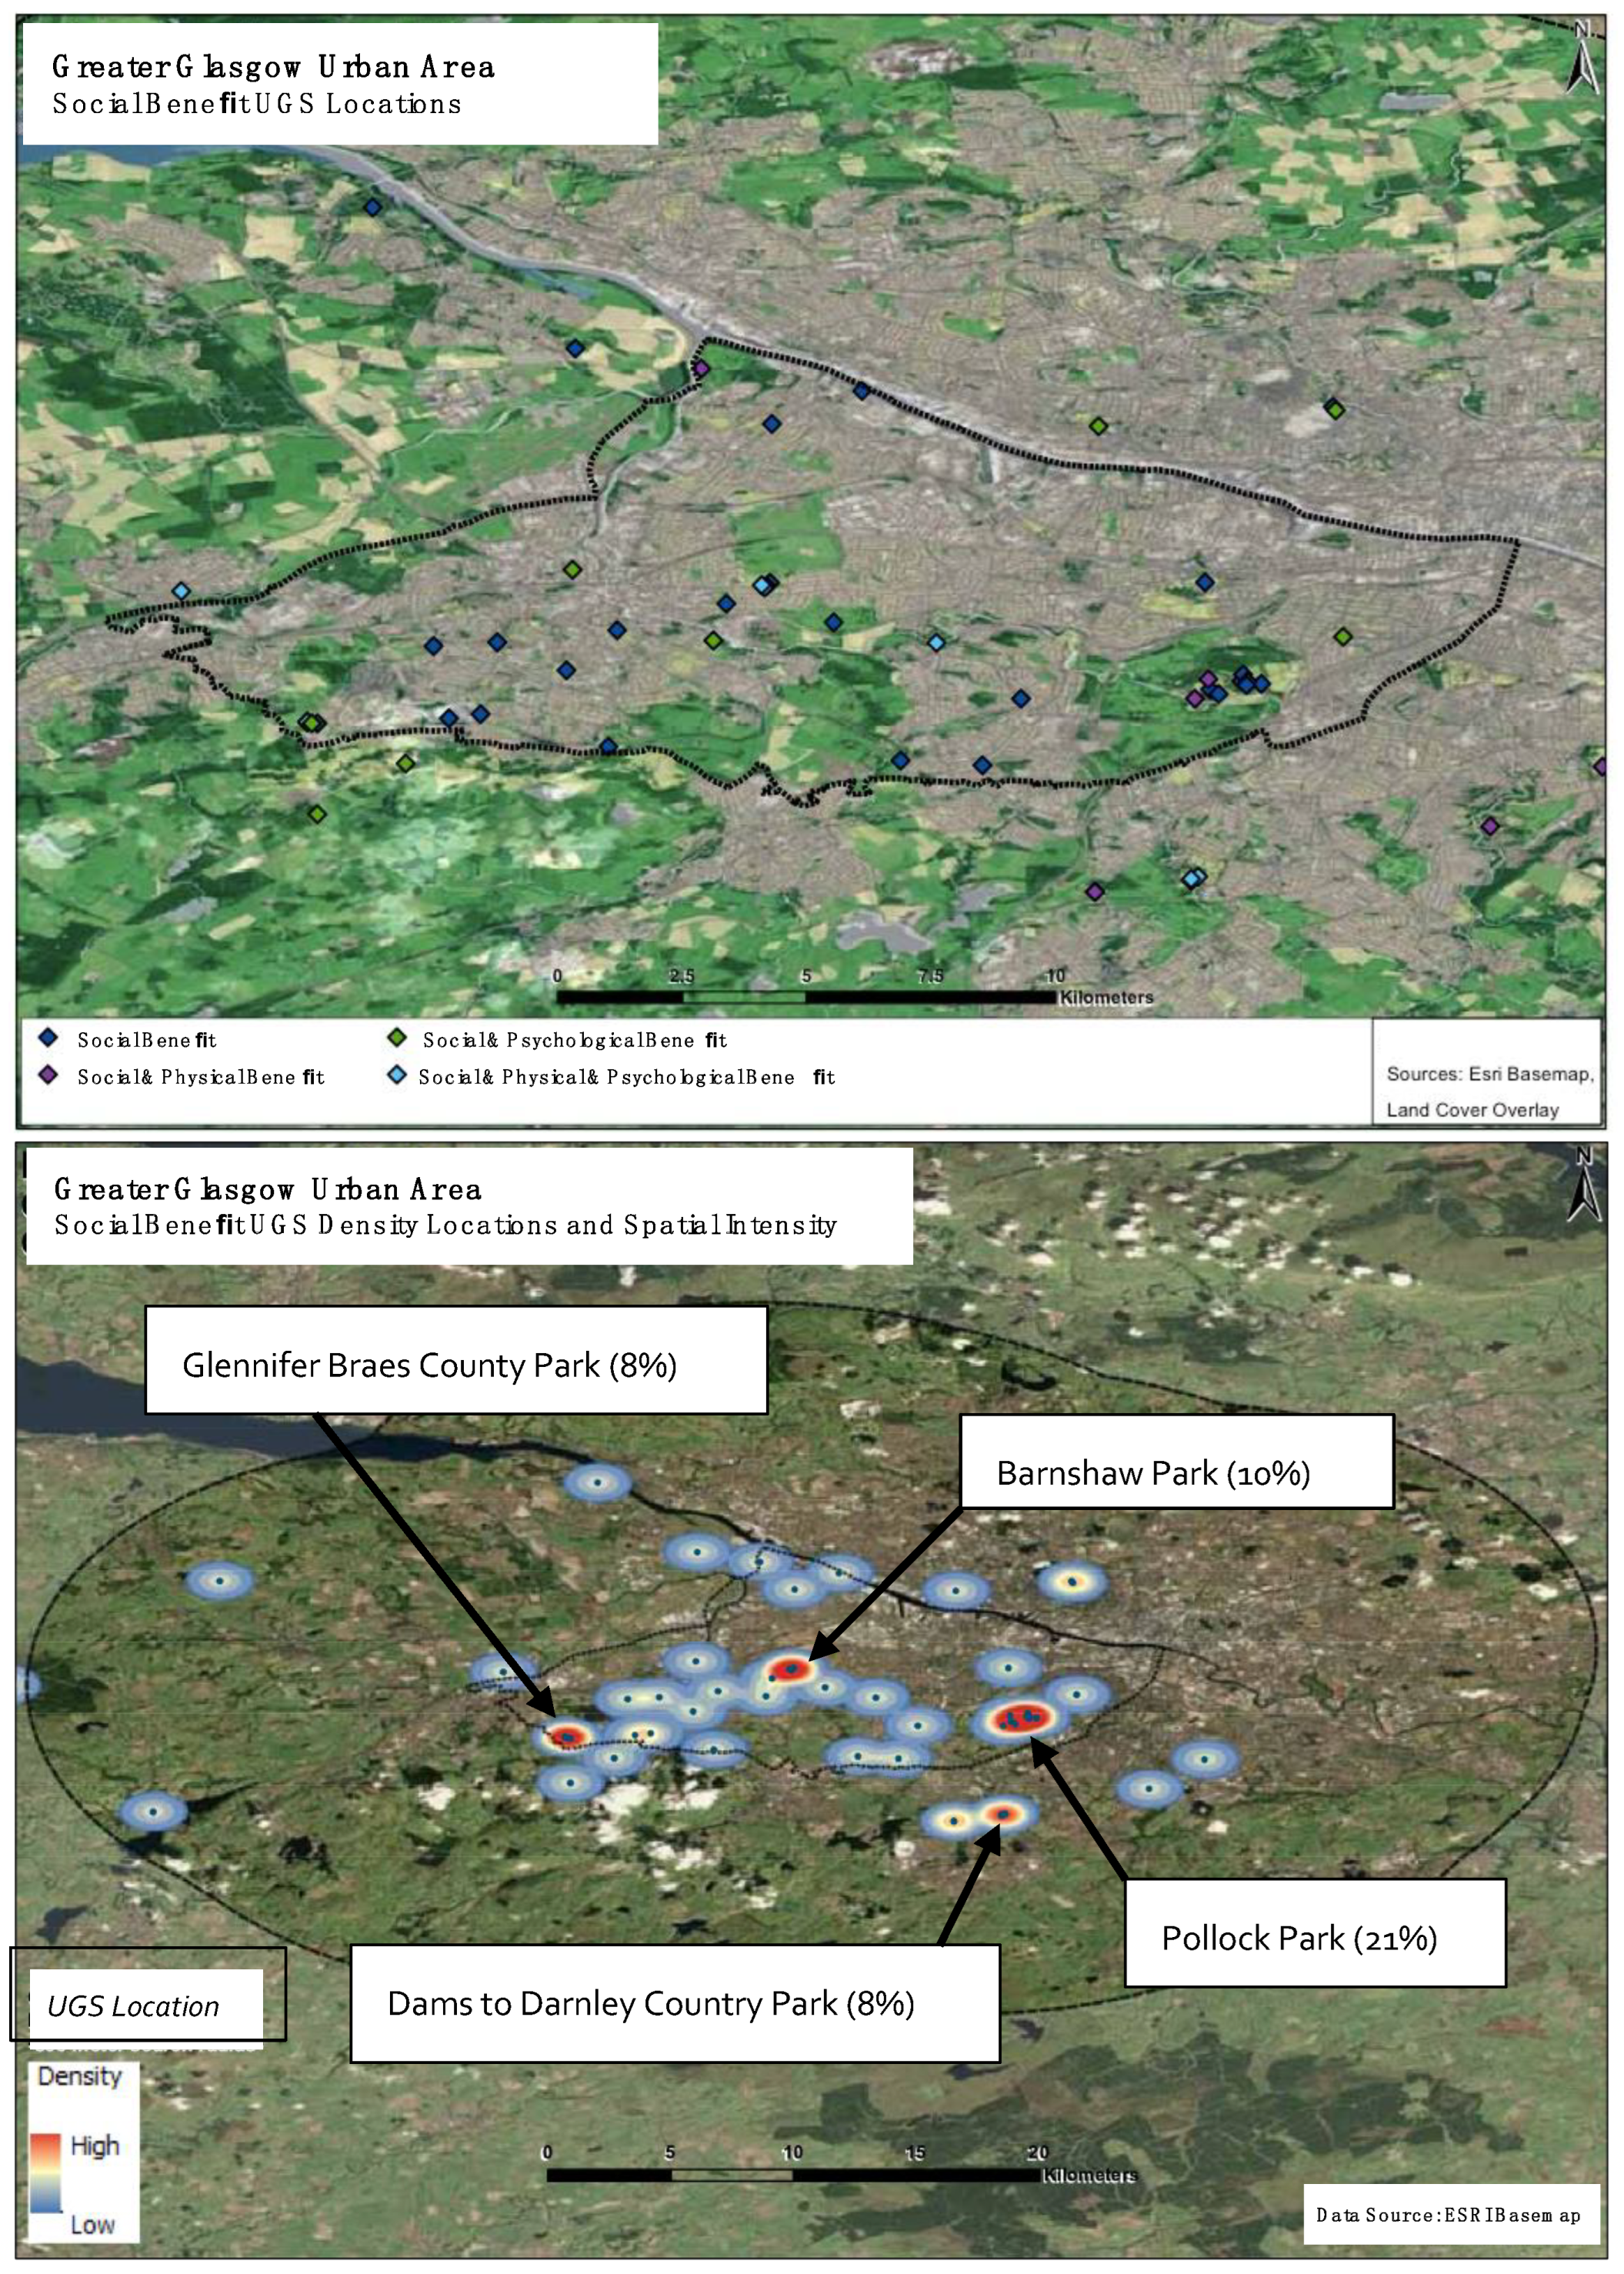
Social wellbeing benefits
As shown in Figure 6 and Table 12, of the total of 114 social wellbeing geo-markers, 65 indicated a UG that provided only a social wellbeing benefit (57%). The next highest multi-functional social wellbeing UG provided a psychological wellbeing benefit (n = 17, 15%) and physical wellbeing benefit (n = 14, 12%).
(c)
Physical wellbeing benefits
As shown in Figure 5 and Table 12, of the total 152 physical wellbeing geo-markers, 104 indicated a UG that provided only a physical wellbeing benefit (68%). The next highest multi-functional physical wellbeing UG also provided a psychological wellbeing benefit (n = 16, 11%) and social wellbeing benefit (n = 14, 9%).
(d)
Psychological, Social, and Physical wellbeing benefits
Eighteen of the total 454 UG markers were noted as providing all three wellbeing benefits (4%) to a respondent. When integrated into the data, results indicated that these multiple-beneficial UGs provided 10% of the total psychological wellbeing benefits, 16% of the total social wellbeing benefits, and 12% of the total physical wellbeing benefits.

4. Discussion

First, a discussion of the specific HWB transactional benefits as related to respondent data is then followed by a discussion of UG multi-functionality or those UGs that provided for social, psychological, and physical wellbeing benefits simultaneously. The literature has suggested that physical contact and interaction with UGs influence HWB by providing psychological restoration, physical activity, and social connection among many other beneficial components (e.g., [67,97,98]). This research supports such findings by showing that interactions with UGs support multiple aspects of HWB. Findings revealed that Paisley’s greenspaces provided, overall and generally to all users, mostly psychological benefits such as quiet places to sit and relax, enjoy natural surroundings, and view nature and wildlife. The social and physical benefits were not as frequent in these UG interactions but were clearly provided.
Spatially, the UG markers and intensity maps of Figure 5, Figure 6 and Figure 7 illustrate the locations of the most interacted UGs for an associated benefit and, generally, the most frequent UGs are shared across all wellbeing benefit typologies. For example, the red-colored or most frequent geo-markers in Figure 5 are for Pollock Park and Barshaw Park, two large, public parks within the GGUA. It is also worth noting that these two and the other high-intensity UGs are centrally located within the study area, thereby indicating a spatial relationship to their interactions. The specific UGs noted as the most interacted with for physical wellbeing benefits were Glennifer Braes County Park, Brodie Park, Barshaw Park, and Pollock Park. For social wellbeing benefits they were Glennifer Braes County Park, Barshaw Park, Pollock Park, and Dams to Darnley Country Park as the most frequent UG interactions. Lastly, the most frequent psychological human wellbeing benefit UG locations were Glennifer Braes County Park, Saucehill Park, Barshaw Park, Bellahouston Park, Pollock Park, and Dams to Darnley Country Park.
Interesting patterns emerged within this research’s UG–HWB relationship data. The geo-questionnaire results not only provided insight to which type of HWB benefits are the most associated with UG interactions, but also how these are influenced by the respondents’ characteristics and, particularly, how they can influence one’s sense of life satisfaction. Results suggest, generally, that people who live in the GGUA in and around Paisley visit UGs in order to receive, predominately, a psychological HWB benefit (41% of total visits). Additionally, of the total 454 selected UGs provided by the respondents, 137 or 30.2% were a singular psychological HWB marker and not shared with other benefits. This indicates respondents selected clearly and deliberately when it came to UG visitation and a benefit received. Overall, 62% of respondents noted a UG as a singular marker, meaning no other respondent identified it as a UG they visited for benefits. The reasons for this are unknown and could include nearness to home or friends, dog access, and others, but it does show that respondents were particular in their choice of UG selection.
The literature notes that dog ownership increases UG visitation frequency [99]. Although the suggestion from this research is that dog ownership does not influence UG use, dog ownership was very low, making generalization difficult. However, dog owners primarily visited UGs with their dog for psychological HWB benefits (45%).
Overall, a majority of respondents (67.3%) reported that they were very satisfied or satisfied with their current life conditions; however, nearly 14% stated they were very unsatisfied or unsatisfied—this is not an insignificant percentage. Most of these very unsatisfied or unsatisfied respondents were female, aged 45–54, with an education level of SVQ 1 or 2, an income level of 5000–10,000 GBP, and falling within the SIMD ranking of 11–20%, 51–60%, and 61–70%. Though minimal education level and low household income do correspond to low life satisfaction self-reported levels, the SIMD ranking does not clearly predict a low life satisfaction self-ranking. This finding is supported by a recent Scottish wellbeing study [100], where though most of the Scottish population is broadly satisfied with their lives, there are considerable inequalities of life satisfaction, both demographically and socio-economically. In that study, it was younger respondents who reported lower levels of HWB, which is clearly supported in this study where the 25–34 age group reported 16% as not being very unsatisfied or unsatisfied and 36% being neither satisfied nor unsatisfied. Interestingly, this same age group reported they visit UGs and receive a mostly evenly distributed HWB benefit (physical = 33%, social = 36%, psychological = 31%), thus indicating a key finding that young people in and around Paisley, though expressing a low level of life satisfaction, visited UGs for a well-balanced set of HWB benefits, not only psychological as the larger population indicated.
This study’s findings support the synergistic effect or multi-beneficial outcomes of interacting with UGs. HWB benefits are shown to be interrelated and supportive of other HWB benefits [101]. For example, the literature states that psychological wellbeing is more positive with strong social networks [102] and physical health is improved by strong social wellbeing [86]. A research study by Jane Jacobs [50] illustrated the positive relationship between social interactions and human health. Another study concluded that parks “directly promote physical activity, and indirectly mitigate stress via the spaces’ positive impact on social support” ([103], p. 1209). Similarly, walking, cycling, and other outdoor sports or activities can improve both psychological and physical components of human wellbeing [28] as well as spiritual health [42]. A recent Scottish study also reported the co-benefits of UG interactions towards physical health and social wellbeing [104].
The geo-data analysis indicated that there was a total of 18 singular UG locations or 4% of the total UG geo-markers that provided the full suite or all three HWB benefits to a single respondent—the physical, social, and psychological. The author visited these 18 UG geo-marker locations shown in Figure 7 and reported the following three highest frequencies: 10% were for Pollock Park, 9% for Barshaw Park, and 6% for Brodie Park. All three are considered public parks, naturalistic in vegetative composition, and large in size, with Pollock Park the largest in the study area.

4.1. Study Limitations

Establishing a causal relationship to receiving a HWB benefit is difficult and complex. UG interactions may therefore fail to address the underlying determinants of HWB. For example, greenspace or environmental factors such as accessibility, safety perception, management quality, and others are environmental factors of UG use and the individual’s receipt of benefits. Future studies should clarify the many individual factors such as personality traits, preferences, ethnicity, cultural factors, and others, including current socio-emotional and mental health. Additionally, response bias or reverse causality as well as confounding variables are common within subjective, human-based questionnaires. Latent variables may not be explicitly observed or measured, such as a respondent’s mental state (e.g., depression, bipolar, Alzheimer’s) and the other factors (e.g., cognitive, economic) that influence life satisfaction and HWB unaccounted for within this study’s structure. The postal code data is statistically weak due to its spatial generalization and presents a general relationship with degrees of variability and reliability.
The transactional relationship between humans and HWB benefits is also dependent upon a greenspace’s biophysical and spatial qualities. A study by Rietveld and Kiverstein [90] reported that the qualities, properties, and characteristics of the landscape and its greenspaces are just as important as the human behaviors or interactions. Future studies should further develop UG typological characteristic measures, which correlate to HWB benefit domains; this paper only provided a simple, subjective analysis; more detail on the qualities and other UG spatial features (e.g., size, presence of built facilities, land cover types, vegetative components, use areas) would begin to clarify HWB–UG transactional benefit pathways. Further questions include how often do respondents visit the UG and what is the LS ranking of the individuals which visited these UGs, which these anonymous data could not synthesize.

4.2. Implications for Urban Planning

As urbanization occurs, the overall structure and characteristics of greenspaces change. Thus, the landscape’s complex, varied ecosystems and how users experience and interact with them are critical to the spatial design and management of those greenspaces. Continued research and methods are required to further identify and clarify the relationship between humans, wellbeing, and urban greenspaces, particularly those removing subjective valuation and integrating a plurality of benefits. Multifunctional evaluation frameworks such as citizen-based participatory tools provide a valuable approach to collect intrinsic and relational values of landscapes beyond economic-focused measures.
VGI is a valuable tool for revealing and quantifying human-based components in future studies. SoftGIS provided a direct correlation between landscape and human benefits—the interactional relationships between users and greenspaces. This research’s framework and results inform the GGUA’s spatial planning and policy through place-based mapping and the knowledge of actual UG use, not preference. Such citizen-based approaches enable effective decision making as they increase community cohesion, reduce stakeholder conflict, contribute to transparency, and actively engage the public in order to achieve more inclusive design and strategic planning opportunities.
The GGUA’s urbanization process has put more pressure on the existing infrastructure as well as the remaining undeveloped land, greenfields, parks, and other greenspaces used by residents. Development in the green belt around Glasgow has occurred (e.g., Newton Mearns) and is expected to continue. Additionally, Paisley recently demolished a 1.2 ha urban park, converted it into a parking lot. This research did not analyze greenspace accessibility, a concept well researched within the environmental justice and equity literature for deprived communities [105]. Natural England and Public Health England have developed green space distance standards and recommend UGs should be located within a 5 min walk from every resident within new housing developments. Many municipalities within the UK have adopted similar strategies.
Further studies are needed to better integrate different types of citizen data and information. For example, planning can incorporate diverse demographic and socio-economic information to better identify UG use and benefits. Specifically designed and managed UGs can be strategically located near those deprived communities lacking a distinct or desired HWB benefit and improve overall life satisfaction.

5. Conclusions

Inclusive, empowered, resilient, and safe communities are those that are functioning well economically, physically, socially, and psychologically. The greenspaces where people live and age shape the opportunities people have and can influence their life course, and they are increasingly recognized as important for life satisfaction and overall wellbeing. This study’s transactional-based operationalization of data collection removed subjective interpretation as much as possible by focusing on interactions and transactions through activity. Within the VGI’s SoftGIS questionnaire, respondents provided specific locations of UGs they visit, followed by descriptive attributes of what HWB benefit(s) they receive from that interaction. The interactional perspective found within the transactional paradigms provided the mechanism to accurately document this mutual relationship, ultimately improving pathways to urban planning and policy in the GGUA and other deprived regions across the globe.

Funding

This research received no external funding.

Institutional Review Board Statement

The study was conducted in accordance with the Declaration of Helsinki, and Ethical approval has been given by the University of Edinburgh, Edinburgh College of Art Research, Ethics and Knowledge Exchange Committee (ref. 19/06/2021).

Informed Consent Statement

Informed consent was obtained from all subjects involved in the study.

Data Availability Statement

Data available on request from the author.

Acknowledgments

The author wishes to thank the many participants who took the time to engage with this study.

Conflicts of Interest

The author declares no conflict of interest.

References

  1. Chesser, S.; Porter, M.M.; Tuckett, A.G. Cultivating citizen science for all: Ethical considerations for research projects involving diverse and marginalized populations. Int. J. Soc. Res. Methodol. 2019, 23, 497–508. [Google Scholar] [CrossRef]
  2. Kaplan, S. The restorative benefits of nature: Toward an integrative framework. J. Environ. Psychol. 1995, 15, 169–182. [Google Scholar] [CrossRef]
  3. Kahila, M.; Kyttä, M. SoftGIS as a bridge builder in collaborative urban planning. In Planning Support Systems: Best Practices and New Methods; Geertman, S., Stillwell, J., Eds.; Springer: Berlin/Heidelberg, Germany, 2009; pp. 389–412. [Google Scholar]
  4. Czembrowski, P.; Łaszkiewicz, E.; Kronenberg, J.; Engström, G.; Andersson, E. Valuing individual characteristics and the multifunctionality of urban green spaces: The integration of sociotope mapping and hedonic pricing. PLoS ONE 2019, 14, e0212277. [Google Scholar] [CrossRef] [PubMed] [Green Version]
  5. Bell, S.L.; Phoenix, C.; Lovell, R.; Wheeler, B.W. Green space, health and wellbeing: Making space for individual agency. Health Place 2014, 30, 287–292. [Google Scholar] [CrossRef] [PubMed] [Green Version]
  6. Dolan, P.; Layard, R.; Metcalfe, R. Measuring Subjective Well-Being for Public Policy; Centre for Economic Performance: London, UK, 2011. [Google Scholar]
  7. Handy, S.; Cao, X.; Mokhtarian, P.L. Self-Selection in the Relationship between the Built Environment and Walking: Empirical Evidence from Northern California. J. Am. Plan. Assoc. 2006, 72, 55–74. [Google Scholar] [CrossRef]
  8. Jankowski, P.; Czepkiewicz, M.; Młodkowski, M.; Zwoliński, Z. Geo-questionnaire: A method and tool for public preference elicitation in land use planning. Trans. GIS 2016, 20, 903–924. [Google Scholar] [CrossRef]
  9. Maes, J.; Teller, A.; Erhard, M.; Grizzetti, B.; Barredo, J.I.; Paracchini, M.L.; Condé, S.; Somma, F.; Orgiazzi, A.; Jones, A. Mapping and Assessment of Ecosystems and Their Services: An Analytical Framework for Ecosystem Condition; Publications Office of the European Union: Luxembourg, 2018. [Google Scholar]
  10. Rall, E.; Hansen, R.; Pauleit, S. The added value of public participation GIS (PPGIS) for urban green infrastructure planning. Urban For. Urban Green. 2019, 40, 264–274. [Google Scholar] [CrossRef]
  11. Dolan, P.; Peasgood, T.; Dixon, A.M.; Knight, M.; Phillips, D.; Tsuchiya, A.; White, M. Research on the Relationship between Well-Being and Sustainable Development; DEFRA: London, UK, 2006.
  12. Matsuoka, R.H.; Kaplan, R. People needs in the urban landscape: Analysis of Landscape and Urban Planning contributions. Landsc. Urban Plan. 2008, 84, 7–19. [Google Scholar] [CrossRef]
  13. Groenewegen, P.P.; Van den Berg, A.E.; De Vries, S.; Verheij, R.A. Vitamin G: Effects of green space on health, well-being, and social safety. BMC Public Health 2006, 6, 149. [Google Scholar] [CrossRef] [Green Version]
  14. Forkink, A. Benefits and challenges of using an Assessment of Ecosystem Services approach in land-use planning. J. Environ. Plan. Manag. 2017, 60, 2071–2084. [Google Scholar] [CrossRef]
  15. Larson, L.R.; Hipp, J.A. Nature-based Pathways to Health Promotion: The Value of Parks and Greenspace. North Carol. Med. J. 2022, 83, 99–102. [Google Scholar] [CrossRef]
  16. Andrews, F.M.; Withey, S.B. Social Indicators of Wellbeing: The Development and Measurement of Perceptual Indicators; Plenum: New York, NY, USA, 1976. [Google Scholar]
  17. Kaplan, R.; Kaplan, S. Well-being, reasonableness, and the natural environment. Appl. Psychol. Health Well-Being 2011, 3, 304–321. [Google Scholar] [CrossRef] [Green Version]
  18. Thompson, C.W.; Aspinall, P.A. Natural Environments and their Impact on Activity, Health, and Quality of Life. Appl. Psychol. Health Well-Being 2011, 3, 230–260. [Google Scholar] [CrossRef]
  19. Aldana-Domínguez, J.; Palomo, I.; Arellana, J.; de la Rosa, C.G. Unpacking the complexity of nature’s contributions to human well-being: Lessons to transform the Barranquilla Metropolitan Area into a BiodiverCity. Ecosyst. People 2022, 18, 430–446. [Google Scholar] [CrossRef]
  20. Cheng, X.; Van Damme, S.; Li, L.; Uyttenhove, P. Evaluation of cultural ecosystem services: A review of methods. Ecosyst. Serv. 2019, 37, 100925. [Google Scholar] [CrossRef]
  21. Hartig, T. Restorative environments. In Encyclopedia of Applied Psychology; Spielberger, C., Ed.; Academic Press: San Diego, CA, USA, 2004; Volume 3, pp. 273–279. [Google Scholar]
  22. Ittelson, W.H. Visual perception of markings. Psychon. Bull. Rev. 1996, 3, 171–187. [Google Scholar] [CrossRef] [Green Version]
  23. World Health Organization. Ottawa Charter for Health Promotion, 1986 (No. WHO/EURO: 1986-4044-43803-61677); World Health Organization, Regional Office for Europe: Copenhagen, Denmark, 1986.
  24. Akpinar, A. How is quality of urban green spaces associated with physical activity and health? Urban For. Urban Green. 2016, 16, 76–83. [Google Scholar] [CrossRef]
  25. Beyer, K.M.; Kaltenbach, A.; Szabo, A.; Bogar, S.; Nieto, F.J.; Malecki, K.M. Exposure to Neighborhood Green Space and Mental Health: Evidence from the Survey of the Health of Wisconsin. Int. J. Environ. Res. Public Health 2014, 11, 3453–3472. [Google Scholar] [CrossRef] [PubMed] [Green Version]
  26. King, A.C.; Winter, S.J.; Sheats, J.L.; Rosas, L.G.; Buman, M.P.; Salvo, D.; Rodriguez, N.M.; Seguin, R.A.; Moran, M.; Garber, R.; et al. Leveraging Citizen Science and Information Technology for Population Physical Activity Promotion. Transl. J. Am. Coll. Sports Med. 2016, 1, 30–44. [Google Scholar] [CrossRef]
  27. Lee, A.C.K.; Maheswaran, R. The health benefits of urban green spaces: A review of the evidence. J. Public Health 2010, 33, 212–222. [Google Scholar] [CrossRef] [Green Version]
  28. Thompson, C.W.; Aspinall, P.; Roe, J.; Robertson, L.; Miller, D. Mitigating Stress and Supporting Health in Deprived Urban Communities: The Importance of Green Space and the Social Environment. Int. J. Environ. Res. Public Health 2016, 13, 440. [Google Scholar] [CrossRef] [PubMed] [Green Version]
  29. Bell, S.; Hamilton, V.; Montarzino, A.; Rothnie, H.; Travlou, P.; Alves, S. Greenspace and Quality of Life: A Critical Literature Review. In Greenspace Scotland Research Report; Greenspace Scotland, Ed.; Greenspace Scotland: Stirling, Scotland, 2008. [Google Scholar]
  30. Palliwoda, J.; Priess, J. What do people value in urban green? Linking characteristics of urban green spaces to users’ perceptions of nature benefits, disturbances, and disservices. Ecol. Soc. 2021, 26, 28. [Google Scholar] [CrossRef]
  31. Larwin, K.H.; Harvey, M.E.; Constantinou, S.T. An Expanded Life Satisfaction Model: A Component of Subjective Well-Being. J. Methods Meas. Soc. Sci. 2020, 11, 25–44. [Google Scholar] [CrossRef]
  32. Jennings, V.; Larson, L.; Yun, J. Advancing Sustainability through Urban Green Space: Cultural Ecosystem Services, Equity, and Social Determinants of Health. Int. J. Environ. Res. Public Health 2016, 13, 196. [Google Scholar] [CrossRef] [PubMed] [Green Version]
  33. Kondo, M.C.; Fluehr, J.M.; McKeon, T.; Branas, C.C. Urban green space and its impact on human health. Int. J. Environ. Res. Public Health 2018, 15, 445. [Google Scholar] [CrossRef] [Green Version]
  34. Larsen, C.A. The Rise and Fall of Social Cohesion: The Construction and De-Construction of Social Trust in the US, UK, Sweden and Denmark; Oxford University Press: Oxford, UK, 2013. [Google Scholar]
  35. Taylor, R. Good Growth for Cities; PriceWaterhouseCoopers: London, UK, 2022. [Google Scholar]
  36. Siemens, P.; Paisner, B.L. Good Growth for Cities; PriceWaterhouseCoopers: London, UK, 2012. [Google Scholar]
  37. Keyes, C.L.M. The Mental Health Continuum: From Languishing to Flourishing in Life. J. Health Soc. Behav. 2002, 43, 207–222. [Google Scholar] [CrossRef] [Green Version]
  38. Bush, J.; Doyon, A. Urban green spaces in Australian cities: Social inclusion and community participation. In Proceedings of the State of Australian Cities Conference, Adelaide, Australia, 28–30 November 2017. [Google Scholar]
  39. Korpela, K.; Borodulin, K.; Neuvonen, M.; Paronen, O.; Tyrväinen, L. Analyzing the mediators between nature-based outdoor recreation and emotional well-being. J. Environ. Psychol. 2014, 37, 1–7. [Google Scholar] [CrossRef]
  40. Pedrosa, E.L.J.; Okyere, S.A.; Diko, S.K.; Kita, M. Informal greenspaces in Peripheral Luanda, Angola: Benefits and Challenges. In Sustainable Urban Futures in Africa; Routledge: Oxfordshire, UK, 2021; pp. 159–183. [Google Scholar]
  41. Opdam, P.; Albert, C.; Fürst, C.; Grêt-Regamey, A.; Kleemann, J.; Parker, D.; La Rosa, D.; Schmidt, K.; Villamor, G.B.; Walz, A. Ecosystem services for connecting actors—Lessons from a symposium. Chang. Adapt. Socio-Ecol. Syst. 2015, 2, 1–7. [Google Scholar] [CrossRef]
  42. Rietveld, E.; Kiverstein, J. A Rich Landscape of Affordances. Ecol. Psychol. 2014, 26, 325–352. [Google Scholar] [CrossRef]
  43. Veenhoven, R. The Study of Life-Satisfaction; Eötvös University Press: Egyetem tér, Hungary, 1996. [Google Scholar]
  44. Umberson, D.; Montez, J.K. Social Relationships and Health: A Flashpoint for Health Policy. J. Health Soc. Behav. 2010, 51, S54–S66. [Google Scholar] [CrossRef] [Green Version]
  45. Douglas, I. Urban ecology and urban ecosystems: Understanding the links to human health and well-being. Curr. Opin. Environ. Sustain. 2012, 4, 385–392. [Google Scholar] [CrossRef]
  46. Hansen, R.; Pauleit, S. From Multifunctionality to Multiple Ecosystem Services? A Conceptual Framework for Multifunctionality in Green Infrastructure Planning for Urban Areas. AMBIO 2014, 43, 516–529. [Google Scholar] [CrossRef] [PubMed] [Green Version]
  47. Kahila, M.; Kyttä, M. The Use of Web-Based SoftGIS-Method in the Urban Planning Practices. In Proceedings of the Conference on Urban Conditions and Life Changes, Helsinki University of Technology, Espoo, Finland, 2006. [Google Scholar]
  48. Astell-Burt, T.; Feng, X. Association of Urban Green Space with Mental Health and General Health among Adults in Australia. JAMA Netw. Open 2019, 2, e198209. [Google Scholar] [CrossRef] [PubMed] [Green Version]
  49. Dunn, C.E. Participatory GIS—A people’s GIS? Prog. Hum. Geogr. 2007, 31, 616–637. [Google Scholar] [CrossRef] [Green Version]
  50. Viirret, E.; Raatikainen, K.J.; Fagerholm, N.; Käyhkö, N.; Vihervaara, P. Ecosystem Services at the Archipelago Sea Biosphere Reserve in Finland: A Visitor Perspective. Sustainability 2019, 11, 421. [Google Scholar] [CrossRef] [Green Version]
  51. Lee, A.; Jordan, H.; Horsley, J. Value of urban green spaces in promoting healthy living and wellbeing: Prospects for planning. Risk Manag. Health Policy 2015, 8, 131–137. [Google Scholar] [CrossRef] [PubMed] [Green Version]
  52. Ma, B.; Zhou, T.; Lei, S.; Wen, Y.; Htun, T.T. Effects of urban green spaces on residents’ well-being. Environ. Dev. Sustain. 2018, 21, 2793–2809. [Google Scholar] [CrossRef]
  53. Vårheim, A. Public Libraries, Community Resilience, and Social Capital; University of Borås: Borås, Sweden, 2017. [Google Scholar]
  54. Hedblom, M.; Gunnarsson, B.; Iravani, B.; Knez, I.; Schaefer, M.; Thorsson, P.; Lundström, J.N. Reduction of physiological stress by urban green space in a multisensory virtual experiment. Sci. Rep. 2019, 9, 10113. [Google Scholar] [CrossRef] [Green Version]
  55. Altman, I.; Rogoff, B. World views in psychology: Trait, interactional, organismic, and transactional perspectives. In Handbook of Environmental Psychology; Stokols, D., Altman, I., Eds.; Wiley: New York, NY, USA, 1987; Volume 1, pp. 1–40. [Google Scholar]
  56. Gobster, P.H.; Nassauer, J.I.; Daniel, T.C.; Fry, G. The shared landscape: What does aesthetics have to do with ecology? Landsc. Ecol. 2007, 22, 959–972. [Google Scholar] [CrossRef]
  57. Kimura, A.H.; Kinchy, A. Citizen Science: Probing the Virtues and Contexts of Participatory Research. Engag. Sci. Technol. Soc. 2016, 2, 331–361. [Google Scholar] [CrossRef] [Green Version]
  58. Lebrasseur, R. Cultural Greenspaces: Synthesizing Knowledge and Experience in Nova Scotia’s African-Canadian Communities through Participatory Research and SoftGIS. Soc. Sci. 2022, 11, 281. [Google Scholar] [CrossRef]
  59. Cortinovis, C.; Geneletti, D. Ecosystem services in urban plans: What is there, and what is still needed for better decisions. Land Use Policy 2018, 70, 298–312. [Google Scholar] [CrossRef]
  60. Gómez, E.; Baur, J.W.R.; Hill, E.; Georgiev, S. Urban Parks and Psychological Sense of Community. J. Leis. Res. 2015, 47, 388–398. [Google Scholar] [CrossRef]
  61. Hagerty, M.R.; Cummins, R.; Ferriss, A.L.; Land, K.; Michalos, A.C.; Peterson, M.; Sharpe, A.; Sirgy, J.; Vogel, J. Quality of Life Indexes for National Policy: Review and Agenda for Research. Bull. Sociol. Methodol./Bull. Méthodol. Sociol. 2001, 71, 58–78. [Google Scholar] [CrossRef]
  62. Kim, J.; Kaplan, R. Physical and psychological factors in sense of community: New urbanist Kentlands and nearby Orchard Village. Environ. Behav. 2004, 36, 313–340. [Google Scholar] [CrossRef]
  63. Douglas, O.; Lennon, M.; Scott, M. Green space benefits for health and well-being: A life-course approach for urban planning, design and management. Cities 2017, 66, 53–62. [Google Scholar] [CrossRef] [Green Version]
  64. Brown, G.; Reed, P.; Raymond, C.M. Mapping place values: 10 lessons from two decades of public participation GIS empirical research. Appl. Geogr. 2020, 116, 102156. [Google Scholar] [CrossRef]
  65. Dzhambov, A.M.; Markevych, I.; Hartig, T.; Tilov, B.; Arabadzhiev, Z.; Stoyanov, D.; Gatseva, P.; Dimitrova, D.D. Multiple pathways link urban green- and bluespace to mental health in young adults. Environ. Res. 2018, 166, 223–233. [Google Scholar] [CrossRef]
  66. Leavell, M.A.; Leiferman, J.A.; Gascon, M.; Braddick, F.; Gonzalez, J.C.; Litt, J.S. Nature-Based Social Prescribing in Urban Settings to Improve Social Connectedness and Mental Well-being: A Review. Curr. Environ. Health Rep. 2019, 6, 297–308. [Google Scholar] [CrossRef]
  67. Albert, C.; Aronson, J.; Fürst, C.; Opdam, P. Integrating ecosystem services in landscape planning: Requirements, approaches, and impacts. Landsc. Ecol. 2014, 29, 1277–1285. [Google Scholar] [CrossRef]
  68. Coppel, G.; Wüstemann, H. The impact of urban green space on health in Berlin, Germany: Empirical findings and implications for urban planning. Landsc. Urban Plan. 2017, 167, 410–418. [Google Scholar] [CrossRef]
  69. Finch, D.; Wilson, H.; Bibby, J. Leave No One behind: The State of Health and Health Inequalities in Scotland; The Health Foundation: London, UK, 2023. [Google Scholar] [CrossRef]
  70. Maes, J.; Jacobs, S. Nature-Based solutions for Europe’s sustainable development. Conserv. Lett. 2017, 10, 121–124. [Google Scholar] [CrossRef] [Green Version]
  71. Markevych, I.; Schoierer, J.; Hartig, T.; Chudnovsky, A.; Hystad, P.; Dzhambov, A.M.; de Vries, S.; Triguero-Mas, M.; Brauer, M.; Nieuwenhuijsen, M.J.; et al. Exploring pathways linking greenspace to health: Theoretical and methodological guidance. Environ. Res. 2017, 158, 301–317. [Google Scholar] [CrossRef] [PubMed]
  72. Fagerholm, N.; Raymond, C.M.; Olafsson, A.S.; Brown, G.; Rinne, T.; Hasanzadeh, K.; Broberg, A.; Kyttä, M. A methodological framework for analysis of participatory mapping data in research, planning, and management. Int. J. Geogr. Inf. Sci. 2021, 35, 1848–1875. [Google Scholar] [CrossRef]
  73. Bezák, P.; Mederly, P.; Izakovičová, Z.; Špulerová, J.; Schleyer, C. Divergence and conflicts in landscape planning across spatial scales in Slovakia: An opportunity for an ecosystem services-based approach? Int. J. Biodivers. Sci. Ecosyst. Serv. Manag. 2017, 13, 119–135. [Google Scholar] [CrossRef] [Green Version]
  74. Poortinga, W. Social relations or social capital? Individual and community health effects of bonding social capital. Soc. Sci. Med. 2006, 63, 255–270. [Google Scholar] [CrossRef]
  75. Boeraeve, F.; Dufrene, M.; De Vreese, R.; Jacobs, S.; Pipart, N.; Turkelboom, F.; Verheyden, W.; Dendoncker, N. Participatory identification and selection of ecosystem services: Building on field experiences. Ecol. Soc. 2018, 23, 27. [Google Scholar] [CrossRef]
  76. Renfrewshire Council. Renfrewshire—Its Place and People. 2023. Available online: https://www.renfrewshire.gov.uk/article/11014/4.-Renfrewshire---its-place-and-people (accessed on 12 April 2023).
  77. World Population Review. Glasgow Population Review. 2023. Available online: https://worldpopulationreview.com/world-cities/glasgow-population (accessed on 4 April 2023).
  78. Organisation for Economic Co-Operation and Development—OECD. Urban Renaissance: Glasgow: Lessons for Innovation and Implementation; OECD Publishing: Washington, DC, USA, 2002. [Google Scholar]
  79. Scottish Government. Scottish Household Survey. 2021. Available online: http://www.transportscotland.gov.uk/statistics/j333840-72.htm (accessed on 4 November 2022).
  80. Scottish Government. Scottish Health Survey. 2019. Available online: https://www.gov.scot/publications/scottish-health-survey-2019-volume-1-main-report/pages/5/ (accessed on 4 April 2023).
  81. Diffley Partnership. Health Inequalities in Scotland: Public Engagement Research. Report by The Diffley Partnership. 2022. Available online: www.diffleypartnership.co.uk/wp-content/uploads/2022/12/health-inequalities-panel-report-diffley-nov2022.pdf (accessed on 12 April 2023).
  82. Hislop, M.; Scott, A.J.; Corbett, A. What Does Good Green Infrastructure Planning Policy Look Like? Developing and Testing a Policy Assessment Tool within Central Scotland UK. Plan. Theory Pract. 2019, 20, 633–655. [Google Scholar] [CrossRef]
  83. Scottish Government. Scottish Index of Multiple Deprivation. 2020. Available online: https://www.gov.scot/collections/scottish-index-of-multiple-deprivation-2020/ (accessed on 4 April 2023).
  84. Lawder, R.; Harding, O.; Stockton, D.; Fischbacher, C.; Brewster, D.H.; Chalmers, J.; Finlayson, A.; Conway, D.I. Is the Scottish population living dangerously? Prevalence of multiple risk factors: The Scottish Health Survey 2003. BMC Public Health 2010, 10, 1–13. [Google Scholar] [CrossRef] [Green Version]
  85. Bond, L.; Kearns, A.; Mason, P.; Tannahill, C.; Egan, M.; Whitely, E. Exploring the relationships between housing, neighbourhoods and mental wellbeing for residents of deprived areas. BMC Public Health 2012, 12, 48. [Google Scholar] [CrossRef] [Green Version]
  86. Fan, Y.; Das, K.V.; Chen, Q. Neighborhood green, social support, physical activity, and stress: Assessing the cumulative impact. Health Place 2011, 17, 1202–1211. [Google Scholar] [CrossRef] [PubMed]
  87. Bellis, M.A.; Lowey, H.; Hughes, K.; Deacon, L.; Stansfield, J.; Perkins, C. Variations in risk and protective factors for life satisfaction and mental wellbeing with deprivation: A cross-sectional study. BMC Public Health 2012, 12, 492. [Google Scholar] [CrossRef] [PubMed] [Green Version]
  88. Gibson, S.; Loukaitou-Sideris, A.; Mukhija, V. Ensuring park equity: A California case study. J. Urban Des. 2018, 24, 385–405. [Google Scholar] [CrossRef]
  89. Aelbrecht, P.S. ‘Fourth places’: The contemporary public settings for informal social interaction among strangers. J. Urban Des. 2016, 21, 124–152. [Google Scholar] [CrossRef]
  90. McGillivray, M.; Clarke, M. (Eds.) Understanding Human Well-Being; United Nations University Press: Tokyo, Japan, 2006. [Google Scholar]
  91. Maas, J.; Verheij, R.A.; Groenewegen, P.P.; de Vries, S.; Spreeuwenberg, P. Green space, urbanity, and health: How strong is the relation? J. Epidemiol. Community Health 2006, 60, 587–592. [Google Scholar] [CrossRef] [PubMed] [Green Version]
  92. Maas, J.; van Dillen, S.M.E.; Verheij, R.A.; Groenewegen, P.P. Social contacts as a possible mechanism behind the relation between green space and health. Health Place 2009, 15, 586–595. [Google Scholar] [CrossRef] [Green Version]
  93. Christian, H.E.; Westgarth, C.; Bauman, A.; Richards, E.A.; Rhodes, R.E.; Evenson, K.R.; Mayer, J.A.; Thorpe, R.J., Jr. Dog ownership and physical activity: A review of the evidence. J. Phys. Act. Health 2013, 10, 750–759. [Google Scholar] [CrossRef] [Green Version]
  94. Hall, P. Sociable Cites: The Legacy of Ebenezer Howard; Wiley: Chichester, UK, 1998. [Google Scholar]
  95. Scottish Government. Scottish Household Survey 2021: Annual Report. 2020. Available online: https://www.gov.scot/publications/scotlands-people-results-2020-scottish-household-survey/pages/2/ (accessed on 12 April 2023).
  96. Greenspace Scotland. Greenspace Use and Attitude Survey. 2017. Available online: https://drive.google.com/file/d/1x_GfzPxFf059X-3Imz20Mj51EHCoN8F6/view (accessed on 2 November 2022).
  97. Lebrasseur, R. Linking human wellbeing and urban greenspaces: Applying the SoftGIS tool for analyzing human wellbeing interaction in Helsinki, Finland. Front. Environ. Sci. 2022, 10, 950894. [Google Scholar] [CrossRef]
  98. Cutt, H.; Giles-Corti, B.; Knuiman, M.; Timperio, A.; Bull, F. Understanding Dog Owners’ Increased Levels of Physical Activity: Results from RESIDE. Am. J. Public Health 2008, 98, 66–69. [Google Scholar] [CrossRef]
  99. Anderson, S.; Nasr, L.; Rayburn, S.W. Transformative service research and service design: Synergistic effects in healthcare. Serv. Ind. J. 2018, 38, 99–113. [Google Scholar] [CrossRef]
  100. Uchino, B.N. Social Support and Health: A Review of Physiological Processes Potentially Underlying Links to Disease Outcomes. J. Behav. Med. 2006, 29, 377–387. [Google Scholar] [CrossRef] [PubMed]
  101. Thomas, P.A. Trajectories of Social Engagement and Limitations in Late Life. J. Health Soc. Behav. 2011, 52, 430–443. [Google Scholar] [CrossRef] [PubMed]
  102. Jacobs, J. The Death and Life of Great American Cities; Random House: New York, NY, USA, 1961. [Google Scholar]
  103. Ozbay, F.; Johnson, D.C.; Dimoulas, E.; Morgan Iii, C.A.; Charney, D.; Southwick, S. Social support and resilience to stress: From neurobiology to clinical practice. Psychiatry 2007, 4, 35. [Google Scholar]
  104. Thompson, C.W.; Peter, A.; Jenny, R. Access to green space in disadvantaged urban communities: Evidence of salutogenic effects based on biomarker and self-report measures of wellbeing. Procedia-Soc. Behav. Sci. 2014, 153, 10–22. [Google Scholar] [CrossRef] [Green Version]
  105. Coulson, S.; Woods, M.; Eu, M.S. Citizen Sensing: An Action-Orientated Framework for Citizen Science. Front. Commun. 2021, 6, 629700. [Google Scholar] [CrossRef]
Figure 1. The Greater Glasgow Urban Area population density map, which illustrates the spatial relationship between the urban areas (colored) and greenspaces (medium and darker greens). Source: National Records of Scotland, UK Data Service.
Land 12 01391 g001
Figure 2. Paisley case study area: 79,289,503 m2 (79.293 m2) outlined in purple. Orthophoto source: Google Earth, Digital Globe 2022.
Land 12 01391 g002
Figure 3. Geo-marker home location and demographic questions. Orthophoto source: Google Earth, Digital Globe 2022.
Land 12 01391 g003
Figure 4. Human wellbeing benefit interaction locations (top) and intensity map (bottom) illustrating Brodie Park (6%), Barshaw Park (9%), and Pollock Park (10%) as the most frequent UG interactions. Source: Author.
Land 12 01391 g004
Figure 5. Physical human wellbeing benefit locations and intensity map illustrating Glennifer Braes County Park (7%), Brodie Park (10%), Barshaw Park (16%), and Pollock Park (17%) as the most frequent UG interactions. Source: Author.
Land 12 01391 g005
Figure 6. Social human wellbeing benefit locations and intensity map illustrating Glennifer Braes County Park (8%), Barshaw Park (10%), Pollock Park (21%), and Dams to Darnley Country Park (8%) as the most frequent UG interactions. Source: Author.
Land 12 01391 g006
Figure 7. Psychological human wellbeing benefit locations and intensity map illustrating Glennifer Braes County Park (4%), Saucehill Park (5%), Barshaw Park (8%), Bellahouston Park (6%), Pollock Park (9%), and Dams to Darnley Country Park (5%) as the most frequent UG interactions. Source: Author.
Land 12 01391 g007
Table 1. Respondents were asked to select which activities they do in the selected UGs. More than one could be selected. The coded human wellbeing benefit to interaction type is noted in the parentheses and was not visible to respondents.
What do you typically do at this Green Space when you visit? Please check all that apply:
1Play sports and games or ride the bike. (PHYSICAL HWB BENEFIT)
2Sit and relax, read, be peaceful and enjoy nature. (PSYCHOLOGICAL HWB BENEFIT)
3Get together with friends and family, have picnics. (SOCIAL HWB BENEFIT)
4Walk the dog. (PHYSICAL HWB BENEFIT)
5Bring the kids to play. (SOCIAL HWB BENEFIT)
6Socialize with others, catch-up or gossip. (SOCIAL HWB BENEFIT)
7Walk, run, jog or hike. (PHYSICAL HWB BENEFIT)
8View wildlife and be in quiet natural areas. (PSYCHOLOGICAL HWB BENEFIT)
9Garden and Farm. (PSYCHOLOGICAL HWB BENEFIT)
Table 2. Questionnaire asking for self-reported life satisfaction.
The goal of this research is to increase the understanding of green spaces and their effects upon human quality of life benefits such as well-being, reduced stress, sociability, sense of community, safety, and happiness.

How dissatisfied or satisfied are you with your life overall?

Consider your overall state of health, home life, financial situation, family and friends, leisure activities and work or education circumstances.

The results will be handled confidentially. No single respondent can be identified.
1I am very satisfied with my current life.
2I am satisfied with my current life.
3I am neither satisfied nor unsatisfied with my current life.
4I am unsatisfied with my current life.
5I am very unsatisfied with my current life.
Table 3. Primary data simple statistical analysis.
Gender#%
Male8252.7%
Female7347.3%
Dog#%
Yes3019.3%
No12580.7%
Car#%
Yes13889.4%
No1710.6%
Age#%
18–2431.8%
25–342818.2%
35–442012.5%
45–545938.2%
55–643120.2%
65–75149.1%
Table 4. Respondent life satisfaction simple statistical analysis.
#%Self Reported Life Satisfaction
10467.0%highly satisfied or satisfied
117.3%neither satisfied nor unsatisfied
4025.7%unsatisfied or highly unsatisfied
Table 5. Secondary data simple statistical analysis.
#%Primary Postal Code
6441.2%PA1
4025.8%PA2
3321.4%PS3
1811.6%PA8
#%Household Income
3925.5%0–10,000 GBP
2112.7%10,001–20,000 GBP
5334.5%20,001–30,000 GBP
2818.2%30,001–40,000 GBP
149.1%40,000 + GBP
#%Education Level
2112.7%No Quals
2516.4%SVQ Level 1 or 2
2818.2%SVQ Level 3
2818.2%SVQ Level 4
5334.5%Post Quals
#%Deprivation Quintile Ranking (SIMD threshold levels)
117.3%Income 0–5% median
31.8%Income 5–10% median
149.1%Income 10–15% median
31.8%Income 15–20% median
12480%Income 20–100% median
Table 6. Human wellbeing benefits noted through urban greenspace interactions.
#%Human Wellbeing Benefit Noted through Urban Greenspace Interaction
15234%Physical Benefit
11425%Social Benefit
18841%Psychological Benefit
Table 7. Human wellbeing benefits noted through urban greenspace interaction and respondent age simple statistical analysis.
HWB BenefitAged
18–24
Aged
25–34
Aged
35–44
Aged
45–54
Aged
55–64
Aged
65–75
Physical0%20%14%42%17%7%
Social3%21%14%27%10%2%
Psychological2%18%7%65%31%11%
Table 8. Human wellbeing benefits noted through urban greenspace interactions and demographic data simple statistical analysis.
HWB BenefitMaleFemale
Physical31%36%
Social25%21%
Psychological44%43%
HWB BenefitCar AvailabilityNo Car Availability
Physical88%12%
Social88%12%
Psychological90%10%
HWB BenefitDog OwnershipNo Dog Ownership
Physical17%83%
Social14%86%
Psychological18%82%
Table 9. Gender and self-reported life satisfaction simple statistical analysis.
Life Satisfaction ScoreVery Satisfied and SatisfiedNeither Satisfied nor UnsatisfiedVery Unsatisfied and Unsatisfied
Male78.1%7.3%14.6%
(n = 82)(n = 64)(n = 6)(n = 12)
Female67.1%15.1%17.8%
(n = 73)(n = 49)(n = 11)(n = 13)
All Respondents72.9%11%16.1%
(n = 155)(n = 113)(n = 17)(n = 25)
Table 10. Age and self-reported life satisfaction simple statistical analysis.
Life Satisfaction ScoreAged
18–24
Aged
25–34
Aged
35–44
Aged
45–54
Aged
55–64
Aged
65–75
Very Satisfied and Satisfied2%8%8.5%32%15%8%
Neither Satisfied nor Unsatisfied0%6%0%0%3%3%
Very Unsatisfied and Unsatisfied0%3%3%8.5%3%0%
Table 11. Human wellbeing benefits noted through urban greenspace interactions and self-reported life satisfaction simple statistical analysis.
HWB BenefitVery Satisfied and SatisfiedNeither Satisfied nor UnsatisfiedVery Unsatisfied and Unsatisfied
Physical86%5%9%
(n = 108)(n = 6)(n = 12)
Social77%6%17%
(n = 74)(n = 6)(n = 16)
Psychological82%3%15%
(n = 148)(n = 6)(n = 28)
Table 12. Human wellbeing benefit interaction summary. Individual psychological UG benefits (n = 188) provided by respondents. Individual social UG benefits (n = 114) provided by respondents. Individual physical UG benefits (n = 152) provided by respondents.
Psychological HWB Benefit#%
Psychological ONLY13773%
Psychological + Physical168%
Psychological + Social179%
Psychological + Physical + Social1810%
Social HWB Benefit#%
Social ONLY6557%
Social + Physical1412%
Social + Psychological 1715%
Psychological + Physical + Social1816%
Physical HWB Benefit#%
Physical ONLY10468%
Physical + Social149%
Physical + Psychological 1611%
Psychological + Physical + Social1812%
Disclaimer/Publisher’s Note: The statements, opinions and data contained in all publications are solely those of the individual author(s) and contributor(s) and not of MDPI and/or the editor(s). MDPI and/or the editor(s) disclaim responsibility for any injury to people or property resulting from any ideas, methods, instructions or products referred to in the content.

