Article

Spatial Distribution Pattern and Influencing Factors of Above-Ground Biomass and Species Diversity of Grassland in the Altay Forest Area

1
College of Geographical and Tourism, Xinjiang Normal University, Urumqi 830054, China
2
Xinjiang Laboratory of Lake Environment and Resources in Arid Zone, Urumqi 830054, China
*
Author to whom correspondence should be addressed.
Land 2023, 12(7), 1370; https://doi.org/10.3390/land12071370
Submission received: 2 June 2023 / Revised: 3 July 2023 / Accepted: 4 July 2023 / Published: 8 July 2023
(This article belongs to the Topic Low Carbon Economy and Sustainable Development)

Abstract

:
Grasslands in the Altay Mountains are the main part of the grassland ecosystem in Xinjiang, and the spatial distribution patterns of grassland species diversity and biomass have changed significantly due to the combined effects of climate change and anthropogenic disturbances. To clarify the effects of point factors on species diversity and biomass, this study investigated the vegetation status of 41 sample plots in the grasslands of the Altay forest area. The Margalef richness index, Simpson dominance index, Shannon–Wiener diversity index, and Alatalo evenness index in the α-diversity measure were used to analyze the changing characteristics of species diversity and to explore the changing patterns of the spatial distribution of species diversity and above-ground biomass. The results show the following: (1) The above-ground biomass of grasslands in the Altay forest area shows a clear spatial pattern, with the above-ground biomass gradually decreasing from northeast to southwest; the altitude gradient shows a “single-peak” pattern of decrease followed by an increase, with the largest biomass at an altitude of 1400–1800 m. (2) There was a significant “bimodal” pattern of variation between above-ground biomass and grassland cover, which was significantly correlated with elevation (p < 0.05) but not with latitude and longitude. (3) Except for the Alatalo evenness index, the trend of the species diversity indexes showed a high trend in the northeast and a low trend in the southwest, with the highest overall species diversity index on average in the Qiaoati sample site. (4) Except for the Alatalo evenness index, all species diversity indexes were significantly correlated with latitude, altitude, longitude, and cover (p < 0.05); the species diversity indexes showed an upward spiral trend with altitude, and with increasing longitude and cover, the species diversity indexes showed an “S” pattern. Elevation, cover, latitude, and longitude were the main environmental factors affecting the spatial patterns of above-ground biomass and species diversity in the grasslands of Altay. The results of the study provide data support for grassland management and maintenance in the Altay forest area, as well as for grassland ecological security in the northwest arid zone of China.

1. Introduction

Grassland is the largest terrestrial ecosystem in the world, and its above-ground biomass constitutes thirty percent of the global vegetation biomass [1,2,3]. The above-ground biomass of grassland is the material basis of the grassland ecosystem, which is significant for maintaining the ecological function and production function of the grassland ecosystem [4,5,6]. The species diversity of grassland can reflect the species composition, structure, and function of grassland communities and can quickly respond to changing environmental factors such as altitude, temperature, slope, precipitation, soil nutrients, and so on [7,8,9,10,11,12,13,14,15,16]. A study on the changing relationship between the above-ground biomass and species diversity of grassland and their driving factors is helpful to deeply understand the dynamic changes in ecosystem structure and function and better protect the grassland ecosystem [17,18,19].
In order to understand the dynamic changes in grassland ecosystems and better manage grasslands, remote sensing methods and a remote sensing model are adopted to predict grassland above-ground biomass changes. Some scholars have used spatial simulation models to evaluate grassland degradation and restoration in the Qinghai–Tibet Plateau, which indicated that the influence of climate change on grassland degradation is much more than that of human activities [20]. The wind erosion model was used to study the spatiotemporal change of wind protection and sand fixation of grassland. It was found that the wind protection and sand fixation capacity of grassland was generally strengthened in Ning Xia province [21]. In addition, some animals, such as spiders, insects [22,23], and other arthropods [24], as an indicator, have reflected the health status of the grassland ecosystems. However, the remote sensing methods are difficult to identify plant species due to the limitation of remote sensing accuracy. Furthermore, the structure and function of grassland ecosystems are complex and dynamic. The evaluation of a single species is limited and cannot reflect the structural integrity and functional recovery of the grassland ecosystem. Most studies are focused on the structure and function of grassland through field monitoring. The plant species diversity of grassland was calculated, and their relationships with above-ground biomass through field monitoring data in the Qinghai–Tibet Plateau [25,26], northern Tibet [27], Inner Mongolia grassland [28,29], Songnen Plain [30], North America [31], and other places were analyzed. The results of these studies showed that species diversity and biomass have positive, negative, unimodal, uncorrelated, and “U-shaped” curve patterns in different areas. Therefore, the scale effects of studying the relationship between grassland above-ground biomass and species diversity should be considered as one of the important influence factors.
Since the 20th century, extreme precipitation events have occurred frequently in the Altay Mountains. The grassland resources have been overexploited by human activities. These factors have caused some ecological problems. For example, plant species diversity was reduced, and grassland degradation was aggravated. This seriously threatens the ecosystem’s structural stability and husbandry development [32,33,34]. Due to the weak research foundation and the difficulty of sampling data collection in the Altay Mountains area, grassland research based on field survey data is seriously weak. Previous studies in the Altay Mountains showed that the grassland was mainly evaluated using statistical data or remote sensing methods, but the estimation error was large.
Based on those challenges and problems, the aim of this study is (1) to analyze the spatial contribution pattern of the plant diversity index and above-ground biomass, (2) to explain the influencing environmental factors of spatial change of above-ground biomass and plant species diversity index, and (3) to discuss the relationship between above-ground biomass and species diversity. This study is expected to yield positive significance for the health evaluation of the grassland ecosystem and the management of ecological security in the Altay Mountains.

2. Materials and Methods
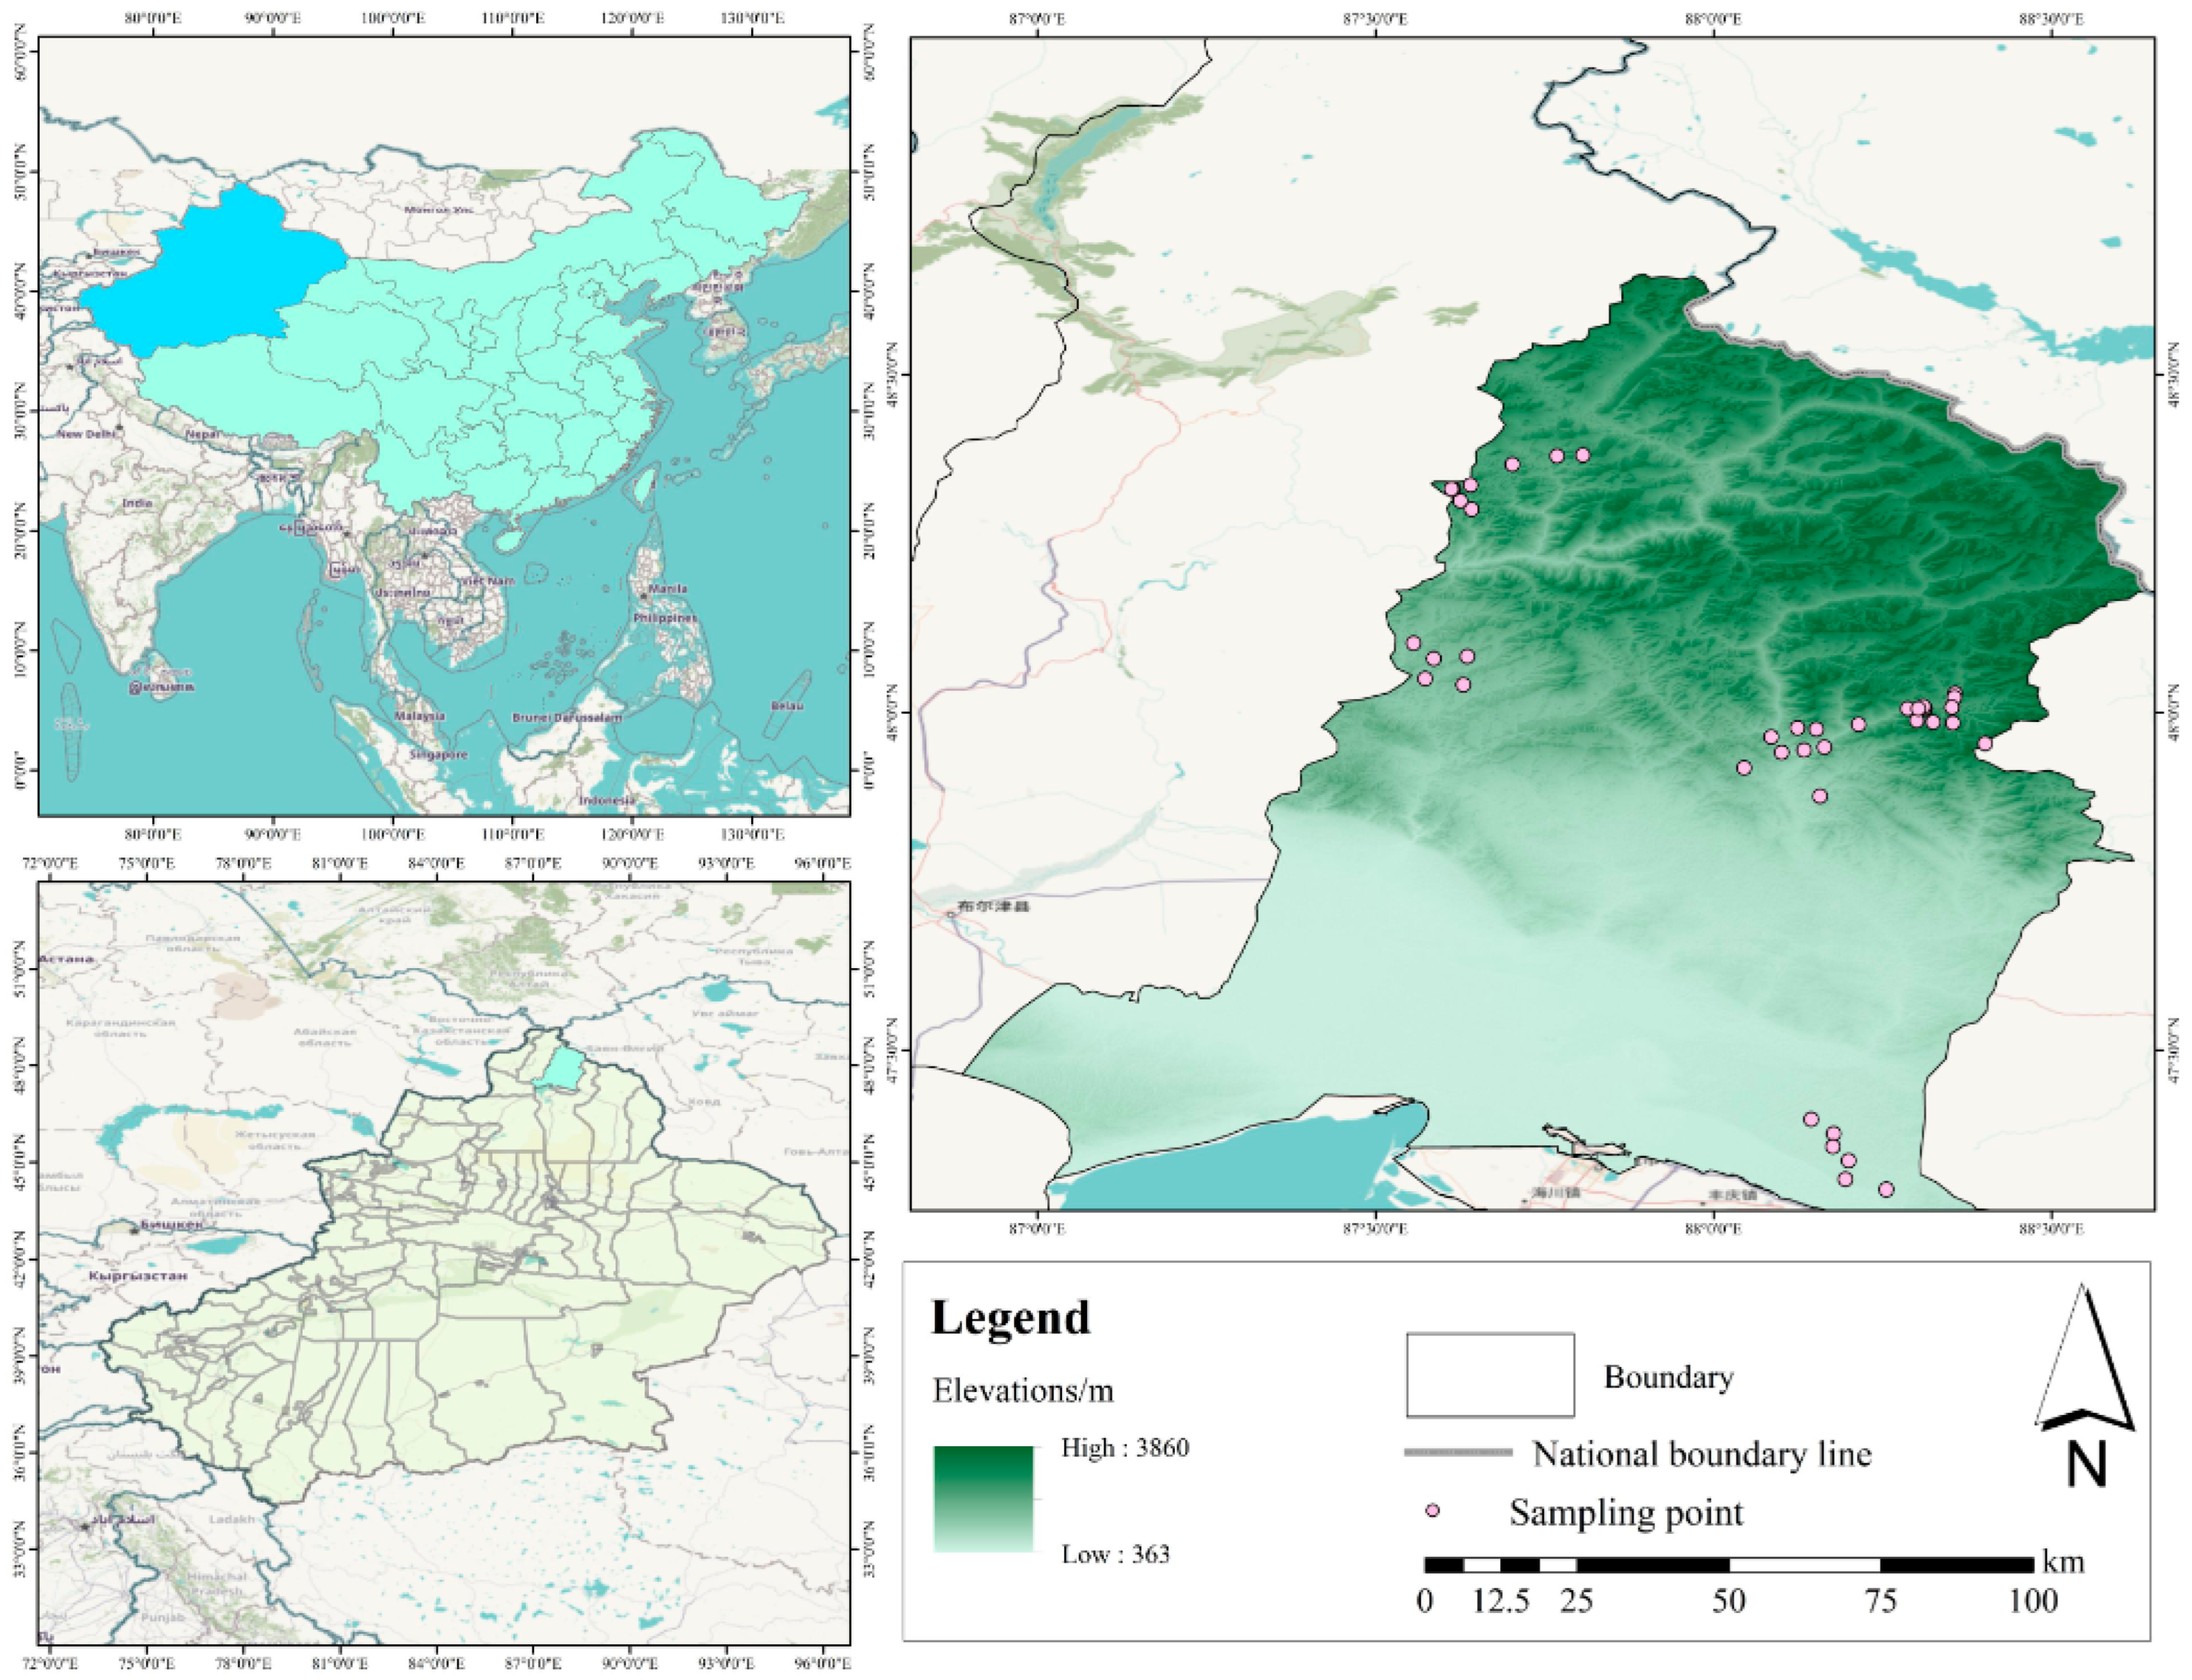
2.1. Study Area

The Altay Mountains are located in northern Xinjiang (85°31′~91°04″ E, 45°00′~49°11″ N), bordering Mongolia and Russia. The terrain of the Altay Mountains is complex; the terrain is high in the north and low in the south, and there are three major geomorphological units in the territory (desert, plain, and mountain), with a huge difference in height, resulting in diverse underlying surfaces, significant climatic differences, and obvious zonality [11,35,36]. It has the climate characteristics of a windy spring, short summer, cool autumn, and long and windy winter. The average annual temperature in the Altay Forest is −4 °C~−2 °C. The terrain is predominantly mountainous. Due to mountain uplift, precipitation is relatively abundant, mainly from the westerly airflow from the Atlantic Ocean and water vapor from the airflow through the mountain pass from the Arctic Ocean [37,38]. The annual precipitation is between 300 and 500 mm, with the annual precipitation increasing by 30~70 mm with every 100 m increase in altitude; the low mountain zone receives 200~300 mm, the middle mountain zone receives 300~500 mm, and the annual precipitation in the alpine area can reach 500~800 mm. The grassland types in the forest area have obvious vertical distribution characteristics with the increase in altitude, and from bottom to top, they are desert steppe, mountain steppe, mountain meadow steppe, mountain meadow, mountain desert, and alpine meadow. The soil types mainly include calcareous chestnut soil, subalpine meadow soil, montane gray forest soil, and alpine meadow soil [39,40]. The grasslands in the forest area are rich and diverse, with Galium odoratum, Eleusine indica, and Taraxacum mongolicum as the main establishment species and Geranium wilfordii, Achillea millefolium, and Potentilla chinensis as the main companion species.

2.2. Design of Experiments

In this survey, the spatial distribution pattern of above-ground biomass and species diversity of the Altay grassland was analyzed during the vigorous growth period of forage grass from July to August 2021. A total of 41 plots (20 m × 20 m) were set up along altitude lines and different pastures areas in Wuxilike (W6), Qiaoati (Q8), Valley (HG5), elevation plot (HB7), and Dadonggou (D14) in Altay (Figure 1); three 1 m × 1 m quadrats were randomly selected in each plot for analysis. At the same time, the coverage, number of species, plant height, density, and above-ground biomass of species in each quadrat were recorded. After monitoring, the cutting method was used in each quadrat, and the fresh weight of the above-ground biomass of each species was weighed for the determination of above-ground biomass. The plot information is shown in Figure 1. The human factors and dominant species present in these plots are shown in Table 1.

2.3. Calculation of Species Diversity

Species diversity was measured using the Margalef (S), Shannon–Wiener (H), Simpson (D), and Alatalo (Ea) indexes [41,42]:
Margalef   ( S ) :   S = ( S 1 ) / l n ( N )
Simpson   ( D ) :   D = 1 P i 2
Shannon Wiener   ( H ) :   H = P i l n P i
Alatalo   ( Ea ) :   E A = H / l n S
The Margalef richness index evaluates the richness of species in a community or ecological environment on the basis of the number and abundance of species. The larger the index, the better the species diversity.
As per the Simpson index, the larger the value, the smaller the dominant species and the higher the strangeness.
The Shannon–Wiener index is used to evaluate the diversity of species in a community or ecological environment based on the number of species. The greater the index is, the more unknown factors in the community, and the more complex the community is, the higher the biodiversity.
The Alatalo evenness index evaluates the evenness of species in a community or ecological environment. The greater the index, the more evenly the number of species is distributed.
S is the total number of species in the quadrat; N is the total number of individuals in the quadrat; Pi is the proportion of the number of i plant individuals to the total number of individuals.

2.4. Data Calculation

Excel 2010 software was used for preliminary data collation and standard error processing. Oneway ANOVA, correlation analysis, and regression equation analysis were performed on the species diversity indexes and above-ground biomass using IBMSPSS Statistics 25.0 [43]. Figures were drawn with Origin 2018. Significant differences in biomass were tested. Origin 2018 was used to map the changes in species diversity index and above-ground biomass due to environmental factors.
On the basis of field investigation, combined with the records of wild plants in the Altay Mountains in Flora of China [44]. The types of habitats were identified, and the list of grassland flora and dominant species in the study area was established (Table 1).

3. Results

3.1. Spatial Pattern and Influencing Factors of Grassland Above-Ground Biomass in Altay Forest Region

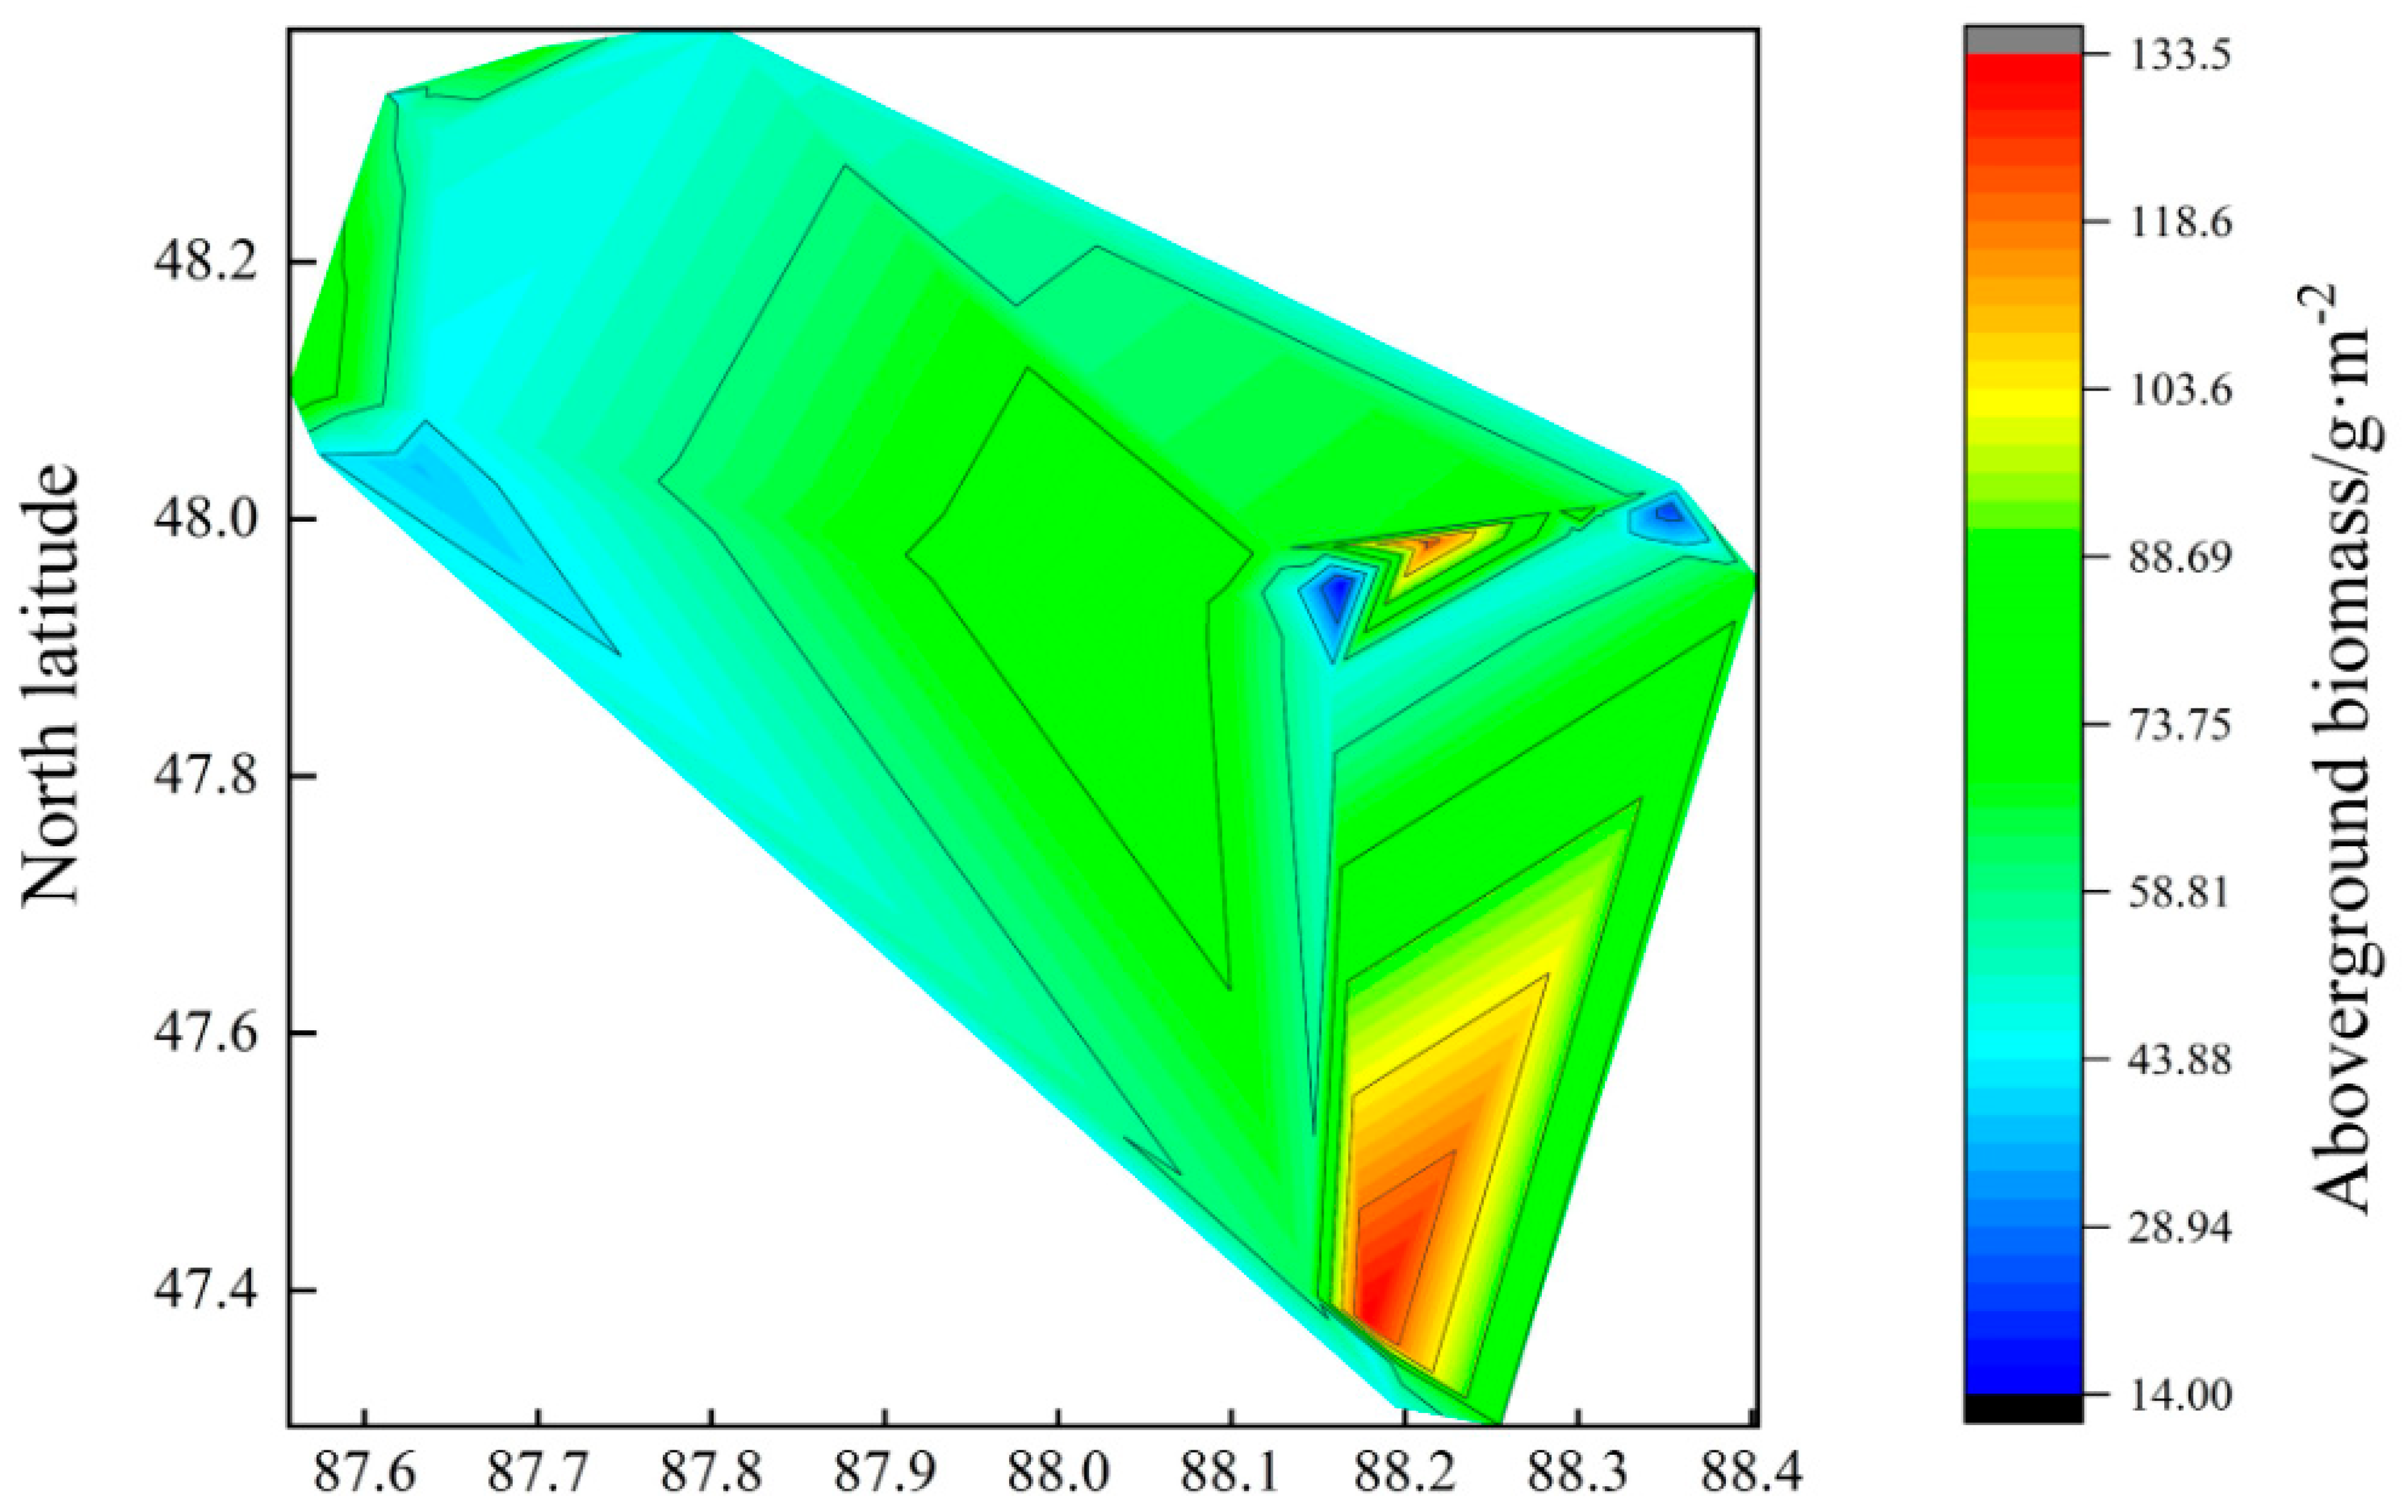
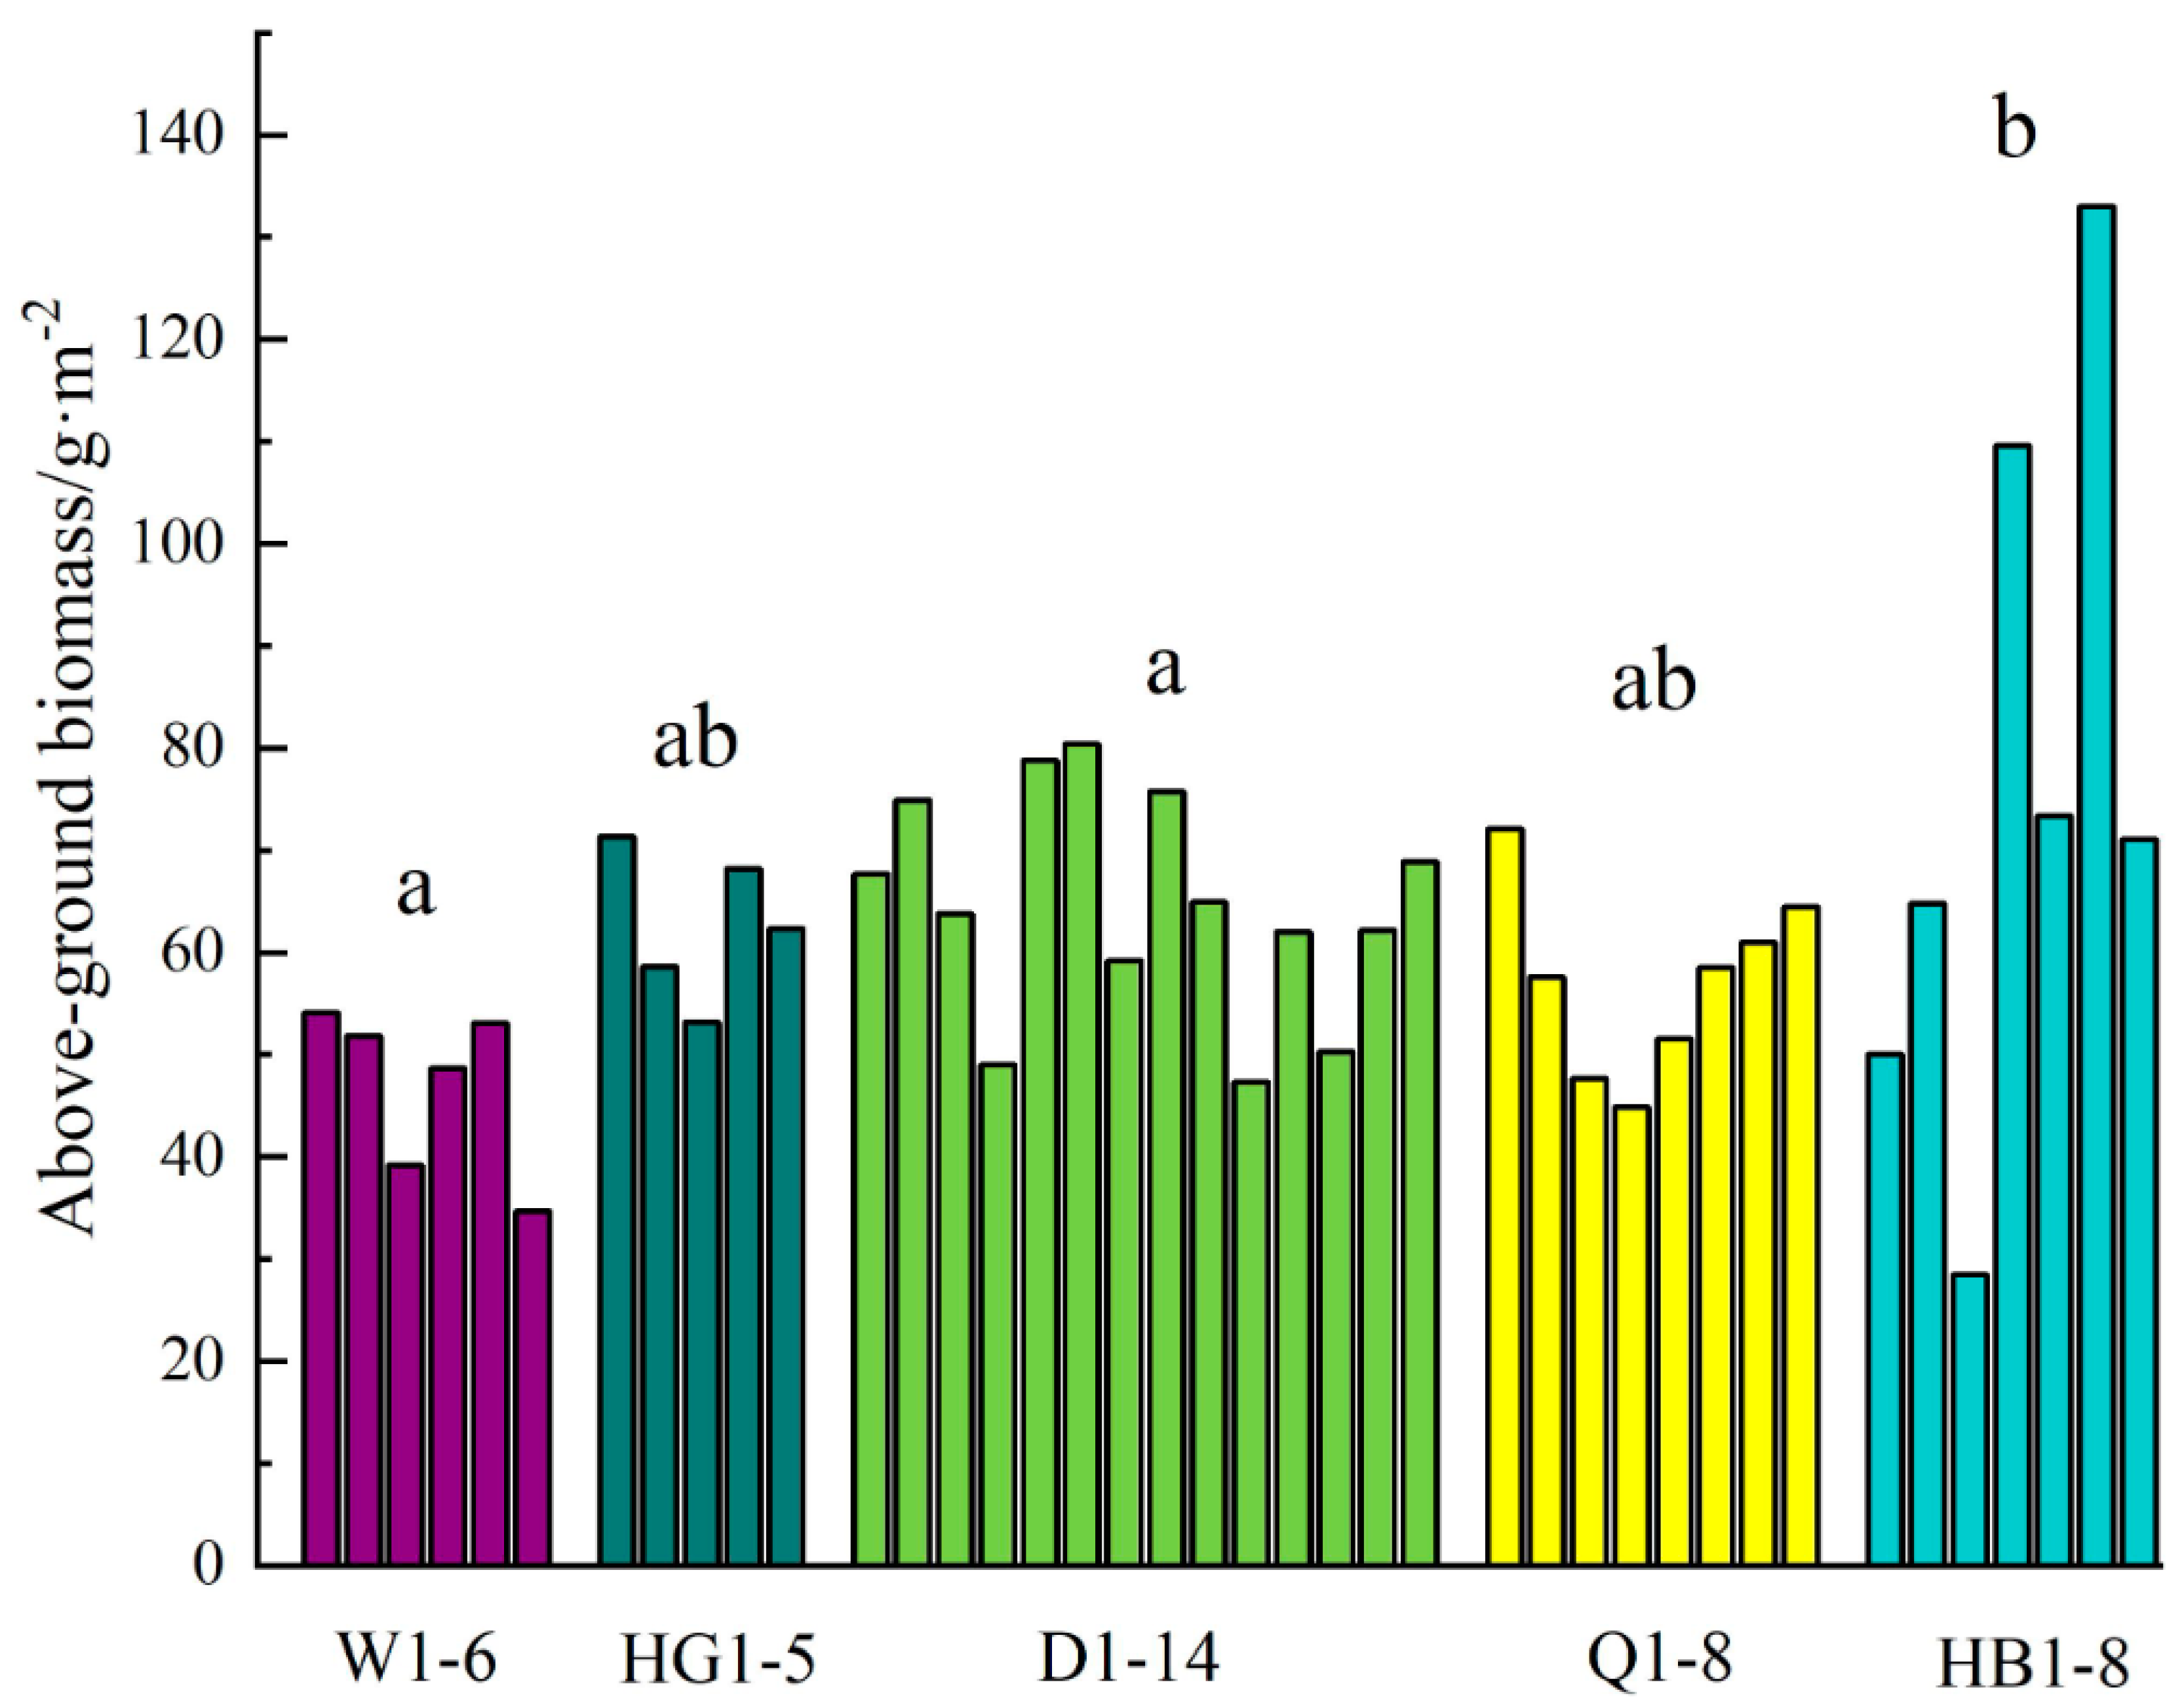
3.1.1. Spatial Pattern of Above-Ground Biomass

This can be seen in Figure 2, the highest values of above-ground biomass of grassland in the Altay forest area appeared in the range of low latitude and high longitude. Low values occur at high latitudes and low longitudes. With 88.1° E as the node, the area was divided into two parts, showing the characteristics of higher above-ground biomass in the east and lower in the west. The highest and lowest values appeared further east than 88.1° E, and the range of change was large, which was 133.02~28.46 g/m2. The grassland west of 88.1° E showed a trend of increasing and then decreasing from east to west (80.4~44.84 g/m2). In the latitude direction, except for the central and eastern regions, the above-ground biomass of grasslands generally shows the characteristics of being higher in the south and lower in the north. Taking 48° N as the node, the above-ground biomass was divided into two obvious areas, both of which gradually decreased in the north–south direction. The variation in above-ground biomass in the range of 88.1~88.4° E was complex. In the overall grassland of the Altay forest area, the part east of 88.1° E changed more than the west part.
It can be seen from Figure 3 that the above-ground biomass of the Altay grassland was significantly different in the different plots, and the average above-ground biomass of all plots was 62.21 g/m2. Among them, the lowest average above-ground biomass was 46.93 g/m2 in the Wuxilike plot, and the highest above-ground biomass was 75.75 g/m2 in the HB plot. The highest and lowest values of above-ground biomass also appeared in the altitude plots. The highest value was 133.02 g/m2 in HB4, and the lowest biomass was only 28.46 g/m2 in HB1. There was a 4.7-fold difference between the highest and lowest values.

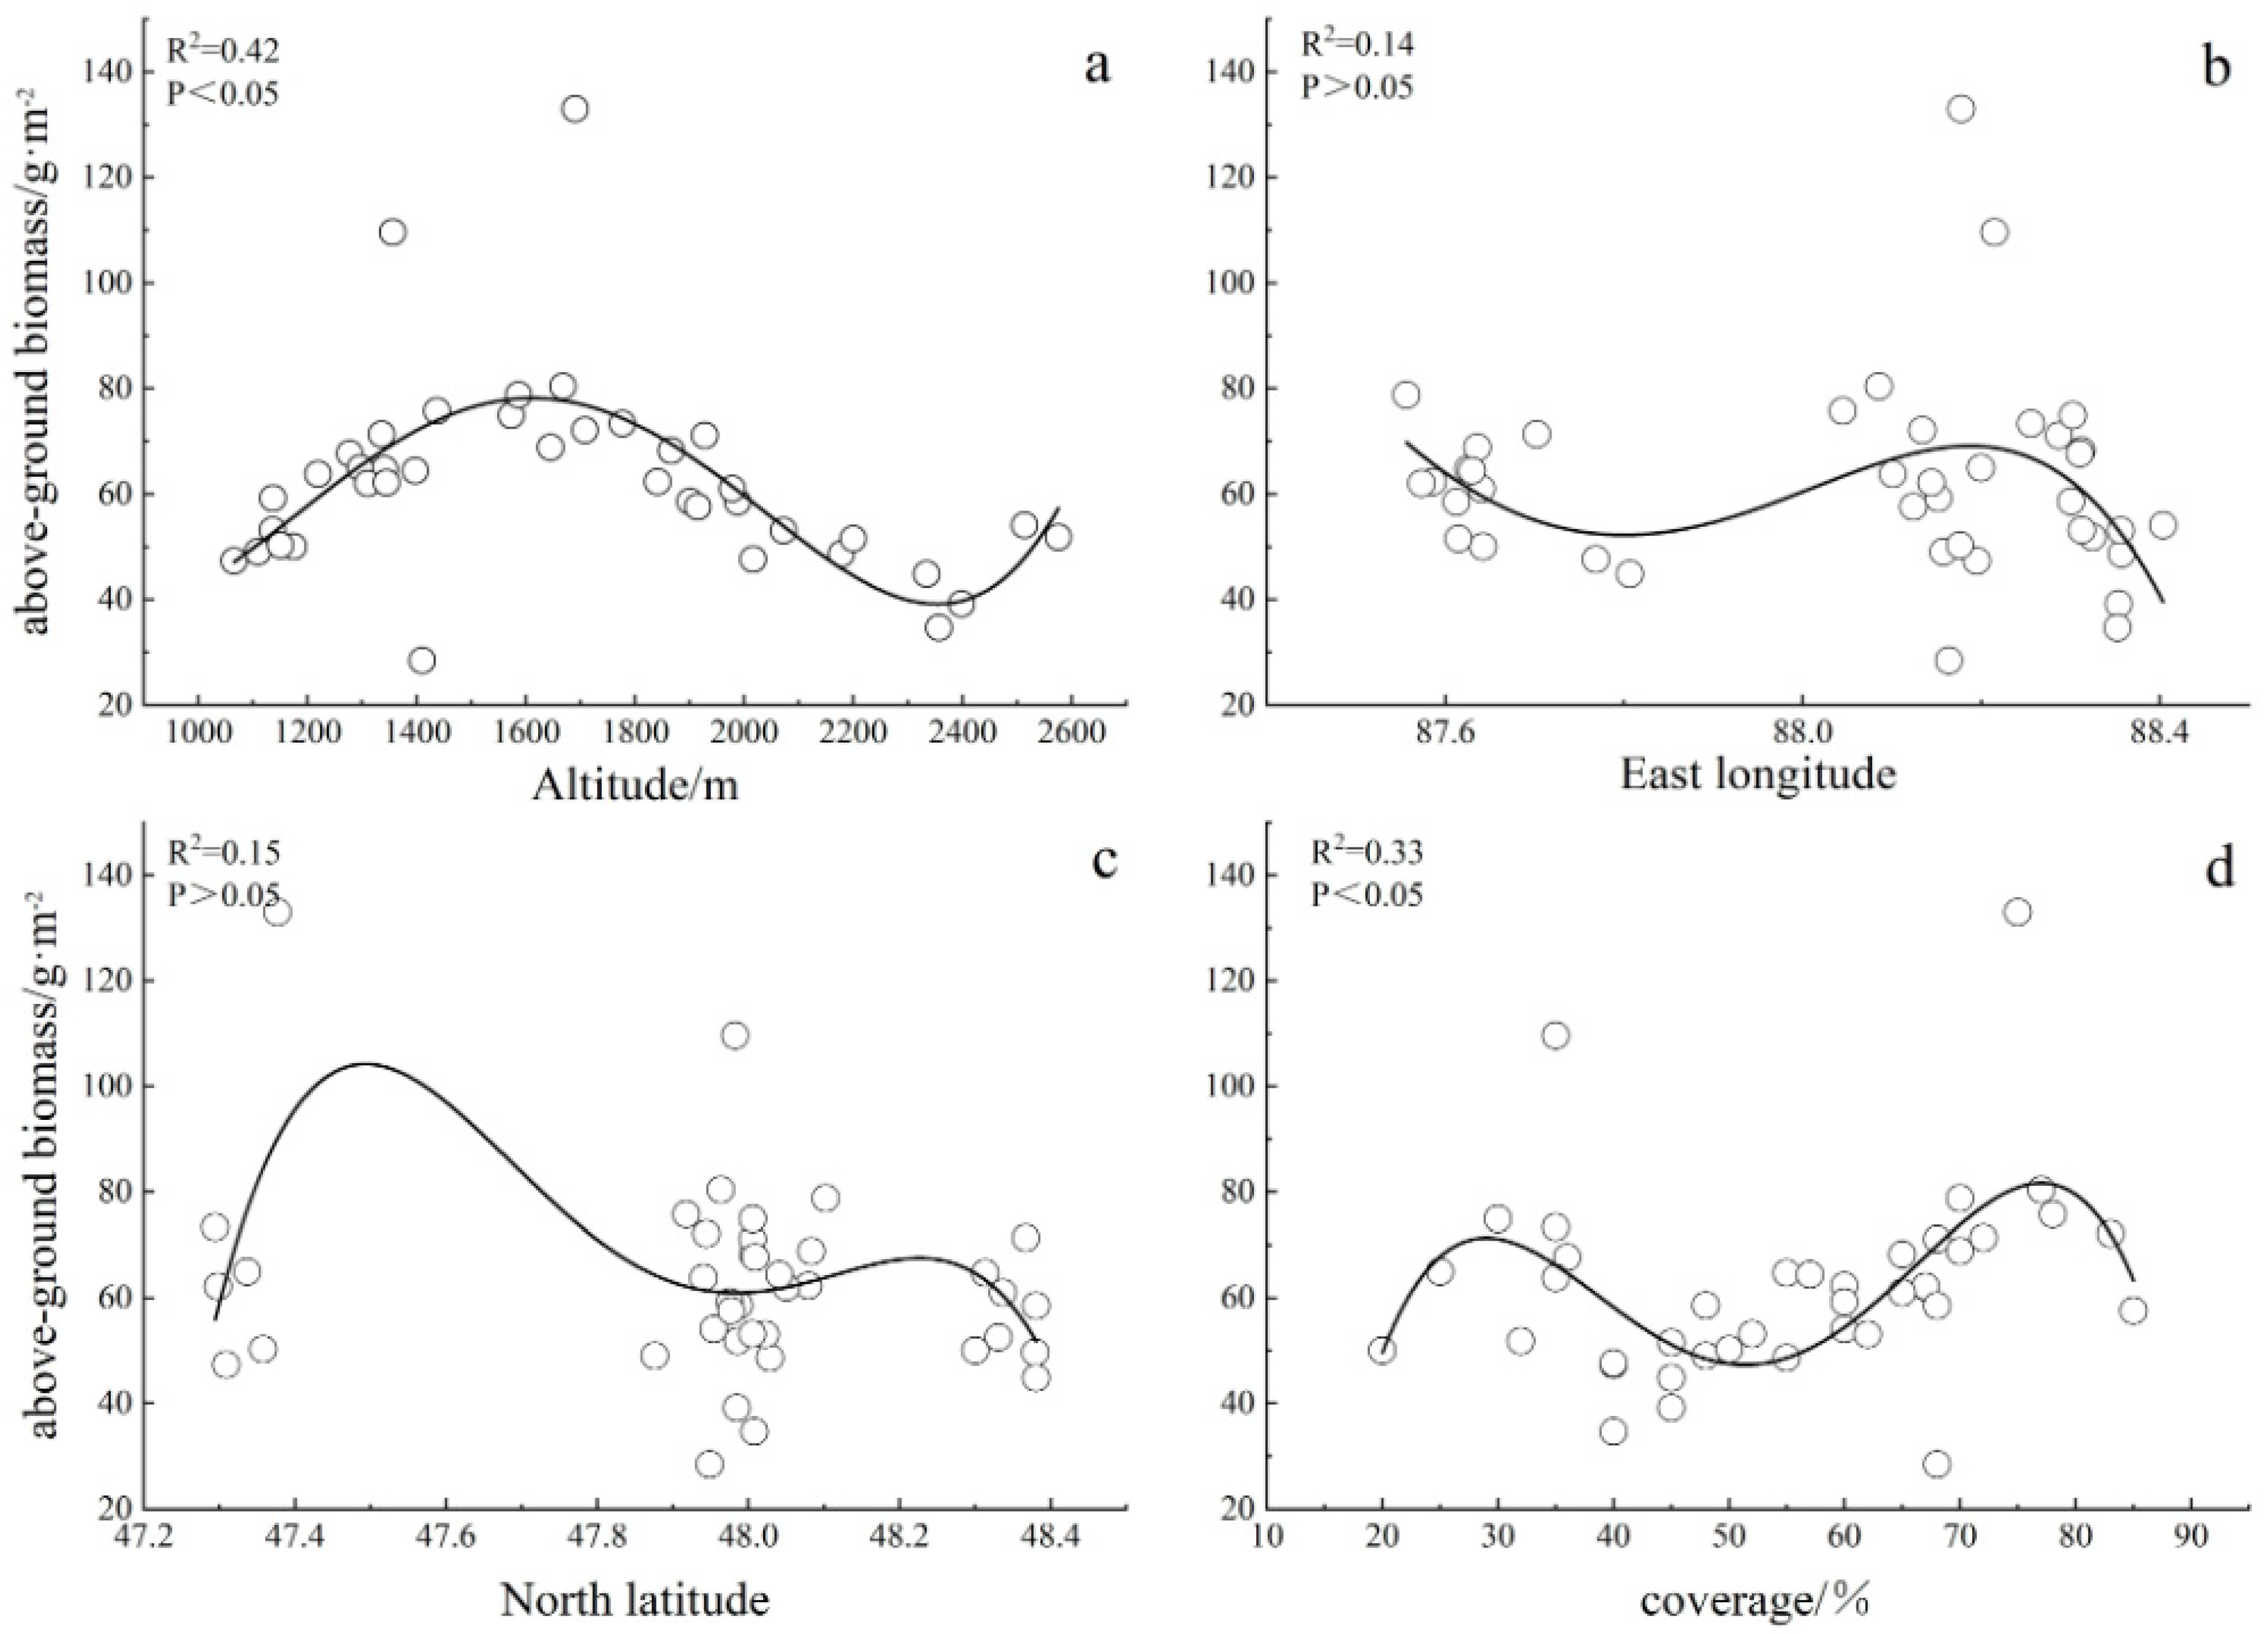
3.1.2. Influencing Factors of Spatial Pattern of Above-Ground Biomass

From Figure 4, it can be seen that with the increase in altitude from 1000 m to 2500 m, the above-ground biomass showed a very significant change (R2 = 0.42, p < 0.05). The change pattern first rose, then fell, and then rose, and the peak value appeared at an altitude of 1400~1800 m. There was no significant correlation between above-ground biomass and longitude and latitude. There was a significant cubic function relationship between above-ground biomass and grassland coverage (R2 = 0.36, p < 0.05). With the increase in coverage, the above-ground biomass showed a “bimodal” change pattern of first increasing and then decreasing. However, there were very few cases of low coverage and high biomass.

3.2. Spatial Pattern of Species Diversity and the Factors That Influence It

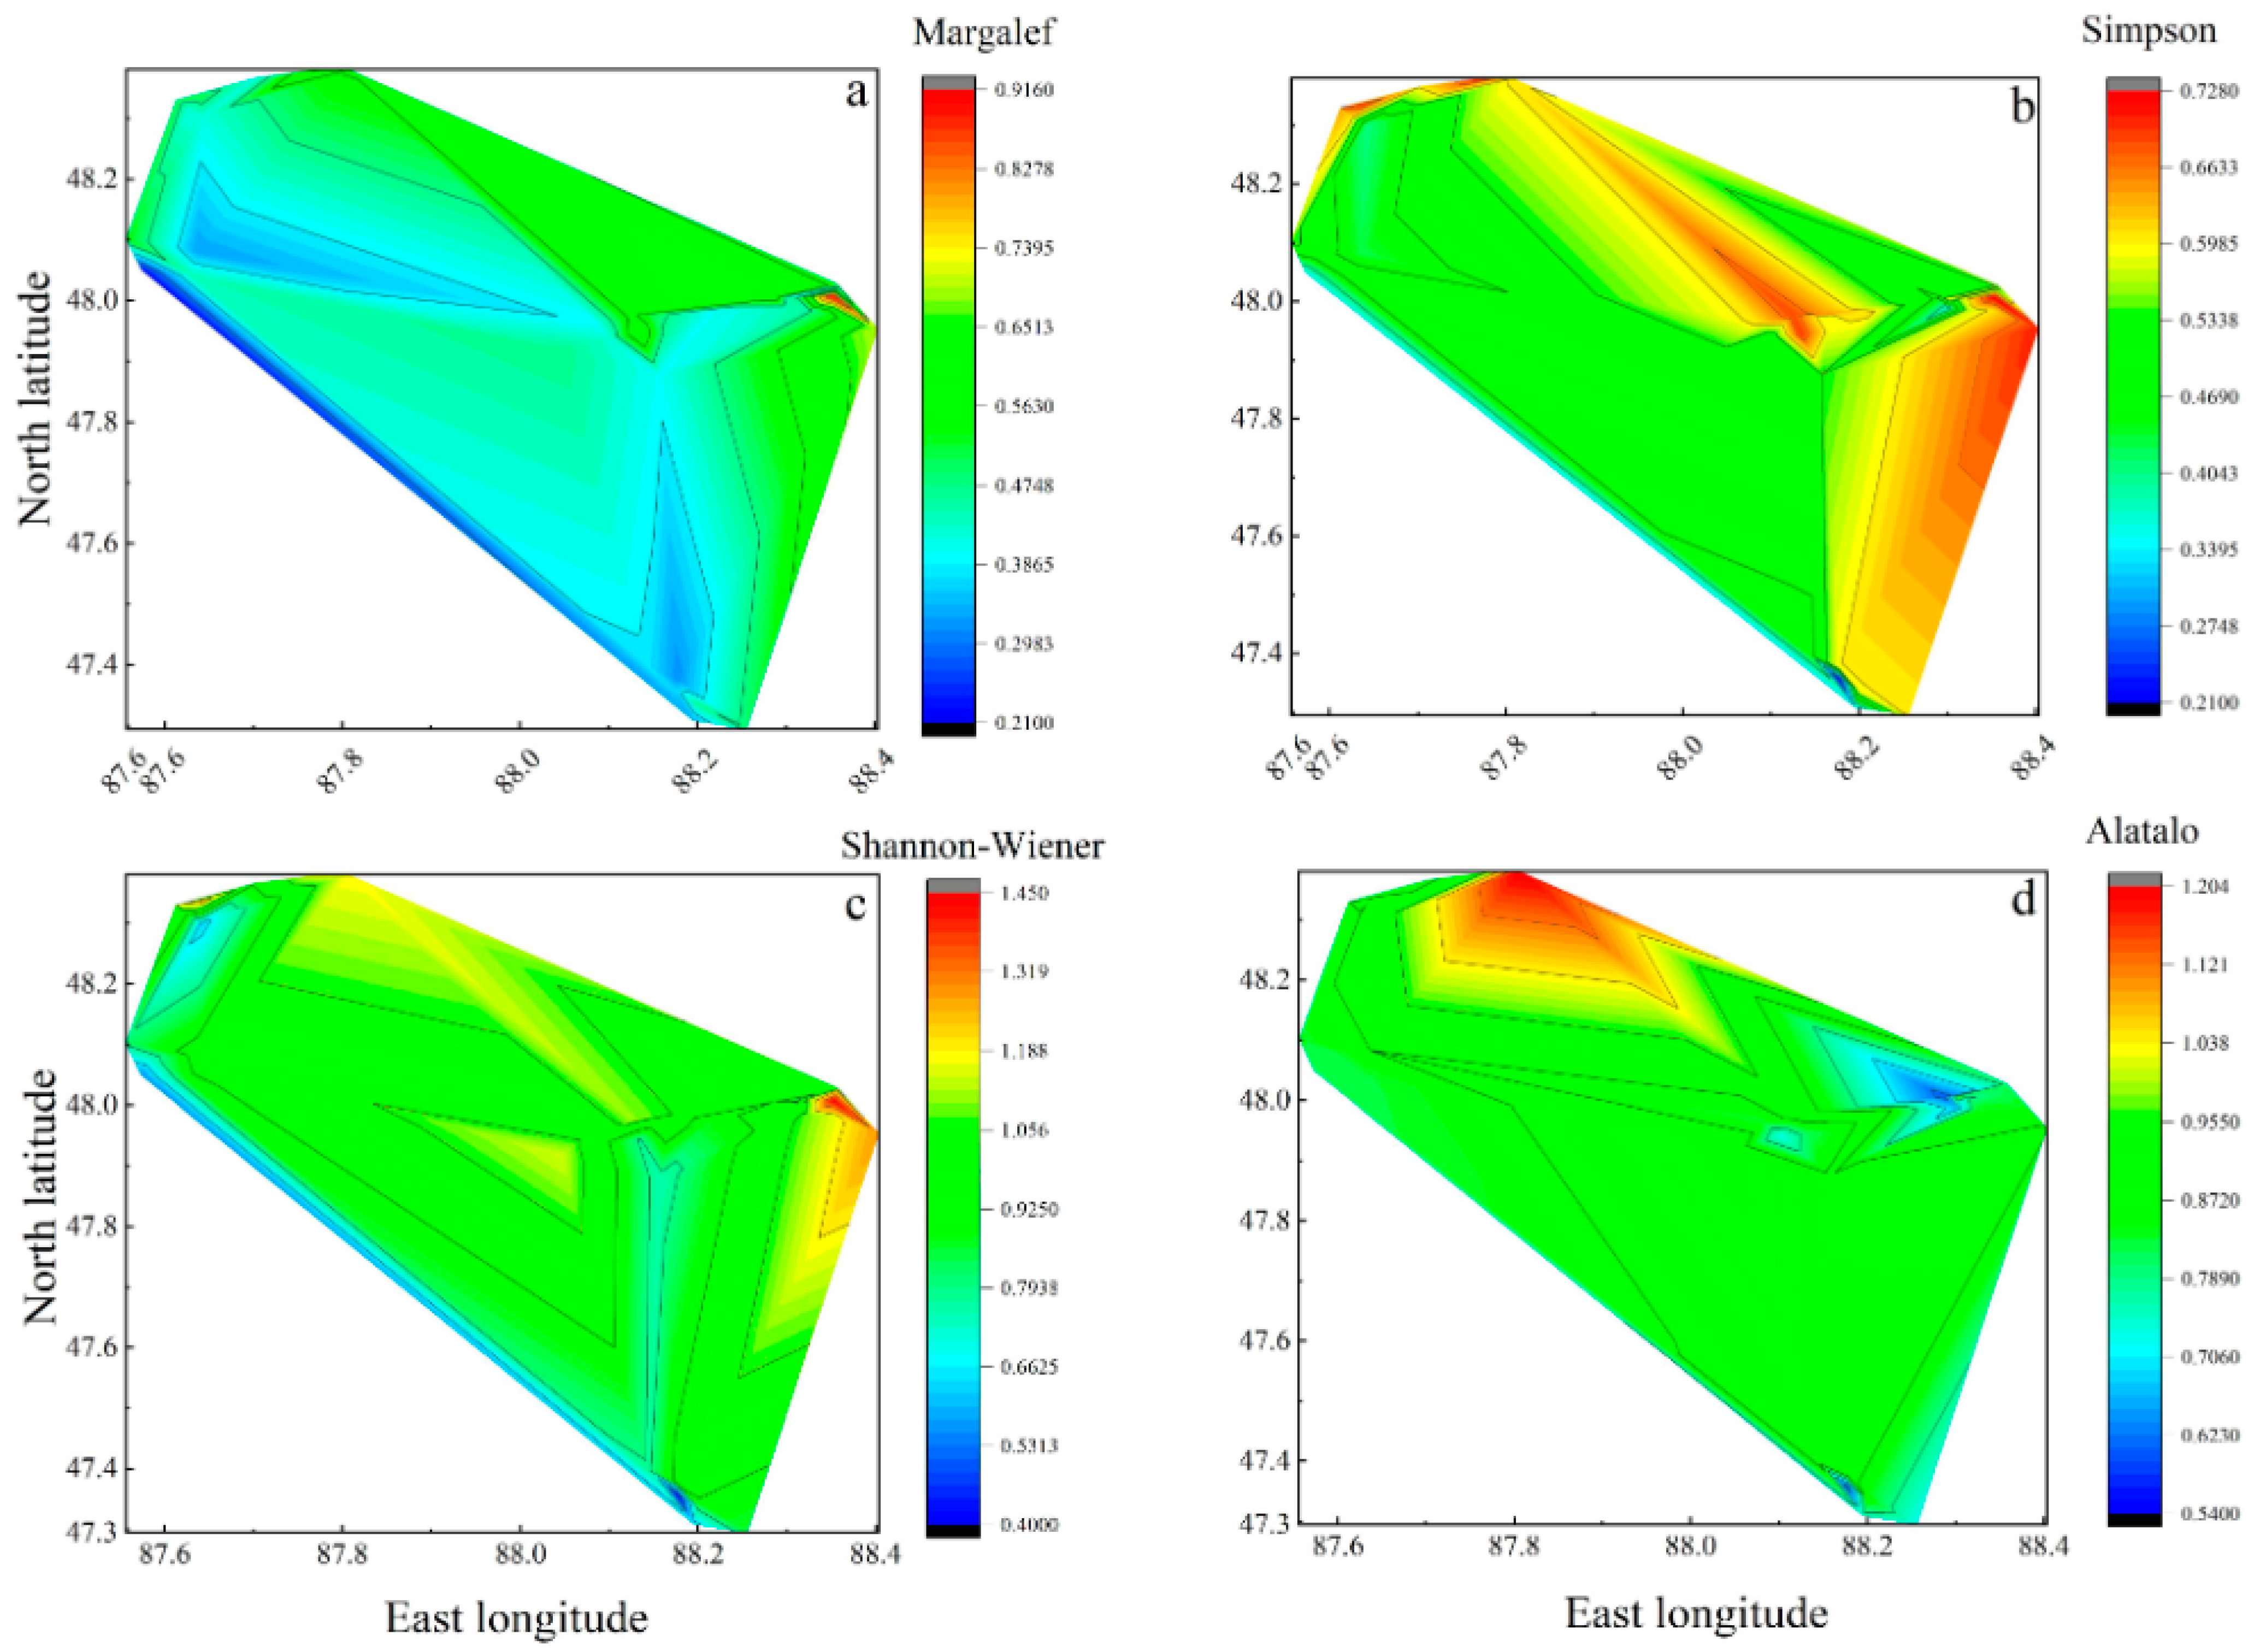
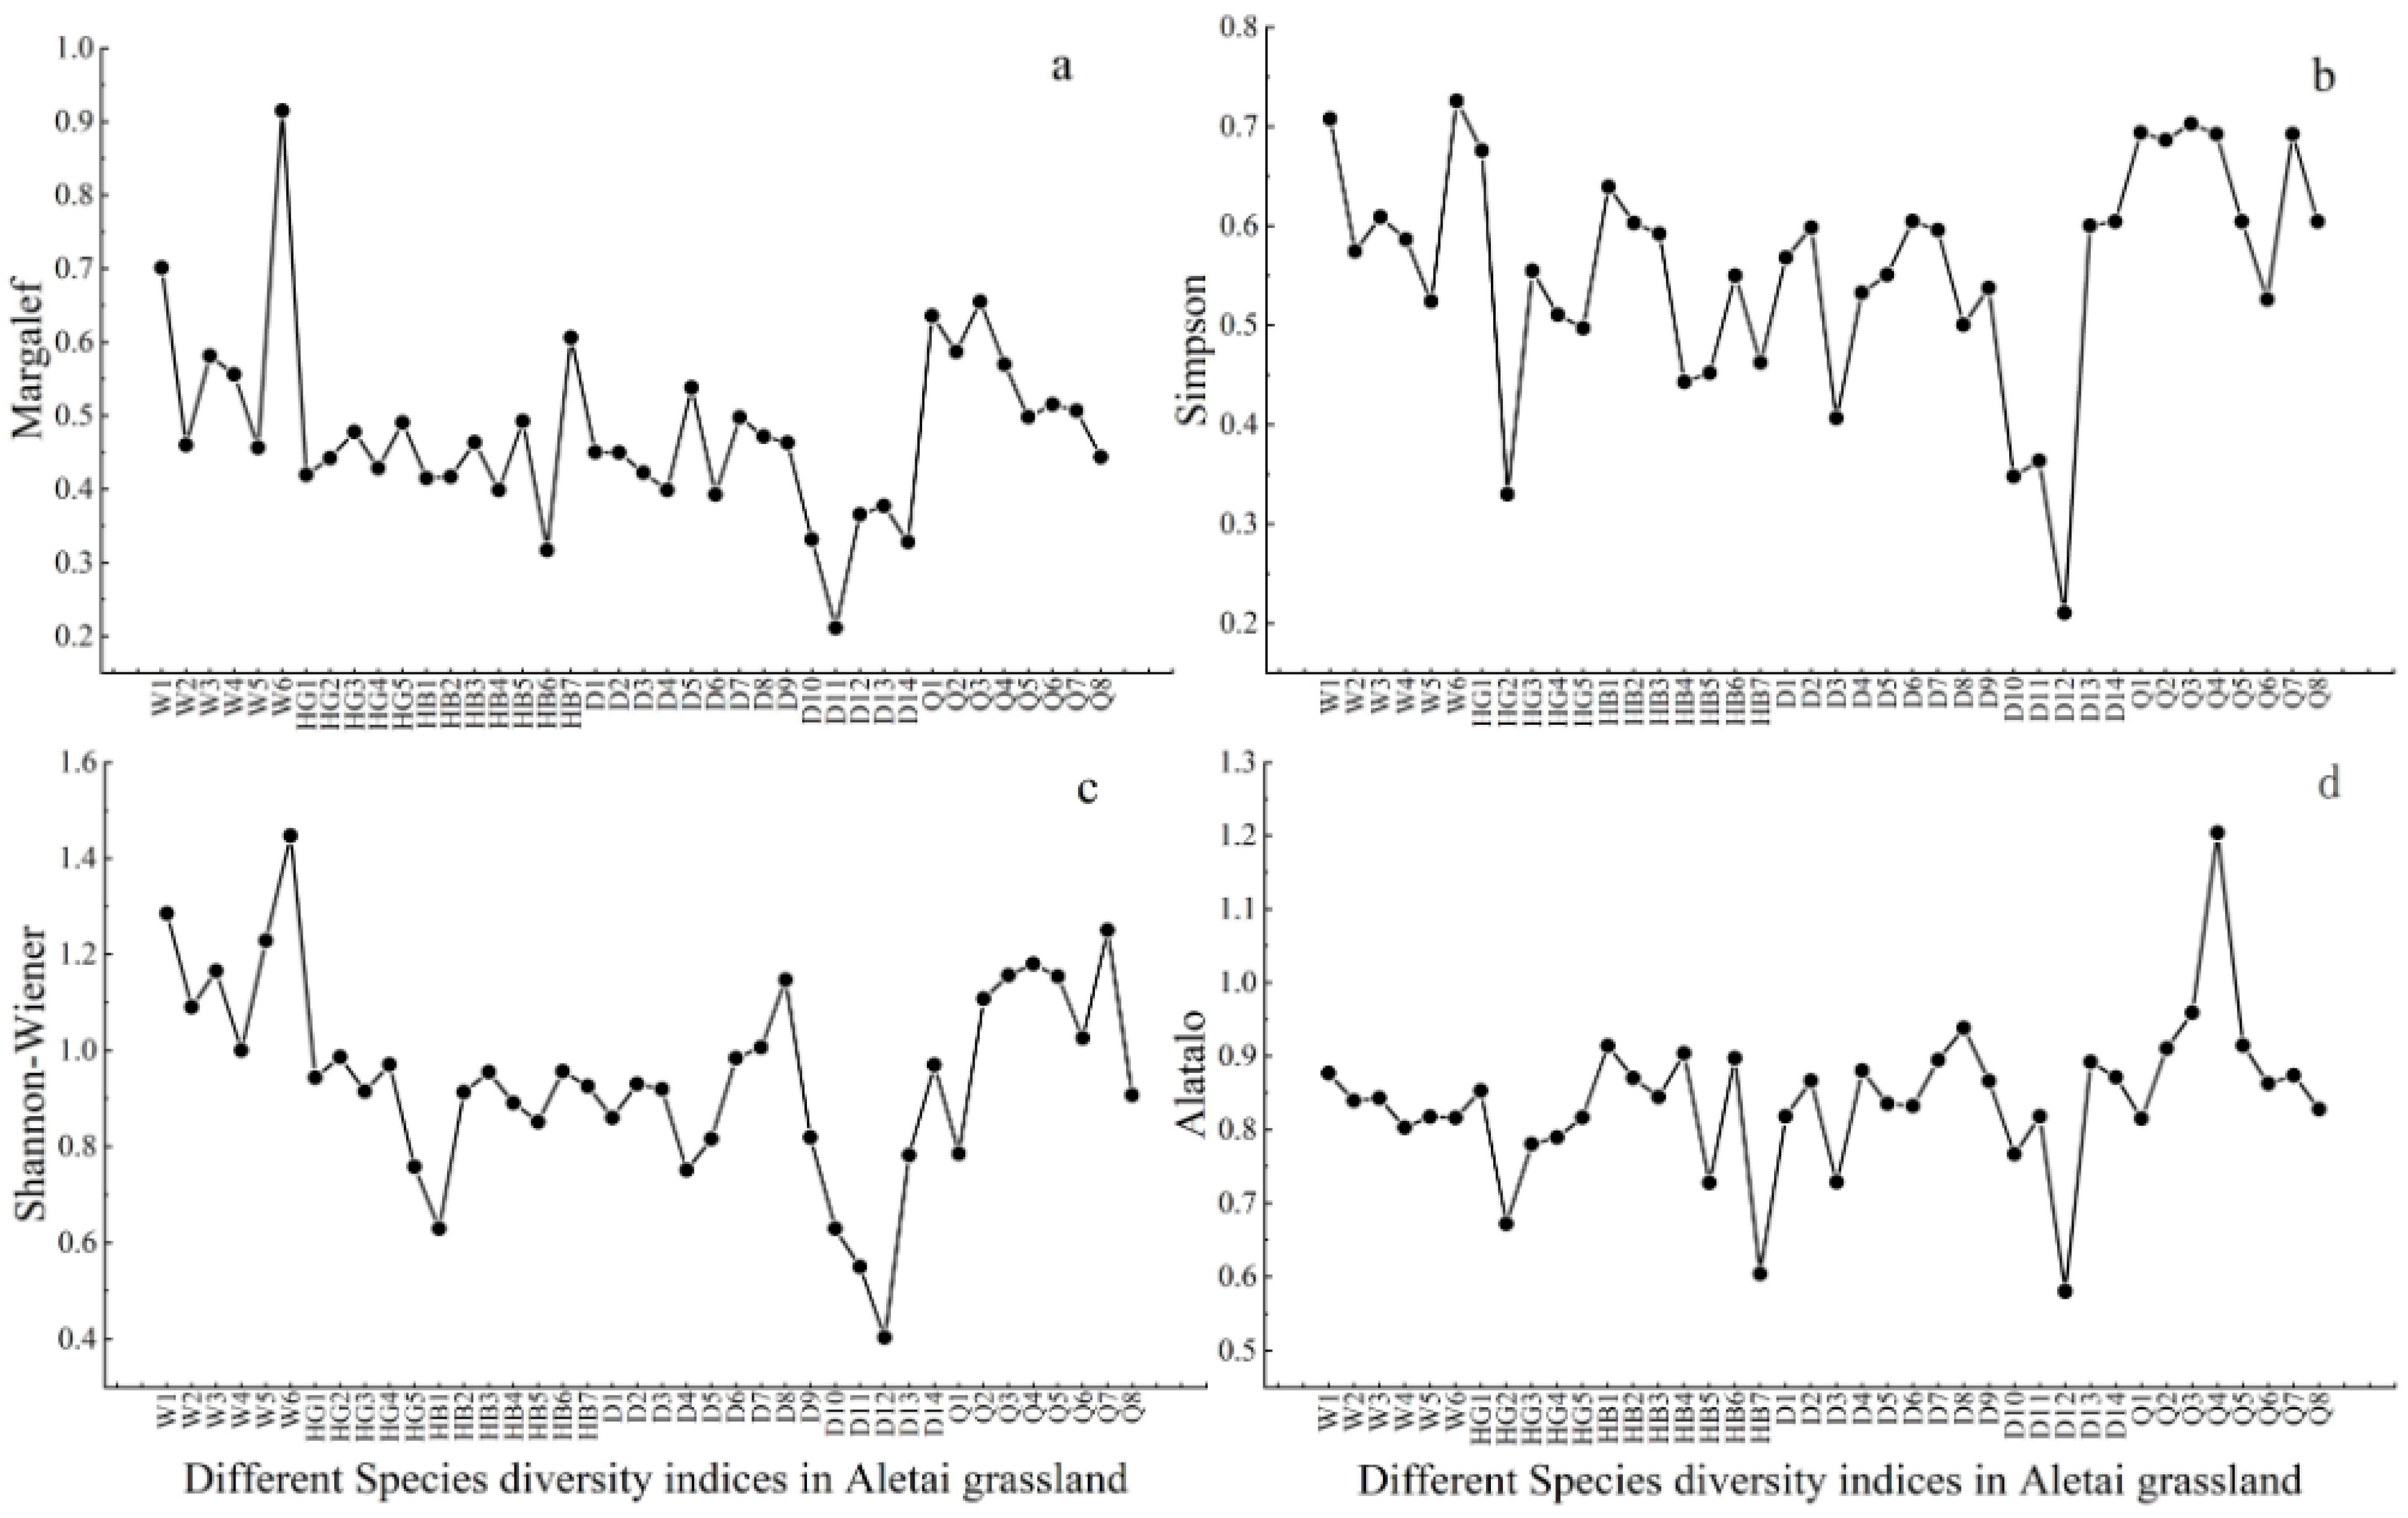
3.2.1. Spatial Pattern of Species Diversity

The species diversity of the Altay grassland was more complicated along the latitude and longitude lines from a spatial point of view. In addition to the Alatalo index, the species diversity indexes were generally higher in the northeast (high longitude, high latitude), and the lowest values were mostly in the southwest. However, the spatial distribution characteristics of various species diversity indexes were not exactly the same. The variation range of the Simpson index was 0.33~0.73, showing a spatial pattern of higher values in the east (high longitude) and lower in the west (low longitude). The variation range of the Margalef index was 0.21~0.91, which was divided into three parts from northeast to southwest and gradually decreased step by step. The part with the low values appears in the range of 87.6~88.2° E and 47.3~48.1° N. The Shannon–Wiener index ranged from 0.40 to 1.45. In the whole Altay grassland, except for a few plots, the Shannon–Wiener index was higher, and it was roughly divided into three parts, which gradually decreased from northeast to southwest; the parts with the high values were all in the range of 88.3~88.4° E, 47.8~48° N in the northeast. The Alatalo index ranged from 0.54 to 1.20. In contrast to the other diversity indexes, the Alatalo index was highest in the northwest and lowest in the northeast and southeast. Taking 88.1° E as the boundary, the spatial distribution of the Alatalo index was divided into two parts: east and west. The difference between east and west was obvious, the change was more complex, and the distribution pattern gradually decreased from high longitude to low longitude.
It can be seen from Figure 5 that, except for the Alatalo index, there were great differences among the plots, but the trend of the species diversity indexes was generally the same. The average species diversity index of the Altay grassland was 0.48; the Simpson index was 0.56; the Shannon–Wiener index was 0.95; and the Alatalo index was 0.84. The Shannon–Wiener index was the highest, and the Margalef richness index was the lowest, indicating that the species diversity of the Altay grassland was generally high. The overall average species diversity index of the Dadonggou plot was the lowest, and the overall species diversity index of the Qiaoati plot was higher; the highest value of the Alatalo index (1.20) appeared in the Qiaoati plot (Q4). The highest values of the Margalef, Simpson, and Shannon–Wiener indexes were 0.92, 0.73, and 1.45, respectively, in the Wuxilike plot (W6). However, the diversity index values of various plots in Wuxilike were quite different, so the average value of the whole Wuxilike plot was not high.

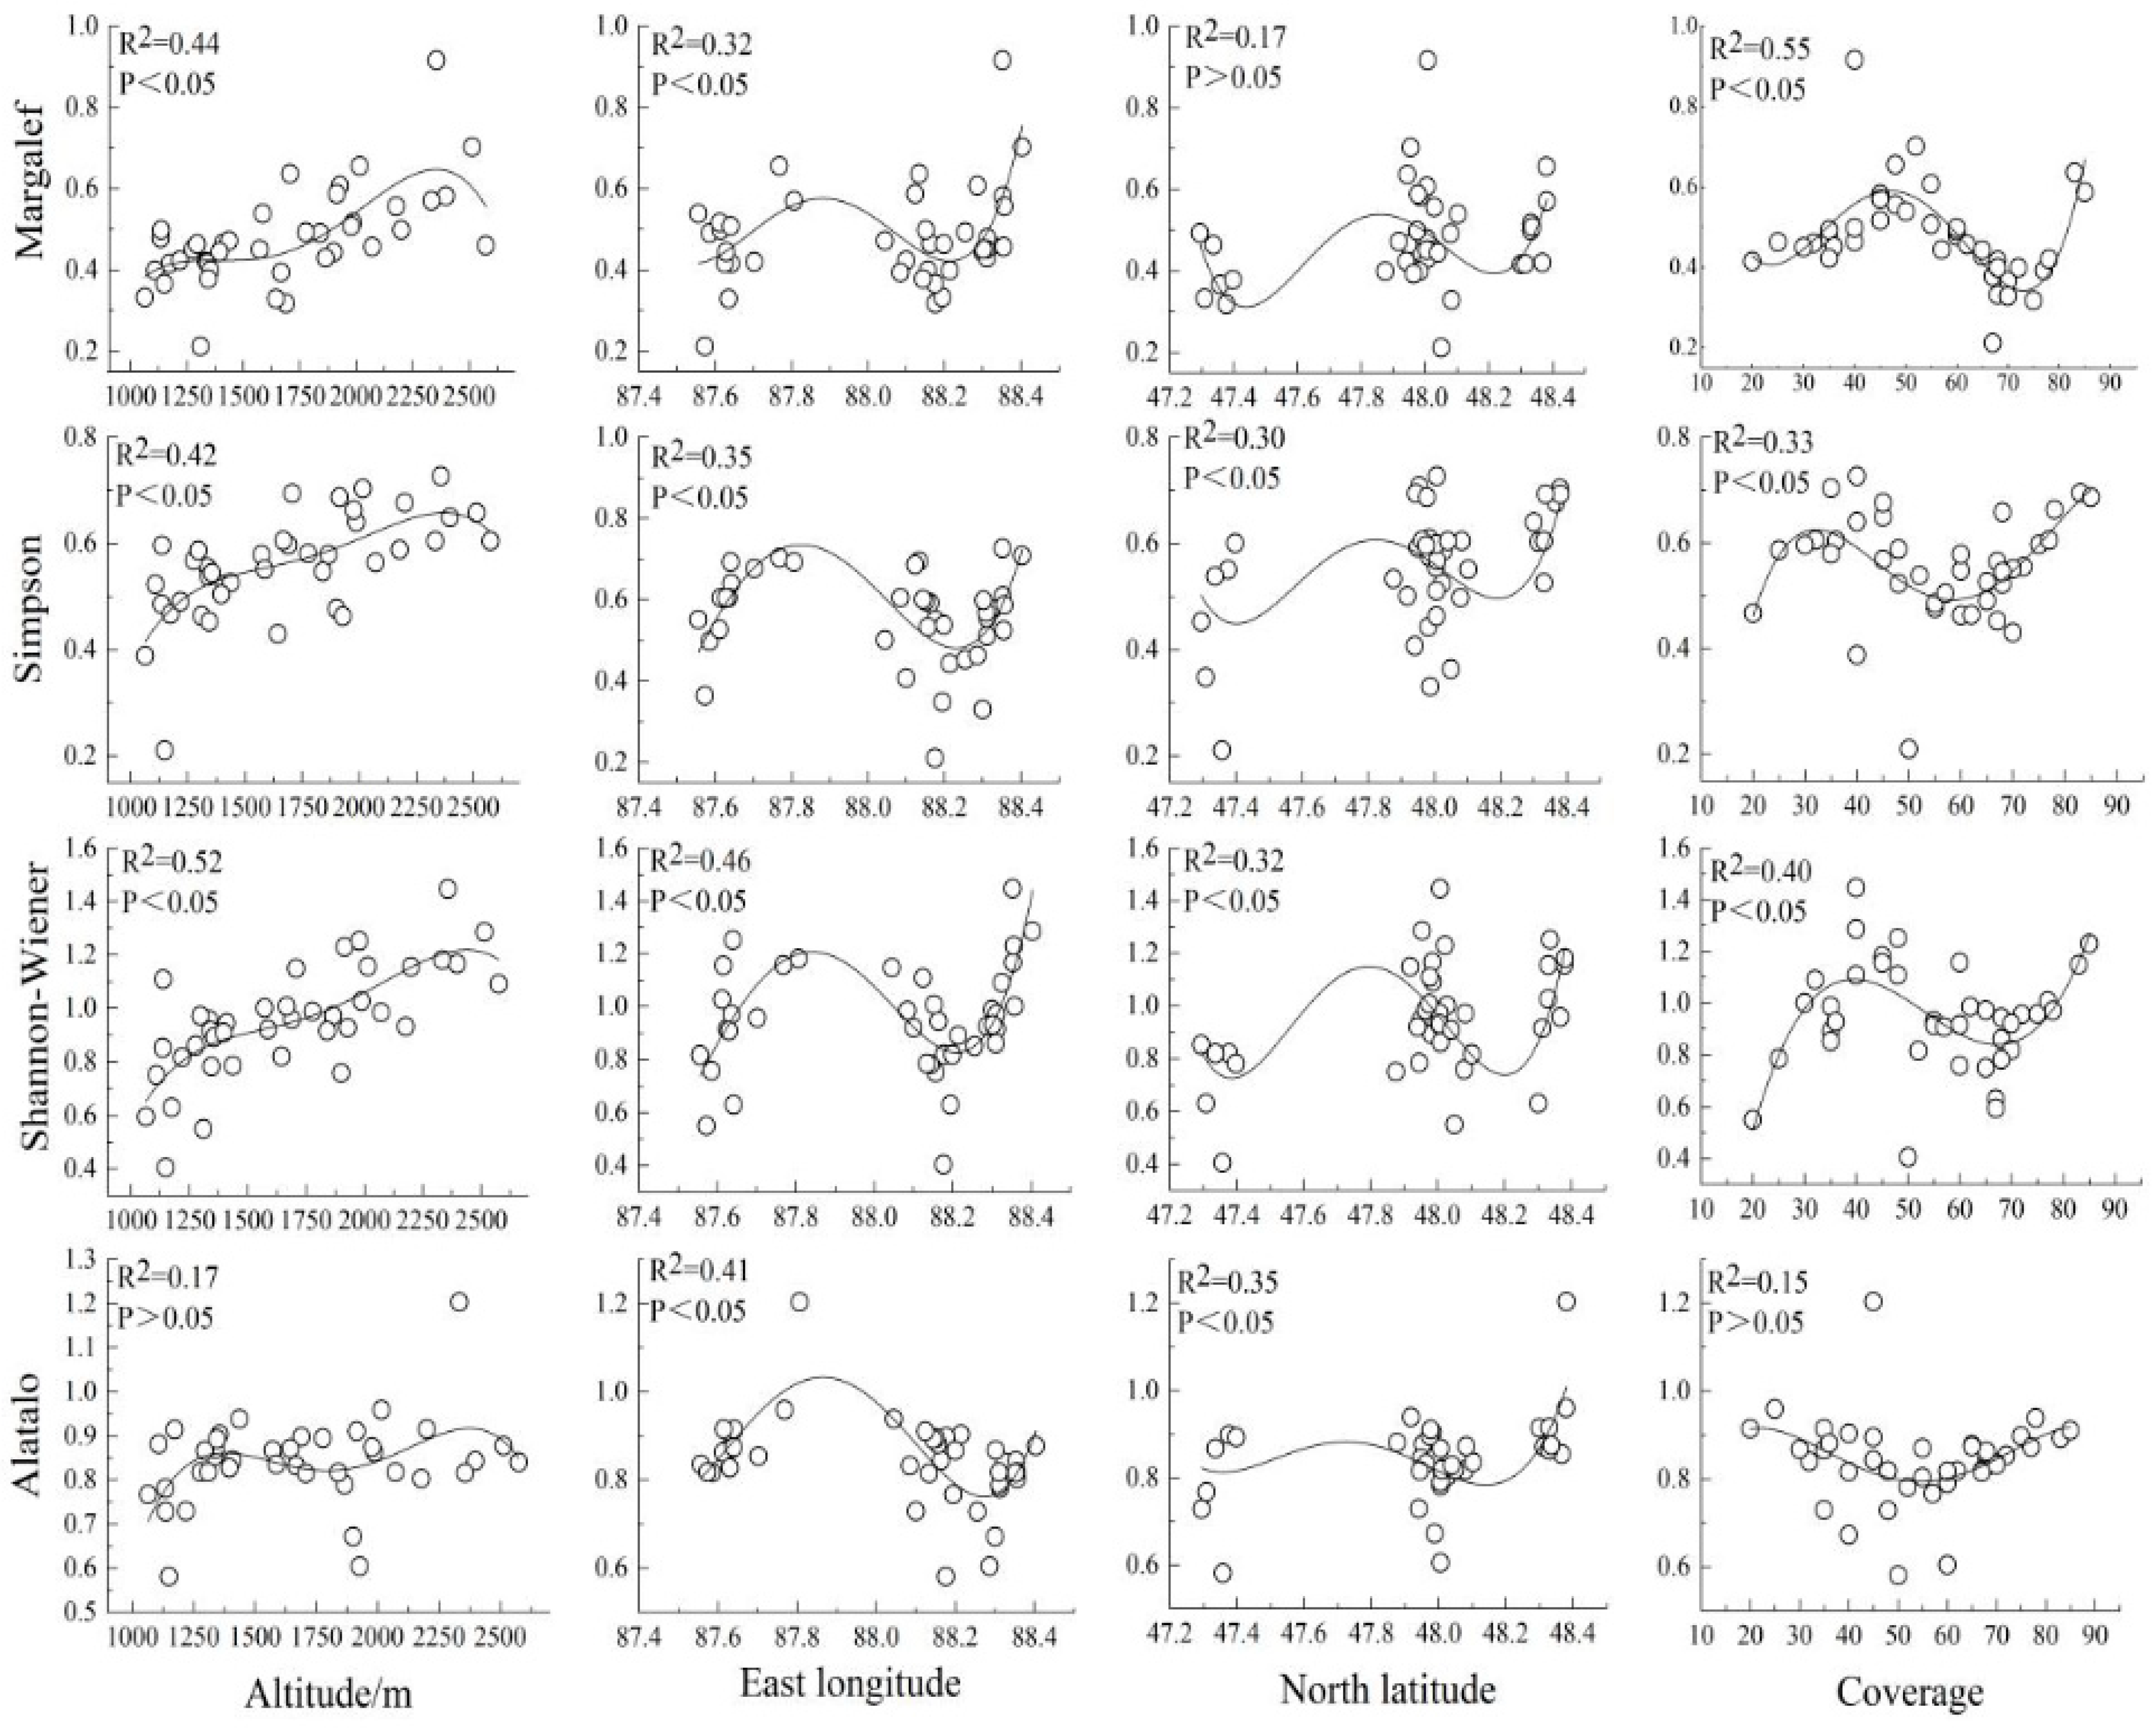
3.2.2. Influencing Factors of Spatial Pattern of Species Diversity

It can be seen from Figure 6 that the species diversity index changed significantly along with altitude. The Margalef index showed a significant cubic function relationship with altitude (p < 0.05, Table 1). With the increase in altitude, the Margalef index first increased and then decreased, and there was a sharp increase between 2000 and 2300 m. The Simpson and Shannon–Wiener indexes had the same change trend with altitude and had a significant positive correlation with altitude (p < 0.05, Table 1); with the increase in altitude, the pattern of change was spiral. The peak values appeared at an altitude of 2100~2300 m. There was no significant change in the Alatalo index with the increase in altitude (p > 0.05).
There was a significant positive correlation between the four species diversity indexes and longitude, and the trend of change was generally consistent (Table 2). With the increase in longitude, the four species diversity indexes showed an “S” pattern of first increasing, then decreasing, and then increasing. Two peaks appeared between 87.7~87.9° E and 88.4° E. The lowest values were in the range of 87.5~87.6° E and 88.1~88.3° E. From the relationship between latitude and species diversity, the influence of latitude on the Margalef index was not significant, and the remaining diversity indexes were significantly positively correlated with latitude (p < 0.05). With the increase in latitude, the diversity index of each species showed a “W” pattern, and the two peaks appeared in the range of 47.7~47.9° N and 48.3~48.4° N. The coverage was significantly correlated with the Margalef, Simpson, and Shannon–Wiener indexes (p < 0.05). The correlation between the Margalef index and coverage was as high as 0.55. It can be seen from Figure 7 that, except for the Alatalo index uniformity, which was not significantly correlated with the coverage, the other indexes first increased, then decreased, and then increased with the increase in coverage.

4. Discussion

4.1. Spatial Pattern of Above-Ground Biomass and Its Influencing Factors

Due to the regional characteristics of the study area, the factors affecting the spatial pattern of above-ground biomass were not the same. The above-ground biomass of the Altay grassland was significantly positively correlated with altitude (p < 0.05); the biomass first increased and then decreased with the increase in altitude, showing a single peak. This is consistent with the previous research results in the Altay two river source area [11], Qinghai Guoluo Prefecture [45], Lhasa River Valley area [46], and northern Tibet [27]. A study on the relationship between biomass and altitude of some dominant species in Xinjiang by Ma Jingjing found that there was a “U-shaped” relationship between them, which first decreased and then increased [47]. The reason for this result may be due to the low precipitation and large amounts of evaporation in the low-altitude area of Xinjiang, which makes salt accumulate on the soil surface, thus affecting the growth of plants and reducing the species in the community [48]. In high-altitude areas, the climate is humid, and the plant water content is higher than that of meadow steppes. In the Altay forest region, the study area is affected by westerly airflow, and the Altay Mountains are rich in precipitation [49]. The climate is also relatively humid at low altitudes, and the temperature decreases with the increase in altitude, limiting plant growth. In the horizontal direction, with the increase in longitude, the above-ground biomass of the Altay grassland decreased gradually from northeast to southwest. There was an aberration in the range of 88.1 E~88.2° E because the plot was located near the mountain meadow of the elevation plot, and the hydrothermal conditions were better. At the same time, this pasture is an autumn pasture, and other pastures are spring and summer pastures. The sampling time of this study was June, and grazing had not yet begun, so there was a sudden increase in biomass in this interval. Altitude is one of the most important factors among many factors, and its change usually affects the redistribution of temperature, humidity, and solar radiation, which then affects the distribution pattern of grassland [50,51]. Most of the Wuxilike sample plots belong to the alpine meadow grassland type with low temperatures and high humidity. This altitude section is suitable for the growth of cold-resistant and wet-loving plants such as Kobresia humilis and Androsace tapete Maxim, resulting in the lowest average biomass of the Wuxilike sample plots. Wang Changting also confirmed that a cold and humid soil environment is more conducive to the growth and development of Kobresia humilis [52]. Above-ground biomass varied greatly from north to south. This may be due to the low altitude and suitable water temperature in the south part of the Altay grassland, resulting in a larger biomass in the south. The relationship between above-ground biomass and coverage was very complex, although there was a significant correlation (p < 0.05). On the whole, with the increase in coverage, the biomass showed a “bimodal” pattern of first increasing and then decreasing, but there was a phenomenon of low coverage and high biomass, which may be due to low vegetation coverage but large plant growth. On the whole, the main limiting environmental factors of grassland above-ground biomass in the Altay forest area are altitude, latitude, and coverage, which is consistent with the spatial pattern of grassland biomass in the Altay Mountains.

4.2. Spatial Pattern of Species Diversity and Its Influencing Factors

Among the species diversity indexes, the Shannon–Wiener index was the highest, indicating that the overall stability of the Altay grassland community was relatively high. However, due to various environmental factors such as altitude and coverage and the influence of grazing, the range of the Shannon–Wiener index between different plots was large. The species diversity index of the grassland in the Altay forest area was the highest in the northeast except for the Alatalo index. However, the highest value of the Alatalo index appeared in the northwest, which was opposite to the spatial pattern of the other species diversity indexes. This is because the more concentrated the number of individuals (or biomass) in the community was in a few groups, the greater the dominance of the community. The more dispersed the community is, the smaller the dominance [53]. The Margalef index was low because grazing changed the species composition of grassland communities. Due to grazing, the grassland was dominated by trampling-resistant dwarf grasses, Compositae, and Ranunculaceae plants [54]. There were large differences in the various diversity indexes among different plots in Wuxilike. Although the highest values of the Margalef richness index, Simpson dominance index, and Shannon–Wiener diversity index all appeared in the Wuxilike plot (W6), the average value of the whole plot was not high. The reason may be that there was a large difference in the slope aspect. As an important topographic factor, the slope aspect can redistribute hydrothermal resources in a certain area [26,55]. It can lead to changes in constraints, interspecific competition, or driving factors that control the spatial pattern of community biomass and species diversity. This difference results in the heterogeneity of the spatial pattern of community species diversity indexes [56,57].
In addition to the Alatalo index, the effects of altitude, longitude, and coverage on species diversity were significant. The reason may be that the grassland in the Altay forest area is dominated by Gramineae and Artemisia dahuricus populations. For herbaceous plants with small individuals, the distance and range of seed dispersal are smaller, the seeds are small, and the number is large, so it is easier to form a smaller aggregated distribution with large aggregation intensity [58]. Therefore, environmental factors such as altitude, longitude, and coverage have no significant effect on them. Therefore, the species diversity of the grassland in the Altay forest area is affected by altitude, longitude, and coverage.
The spatial pattern of species diversity and biomass of grassland in the Altay forest region was studied in this paper in terms of altitude, latitude, and longitude. Because of the poor environment in the Altay high-altitude area, the soil was not measured at the same time in the experiment, and the slope and slope factors were not recorded. This results in the correlation analysis of non-soil factors and slope factors with grassland biomass and diversity. At the same time, since soil factors were not taken into account, the PCA analysis method was not suitable for this study. This aspect will be included in our field monitoring in future studies. Soil, terrain factors, and human factors can be combined, and then statistical models such as PCA analysis can be used for analysis.

5. Conclusions

In this study, through the investigation of the grassland in the Altay forest area, the spatial pattern of species diversity and productivity and its influencing factors were analyzed, and the following conclusions were drawn:
(1)
The above-ground biomass of the grassland in the Altay forest area decreased gradually from northeast to southwest, and the above-ground biomass was significantly different in different plots. The average above-ground biomass was 46.93 g/m2 in the Wuxilike plot, and the highest above-ground biomass was 75.75 g/m2 in the altitude plots;
(2)
The above-ground biomass of grassland in the Altay forest region first increased and then decreased with the increase in altitude, showing a single peak, and the biomass was the largest at an altitude of 1400–1600 m. It showed a significant “bimodal” relationship with coverage;
(3)
The species diversity index of the grassland in the Altay forest area was generally high and characterized by high diversity in the northeast and low diversity in the southwest. Except for the Alatalo index, the lowest value mostly appeared in the southwest. The overall average species diversity index of the Dadonggou plot was the lowest, and the overall species diversity index of the Qiaoati plot was higher;
(4)
Except for the Alatalo index, which had no significant correlation with altitude and coverage, the species diversity indexes showed significant correlations with altitude. The distribution pattern of longitude and coverage was an “S” type. There is a significant “W” distribution trend with latitude. Altitude, latitude, and longitude were the main environmental factors affecting the spatial pattern of above-ground biomass and species diversity in the Altay grassland.

Author Contributions

Conceptualization, M.Y.; data curation, X.P. and Q.H.; investigation, X.P., K.Z. and Q.H.; methodology, M.Y. and X.P.; software, M.Y. and X.P.; validation, M.Y. and X.P.; visualization, X.P., K.Z. and Q.H.; project administration, M.Y.; writing—original draft, X.P.; writing—review and editing, X.P., M.Y., K.Z. and Q.H. All authors have read and agreed to the published version of the manuscript.

Funding

This research was funded by the Ecological Monitoring Analysis of Altai Mountain State Forest Management Bureau (2021), Grant No. 3010010251.

Data Availability Statement

The data that support the findings of this study are available from the corresponding author upon reasonable request.

Conflicts of Interest

The authors declare no conflict of interest.

References

  1. Wang, H.Z.; Fan, J.W.; Liu, S. A Comprehensive Analysis of Difference in Carbon Stock Estimation in the Grasslands of China. Acta Agrestia Sin. 2017, 25, 905–913. [Google Scholar]
  2. Scurlock, J.M.O.; Johnson, K.; Olson, R.J. Estimating net primary productivity from grassland biomass dynamics measurements. Glob. Chang. Biol. 2002, 8, 736–753. [Google Scholar] [CrossRef] [Green Version]
  3. Yang, Y.H.; Fang, J.Y.; Ma, W.H.; Guo, D.L.; Mohammat, A. Large-scale pattern of biomass partitioning across China’s grasslands. Glob. Ecol. Biogeogr. 2010, 19, 268–277. [Google Scholar] [CrossRef]
  4. Wu, H.B.; Shui, H.W.; Hu, G.Z.; Wang, X.X.; Gan, Z.Z.B.; Yan, J.; He, S.C.; Xie, W.D.; Gao, Q.Z. Species diversity and biomass distribution patterns of alpine grassland along an elevation gradient in the Northern Tibetan Plateau. Ecol. Environ. Sci. 2019, 28, 1071–1079. [Google Scholar]
  5. Jia, W.X.; Liu, Y.R.; Zhang, Y.S.; Cao, W.X. Species diversity and biomass of grassland steppe in Qilian Mountains and their relationships with climate factors. Arid Zone Res. 2015, 32, 1167–1172. [Google Scholar]
  6. Zhang, Y.; Zhao, J.L.; Xin, X.P.; Wang, M.; Pan, F.J.; Yan, R.R.; Li, L.H. Effects of stocking rate on the interannual patterns of ecosystem biomass and soil nitrogen mineralization in a meadow steppe of northeast China. Plant Soil 2021, 473, 9–31. [Google Scholar] [CrossRef]
  7. He, M.Y.; Wang, Y.X.; Peng, Z.C.; Chang, S.H.; Saman, B.; Liu, Y.J.; Hou, F.J. The spatial pattern of aboveground biomass and species richness in the grassland of Qilian Mountain grassland. Pratacult. Sci. 2020, 37, 2012–2021. [Google Scholar]
  8. Dai, L.C.; Ke, X.; Zhang, F.W.; Du, Y.G.; Li, Y.K.; Guo, X.W.; Li, Q.; Lin, N.L.; Ma, J.J.; Cao, G.M. Allocation patterns of above- and belowground biomass and its response to meteorological factors on an alpine in Qinghai-Tibet Plateau. Acta Ecol. Sin. 2019, 39, 486–493. [Google Scholar]
  9. Piao, S.L.; Fang, J.Y.; He, Y.S.; Xiao, Y. Grassland vegetation biomass and its spatial distribution pattern in China. J. Plant Ecol. 2004, 28, 491–498. [Google Scholar]
  10. Zhang, Y.; Hou, L.L.; Yan, R.R.; Xin, X.P. Effects of grazing on plant community characteristics and Nutrient quality of Herbage in a Meadow Steppe. Sci. Agric. Sin. 2020, 53, 2550–2561. [Google Scholar]
  11. Wu, K.; Xu, W.X.; Yang, W.K. Impact of Rainfall Changes on Plant Community in Junggar Desert. Res. Soil Water Conserv. 2019, 26, 100–106. [Google Scholar]
  12. Lanta, V.; Leps, J. Effects of species and functional group richness on production in two fertility environments: An experiment with communities of perennial plants. Acta Oecol. 2007, 32, 93–103. [Google Scholar] [CrossRef]
  13. Dai, M.M.; Yang, K.; Li, S.; Wang, X.D.; Song, Z.B. Fish diversity and resource status in the Nanguang River, a tributary of upper Yangtze River. Biodivers. Sci. 2019, 27, 1081–1089. [Google Scholar]
  14. Guo, J.X.; Ye, M.; Yin, X.K.; Zhang, K.L. Biomass and Diversity of Grassland Community in the Two-river Source Pastoral Areas of Altai Mountains. Acta Bot. Boreal.-Occident. Sin. 2022, 42, 1936–1944. [Google Scholar]
  15. Chen, J.J.; Chang, S.H.; Wang, Z.F.; Peng, Z.C.; Cheng, Y.X.; Chen, X.J.; Hou, F.J. The relationship between plant species diversity and above-ground biomass in a typical steppe in Abaga Banner. Pratacult. Sci. 2018, 35, 2068–2078. [Google Scholar]
  16. Wang, Y.F.; Yu, S.X.; Wang, J. Biomass-dependent susceptibility to drought in experimental grassland communities. Ecol. Lett. 2007, 10, 401–410. [Google Scholar] [CrossRef] [PubMed]
  17. Deborah, S.; Klaus, V.H.; Kleinebecker, T.; Boeddinghaus, R.S.; Hinderling, J.; Kandeler, E.; Marhan, S.; Nowak, S.; Sonnemann, I.; Wurst, S.; et al. Recovery of Ecosystem functions after experimental disturbance in 73 grasslands differing in land use intensity, plant species richness and community composition. J. Ecol. 2019, 107, 2635–2649. [Google Scholar]
  18. Hector, A.; Schmid, B.; Beierkuhnlein, C.; Calderira, M.C.; Diemer, M.; Dimitrakopoulos, P.G.; Finn, J.A.; Freitas, H.; Giller, P.S.; Good, J.; et al. Plant diversity and productivity experiments in European grasslands. Science 1999, 1286, 1123–1127. [Google Scholar] [CrossRef] [Green Version]
  19. Whittaker, R.J. Meta-analyses and mega-mistakes: Calling time on meta-analysis of the species richness-productivity relationship. Ecology 2010, 91, 2522–2533. [Google Scholar] [CrossRef]
  20. Li, X.L.; Gao, J.; Zhang, J.; Hai, Q.S. Natural and anthropogenic influences on the spatiotemporal change of degraded meadows in southern Qinghai province, West China: 1976–2015. Appl. Geogr. 2018, 97, 176. [Google Scholar] [CrossRef]
  21. Zhang, X.J.; Ma, K.X.; Liu, X.B.; Yang, F.L.; Lin, H.L. Spatiotemporal patterns of windbreak and sand fixation before and after grazing prohibition in Ningxia. Pratacult. Sci. 2023, 40, 638–653. [Google Scholar]
  22. Ma, Y.Y.; Li, Q.; Feng, P.; Yang, Z.Z. Diversity of ground-dwelling spider community in different restoring times of post-fire forest, Cangshan Mountain, Yunnan Province. Acta Ecol. Sin. 2013, 33, 0964–0974. [Google Scholar]
  23. Zhang, H.Y.; Ou, X.H. Using insect for indicator to monitor and assess forest Ecosystem Health. World For. Res. 2006, 19, 22–25. [Google Scholar]
  24. Liu, M.Q.; Hu, F.; Li, H.X.; Chen, X.Y.; He, Y.Q. Soil Arthropod Communities Under Different Artificial Woodland Restored on Degraded Red Soil. Acta Ecol. Sin. 2002, 22, 54–61. [Google Scholar]
  25. Zhang, J.T.; Zhao, F.X.; Chen, J.H.; Li, Y.; Sun, J. Correlations of species diversity and biomass with environmental factors in alpine grasslands across the Qingzang Plateau. Pratacult. Sci. 2023, 40, 616–626. [Google Scholar]
  26. Yao, X.X.; Zhou, R.; Li, C.H.; Dou, J.S.N. Effects of solpe aspect on vegetation distribution pattern and forage quality characteristics of alpine grassland in the Qinghai-Tibet plateau. Acta Agrestia Sin. 2021, 29, 2792–2799. [Google Scholar]
  27. Duan, M.J.; Gao, Q.Z.; Guo, Y.Q.; Wan, Y.F.; Li, Y.; Gan, Z.Z.B.; Dan, J.L.B.; Wei, L.T.; Xi, R.Z.M. Species diversity distribution pattern of alpine grassland communities along an altitudinal gradient in the Northern Tibet. Pratacult. Sci. 2011, 28, 1845–1850. [Google Scholar]
  28. Bai, Y.F.; Li, L.H.; Wang, Q.B.; Zhang, L.X.; Zhang, Y.; Chen, Z.Z. Changes in plant species diversity and productivity along gradients of precipitation and elevation in Xilin River basin, Inner Mongolia. Chin. J. Plant Ecol. 2000, 24, 667–673. [Google Scholar]
  29. Guo, Y.R.; Zhao, H.L.; Zhao, X.Y.; Zuo, X.A.; Yun, J.Y. Study on the relationship between species diversity and productivity of sandy grassland communities in Horqin sandland. Zrid Zone Res. 2007, 24, 198–203. [Google Scholar]
  30. Yang, L.M.; Zhou, G.S.; Li, J.D. Relationship between productivity and plant species diversity of grassland communities in Songnen plain of northeast China. Chin. J. Plant Ecol. 2002, 26, 589–593. [Google Scholar]
  31. Rahbek, C. The role of spatial scale and the perception of large-scale species-richness patterns. Ecol. Lett 2005, 8, 224–239. [Google Scholar] [CrossRef]
  32. Huang, J.H.; Lu, X.H.; Guo, Z.J. Service functions of the natural forest ecosystem in Burqin Forest Farm, Xinjiang. Arid Zone Res. 2014, 31, 866–873. [Google Scholar]
  33. Huang, J.H.; Lu, X.H.; Guo, Z.J.; Wang, J.P.; Zang, R.G. Assessment of natural forest ecosystem services in Buerjin County, Xinjiang. J. Beijing For. Univ. 2015, 37, 62–69. [Google Scholar]
  34. Yin, X.K.; Ye, M.; Guo, J.X.; Zhang, K.L.; Zhao, F.F. Relationship between species diversity and productivity of different grassland types in Buerjin forest area of Altai mountains. J. Soil Water Conserv. 2022, 36, 110–115. [Google Scholar]
  35. Xue, R.H.; Jiao, L.; Liu, X.P.; Chen, K. Evaluation of the stability of the radial growth of Larix sibirica at different altitudes in response to climate change in Altai Mountains, Xinjia. Chin. J. Ecol. 2021, 40, 1275–1284. [Google Scholar]
  36. Xu, Q.; Zhao, W.Y.; Wei, Y.; Ye, M.; Zhao, X.F. Forestry structure and spatial distribution pattern of different age tree species in forest area of eastern Altai Mountain. Arid Zone Res. 2022, 39, 1885–1895. [Google Scholar]
  37. Zhang, D.L.; Li, Y.B.; Yang, Y.P.; Lan, B. Synthesized Climate Change in the North Altay Mountains in the Past 2000 Years. Arid Zone Res. 2019, 36, 176–185. [Google Scholar]
  38. Jiang, S.X.; Zhang, T.W.; Yu, S.L.; Shang, H.M.; Zhang, R.B.; Qin, L.; Yuan, Y.J. Integrated Reconstruction of the Historical Climate Series for the Tianshan Mountains and the Altay Mountains. Desert Oasis Meteorol. 2022, 16, 102–111. [Google Scholar]
  39. Hu, J.; Yu, S.L.; Yuan, Y.J.; Shang, H.M.; Zhang, T.W.; Zhang, R.B. Characteristics of tree-ring width chronologies in the central Altai Mountains and climate response. Desert Oasis Meteorol. 2014, 8, 19–26. [Google Scholar]
  40. Xu, H.J.; Han, B.P. Main soil types and soil vertical distribution in Altay mountains Area, Xinjiang. Chin. J. Soil Sci. 2008, 39, 465–470. [Google Scholar]
  41. Ma, K.P. Measuring methods of biodiversity i. Measuring methods of α diversity (part one). Chin. Biodivers. 1994, 2, 229–239. [Google Scholar]
  42. Ma, K.P. Measuring methods of biodiversity i. Measuring methods of α diversity (part two). Chin. Biodivers. 1994, 2, 231–239. [Google Scholar]
  43. Zhao, X.J.; Liang, Z.D.; Shao, L.J.; Zhao, X.F. Analysis and Evaluation on Nonlinear Regression Function of SPSS Software. Stat. Decis. 2021, 23, 20–22. [Google Scholar]
  44. Luo, Y.; He, Y.B.; Li, D.Z.; Wang, Y.H.; Yi, T.S.; Wang, H. A Comparison of Classifications of Families of Chinese Vascular Plants among Flora Republicae Popularis Sinicae, Flora of China and the New Classifications. Plant Divers. Resour. 2012, 34, 231–238. [Google Scholar] [CrossRef]
  45. Ma, W.L.; Shi, P.L.; Li, W.H.; He, Y.T.; Zhang, X.Z.; Shen, Z.X. The change of individual plant traits and biomass allocation in alpine meadow with elevation variation on the Qinghai-Tibetan Plateau. Sci. China Press 2010, 40, 533–543. [Google Scholar] [CrossRef]
  46. Luo, L.M.; Miao, Y.J.; Wu, J.S.; Pan, Y.; Tu, Y.L.; Yu, C.Q.; Zhao, Y.; Zhao, G.F.; Wu, J.X. Variation characteristics of species diversity of mountain shrub grassland in Lhasa River Valley with increasing altitude. Acta Pratacult. Sin. 2014, 23, 320–423. [Google Scholar]
  47. Ma, J.J.; Liu, Y.H.; Sheng, J.D.; Li, N.; Wu, H.Q.; Jia, H.T.; Sun, Z.J.; Cheng, J.H. Changes of relationships between dominant species and their relative biomass along elevational gradients in Xinjiang grasslands. Acta Pratacult. Sin. 2021, 30, 25–35. [Google Scholar]
  48. SU, J.J.; Liu, Y.P.; Liu, L.Y.; Wu, T.Z.; Wang, M. Quantitative classification and ordination analysis of typical plant communities in Altay Prefecture of Xinjiang. Acta Pratacult. Sin. 2023, 32, 50–67. [Google Scholar]
  49. He, B.; Wang, G.Y.; Su, H.C.; Shen, Y.P. Response of extreme hydrological events to climate change in the regions of Altay Mountains, Xinjiang. J. Glaciol. Geocryol. 2012, 34, 927–933. [Google Scholar]
  50. Liu, Y.Y.; Hu, Y.K.; Wang, X.; Gong, Y.M. Vertical differentiation characteristics of species diversity and biomass of alpine grassland in the middle of the southern slope of Tianshan Mountain. Chin. J. Ecol. 2013, 32, 311–318. [Google Scholar]
  51. Ehud, M. From patterns to function in living systems: Dryland ecosystems as a case study. Annu. Rev. Condens. Matter Phys. 2018, 9, 79–103. [Google Scholar]
  52. Wang, C.T.; Cao, G.M.; Wang, Q.L.; Jing, Z.C.; Ding, L.M.; Long, R.J. Changes of plant community species composition and biomass along environmental gradient in the alpine grassland of Qinghai-Tibet Plateau. Sci. China Press 2007, 37, 585–592. [Google Scholar]
  53. Guan, H.L.; Fan, J.W.; Li, Y.Z. The impact of different introduced artificial grassland species combinations on community biomass and species diversity in temperate steppe of the Qinghai-Tibetan Plateau. Acta Pratacult. Sin. 2019, 28, 192–201. [Google Scholar]
  54. Zhang, Y.J.; Zhu, J.T.; Shen, R.N.; Wang, L. Research progress on the effects of grazing on grassland ecosystem. Chin. J. Plant Ecol. 2020, 44, 553–564. [Google Scholar] [CrossRef]
  55. Zhou, W.S.; Zhang, C.T.; Zhou, Z.P.; Zhou, T. Correction of the relationship between altitude and latitude of vegetation distribution. Sci. Sin. Vitae 2021, 51, 334–345. (In Chinese) [Google Scholar] [CrossRef]
  56. Niu, Y.J.; Zhou, J.W.; Yang, S.W.; Wang, G.Z.; Liu, L.; Hua, L.M. Quantitative apportionment of slope aspect and altitude to soil moisture and temperature and plant distribution on alpine meadow. Chin. J. Appl. Ecol. 2017, 28, 1489–1497. [Google Scholar]
  57. Liu, Y.; Zhang, J.; Yang, W.Q. Responses of alpine biodiversity to climate change. Biodivers. Sci. 2009, 17, 88–96. [Google Scholar]
  58. Deng, D.Z.; He, L.; Yan, W.X.; Chen, D.C. Analysis of spatial distribution pattern of dominant populations of desertification grassland in northwest Sichuan. Acta Agrestia Sin. 2017, 25, 492–498. [Google Scholar]
Figure 1. Distribution of sampling in the Altay forest in the Altay Mountains.
Land 12 01370 g001
Figure 2. Spatial distribution pattern of above-ground biomass in Altay grasslands.
Land 12 01370 g002
Figure 3. Above-ground biomass in different parts of the Altay grassland. Different lowercase letters indicate a significant difference of each sample plot among different grassland types at the 0.05 level.
Land 12 01370 g003
Figure 4. (ad) Relationship between above-ground biomass and environmental factors.
Land 12 01370 g004
Figure 5. (ad) Spatial distribution patterns of species diversity in the grasslands of Altay.
Land 12 01370 g005
Figure 6. (ad) Species diversity indexes in different parts of the Altay grassland.
Land 12 01370 g006
Figure 7. Species diversity in relation to environmental factors.
Land 12 01370 g007
Table 1. Community characteristics of different grassland types in the Altay forest region of the Altay Mountains.
Large PlotHumansConstructive SpeciesMain Companion Species
WuxilikeAutumn pastureAndrosace umbellata (Lour.) Merr.Fragaria vesca L.
Eleusine indica (L.) Gaertn.Galium odoratum (L.) Scop.
Kobresia capillifolia (Decne.) C. B. Clarke
DadonggouFront range Piper kadsura (Choisy) OhwiEleusine indica (L.) Gaertn.
Taraxacum mongolicum Hand.-Mazz. Polygonum aviculare L.
VallySummer pastureFestuca ovina L.Potentilla chinensis Ser.
Eleusine indica (L.) Gaertn.Plantago asiatica L.
HBStock routeKobresia capillifolia (Decne.) C. B. ClarkeImperata cylindrica (L.) Beauv.
Stipa sareptana Becker Gagea nakaiana
QiaoatiRoad repairs on the sideFestuca ovina L.Sect. Ranunculoides Chen et C. M. Hu
Fragaria vesca L.Geranium wilfordii Maxim.
Table 2. Fitting equations for species diversity and environmental factors in Altay grassland.
Environmental FactorsSpecies Diversity IndexFitting Equations
AltitudeMargalefY = −2.64 × 10−10x3 + 1.48 × 10−6x2 + −0.0025x + 1.73
SimpsonY = −4.36 × 10−13x4 − 3.17 × 10−9x3 − 8.54 × 10−6x2 + 0.01x − 3.97
Shannon–WienerY = 1.01 × 10−10x3 + 6.1 × 10−7x2 + 0.002x − 0.34
AlataloY = −1.04 × 10−12x4 − 7.68 × 10−9x3 + 2.08 × 10−5 × 10−5x2 + 0.02x − 9.65
LongitudeMargalefY = 12.68x4 − 4455.51x3 + 587,328.38x2 − 3.44x + 7.56
SimpsonY = 0.9x4 − 169.48x3 + 12,032.61x2 − 379,617.37x + 4,490,153.97
Shannon–WienerY = 16.71x4 − 5866.40x3 + 772,541x2 − 4.52x + 9.92
AlataloY = 9.72x4 − 3414.63x3 + 450,027.34x2 − 2.64x + 5.79
LatitudeMargalefY = 6.65x4 − 1271.80x3 + 91,262.97.19x2 − 2,910,565.38x + 3.48
SimpsonY = 6.67x4 − 2339.19x3 + 307,869.22x2 − 1.8x + 3.95
Shannon–WienerY = 11.30x4 − 2160.71x3 + 154,949.32x2 − 4,938,453.13x + 5.9
AlataloY = 1.68x4 − 319.94x3 + 22,788.57x2 − 721,358.58x + 8,562,119.2
CoverageMargalefY = −5.83 × 10−7x4 + 1.12 × 10−4x3 + 0.0073x2 − 0.19x + 2.11
SimpsonY = −2.41 × 10−7x4 − 5.83 × 10−5x3 − 0.0049x2 + 0.16x − 1.31
Shannon–WienerY = −2.38 × 10−5x3 − 0.0038x2 + 0.19x − 1.98
AlataloY = −7.16 × 10−7x3 − 1.46 × 10−5x2 − 0.0082x + 1.09
Disclaimer/Publisher’s Note: The statements, opinions and data contained in all publications are solely those of the individual author(s) and contributor(s) and not of MDPI and/or the editor(s). MDPI and/or the editor(s) disclaim responsibility for any injury to people or property resulting from any ideas, methods, instructions or products referred to in the content.

