Article

Impact of Urbanization on Ecosystem Service Value from the Perspective of Spatio-Temporal Heterogeneity: A Case Study from the Yellow River Basin

1
College of Urban and Environmental Sciences, Northwest University, Xi’an 710127, China
2
Northwest Branch, Beijing Tsinghua Tongheng Urban Planning and Design Institute, Xi’an 710076, China
*
Author to whom correspondence should be addressed.
Land 2023, 12(7), 1301; https://doi.org/10.3390/land12071301
Submission received: 24 May 2023 / Revised: 24 June 2023 / Accepted: 26 June 2023 / Published: 28 June 2023
(This article belongs to the Special Issue Dynamics of Urbanization and Ecosystem Services Provision II)

Abstract

:
Ecosystem services are the beneficial goods and services that ecosystems provide to humans. Urbanization is an important feature of human social development. While promoting economic and social development, it also brings about land degradation, resource depletion, environmental pollution and other problems, intensifying the transformation of natural ecosystems into semi-natural and artificial ecosystems, ultimately leading to the loss of ecosystem service functions and declining value. The study of the impact of urbanization on the value of ecosystem services is of critical importance for the conservation of ecosystems and sustainable development. This study examined the spatio-temporal patterns of urbanization’s impacts on ecosystem service value in the Yellow River Basin from the perspective of spatio-temporal heterogeneity. Findings: (1) Both the ecosystem service value (ESV) and urbanization level (UL) in the Yellow River Basin were on the rise on the whole, but they were significantly spatially negatively correlated and mainly characterized by the high–low spatial clustering of “low ESV–high UL” and “high ESV–low UL”. This negative correlation was gradually weakened with the transformation of the urbanization development mode and ecological restoration projects in the Yellow River Basin. (2) The impacts of the five urbanization subsystems on the value of ecosystem services were diverse. Landscape urbanization had a negative impact on the value of ecosystem services in all regions; economic urbanization and innovation urbanization changed from having a negative to a positive impact; and demographic urbanization and social urbanization had both a positive and a negative impact. (3) To promote the coordinated development of ecological environmental protection and urbanization in the YRB, this paper proposes to change the urbanization development model, implement ecological restoration by zoning, and formulate classified development plans. This study compensates for the shortcomings of current studies that ignore the different impacts of urbanization subsystems on ecosystem service value and lack sufficient consideration of the spatio-temporal heterogeneity characteristics of urbanization and ESVs, enriches the theoretical understanding of the interrelationships between natural and human systems in basin areas, and provides a scientific basis for the rational formulation of urban planning and ecological protection policies in the region, which is of great theoretical and practical significance.

1. Introduction

Ecosystem services refer to material subsistence and services provided by ecosystems to human society [1,2]. Ecosystem service value (ESV) is the monetary value of tangible or intangible benefits that humans derive directly or indirectly from ecosystems [3] and can be quantified by models such as InVEST, ARIES, or MIMES. ESV is a reflection of the potential of ecosystems to provide material subsistence and services for people [4], and it serves as an important measure to evaluate the quality of ecosystem services and social sustainability [5]. The enhancement of human well-being and the sustainable development of the region will not be possible without the guarantee of ecosystem services [6]. However, with the rapid economic development and great social progress in recent years, the strong interference [7,8] of human activities in the ecosystem has led to the decline of many ecosystems around the world [9], blocking the improvement of living standards [10,11,12]. Unprecedented urbanization is taken as the main human activity leading to global ecosystem changes [13,14,15]. Urbanization has caused ecological and environmental problems, such as land degradation, resource depletion, and environmental pollution, due to the expansion of construction land, demographic concentration, and economic growth, thus leading to degraded ecosystem functions. For example, urban land expansion has eroded a large amount of ecological land, such as farmland, forest land, and grassland, leading to structural changes in land use [16], resulting in a dramatic decrease in the net primary productivity [17], carbon sequestration capacity [18], and hydrological regulation capacity [19] of ecosystems. In addition, urban demographic agglomeration and social industrialization have brought about a significant increase in the intensity of human activities, intensifying the consumption of natural resources such as water and minerals [20] and the massive discharge of pollutants such as exhaust gases, wastewater, and waste into the ecosystem [21]. The resulting reduction in the self-purification capacity and anti-disturbance capacity of the ecosystem has triggered a series of ecological and environmental degradation problems, such as the over-exploitation of water resources, shortages of non-renewable energy, soil and water pollution, atmospheric pollution, and climate change. In short, urbanization has intensified the transformation of natural ecosystems into semi-natural and artificial ecosystems [22], changing the structure and processes of ecosystems, leading to the loss of ecosystem services and a decrease in the value of ecosystem services. The question of how to mitigate the disturbance of ecosystem services by urbanization has emerged as a major problem that calls for an immediate solution across the region to maintain sustainable development. Therefore, the impact of urbanization on ESV is one of the major components of current research, and its analysis will help to provide a deeper understanding of the relationship between natural and human systems while laying a theoretical basis for the formulation of ecological protection and sustainable development policies.
Academia has engaged in a detailed discussion of the relationship between urbanization and ESV. Some scholars have examined the coordination of the two in space and time using Pearson correlation methods [23], gray correlation analysis (GCA) models [24], coupled coordination (CCD) models [25], telecoupling coordination degree (LTCCD) models [26], and decoupling models [27]. Moreover, urbanization’s impact on ESV and its mechanism of action have gained the most attention in the field [28,29,30]. The complex interaction between the two is mainly explored in a series of studies using ordinary least squares (OLS) models [31], panel regression models [32], geographically weighted regression (GWR) models [33], curve estimation [34], and segmented linear regression [35]. The findings are not identical and some even contradict each other. According to studies, there are both linear (e.g., positively related [36] and negatively related [37]) and non-linear (e.g., inverted U-shaped [38], N-shaped [39], and double exponential curve [40]) relationships between urbanization and ESV. Specifically, urbanization may improve ecosystem services as a result of industrial structure optimization and urban management enhancement, while resulting in the degradation of land use systems [41], biodiversity reductions [42], landscape fragmentation [43], net primary productivity (NPP) declines [44], and reduced human welfare and benefits [45] due to land expansion, demographic growth, energy consumption, and pollutant emissions [20]. In turn, ecosystem services play a supportive or inhibitory role in urbanization [46,47]. In summary, urbanization and ESV are interdependent and mutually restricted [48].
Although these studies have revealed the complex relationship between the UL and ESV [49], there are some limitations. The existing literature focuses on studies of ESV, including assessment and prediction [50], synergies and trade-offs [51], and supply–demand balance [52]. However, the evaluation of the level of urbanization is one-sided and lacks diversity; specifically, most studies examine the scale growth of urbanization in terms of demographic agglomeration [53], land expansion [54], or economic development [55] in a single dimension, such as the population, land, or economy, which hardly reflects the complexity and diversity of urbanization development in a comprehensive manner [56]. In fact, the new urbanization under the “people-oriented” concept not only pursues a high growth rate but also focuses on high-quality development. The level of urban public services, the degree of social civilization, and the quality of life of residents have been important measures of urbanization development, and scientific and technological innovation has become the core endogenous driving force for the transformation and upgrading of urban development patterns in the middle and late stages of urbanization [57]. Therefore, in addition to considering the three dimensions of population, land, and economy, efforts should be increased to evaluate social urbanization [25] and innovative urbanization [58], which would help to explain the interactions between urbanization and ecosystem services from a more integrated perspective and in a comprehensive manner. Current studies mainly deal with the overall relationship between the two systems, urbanization and ecosystem services [59], with little attention to the differences in the impact of different ULs by subsystem on ESV [60]. Therefore, this study provides a comprehensive evaluation of the UL according to demographic, landscape, economic, social, and innovative subsystems, further enriching the understanding of the connotations of new urbanization and thus providing a more comprehensive understanding of the mechanisms by which urbanization subsystems affect ESV.
Although there are studies that have addressed the spatial correlation between ESV and the UL [61,62,63], only a few have considered the uneven spatio-temporal distribution of the two [64]. ESV and the UL are found to be significantly spatially heterogeneous as a result of different natural environmental conditions and socio-economic development levels in different regions [65,66]. Moreover, the impacts of urbanization on ecosystem services are also time-variant, usually moving from negative effects of disturbance in the primary stage to positive effects of support in the advanced stage [67,68]. Regarding the spatio-temporal heterogeneity characteristics of urbanization and ESV, the geographically weighted regression (GWR) model can deal with spatial correlation and reflect the spatial heterogeneity and influence direction of different geographical locations via regression coefficients, overcoming the shortcomings of traditional regression models that lead to biased regression results due to ignoring individual and temporal differences [69]. Therefore, this study employs a GWR model to conduct a multi-stage comparative analysis based on panel data to explore the spatio-temporal dynamics of the mechanism of urbanization’s impact on ESV.
It should also be emphasized that the interaction of the two spatio-temporally heterogeneous processes adds to their complexity [70], and it is difficult to learn from each of their findings in different regions [71], necessitating spatio-temporal heterogeneity studies of ecosystem service value and urbanization in specific regions. Most of the current studies place their focus on areas with advanced urbanization, such as urban agglomerations and metropolitan areas [72,73,74]. In recent years, some scholars have also shifted their attention to basin-scale studies [39]. From the perspective of spatio-temporal heterogeneity, river basins are a more appropriate and more deserving research scale, since an ecosystem is a complex open system with a strong external impact, and its ecological processes, material cycles, and energy transfers are not subject to administrative boundaries. The economic and social systems are closely related to the local natural background, historical accumulation, and development mode and have unique local identities. As a multi-level network system of “nature–economy–society”, river basins have significant heterogeneity and local characteristics of the ecological environment and socio-economy, and they offer a comprehensive reflection of the main qualities of these two systems. Therefore, the study of river basins is important in guiding ecological protection and high-quality development in basin areas.
As a typical region where rapid urbanization and integrated ecosystem management are taking place simultaneously, the YRB in China plays a major role in national ecological security and the new urbanization strategy [75]. With the successive implementation of ecological restoration projects such as the Sanjiangyuan Ecological Protection Project, the Sanbei Protection Forest Project, and the Return of Cropland to Forests and Grasses Project in the past three decades, the YRB has achieved breakthroughs in ecosystem restoration and environmental pollution management [76]. Nevertheless, the YRB still faces serious problems, such as a fragile ecological environment, a degraded ecosystem, regional economic incoherence, and prominent human–land conflict. With the continued acceleration of urbanization in the YRB, the choice of its future urbanization path will be one of the determinants of the prospects for regional ecological security and sustainable growth.
The following objectives are the foci of this paper: (1) to analyze the spatio-temporal variability of ESV in the YRB from 1990 to 2020 by evaluating ESV and the UL using the equivalent factor method (EFM); (2) to construct a UL evaluation indicator system based on demographic, landscape, economic, social, and innovative subsystems to analyze the spatio-temporal change characteristics of the UL from 2000 to 2020; (3) to verify the spatial interaction of ESV with the UL using the bivariate SPAC model; (4) to explore the mechanisms and spatio-temporal dynamics of urbanization subsystems’ impacts on ESV and the UL using a GWR model. This study addresses the shortcomings of current studies, such as the lack of diversity in the evaluation dimensions of ULs, the neglect of different impacts of urbanization subsystems on ecosystem service value, and insufficient consideration of the spatio-temporal heterogeneity characteristics of urbanization and ESV. From the perspective of heterogeneity, it reveals the spatio-temporal variation patterns of the impacts of urbanization on ESV, proposes targeted policy recommendations for the coordinated development of ecological environmental protection and urbanization in the YRB, and provides a reference for the sustainable development of similar basin areas.

2. Materials and Methods

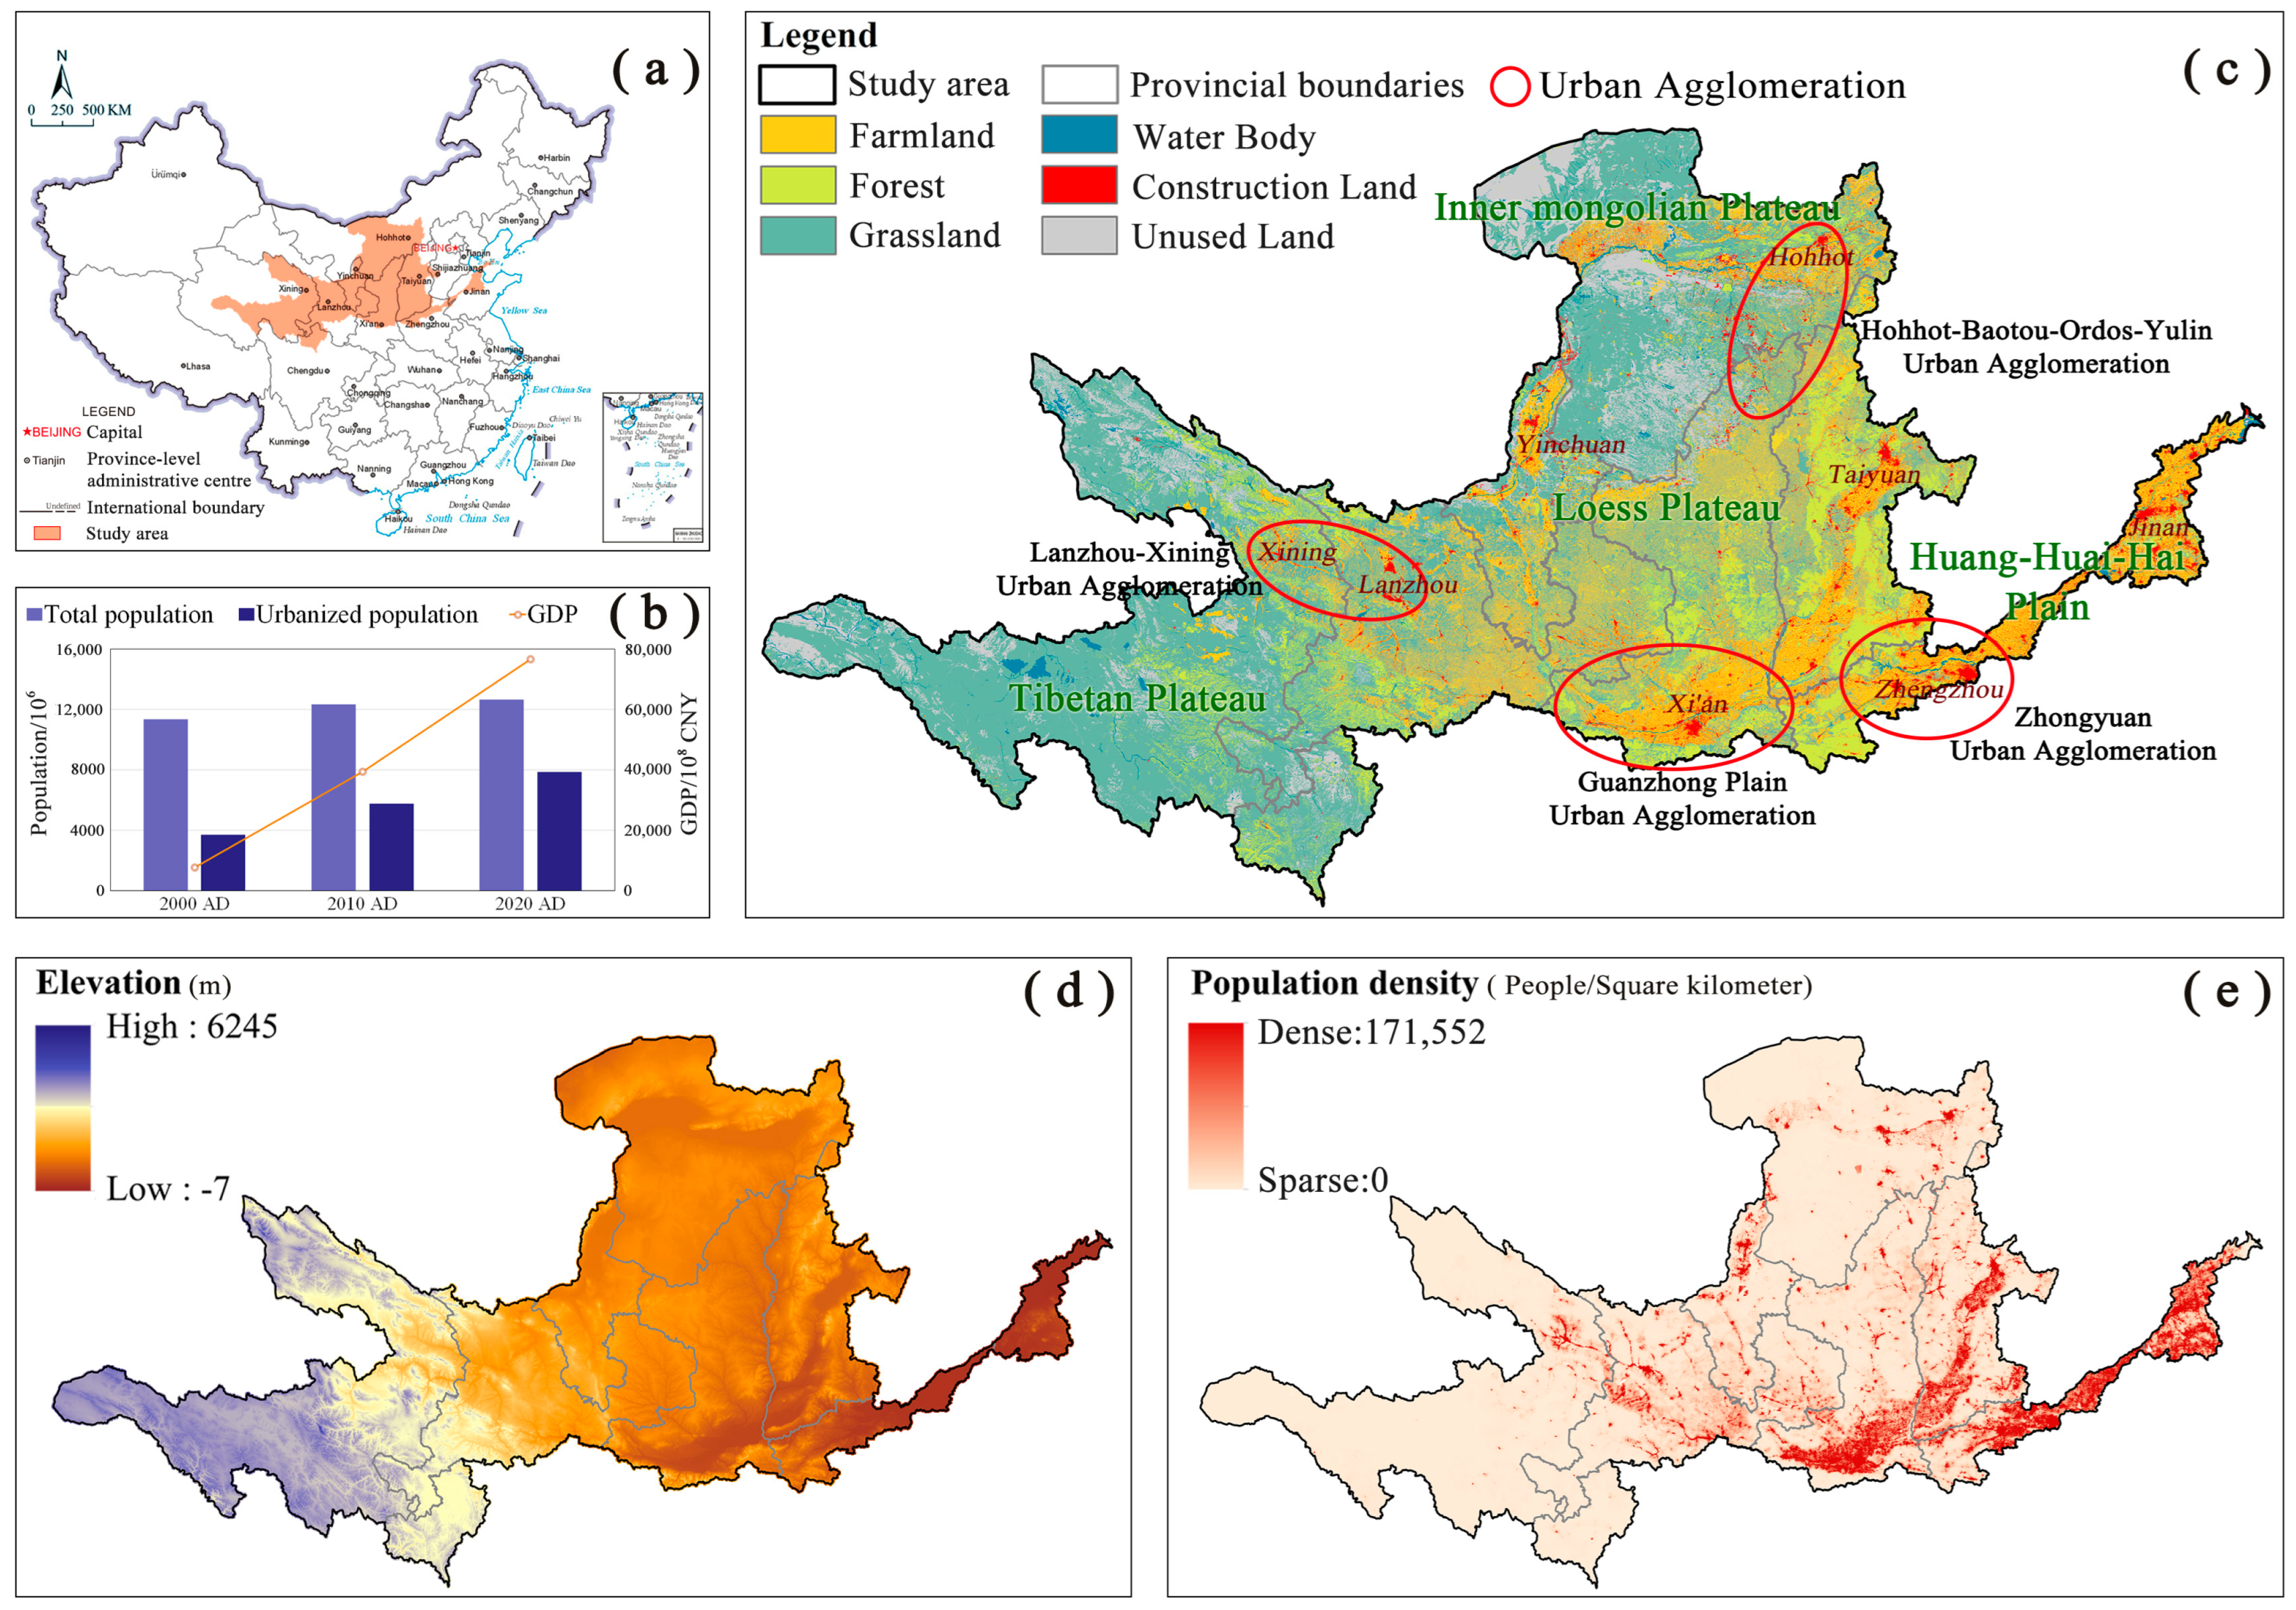
2.1. Research Area: Yellow River Basin, China

The Yellow River Basin (32°10′ N~41°50′ N, 95°53′ E~119°05′ E) lies in Northern China, connected with the four major geomorphic units of the Qinghai–Tibet Plateau, Inner Mongolia Plateau, Loess Plateau, and Huanghuaihai Plain, and is one of the most important ecological barriers [77] and providers of ecosystem services [78] in China, covering a total area of approximately 1.7 × 10⁶ ha, with 82 national nature reserves (Figure 1). The land in the basin is dominated by grassland, farmland, and forest, accounting for 51% (4.8 × 10⁷ ha), 22% (2.1 × 10⁷ ha), and 12% (1.2 × 10⁷ ha) of the total, respectively. The terrain in the basin is high in the west and low in the east, with a total drop of 4448 m and significant differences in climatic conditions, average annual rainfall of 300–600 mm, an average annual temperature of −4–14 °C, and average annual runoff of 5.8 × 10¹⁰ m3. The basin is rich in biological resources, with over 4000 plant species, over 400 bird species, and over 150 fish species. The vegetation is affected by the horizontal zonality and monsoon, and from east to west, it consists of crops, broad-leaved forests, coniferous forests, grassland, and sparse shrub–steppe. The YRB is the core economic zone and key urbanization area in China, spanning three economic zones in the east, middle, and west of China and containing four national urban agglomerations (Guanzhong Plain, Zhongyuan, Hohhot–Baotou–Ordos–Yulin, and Lanzhou–Xining). From 2000 to 2020, the YRB enjoyed rapid socio-economic development, with the GDP growing from 7.94 × 10¹¹ CNY to 7.65 × 10¹² CNY, the urban population growing from 3.75 × 10⁷ to 7.86 × 10⁷, and the urban population rising from 33% to 62% in proportion.
The rapid socioeconomic development and urbanization have placed tremendous pressure on the ecological environment. Under the influence of long-term high-intensity human activities and natural disasters, the ecological environment of the YRB has become sensitive and fragile, leading to the overall and systematic degradation of the ecosystem [76], such as the decline of the water conservation function in the upper reaches and the degradation of natural grassland on a large scale of up to 60–90%; serious soil erosion and desertification in the middle reaches [9], with soil erosion on the Loess Plateau reaching 2.08 × 10⁷ ha; and siltation, the widening of river channels, and the elevation of riverbeds in the lower reaches, with shrinkage of 52.8% in the natural wetlands in the delta of the estuary into the sea. In the past three decades, the LUCC in the basin has changed significantly, with an increase of 1.3 × 10⁶ ha in construction land, up by 72.84%, including 1.1 × 10⁶ ha coming from farmland, indicating that construction land continues to encroach on farmland. To address the severe challenges of ecological protection, China has elevated the ecological protection and high-quality development of the YRB to a major national development strategy and has implemented ecological restoration projects such as natural forest protection, the construction of the Sanbei protection forests, and the return of cropland to forests and grassland. It has converted 2.7 × 10⁶ ha of unused land to grassland, 1.6 × 10⁶ ha of cropland to grassland, and 1.5 × 10⁶ ha of grassland to cropland within thirty years (Figure 2), which has slowed down the ecosystem’s degradation in the YRB to some extent. This study is based on county-level administrative divisions as research units, and the total study area is determined to be 9.45 × 10⁵ km2, involving a total of 361 county-level administrative units in nine provinces.

2.2. Research Methods

2.2.1. Evaluation of Ecosystem Service Value

In this study, we introduce the Equivalent Factor Method (EFM) proposed by Costanza et al. [1] to evaluate the ESV in the YRB. According to the “Table of Ecological Service Value Equivalence per Unit Area of Chinese Ecosystems”, revised by Xie et al. [79], and in view of the heterogeneity, complexity, and dynamics of ecosystem service value [80], as well as the actual grain production capacity, the ESV coefficient per unit area is corrected by the grain yield correction method (Table 1), with wheat, cotton, and rapeseed as the main grain crop species. The equation is as follows:
V C k f = 1 7 E C k f i = 1 n m i p i q i M
where V C k f is the corrected ESV coefficient corresponding to the f -th ecosystem service of land use type k in the YRB—no construction land is included; E C k f is the value equivalent corresponding to the f -th ecosystem service of the land use type k in the “Table of Ecological Service Value Equivalence per Unit Area of Chinese Ecosystems”, revised by Xie et al.; m i is the total sown area of Class i grain crops; p i is the average price of Class i grain crops; q i is the average yield per unit area of Class i grain crops; M is the total sown area of all grain crops; n is the total number of the main grain crop series; 1/7 refers to a one-seventh share of the economic value of an ecosystem service value equivalent factor in the average market value of food production [81].
The value of the ecosystem services for each county in the YRB is calculated using the following equation:
E S V = f = 1 v A k V C k f
where E S V is the value of ecosystem services; A k is the area of land use type k in the county; V C k f is the ESV coefficient corresponding to the f -th ecosystem service of land use type k in the YRB after correction; v is the number of types of ecosystem services.

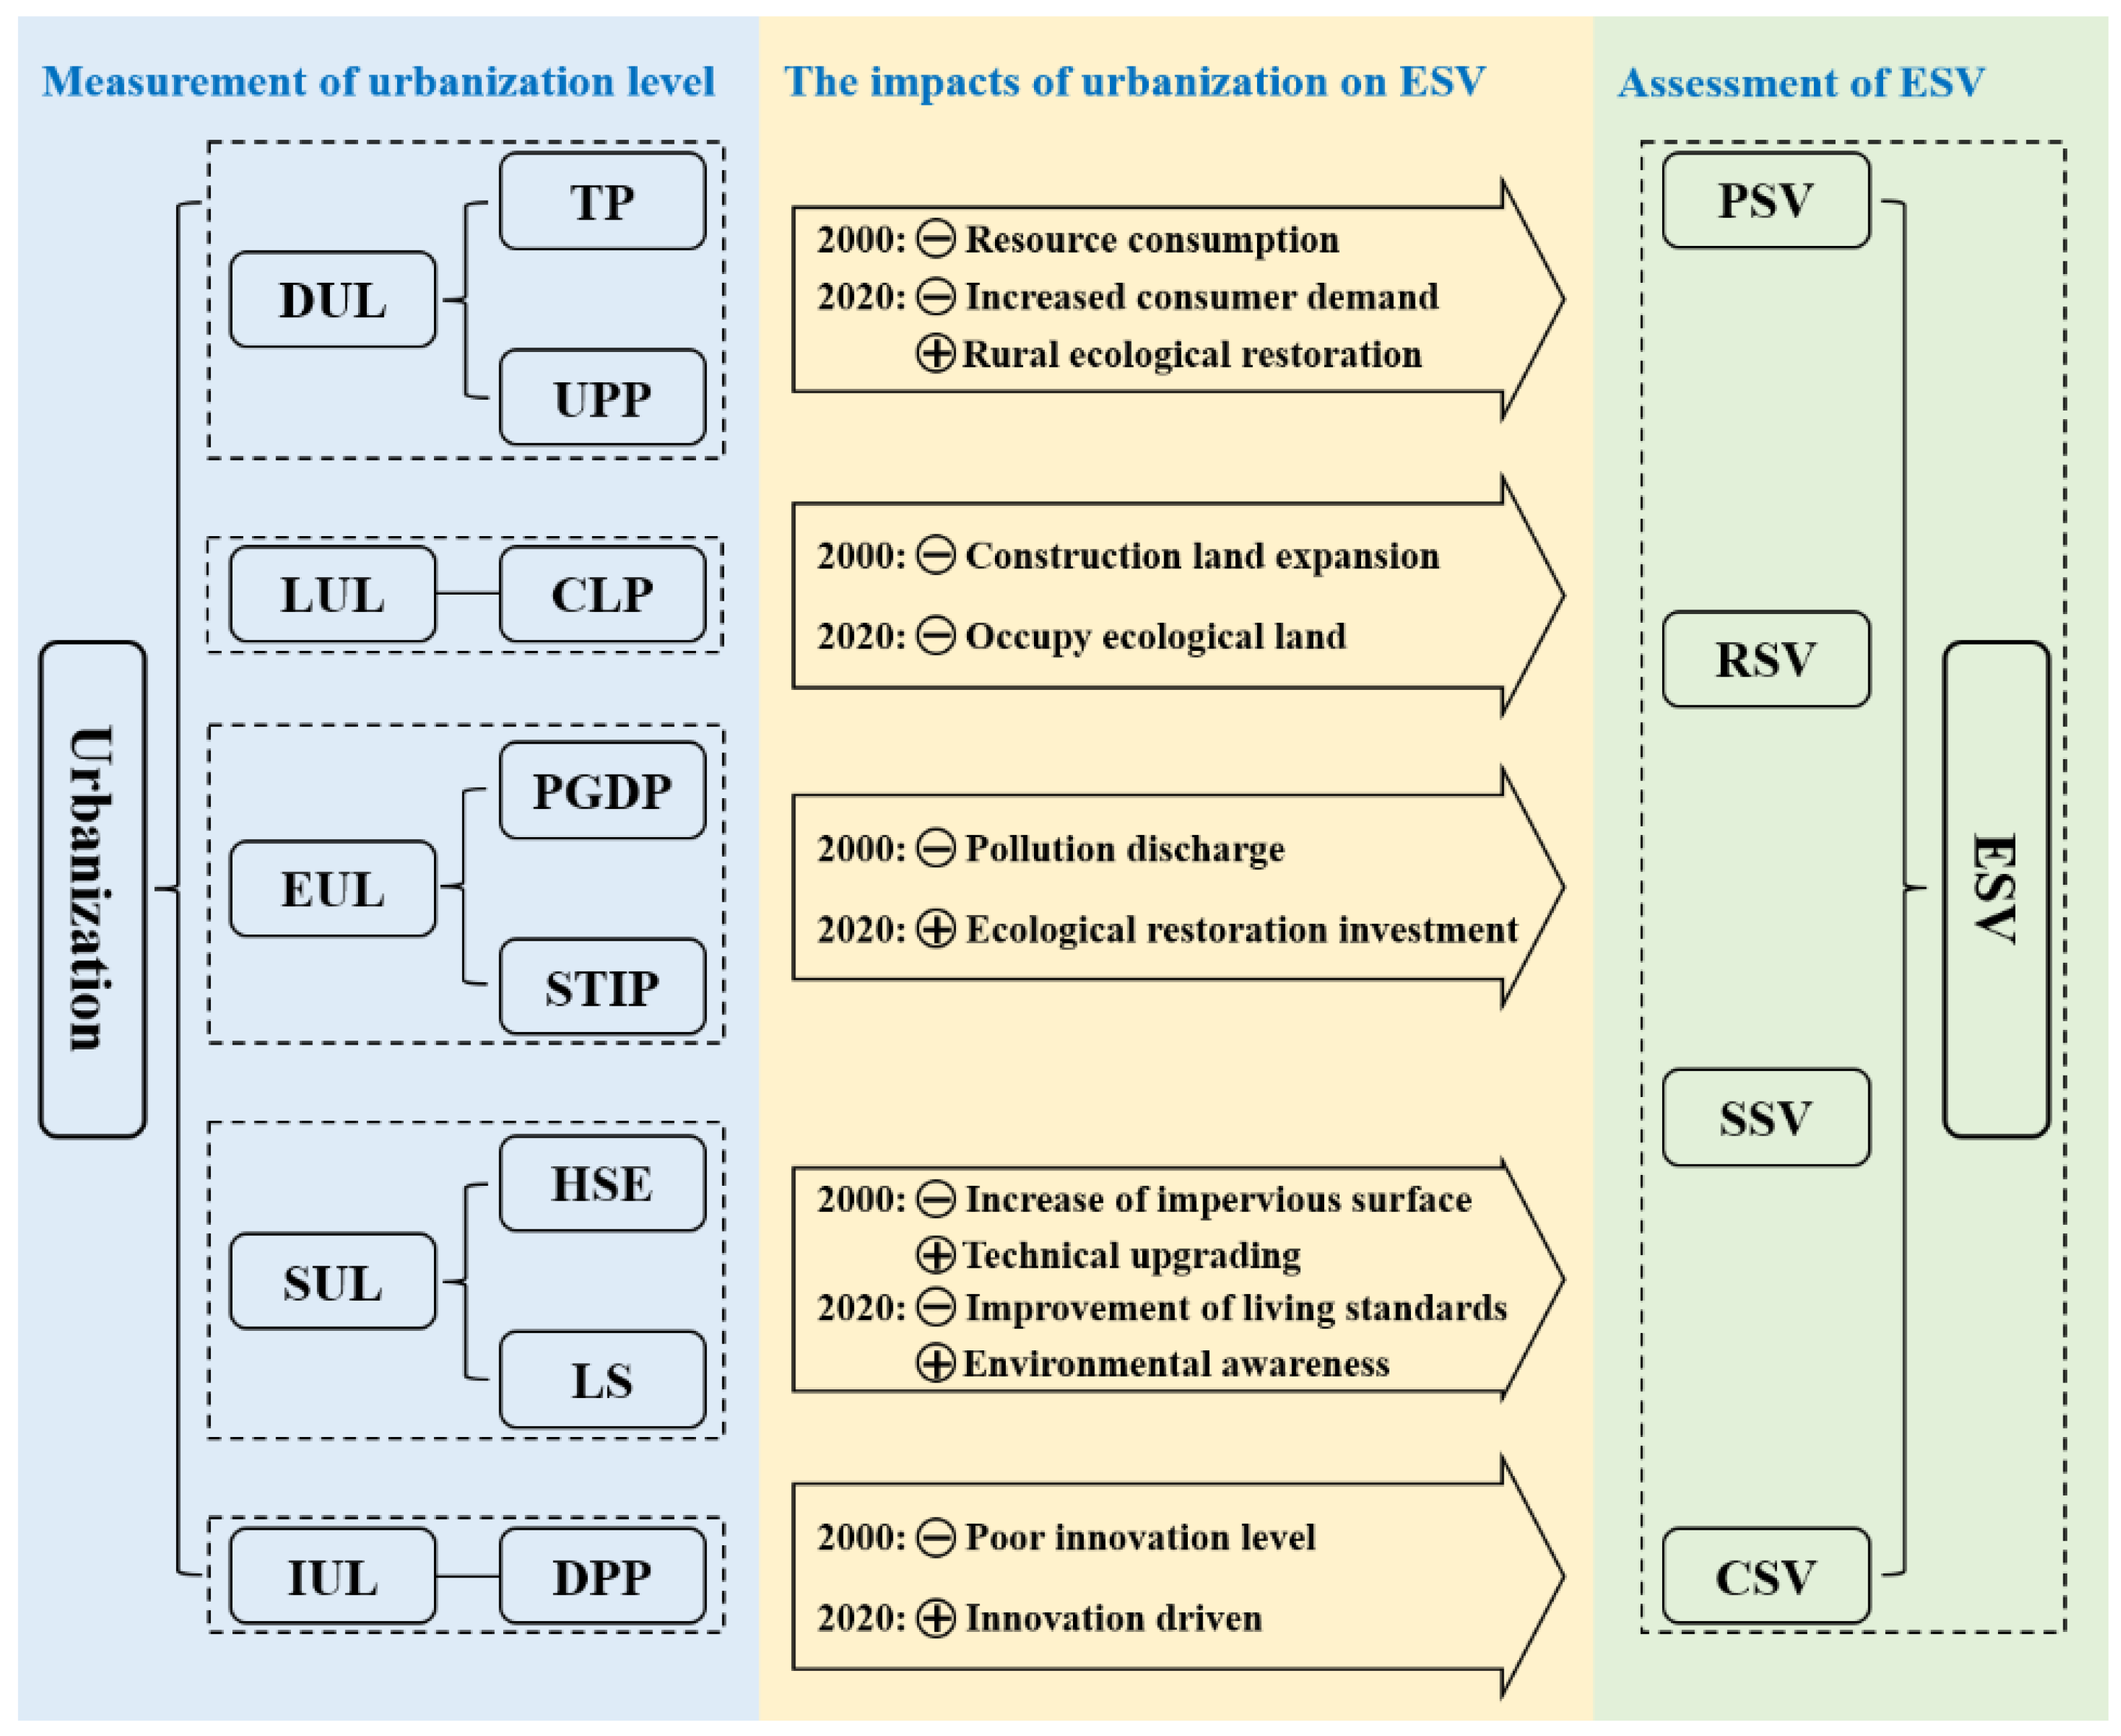
2.2.2. Assessment of Urbanization Level

Urbanization is an interrelated and dynamic process of demographic, landscape, economic, and social subsystems [82,83], and deviation from any one subsystem will reduce the comprehensive UL [84]. Science and technology innovation has provided technical support and guidance for urbanization development in recent years, and it has come to be a major driver of high-quality urbanization [85]. This study further expands the connotations of urbanization according to the characteristics of county urbanization from the dimensions of the five subsystems, and we select eight indicators to comprehensively measure the UL in a scientific, objective, and comprehensive manner with consideration of data availability [86] (Table 2). Demographic growth and agglomeration are the core elements of urbanization, and the demographic urbanization level (DUL) is measured by the total population (TP) and the proportion of the urban population in the total population (UPP) [24]; the expansion of construction land is the spatial expression of urbanization, and the landscape urbanization level (LUL) is measured by the proportion of construction land in the total land area (CLP) [87]; economic development is the driving engine of urbanization, and the economic urbanization level (EUL) is measured by the GDP per capita (PGDP) and the proportion of secondary and tertiary industries in the GDP (STIP); the improvement of people’s living standards is the ultimate goal of urbanization, and the social urbanization level (SUL) is measured by the number of people with a high school education and above (HSE) and the per capita living space (LS); scientific and technological innovation is the endogenous driving force of urbanization, and the innovative urbanization level (IUL) is measured by the number of domestic patent applications authorized (DPP) [88].
In this study, the indices of the urbanization level (UL) and urbanization subsystem level (DUL, LUL, EUL, SUL, IUL) are calculated for each county in each year in the YRB by the entropy method [25,89].

2.2.3. Bivariate Spatial Autocorrelation Model

This study uses the bivariate SPAC model to examine the spatial interaction between the ESV and UL in the YRB. The global bivariate Moran’s I is used to examine the comprehensive association degree between the ESV and UL in the study area and its significance [90], by the following equation:
I = n i = 1 n j = 1 n W i j × i = 1 n j = 1 n W i j x i x ¯ x j x ¯ i = 1 n x i x ¯ 2
where x i and x j are observed values; w i j is the spatial weight matrix between spatial units i and j .
The local bivariate Moran’s I is used to identify the possible spatial association patterns at different spatial locations to acquire, by the following equation,
I i = Z i j = 1 n w i j Z j
where Z i and Z j are the normalized values of the variance for the observed ESV and UL in spatial units i and j, respectively.

2.2.4. Geographically Weighted Regression Model (GWR)

The parameter estimation of the traditional linear regression model is performed by ordinary least squares (OLS), but it only permits global estimates of the parameters. In contrast, the theory of spatial economics assumes that almost all spatial phenomena are spatially dependent or spatially autocorrelated, and the assumption of the independence of residual terms in traditional regression models (OLS models) cannot be satisfied under this theory [65]. By incorporating the spatial location into the model and taking into account the influence of different spatial location indicators on the regression results, the geographically weighted regression (GWR) model can fully demonstrate the non-smoothness of the interaction relationship between the independent and dependent variables in different spatial geographic locations, and the results are more realistic, which can effectively address the problem that traditional regression models cannot reveal the spatial heterogeneity of regression coefficients [91]. Therefore, the GWR model [54] is used in this study to explore the spatial distribution of the impact of urbanization on the value of ecosystem services. The equation is as follows:
y i = a 0 u i , v i + j = 1 k b j u i , v i x i j + c i
where b j u i , v i is the variable parameter of the j-th explanatory variable x i j of the i-th county.

2.3. Data Source

The data required to calculate the ESV and UL in the study include vector ranges, land use information, socioeconomic statistics, and other relevant indicators for each county in the YRB. The sources and descriptions of the data are shown in Table 3. For a small number of missing data due to incomplete statistics, the average growth rate of the last three years was used to make projections or supplementation was achieved by interpolating the plural of the indicator according to neighboring counties.

3. Results

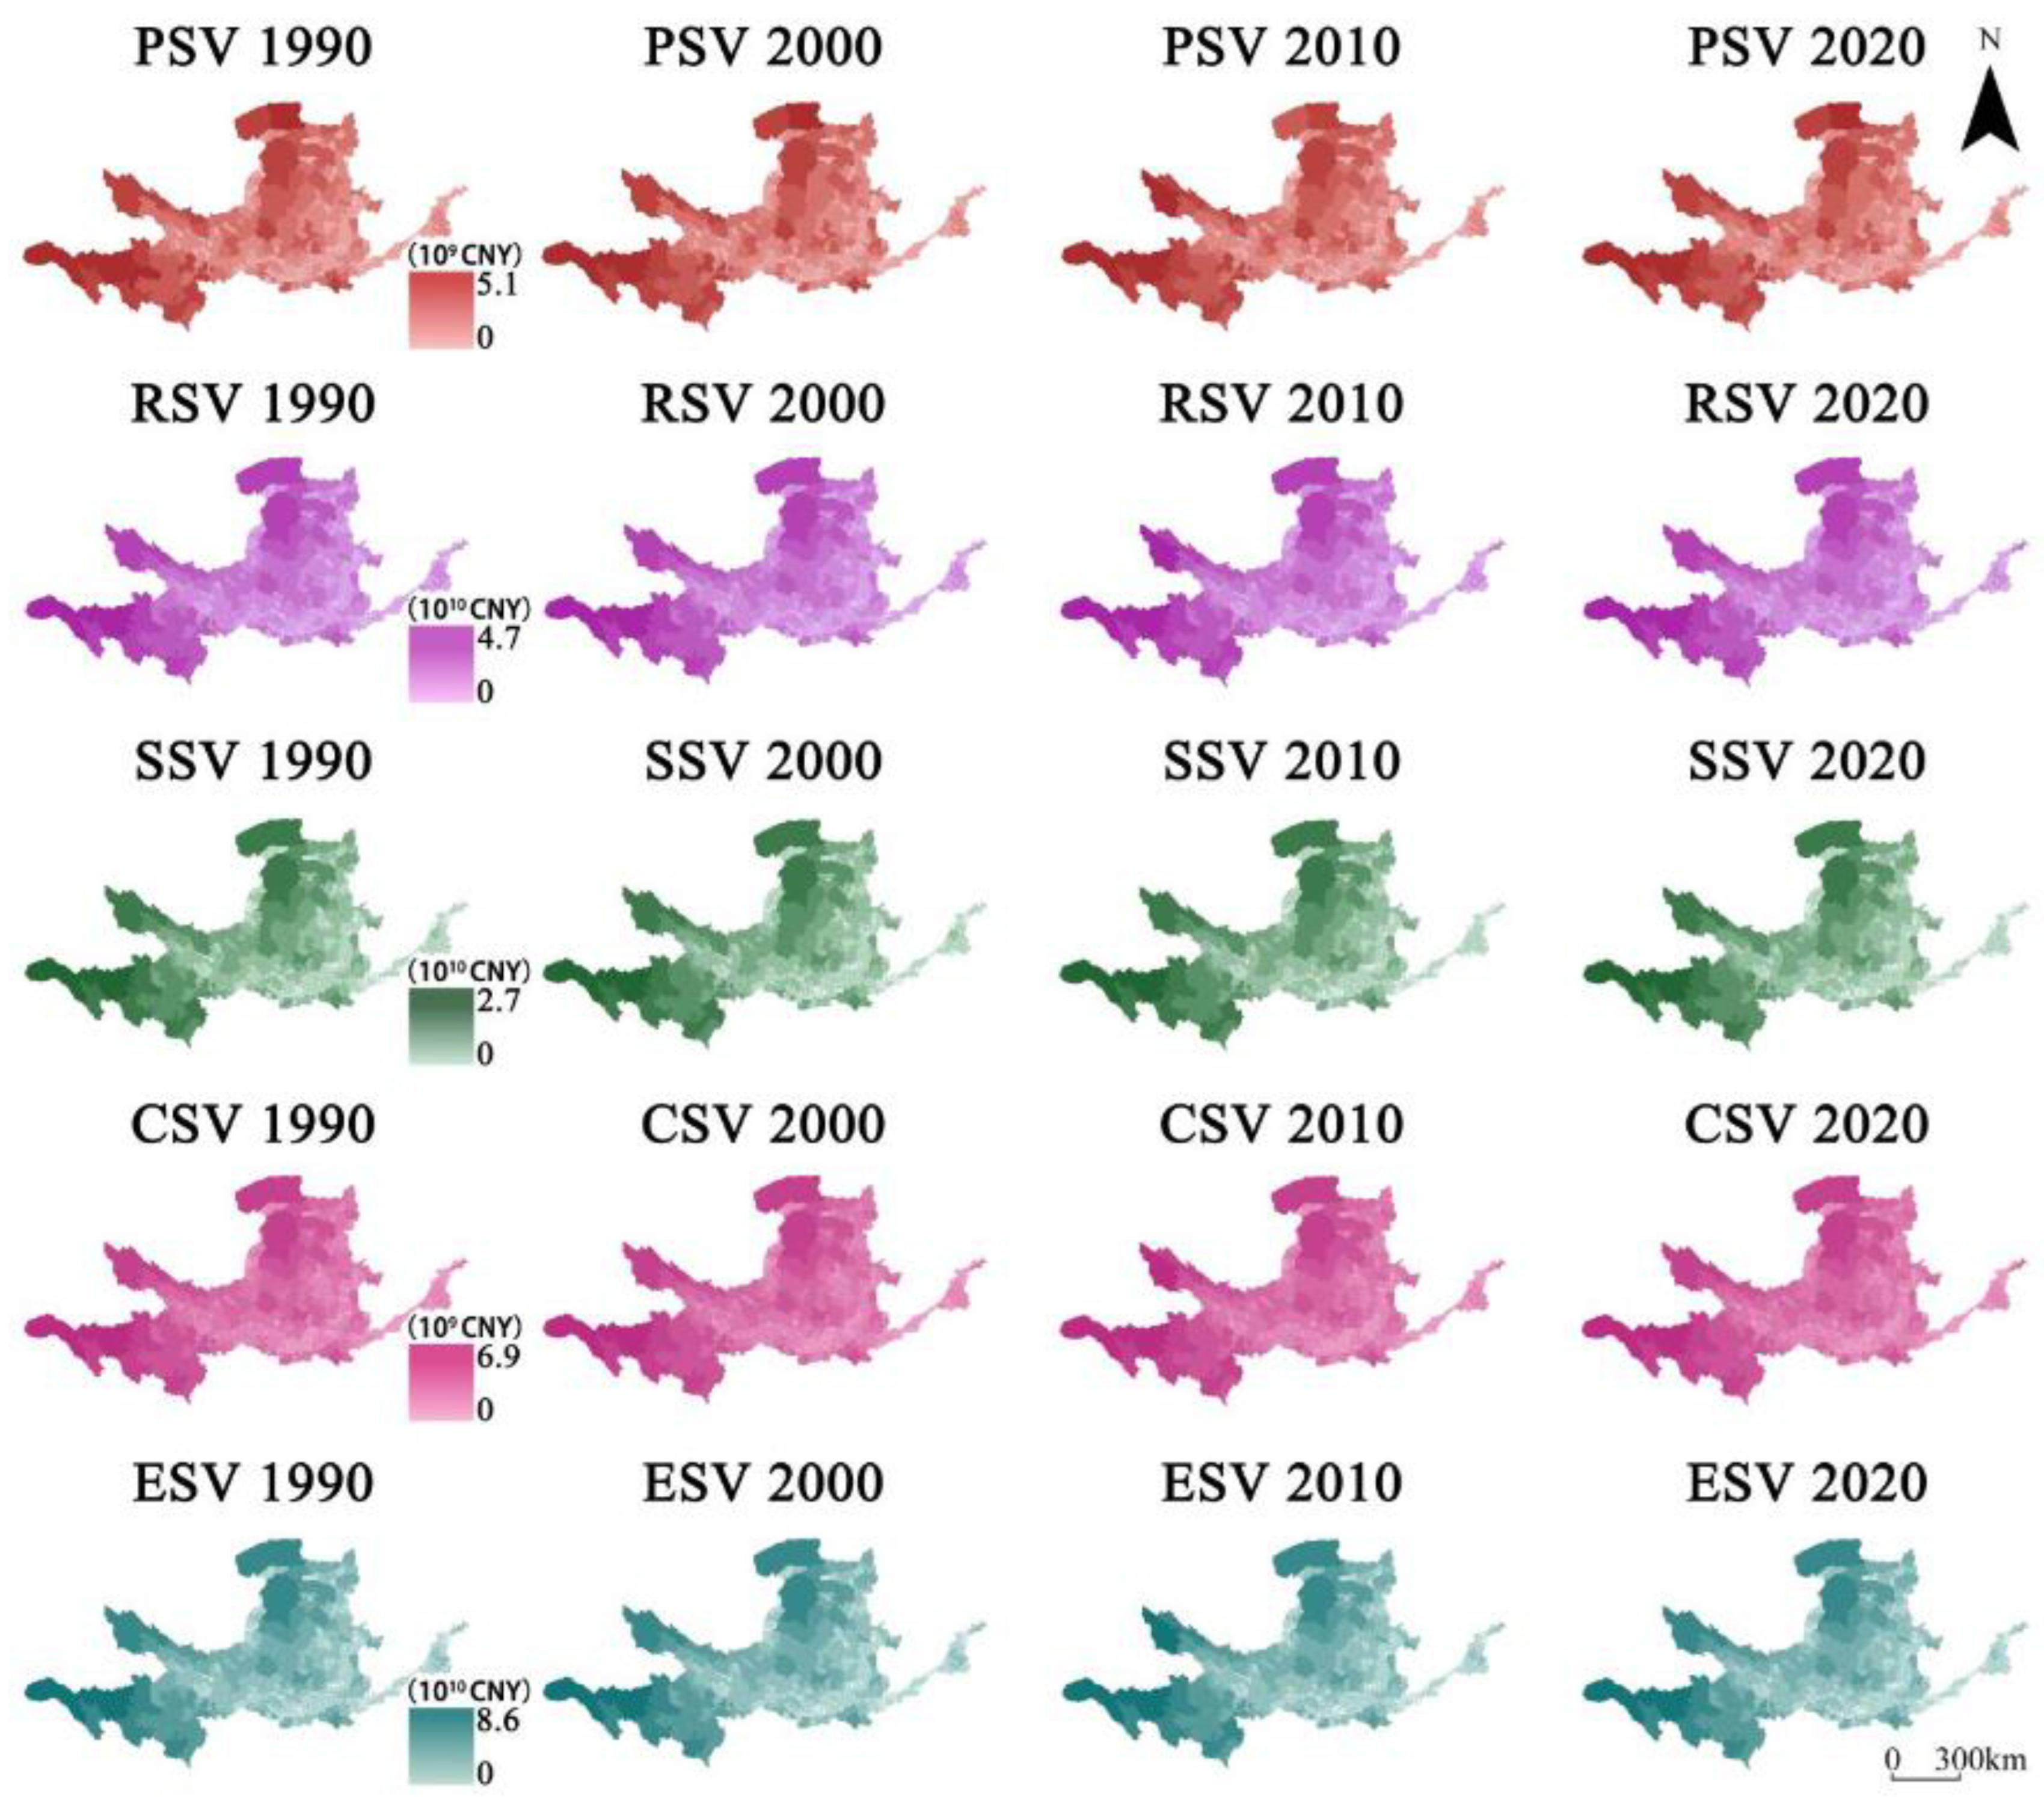
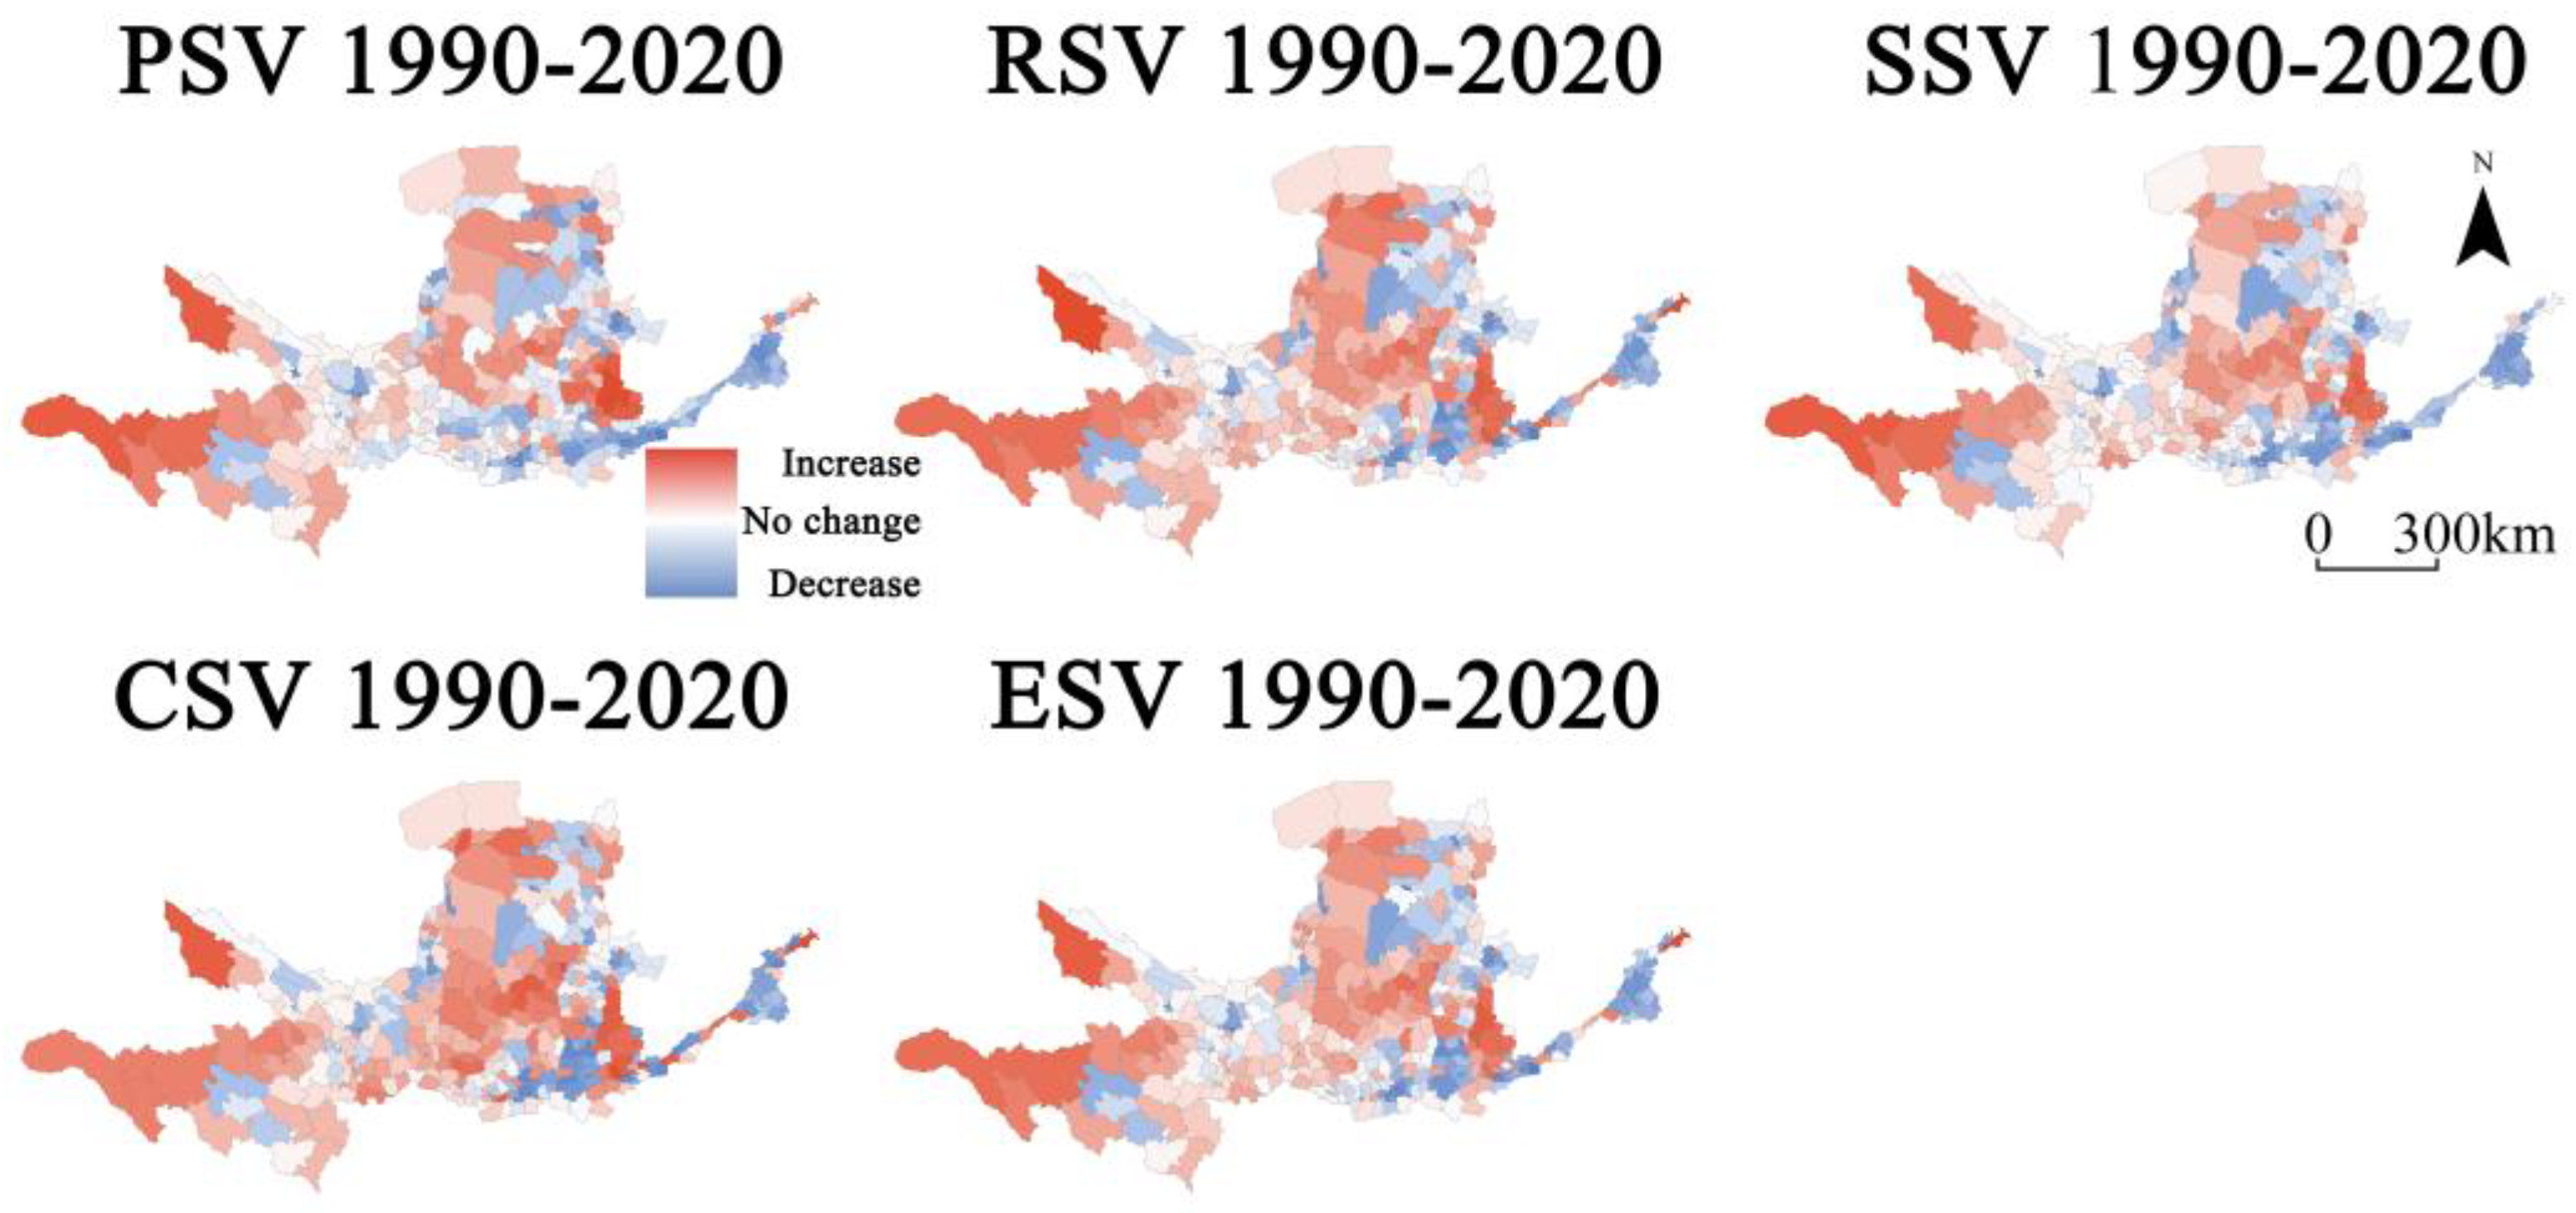
3.1. Spatio-Temporal Variation Characteristics of ESV

The ESV in the YRB enjoyed a steady rise between 1990 and 2020, with a growth rate of 2.87% to 6.7 × 10¹⁰ CNY (Table A1). The achievement was mainly attributed to ecological restoration projects such as grass planting to control desert and returning cultivated land to forests, which effectively increased the area of forests, grassland, and other ecological land. The proportion of each ESV type remained relatively stable, dominated by RSV (52%) and SSV (32%) and supplemented by PSV (9%) and CSV (7%). In terms of change trends, RSV and CSV showed sustained and rapid growth, increasing by 3.47% (4.2 × 10¹⁰ CNY) and 3.62% (5.8 × 10⁹ CNY), respectively, while PSV and SSV showed fluctuations with an increase and then a decrease, increasing by 2.33% (5.1 × 10⁹ CNY) and 2.02% (1.5 × 10¹⁰ CNY) from 1990 to 2010 and decreasing by 0.46% (1.0 × 10⁹ CNY) and 0.03‰ (2.4 × 10⁷ CNY) from 2010 to 2020, respectively.
The spatial distribution of the ESV in the YRB showed obvious spatial heterogeneity, but the overall spatial structure remained stable, and the ESV in the northwestern plateau was much higher than that in the southeastern plain region (Figure 3). Specifically, the high-ESV regions were mainly scattered in the plateau areas, such as the southwest of the Inner Mongolia Autonomous Region and the southeast of Qinghai Province in the upper reaches, while the low-value regions were mainly in the plain areas, such as the Guanzhong Plain, Fen River Plain, and Huanghuaihai Plain, in addition to the hilly and gully areas and windy beach areas of the Loess Plateau. RSV, SSV, and CSV for the ESV types were largely identical to the ESV in spatial distribution, whereas PSV showed a decentralized network distribution because of its role in providing materials or energy directly to humans. Changes in ESV by county showed the coexistence of improvement (162 counties) and deterioration (198 counties) (Figure A1), resulting in an overall relatively stable ESV in the YRB. The counties with larger growth and impairment rates were concentrated in the high- and low-ESV areas, respectively, showing a spatial distribution pattern of “high-value area–high growth and low-value area–high impairment”, which further strengthened the spatial heterogeneity of the ESV distribution in the YRB.

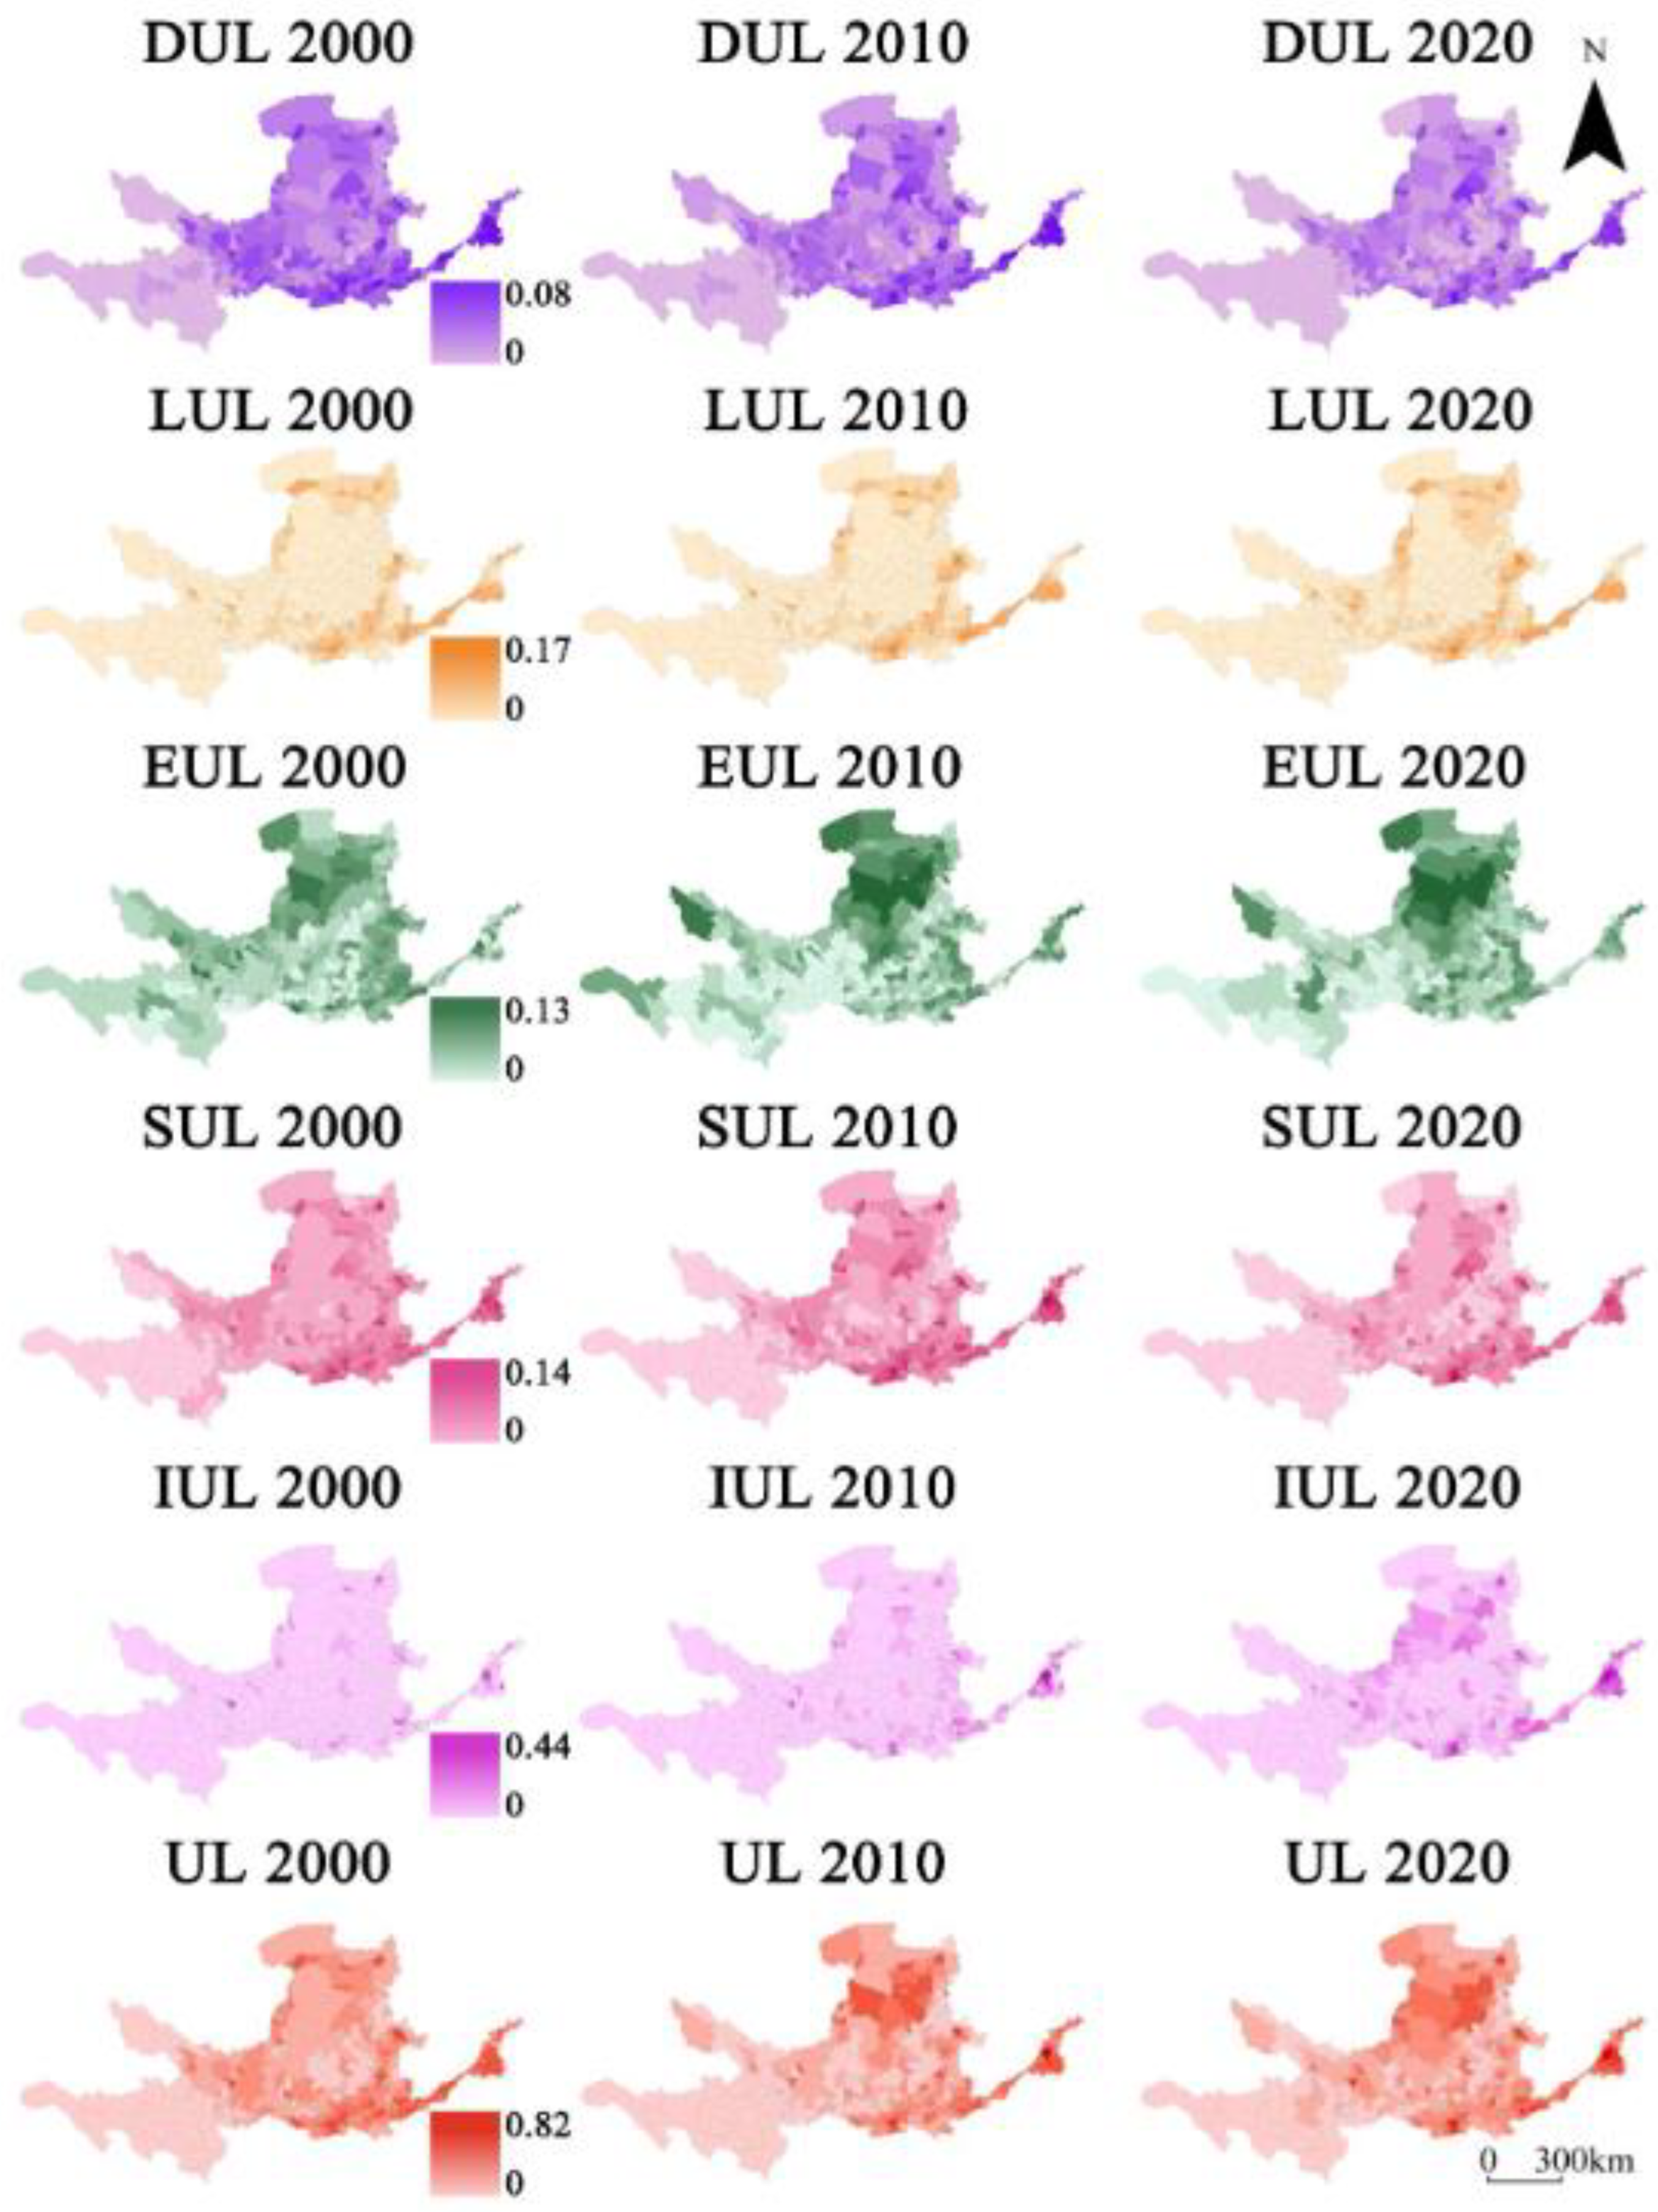
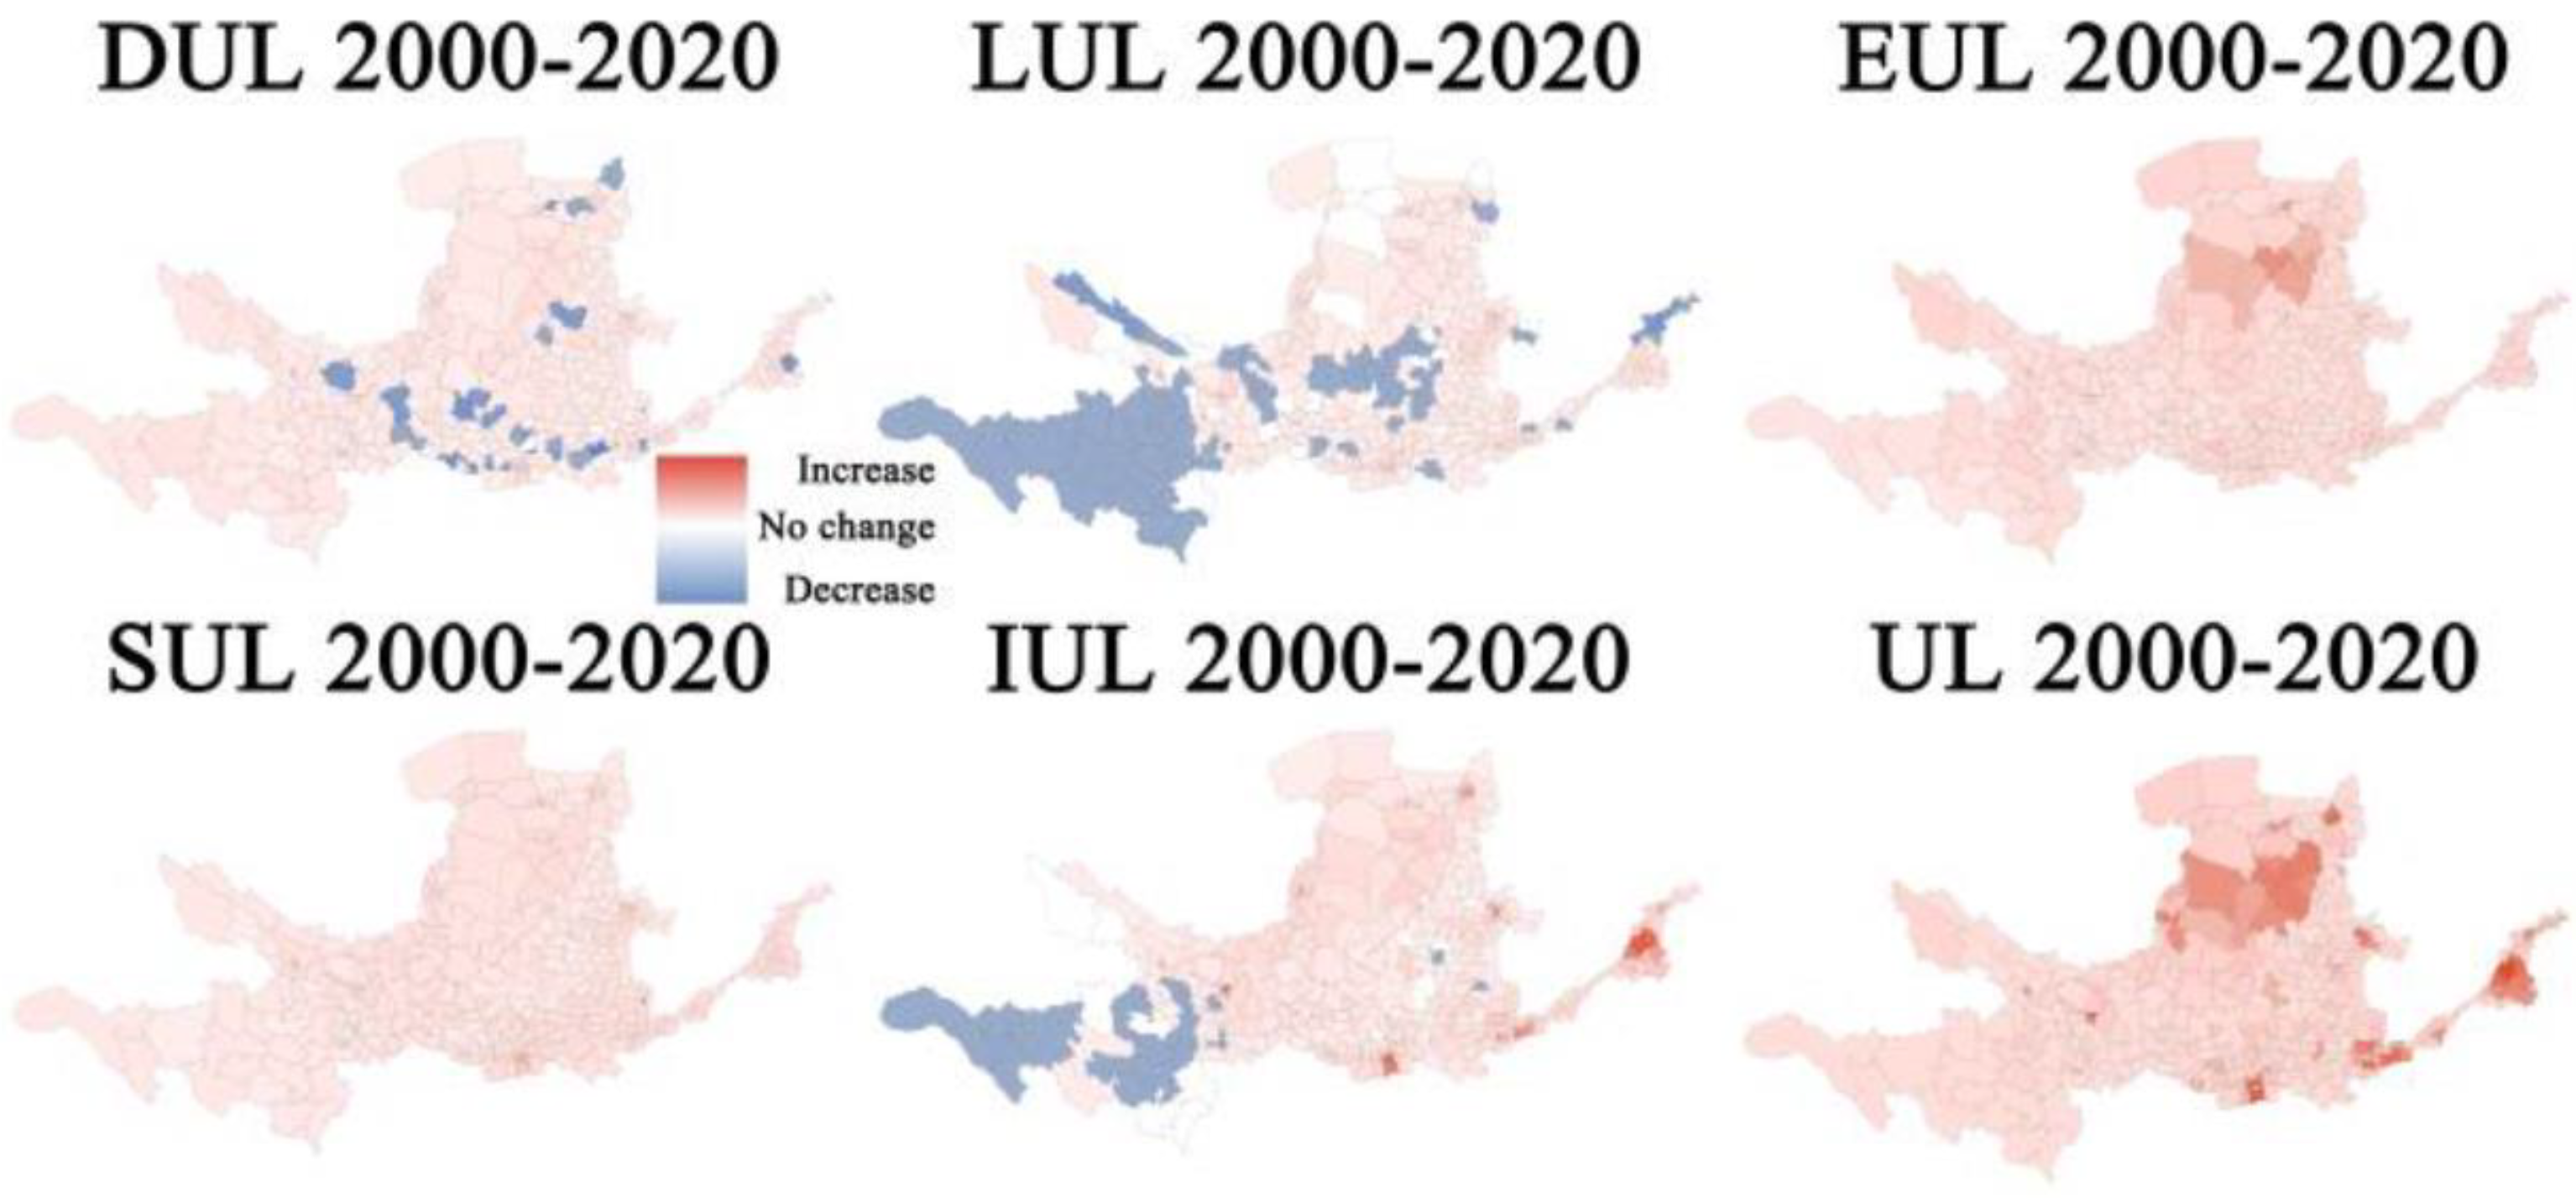
3.2. Spatio-Temporal Variation Characteristics of UL

Urbanization has had a profound impact on China’s economic development, social change, and environmental protection since 2000, when the country proposed the strategic goal of accelerating urbanization. Given the lack of reliable socioeconomic statistics before 1990, this study focuses on the evaluation of the UL in the YRB from 2000 to 2020. The result shows a significant increase in the UL in all counties, with the average index growing by 137.4% to 0.0460–0.1092 (Table A2) and clear spatial heterogeneity in the UL, with the middle and lower reaches being much more urbanized than the upper reaches (Figure 4). It also shows that regions with a high UL featured spatial agglomeration, and a “multi-center grouped” spatial pattern began to take shape around Xi’an, Zhengzhou, Jinan, Taiyuan, Hohhot, and other central cities, with the “Xi’an–Zhengzhou–Jinan” belt of contiguous urbanized areas already emerging on some scale. In general, the UL of the urban agglomeration showed the spatial pattern of a “strong center with a weak periphery” within each group.
The changes in the average index of the five urbanization subsystems showed that DUL and SUL maintained a steady growth trend (Figure A2), increasing by 0.0046 and 0.0206, respectively; LUL grew overall, but at a slower rate, increasing by 0.0038 in the first decade and only 0.0021 in the second; EUL and IUL showed rapid growth, with the average EUL index of 0.0304 in 2020, 5.15 times that of 2000 (0.0059), and the IUL index rose from a low level of 0.005 to 0.0231. In terms of spatial patterns, the indices at the level of the five urbanization subsystems maintained strong consistency with those at the level of integrated urbanization, i.e., they showed both a gradient pattern of a gradual increase from west to east and a polycentric pattern around the central city. From the change in the UL of each county, the integrated urbanization and five subsystems showed growth, but there was also a phenomenon of “high level–fast growth and low level–slow growth”.

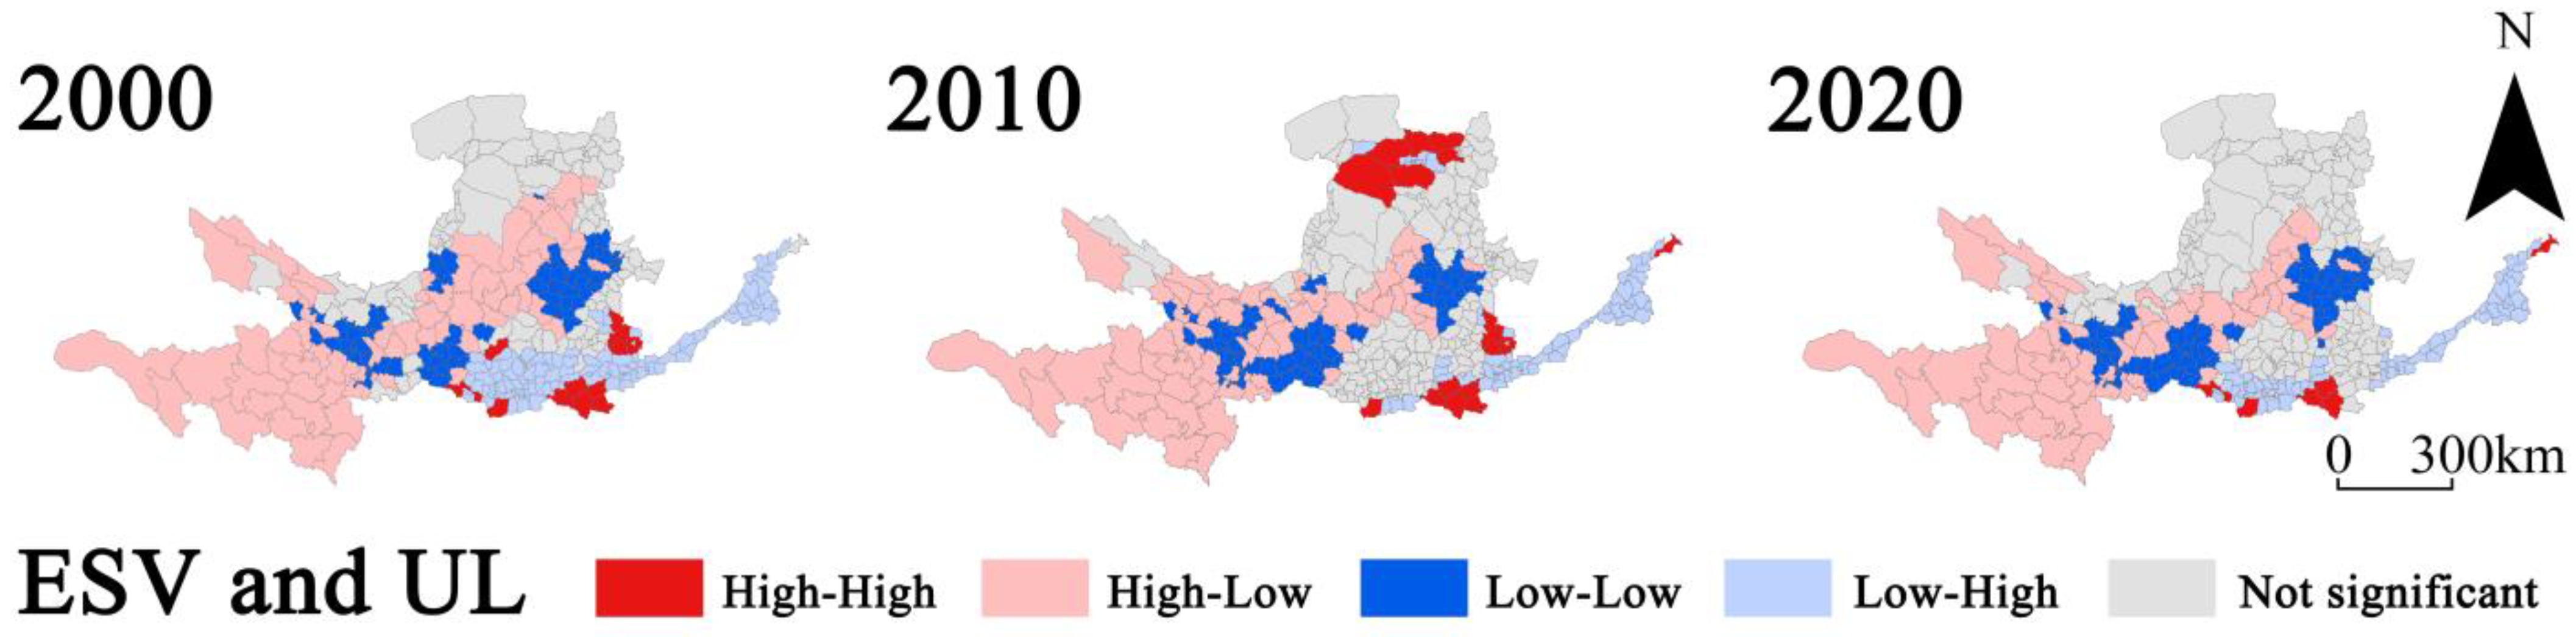
3.3. The Spatial Correlation between ESV and UL

The global Moran’s I of the bivariate SPAC model was −0.19, −0.17, and −0.15 in 2000, 2010, and 2020, respectively, suggesting a significant negative spatial correlation of ESV with the UL (p = 0.001), but with weakening strength. A bivariate, locally spatially autocorrelated LISA aggregation plot (Figure 5) based on the Z-test (p = 0.05) showed that the main spatial clustering patterns in the YRB were dominated by low–high (low ESV and high UL) and high–low (high ESV and low UL) types. Specifically, the low–high types were mostly scattered in densely inhabited and economically advanced areas such as the Huanghuaihai Plain and the Guanzhong Plain, where high-speed demographic concentration and rapid land expansion led to the encroachment and destruction of ecosystems. The high–low types were mainly in the middle and upper reaches, such as the Qinghai–Tibet Plateau and the Loess Plateau, where the UL was lagging behind, although they were rich in natural resources. The low–low types (low ESV and low UL) were clustered in the hilly and ravine areas, the wind–sand and grassland areas, and the Gobi Desert areas of the Loess Plateau, where there were constraints from natural conditions such as water scarcity and ecological fragility. Moreover, a few high–high types (high ESV and high UL) were found in the Yellow River Delta and the northern foot of the Qinling Mountains, showing the coordinated development of ecosystem conservation and urbanization.

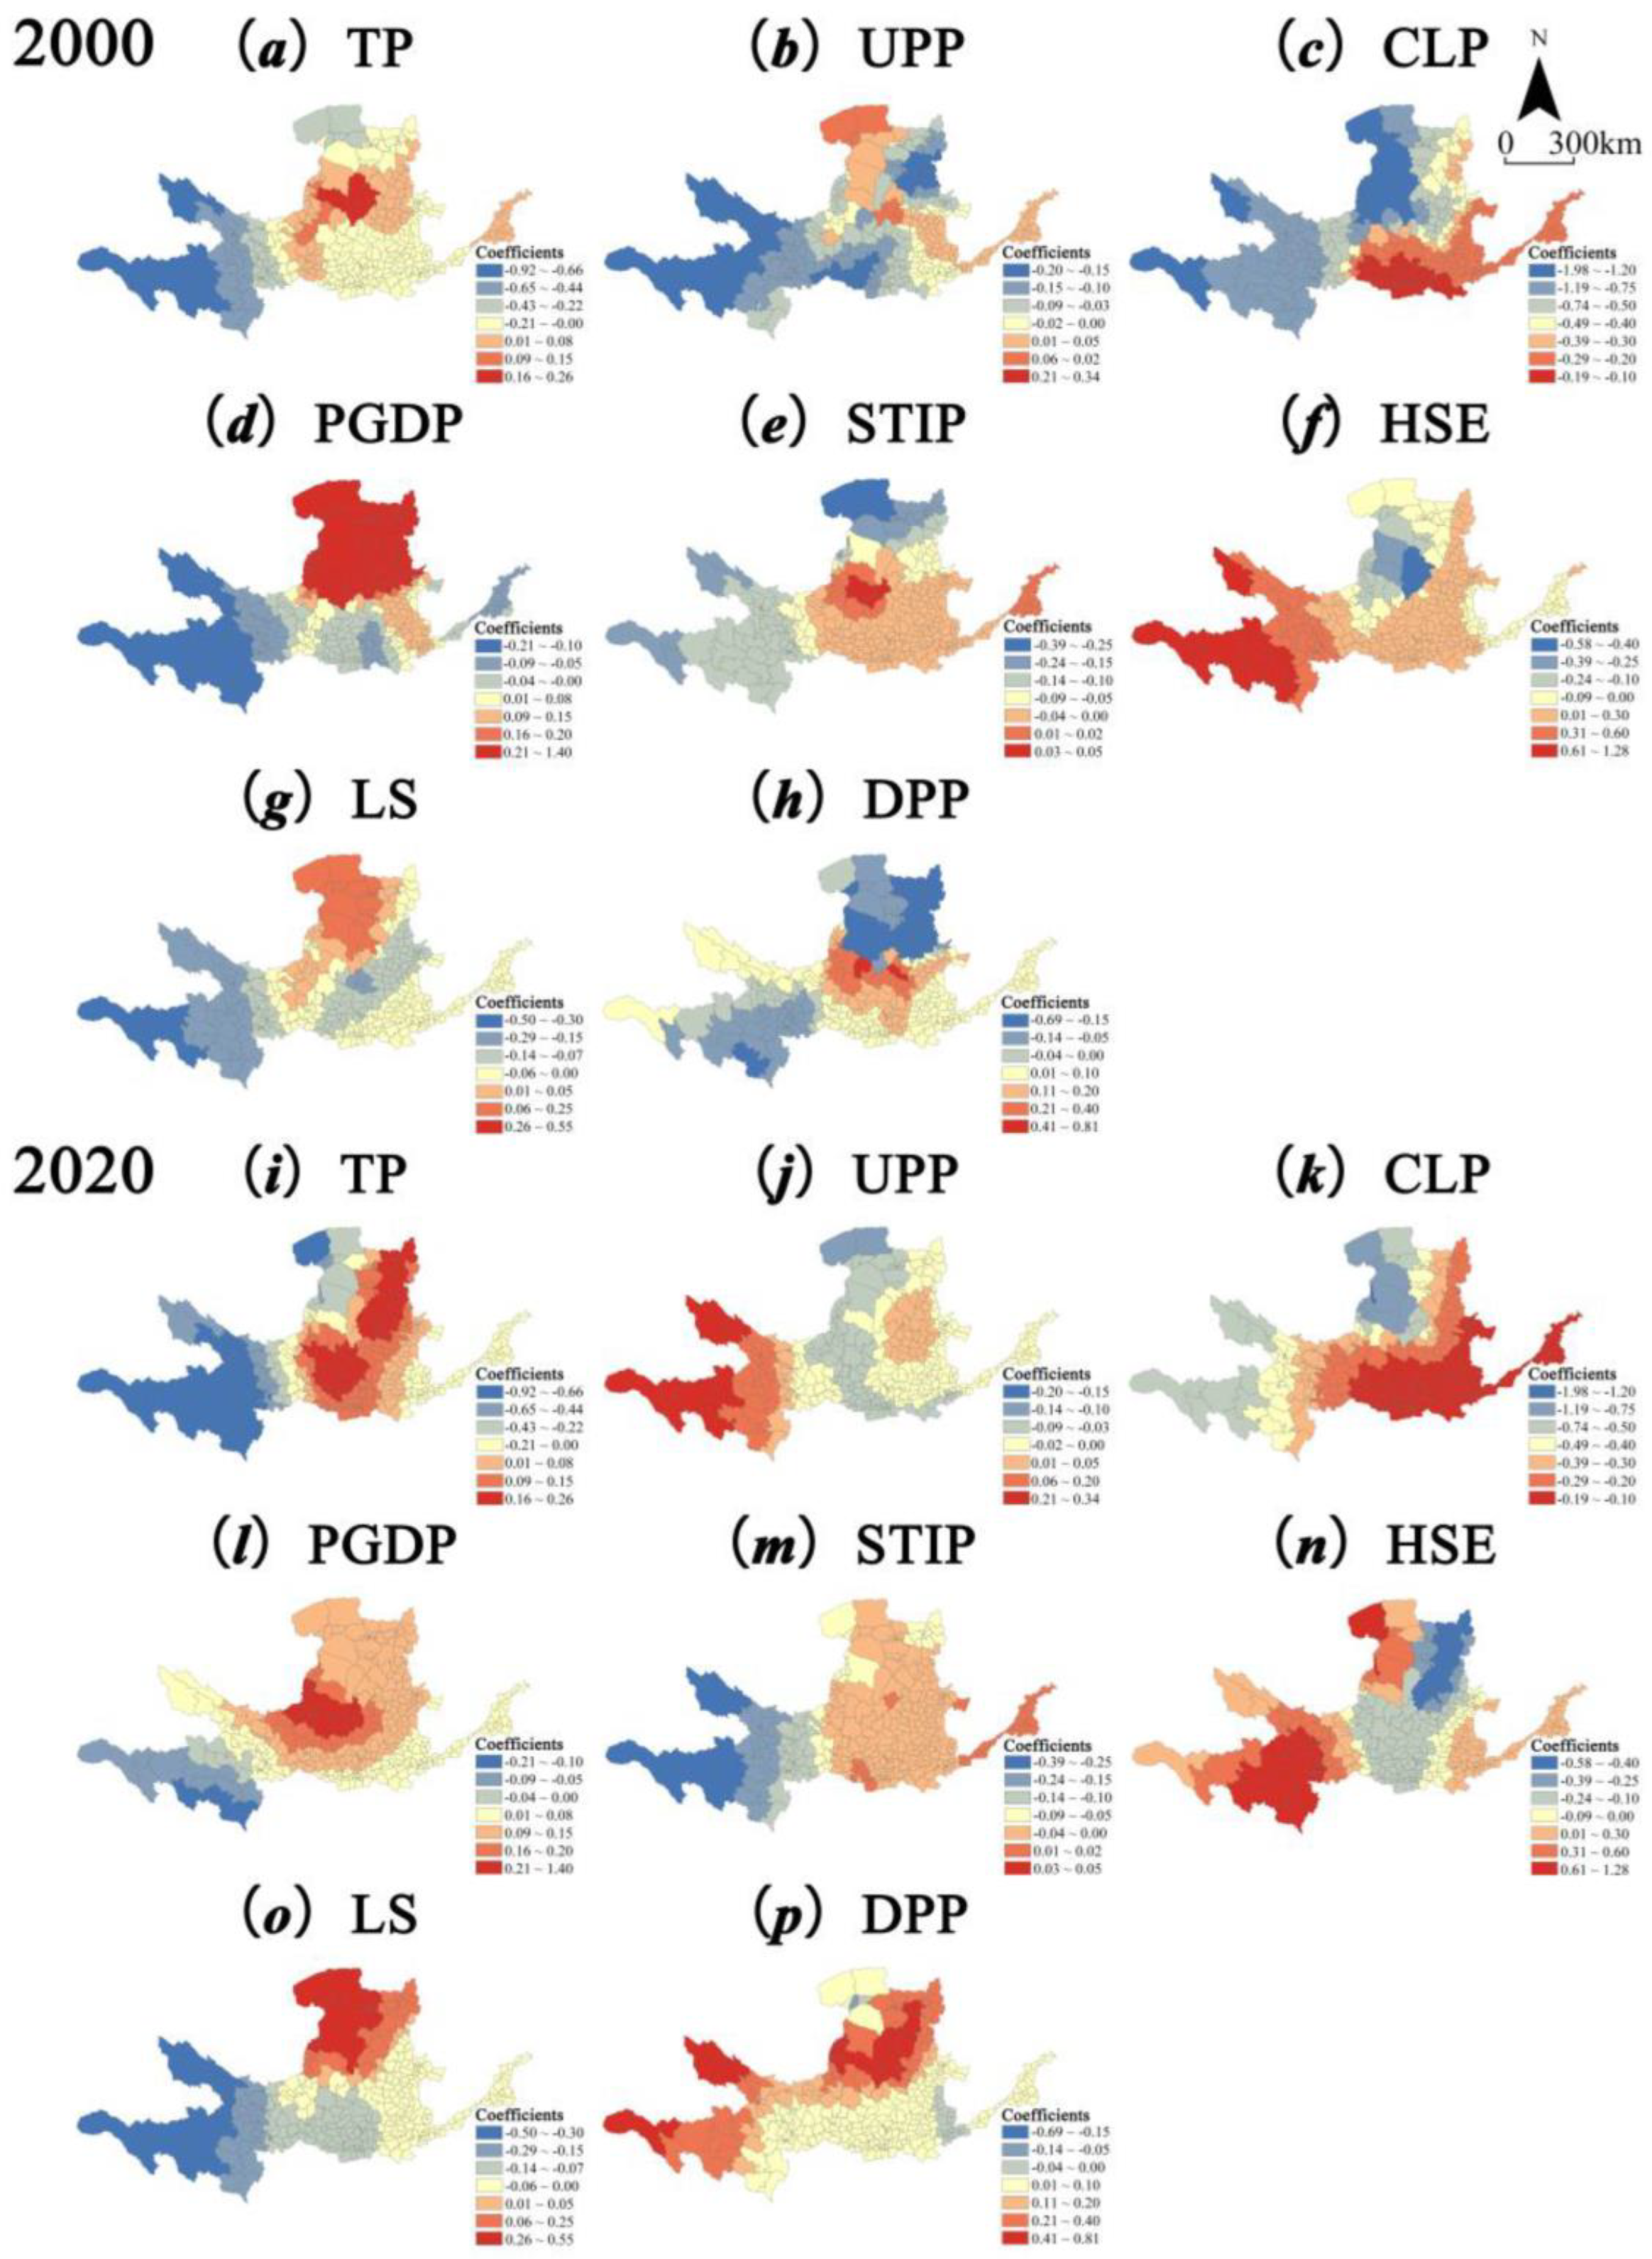
3.4. Impact of Urbanization on ESV

To objectively present the overall changes and dynamic trends of urbanization regarding the ESV and UL, and to reduce data covariance and enhance the model’s robustness, two time points, 2000 and 2020, were taken for comparative analysis. The correlation of ESV with the eight explanatory variables was first examined using the OLS model (Table 4), and the regression results showed that the VIFs of all variables in 2000 and 2020 ranged from 1.09 to 13.17, with a weak effect of collinearity and a small impact on the model regression results. It was found that, in the YRB, PGDP, HSE, and DPP were positively correlated with ESV in 2000, while the other explanatory variables were negatively correlated; by 2020, the impact of UPP changed from negative to positive, while no changes were found for the other explanatory variables.
Although the OLS model provides a global perspective for analysis, it does not take into account the spatial variation in the impact of urbanization on ESV, so to investigate this spatial heterogeneity, we further introduced the GWR model for regression analysis. The R2 and adjusted R2 values of the GWR model were significantly higher than those of the OLS model, while the AICc values of the GWR model were lower than those of the OLS model (Table 5), indicating that the GWR model could better fit the true correlation between the UL and ESV. The average of the coefficients of eight explanatory variables in the regression results of the GWR model (Table 6) suggests that CLP has the strongest negative impact on ESV, followed by TP, LS, STIP, and UPP; meanwhile, HSE, PGDP, and DPP have a progressively weaker positive impact on ESV. The results imply that there are significant differences in the direction and extent of urbanization’s impact via the five subsystems on ESV, and that LUL is the primary cause of ecosystem degradation.
The results of the GWR model regression were spatially visualized and expressed, and the results showed that there were also significant spatial differences and spatio-temporal dynamics in the impact of the urbanization subsystems on ESV in the YRB (Figure 6). Overall, landscape urbanization was the primary factor resulting in the ESV decline, and it had a negative impact in all regions. The change toward a positive impact for economic urbanization and innovative urbanization reflects the positive effect of increased levels of regional economic industry and technological innovation on the ESV and UL. In contrast, demographic urbanization and social urbanization had unstable impacts, in both positive and negative directions.
Specifically, the direction and intensity of the impacts of the five urbanization subsystems were as follows.
(1) The impact of DUL on ESV was characterized by significant spatio-temporal dynamics. In 2000, TP had an overall negative impact on ESV, and, by 2020, the negative impact was intensified in the upper reaches and the positive impact was weakened or became negative in the lower reaches, while the negative impact was weakened or became positive in the middle reaches and the positive impact increased in intensity (Figure 6a,i). The impact of UPP on ESV also changed, from a negative global correlation in 2000 to a weakening negative correlation or positive correlation in 2020, with a significant increase in the positive impact, especially in the upper YRB (Figure 6b,j).
(2) LUL showed a consistently negative global impact on ESV, but the intensity diminished over time. The impact of CLP on ESV was spatially distributed in a stable gradient, gradually weakening from the upper to the middle and lower reaches of the Yellow River (Figure 6c,k).
(3) EUL shifted from a negative to a positive impact on ESV, but the extent was generally weak. PGDP was mainly negatively correlated with ESV in 2000, but it had a strong positive impact in the Inner Mongolia Plateau and the north of the Loess Plateau. By 2020, the positive impact had increased in the middle and lower reaches, while the negative impact continued to weaken in the upper reaches (Figure 6d,l). STIP was negatively correlated with ESV, and its negative impact on the Tibetan Plateau continued to gain strength, while it generally had a weak impact on the middle and lower reaches (Figure 6e,m).
(4) SUL showed both positive and negative impacts on ESV, similar to the characteristics of demographic urbanization. HSE had an overall positive but unstable impact on ESV, shifting from positive to negative in the middle reaches, while a diametrically opposite trend was observed in the lower reaches (Figure 6f,n). LS had an overall negative impact on ESV, except for the positive impact on the Inner Mongolia Plateau and the north of the Loess Plateau, both of which continued to increase (Figure 6g,o).
(5) The impact of IUL on ESV was manifested as a full shift to the positive direction in 2020. The DPP was extremely low in 2000 across the counties and had almost no impact on ecosystem services, while the positive impact of DPP had increased significantly by 2020 (Figure 6h,p).

4. Discussion

4.1. The Relationship between Urbanization Transition and ESV

Urbanization in the YRB underwent a major transition in its development pattern between 2000 and 2020. The proportion of urbanization by subsystem shows a significant decrease in the share of DUL, LUL, and SUL, and a significant increase in the share of EUL and IUL. The change implies that urbanization has shifted from the rapid development driven by demographic concentration and spatial expansion to a new stage of high-quality growth led by industrial upgrading and technological innovation. This conclusion is in agreement with the previous findings of Bai et al. [53] and Liu et al. [92] and also conforms to the general trend of urbanization development in China [93]. In this process, with the rapid rise in the overall UL, ESV also took on an upward trend. From 1990 to 2020, the forest and grassland cover increased by 9.2 × 10⁵ ha and 4.8 × 10⁵ ha, respectively, dramatically improving the net primary productivity of the region [94]. According to Ouyang et al. [95], the trend is similar to that seen when valuing ecosystem services at the national scale in China. Tian et al. [96] also pointed out that, since 2012, China’s urbanization has focused on integrated economic, ecological, and social benefits, and ecosystem services have gradually shifted to develop in synergy with urbanization.
However, ESV variation across counties also showed significant spatial heterogeneity. The counties with faster ESV growth were clustered in the Sanjiangyuan area, the Loess Plateau’s hilly and ravine area, the Fen River Basin, and other regions, where the growth in ESV mainly benefited from national ecological restoration projects such as the ecological protection in the Sanjiangyuan area, the Sanbei protection forests, the return of cropland to forest and grassland, the protection of natural forests, and the restoration of mining areas [97]. The rapid expansion of construction land in the lower reaches of the YRB (an increase of 2.2 × 105 ha by 2020 from 1990) led to a general decline in ESV, but Puyang, Dongping, Dongying, and other demonstration counties for ecological civilization construction witnessed a significant increase in ESV, as they effectively offset the negative impact of urbanization on ESV by ecological restoration [25]. Bryan et al. [98], Sharma et al. [99], and Wu et al. [100] obtained similar findings in the Guangzhou–Foshan Metropolitan Area, Delhi of India, and the Loess Plateau region, suggesting that national ecological regulation policies play a decisive role in ecosystem restoration. Additionally, it is also important to note the spatial misalignment and incompatibility between such urbanization and ecological restoration, which may further exacerbate the supply–demand imbalance of ESV and increase the risk of ecosystem security.
According to the changes in ESV by type in each county, CSV, RSV, and SSV showed essentially the same change characteristics as the ESV, but PSV decreased in 235 counties. This suggests that despite the ability to increase productivity per unit of farmland, agricultural technology improvements have not been sufficient to compensate for the loss of farmland due to the massive encroachment of construction land [101], which contributed to the significant decline in PSV in the YRB following 2010. This finding differs from the studies of Kindu et al. [71], Richards et al. [102], García-Nieto et al. [103], and Jaligot et al. [104]. For example, Kindu et al. found an increasing trend in PSV in Munessa-Shashemene; Richards et al. and García- Nieto et al. noted that urbanization led to a decrease in RSV in Singapore and Mediterranean cities; and Jaligot concluded that urbanization would lead to a decrease in CSV in Cameroon. The different findings may arise from the large differences in the national context and the stage of urbanization development in the case studies.

4.2. Spatio-Temporal Heterogeneity of Urbanization’s Impact on Ecosystem Service Value

Scholars generally agree that urbanization has a predominantly negative impact on ESV and the UL. For example, Aguilera et al. [59], Eigenbrod et al. [105], and Dadashpoor [72] found that the massive replacement of natural ecosystems (farmland, grassland, forest, etc.) by artificial surfaces during urbanization has brought about a decrease in the number and quality of ecosystem service providers, which seriously affects the structure, processes, and functions of ecosystems [106,107]. Tiwari et al. [108] further argued that many urban areas in developing countries have gone beyond the permissible growth limits. However, we found that the impact of urbanization on the ESV and UL in the YRB is complex [35] (Figure 7), as it is affected by a combination of factors, such as the urbanization stage, ecological background, management policies, and regional collaboration. This conclusion is in agreement with the studies of Mitchell et al. [109] and Tian et al. [68].
Specifically, LUL was the only subsystem that showed a negative impact in all regions, indicating that LUL reduced ESV, but the negative impact diminished in intensity over time. It may be due to land expansion encroaching on natural ecosystems, thus leading to changes in land use/cover type, structure, and pattern that disrupt ecosystem functions and quality. Similar evidence was provided by Gifford et al. [110] and Mao et al. [111]. The implementation of land use policies such as permanent basic farmland and ecological red lines for the purpose of strengthening the planning and management of land use changes in China in the past 30 years has promoted the optimization of the land use structure and pattern, offsetting, to some extent, the loss of ESV caused by land expansion and maintaining the stability of ecosystem services. In their studies of the Dongting Lake Basin and Idaho, Zhao et al. [112] and Halperin et al. [113] also found that policies such as enhancing forest conservation and building high-quality agricultural land play a crucial role in improving overall ecosystem services and balancing the demand for housing, food, and other sustainable energy sources.
EUL had a predominantly negative impact on ESV in the YRB in 2000, probably due to the fact that, with the rapid growth of industrial development after the start of the development strategy in Western China, the transfer of many high-polluting and energy-intensive industries from East–Central to Western China [114] has aggravated the problems of resource depletion, ecological damage, and environmental pollution, leading to a continuous decrease in ESV. Yang et al. [115] also demonstrated that ecosystems in Western China are more sensitive to the impact of EUL. However, the middle and lower reaches saw the beginning of positive impacts of EUL in 2020, indicating that with the growth of the regional economy and social productivity, the government has the ability to invest more funds and human resources to vigorously carry out ecological restoration and protection work and strengthen the ecosystem’s ability to resist the negative impacts of urbanization. However, Wang et al. [116] pointed out that economic development in neighboring cities has an overall negative effect on the local ESV, and Sannigrahi et al. [117] also suggested that the effect of economic factors on ESV is negligible, which may be due to differences in research methods and indicator selection.
DUL and SUL have both negative and positive impacts on ESV. Given the fragile ecological carrying capacity of the three plateau areas and the highly dense population in the Yellow and Huaihai Plains, the rapid growth of the total population and the increase in the living standards and consumption levels of urban residents drive the increasing demand for PSV and CSV [118], which leads to the overconsumption of natural resources and serious damage to ecosystems, further exacerbating the loss of ecosystem RSV and SSV. The scattered population and extremely low level of urbanization in the early years, and the continued reduction in the rural population while continuing to concentrate in towns and cities, have effectively alleviated problems such as resource consumption and environmental pollution and promoted the return of rural land to forestry and grassland, thus stabilizing the ecological environment. Moreover, with the increase in education, the regional population has a stronger desire for eco-environmental protection and a greater sense of awareness and responsibility [119], resulting in greater willingness to introduce more advanced and environmentally friendly technologies to boost the resource use efficiency and environmental management capabilities and to enhance the regional ESV. This conclusion supports the findings of Kollmuss et al. [120] and Singh et al. [121], suggesting that a higher level of education usually corresponds to greater environmental concern and that the improvement of the education level may contribute to sustainable regional development.
We also found that IUL did not begin to have a positive impact on ESV in the YRB until 2020, which may be the result of a certain “threshold” brought by scientific and technological innovation, i.e., only when innovation reaches a certain height can it effectively drive ESV to grow. In addition to the potential to improve ecosystem conservation techniques, innovation allows for the more precise assessment of the type, structure, and patterns of changes in ecosystem services through regional ecosystem monitoring and modeling, and thus the precise governance and optimization of ecosystem services. The study by Guo et al. [122] also demonstrates that innovation and technological advances will drive vertical urban sprawl and increase land use efficiency. However, in general, unlike existing studies that rarely consider the operational mechanisms by which innovative urbanization affects ESV and UL, this paper provides an in-depth discussion that contributes to the understanding of the relationship between urban technological innovation dynamics and ecosystem services, and this is consistent with the current trend of urbanization in China, where innovation-driven growth is the core of competitiveness.
Although subject to change, the correlation between UL and ESV in the YRB shows a relatively stable pattern in space. Urbanization in the Tibetan Plateau region generally has a negative impact on ESV, suggesting that the ecosystems there are more sensitive to the impact of human activities. Zhang et al. [123] also found that the ecosystem service scarcity value (ESSV) in the Tibetan Plateau region increased significantly, with the growth rate of public product-type services exceeding that of private product-type services. The main cause is that the fragile ecological environment of the Qinghai–Tibet Plateau has reduced the supply capacity of ecosystem services [70], as well as the low urbanization level, leading to the result that demographic growth, land expansion, industrial development, and other anthropogenic factors have caused serious damage to the ecosystems of alpine meadows and desert grasslands [124]. The positive impact of urbanization on ESV is more pronounced in the middle and lower reaches, mainly because China has implemented a series of ecological restoration projects and land management policies in response to eco-environmental problems such as soil erosion in the Huanghuaihai Plain and wetland degradation in the Loess Plateau. As urbanization in the region enters a new stage of high-quality development, technological innovation and environmental awareness, among others, have also contributed positively to the ecosystem. Yang et al. [125] also found evidence of this.

4.3. Policy Implications

This study finds that the quality of ecosystem services has a close connection with the complex interactions between ecosystems and human activities, and that the traditional highly energy-consuming and highly polluting urbanization is difficult to sustain [126,127]. Strassburg et al. [128] and Sirakaya et al. [129] also pointed out that changing the development pattern of urbanization and strengthening government ecological construction and management are critical paths to effectively mitigate the negative impacts of urbanization on ecosystem services. Therefore, this study recommends incorporating the protection and coordination of ecosystem services into new urbanization management policies and strengthening sustainable urban planning. It also proposes three policy recommendations: changing the urbanization development mode, carrying out ecological restoration by zone, and formulating development plans by type.
(i) Changing the urbanization development mode. The YRB, especially the middle and upper reaches, has not yet completed its urbanization process and is an important regional growth area for China’s future urbanization development. To promote the transformation of urbanization to a green, low-carbon, innovation-driven, and collaborative development mode based on the characteristics of the development stage, policies should be introduced to build a pattern of coordinated development in small, medium, and large cities; strengthen the leading role of national central cities such as Xi’an and Zhengzhou; accelerate the construction of the modern Xi’an metropolitan area with national influence; systematically cultivate the Zhengzhou, Jinan, Lanzhou, Xining, Taiyuan, Yinchuan, and Hohhot metropolitan areas; develop and expand the Guanzhong Plain Urban Agglomeration and Zhongyuan Urban Agglomeration; guide the steady development of the Hohhot–Baotou–Ordos–Yulin Urban Agglomeration and Lanzhou–Xining Urban Agglomeration [28]; and simultaneously promote new urbanization with county cities as important carriers. Public service systems such as urban green infrastructure, education and healthcare, and housing security should be completed. Ecosystem services should be incorporated into the national spatial planning management system and measures should be taken to construct the ecological security pattern of the river basin by weighing the development patterns under various planning scenarios [130] and carrying out basic work such as the assessment of the current state of the YRB ecosystem, evaluation of the resource and environmental carrying capacity, and ecological risk identification. The counties involved should strictly implement a farmland protection system, strengthen the monitoring and assessment of farmland quality, and improve the efficiency of farmland use and output. An ecological economy system for the YRB should be established, with sound systems for ecological product value accounting, ecological tenure trading, ecological transfer payment, and cross-regional ecological compensation [55], as well as other systems to guide the sustainable management and equitable distribution of regional ecosystem service value [131], with focus placed on pilot demonstrations in key ecological function areas, such as the Sanjiangyuan, Qinling, and Qilian Mountains and the Yellow River Delta wetlands. A multi-level and normalized regional collaborative governance mechanism should be established to bring about the positive spillover effects of urbanization, while eco-environmental resources should be used in a complementary manner to carry out ecological governance, economic cooperation, scientific and technological innovation, and facility construction through cross-administrative coordination.
(ii) Carrying out ecological restoration by zone. Key projects of ecological protection should be implemented regionally in the upper, middle, and lower reaches of the YRB, to strengthen the protection and restoration of critical ecological functional areas. (1) The upper reaches are an important water recharge area in the YRB and also the area with the most extensive desertification (61.7%). Desertification control in key areas has achieved remarkable results in recent years, and the area of unused land in the upper reaches has been reduced by 1.9 × 10⁶ ha in 30 years. Future efforts to protect and restore the degraded grassland ecology should be increased in key areas such as the Yellow River source area, Sanjiangyuan, and the Ruoergai grassland wetlands. In addition, stronger measures should be taken to manage the wind and sand desert in the Ordos Plateau area and continue to promote the construction of the Sanbei protection forests, returning farmland to forest, and other key projects to control the expansion of the Ulanbuh Desert and Tengger Desert. (2) The middle reaches are faced with ecological problems such as increased soil erosion, fragmentation of the landscape, and the declining production capacity of animal husbandry. In the future, there should be policies to encourage the implementation of national key projects for soil and water conservation in the hilly and ravine areas of the Loess Plateau, such as the comprehensive management of small river basins, comprehensive management of sloping land, sand interception in the concentrated source areas of coarse sediment, and land protection of the Loess Plateau. In Eastern Ningxia, Northern Shanxi, Northern Shaanxi, Central Inner Mongolia, and other coal-rich areas, key projects such as geological environment management, comprehensive land improvement, and continuous industry cultivation should be arranged as a whole. In addition, because of the loss of 7.6 × 10⁵ ha of the grassland area in the middle reaches in the past 30 years, the implementation of policies such as grazing bans and rotational grazing should be intensified in overgrazing areas such as the riverain-irrigated regions. (3) Most of the lower reaches are in low-ESV zones and face ecological problems such as flooding in beach areas and shrinking wetlands. In the future, policies should be developed to promote the management of the Yellow River beach area; strengthen the water ecological space control in the beach area, flood control and sand sedimentation, and other functions; and build urban forest parks along the Yellow River according to the local conditions. Priority should be given to restoring the wetland ecosystem of the Yellow River Delta, systematically carrying out the work of returning farmland to water bodies and beaches, and building a green ecological corridor in the lower reaches of the YRB, integrating flood control and bank protection, water conservation, and biological habitats.
(iii) Formulating development plans by type. County ecological protection and high-quality development plans should be formulated according to the spatial clustering pattern of the ESV and UL in the YRB by type, to explore a new path of urbanization tailored to the local conditions [115]. Specifically, (1) the 77 low–low-type counties should continue the construction of the desert shelter forest system, implement critical projects such as the return of grazing land to grassland and saline land management, carry out pilot sand control based on the photovoltaic industry relying on policy support, build a long-term mechanism to guarantee funds for desertification control, improve the ecosystem service capacity, and create conditions for urbanization. (2) The 54 high–low-type counties should, following the ecology-based functional zoning, try to develop ecological tourism, special agricultural products, and other green industries and make efforts to complete the ecological product value accounting and ecological tenure trading system to achieve ecological product value [132], to transform natural ecological advantages into economic advantages and promote urbanization in harmony with ecological protection. (3) The 72 low–high-type counties should focus on building a multi-level ecological network system, slowing down urban expansion [66], promoting the ecological and green transformation of industries, boosting sustainable and healthy economic and social development centered on supply-side structural reform, and improving the quality of the urban ecological environment. (4) The six high–high-type counties should strengthen the positioning of the “ecological economic zone” [133], encourage the development of high-tech industries, eliminate polluting industries, establish a number of ecological economic demonstration bases and recycling industrial parks, and set up green development samples to lead the process of ecological civilization construction.

5. Conclusions

Urbanization is one of the most significant features of human social development, and it has a profound impact on the value of regional ecosystem services. Taking counties as the study units, this study analyzed the spatio-temporal variation characteristics and spatial interactions of the ecosystem service value and urbanization levels of 361 county units in the YRB from the perspective of spatio-temporal heterogeneity at the study scale of the basin using the GWR model. It also explored the mechanisms of influence of five urbanization subsystems—population, land, economy, society, and innovation—on the value of ecosystem services and the patterns of spatio-temporal dynamics.
The results showed that the ESV in the YRB experienced a steady rise of 2.87% from 1990 to 2020, high in the northwest plateau region and low in the southeast plain region. Regulation services and support services were the main components of the ESV, holding 84% of the total, and determined the overall trend of the ESV. The YRB enjoyed a significant increase in the UL and also underwent a major transformation in its development pattern, eventually forming a “multi-center grouped style” urbanization spatial pattern with central cities as the core. There was a gradually decreasing negative spatial correlation between the ESV and UL, with low–high and high–low types as the dominant spatial clustering patterns. The impact of urbanization subsystems on ESV showed significant spatial differences and spatio-temporal dynamics. Landscape urbanization showed a significant negative impact across the board; economic urbanization and innovative urbanization changed to have a positive impact; and demographic urbanization and social urbanization had both positive and negative impacts. On this basis, this paper proposes three policy recommendations based on the actual situation of the basin, such as changing the urbanization development mode, carrying out ecological restoration by zone, and formulating development plans by type, to provide a theoretical basis and practical experience for the high-quality development of similar basin areas.
On the basis of existing studies, this paper attempts to expand the vision and depth of urbanization and ESV research from three points. First, in the comprehensive evaluation of the UL, this paper takes into account the three traditional dimensions of population, land, and economy, and two additional important driving factors for new urbanization, namely social services and technological innovation, enriching the connotations and indicator system of new urbanization. Second, from the perspective of the spatio-temporal heterogeneity of urbanization and ESV, this paper reveals the spatio-temporal variation pattern of the urbanization subsystem’s influence mechanism on ESV, which compensates for the deficiency of previous studies that ignore the uneven spatio-temporal distribution characteristics of the two and enriches the theoretical understanding of the interrelationships between natural systems and human systems. Third, this paper proposes policy recommendations to promote the coordinated development of ecological environmental protection and urbanization in the YRB, which will provide a reference for the sustainable development of similar basin areas with great practical value.
This paper advances the theory and methodology of urbanization and ESV research to a certain extent, but it still has the following shortcomings for further improvement in future research. First, this study does not delve into the mutual or synergistic effects among the five urbanization subsystems. More suitable methods, such as geographic probes, can be used in future studies to analyze the interactions between urbanization subsystems and the combined effects on ESV. Second, although the use of county-level administrative divisions as the study units in this paper facilitates county-level administrative entities to formulate regional ecological environmental protection and sustainable development policies according to local conditions in response to research findings [134], there is no comprehensive knowledge of the mechanisms by which urbanization affects the value of ecosystem services at the municipal scale, basin scale, or raster scale. The impact of urbanization on ecosystem services at different spatial scales and its variability should be explored in depth in the future. Finally, with the increasing richness of China’s new urbanization [135], limitations in data sources and quality make it difficult to cover all influences on urbanization that may be relevant to the value of ecosystem services. The framework for UL evaluation can be further improved in future studies with efforts to acquire more reliable data.

Author Contributions

Conceptualization, Y.C. and P.C.; methodology, Q.K., K.Z. and Q.N.; software, Q.K., K.Z. and Q.N.; validation, Q.K., K.Z. and Q.N.; formal analysis, Y.C. and Q.K.; investigation, Q.N. and X.M.; resources, Q.K. and X.M.; data curation, Q.K. and X.M.; writing—original draft preparation, Y.C., Q.K., Q.N. and X.M.; writing—review and editing, Y.C. and Q.K.; visualization, Q.K. and Q.N.; supervision, P.C. and K.L.; project administration, K.L. and J.L.; funding acquisition, J.L. All authors have read and agreed to the published version of the manuscript.

Funding

This research was funded by the National Natural Science Foundation of China (grant number 42071211) and the National Key R&D Program of China (grant number 2022YFC3802804).

Data Availability Statement

The LUCC data and vector ranges of the Yellow River Basin were obtained from the Resources and Environmental Sciences and Data Center, Chinese Academy of Sciences (http://www.resdc.cn/, accessed on 12 January 2023). The data on the grain sown area, output, and grain price were obtained from the provincial statistical yearbook and the Yearbook of China Agricultural Product Price Survey. Data on other influencing factors were obtained from the “China Census by County”, “China County Statistical Yearbook”, “Statistical Annual Report of the State Intellectual Property Office of China”, and the Statistical Yearbook of the Yellow River Basin.

Conflicts of Interest

The authors declare no conflict of interest.

Appendix A

Table A1. Change in total value of ESV in the YRB from 1990 to 2020 (CNY).
YEARPSVRSVSSVCSVESV
19902.194 × 10111.217 × 10127.388 × 10111.604 × 10112.336 × 1012
20002.222 × 10111.226 × 10127.411 × 10111.615 × 10112.351 × 1012
20102.245 × 10111.254 × 10127.537 × 10111.652 × 10112.397 × 1012
20202.235 × 10111.259 × 10127.537 × 10111.662 × 10112.403 × 1012
Table A2. Change in mean values of UL in the YRB from 1990 to 2020.
YEARDULLULEULSULIULUL
20000.01390.00590.00950.01080.00050.0406
20100.01640.01790.01460.01460.00240.0659
20200.01850.03040.02060.01670.02310.1092
Figure A1. Spatio-temporal change in ESV in the YRB from 1990 to 2020.
Land 12 01301 g0a1
Figure A2. Spatio-temporal change in UL in the YRB from 2000 to 2020.
Land 12 01301 g0a2

References

  1. Costanza, R.; d’Arge, R.; de Groot, R.; Farber, S.; Grasso, M.; Hannon, B.; Limburg, K.; Naeem, S.; O’Neill, R.V.; Paruelo, J.; et al. The value of the world’s ecosystem services and natural capital. Nature 1997, 387, 253–260. [Google Scholar] [CrossRef]
  2. Nelson, E.; Mendoza, G.; Regetz, J.; Polasky, S.; Tallis, H.; Cameron, D.; Chan, K.M.A.; Daily, G.C.; Goldstein, J.; Kareiva, P.M.; et al. Modeling multiple ecosystem services, biodiversity conservation, commodity production, and tradeoffs at landscape scales. Front. Ecol. Environ. 2009, 7, 4–11. [Google Scholar] [CrossRef]
  3. Gómez-Baggethun, E.; Barton, D.N. Classifying and valuing ecosystem services for urban planning. Ecol. Econ. 2013, 86, 235–245. [Google Scholar] [CrossRef]
  4. Li, G.; Fang, C.; Wang, S. Exploring spatiotemporal changes in ecosystem-service values and hotspots in China. Sci. Total Environ. 2016, 545–546, 609–620. [Google Scholar] [CrossRef] [PubMed]
  5. Tao, Y.; Wang, H.; Ou, W.; Guo, J. A land-cover-based approach to assessing ecosystem services supply and demand dynamics in the rapidly urbanizing Yangtze River Delta region. Land Use Policy 2018, 72, 250–258. [Google Scholar] [CrossRef]
  6. de Groot, R.S.; Wilson, M.A.; Boumans, R.M.J. A typology for the classification, description and valuation of ecosystem functions, goods and services. Ecol. Econ. 2002, 41, 393–408. [Google Scholar] [CrossRef] [Green Version]
  7. Grimm, N.B.; Faeth, S.H.; Golubiewski, N.E.; Redman, C.L.; Wu, J.; Bai, X.; Briggs, J.M. Global change and the ecology of cities. Science 2008, 319, 756–760. [Google Scholar] [CrossRef] [Green Version]
  8. Pan, Z.; Wang, J. Spatially heterogeneity response of ecosystem services supply and demand to urbanization in China. Ecol. Eng. 2021, 169, 106303. [Google Scholar] [CrossRef]
  9. Wang, C.; Wang, L.; Zhan, J.; Liu, W.; Teng, Y.; Chu, X.; Wang, H. Spatial heterogeneity of urbanization impacts on ecosystem services in the urban agglomerations along the Yellow River, China. Ecol. Eng. 2022, 182, 106717. [Google Scholar] [CrossRef]
  10. Taylor, L.; Hahs, A.K.; Hochuli, D.F. Correction to: Wellbeing and urban living: Nurtured by nature. Urban Ecosyst. 2018, 21, 1227–1228. [Google Scholar] [CrossRef] [Green Version]
  11. Zhang, M.; Tan, S.; Zhang, C.; Han, S.; Zou, S.; Chen, E. Assessing the impact of fractional vegetation cover on urban thermal environment: A case study of Hangzhou, China. Sustain. Cities Soc. 2023, 96, 104663. [Google Scholar] [CrossRef]
  12. Yang, K.; Hou, H.; Li, Y.; Chen, Y.; Wang, L.; Wang, P.; Hu, T. Future urban waterlogging simulation based on LULC forecast model: A case study in Haining City, China. Sustain. Cities Soc. 2022, 87, 104167. [Google Scholar] [CrossRef]
  13. Liu, X.; Pei, F.; Wen, Y.; Li, X.; Wang, S.; Wu, C.; Cai, Y.; Wu, J.; Chen, J.; Feng, K.; et al. Global urban expansion offsets climate-driven increases in terrestrial net primary productivity. Nat. Commun. 2019, 10, 5558. [Google Scholar] [CrossRef] [Green Version]
  14. Grêt-Regamey, A.; Galleguillos-Torres, M.; Dissegna, A.; Weibel, B. How urban densification influences ecosystem services—A comparison between a temperate and a tropical city. Environ. Res. Lett. 2020, 15, 075001. [Google Scholar] [CrossRef]
  15. Wang, S.; Song, S.; Zhang, J.; Wu, X.; Fu, B. Achieving a fit between social and ecological systems in drylands for sustainability. Curr. Opin. Environ. Sustai. 2021, 48, 53–58. [Google Scholar] [CrossRef]
  16. Deng, C.; Liu, J.; Nie, X.; Li, Z.; Liu, Y.; Xiao, H.; Hu, X.; Wang, L.; Zhang, Y.; Zhang, G.; et al. How trade-offs between ecological construction and urbanization expansion affect ecosystem services. Ecol. Indic. 2021, 122, 107253. [Google Scholar] [CrossRef]
  17. Peng, J.; Shen, H.; Wu, W.; Liu, Y.; Wang, Y. Net primary productivity (NPP) dynamics and associated urbanization driving forces in metropolitan areas: A case study in Beijing City, China. Landsc. Ecol. 2016, 31, 1077–1092. [Google Scholar] [CrossRef]
  18. Zhang, D.; Huang, Q.; He, C.; Wu, J. Impacts of urban expansion on ecosystem services in the Beijing-Tianjin-Hebei urban agglomeration, China: A scenario analysis based on the Shared Socioeconomic Pathways. Resour. Conserv. Recy. 2017, 125, 115–130. [Google Scholar] [CrossRef]
  19. Dang, K.B.; Pham, H.H.; Nguyen, T.N.; Giang, T.L.; Pham, T.P.N.; Nghiem, V.S.; Nguyen, D.H.; Vu, K.C.; Bui, Q.D.; Pham, H.N.; et al. Monitoring the effects of urbanization and flood hazards on sandy ecosystem services. Sci. Total Environ. 2023, 880, 163271. [Google Scholar] [CrossRef]
  20. Zhu, C.; Zhang, X.; Zhou, M.; He, S.; Gan, M.; Yang, L.; Wang, K. Impacts of urbanization and landscape pattern on habitat quality using OLS and GWR models in Hangzhou, China. Ecol. Indic. 2020, 117, 106654. [Google Scholar] [CrossRef]
  21. McFarlane, R.A.; Horwitz, P.; Arabena, K.; Capon, A.; Jenkins, A.; Jupiter, S.; Negin, J.; Parkes, M.W.; Saketa, S. Ecosystem services for human health in Oceania. Ecosyst. Serv. 2019, 39, 100976. [Google Scholar] [CrossRef]
  22. Song, W.; Deng, X. Land-use/land-cover change and ecosystem service provision in China. Sci. Total Environ. 2017, 576, 705–719. [Google Scholar] [CrossRef] [PubMed]
  23. Tian, Y.; Jiang, G.; Zhou, D.; Li, G. Systematically addressing the heterogeneity in the response of ecosystem services to agricultural modernization, industrialization and urbanization in the Qinghai-Tibetan Plateau from 2000 to 2018. J. Clean. Prod. 2021, 285, 125323. [Google Scholar] [CrossRef]
  24. Zhang, Y.; Liu, Y.; Zhang, Y.; Liu, Y.; Zhang, G.; Chen, Y. On the spatial relationship between ecosystem services and urbanization: A case study in Wuhan, China. Sci. Total Environ. 2018, 637–638, 780–790. [Google Scholar] [CrossRef]
  25. Xiao, R.; Lin, M.; Fei, X.; Li, Y.; Zhang, Z.; Meng, Q. Exploring the interactive coercing relationship between urbanization and ecosystem service value in the Shanghai–Hangzhou Bay Metropolitan Region. J. Clean. Prod. 2020, 253, 119803. [Google Scholar] [CrossRef]
  26. Li, W.; An, M.; Wu, H.; An, H.; Huang, J.; Khanal, R. The local coupling and telecoupling of urbanization and ecological environment quality based on multisource remote sensing data. J. Environ. Manag. 2023, 327, 116921. [Google Scholar] [CrossRef]
  27. Peng, J.; Wang, X.; Liu, Y.; Zhao, Y.; Xu, Z.; Zhao, M.; Qiu, S.; Wu, J. Urbanization impact on the supply-demand budget of ecosystem services: Decoupling analysis. Ecosyst. Serv. 2020, 44, 101139. [Google Scholar] [CrossRef]
  28. Ouyang, X.; Tang, L.; Wei, X.; Li, Y. Spatial interaction between urbanization and ecosystem services in Chinese urban agglomerations. Land Use Policy 2021, 109, 105587. [Google Scholar] [CrossRef]
  29. Taylor, L.; Hochuli, D.F. Creating better cities: How biodiversity and ecosystem functioning enhance urban residents’ wellbeing. Urban Ecosyst. 2014, 18, 747–762. [Google Scholar] [CrossRef]
  30. Wan, L.; Ye, X.; Lee, J.; Lu, X.; Zheng, L.; Wu, K. Effects of urbanization on ecosystem service values in a mineral resource-based city. Habitat Int. 2015, 46, 54–63. [Google Scholar] [CrossRef]
  31. Zhou, D.; Tian, Y.; Jiang, G. Spatio-temporal investigation of the interactive relationship between urbanization and ecosystem services: Case study of the Jingjinji urban agglomeration, China. Ecol. Indic. 2018, 95, 152–164. [Google Scholar] [CrossRef]
  32. Yao, X.; Kou, D.; Shao, S.; Li, X.; Wang, W.; Zhang, C. Can urbanization process and carbon emission abatement be harmonious? New evidence from China. Environ. Impact Assess. Rev. 2018, 71, 70–83. [Google Scholar] [CrossRef]
  33. Liu, Y.; Liu, S.; Sun, Y.; Sun, J.; Wang, F.; Li, M. Effect of grazing exclusion on ecosystem services dynamics, trade-offs and synergies in Northern Tibet. Ecol. Eng. 2022, 179, 106638. [Google Scholar] [CrossRef]
  34. Wang, Z.; Liang, L.; Sun, Z.; Wang, X. Spatiotemporal differentiation and the factors influencing urbanization and ecological environment synergistic effects within the Beijing-Tianjin-Hebei urban agglomeration. J. Environ. Manag. 2019, 243, 227–239. [Google Scholar] [CrossRef]
  35. Peng, J.; Tian, L.; Liu, Y.; Zhao, M.; Hu, Y.; Wu, J. Ecosystem services response to urbanization in metropolitan areas: Thresholds identification. Sci. Total Environ. 2017, 607–608, 706–714. [Google Scholar] [CrossRef] [PubMed]
  36. Wang, J.; Zhou, W.; Pickett, S.T.A.; Yu, W.; Li, W. A multiscale analysis of urbanization effects on ecosystem services supply in an urban megaregion. Sci. Total Environ. 2019, 662, 824–833. [Google Scholar] [CrossRef]
  37. Faulkner, S. Urbanization impacts on the structure and function of forested wetlands. Urban Ecosyst. 2004, 7, 89–106. [Google Scholar] [CrossRef]
  38. Wang, S.; Ma, H.; Zhao, Y. Exploring the relationship between urbanization and the eco-environment—A case study of Beijing–Tianjin–Hebei region. Ecol. Indic. 2014, 45, 171–183. [Google Scholar] [CrossRef]
  39. Zhou, S.; Huang, Y.; Yu, B.; Wang, G. Effects of human activities on the eco-environment in the middle Heihe River Basin based on an extended environmental Kuznets curve model. Ecol. Eng. 2015, 76, 14–26. [Google Scholar] [CrossRef]
  40. Saboori, B.; Sulaiman, J. Environmental degradation, economic growth and energy consumption: Evidence of the environmental Kuznets curve in Malaysia. Energy Policy 2013, 60, 892–905. [Google Scholar] [CrossRef]
  41. Chen, W.; Zeng, J.; Li, N. Change in land-use structure due to urbanisation in China. J. Clean. Prod. 2021, 321, 128986. [Google Scholar] [CrossRef]
  42. Chen, W.; Chi, G.; Li, J. The spatial aspect of ecosystem services balance and its determinants. Land Use Policy 2020, 90, 104263. [Google Scholar] [CrossRef]
  43. Peng, J.; Liu, Y.; Corstanje, R.; Meersmans, J. Promoting sustainable landscape pattern for landscape sustainability. Landsc. Ecol. 2021, 36, 1839–1844. [Google Scholar] [CrossRef]
  44. Sallustio, L.; De Toni, A.; Strollo, A.; Di Febbraro, M.; Gissi, E.; Casella, L.; Geneletti, D.; Munafo, M.; Vizzarri, M.; Marchetti, M. Assessing habitat quality in relation to the spatial distribution of protected areas in Italy. J. Environ. Manag. 2017, 201, 129–137. [Google Scholar] [CrossRef]
  45. Claris Fisher, J.; Emmerson Bicknell, J.; Nesbitt Irvine, K.; Fernandes, D.; Mistry, J.; Georgina Davies, Z. Exploring how urban nature is associated with human wellbeing in a neotropical city. Landsc. Urban Plann. 2021, 212, 104119. [Google Scholar] [CrossRef]
  46. Wang, Q.; Lan, Z. Park green spaces, public health and social inequalities: Understanding the interrelationships for policy implications. Land Use Policy 2019, 83, 66–74. [Google Scholar] [CrossRef]
  47. Chen, W.; Chi, G.; Li, J. The spatial association of ecosystem services with land use and land cover change at the county level in China, 1995–2015. Sci. Total Environ. 2019, 669, 459–470. [Google Scholar] [CrossRef]
  48. Ahmed, Z.; Asghar, M.M.; Malik, M.N.; Nawaz, K. Moving towards a sustainable environment: The dynamic linkage between natural resources, human capital, urbanization, economic growth, and ecological footprint in China. Resour. Policy 2020, 67, 101677. [Google Scholar] [CrossRef]
  49. Zank, B.; Bagstad, K.J.; Voigt, B.; Villa, F. Modeling the effects of urban expansion on natural capital stocks and ecosystem service flows: A case study in the Puget Sound, Washington, USA. Landsc. Urban Plann. 2016, 149, 31–42. [Google Scholar] [CrossRef]
  50. Wang, L.; Li, Q.; Bi, H.; Mao, X.Z. Human impacts and changes in the coastal waters of south China. Sci. Total Environ. 2016, 562, 108–114. [Google Scholar] [CrossRef]
  51. Luo, Q.; Zhou, J.; Zhang, Y.; Yu, B.; Zhu, Z. What is the spatiotemporal relationship between urbanization and ecosystem services? A case from 110 cities in the Yangtze River Economic Belt, China. J. Environ. Manag. 2022, 321, 115709. [Google Scholar] [CrossRef] [PubMed]
  52. Shi, Y.; Feng, C.-C.; Yu, Q.; Guo, L. Integrating supply and demand factors for estimating ecosystem services scarcity value and its response to urbanization in typical mountainous and hilly regions of south China. Sci. Total Environ. 2021, 796, 149032. [Google Scholar] [CrossRef] [PubMed]
  53. Bai, Y.; Deng, X.; Jiang, S.; Zhang, Q.; Wang, Z. Exploring the relationship between urbanization and urban eco-efficiency: Evidence from prefecture-level cities in China. J. Clean. Prod. 2018, 195, 1487–1496. [Google Scholar] [CrossRef]
  54. Cao, Y.; Kong, L.; Zhang, L.; Ouyang, Z. The balance between economic development and ecosystem service value in the process of land urbanization: A case study of China’s land urbanization from 2000 to 2015. Land Use Policy 2021, 108, 105536. [Google Scholar] [CrossRef]
  55. Yu, Q.; Feng, C.-C.; Shi, Y.; Guo, L. Spatiotemporal interaction between ecosystem services and urbanization in China: Incorporating the scarcity effects. J. Clean. Prod. 2021, 317, 128392. [Google Scholar] [CrossRef]
  56. Deng, C.; Liu, J.; Liu, Y.; Li, Z.; Nie, X.; Hu, X.; Wang, L.; Zhang, Y.; Zhang, G.; Zhu, D.; et al. Spatiotemporal dislocation of urbanization and ecological construction increased the ecosystem service supply and demand imbalance. J. Environ. Manag. 2021, 288, 112478. [Google Scholar] [CrossRef]
  57. Villamagna, A.M.; Angermeier, P.L.; Bennett, E.M. Capacity, pressure, demand, and flow: A conceptual framework for analyzing ecosystem service provision and delivery. Ecol. Complex. 2013, 15, 114–121. [Google Scholar] [CrossRef]
  58. Xu, Z.; Peng, J.; Qiu, S.; Liu, Y.; Dong, J.; Zhang, H. Responses of spatial relationships between ecosystem services and the Sustainable Development Goals to urbanization. Sci. Total Environ. 2022, 850, 157868. [Google Scholar] [CrossRef]
  59. Aguilera, M.A.; Tapia, J.; Gallardo, C.; Nunez, P.; Varas-Belemmi, K. Loss of coastal ecosystem spatial connectivity and services by urbanization: Natural-to-urban integration for bay management. J. Environ. Manag. 2020, 276, 111297. [Google Scholar] [CrossRef]
  60. Dong, F.; Pan, Y.; Li, Y.; Zhang, S. How public and government matter in industrial pollution mitigation performance: Evidence from China. J. Clean. Prod. 2021, 306, 127099. [Google Scholar] [CrossRef]
  61. Li, B.; Chen, D.; Wu, S.; Zhou, S.; Wang, T.; Chen, H. Spatio-temporal assessment of urbanization impacts on ecosystem services: Case study of Nanjing City, China. Ecol. Indic. 2016, 71, 416–427. [Google Scholar] [CrossRef]
  62. Luo, Q.; Zhou, J.; Li, Z.; Yu, B. Spatial differences of ecosystem services and their driving factors: A comparation analysis among three urban agglomerations in China’s Yangtze River Economic Belt. Sci. Total Environ. 2020, 725, 138452. [Google Scholar] [CrossRef]
  63. Yuan, Y.; Wu, S.; Yu, Y.; Tong, G.; Mo, L.; Yan, D.; Li, F. Spatiotemporal interaction between ecosystem services and urbanization: Case study of Nanjing City, China. Ecol. Indic. 2018, 95, 917–929. [Google Scholar] [CrossRef]
  64. Li, R.; Shi, Y.; Feng, C.-C.; Guo, L. The spatial relationship between ecosystem service scarcity value and urbanization from the perspective of heterogeneity in typical arid and semiarid regions of China. Ecol. Indic. 2021, 132, 108299. [Google Scholar] [CrossRef]
  65. Su, S.; Li, D.; Hu, Y.N.; Xiao, R.; Zhang, Y. Spatially non-stationary response of ecosystem service value changes to urbanization in Shanghai, China. Ecol. Indic. 2014, 45, 332–339. [Google Scholar] [CrossRef]
  66. Yu, P.; Zhang, S.; Yung, E.H.K.; Chan, E.H.W.; Luan, B.; Chen, Y. On the urban compactness to ecosystem services in a rapidly urbanising metropolitan area: Highlighting scale effects and spatial non–stationary. Environ. Impact Assess. Rev. 2023, 98, 106975. [Google Scholar] [CrossRef]
  67. Guo, X.M.; Fang, C.L.; Mu, X.F.; Chen, D. Coupling and coordination analysis of urbanization and ecosystem service value in Beijing-Tianjin-Hebei urban agglomeration. Ecol. Indic. 2022, 137, 108782. [Google Scholar] [CrossRef]
  68. Tian, Y.; Zhou, D.; Jiang, G. Conflict or Coordination? Multiscale assessment of the spatio-temporal coupling relationship between urbanization and ecosystem services: The case of the Jingjinji Region, China. Ecol. Indic. 2020, 117, 106543. [Google Scholar] [CrossRef]
  69. Xing, L.; Zhu, Y.; Wang, J. Spatial spillover effects of urbanization on ecosystem services value in Chinese cities. Ecol. Indic. 2021, 121, 107028. [Google Scholar] [CrossRef]
  70. Wang, J.; Zhai, T.; Lin, Y.; Kong, X.; He, T. Spatial imbalance and changes in supply and demand of ecosystem services in China. Sci. Total Environ. 2019, 657, 781–791. [Google Scholar] [CrossRef]
  71. Kindu, M.; Schneider, T.; Teketay, D.; Knoke, T. Changes of ecosystem service values in response to land use/land cover dynamics in Munessa-Shashemene landscape of the Ethiopian highlands. Sci. Total Environ. 2016, 547, 137–147. [Google Scholar] [CrossRef] [PubMed]
  72. Dadashpoor, H.; Azizi, P.; Moghadasi, M. Land use change, urbanization, and change in landscape pattern in a metropolitan area. Sci. Total Environ. 2019, 655, 707–719. [Google Scholar] [CrossRef] [PubMed]
  73. Narducci, J.; Quintas-Soriano, C.; Castro, A.; Som-Castellano, R.; Brandt, J.S. Implications of urban growth and farmland loss for ecosystem services in the western United States. Land Use Policy 2019, 86, 1–11. [Google Scholar] [CrossRef]
  74. Zhang, H.; Deng, W.; Zhang, S.; Peng, L.; Liu, Y. Impacts of urbanization on ecosystem services in the Chengdu-Chongqing Urban Agglomeration: Changes and trade-offs. Ecol. Indic. 2022, 139, 108920. [Google Scholar] [CrossRef]
  75. Wang, S.; Fu, B.; Piao, S.; Lü, Y.; Ciais, P.; Feng, X.; Wang, Y. Reduced sediment transport in the Yellow River due to anthropogenic changes. Nat. Geosci. 2015, 9, 38–41. [Google Scholar] [CrossRef]
  76. Li, Y.; Xie, Z.; Qin, Y.; Zheng, Z. Responses of the Yellow River basin vegetation: Climate change. Int. J. Clim. Chang. Str. 2019, 11, 483–498. [Google Scholar] [CrossRef]
  77. Wang, S.; Fu, B.; Liang, W.; Liu, Y.; Wang, Y. Driving forces of changes in the water and sediment relationship in the Yellow River. Sci. Total Environ. 2017, 576, 453–461. [Google Scholar] [CrossRef]
  78. Wang, S.; Fu, B.; Liang, W. Developing policy for the Yellow River sediment sustainable control. Natl. Sci. Rev. 2016, 3, 162–164. [Google Scholar] [CrossRef] [Green Version]
  79. Xie, G.D.; Zhang, C.X.; Zhang, L.M.; Chen, W.H.; Li, S.M. Improvement of the evaluation method for ecosystem service value based on per unit area. J. Nat. Resour. 2015, 30, 1243–1254. [Google Scholar]
  80. Xing, L.; Hu, M.; Wang, Y. Integrating ecosystem services value and uncertainty into regional ecological risk assessment: A case study of Hubei Province, Central China. Sci. Total Environ. 2020, 740, 140126. [Google Scholar] [CrossRef]
  81. Zhang, B.; Wang, Y.; Li, J.; Zheng, L. Degradation or Restoration? The temporal-spatial evolution of ecosystem services and its determinants in the Yellow River Basin, China. Land 2022, 11, 863. [Google Scholar] [CrossRef]
  82. Ahern, J.; Cilliers, S.; Niemelä, J. The concept of ecosystem services in adaptive urban planning and design: A framework for supporting innovation. Landsc. Urban Plann. 2014, 125, 254–259. [Google Scholar] [CrossRef] [Green Version]
  83. Ma, L.; Cheng, W.; Qi, J. Coordinated evaluation and development model of oasis urbanization from the perspective of new urbanization: A case study in Shandan County of Hexi Corridor, China. Sustain. Cities Soc. 2018, 39, 78–92. [Google Scholar] [CrossRef]
  84. Friedmann, J. Four theses in the study of China’s urbanization. Int. J. Urban Regional 2006, 30, 440–451. [Google Scholar] [CrossRef]
  85. Ahmad, M.; Jiang, P.; Murshed, M.; Shehzad, K.; Akram, R.; Cui, L.; Khan, Z. Modelling the dynamic linkages between eco-innovation, urbanization, economic growth and ecological footprints for G7 countries: Does financial globalization matter? Sustain. Cities Soc. 2021, 70, 102881. [Google Scholar] [CrossRef]
  86. Ahani, S.; Dadashpoor, H. A review of domains, approaches, methods and indicators in peri-urbanization literature. Habitat Int. 2021, 114, 102387. [Google Scholar] [CrossRef]
  87. Zhou, Y.; Chen, M.; Tang, Z.; Mei, Z. Urbanization, land use change, and carbon emissions: Quantitative assessments for city-level carbon emissions in Beijing-Tianjin-Hebei region. Sustain. Cities Soc. 2021, 66, 102701. [Google Scholar] [CrossRef]
  88. Zhang, L.; Huang, S. Social capital and regional innovation efficiency: The moderating effect of governance quality. Struct. Chang. Econ. Dynam. 2022, 62, 343–359. [Google Scholar] [CrossRef]
  89. Li, Y.; Li, Y.; Zhou, Y.; Shi, Y.; Zhu, X. Investigation of a coupling model of coordination between urbanization and the environment. J. Environ. Manag. 2012, 98, 127–133. [Google Scholar] [CrossRef]
  90. Chen, T.-L.; Lin, Z.-H. Impact of land use types on the spatial heterogeneity of extreme heat environments in a metropolitan area. Sustain. Cities Soc. 2021, 72, 103005. [Google Scholar] [CrossRef]
  91. Zhang, M.; Tan, S.; Zhang, X. How do varying socio-economic factors affect the scale of land transfer? Evidence from 287 cities in China. Environ. Sci. Pollut. Res. 2022, 29, 40865–40877. [Google Scholar] [CrossRef]
  92. Liu, W.; Zhan, J.; Zhao, F.; Wei, X.; Zhang, F. Exploring the coupling relationship between urbanization and energy eco-efficiency: A case study of 281 prefecture-level cities in China. Sustain. Cities Soc. 2021, 64, 102563. [Google Scholar] [CrossRef]
  93. Bai, X.; Shi, P.; Liu, Y. Society: Realizing China’s urban dream. Nature 2014, 509, 158–160. [Google Scholar] [CrossRef] [Green Version]
  94. Mu, W.; Zhu, X.; Ma, W.; Han, Y.; Huang, H.; Huang, X. Impact assessment of urbanization on vegetation net primary productivity: A case study of the core development area in central plains urban agglomeration, China. Environ. Res. 2023, 229, 115995. [Google Scholar] [CrossRef]
  95. Ouyang, Z.; Zheng, H.; Xiao, Y.; Polasky, S.; Liu, J.; Xu, W.; Wang, Q.; Zhang, L.; Xiao, Y.; Rao, E.; et al. Improvements in ecosystem services from investments in natural capital. Science 2016, 352, 1455–1459. [Google Scholar] [CrossRef]
  96. Tian, P.; Liu, Y.; Li, J.; Pu, R.; Cao, L.; Zhang, H. Spatiotemporal patterns of urban expansion and trade-offs and synergies among ecosystem services in urban agglomerations of China. Ecol. Indic. 2023, 148, 110057. [Google Scholar] [CrossRef]
  97. Fu, B.; Wang, S.; Liu, Y.; Liu, J.; Liang, W.; Miao, C. Hydrogeomorphic Ecosystem Responses to Natural and Anthropogenic Changes in the Loess Plateau of China. Annu. Rev. Earth Planet. Sci. 2017, 45, 223–243. [Google Scholar] [CrossRef]
  98. Bryan, B.A.; Ye, Y.; Zhang, J.E.; Connor, J.D. Land-use change impacts on ecosystem services value: Incorporating the scarcity effects of supply and demand dynamics. Ecosyst. Serv. 2018, 32, 144–157. [Google Scholar] [CrossRef]
  99. Sharma, S.; Nahid, S.; Sharma, M.; Sannigrahi, S.; Anees, M.M.; Sharma, R.; Shekhar, R.; Basu, A.S.; Pilla, F.; Basu, B.; et al. A long-term and comprehensive assessment of urbanization-induced impacts on ecosystem services in the capital city of India. City Environ. Interact. 2020, 7, 100047. [Google Scholar] [CrossRef]
  100. Wu, X.; Wang, S.; Fu, B.; Feng, X.; Chen, Y. Socio-ecological changes on the loess plateau of China after Grain to Green Program. Sci. Total Environ. 2019, 678, 565–573. [Google Scholar] [CrossRef]
  101. Wang, S.; Hu, M.; Wang, Y.; Xia, B. Dynamics of ecosystem services in response to urbanization across temporal and spatial scales in a mega metropolitan area. Sustain. Cities Soc. 2022, 77, 103561. [Google Scholar] [CrossRef]
  102. Richards, D.R.; Law, A.; Tan, C.S.Y.; Shaikh, S.F.E.A.; Carrasco, L.R.; Jaung, W.; Oh, R.R.Y. Rapid urbanisation in Singapore causes a shift from local provisioning and regulating to cultural ecosystem services use. Ecosyst. Serv. 2020, 46, 101193. [Google Scholar] [CrossRef]
  103. García-Nieto, A.P.; Geijzendorffer, I.R.; Baró, F.; Roche, P.K.; Bondeau, A.; Cramer, W. Impacts of urbanization around Mediterranean cities: Changes in ecosystem service supply. Ecol. Indic. 2018, 91, 589–606. [Google Scholar] [CrossRef] [Green Version]
  104. Jaligot, R.; Kemajou, A.; Chenal, J. Cultural ecosystem services provision in response to urbanization in Cameroon. Land Use Policy 2018, 79, 641–649. [Google Scholar] [CrossRef]
  105. Eigenbrod, F.; Bell, V.A.; Davies, H.N.; Heinemeyer, A.; Armsworth, P.R.; Gaston, K.J. The impact of projected increases in urbanization on ecosystem services. Proc. R. Soc. B-Biol. Sci. 2011, 278, 3201–3208. [Google Scholar] [CrossRef] [Green Version]
  106. Seto, K.C.; Guneralp, B.; Hutyra, L.R. Global forecasts of urban expansion to 2030 and direct impacts on biodiversity and carbon pools. Proc. Natl. Acad. Sci. USA. 2012, 109, 16083–16088. [Google Scholar] [CrossRef] [Green Version]
  107. Estoque, R.C.; Murayama, Y. Landscape pattern and ecosystem service value changes: Implications for environmental sustainability planning for the rapidly urbanizing summer capital of the Philippines. Landsc. Urban Plan. 2013, 116, 60–72. [Google Scholar] [CrossRef]
  108. Tiwari, A.; Tyagi, D.; Sharma, S.K.; Suresh, M.; Jain, K. Multi-criteria decision analysis for identifying potential sites for future urban development in Haridwar, India. In Proceedings of the International Conference on Communications and Cyber Physical Engineering 2018, Hyderabad, India, 24–25 January 2019; Springer: Singapore, 2019; Volume 500, pp. 761–777. [Google Scholar] [CrossRef]
  109. Mitchell, M.G.E.; Schuster, R.; Jacob, A.L.; Hanna, D.E.L.; Dallaire, C.O.; Raudsepp-Hearne, C.; Bennett, E.M.; Lehner, B.; Chan, K.M.A. Identifying key ecosystem service providing areas to inform national-scale conservation planning. Environ. Res. Lett. 2021, 16, 014038. [Google Scholar] [CrossRef]
  110. Gifford, R.; Nilsson, A. Personal and social factors that influence pro-environmental concern and behaviour: A review. Int. J. Psychol. 2014, 49, 141–157. [Google Scholar] [CrossRef]
  111. Mao, D.; He, X.; Wang, Z.; Tian, Y.; Xiang, H.; Yu, H.; Man, W.; Jia, M.; Ren, C.; Zheng, H. Diverse policies leading to contrasting impacts on land cover and ecosystem services in Northeast China. J. Clean. Prod. 2019, 240, 117961. [Google Scholar] [CrossRef]
  112. Zhao, Y.; Wang, M.; Lan, T.; Xu, Z.; Wu, J.; Liu, Q.; Peng, J. Distinguishing the effects of land use policies on ecosystem services and their trade-offs based on multi-scenario simulations. Appl. Geogr. 2023, 151, 102864. [Google Scholar] [CrossRef]
  113. Halperin, S.; Castro, A.J.; Quintas-Soriano, C.; Brandt, J.S. Assessing high quality agricultural lands through the ecosystem services lens: Insights from a rapidly urbanizing agricultural region in the western United States. Agr. Ecosyst. Environ. 2023, 349, 108435. [Google Scholar] [CrossRef]
  114. Liao, S.; Wu, Y.; Wong, S.W.; Shen, L. Provincial perspective analysis on the coordination between urbanization growth and resource environment carrying capacity (RECC) in China. Sci. Total Environ. 2020, 730, 138964. [Google Scholar] [CrossRef] [PubMed]
  115. Yang, M.; Gao, X.; Siddique, K.H.M.; Wu, P.; Zhao, X. Spatiotemporal exploration of ecosystem service, urbanization, and their interactive coercing relationship in the Yellow River Basin over the past 40 years. Sci. Total Environ. 2023, 858, 159757. [Google Scholar] [CrossRef] [PubMed]
  116. Wang, J.; Gao, D.; Shi, W.; Du, J.; Huang, Z.; Liu, B. Spatio-temporal changes in ecosystem service value: Evidence from the economic development of urbanised regions. Technol. Forecast. Soc. 2023, 193, 122626. [Google Scholar] [CrossRef]
  117. Sannigrahi, S.; Zhang, Q.; Pilla, F.; Joshi, P.K.; Basu, B.; Keesstra, S.; Roy, P.S.; Wang, Y.; Sutton, P.C.; Chakraborti, S.; et al. Responses of ecosystem services to natural and anthropogenic forcings: A spatial regression based assessment in the world’s largest mangrove ecosystem. Sci. Total Environ. 2020, 715, 137004. [Google Scholar] [CrossRef]
  118. Andersson, E.; Tengö, M.; McPhearson, T.; Kremer, P. Cultural ecosystem services as a gateway for improving urban sustainability. Ecosyst. Serv. 2015, 12, 165–168. [Google Scholar] [CrossRef]
  119. Yu, X. Is environment ‘a city thing’ in China? Rural–urban differences in environmental attitudes. J. Environ. Psychol. 2014, 38, 39–48. [Google Scholar] [CrossRef]
  120. Kollmuss, A.; Agyeman, J. Mind the Gap: Why do people act environmentally and what are the barriers to pro-environmental behavior? Environ. Educ. Res. 2002, 8, 239–260. [Google Scholar] [CrossRef] [Green Version]
  121. Singh, P. Environmental education: Enhancing learning and awareness through assessment. Syst. Pract. Act. Res. 2012, 26, 299–314. [Google Scholar] [CrossRef]
  122. Guo, J.; Zhang, M. Exploring the patterns and drivers of urban expansion in the Texas triangle megaregion. Land 2021, 10, 1244. [Google Scholar] [CrossRef]
  123. Zhang, S.; Wu, T.; Guo, L.; Zou, H.; Shi, Y. Integrating ecosystem services supply and demand on the Qinghai-Tibetan Plateau using scarcity value assessment. Ecol. Indic. 2023, 147, 109969. [Google Scholar] [CrossRef]
  124. Tian, G.; Qiao, Z. Assessing the impact of the urbanization process on net primary productivity in China in 1989–2000. Environ. Pollut. 2014, 184, 320–326. [Google Scholar] [CrossRef] [PubMed]
  125. Yang, J.; Xie, B.; Zhang, D. Spatial-temporal evolution of ESV and its response to land use change in the Yellow River Basin, China. Sci. Rep. 2022, 12, 13103. [Google Scholar] [CrossRef]
  126. Pan, Y.; Dong, F. Design of energy use rights trading policy from the perspective of energy vulnerability. Energy Policy 2022, 160, 112668. [Google Scholar] [CrossRef]
  127. Zhang, P.; Yuan, H.; Tian, X. Sustainable development in China: Trends, patterns, and determinants of the “Five Modernizations” in Chinese cities. J. Clean. Prod. 2019, 214, 685–695. [Google Scholar] [CrossRef]
  128. Strassburg, B.B.N.; Iribarrem, A.; Beyer, H.L.; Cordeiro, C.L.; Crouzeilles, R.; Jakovac, C.C.; Braga Junqueira, A.; Lacerda, E.; Latawiec, A.E.; Balmford, A.; et al. Author Correction: Global priority areas for ecosystem restoration. Nature 2022, 609, E7. [Google Scholar] [CrossRef]
  129. Sirakaya, A.; Cliquet, A.; Harris, J. Ecosystem services in cities: Towards the international legal protection of ecosystem services in urban environments. Ecosyst. Serv. 2018, 29, 205–212. [Google Scholar] [CrossRef] [Green Version]
  130. Pham, K.T.; Lin, T.-H. Effects of urbanisation on ecosystem service values: A case study of Nha Trang, Vietnam. Land Use Policy 2023, 128, 106599. [Google Scholar] [CrossRef]
  131. Wellmann, T.; Lausch, A.; Andersson, E.; Knapp, S.; Cortinovis, C.; Jache, J.; Scheuer, S.; Kremer, P.; Mascarenhas, A.; Kraemer, R.; et al. Remote sensing in urban planning: Contributions towards ecologically sound policies? Landsc. Urban Plann. 2020, 204, 103921. [Google Scholar] [CrossRef]
  132. Zhang, Z.; Gao, J.; Fan, X.; Lan, Y.; Zhao, M. Response of ecosystem services to socioeconomic development in the Yangtze River Basin, China. Ecol. Indic. 2017, 72, 481–493. [Google Scholar] [CrossRef]
  133. Zhao, Y.; Shi, Y.; Feng, C.-C.; Guo, L. Exploring coordinated development between urbanization and ecosystem services value of sustainable demonstration area in China- take Guizhou Province as an example. Ecol. Indic. 2022, 144, 109444. [Google Scholar] [CrossRef]
  134. Wang, H.; Liu, L.; Yin, L.; Shen, J.; Li, S. Exploring the complex relationships and drivers of ecosystem services across different geomorphological types in the Beijing-Tianjin-Hebei region, China (2000–2018). Ecol. Indic. 2021, 121, 107116. [Google Scholar] [CrossRef]
  135. Chen, M.; Liu, W.; Lu, D.; Chen, H.; Ye, C. Progress of China’s new-type urbanization construction since 2014: A preliminary assessment. Cities 2018, 78, 180–193. [Google Scholar] [CrossRef]
Figure 1. Study area. (a) Location of YRB in China; (b) changes in total population, urban population, and GDP in the YRB from 2000 to 2020; (c) land use types in 2020; (d) elevation; (e) population density in 2020.
Land 12 01301 g001
Figure 2. Transfer flows of different land use types in the YRB from 1990 to 2020 (A: Farmland; B: Forest; C: Grassland; D: Water Body; E: Construction Land; F: Unused Land).
Land 12 01301 g002
Figure 3. Spatio-temporal pattern of ESV in the YRB from 1990 to 2020.
Land 12 01301 g003
Figure 4. Spatio-temporal pattern of UL in the YRB from 2000 to 2020.
Land 12 01301 g004
Figure 5. Bivariate LISA cluster map between ESV and UL in the YRB.
Land 12 01301 g005
Figure 6. (ap) Spatial distribution of regression coefficients between urbanization indicators and ESV in the YRB in 2000 and 2020.
Land 12 01301 g006
Figure 7. The impact mechanism of urbanization on ESV. “+” and “−” represent the positive and negative impacts of urbanization on ESV, with some examples.
Land 12 01301 g007
Table 1. ESV per unit area of different land use types in the YRB (CNY·ha·a−1).
FarmlandForestGrasslandWater BodyUnused Land
Provision service value (PSV)2895.46894.81645.591541.43124.98
Regulation service value (RSV)8019.6229,578.912,289.8283,310.421083.17
Support service value (SSV)5186.7217,768.168561.229915.171187.32
Cultural service value (CSV)354.114332.681812.239508.99499.93
Ecosystem service Value (ESV)16,455.8558,574.5424,308.86104,276.012895.4
Table 2. Indicator system of comprehensive urbanization level.
SystemIndicatorIndicator Meaning
Demographic urbanization level (DUL)Total population (TP) (person)Reflecting the total demographic size of the region, as the population basis of urbanization.
Proportion of urban population in total population (UPP) (%)Reflecting the degree of demographic agglomeration in urban areas, as a key measure of the urbanization process.
Landscape urbanization level (LUL)Proportion of construction land in total land area (CLP) (%)Reflecting the expansion of urban land, as a direct spatial expression of urbanization.
Economic urbanization level (EUL)GDP per capita (PGDP) (CNY)Reflecting the level of regional economic development, as the economic basis of urbanization.
Proportion of secondary and tertiary industries in GDP (STIP) (%)Reflecting the structure of the regional economy, as the driving force for urbanization in the non-agricultural sectors.
Social urbanization level (SUL)Number of people with high school education and above (HSE)Reflecting the level of regional education services and the quality of human resources, as a key driving force for urbanization quality.
Per capita living space (LS) (m2)Reflecting the quality of life of regional residents, as a typical expression of urbanization to enhance the well-being of residents.
Innovative urbanization level (IUL)Number of domestic patent applications authorized (DPP)Reflecting the level of regional science and technology innovation, as the endogenous driving force of urbanization.
Table 3. Data description.
DataIndicatorSourceDescription
Vector rangesUL (CLP)Resources and Environmental Science Data Center of the Chinese Academy of Sciences (http://www.resdc.cn, accessed on 25 February 2022.)The data of 1990, 2000, and 2010 are integrated according to the adjustment of administrative divisions, based on the county-level administrative regions of the YRB in 2020.
Land use dataESV (PSV, RSV, SSV, CSV)Resources and Environmental Science Data Center of the Chinese Academy of Sciences (http://www.resdc.cn, accessed on 25 February 2022.)The spatial resolution is 30 m, and the reclassification is made according to 6 primary land classes of cultivated land, forest, grassland, water bodies, construction land, and unused land.
Grain dataESV (PSV, RSV, SSV, CSV)Provincial statistical yearbooks in YRB
Yearbook of China Agricultural Product Price Survey (1990~2021)
Containing data on grain production, sown area, and grain prices, used for ESV calculations.
Demographic dataUL (TP, UPP, PGDP)China Census by County (2000, 2010, and 2020)Both total population and urban population used in the study refer to the resident population of the county.
Patent dataUL (DPP)Statistical Annual Report of the State Intellectual Property Office of China (2000, 2010, and 2020)The number of patent applications accepted in China covers invention patents, utility model patents, and design patents applied for in China.
Other socioeconomic dataUL (PGDP, STIP, HSE, LS)Provincial statistical yearbooks in YRB
China County Statistical Yearbook (2001, 2011, and 2021)
Including GDP, education, housing, and other data.
Table 4. Estimation parameters of OLS model.
Year20002020
VariableCoefficientp-valuet-valueVIFCoefficientp-valuet-valueVIF
TP−0.17 ***0.00−3.412.27−0.140.17−1.388.20
UPP−0.15 *0.05−1.971.870.020.620.492.82
CLP−0.26 ***0.00−3.262.24−0.28 ***0.00−4.982.56
PGDP0.060.390.861.340.14 ***0.003.231.54
STIP−0.06 **0.02−2.301.09−0.19 ***0.00−5.601.30
HSE0.100.261.124.410.060.710.3713.17
LS−0.19 ***0.00−4.631.22−0.14 ***0.00−3.671.40
DPP0.040.680.421.670.160.061.883.82
Note: *** indicates significance at the 1% level, ** indicates 5%, * indicates 10%.
Table 5. Model performance comparisons between GWR and OLS.
Year20002020
AICcR2R2 AdjustedAICcR2R2 Adjusted
OLS model−581.470.250.23−667.930.280.26
GWR model−727.460.610.54−871.880.660.61
Table 6. Summary of the estimates of GWR model.
Year20002020
DimensionVariableMeanMaxMinMedianMeanMaxMinMedian
DULTP−0.160.10−1.10−0.05−0.210.17−0.97−0.08
UPP−0.050.22−0.26−0.02−0.010.23−0.08−0.02
LULCLP−0.59−0.15−3.10−0.29−0.26−0.12−1.06−0.18
EULPGDP0.080.99−0.190.000.100.20−0.020.10
STIP−0.060.00−0.21−0.03−0.060.01−0.38−0.02
SULHSE0.140.79−0.080.060.211.19−0.150.07
LS−0.080.08−0.38−0.06−0.070.33−0.39−0.06
IULDPP0.060.75−0.340.090.080.36−0.010.06
Disclaimer/Publisher’s Note: The statements, opinions and data contained in all publications are solely those of the individual author(s) and contributor(s) and not of MDPI and/or the editor(s). MDPI and/or the editor(s) disclaim responsibility for any injury to people or property resulting from any ideas, methods, instructions or products referred to in the content.

