Article

The Influence Mechanism of Farmer Behavior on the Spatial Pattern Evolution of Agricultural Production in the Yanhe River Basin

1
School of Architecture, Chang’an University, Xi’an 710061, China
2
Engineering Research Center of Collaborative Planning of Low-Carbon Urban Space and Transportation, Universities of Shaanxi Province, Xi’an 710061, China
3
Xi’an Urban Planning and Design Institute, Xi’an 710082, China
*
Author to whom correspondence should be addressed.
Land 2023, 12(7), 1281; https://doi.org/10.3390/land12071281
Submission received: 3 May 2023 / Revised: 20 June 2023 / Accepted: 21 June 2023 / Published: 24 June 2023

Abstract

:
Featuring complex and fractured terrain, the Loess hilly and gully regions suffer poor grain production capacity. The behavior of farmers, the major users of agricultural production space, significantly influences the agricultural production space. Hence, it is essential to explore the evolution rules of the agricultural production space under the influence of farmer behavior and reveal the influencing mechanism of agricultural production space change, which will facilitate the promotion of ecological protection and high-quality development of the Yellow River Basin. Relying on six-stage remote sensing images of the Yanhe River Basin from 1995 to 2018, this study utilized a land use dynamic index, transfer matrix and landscape pattern index to analyze the spatial pattern evolution of agricultural production in the Yanhe River Basin. Furthermore, the geographic detector model was applied to quantitatively analyze the influencing factors of the spatial pattern evolution of agricultural production. The results demonstrated the following: (1) From 1995 to 2018, the overall area of cultivated land in the Yanhe River Basin decreased by 927.02 km2, with a change degree of 21.07%. The spatial structure of agricultural production changed, mainly transferring the cultivated land to woodland and grassland. (2) The spatial form of agricultural production has changed from fragmentation to regularity, and the complexity of the production space shows a trend of first increasing and then decreasing. (3) The evolution of the spatial pattern of agricultural production was affected by multiple factors of farmer behavior, where significant interactive enhancement effects existed. Specifically, labor input was the dominant factor affecting the overall scale of the production space, with an influence value of 0.202; fertilization input and cultivated land transfer were the key factors affecting the spatial distribution of production, with influence values of 0.264 and 0.242, respectively; income level and social interaction were the base factors affecting the spatial form of production, with influence values of 0.558 and 0.438, respectively. The research results provide scientific support for the improvement of agricultural production quality and the spatial evolution mechanism of agricultural production in the Yanhe River Basin.

1. Introduction

Consisting of the most typical landform category of the Loess plateau, the Loess hilly and gully regions suffer severe vegetation degradation due to the long-term unreasonable exploitation of resources, as well as serious soil and water loss, significant decline in land productivity, and a fragile ecological environment [1,2]. As the main carrier and vital position of agricultural development, production space is also the basis for ensuring food security and achieving high-quality development [3]. Since 1999 when the large-scale project of returning cultivated land to woodland and grassland was launched, the ecological environment in this area has greatly improved, but the grain production level remains low and unstable [4,5]. On the one hand, due to the scattered distribution of the fragmented cultivated land operated by farmers, it is difficult to achieve scale management. Moreover, few farmers are willing to input long-term investment in cultivated land, which leads to new conflicts between people and land. On the other hand, young villagers have obtained real benefits in the urbanization process through land use conversion. Consequently, the elderly in the basin have become the main force of food production, making it difficult to enhance the management level of cultivated land [6]. As the key behavior subjects of rural production space, farmers are highly influential in rural development. Their activities indeed change the structure, morphology, and function of agricultural production space. Therefore, it is crucial to promote the ecological protection and high-quality development of the Yellow River Basin by exploring the influencing direction of farmer behaviors on the evolution of agricultural production space and revealing the mechanism of different farmer behaviors on production space. The Yanhe River Basin is located in the middle reaches of the Yellow River Basin and is a primary tributary of the Yellow River. In the Loess hilly and gully regions with complex terrain, the Yanhe River Basin is a typical loess hilly and gully geomorphic unit, and the terrain is highly fragmented. The overall scale and morphological structure of the rural agricultural production space are experiencing huge changes during the critical period of transforming traditional rural agriculture to modern agriculture. As the policy operators, individual farmer behavior is not sufficient to reveal the production space mechanisms [7]. Hence, farmers’ behaviors are diverse and complex, and their effects on the scale, structure, and morphology of agricultural production space need to be revealed during the complex changes.
There have been several domestic and foreign studies on agricultural production space, including the spatial morphology of core elements of rural human-land systems [8,9], typical models [10,11], evolution processes [12,13], and dynamic factors [14]. The research results on agricultural production space are relatively mature, and the main line of research predominantly includes the spatial scale, spatial layout, and production function of cultivated land [15]. In terms of scale and layout, some scholars have studied production space elements such as cultivated land [16] and woodland [17], and explored the spatial and temporal characteristics of rural land use structure by analyzing the morphological characteristics of cultivated land [18,19]. In terms of the spatial function of agricultural production, Qiao et al. [20] constructed an evaluation method system of land spatial function at the city and county scales, and quantitatively identified the spatial function of rural areas. Playing a dominant role in promoting the socioeconomic development of the river basins, farmers’ behaviors determine whether production space and factor resources can be rationally utilized [21,22]. Li et al. [23] studied the spatial distribution features and influencing factors of farmers’ agricultural production from the perspective of farmers. Wang et al. [24] conducted an in-depth study on the reconstruction mechanism of farmers’ behaviors and rural transformation. Liu et al. [25] analyzed the bonding mechanism between farmers’ land use behavior and agricultural spatial distribution. In terms of farmers’ land management behavior, traditional small farmers gradually realize large-scale agricultural production and management through land transfer and other methods to improve the utilization efficiency of land resources [26]; from the perspective of production factor input behavior, farmers’ input in production technology and labor input have an important impact on large-scale agricultural production [27]; at the same time, the change in farmers’ utilization of information and other factors will also lead to the transformation of rural production organization mode [28]. Farmers’ land management behaviors, input behaviors, and resource utilization behaviors have different degrees of influence on the quantity allocation and spatial distribution of agricultural production space. However, most of the above studies are aimed at a certain behavior of farmers, and do not comprehensively study the impact of all the behavior processes of farmers’ agricultural production on agricultural production space.
Regarding research methods, RS and GIS evaluation techniques have been employed to research rural spatial layout and resilience [29,30]. Methods such as the Landscape pattern index [31], transfer matrix [32], and dynamic attitude model [33] are most extensively utilized to explore the spatial and temporal evolution features and influencing mechanisms of ‘scale–structure–function’ of production–ecology–living space. The data on the agricultural production space and farmers’ behavior were statistically analyzed, and the influences of farmers’ behavior on the evolution of agricultural production space patterns were analyzed by constructing econometric models. One empirical study comprehensively adopted a logistic regression model [34] to quantitatively analyze the influence of different types of farmers’ variation and production behaviors on the agricultural production space system [35,36]. The above model is limited to the statistical analysis of the quantitative relationship between the indicators and cannot explore the driving factors that affect the geographical spatial distribution. Compared with other econometric models, the geographical detector model can fully study the interaction between spatial geographical features and their potential driving factors [37,38]. Farmers’ behaviors have more abundant indicators. The interactions between different farmers’ behaviors were measured using the geographical detector model, and the influencing mechanisms of different farmers’ behaviors on the agricultural production space were revealed, thus enriching the existing research.
Therefore, taking the agricultural production space of the Yanhe River Basin as the study object, according to the six periods of land use data of the Yanhe River Basin in 1995, 2000, 2005, 2010, 2015, and 2018, and combined with mathematical models such as spatial analysis function and geographic detector, this study explored the spatial and temporal characteristics, evolution rules, and influencing factors of the agricultural production space from the perspective of farmer behaviors, revealing the influencing mechanisms of farmer behaviors on the evolution of the spatial patterns of rural agricultural production in the river basin. Furthermore, this study offers references for the rational layout of a rural agricultural production space and the relevant decision-making optimization, so as to lay a solid foundation for enriching the research theory and method systems of rural development.

2. Study Area and Data Sources
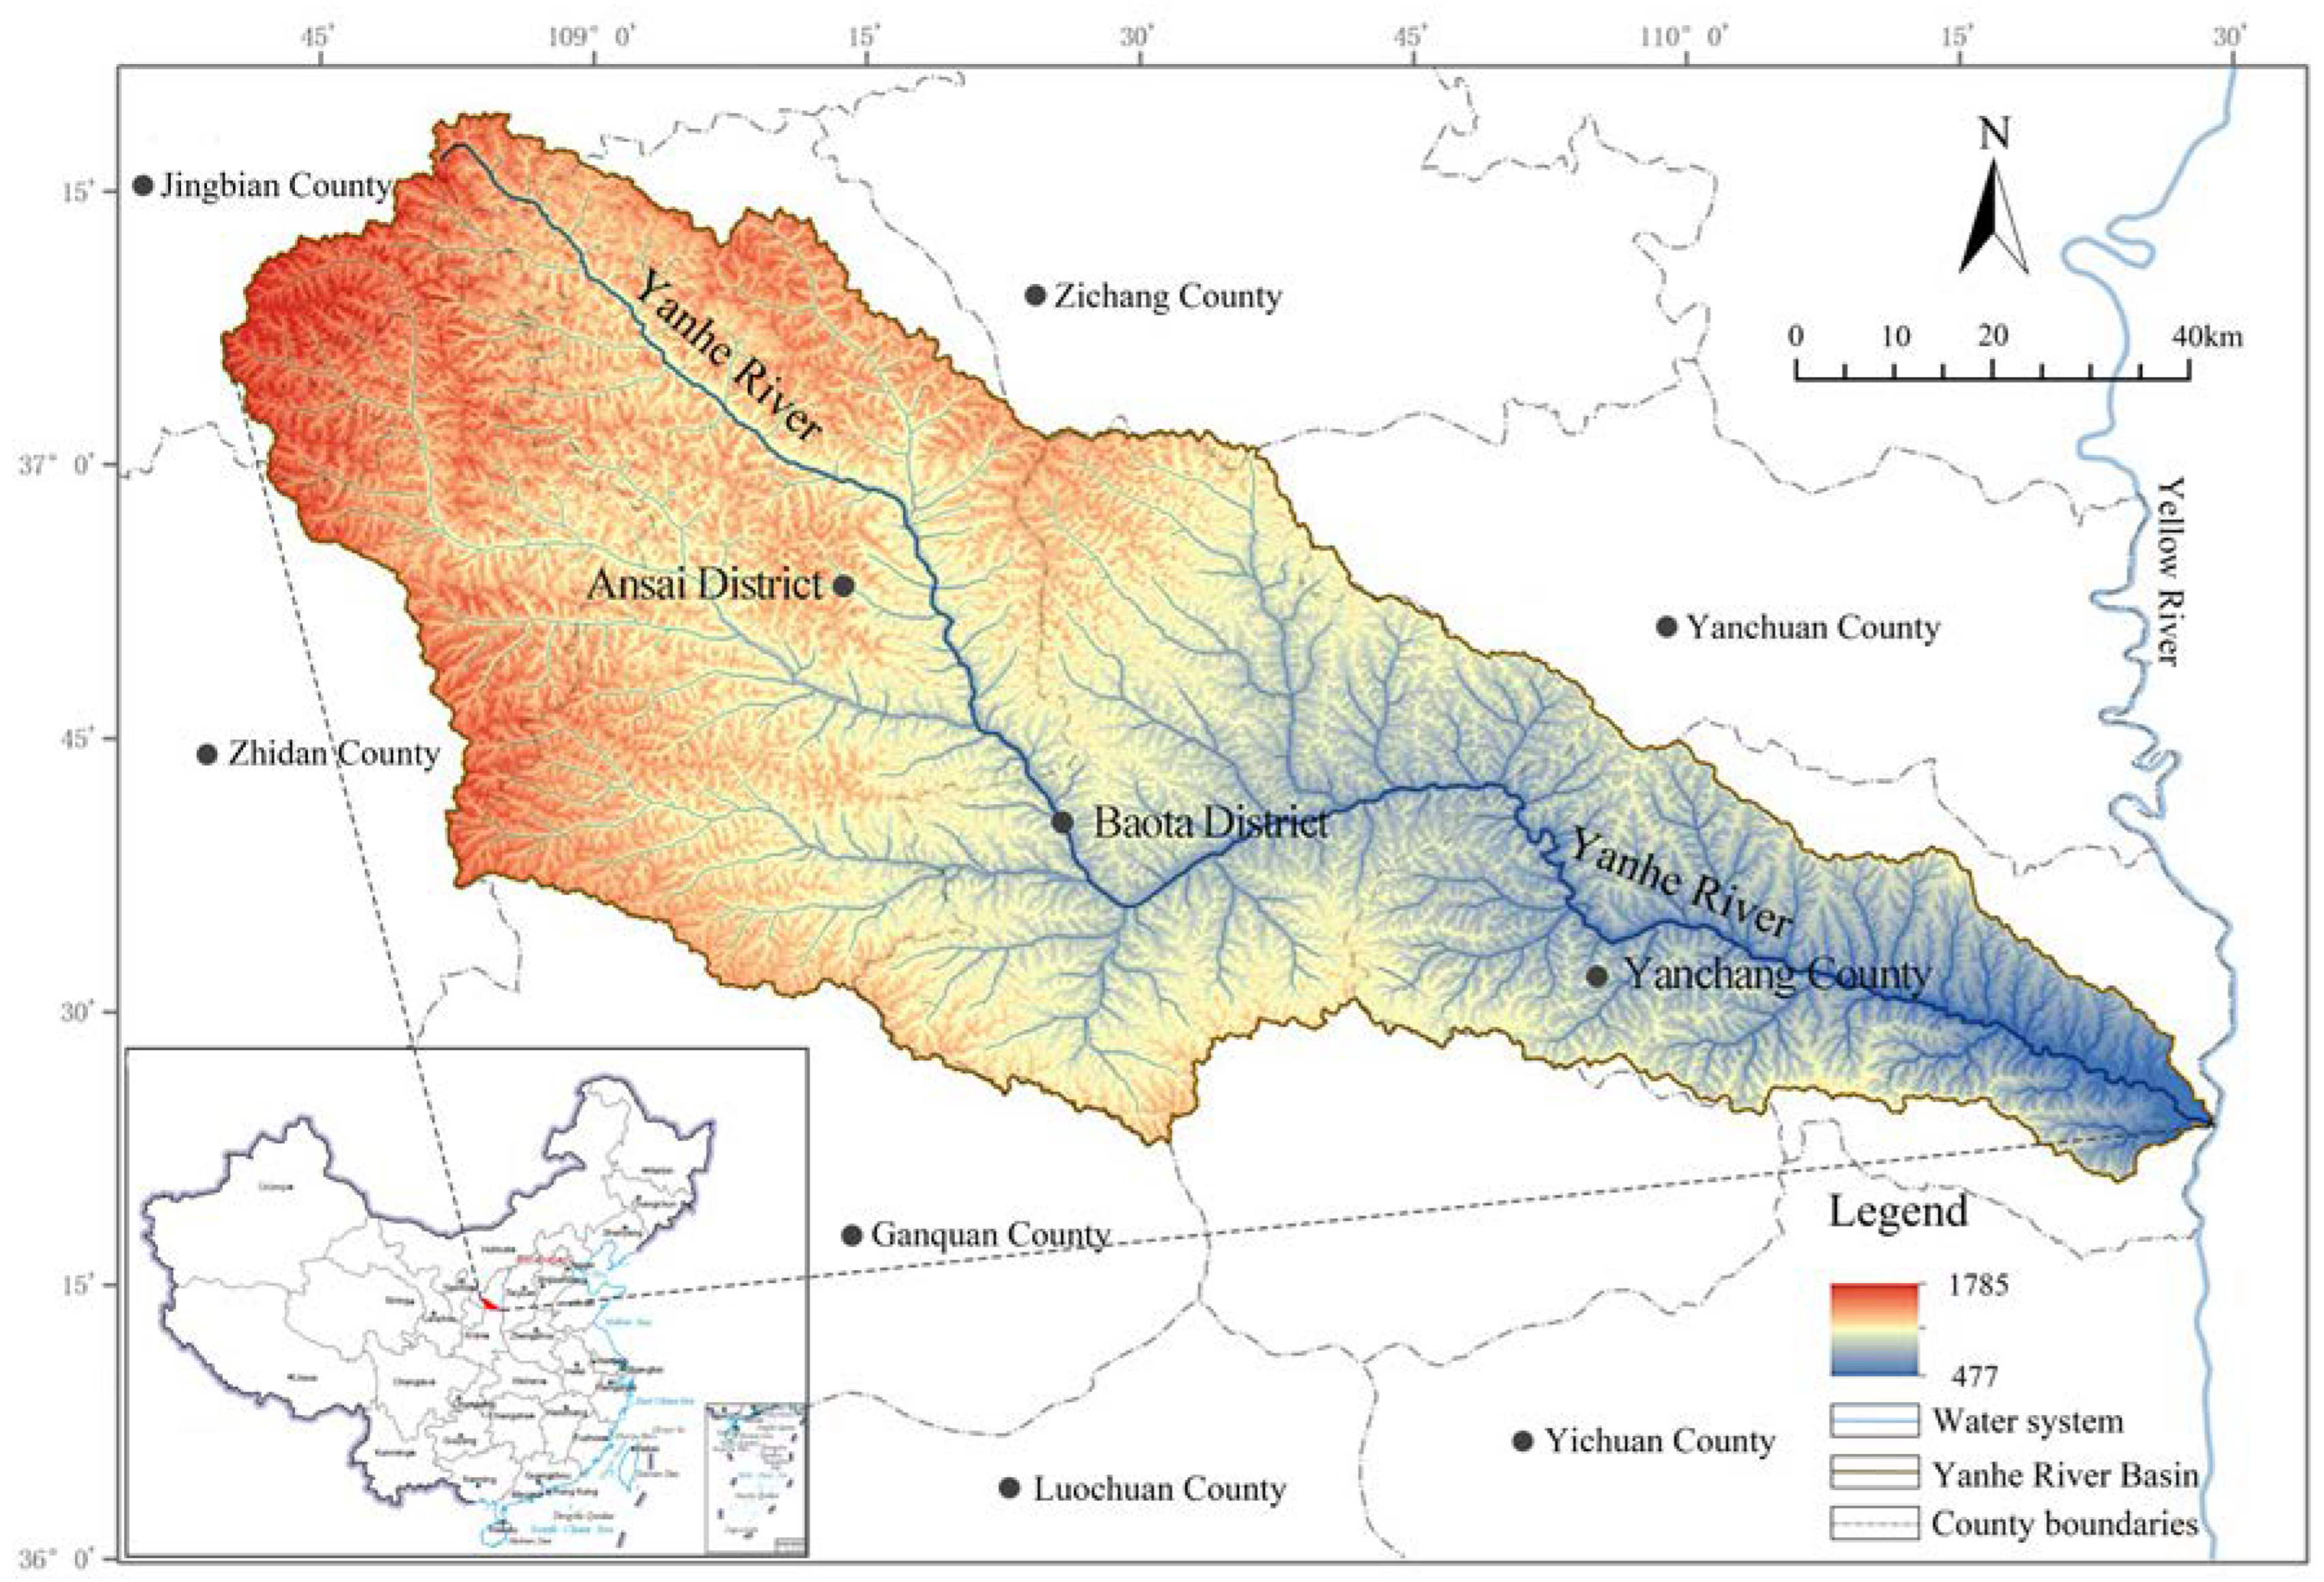
2.1. Study Area

As a typical basin in the Loess hilly and gully regions, the Yanhe River Basin (36°27′–37°58′ N,104°41′–110°29′ E) is high in the northwest and low in the southeast, with complex and fragmented terrain. Originating from Tianciwan Village, Jingbian County, the Yanhe River Basin merges into the Yellow River at Liangshui’an Village, Yanchang County (Figure 1), with a total length of 286.9 km and a basin area of 7725 km2. The Yanhe River flows through seven districts and counties, 10 street offices, and 43 towns, which accounts for 1026 administrative villages in total. In 2018, the rural population along the Yanhe River Basin was 647,300, with a population density of 83.79 people/km2. Cultivated land occupies a dominant position in the agriculture of the Yanhe River Basin. Cultivated land refers to the land dedicated to planting crops. The Yanhe River Basin is located in the Loess hilly and gully region; therefore, the proportion of paddy fields is very small. Thus, this study defines cultivated land as dry land in the LUCC (land use/land cover change) land use classification. The planting types of crops in the Yanhe River Basin mainly include grain and commercial crops. Recently, agriculture in the basin has been developing rapidly, forming an industrial structure featuring pollution-free apples, greenhouse vegetables, and minor grain crops.

2.2. Data Sources

The data adopted in the study mainly contained six periods of land use data on the Yanhe River Basin in 1995, 2000, 2005, 2010, 2015, and 2018, DEM data on the Yanhe River Basin, and relevant farmer data. Specifically, the six periods of land use data on the Yanhe River Basin in 1995, 2000, 2005, 2010, 2015, and 2018 were acquired from the resource and environmental data cloud platform of the Chinese Academy of Sciences. Generated through manual visual interpretation, the spatial resolution was 30 m, with a comprehensive accuracy of over 90%, which was the remote sensing monitoring data product with higher precision for land use in China. The classification of land use data used in this paper refers to the secondary classification system of China’s land use/land cover data. The first level includes six types of cultivated land, woodland, grassland, water area, construction land, and unused land. The second level is divided into 25 types according to the natural attributes of the land. The land use data on the Yanhe River Basin were reclassified by GIS, and the land use data on the Yanhe River Basin were obtained using cutting tools, which mainly included 16 types of dry land, closed forest land, shrub land, sparse woodland, other woodland, lake, etc. derived from a geospatial data cloud, 2018 DEM data applied from a digital elevation data product with a spatial resolution of 30 m, which could precisely reflect the topographic characteristics of the study area. Originating from 1:1,000,000 soil data provided by the Nanjing Soil Institute in the second National Land Survey, the soil data and soil texture data were presented in grid format with WGS84 projection, as well as the main soil classification system of FAO-90.
The relevant data on farmer behavior were obtained through questionnaires and field visits. Additionally, the main contents were obtained in four major items and 12 minor items, including farmer family characteristics, farmer land management behavior, farmer production input behavior, and farmer resource utilization behavior. In the field investigation stage, the people’s governments of the town and the villagers’ committee were interviewed. The respondents were village cadres who were familiar with the village situation, such as the secretary of the village branch, the village head, and the accountant. In total, 70 villages were investigated, and the participatory farmer survey method (PRA) was used to interview the farmers. There were 316 questionnaires distributed; 309 valid questionnaires were collected. To ensure the feasibility of the questionnaire, SPSS22.0 was also utilized to conduct statistical analysis and verification of the questionnaire data, concluding a Cronbach’s α coefficient of 0.809 > 0.8. As the validity test of indicator variables revealed, the KMO result was 0.714 > 0.5, and the Bartlett’s spherical test result was sig < 0.001, confirming the high credibility of the questionnaire data.

3. Research Methods

As shown in Figure 2, this study proposed the research framework of “data collection–feature exploration–mechanism revelation” and adopted specific research contents.
Based on the research data, the change in cultivated land quantity in the Yanhe River Basin was determined using the dynamic change index of land use. In order to explore the spatial distribution of land use types over the whole study period, spatial overlay was conducted based on the spatial information of land use in the Yanhe River Basin at the beginning (1995) and the end (2018) of the study period, and the spatial structure transfer relationship of cultivated land was analyzed via the land use transfer matrix. By analyzing the landscape pattern index, this study implemented spatial statistics of the rural agricultural production patch morphology index in the Yanhe River Basin. Eventually, the influencing mechanism of various farmer behaviors on the production space was revealed through the geographical detector model.

3.1. Analysis Method of the Spatial Characteristics of Agricultural Production

3.1.1. Dynamic Degree Index of Land Use Change

The dynamic degree index of land use change refers to the change amplitude of land use types in the aspect of area, which reflects the speed and intensity of various land use changes in different periods [39]. The single dynamic degree index of land use change reflects the quantity change of a certain land use type within a certain period in the Yanhe River Basin; its detailed calculation formula is as follows:
K = L a L b L a × 100 %
where K refers to the dynamic degree index of the cultivated land area change, La denotes the initial cultivated land area, Lb represents the cultivated land area at the end of the study period, and N means the study period.

3.1.2. Land Use Transfer Matrix

A land use transfer matrix was employed to analyze the quantity and structure changes of rural production space land in the Yanhe River Basin, and the ArcGIS overlay function was also applied to study the spatial position changes of land use conversion. The transfer matrix reflected the area changes, structural characteristics, and changing directions of various land use types at the beginning and end of a period in a certain region [40]; its mathematical form is as follows:
S ij = S 11 S 12 S 1 n S 21 S 22 S 2 n S n 1 S n 2 S nn
where S refers to the land area, n represents the quantity of each land use type, and i and j denote land use types at the beginning and end of the study period, respectively. ArcGIS10.2 software was utilized in this study to conduct spatial overlay, area tabulation, and summarize the land use type data, so as to obtain the transfer matrix of land use type areas at different stages in the Yanhe River Basin.

3.1.3. Landscape Pattern Index Method

The landscape index [41] refers to a simple quantitative indicator that highly concentrates landscape pattern information and reflects certain aspects of its structural composition and spatial configuration characteristics. We selected six indicators to analyze the spatial morphological changes in agricultural production in the Yanhe River Basin. These indices cover three aspects of patch complexity: area, shape, and diversity [42]. Among them, the area index selects the average patch size (MPS) and the number of patches (NP) to comprehensively measure the scale of cultivated land and the degree of patch fragmentation. The shape index selects the perimeter area fractal dimension (PAFRAC), the mean shape index (MSI), and the aggregation index (AI) to express the complexity of cultivated land morphology. Under the same patch area, the more complex the shape boundary, the higher the degree of fragmentation. We selected the Shannon diversity index (SHDI) to evaluate patch diversity. Fragstats4.2 software was used for spatial statistics, and principal component analysis was used to measure the spatial and temporal characteristics of landscape fragmentation in the Yanhe River Basin [43,44]. The shown in Table 1.

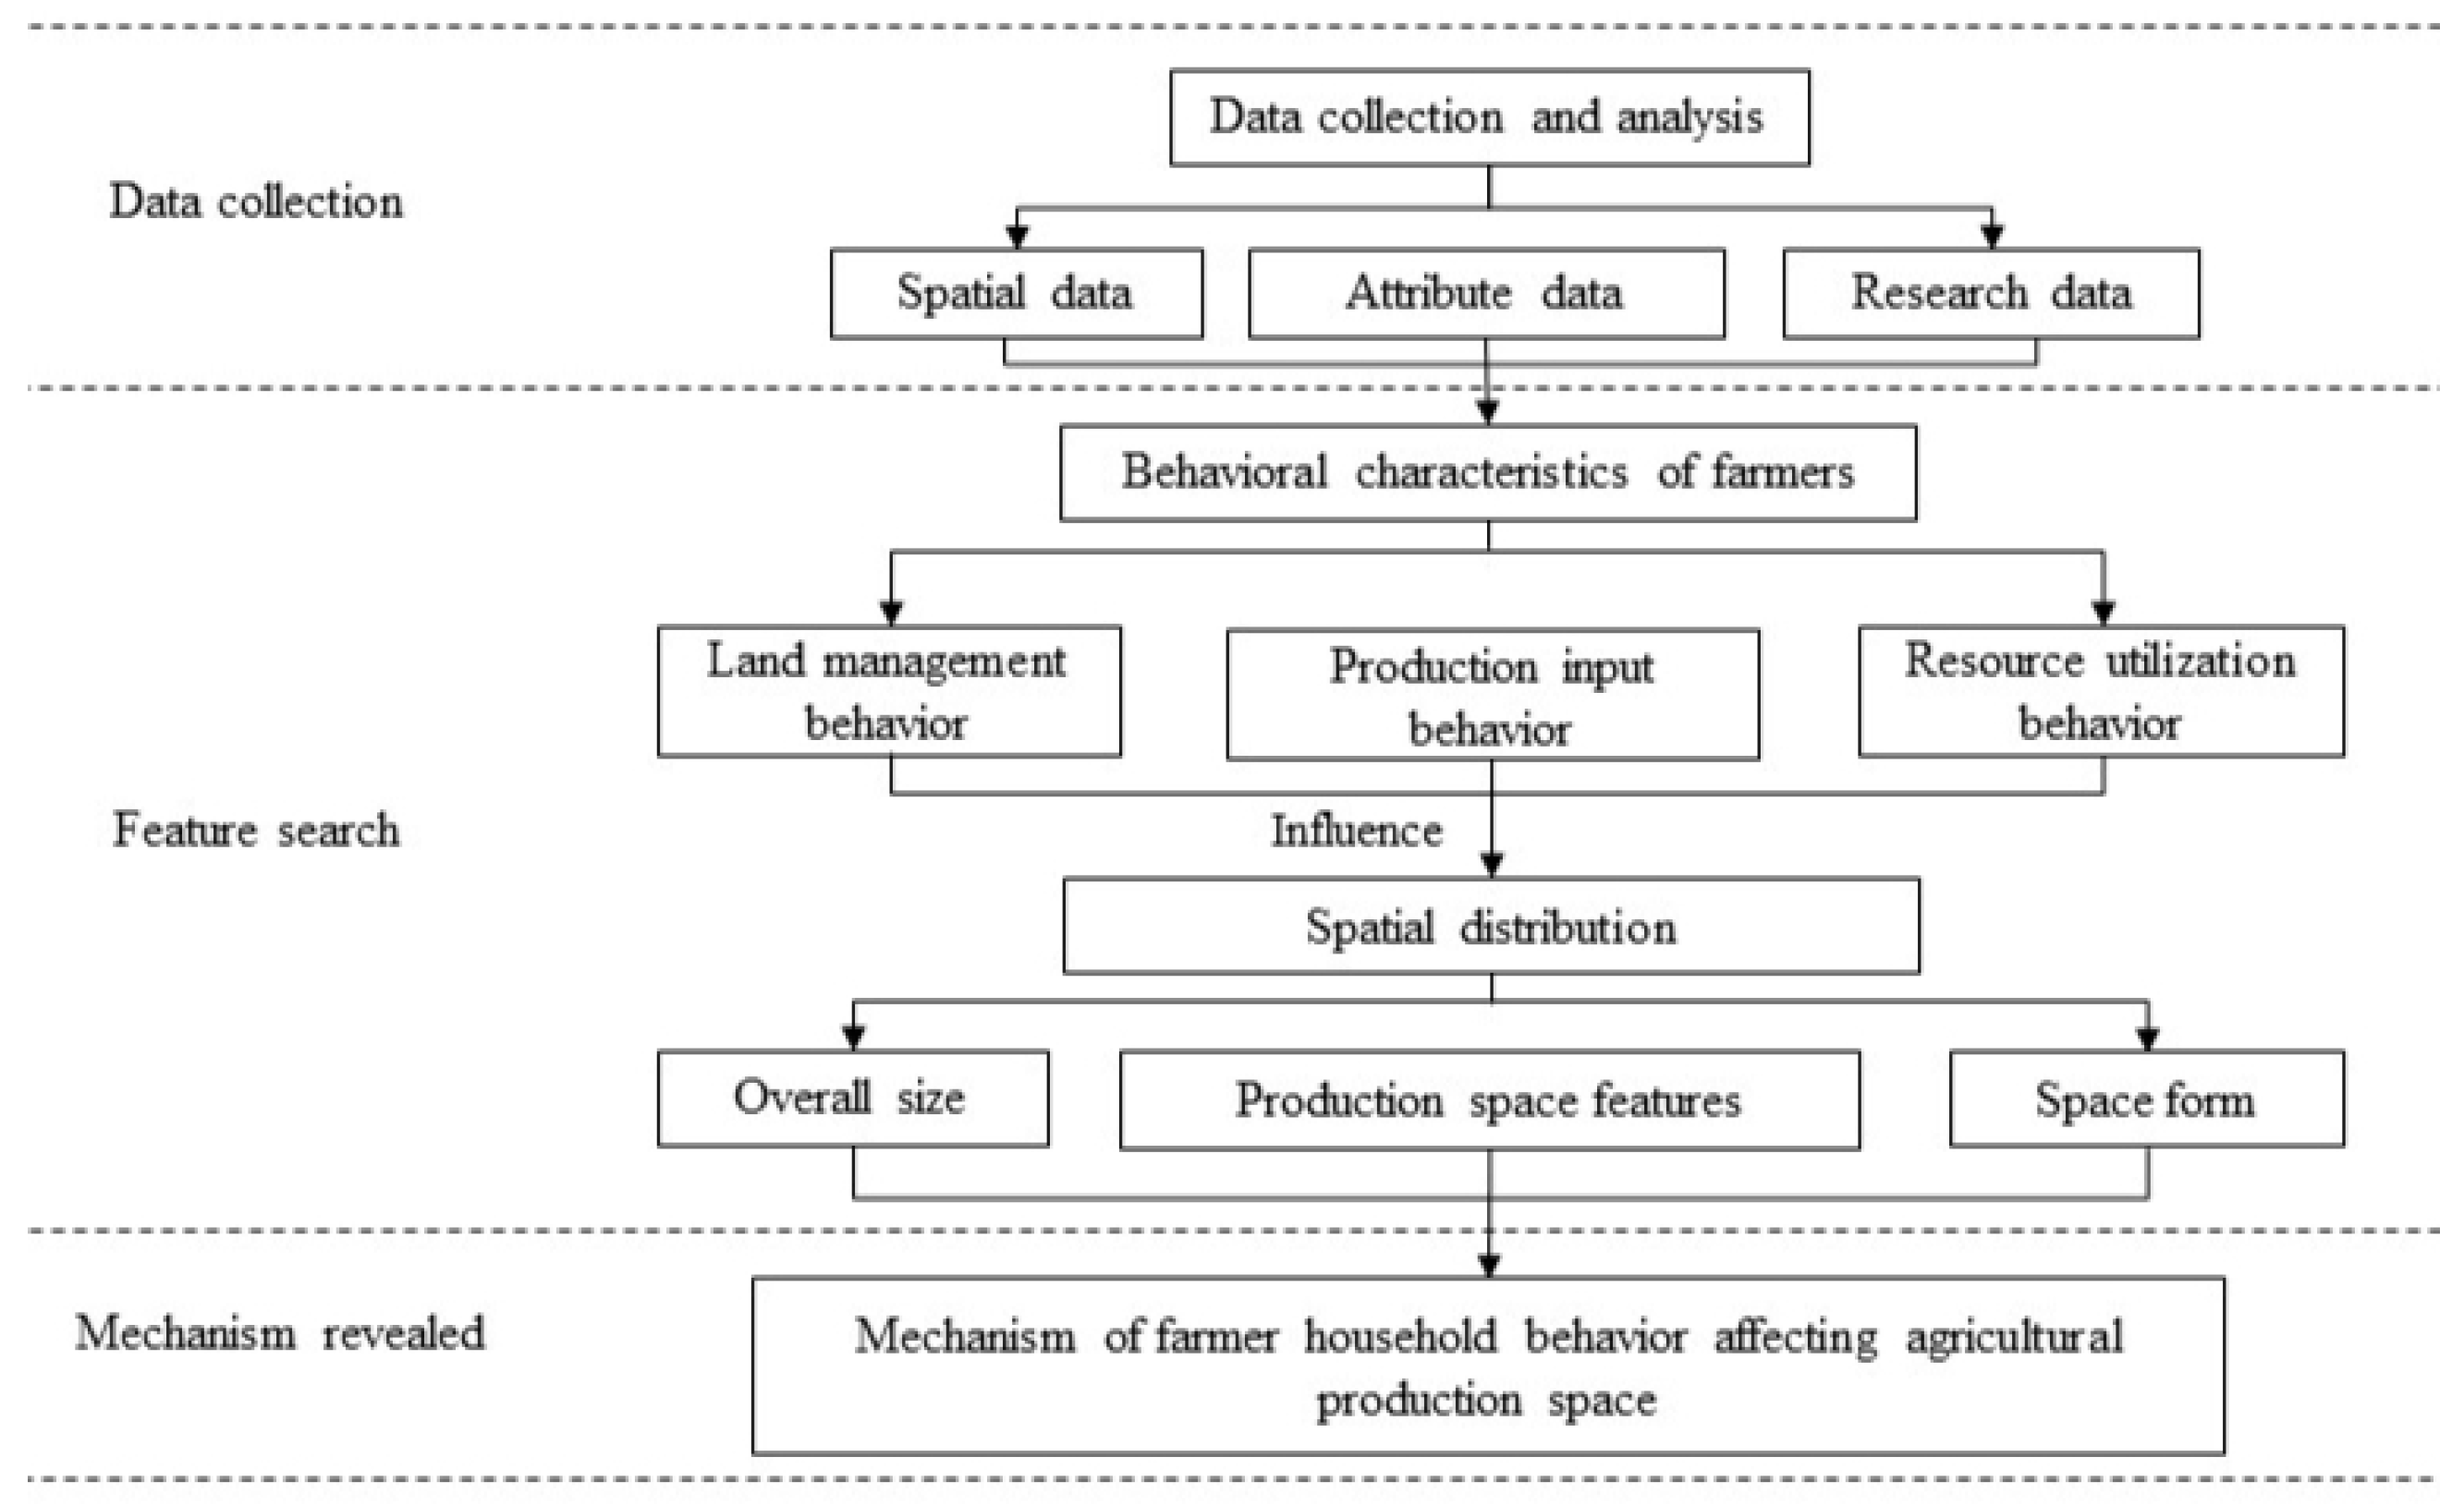
3.2. The Influence Mechanism of Farmers’ Behavior on Agricultural Production Space

Geographic Detector

The geographic detector is a group of statistical methods for detecting spatial differentiation and revealing hidden driving forces [36]. Based on the factor detection module of the geographic detector model, this study explored the influencing factors of farmer behaviors on the spatial change in agricultural production in the Yanhe River Basin. It was assumed that it could detect the contribution rate of each factor to the model and extract practical spatial association rules from a huge spatial database [45]. The specific calculation formula was as follows:
q = 1 1 N σ 2 i = 1 L N i σ i 2
where q stands for the spatial differentiation features within the range of 0–1; the bigger the q is, the stronger the heterogeneity of spatial distribution will be. N denotes the study sample number; σ i 2 means variance of index; i refers to the sub-region; and L is the sub-region quantity.
Factor interaction detection was utilized to identify whether the combined effect of each driving factor enhanced or weakened the explanatory ability of spatial differentiation characteristics of the study area [15]. The specific statistical method is to first collect the q value of the single effect of each factor, and then calculate and compare the q value of the pair interaction of each factor. The interaction results of various driving factors can be classified into the five categories shown in Table 2.

4. Results

4.1. Results of Spatial Pattern Evolution of Agricultural Production

4.1.1. Overall Scale Characteristic Results

As Figure 3 reveals, the cultivated land in the Yanhe River Basin is mainly dry land. In 1995, the cultivated land was mainly distributed in the upper reaches of the Yanhe River Basin. After 2010, the regional cultivated land was gradually evenly distributed in the middle and lower reaches of the Yanhe River Basin; woodland and grassland increased significantly, which were mainly influenced by the two major policies of “Great Western Development” and the ecological restoration project of “returning farmland to woodland and grassland”, implemented by the country in 2000.
According to Table 3, from 1995 to 2018, the rural agricultural production space area of the Yanhe River Basin presented a fluctuant decreasing trend, from 3330.07 km2 to 2403.05 km2, decreasing the cultivated land area by 927.02 km2. From 2005 to 2010, the cultivated land area sharply decreased by 651.93 km2, from 3094.37 km2 to 2442.39 km2, with a change degree of 21.07%. Simultaneously, the cultivated land area of rural land use in the Yanhe River Basin reduced, attributed to the farmers’ conversion from traditional grain planting to commercial crop planting, supplemented by food crops, and the emergence of moderate-scale management modes. With the gradual diversification of farmers’ planting crops, the channels of agricultural production have gradually broadened, the agricultural planting structure has changed, and traditional food crops have shifted to a planting structure dominated by cash crops and supplemented by food crops. In the adjustment of agricultural structure, a large amount of agricultural land has been converted to planting orchards or cultivating the water surface, resulting in a decrease in cultivated land area. In the adjustment of planting structure, the blind adjustment of farmers’ planting structures is not conducive to the maintenance of cultivated land, which can easily lead to a decline in cultivated land quality and the loss of cultivated land.

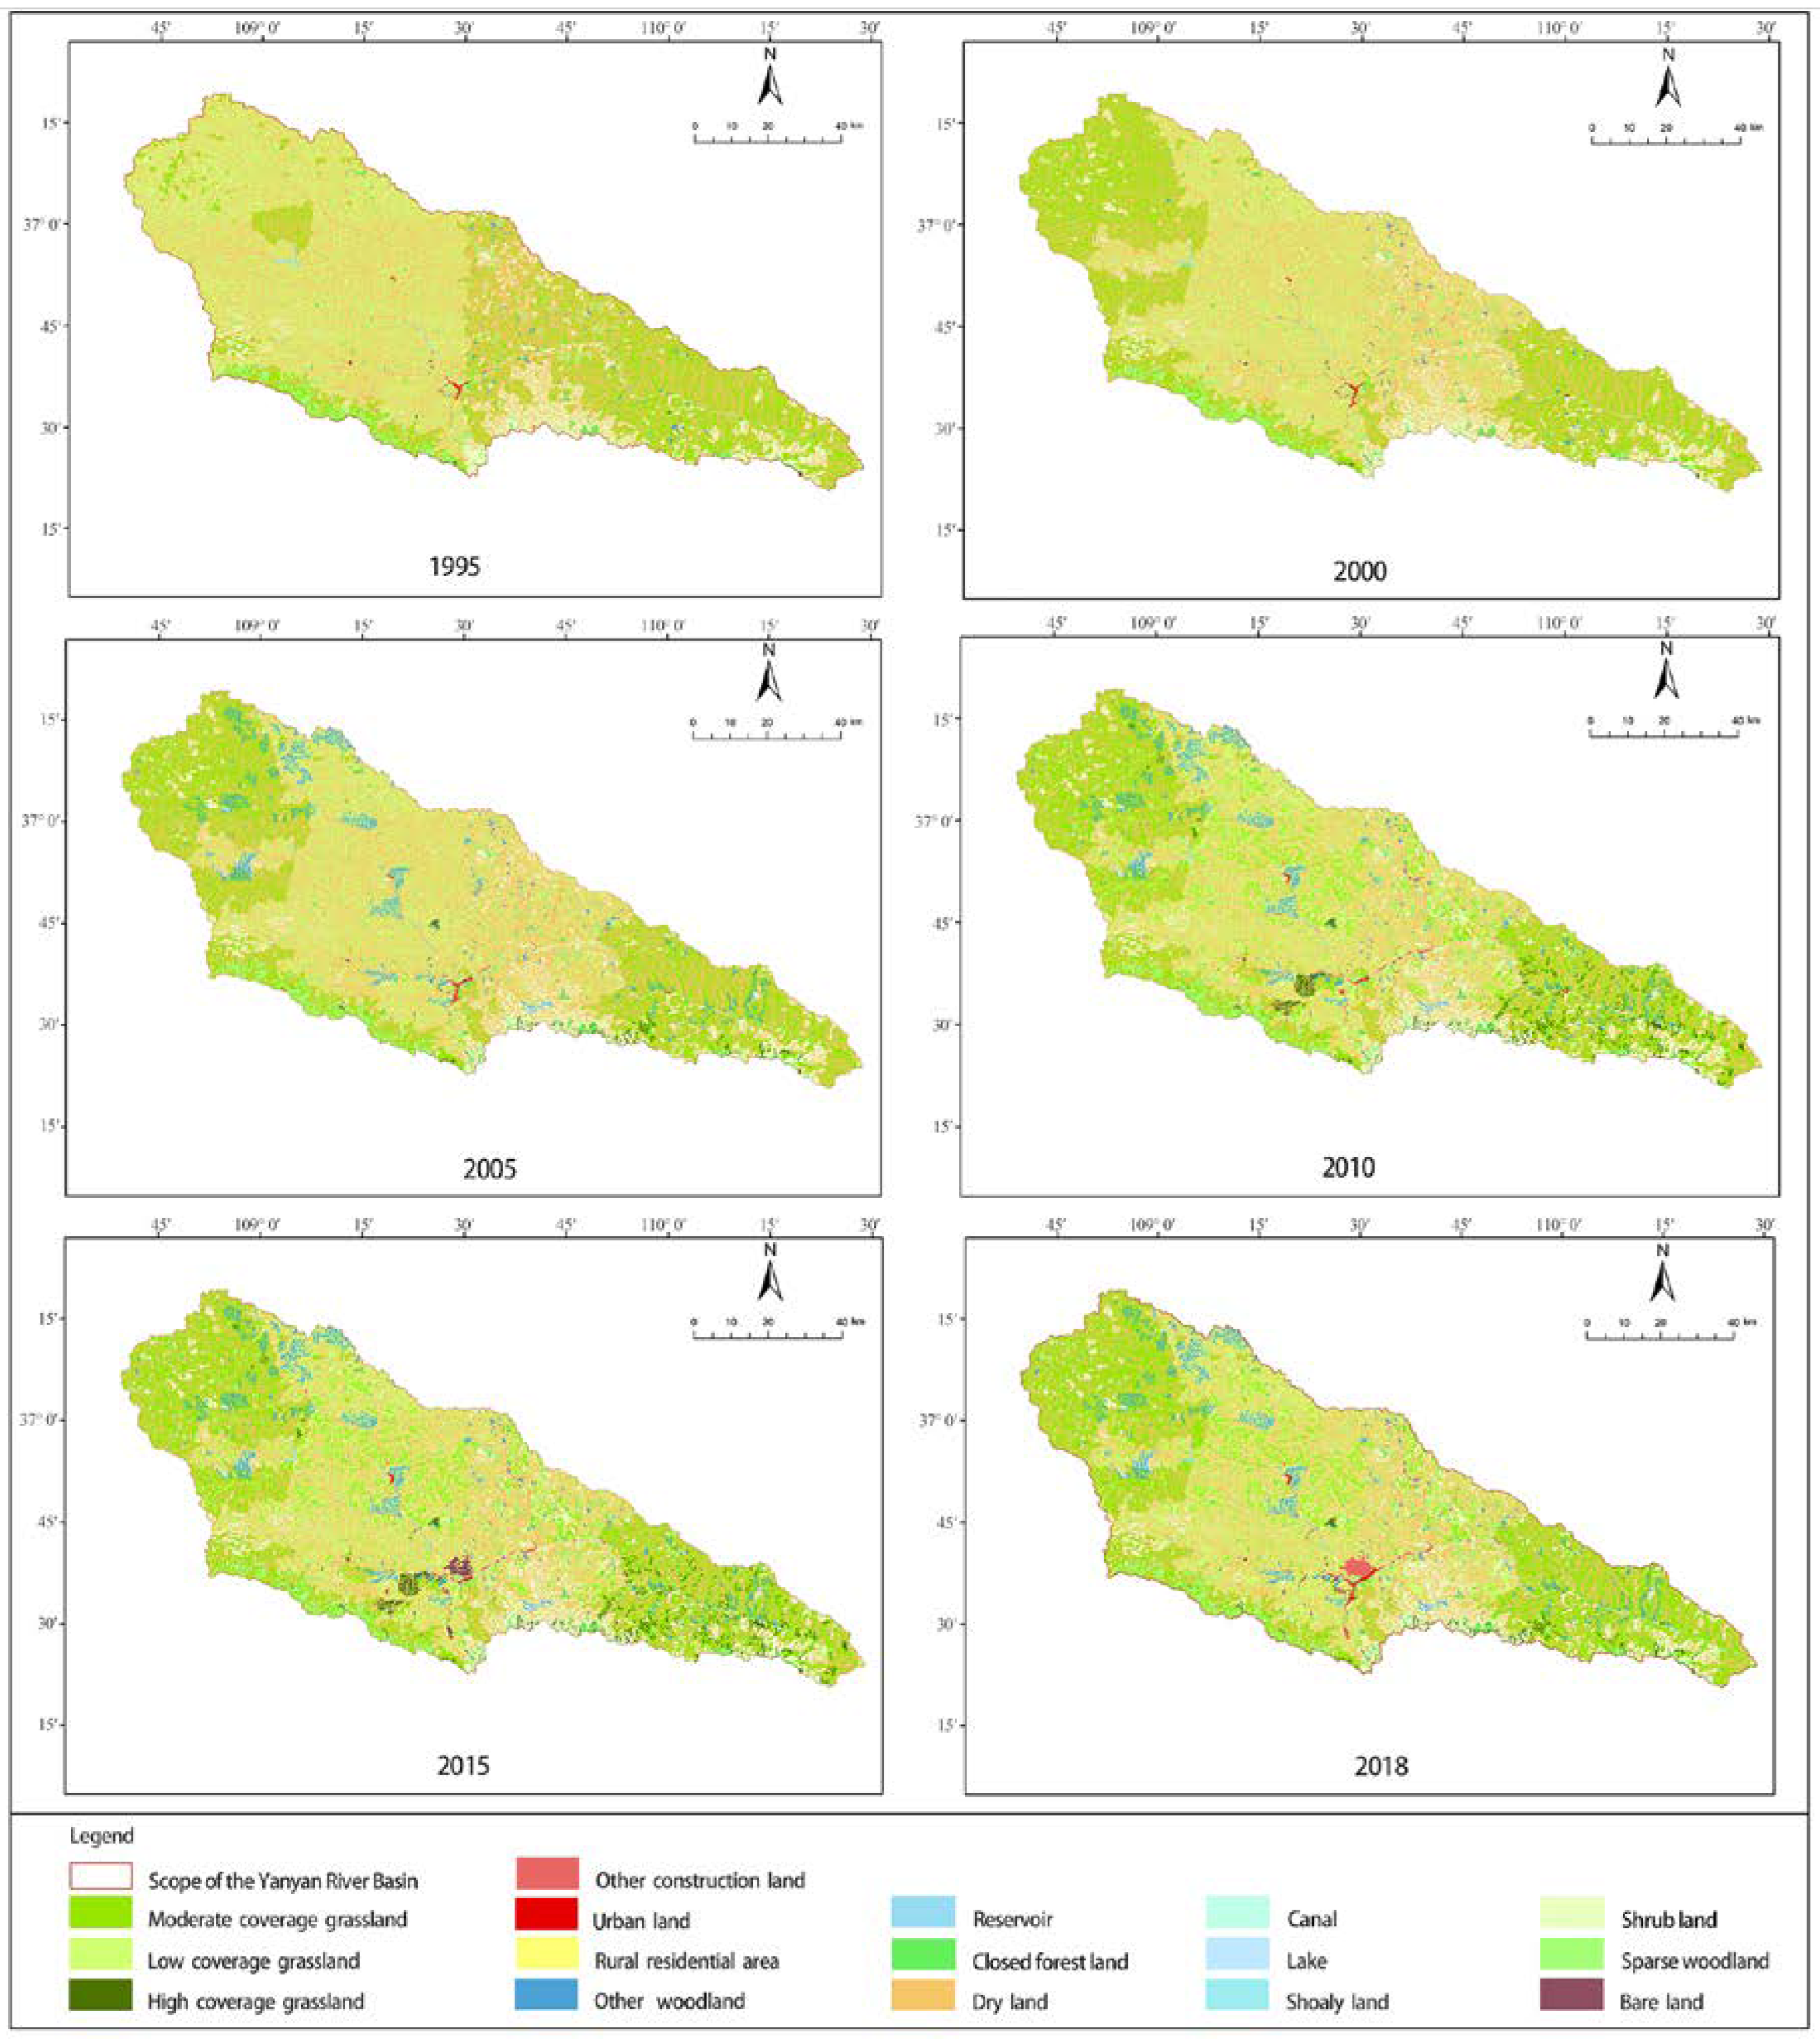
4.1.2. Characteristic Results of Spatial Distribution Transfer

According to Table 4, the area of cultivated land and water area in the Yanhe River Basin decreased from 1995 to 2018, and the area of woodland, grassland, construction land, and unused land increased. Cultivated land was transformed to woodland and grassland of 273.93 km2 and 754.73 km2, respectively, and to construction land and bare land of 36.30 km2 and 1.44 km2, respectively. Some land was also transformed into cultivated land: 23.40 km2 of woodland, 113.08 km2 of grassland, and 3.71 km2 of water area. The transfer to other construction land mainly came from cultivated land and grassland types. The transferred-out area of cultivated land was 1067.94 km2, which was much smaller than the transferred-in area. It is the land type with the largest area change in land use, followed by grassland and forest land, and the transferred-out areas were 244.33 km2 and 51.20 km2, respectively. In general, the flow of cultivated land in the Yanhe River Basin from 1995 to 2018 was mainly woodland, grassland, and construction land, which is closely related to the implementation of ‘returning cultivated land to woodland and grassland’ and the rapid development of social economy in recent years.

4.1.3. Evolution Results of the Spatial Morphological Features

As is shown in Table 5, the NP value of the Yanhe River Basin first increased and then decreased during 1995–2018, which was the same trend in the fragmented degree of the cultivated land, indicating that landscape destruction caused by human activities in the basin had accelerated the fragmentation of production space. However, the MPS value in the Yanhe River Basin decreased first and then increased, suggesting that the spatial landscape fragmentation degree of agricultural production in the Yanhe River Basin presented a trend of increasing first and then decreasing. MSI increased first and then decreased, suggesting that the complexity of the patch shape was reducing. Simultaneously, PAFRAC increased first and then decreased, indicating that the patch shape changed from irregular to regular, and the ecological environment also shifted from complex to simple. The value of SHDI first increased and then decreased, suggesting that the spatial patches of agricultural production in the basin displayed a trend of uniform distribution, and the fragmented degree increased first and then slightly decreased. The aggregation index, AI, presented a trend of first decreasing and then increasing, revealing that the agglomeration degree of the agricultural production space first decreased and then tightened.

4.2. Analysis of Influencing Factors of Farmer Behavior on the Spatial Pattern Evolution of Agricultural Production

Scientifically and accurately revealing the spatial characteristics and influencing factors of cultivated land is an important basis for the study of optimal allocation of agricultural production space resources. Based on the existing literature research [46], this study selected the spatial scale of agricultural production, the spatial distribution of production and the spatial form of production as the dependent variables. Based on the sub-watershed unit, the spatial pattern of agricultural production was quantitatively analyzed. The geographical detector was used to analyze the independent variables of farmers’ behavior and the spatial dependent variables of agricultural production. The main driving force of the spatial differentiation of agricultural production in the Yanhe River Basin was measured; then, the influence mechanism of farmers’ behavior on the evolution of the spatial pattern of agricultural production at the basin scale was analyzed.

4.2.1. Constructing an Index System of Influencing Factors

The spatial differentiation of rural agricultural production in the Yanhe River Basin is a result of the comprehensive effect of farmer spatial behaviors. Starting from the four aspects of farmer family features, land management behaviors, production input behaviors and resource utilization behaviors, twelve influencing factors (Table 6) were chosen to explore the effects on the spatial differentiation of rural agricultural production. Using ArcGIS10.6 software, discrete processing was conducted according to the aggregation characteristics of each driving factor, and the geographical detector was adopted to implement factor detection on the selected factors. Consequently, this study could obtain the influencing value of each factor on the production space evolution (q value: the larger the value was, the greater the effect of the factor on the production space evolution, and vice versa), and the explanatory power value of the factor (p value: the smaller the value was, the greater the explanatory power of the factor on the production space evolution, and vice versa).

4.2.2. Analysis Results of Influencing Factors

(1)
Analysis of main influencing factors
Quantitative analysis of the driving force of the rural agricultural production space scale in the Yanhe River Basin was performed. As shown in Table 7, the labor input, X9 (0.202), in the production input behaviors exerted the greatest effect on the rural production space scale. Secondly, the distance to farmers’ cultivated land, X4 (0.153), and the income, X1 (0.150), of the farmers’ family features in land management behavior exerted considerable impacts on the production space scale, and the corresponding factors showed relatively strong explanatory power.
The driving factors affecting the spatial distribution of rural production included fertilization input, X10 (0.264); cultivated land transfer, X3 (0.242); labor input, X9 (0.177); understanding of policy and information, X11 (0.162); and education degree, X2 (0.120); the q values of other factors were all less than 0.1, with a low influencing degree. The explanatory power of fertilization input was the smallest (0.034). Specifically, in the production process, the conversion of land resources reduced the abandonment and waste of cultivated land, broke the fragmented management pattern of land management, gradually changed to the moderate scale of land management, and transformed to the industrial structure of rural production space.
The main factors influencing the spatial pattern change of rural production included farmer income, X1 (0.558); social interaction, X12 (0.438); and fertilization input, X10 (0.403); whose influence q values were all greater than 0.4. It was revealed that the improvement in farmer income and social interaction greatly enhanced the cultivation technology and fertilization input, as well as the efficiency of agricultural production management. Under the constraints of different terrain conditions, the fertilization input of farmers in promoting intensive land production was higher, reducing the arable patch area and intensifying the fragmentation of cultivated land.
(2)
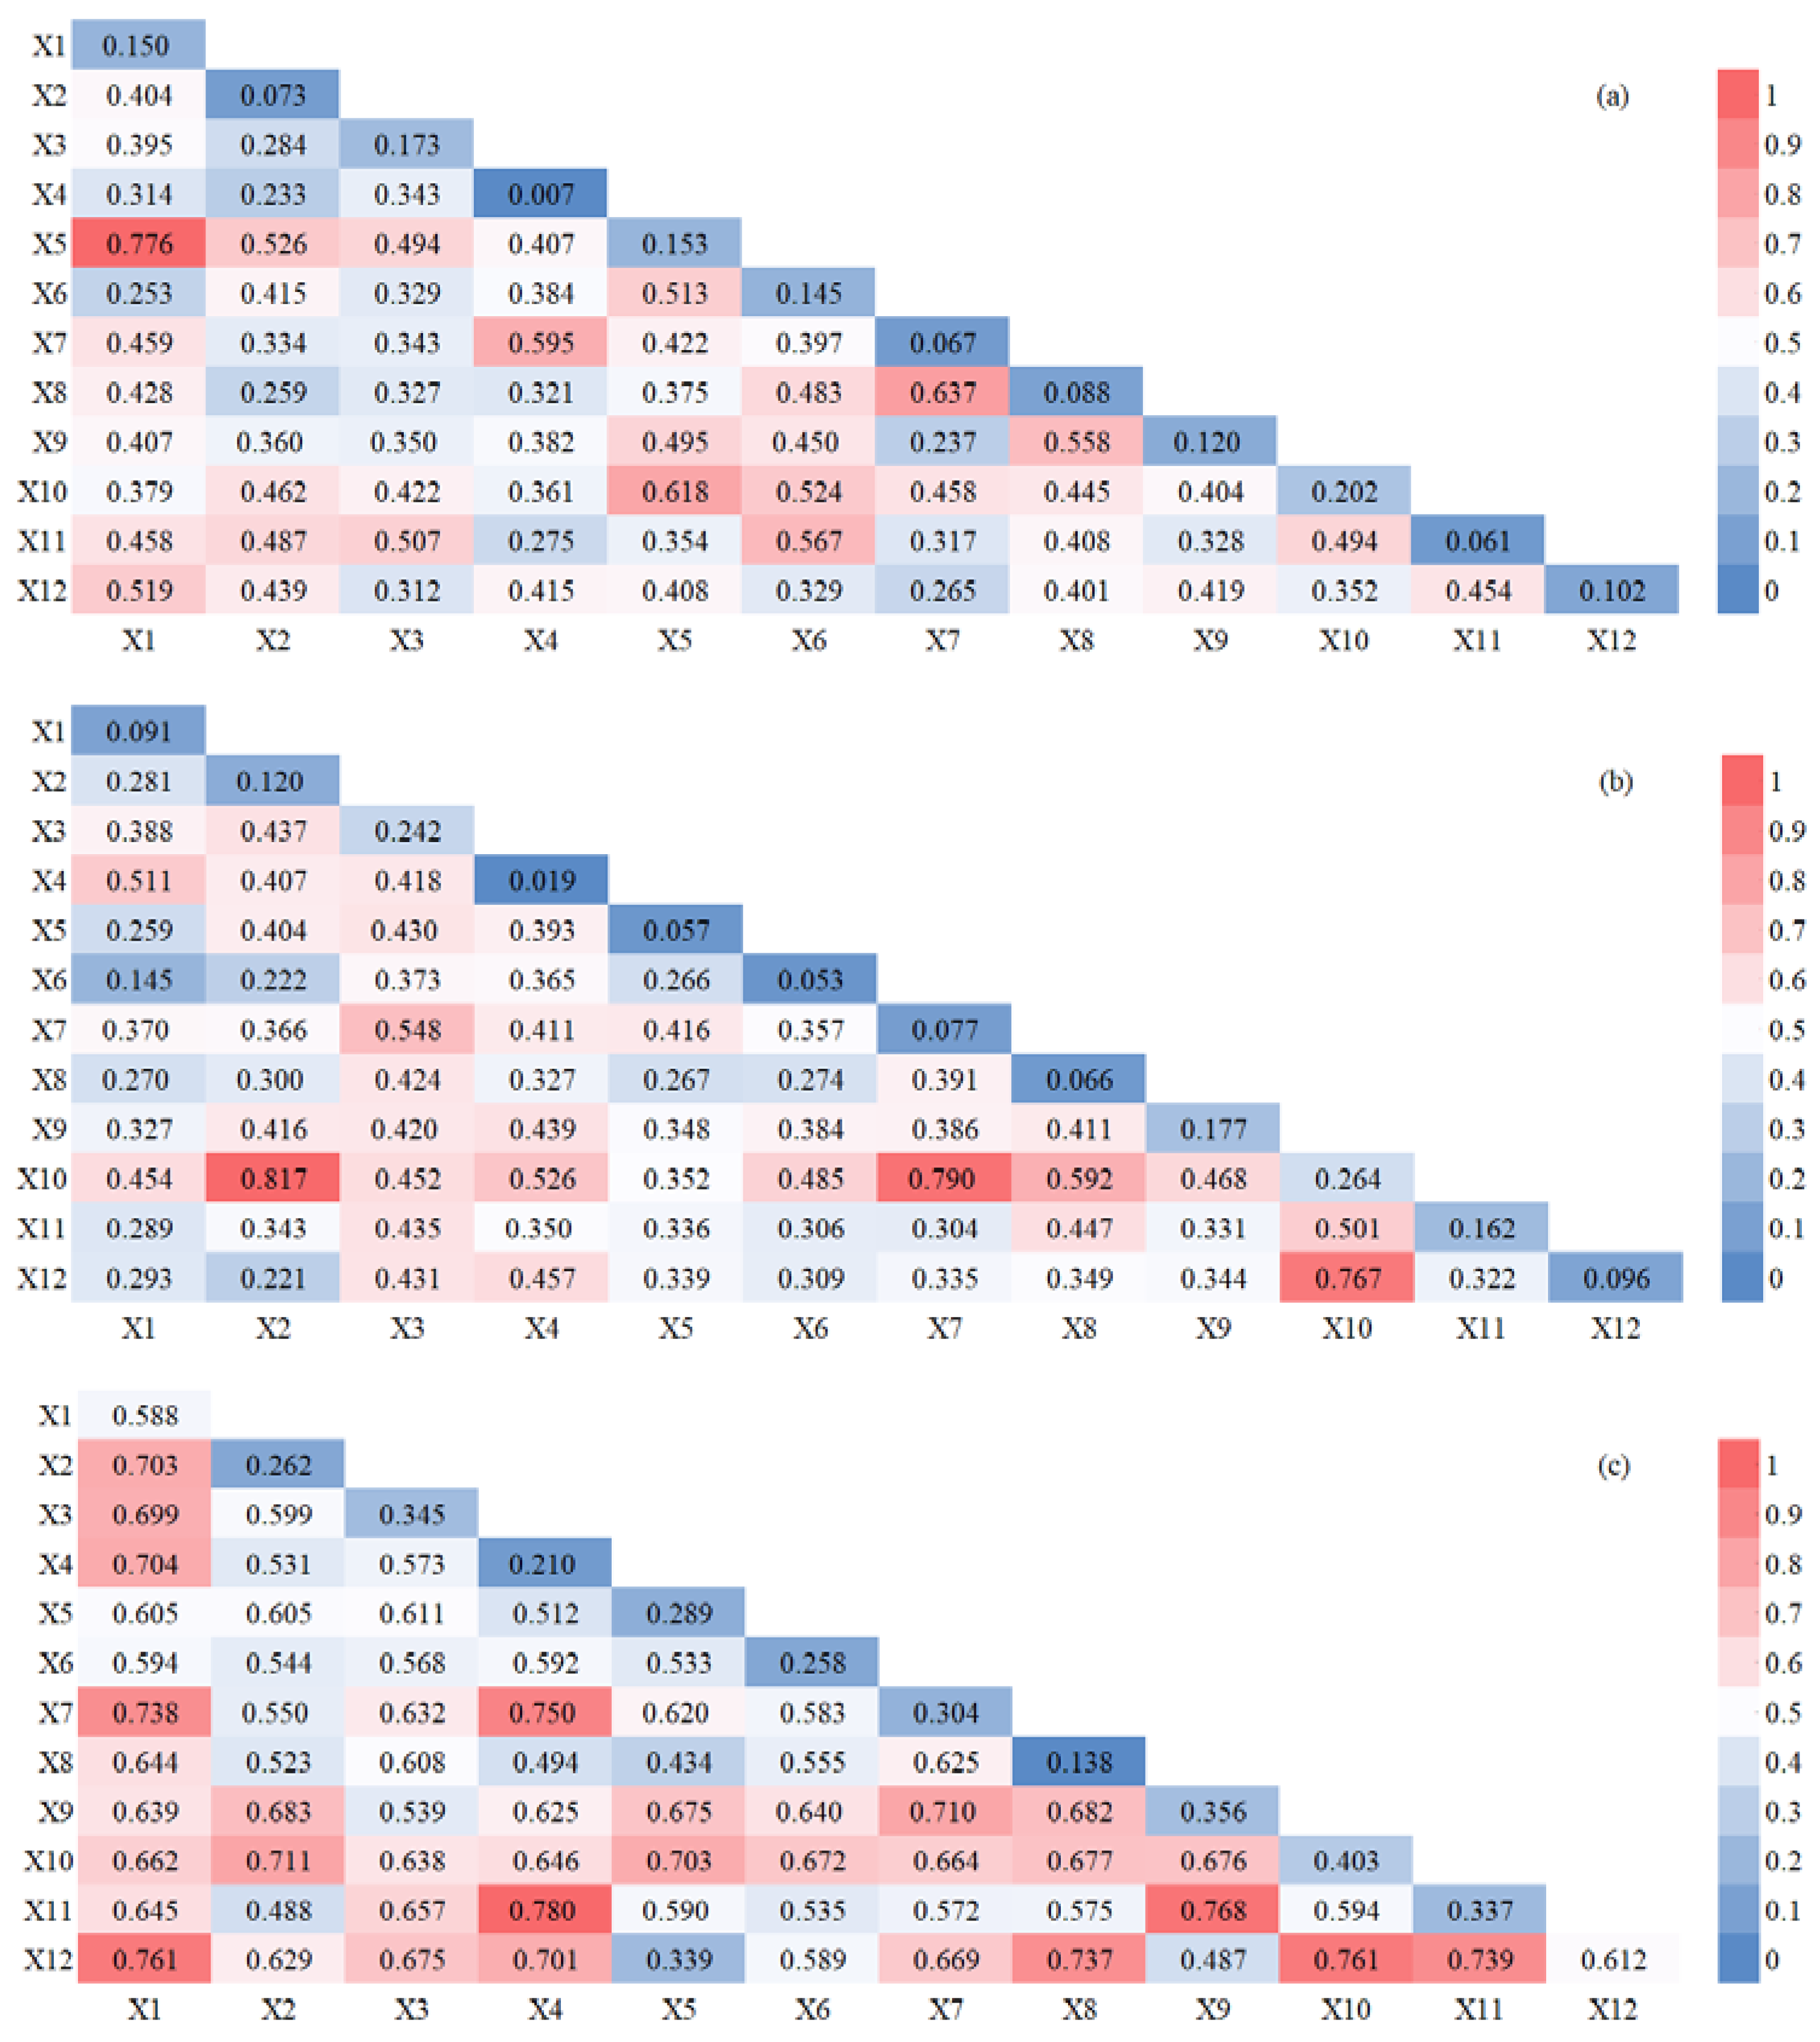
Analysis of interactive detection
According to Figure 4a, the interaction between farmer income and farming distance is the strongest, reaching 0.776, followed by the interaction between farming radius and irrigation input, and farming distance and labor input, which were 0.637 and 0.618, respectively.
As for the influence of farmers’ land management behavior on the spatial distribution of rural production, Figure 4b reveals that the interaction between fertilization input and education degree was the strongest, reaching 0.817, and that between irrigation input and fertilization input was also strong, reaching 0.790.
According to Figure 4c, the interaction between policy, information understanding, and farming distance was the strongest, reaching 0.780. Moreover, the interaction of production input behavior and any two influencing factors exerted a great impact on the spatial form of production.

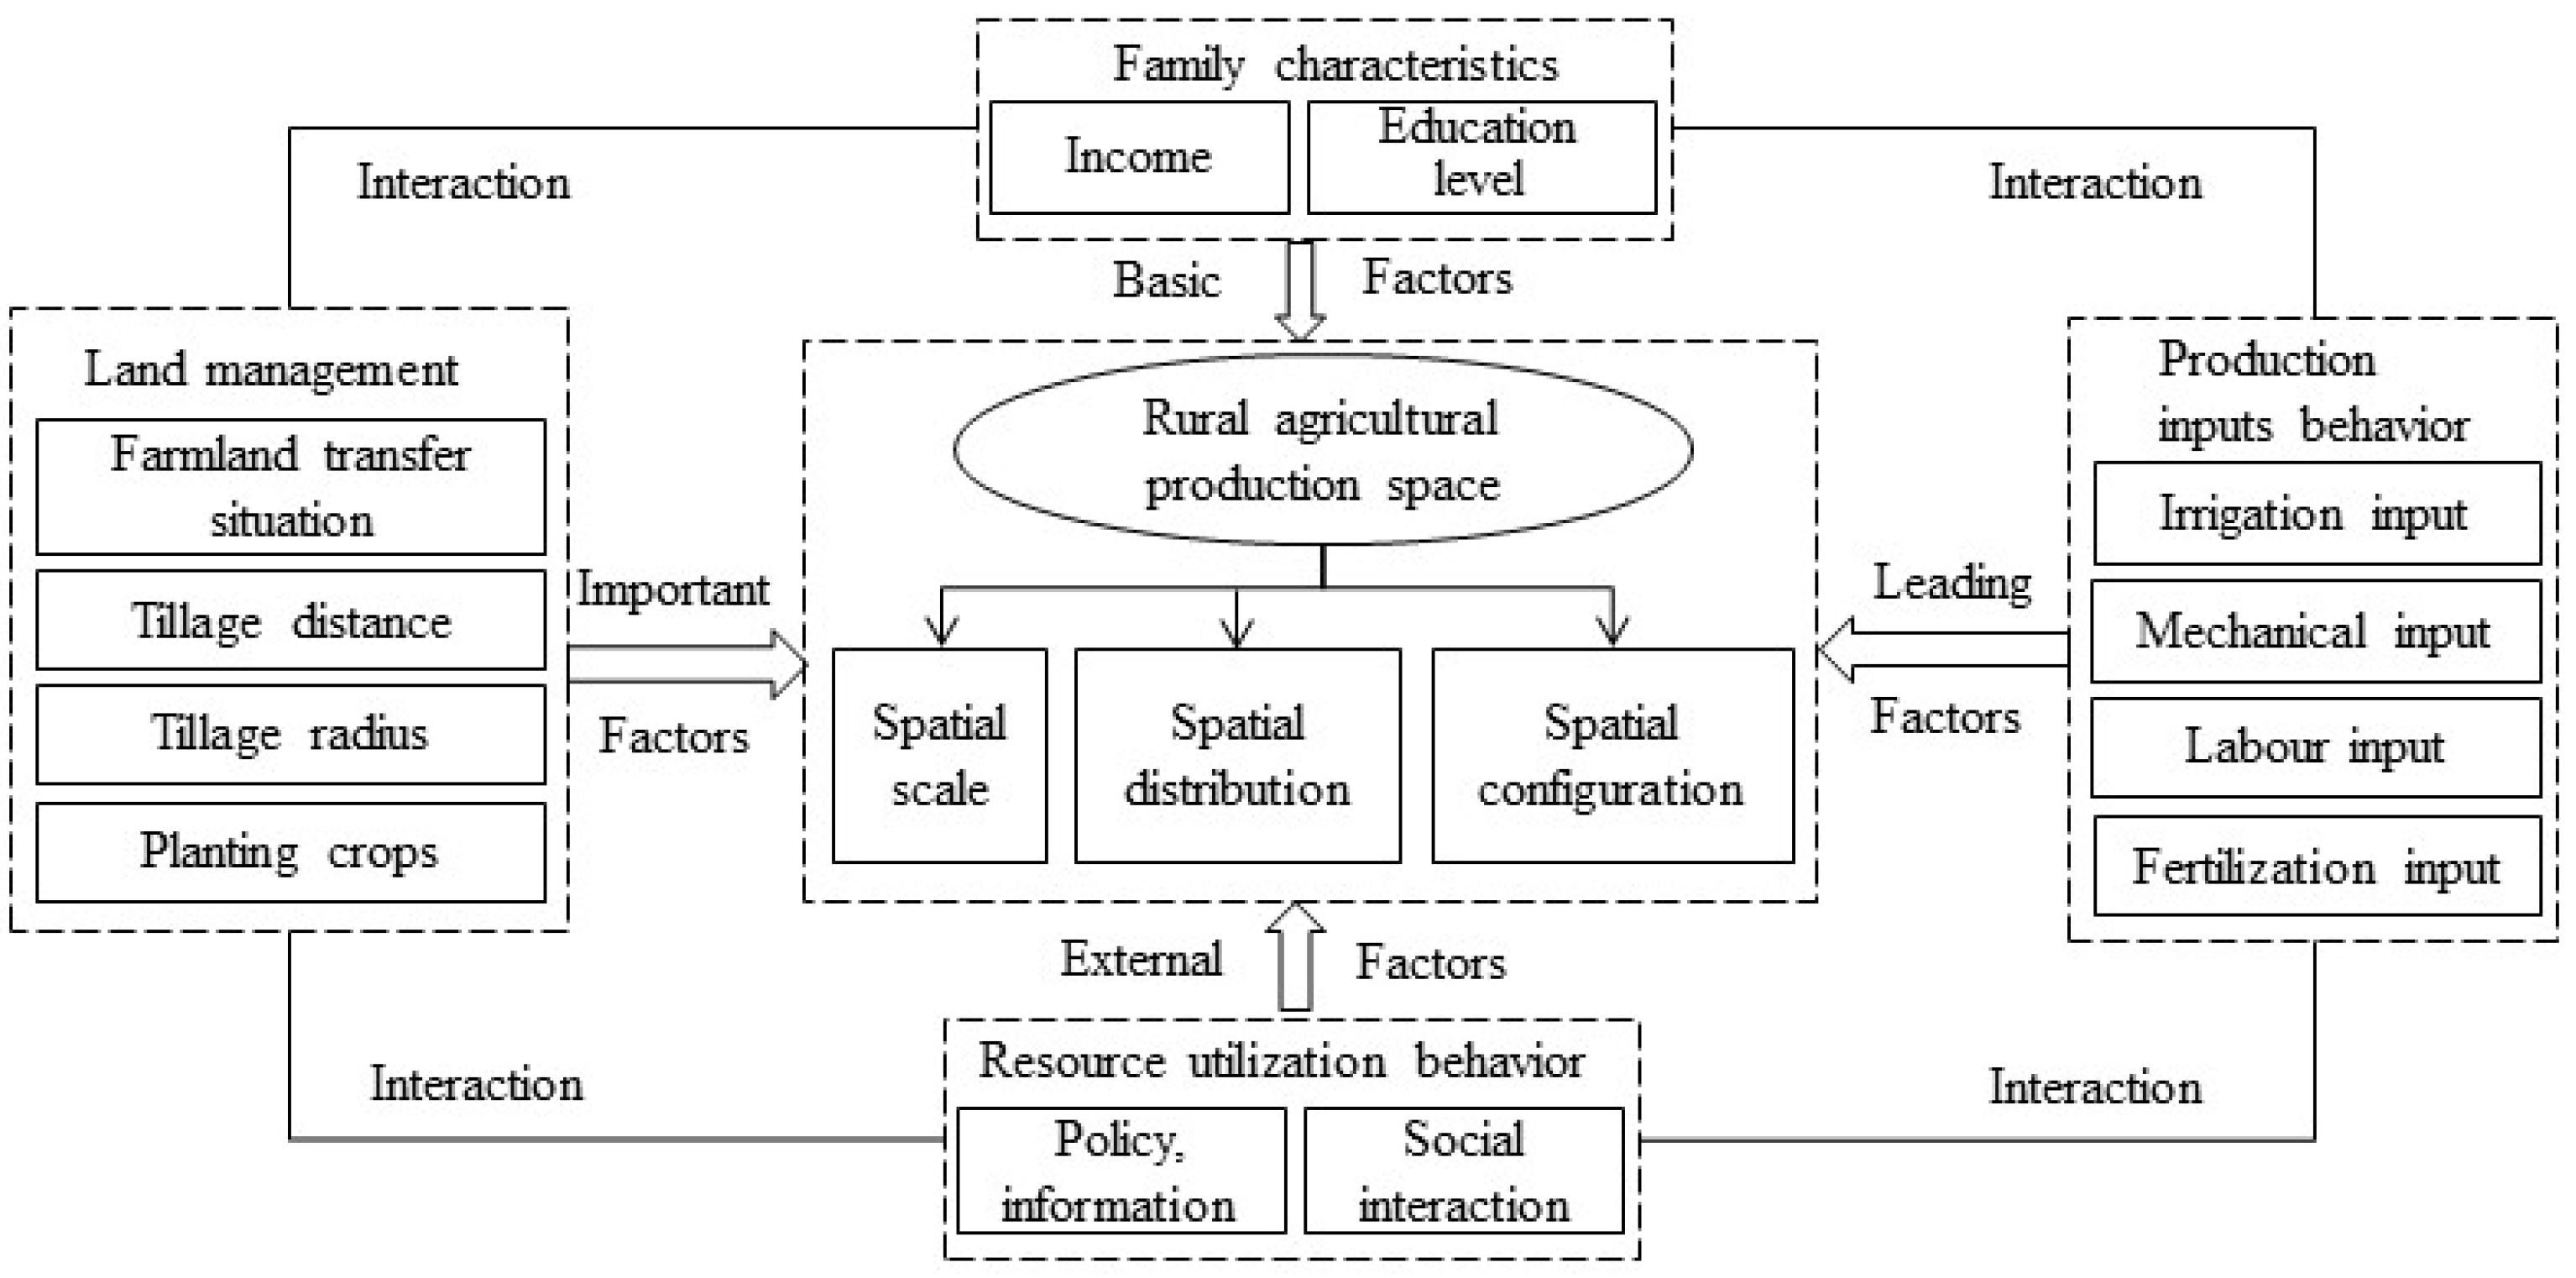
4.3. The Influencing Mechanism of Farmer Behavior on the Evolution of Spatial Patterns of Agricultural Production

As shown in Figure 5, based on the results of the above geographical detectors, the influence mechanism of the rural agricultural production space in the Yanhe River Basin was constructed. As the main body of the basic social unit in the complex system of the agricultural production space in the Yanhe River Basin, farmers’ production behavior has a considerable influence on the agricultural production space.
The higher the education level and income of farmers, the more comprehensive the cognition of agricultural development, and farmers’ rational behavior decisions can optimize and adjust the agricultural production space. The income and education level of farmers are basic factors affecting the evolution of spatial patterns of agricultural production. At the same time, the interaction value between farmers’ income and farming radius is very high, for farmers who rely on agricultural production to maintain their livelihoods, the reference of establishing residential areas according to ‘farming radius’ is very high, which is more conducive to the large-scale operation of the agricultural production space.
Among the influencing factors of land management behavior, the interaction value of tillage distance with policy information and irrigation input is higher, and the influence value of cultivated land transfer on the spatial layout of agricultural production is higher. On the one hand, when the farming distance was great, or the farming radius was large, the agricultural production cost was high, and the farmers’ enthusiasm for farming was not high. On the other hand, most of them were located in remote areas at high altitude and with inconvenient transportation. Cultivated land is continuously abandoned; idle land gradually begins to transform; and the degree of land fragmentation is weakened. Through interactive detection analysis, it is concluded that farmers’ land management behavior is an important factor affecting the evolution of agricultural production spatial patterns. From the analysis of farmers’ land management behavior, traditional small farmers have gradually become agricultural workers through idle land transfer and land shareholding, which has promoted large-scale land management, weakened the fragmentation of the agricultural production space and improved agricultural production efficiency. At the same time, we will promote the integration of rural agriculture with secondary and tertiary industries and accelerate agricultural modernization.
Through interactive detection analysis, it was concluded that production input behavior is the dominant factor affecting the evolution of agricultural production spatial patterns. The interactions between fertilization input, farmers’ education level, and irrigation input are very high, and the interaction between labor input and policy information understanding is very strong. This shows that at the level of production input, the approach of simply increasing labor input to increase production has gradually changed. The increase of agricultural machinery, fertilizer and other production inputs has a positive impact on the scale of agricultural production and accelerates the development of information technology. However, farmers have changed from simple agricultural management to part-time management, labor input has been reduced, poor quality farmland has been abandoned, and the number of agricultural management plots has been reduced, which will aggravate the fragmentation of agricultural production space.
Resource utilization behavior is an external factor affecting agricultural production space. The interactive detection analysis showed that policy information factors have a key impact on the spatial evolution of agricultural production. Due to the rapid development of urbanization, the spatial transformation of the rural population, the aggregation of non-agricultural industries to cities and towns, and the transfer of an agricultural labor force to a non-agricultural labor force occur, as highlighted in the significant reduction in cultivated land and the increase in construction land in agricultural production space in the Yanhe River Basin. The implementation of the policy of returning cultivated land to woodland and grassland and the rapid development of urbanization have driving effects on the spatial evolution of agricultural production in the Yanhe River Basin, which is the main external influencing factor of the spatial pattern evolution of agricultural production. The degree of access to policy, information and credit is better, and the adoption of advanced agricultural technology is gradually increasing, which has a positive impact on the quality of cultivated land, promotes the abandonment of unsuitable cultivated land and improves the efficiency of agricultural production. It can promote the improvement of agricultural related policy information and market information.

5. Discussion

Originating from the field investigation of rural agricultural production space and farmers’ spatial behavior in the Yanhe River Basin, this study adopted a scientific, systematic and reasonable research method, although its research structure was slightly different from the reality [47,48]. For instance, farmer behaviors were divided into twelve influencing factor indicators, in the four dimensions of farmer family features, land management behaviors, production input behaviors and resource utilization behaviors, which enriched the research on the influence of the existing policies and technological development on farmers’ decision-making [49]. In the meantime, the interaction between different farmer behaviors exerted a more precise effect on the rural agricultural production space. The subjects of production function in the basin were inter-related. Therefore, combined with the index system of farmer behaviors and through the geographical detector model, this study not only expounded the influence intensity of each factor on the change in agricultural production space from the single factor aspect, but also further discussed the changing mechanism of agricultural production space from the perspective of factor interaction, complementing the shortcomings of conventional methods which cannot explain the influencing mechanisms of interaction [50,51]. Although this study provides support for rural spatial planning and construction, and represents a reference for the research of similar subjects, ‘behavior–space’ itself is a complex system, whose intrinsic mechanism needs to be further explored in the future.
Rural agricultural production space is a complex research object, where the rapid flow of rural elements has a profound impact on agricultural land use, industrial development, and social systems. However, as the subjects of rural agricultural production space, farmers’ economic and social activities deeply change the spatial pattern of agricultural production. In addition, differences in family resource endowment, subjective cognitive ability and individual behavioral preferences also determine the behavioral goals of farmers. This study verified the rationality of the indicators, confirming that the evolution features of the spatial pattern of agricultural production in the Yanhe River Basin basically satisfied the requirements of social and economic development and farmland protection policies [52,53,54]. From the micro perspective, the evolution and development of rural agricultural production space exerted a crucial impact on further improving the land transfer system, reducing the abandonment rate of farms, strengthening the supervision of land transfer, and promoting the optimal utilization of land resources. In order to provide a research paradigm for the management of production space, regulation measures suitable for the actual needs of farmers should be formulated.
In the process of rapid urbanization, farmers’ individual wishes should be combined while studying the rural agricultural production space in the basin, and more field investigations should be carried out in rural areas with various characteristics. The following aspects should be considered in optimizing basin production space:
  • Actively develop a variety of forms of moderate scale management, in order to build a modern agricultural industry system, i.e., a production system.
  • Establish a sound land transfer mechanism, standardize land transfer procedures, ensure sufficient arable land area, avoid wasting resources, for example through land abandonment due to non-agricultural transfer of traditional farmers, and improve space utilization efficiency.
  • Provide a good regional policy and education platform, and strengthen the cultivation of farmers’ production capacity, technical level, and management ability.

6. Conclusions

This study took the spatial behavior of farmers as the starting point, and comprehensively considered the evolution of the spatial pattern of agricultural production from the perspective of human behavior. First of all, this study used land use dynamics, transfer matrix and landscape pattern index analysis [34,35,36] to describe the evolution characteristics of agricultural production space scale, structure, and form. The cultivated land area in the Yanhe River Basin decreased by 927.02 km2, and was mainly transformed to woodland, grassland, and construction land. Secondly, the geographical detector model was used to analyze the relationship between farmers’ behavior and the scale, distribution, and form of agricultural production space. Among them, the interaction between irrigation input and fertilization input, the interaction between farming distance and policy understanding, and the interaction between farming radius and household income have significant effects on agricultural production space. The interaction detection values are 0.790, 0.780 and 0.776, respectively. Finally, the influence mechanism of farmers’ behavior on the evolution of agricultural production spatial pattern was analyzed.
Among them, the characteristics of peasant households are the internal driving force that affects the adjustment of agricultural production space. Farmers demonstrate great differences in the acquisition of information, technology, policy, and other factors, as well as the use of labor input and production tools, which, in turn, affect the scale, distribution, and morphological structure of agricultural production space, and promote the gradual evolution of agricultural production to the direction of large-scale operation and modernization. However, social and economic systems, such as policy, market, and technology, as well as natural systems, such as terrain structure and location conditions, constitute the main external factors affecting agricultural production space. Under the constraints of objective external conditions, farmers comprehensively consider the situation of labor force and production input, which together constitute the influence mechanism of the evolution of agricultural production spatial pattern in the Yanhe River Basin. The research results can be used to guide the production space layout and land development strategies in the future agricultural production space planning of the Yanhe River Basin.
The evolution of the spatial pattern of agricultural production in the Yanhe River Basin is affected by many complex factors, including the influence of different scale operators. Hence, there are some limitations to this study. First of all, from the perspective of the main body of scale management, further research [52] considering the migration of rural populations, the support of external policy conditions, and the development of modern technology will affect the evolution of the spatial pattern of agricultural production. In future research, such changes in agricultural production space are not very active areas. We should expand the research time, and more scientifically and comprehensively analyze the evolution characteristics and influence mechanism of agricultural production space in the Yanhe River Basin.

Author Contributions

Conceptualization, Q.H. and Y.D.; methodology, Z.H., X.F. and L.Z.; software, J.Z. and L.Z.; validation, J.Z. and Y.D.; formal analysis, Z.H. and Y.Y.; investigation, X.F.; resources, Q.H. and X.F.; data curation, Z.H., X.F. and Y.Y.; writing—original draft preparation, Z.H.; visualization, X.F.; supervision, Q.H. and Y.D.; project administration, J.Z.; funding acquisition, Z.H. and J.Z. All authors have read and agreed to the published version of the manuscript.

Funding

This study was funded by National Natural Science Foundation of China, grant number 52178030, the National Key Research and Development Program under grant 2022YFC3802803, and the Philosophy and Social Science Research Project in Shaanxi, grant number 2023ZD0622 and 2022HZ1870.

Data Availability Statement

Not applicable.

Acknowledgments

We are thankful to the anonymous reviewers for their valuable comments.

Conflicts of Interest

The authors declare no conflict of interest.

References

  1. He, J.; Shi, X.; Fu, Y.; Yuan, Y. Spatiotemporal pattern of the trade-offs and synergies of ecosystem services after Grain for Green Program: A case study of the Loess Plateau, China. Environ. Sci. Pollut. R. 2020, 27, 30020–30033. [Google Scholar] [CrossRef] [PubMed]
  2. Hou, Q.H.; Chen, S.H.; Miao, Y.T.; Zhang, Y.H.; Chen, S.; Fan, X.Y.; Duan, Y.Q.; Zhang, L.D. Managemengt and Control of Agricultural Production Space in the Yanhe River Basin Based on Peasant Household Behavior. Sustainability 2023, 15, 8399. [Google Scholar] [CrossRef]
  3. Fan, Y.T.; Jin, X.B.; Xiang, X.M.; Yang, X.H.; Liu, J.; Zhou, Y.K. Analysis of multi-functional evaluation and spatial characteristics of cultivated land in southern Jiangsu Province. Resour. Sci. 2018, 40, 980–992. [Google Scholar]
  4. Liu, W.C.; Liu, J.Y.; Kuang, W.H. Spatiotemporal patterns of soil protection effect of the Grain for Green Project in northern Shaanxi. Acta Geogr. Sin. 2019, 74, 1835–1852. [Google Scholar]
  5. Li, F.; Qin, Z.X.; Liu, X.L.; Chen, Z.; Wei, X.; Zhang, Q.; Lei, M. Grain production space reconstruction and land system function tradeoffs in China. Geogr. Sustain. 2021, 2, 22–30. [Google Scholar] [CrossRef]
  6. Wang, C.; Li, H.Y. Conceptual cognition and research framework of rural production space system. Prog. Geogr. 2017, 36, 913–923. [Google Scholar]
  7. Luo, Y.; Lü, Y.; Fu, B.; Zhang, Q.; Li, T.; Hu, W.; Comber, A. Half century change of interactions among ecosystem services driven by ecological restoration: Quantification and policy implications at a watershed scale in the Chinese Loess Plateau. Sci. Total Environ. 2019, 651, 2546–2557. [Google Scholar] [CrossRef] [Green Version]
  8. Li, Y.R.; Li, Y.; Fan, P.C.; Long, L. Impacts of land consolidation on rural human-environment system in typical watershed of the Loess Plateau and implications for rural development policy. Land Use Policy 2019, 86, 339–350. [Google Scholar]
  9. Cao, Z.; Liu, Y.S.; Li, Y.R. Rural transition in the loess hilly and gully region: From the perspective of “flowing” cropland. J. Rural Stud. 2022, 93, 326–335. [Google Scholar] [CrossRef]
  10. Zhang, X.C.; Liu, Y.S.; Li, Y.R.; Guo, Y.; Cao, Z. Mechanism and typical model of rural ecological industrialization in the hilly and gully regions of Loess Plateau. Resour. Sci. 2020, 42, 1275–1284. [Google Scholar]
  11. Zhang, L.D.; Hou, Q.H.; Duan, Y.Q. Ecological spatial control model of basin in Loess Plateau. Trans. Chin. Soc. Agric. Eng. 2021, 37, 206–213. [Google Scholar]
  12. Liu, X.Q.; Liu, Y.S.; Liu, Z.J.; Chen, Z. Impacts of climatic warming on cropping system borders of China and potential adaptation strategies for regional agriculture development. Sci. Total Environ. 2021, 755, 142415. [Google Scholar] [CrossRef] [PubMed]
  13. He, M.N.; Wang, Y.Q.; Tong, Y.P.; Zhao, Y.; Qiang, X.; Song, Y.; Wang, L.; Song, Y.; Wang, G.; He, C. Evaluation of the environmental effects of intensive land consolidation: A field-based case study of the Chinese Loess Plateau. Land Use Policy 2020, 94, 104523. [Google Scholar] [CrossRef]
  14. Wu, W.H.; Chen, Z.F.; Li, Y.H.; Wang, Y.; Yan, J.; Song, C. Land engineering and its role for sustainable agriculture in the agropastoral ecotone: A case study of Yulin, Shaanxi Province, China. J. Geogr. Sci. 2019, 29, 818–830. [Google Scholar] [CrossRef] [Green Version]
  15. Liu, Y.S.; Long, H.L.; Zhang, X.L.; Qiao, J. Research Progress and Prospect in the Disciplines of Agricultural Geography and Rural Development in China. Prog. Geogr. 2011, 30, 1498–1505. [Google Scholar]
  16. Tu, S.; Long, H.; Zhang, Y.; Ge, D.; Qu, Y. Rural restructuring at village level under rapid urbanization in metropolitan suburbs of China and its implications for innovations in land use policy. Habitat Int. 2018, 77, 143–152. [Google Scholar] [CrossRef]
  17. Garrett, R.D.; Koh, I.; Lambin, E.F.; le Polain de Waroux, Y.; Kastens, J.H.; Brown, J.C. Intensification in agriculture-forest frontiers: Land use responses to development and conservation policies in Brazil. Glob. Environ. Chang. 2018, 53, 233–243. [Google Scholar] [CrossRef]
  18. Zu, J.A.; Zhang, B.B.; Kong, X.B. Fragmented characteristics and utilization efficiency of cultivated land in the hilly and gully regions of Loess Plateau in the southwestern China: A case study of Caohai Village, Guizhou Province. J. China Agric. Univ. 2016, 21, 104–113. [Google Scholar]
  19. Du, P.C.; Xu, Q.; Zhao, K.Y.; Guo, P.; Peng, S.Q.; Guo, C. Effects of land reclamation project on cultivated land distribution and vegetation restoration in northern Shaanxi Province: A case study of Gutun Basin, Yan’an City. Bull. Soil Water Conserv. 2019, 39, 1–8. [Google Scholar]
  20. Qiao, W.F.; Ge, D.Z.; Gao, J.L.; Lu, C.; Huang, L. Study on rural regional function and revitalization path selection in Jiangsu Province. Geogr. Res. 2019, 38, 522–534. [Google Scholar]
  21. Fang, F.; He, R.W. Study on spatial evolution features and mechanism of rural livelihood from the perspective of farmer behaviors. Study Pract. 2018, 1, 101–110. [Google Scholar]
  22. Li, B.H. Study on Spatial Behavior Change of Farmers and Optimization of Rural Human Settlement Environment; Science Press: Beijing, China, 2014. [Google Scholar]
  23. Li, X.J. Theory of Farmer Land; Science Press: Beijing China, 2009. [Google Scholar]
  24. Wang, Z.Q. Study on Ecosystem in the Typical Rural Society of Loess Plateau from the Perspective of Resilience; Northwest University: Xi’an, China, 2018. [Google Scholar]
  25. Liu, H.B.; Wang, Q.B.; Dong, X.R.; Yu, G.F.; Sun, Y. Behavior differences and policy inspiration of farmers’ land use in urban-rural fringe: A case study of 238 farmers in Sujiatun District, Shenyang City. Econ. Geogr. 2012, 32, 113–119. [Google Scholar]
  26. Wen, G.H.; Yang, G.Q.; Wang, W.X.; Zhao, W. Evaluation of cultivated land fragmentation degree based on farmers’ perspective: A case of Jiangxia District, Xian’an District, and Tongshan County in Hubei Province. Prog. Geogr. 2016, 35, 1129–1143. [Google Scholar]
  27. Wang, C.; Jiang, F.X.; Wang, L.P.; Zhang, Y.Y. Cultivated Land Investment Behaviors of Farmers with Different Living Strategies: An Empirical Study on 471 Farmer Households in Bailin Village, Chongqing City. China Land Sci. 2013, 27, 19–25, 77. [Google Scholar]
  28. Zhao, C. Factor Flowing, Resource Reorganization and Rural Renaissance: A Case Study of Dashan Village, Gaochun Cittaslow. Urban Plan. Forum 2013, 000, 28–35. [Google Scholar]
  29. Zhou, J.Z.; Hou, Q.H. Complex Network-Based Research on the Resilience of Rural Settlements in Sanshui Watershed. Land 2021, 10, 1068. [Google Scholar] [CrossRef]
  30. Hou, Q.H.; Du, Y.; Dong, W.T.; Zeng, Z.L.; Zhang, L.D.; Duan, Y.Q.; Hou, X.M. Smart city oriented ecological corridor layout of Sanshui River Basin in arid area of Loess Plateau. Sustain. Energy Technol. Assess. 2021, 44, 100993. [Google Scholar] [CrossRef]
  31. Zhao, Y.; Yu, X.X.; Jia, J.B.; Liu, X.H. Analysis of dynamic evolution and driving force of landscape land use in Hongmenchuan Basin. Trans. Chin. Soc. Agric. Eng. 2013, 29, 239–248. [Google Scholar]
  32. Kong, D.Y.; Chen, H.G.; Wu, K.S. Evolution characteristics, eco-environmental effects and influencing factors of “production-living-ecological” spaces in China. J. Nat. Resour. 2021, 36, 1116–1135. [Google Scholar]
  33. Ling, Z.Y.; Li, Y.S.; Jiang, W.G.; Liao, C.M.; Lin, Y.R. Dynamic change characteristics of “production-living-ecological spaces” of urban agglomeration interlaced with mountains, rivers and sea: A case study of the Beibu Gulf urban agglomeration in Guangxi. Econ. Geogr. 2012, 42, 18–24. [Google Scholar]
  34. Li, F.D.; Li, Z.Y.; Yin, C.B.; He, T.G. Decision-making behavior and its influencing factors of green manure planting: Based on binary Logistic model and a survey of 506 farmers in southern rice region. J. China Agric. Univ. 2019, 24, 207–217. [Google Scholar]
  35. He, Y.Z.; Wang, C. Evolution and sustainable development ability of rural production spatial system based on information entropy. J. Nat. Resour. 2019, 34, 815–828. [Google Scholar]
  36. Wang, J.F.; Xu, C.D. Geographic detector: Principle and prospect. Acta Geogr. Sin. 2017, 72, 116–134. [Google Scholar]
  37. Wang, Q.; Wang, Y.S.; Du, G.M.; Liu, Z.J. Spatial differentiation and geographic exploration of the driving mechanism of cultivated land transfer in arid region based on man-land relationship. J. Agric. Resour. Environ. 2021, 38, 241–248. [Google Scholar]
  38. Wang, H.; Liu, H.L.; Xie, Y.L.; Tian, Q.C.; Xiao, J. Spatial and temporal evolution and its influencing factors of county industrial structure: A case study of Shanxi-Shaanxi-Henan Yellow River Golden Triangle Region. J. Nat. Sci. Hunan Norm. Univ. 2020, 43, 35–42. [Google Scholar]
  39. Xue, S.S.; Gao, F.; He, B.; Yan, Z.L. Study on the Change of land use and ecosystem service value in Ulungur River Basin in recent 30 years. Bull. Soil Water Conserv. 2019, 39, 223–229+322. [Google Scholar]
  40. Li, W.; Chen, J.; Li, L.; Chen, H. Analysis of land use change in the Yangtze River Basin from 1980 to 2015. Yangtze River 2019, 51, 49–57. [Google Scholar]
  41. Liu, L.Y.; Ding, S.Y.; Ren, J.Y.; Bian, Z.Q. Effect study of landscape spatial heterogeneity on surface water quality services: A case study of Yihe River Basin, Henan Province. Geogr. Res. 2019, 38, 1527–1541. [Google Scholar]
  42. Wu, L.; Luo, J.; Li, M. Evaluation method of land-scaled consolidation potential based on landscape pattern principle. Trans. Chin. Soc. Agric. Eng. 2010, 26, 300–306. [Google Scholar]
  43. Liu, J.P.; Dong, C.Y.; Sheng, L.X.; Liu, Y. Landscape pattern change and its response to human disturbance in Xiaosanjiang Plain from 1955 to 2010. Sci. Geogr. Sin. 2016, 36, 879–887. [Google Scholar]
  44. Chen, Z.F.; Shi, D.M.; He, W.; Xia, J.R.; Jin, H.F.; Lou, Y.B. Analysis of spatial and temporal distribution and evolution characteristics of slope cultivated land resources in Yunnan Province from 1980 to 2015. Trans. Chin. Soc. Agric. Eng. 2019, 35, 256–265. [Google Scholar]
  45. Li, Y.L.; Pan, X.Z.; Wang, C.K.; Liu, Y.; Zhao, Q.G. Spatial and temporal distribution characteristics and driving factors of net primary productivity of vegetation in Guangxi from 2000 to 2011. Acta Geogr. Sin. 2014, 34, 5220–5228. [Google Scholar]
  46. Sun, X.B.; Kong, X.B.; Wen, L.Y.; Hu, Y.J. Farmland fragmentation and its managing models of the concentrated farmland in agricultural region of North China: A case study of Quzhou County in Hebei Province. Res. Agric. Mod. 2019, 40, 556–564. [Google Scholar]
  47. Li, L.G.; Wang, Y.X.; Qiu, S.; Wang, P.Z. Analysis of ecological changes and driving forces of land use and cover in Urumqi, China. J. China Agric. Univ. 2017, 22, 177–188. [Google Scholar] [CrossRef]
  48. Chang, X.Y.; Li, X.J.; Diao, H.T. Analysis of driving force for landscape pattern evolution in coal mining subsidence area. J. Agric. Resour. Environ. 2020, 37, 169–178. [Google Scholar]
  49. Guo, Z. Institutional change, cognitive bias and farmers’ farmland use behavior. J. Nantong Univ. 2020, 36, 92–98. [Google Scholar]
  50. Thapa, R.B.; Murayama, Y. Drivers of urban growth in the Kathmandu Valley, Nepal: Examining the efficacy of the analytic hierarchy process. Appl. Geogr. 2010, 30, 70–83. [Google Scholar] [CrossRef]
  51. Wei, X.; Liu, Y.L.; Yao, P. Study on driving force of land use change based on simulated annealing genetic algorithm. China Land Sci. 2008, 22, 34–37. [Google Scholar]
  52. Li, H.; Qi, N.; Li, Z.; Ma, W. The relationship between farmers’ entrepreneurial behavior and macroeconomics based on the probit regression model and entrepreneurial psychological capital. Front. Psychol. 2022, 13, 954874. [Google Scholar] [CrossRef]
  53. Wei, X.; Ruan, J. Influences of Government Policies and Farmers’ Cognition on Farmers’ Participation Willingness and Behaviors in E-Commerce Interest Linkage Mechanisms during Farmer–Enterprise Games. Agriculture 2022, 12, 1625. [Google Scholar] [CrossRef]
  54. Wang, F.; An, L.; Dang, A.; Han, J.; Miao, C.; Wang, J.; Zhang, G.; Zhao, Y. Human-land coupling and sustainable human settlements in the Yellow River Basin. Geogr. Res. 2020, 39, 1707–1724. [Google Scholar]
Figure 1. Location of the study area.
Land 12 01281 g001
Figure 2. The research framework.
Land 12 01281 g002
Figure 3. Spatial pattern of land use types in the Yanhe River Basin in different historical periods.
Land 12 01281 g003
Figure 4. (a) Interactive detection of the effects of production space scale; (b) interactive detection of the effects of production spatial distribution; (c) interactive detection of the effects of production spatial morphology.
Land 12 01281 g004
Figure 5. Influencing mechanism diagram.
Land 12 01281 g005
Table 1. List of patch feature evaluation formulas and their meanings.
Index TypePatch
Indicators
FormulaFormula
Explanation
Indicator
Significance
Equation
AreaNumber of Patches (NP)NP = NN is the number of patchesThe higher the value, the higher the degree of fragmentation of cultivated land(3)
Mean Patch Size (MPS) MPS = A N A is the total area of patches;
N is the number of patches
The most direct indicator reflecting the patch size. The higher the value, the lower the degree of fragmentation(4)
ShapeMean Shape Index (MSI) MSI I = j = 1 n 2 P ij 2 π × a ij n i Pij represents the circumference of the jth patch of the ith patch type, and aij is the area of the jth patch of the ith patch type; n is the number of patchesThe larger the value, the higher the complexity of the plaque(5)
Perimeter Area Fractal Dimension (PAFRAC) PAFRAC = 2 ln P / 4 / ln A P represents the perimeter of the patch; A represents the area of the patchThe larger the value, the more complex the shape of the patch(6)
Agglomeration index (AI) AI c = 1 j = 1 n p ij j = 1 n p ij a ij 1 1 z 1 pij represents the circumference of the jth patch of the ith patch type, and aij is the area of the jth patch of the ith patch type; n is the number of patchesThe larger the value, the higher the aggregation degree of similar plaques(7)
DiversityShannon Diversity Index (SHDI) SHDI = i = 1 m P i ln P i Pi represents the proportion occupied by landscape patch type iIt reflects spatial heterogeneity. The larger the index, the higher the fragmentation degree(8)
Table 2. Geodetector interactive detection function.
Interaction Interaction Judgment ReferenceInteraction Graph
Non-linear enhancementq(X1∩X2) > q(X1) + q(X2)Land 12 01281 i001
Independenceq(X1∩X2) = q(X1) + q(X2)Land 12 01281 i002
Two-factor enhancementq(X1∩X2) > max(q(X1), q(X2))Land 12 01281 i003
Single-factor non-linear declinemin(q(X1), q(X2)) < q(X1∩X2) < max(q(X1), q(X2))Land 12 01281 i004
Non-linear declineq(X1∩X2) < min(q(X1), q(X2))Land 12 01281 i005
Table 3. Changes in the amount of cultivated land in the Yanhe River Basin.
YearsCultivated Land Area (km2)Cultivated Land Change (km2)Annual Change Rate of Cultivated Land Area (%)
19953330.07
20003310.81−19.26−0.58
20053094.37−216.44−6.54
20102442.39−651.99−21.07
20152428.12−14.27−0.58
20182403.22−24.90−1.03
Table 4. Transfer matrix of land use types in the Yanhe River Basin from 1995 to 2018 (unit: km2).
2018Cultivated LandWoodlandGrasslandWater
Area
Urban LandRural
Residential Land
Other
Construction Land
Bare LandTransfer
1995
Cultivated land2403.22273.93754.731.543.3111.6121.381.441067.94
Woodland23.40760.6823.170.530.330.932.580.2651.20
Grassland113.08105.703242.793.723.071.7812.993.99244.33
Water area3.710.501.0521.670.330.240.25-6.08
Urban land0.030.010.030.024.900.060.00-0.15
Rural
residential land
0.750.160.640.051.5816.320.420.003.60
Other
construction land
0.080.000.010.010.010.012.14-0.12
Bare land0.130.000.07---0.002.380.20
Conversion141.18380.30779.705.878.6314.6337.625.691373.62
Table 5. Spatial morphological characteristics of agricultural production in the Yanhe River Basin.
YearsNPMPSMSIPAFRACSHIDAI
19955375143.01642.43401.54591.407590.4482
20005454140.94472.44951.54631.430890.2664
20055489140.04672.52791.58181.540890.0733
2010854090.01362.41331.59021.634890.0011
2015877187.64272.39801.57361.657489.9870
2018834892.08392.40901.57651.629690.2455
Table 6. Index system of factors influencing spatial differentiation in rural agricultural production.
Element LayerFactor LayerCalculation MethodFarmer Perception (Field Interview and Research)
Farmer family
features
Income level X1Per capita disposable
income of farmers
“Many well-educated and well-off families here don’t farm any more, and even if they do, they know more than us, invest more, and gain higher productivity.”
Education degree X2Illiteracy rate
Land
Management
behavior
Cultivated land
transfer X3
Change degree of
cultivated land area
“It’s a long way from home to the farm. It takes more than half an hour to walk, which is shorter if we ride tricycles. We just plant some corn in the mountains, and we don’t take much care afterwards.”
Cultivation distance
condition X4
Distance from road
Cultivation radius
condition X5
Distance from residential
area
Planting situation X6The proportion of
grain planting
Production
input behavior
Irrigation input X7Distance from the river“We almost all rely on the nature. Only the land close to the river can be pumped for irrigation. Worse still, it is difficult to walk to the mountain land, and the machinery can’t reach there...... Besides the high cost of plowing and fertilizer, human input is also large, so we have to hire people if we cannot do these ourselves.”
Input of machinery X8Road network density
Labor input X9Labor force amount of
unit cultivated land area
Fertilization input X10Physical amount of
agricultural fertilizer
Resource
Utilization
behavior
Understanding of
policies and information X11
Distance from the town“Living close to the county, we can often go there to understand more about the market. Moreover, we have more working opportunities, a wider interpersonal circle, and more channels to obtain information.”
Social interactions X12Internet users of
telecommunication services
“We invest a lot in farming, and sometimes we borrow money from relatives and friends when we are short of money... Now we live far, so we seldom see each other, and rely more on mobile phone for contacting.”
Table 7. Influencing factor detection of the spatial evolution of rural agricultural production in the Yanhe River Basin.
Driving
Factors
Production Space
Scale
Production Space
Distribution
Production Space
Morphology
qpqpqp
X10.1500.3910.0910.9020.5581.000
X20.0730.5520.1200.4630.2621.000
X30.0070.9930.2420.2920.3451.000
X40.1530.2100.0190.9530.2101.000
X50.0670.6770.0570.8470.2891.000
X60.1450.4810.0530.9430.2581.000
X70.0880.4420.0770.7700.3041.000
X80.1200.2970.0660.6350.1381.000
X90.2020.1090.1770.4200.3561.000
X100.0610.7290.2640.0340.4031.000
X110.1020.5200.1620.2450.3371.000
X120.1000.4310.0960.4180.4381.000
Disclaimer/Publisher’s Note: The statements, opinions and data contained in all publications are solely those of the individual author(s) and contributor(s) and not of MDPI and/or the editor(s). MDPI and/or the editor(s) disclaim responsibility for any injury to people or property resulting from any ideas, methods, instructions or products referred to in the content.

