Article

Quota and Space Allocations of New Urban Land Supported by Urban Growth Simulations: A Case Study of Guangzhou City, China

1
Guangzhou Urban Planning and Design Survey Research Institute, Guangzhou 510060, China
2
Guangdong Enterprise Key Laboratory for Urban Sensing, Monitoring and Early Warning, Guangzhou 510060, China
3
School of Architecture, South China University of Technology, Guangzhou 510641, China
*
Author to whom correspondence should be addressed.
Land 2023, 12(6), 1262; https://doi.org/10.3390/land12061262
Submission received: 29 May 2023 / Revised: 13 June 2023 / Accepted: 17 June 2023 / Published: 20 June 2023
(This article belongs to the Special Issue Future Urban Land Expansion in China)

Abstract

:
Previous allocations of new urban land were ineffective because they lacked synergy between quota and space, challenging the government planning authority. This study proposes a new and more reasonable urban land allocation method to guide the smart growth of cities. We used a logistic regression model and multisource data to explore the laws of urban growth and employed a cellular automata (CA) model to simulate this under inertial and constrained scenarios. In addition, the disparities between both scenarios concerning allocation were analyzed. We realized the synergy of quota and space allocations of new urban land through urban growth simulation. Further, the allocation of new urban land was more consistent with the development strategy of Guangzhou under a constrained scenario. The allocation of space was more regular and concentrated under a constrained scenario, which aligns with the requirements of the Government Land Space Planning. Additionally, in the constrained scenario, the bottom lines of cultivated land protection, ecological service, and geological safety were better controlled. This study compensated for the shortcomings of the disjoined quota and space allocations of new urban land and proved that a constrained scenario can more effectively promote reasonable urban growth.

1. Introduction

Urban land allocation has become one of the most-significant factors affecting the dynamics of the Earth’s surface and ecological services [1,2]. Since the 1990s, China has entered into a rapid urbanization process, converting a substantial amount of cultivated and ecological land into urban land, driving economic and social development in cities [3]. However, in some regions, the disorderly allocation of urban land has resulted in problems such as grain reduction [4], ecological degradation [5], and the low efficiency of land use [6]. These problems challenge the sustainable development of cities [7].
In China, metropolises such as Beijing, Shanghai, and Guangzhou City are beyond radical urbanization [8] and are pursuing high-quality development and smart urban growth [9]. Therefore, new urban land will become a scarce resource for urban development in the coming decades, and optimizing new urban land allocation has become a core issue for governments [10]. The allocation of new urban land has always been the focus of government and academia, particularly quota and space allocations [11]. Quota allocation is the quantitative measure of new urban land received by administrative units. Meanwhile, space allocation is the distribution of new urban land within an administrative unit. Before 2020, The General Land Use Planning conducted the allocation of new urban land in China, and the quota allocation of new urban land was implemented from top to bottom [12]. The State Council distributed the quota of new urban land to each province; the province distributed the quota to each city at the level of prefectures; the prefectures distributed the quota to each county unit [13]. According to the rules of The General Land Use Planning, the quota of new urban land of an administrative unit was calculated by multiplying its predicted new population by the new urban land per capita. Then, after a multi-party gaming strategy, the quota allocation results could be adjusted and settled. However, new population prediction is fairly flexible [14], and the new urban land per capita was set by the central government [15], lacking pertinence for different regions. In rapid urbanization, more quota of new urban land implies more development opportunities [16,17]. Therefore, the government may try to adjust the new predicted population to obtain more quota of new urban land. On the contrary, the spatial allocation of new urban land was performed at the county level. When one county unit receives its quota, it starts to layout the new urban land. Usually, new urban land is distributed according to the significance of each project, such as enterprises, schools, and commercial buildings. It should be noted that the locations of significant projects may change, resulting in an invalid space allocation of new urban land. We can conclude that, in the previous Land Use Planning, quota and space allocations were vertical and horizontal processes, respectively, as shown in Figure 1. Briefly, the method of “first allocating quota and then allocating space” lacked synergy between quota and space allocations in the previous Land Use Planning, which may dislocate the actual and planned urban land in some regions, as shown in Figure 2. This dislocation challenged the government planning authority [18], significantly increasing the workload of investigation and sanctions for illegal urban land [19]. In summary, the allocation method for new urban land needs to be optimized.
Compared with The General Land Use Planning, existing studies have focused on space allocation, which has more academic value than quota allocation. Space allocation of urban land is usually conducted through land use change or growth simulation models [20,21]. Urban growth simulations can predict areas that are likely to become urban lands and are widely used for space allocation of new urban land [22,23]. Moreover, if we count the simulated new urban lands by administrative division, we can directly obtain its quota, strengthening the synergy between the quota and space allocations of new urban land. In addition, it compensates for the flaws of separating quota and space allocations in the previous Land Use Planning. Recent studies on urban growth simulations have focused mainly on the ecological constraints on urban growth [24]. Owing to the requirements of an ecological civilization, Liu et al. integrated the ecological importance into the growth simulation process [25]; Yu et al. [26] simulated urban growth from a low-carbon perspective; Liao et al. analyzed the ecological risks caused by urban sprawl [27]. After 2020, China proposed the new Land Space Planning, which integrates land use and urban planning, serving as a high-level policy for sustainable development [28]. To cope with global food security risks, environmental crises, and geological disasters, the ecological and cultivated land protection and geological safety have been placed in the same relevant position as economic development in the Land Space Planning [29]. Therefore, in this context, ecological and cultivated land protection, as well as geological security, must be integrated into the urban growth simulation process [30,31].
This research aimed to compensate for the shortcomings that the quota and space allocations of new urban land have caused in the past and proposes a new, more rational urban land allocation method to guide the urban expansion in the context of the Land Space Planning. We selected Guangzhou City as the study area and simulated new urban growths from 2021–2035 considering inertial and constrained growth scenarios. The inertial growth simulations followed previous growth laws, whereas the constrained growth simulations integrated the requirements of the Land Space Planning. We realized the synergy of the quota and space allocations of new urban land, optimized the new urban land allocation methods, and analyzed the advantages of the constrained growth simulations.

2. Study Area and Data Source

2.1. Study Area

Guangzhou City is located in the south of China in the middle of Guangdong Province (Figure 2). It has 11 districts and covers an area of approximately 7434 km2, backing mountains and facing the sea. Guangzhou City is the national central city and the center of commerce, culture, education, and transportation in South China. In 2021, the GDP of Guangzhou City reached CNY 2.9 trillion and a population of 18.87 million, ranking fifth in both parameters among Chinese cities [32]. However, Guangzhou City is facing severe pressure to allocate new urban land because of the massive demand and limited expansion space. Therefore, we selected this city as the study area.

2.2. Data Source

2.2.1. Data Introduction

Vector, raster, and statistical data were used in this study; their basic information is presented in Table 1:
(1) Vector data: Land use data are the basis and standard for urban growth simulations. The administrative divisions were used to clip the raster data. Cultivated land quality and geological hazard susceptibility grade data were used as the constraints for cultivated land protection and geological safety, respectively. Road and POI data were used to calculate road and facility accessibility as indicators of urban growth simulation. Mobile phone signal data were used to retrieve the population distribution as an urban growth simulation indicator.
(2) Raster data: DEM data were used as indicators to calculate the urban growth potential. Soil texture and MODIS EVI data were used to calculate the ecological importance as ecological protection constraint factors. The NPP-VIIRS night-light data and Luojia No. 1 night-light data were used to calculate the economic factors as an urban growth indicator.
(3) Statistical data: GDP and average annual rainfall data were used to calculate economic changes and ecological importance, respectively, at the district level.
It should be noted that this study included two simulation periods and processes. The data from 2015–2020 were used for logistic regression and to validate the accuracy of the simulation results. The second period was from 2021–2035, the same period of the Land Space Planning of Guangzhou City.

2.2.2. Indicators of Urban Growth Simulation

According to previous studies, natural conditions, economic and social factors, traffic accessibility, and facility accessibility are indicators affecting urban growth [33]. Based on the collected data, we built an indicator system for urban growth simulation (Table 2). We normalized the indicators to eliminate the influence of different indicator units, and the quantification methods are listed in Table 2. In addition, some spatialization results for the indicators are shown in Figure 3.
Table 2. Indicators of urban growth used in this study.
Indicators’
Category
NameQuantification Method
Natural conditionsHeightNormalization
Slope
Economic and social factorsPopulation densityInverted from mobile phone signal data [34]
Economic developmentInverted from night-light data [35]
Traffic accessibilityHigh-speed roads’ accessibilitySpatial syntax [36] and kernel density analysis [37]
Urban trunk roads’ accessibility
County-level roads’ accessibility
Major transportation hubs’ accessibility
Facility accessibilityGovernment agencies’ accessibility
Educational institutions’ accessibility
Medical institutions’ accessibility
Entertainment places’ accessibility
Kernel density analysis [37]

3. Research Methods

Our objective was to realize the synergy of the quota and space allocations of new urban land and find a better growth scenario for Guangzhou City. The growth potential layer was the foundation for the urban growth simulation, used to build a CA model to conduct the simulation process under two scenarios. Therefore, the methods included urban growth potential calculation, urban growth simulation, and simulation scenario setting.

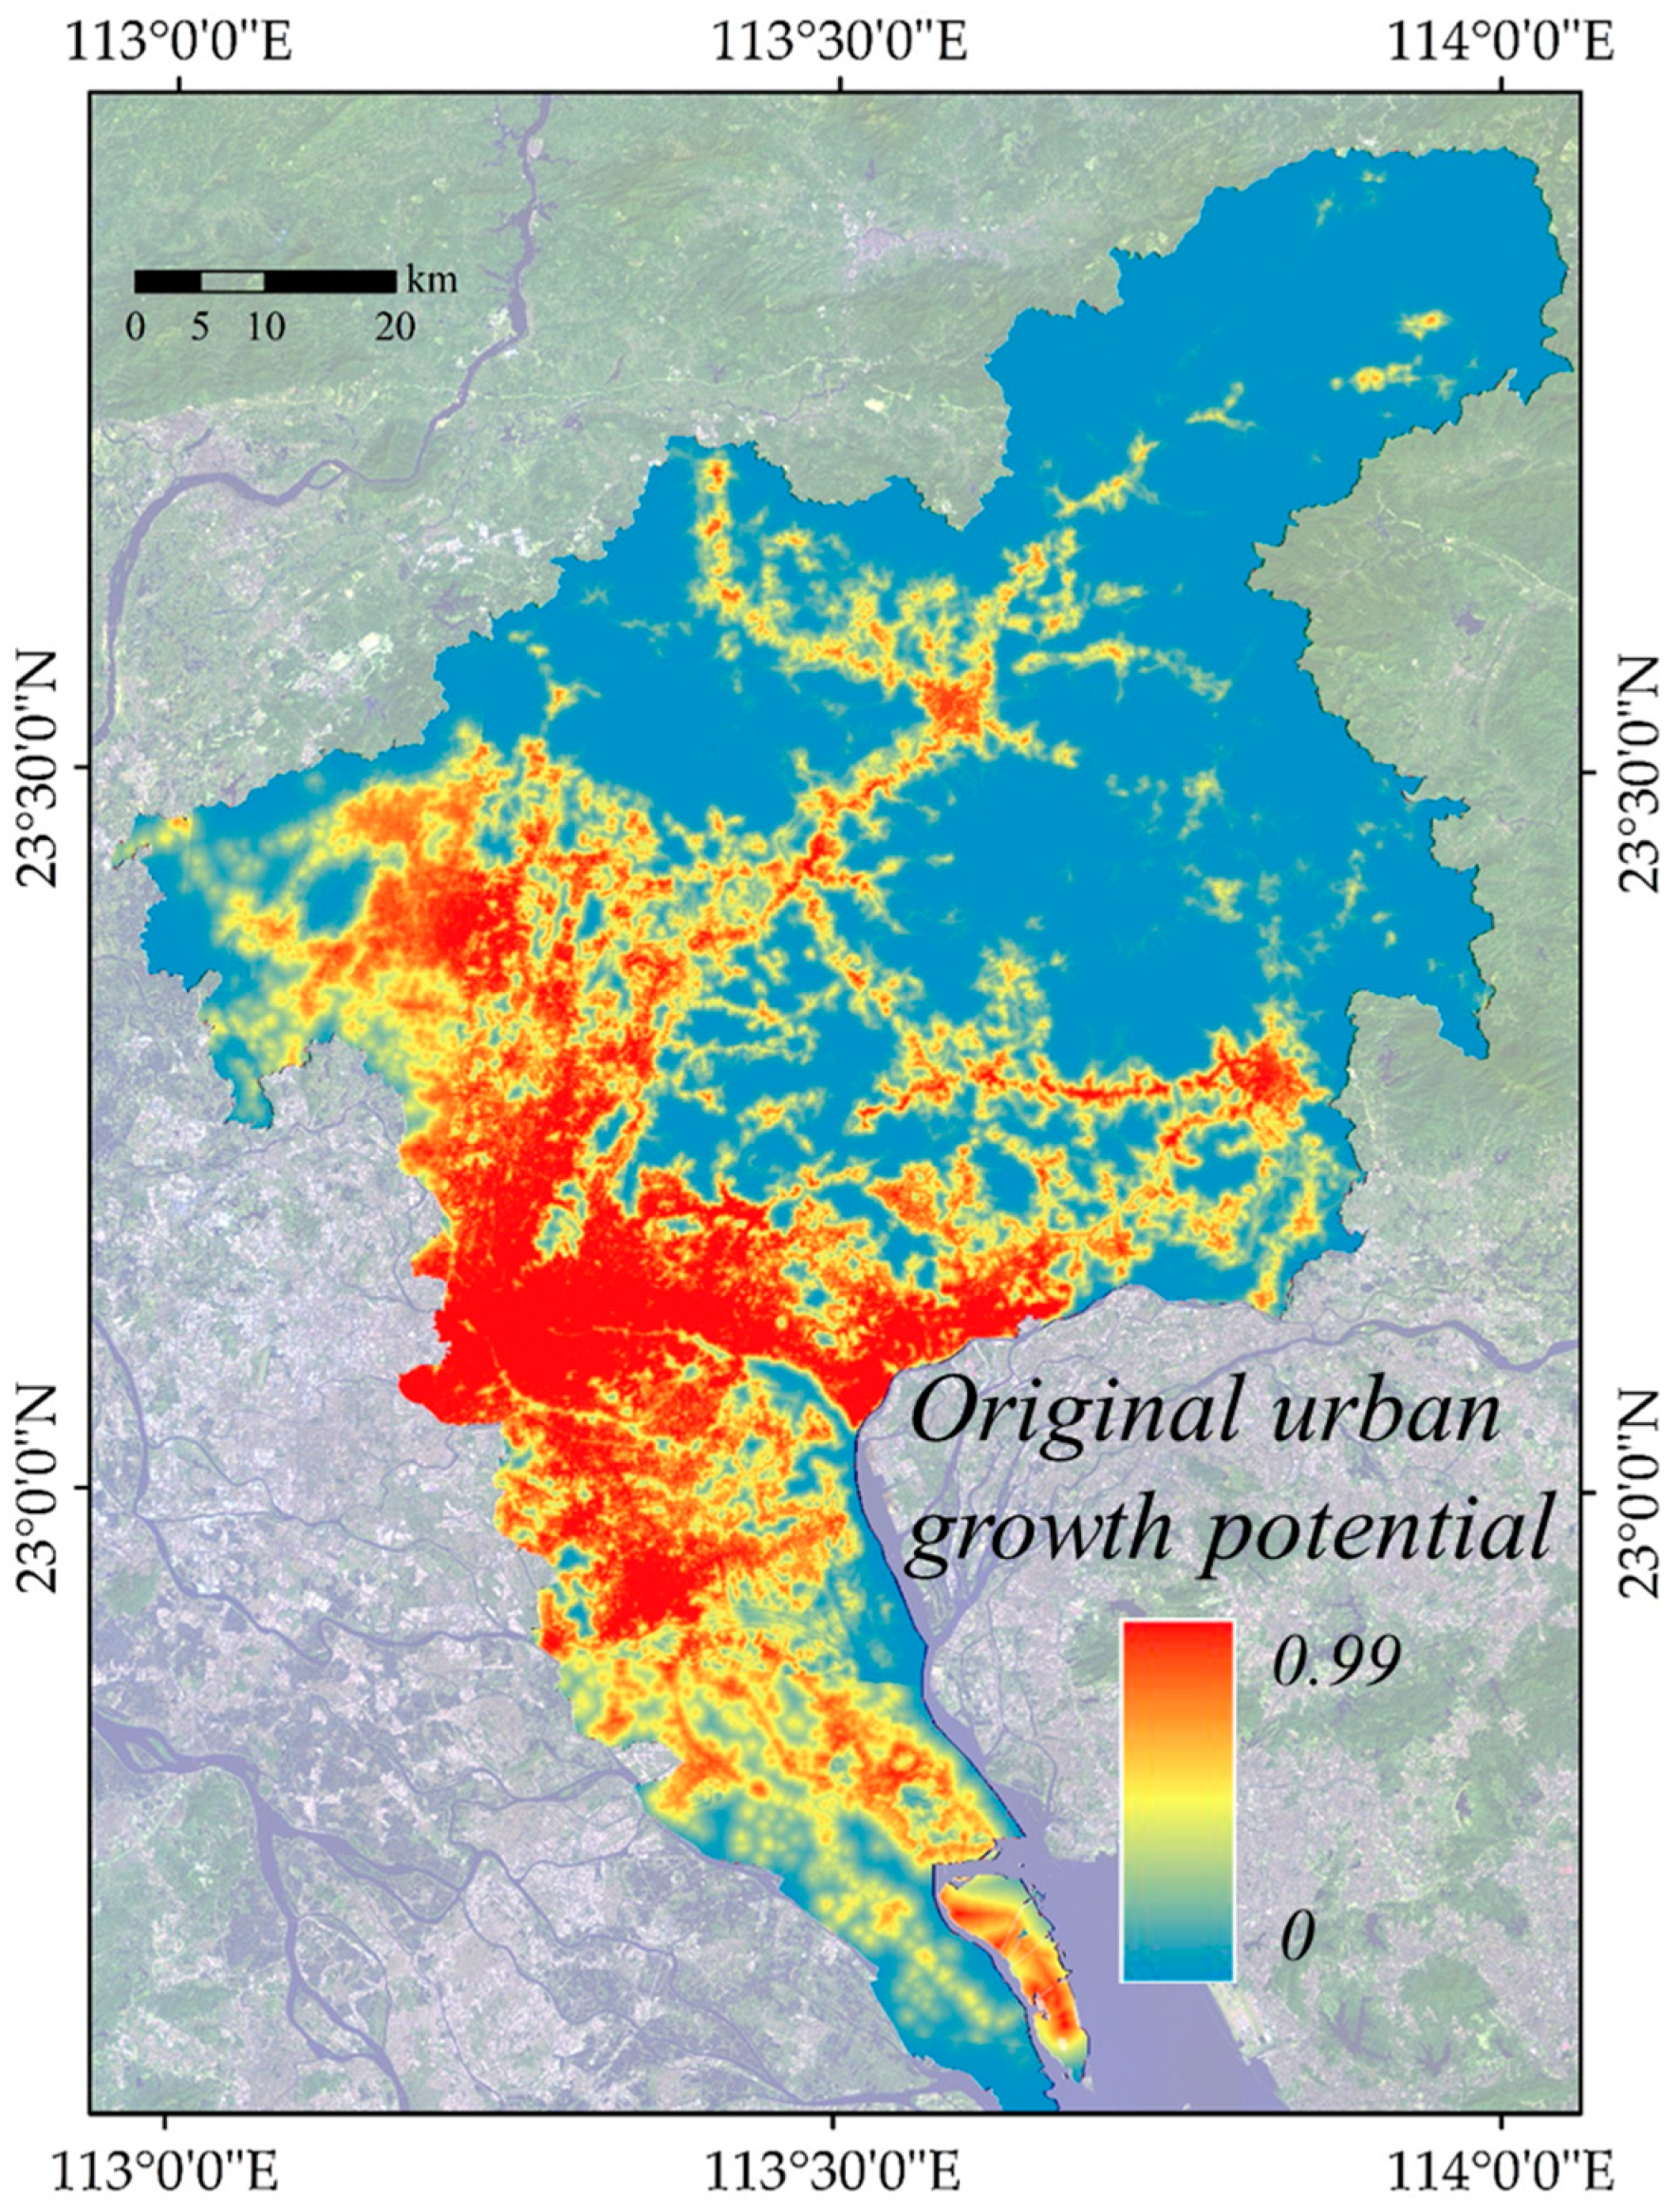
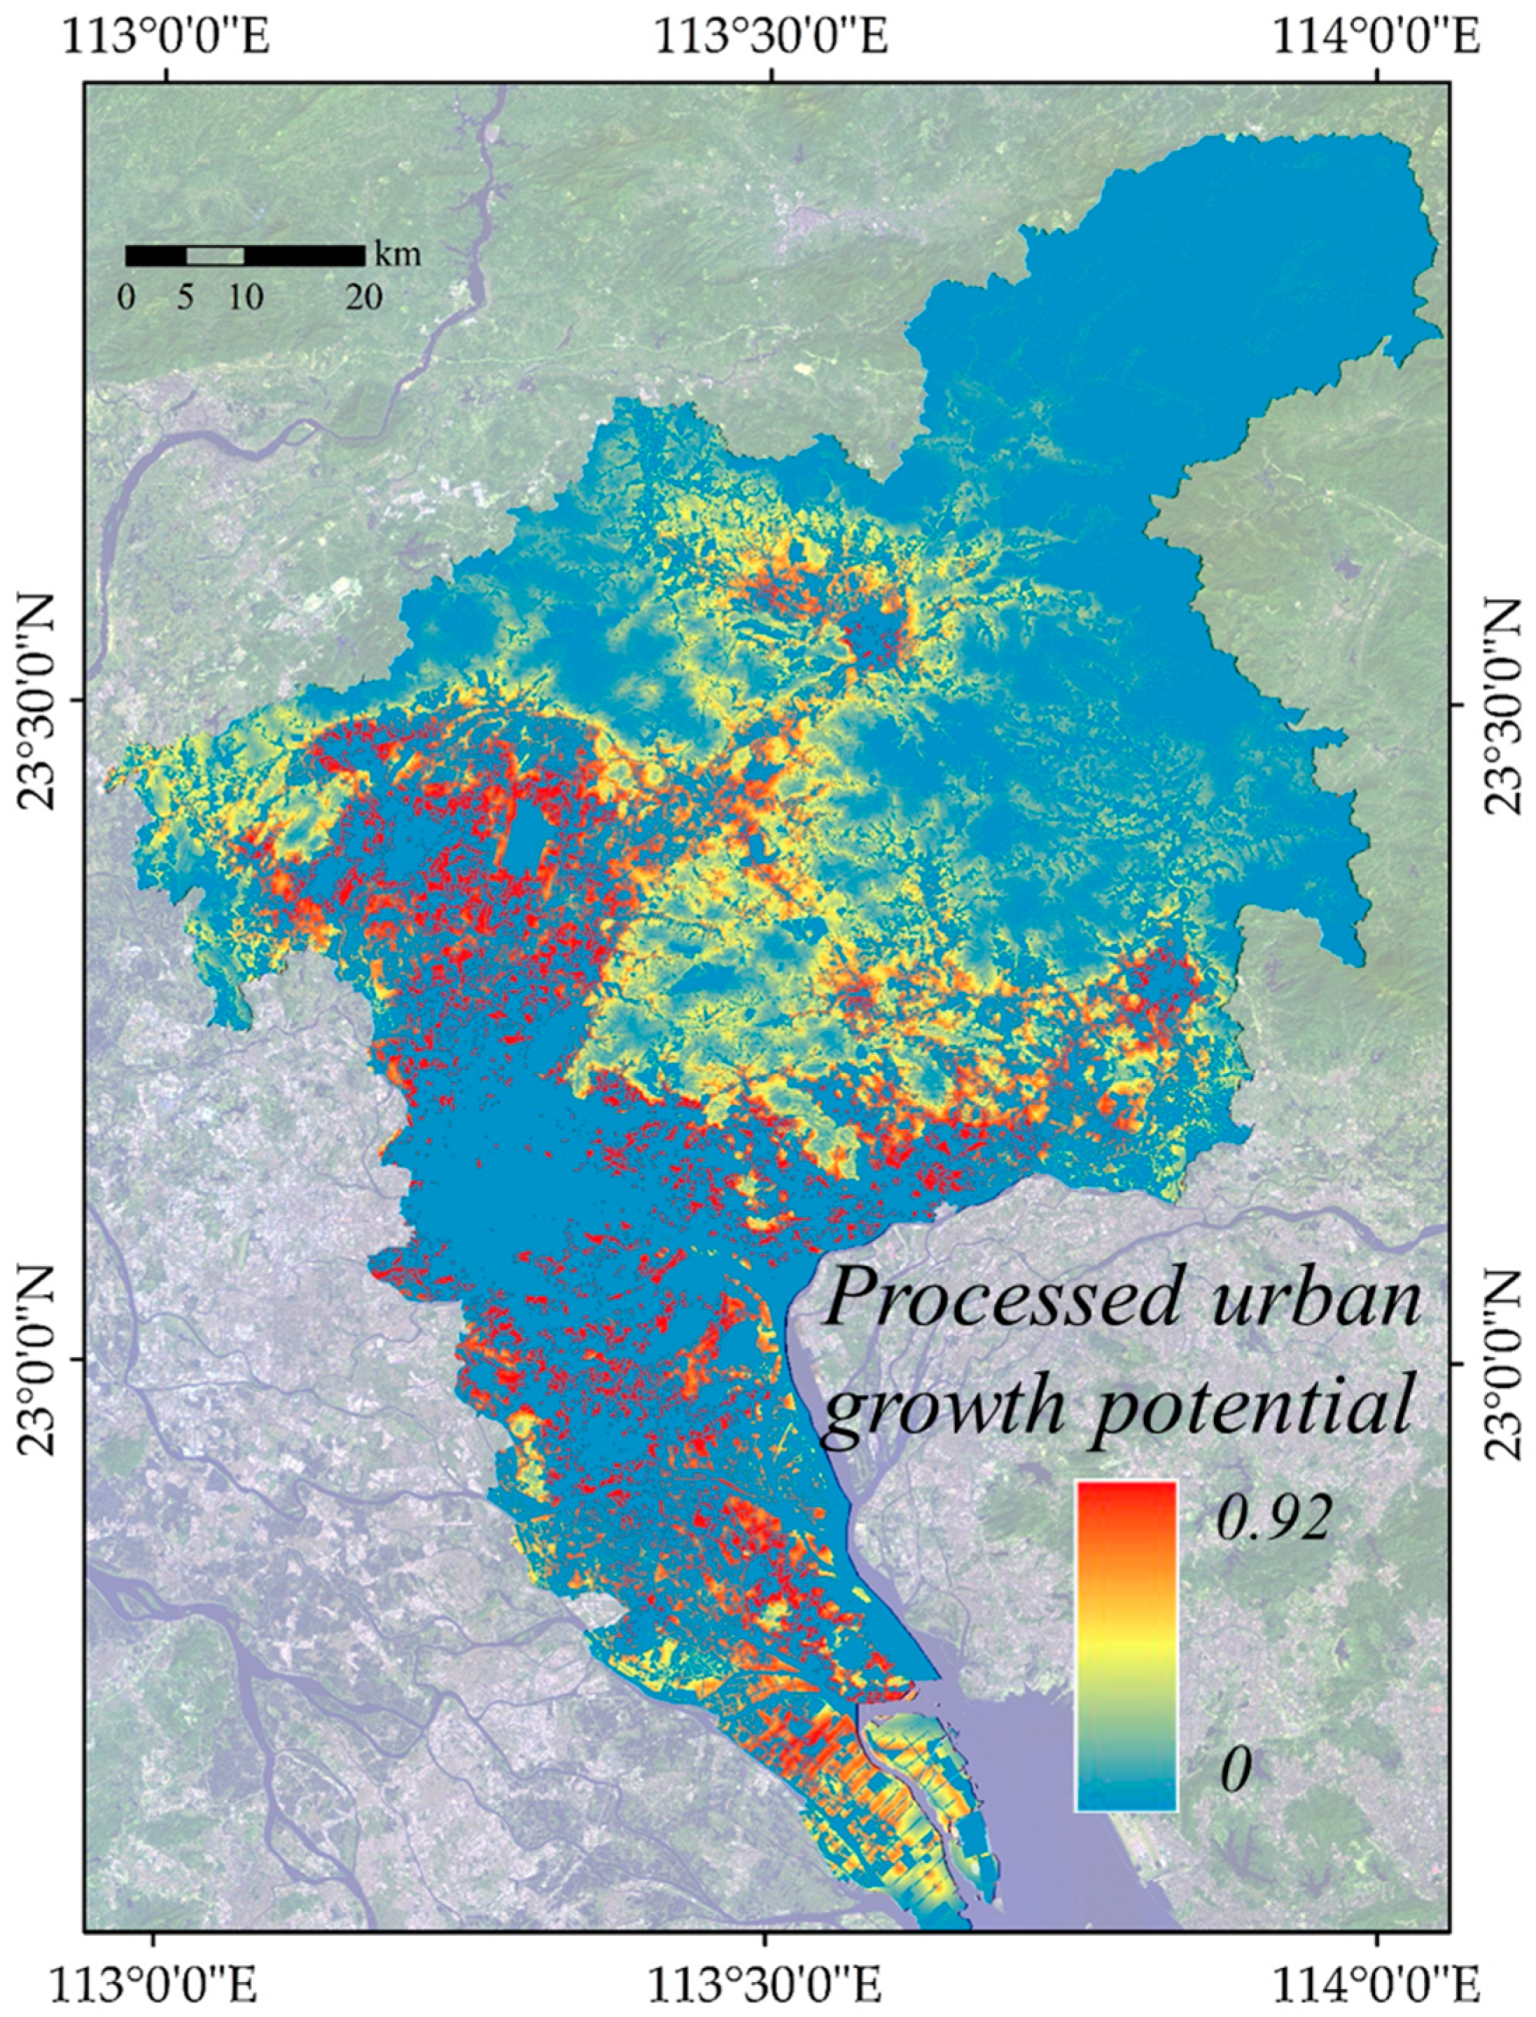
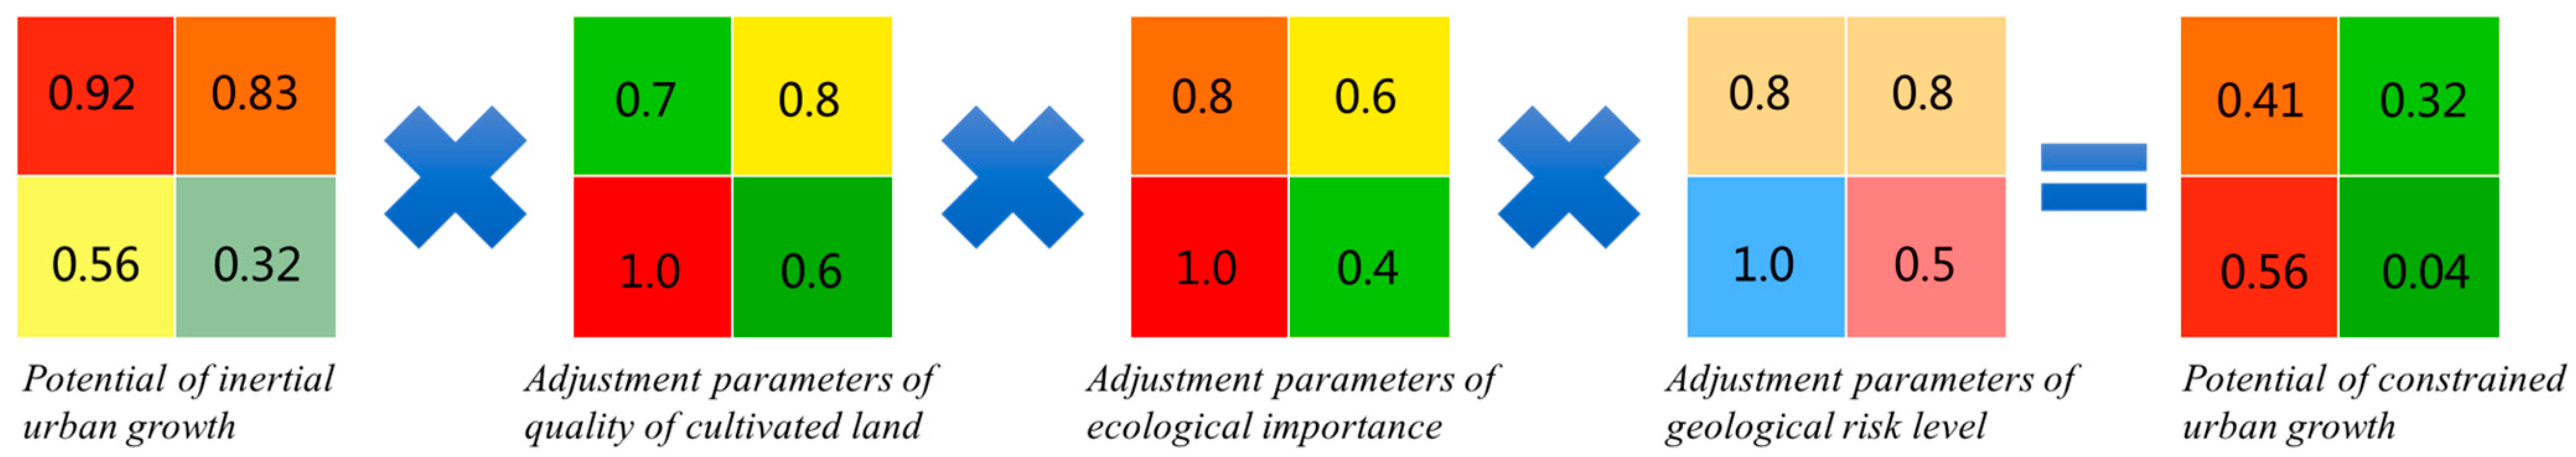
3.1. Urban Growth Potential Calculation

During the study period, the urban growth was dual, implying that one space unit became urban land or not [38,39]. The changed and unchanged units had a value of 1 and 0, respectively. The logistic regression model can effectively process datasets with binary characteristics and summarize their rules [40]. Therefore, we employed a logistic regression model to explore the rules of urban simulation based on these indicators. In addition, we obtained a set of parameters to calculate the urban growth potential in the logistic regression. The logistic regression and calculation processes are shown in Equations (1) and (2), respectively. The original urban growth potential in 2014 is shown in Figure 4.
L o g ( P ) = ln ( P 1 P ) = α + i = 1 n β i x i
P = exp ( α + β 1 * X 1 + β 2 * X 2 + β n * X n ) 1 + exp ( α + β 1 * X 1 + β 2 * X 2 + β n * X n )
where P is the urban growth potential, α is a constant term, x1, x2 ….. xn are the normalized indicators, and β1, β2, ….. βn are the parameters in the logistic regression.

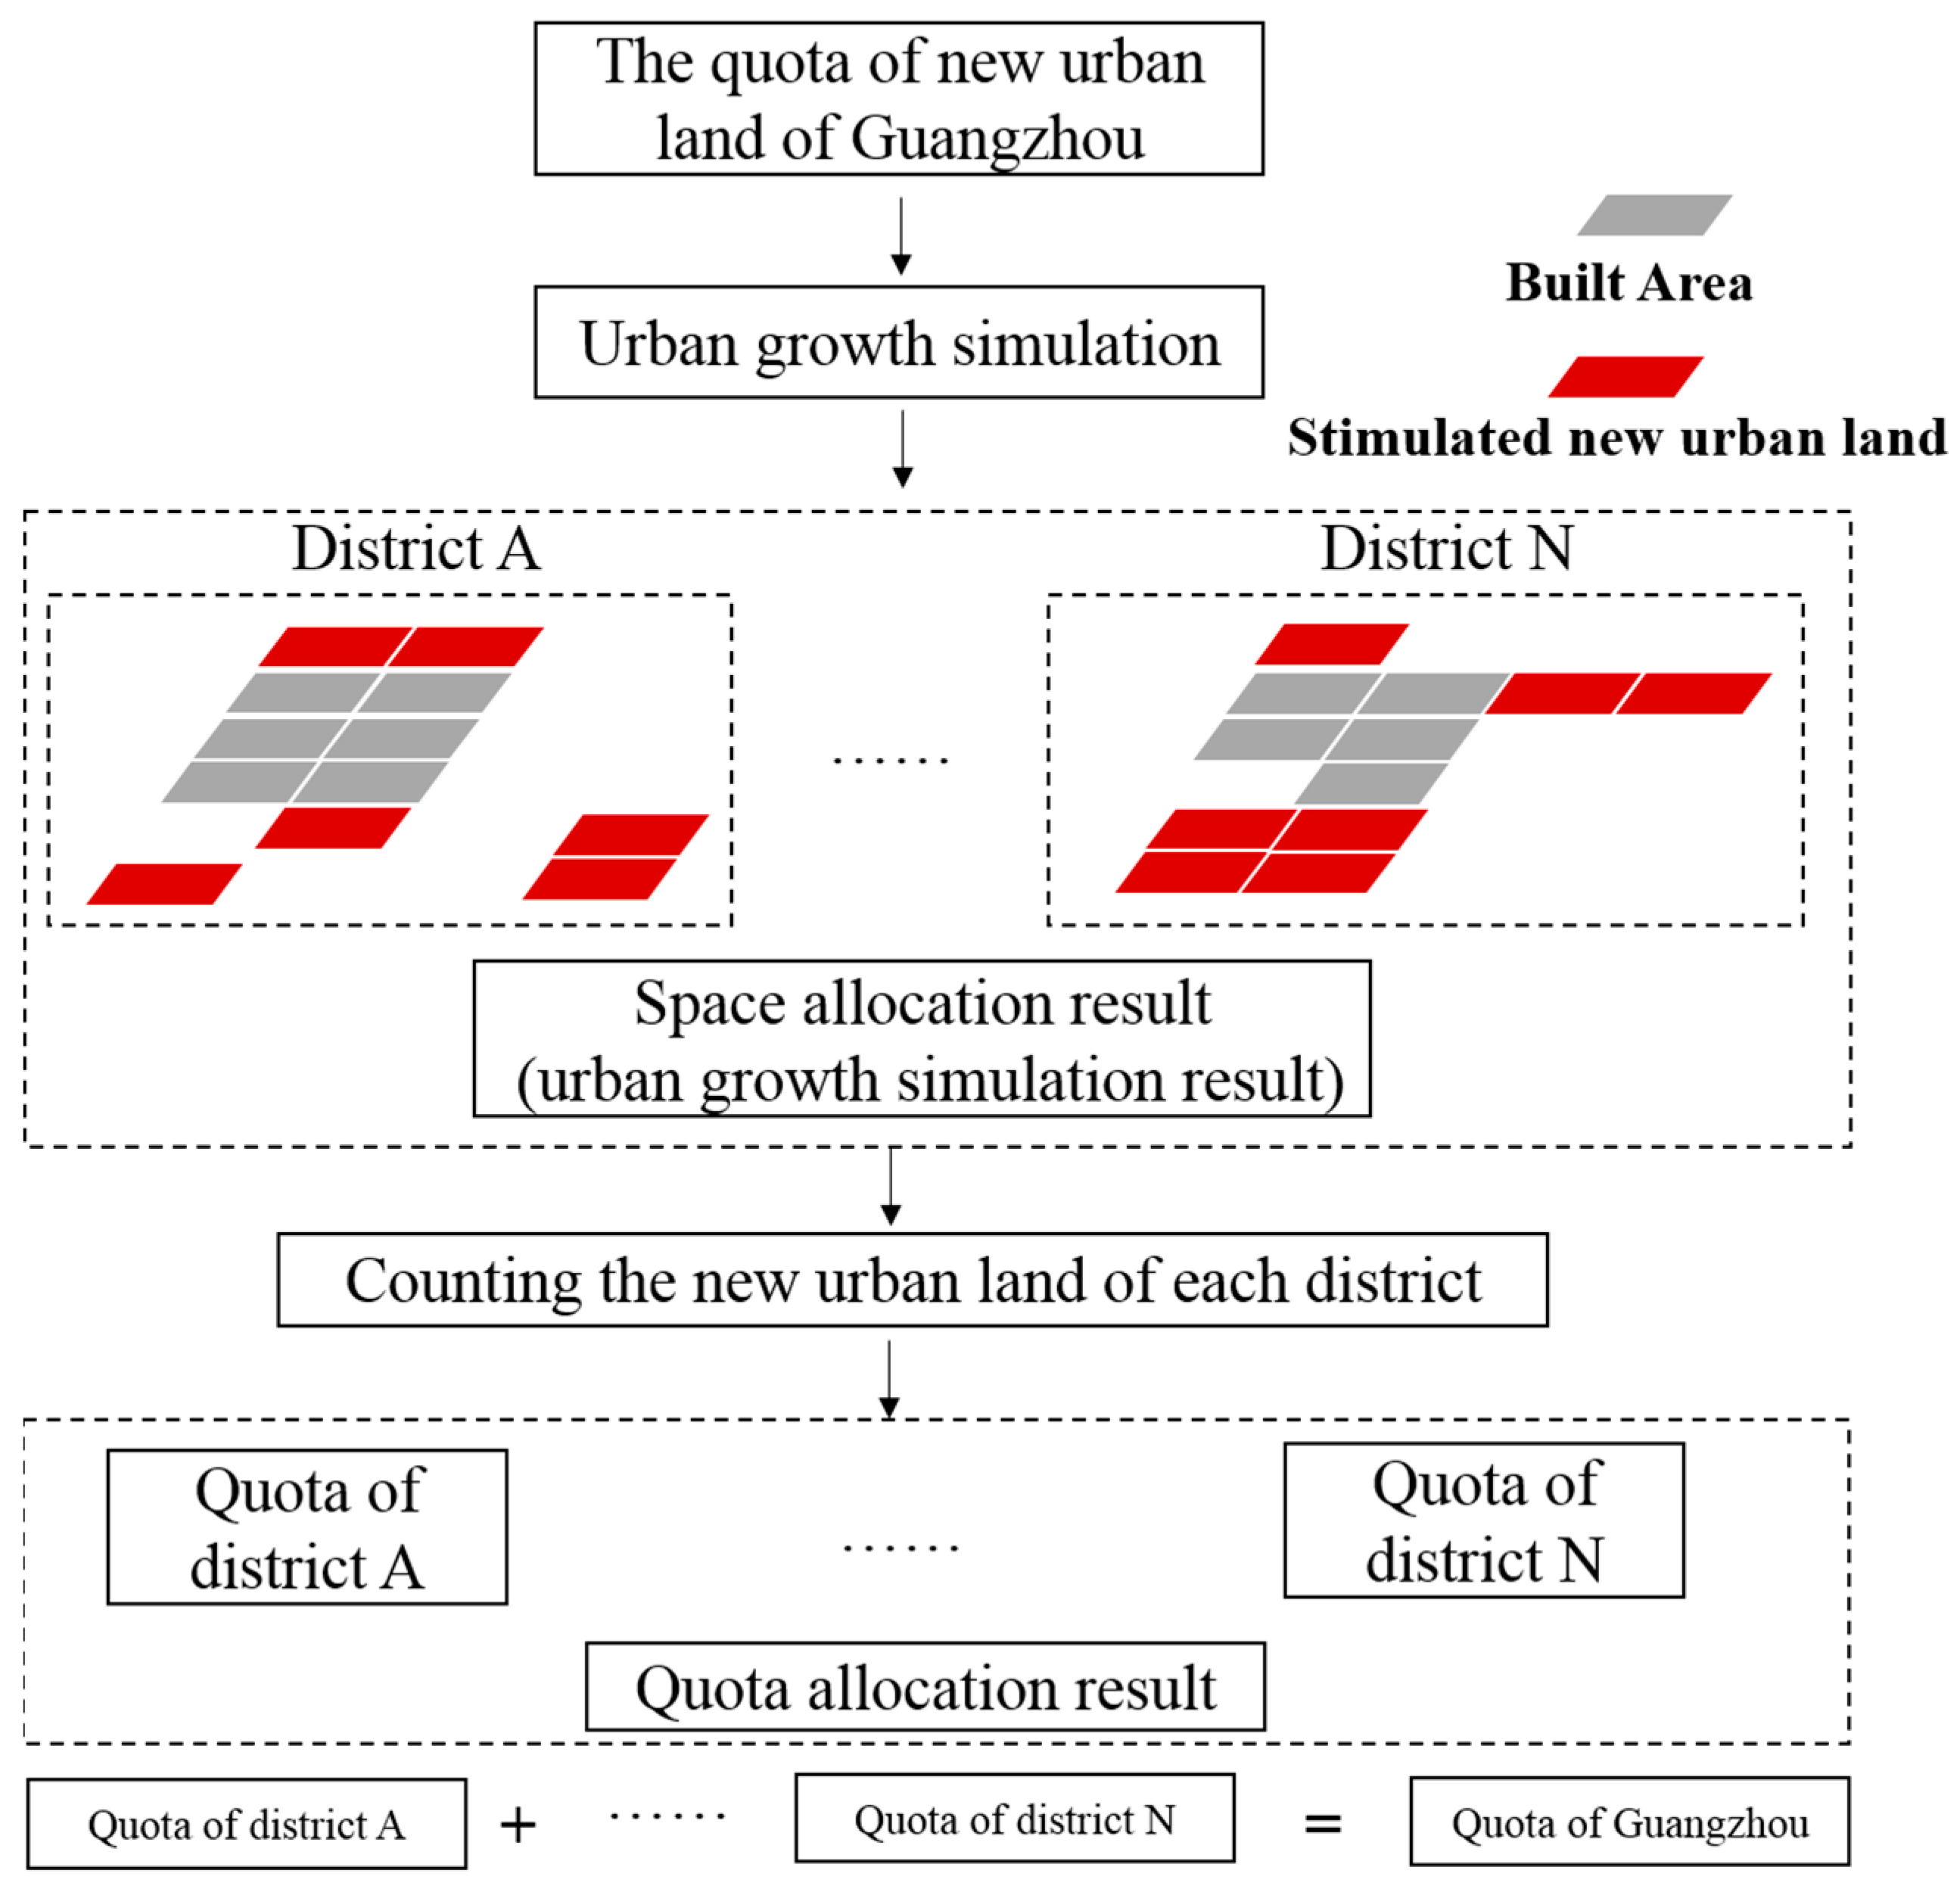
3.2. Urban Growth Simulation

Previous studies have mainly used models such as SLEUTH [41] and FLUS [42] to simulate urban growth. These models are encapsulated and easy to use [43]. However, the input indicators of these models are limited and have poor scalability; for example, in the SLEUTH model, the input indicators include slope, land use, exclusion factors (such as water bodies), urban extent, transportation, and hill shade. In this study, we built indicators for urban simulation based on multi-source data. Our input indicators were more numerous than those of the encapsulated models; therefore, previous encapsulated models were no longer applicable in this study, thus requiring an urban growth simulation model according to the principles of cellular automata (CA) [44]. Several basic elements need to be clarified when using the CA model to perform urban growth simulations, as Table 3 shows.
Before simulating urban growth, the original urban growth potential should be further processed according to the restriction [45] and neighborhood factors [46]. The formula of processed urban growth potential is shown below. The processed urban growth potential is displayed in Figure 5, and its fundamental layer for following urban growth simulation is:
P P i = O P i * R F i * N F i
R F i = c o n [ c e l l i ( b a , m w , h s ) , 0 , 1 ]
N F i = c o n [ ( S i = u r b a n ) , 1 , 0 ] / ( 3 * 3 1 )
where PPi indicates the processed urban growth potential of celli, OPi is the original urban growth potential of celli, RFi is the restrict factors of celli, NFi is the neighborhood factor of celli, ba is built area, mw is the major water body, hs is the cells with a high slope (over 25°), and Si is the status of celli.
Based on the processed urban growth potential layer and the urban growth rules, we built the model using the ArcGIS 10.5 software. The whole simulation process is shown in Figure 6. We first set the variables S and C, where S is the area of simulation and C was used to store the area of converted cells. Before we started the simulation, we set a result layer, which was a blank raster with the same spatial resolution of 100 × 100 m. The value of S was determined by the simulation period, and the initial value of C was 0. First, we traversed the processed urban growth layer, found the cell with the max potential, and called this cellp-max. Second, we added one cell area (1 hectare) to variable C, and the value of C turned from 0 to 1 in the first-round simulation. Third, we converted the cell into urban land in the result layer, whose position was the same as cellp-max in the processed potential layer. After this, we finished one simulation. Then, if S was equal to C, we exited the loop, ended the simulation, and output the simulation result layer; otherwise, we set the potential of cellp-max as 0 in this round and started the next loop [47].
It should be noted that, unlike The General Land Use Planning, after 2020, China started to implement the Land Spatial Planning, where the State Council stopped the distribution of urban land from top to bottom. Thus, the quota of new urban land is allocated from the province to the prefecture city; then, the quota and space allocations are assigned from the prefecture city to the county or district. In addition, some studies used the grey model [48], Markov chain [49], and other methods to predict the scale of new urban land (scale of simulation); however, there were always errors in the predicted results [50]. Therefore, this study used real or authoritative data as the simulation scale. From 2015–2020, we used the real quantity of new urban land as the simulation scale, while from 2021–2035, we used the planned quantity of new urban land, following the Land Space Planning of Guangzhou City (2021–2035) as the simulation scale.
Table 3. Basic elements of the CA model.
NameConnotation
Cell sizeIs the scale of each cell (the smallest spatial unit). In this study, the cell size was 100 × 100 m, which means that the area of one cell is 1 ha.
Scale of simulationIs the area of the new urban land in a certain period. It determines the scale of the simulation process.
Number of iterationsIt specifically refers to a time component during one growth simulation. It can be obtained by dividing the simulation scale by the cell size.
Restriction factorsSome cells cannot be converted into urban land, and its potential needs to be set as 0, such as a built area, a major water body, and areas with a slope greater than 25°.
Neighborhood factorIs the influence of the surrounding cells on the central cell. Following Feng et al. [51], we used a 3 × 3 neighborhood window to calculate this factor.
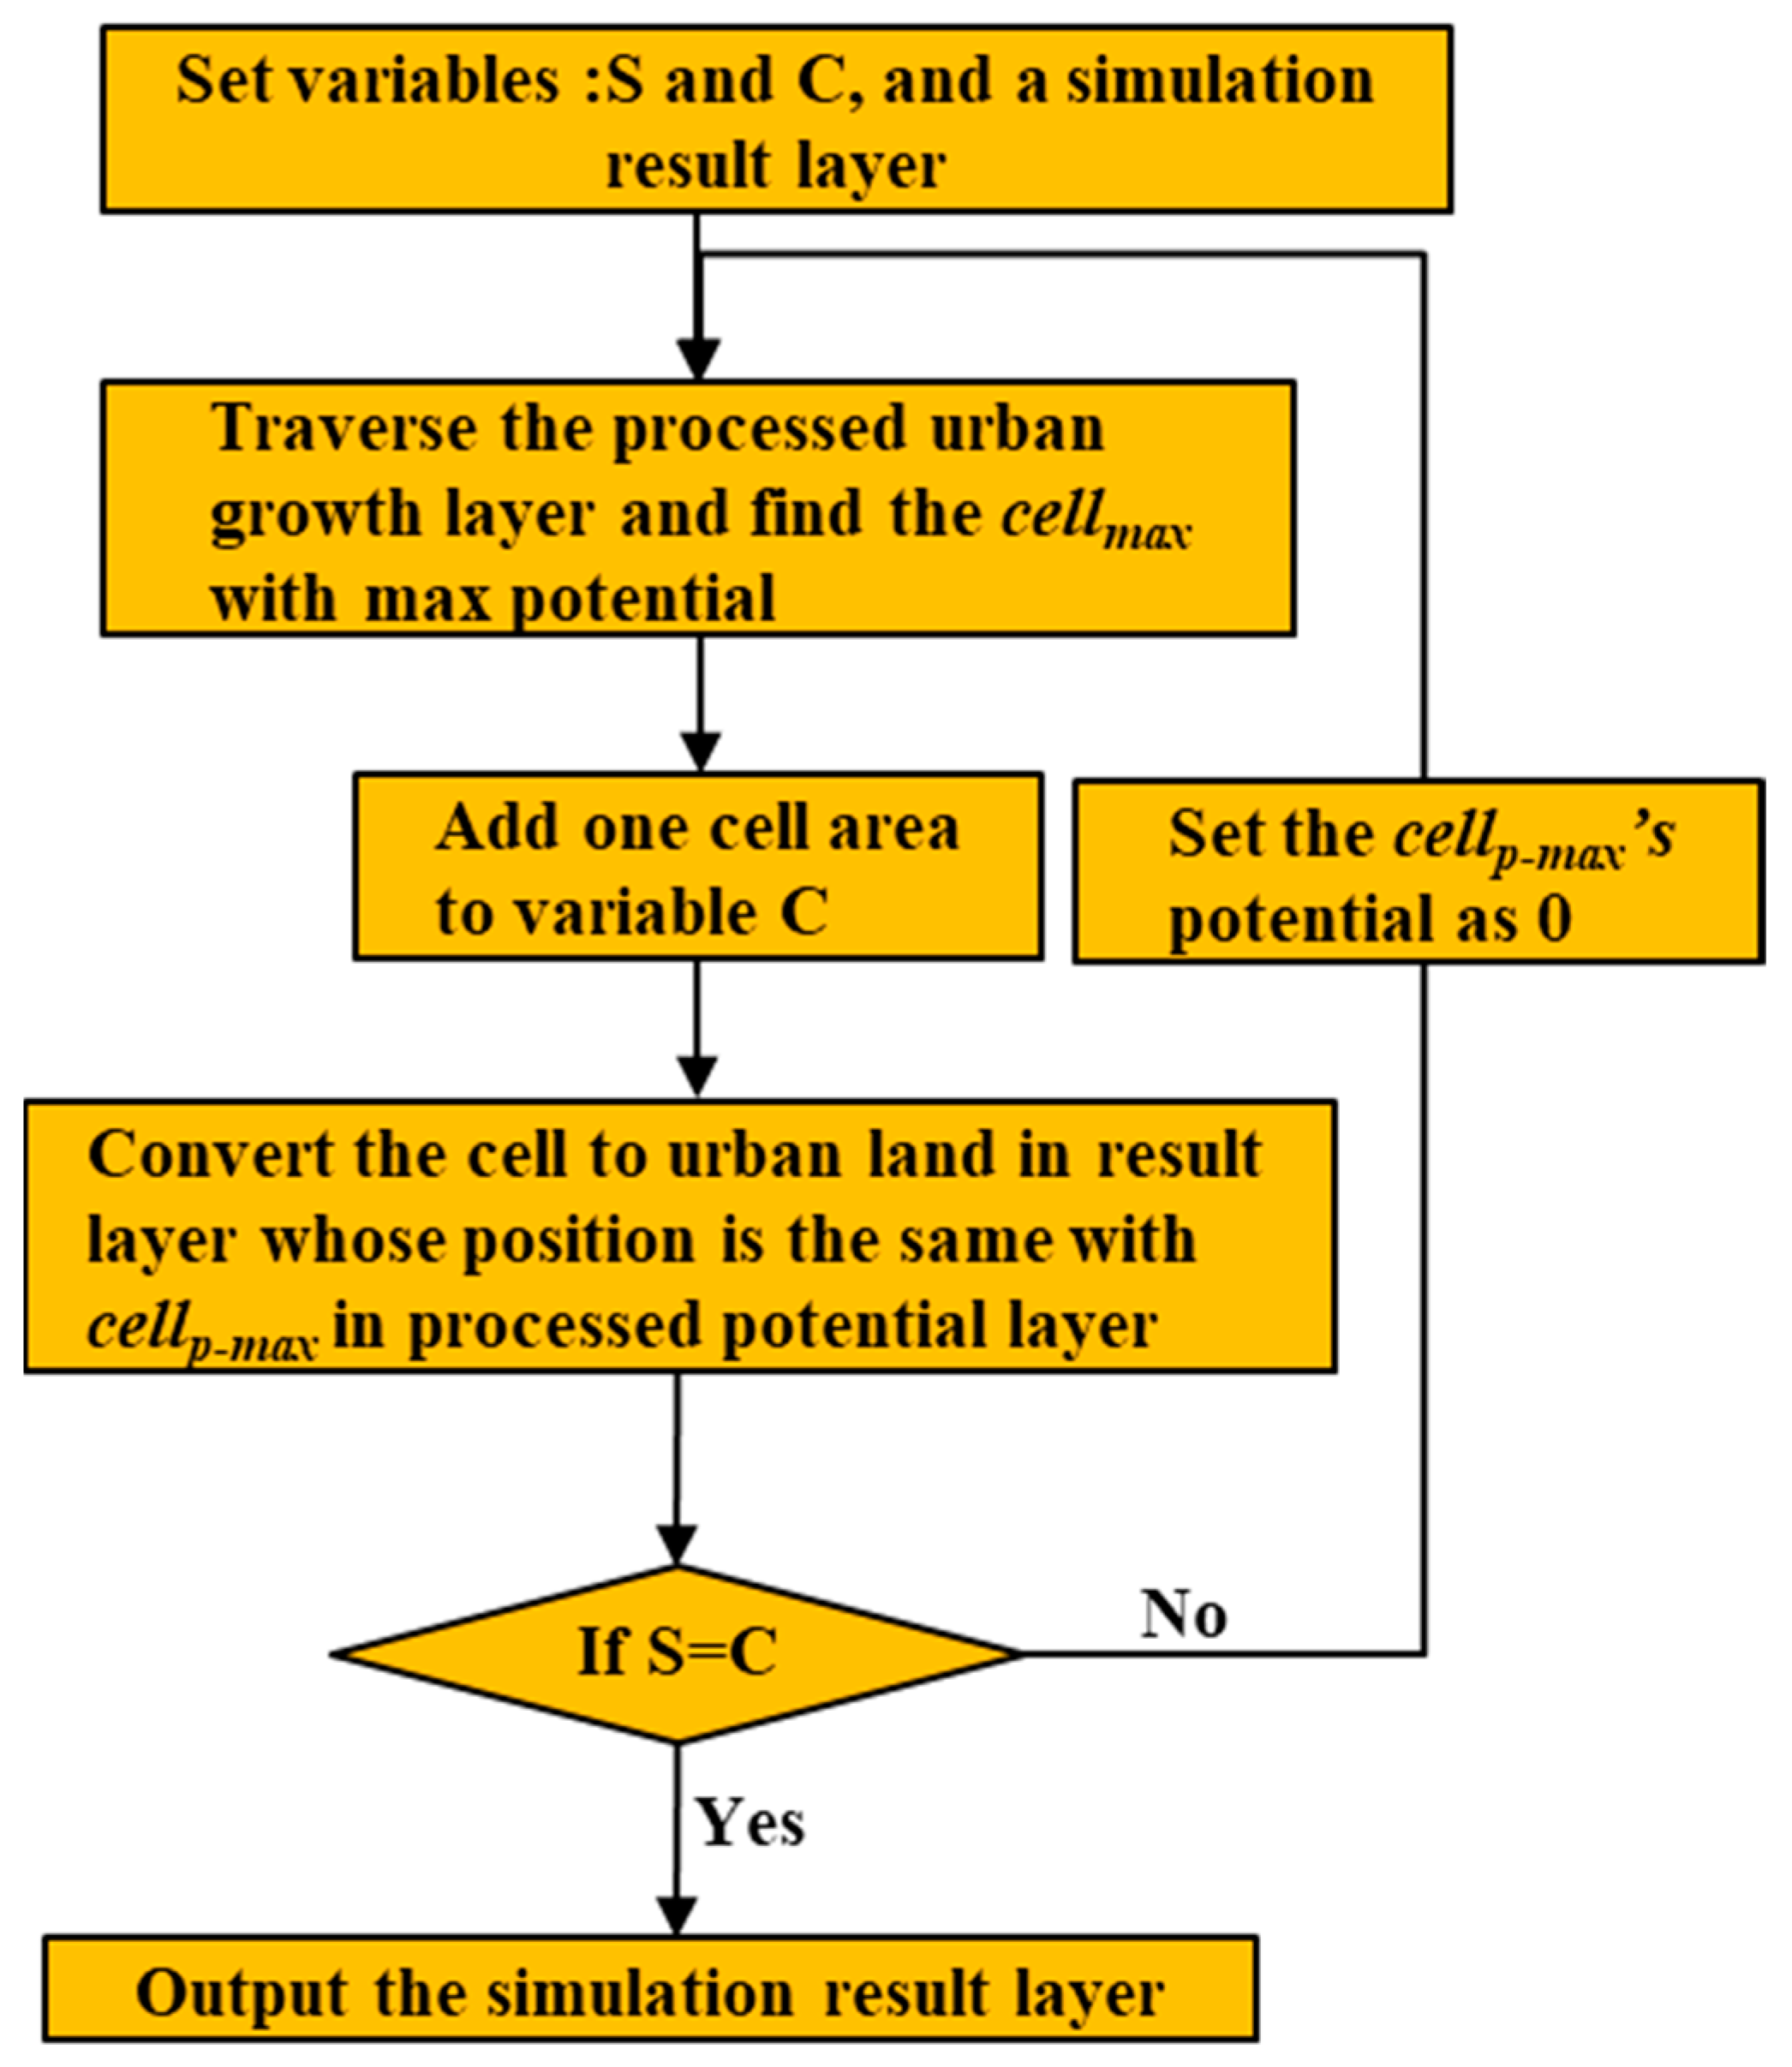
Rules of growthIn this study, we set two growth rules: (1) Every time, traverse all the cells on the processed potential layer, and select the cell with the max potential to convert it into urban land. Set the potential of the converted cell to zero and start the next traversal [52]. (2) When the area of the converted cells reaches the simulation scale, it exits the traversal process, and the simulation will end [52].

3.3. Simulation Scenario Setting

In contrast to the previous Land Use Planning, in the Land Space Planning, the cultivated land protection, ecological protection, and geological safety hold the same significance as economic development [53]. Therefore, these three factors profoundly affect urban growth. To explore how new urban land expands in Guangzhou City and its impact under different conditions, we set up inertial and constrained scenarios for comparative experiments. It should be noted that, in both scenarios, the simulation scale was equal, which was estimated from the Land Space Planning for Guangzhou City (2021–2035):
(1) Inertial growth simulation: Here, we used the previous rules to simulate future urban land growth. Specifically, we calculated the original potential with the set of parameters from the 2015–2020 data and the indicators from the 2020 data, set the potential of the cells in the built area and main water body to 0, and performed the simulation process from 2021–2035 under this scenario.
(2) Constrained growth simulation: Based on the inertial growth simulation, we integrated three constraint factors into this simulation. Specifically, we used constraint factors to adjust the growth potential in the inertial growth simulation and obtained the growth potential for this scenario.
Quality may be more important than quantity for grain production and cultivated land protection [54]. Therefore, we considered the quality data as the adjusted layer for cultivated land protection. The data of cultivated land quality in China were divided into 15 grades (1–15); Guangzhou City had 6 grades, as shown in Figure 7a. The smaller the number, the higher the quality is. Thus, we set the adjusted coefficients for cultivated land protection, as shown in Table 4, to ensure that the better the quality of the cultivated land, the lower its potential to be occupied by urban land would be. For ecological protection, the ecological importance of Guangzhou City was calculated according to Zhang [55]. The ecological importance results are shown in Figure 7b, and the adjusted coefficients of ecological protection are listed in Table 5. We defined that the higher the ecological importance, the lower the adjustment coefficient is; thus, the potential to become an urban land decreases. According to the geological conditions of Guangzhou City, the geological hazard risks are mainly land subsidence and collapse risk. The geological hazard risk level map for geological safety is shown in Figure 7c, and the adjusted coefficients are listed in Table 6. Similarly, we defined that the higher the geological safety risk, the lower the adjustment coefficient is; thus, the potential of becoming urban land decreases. Owing to the lack of relevant reference data, the adjustment parameters of this study were obtained by consulting the relevant experts. The adjustment process of the constraint factors is displayed in Figure 8. After the adjustment, the potential of a cell with high-quality cultivated land, ecological importance, and geological safety risk decreased.

4. Results

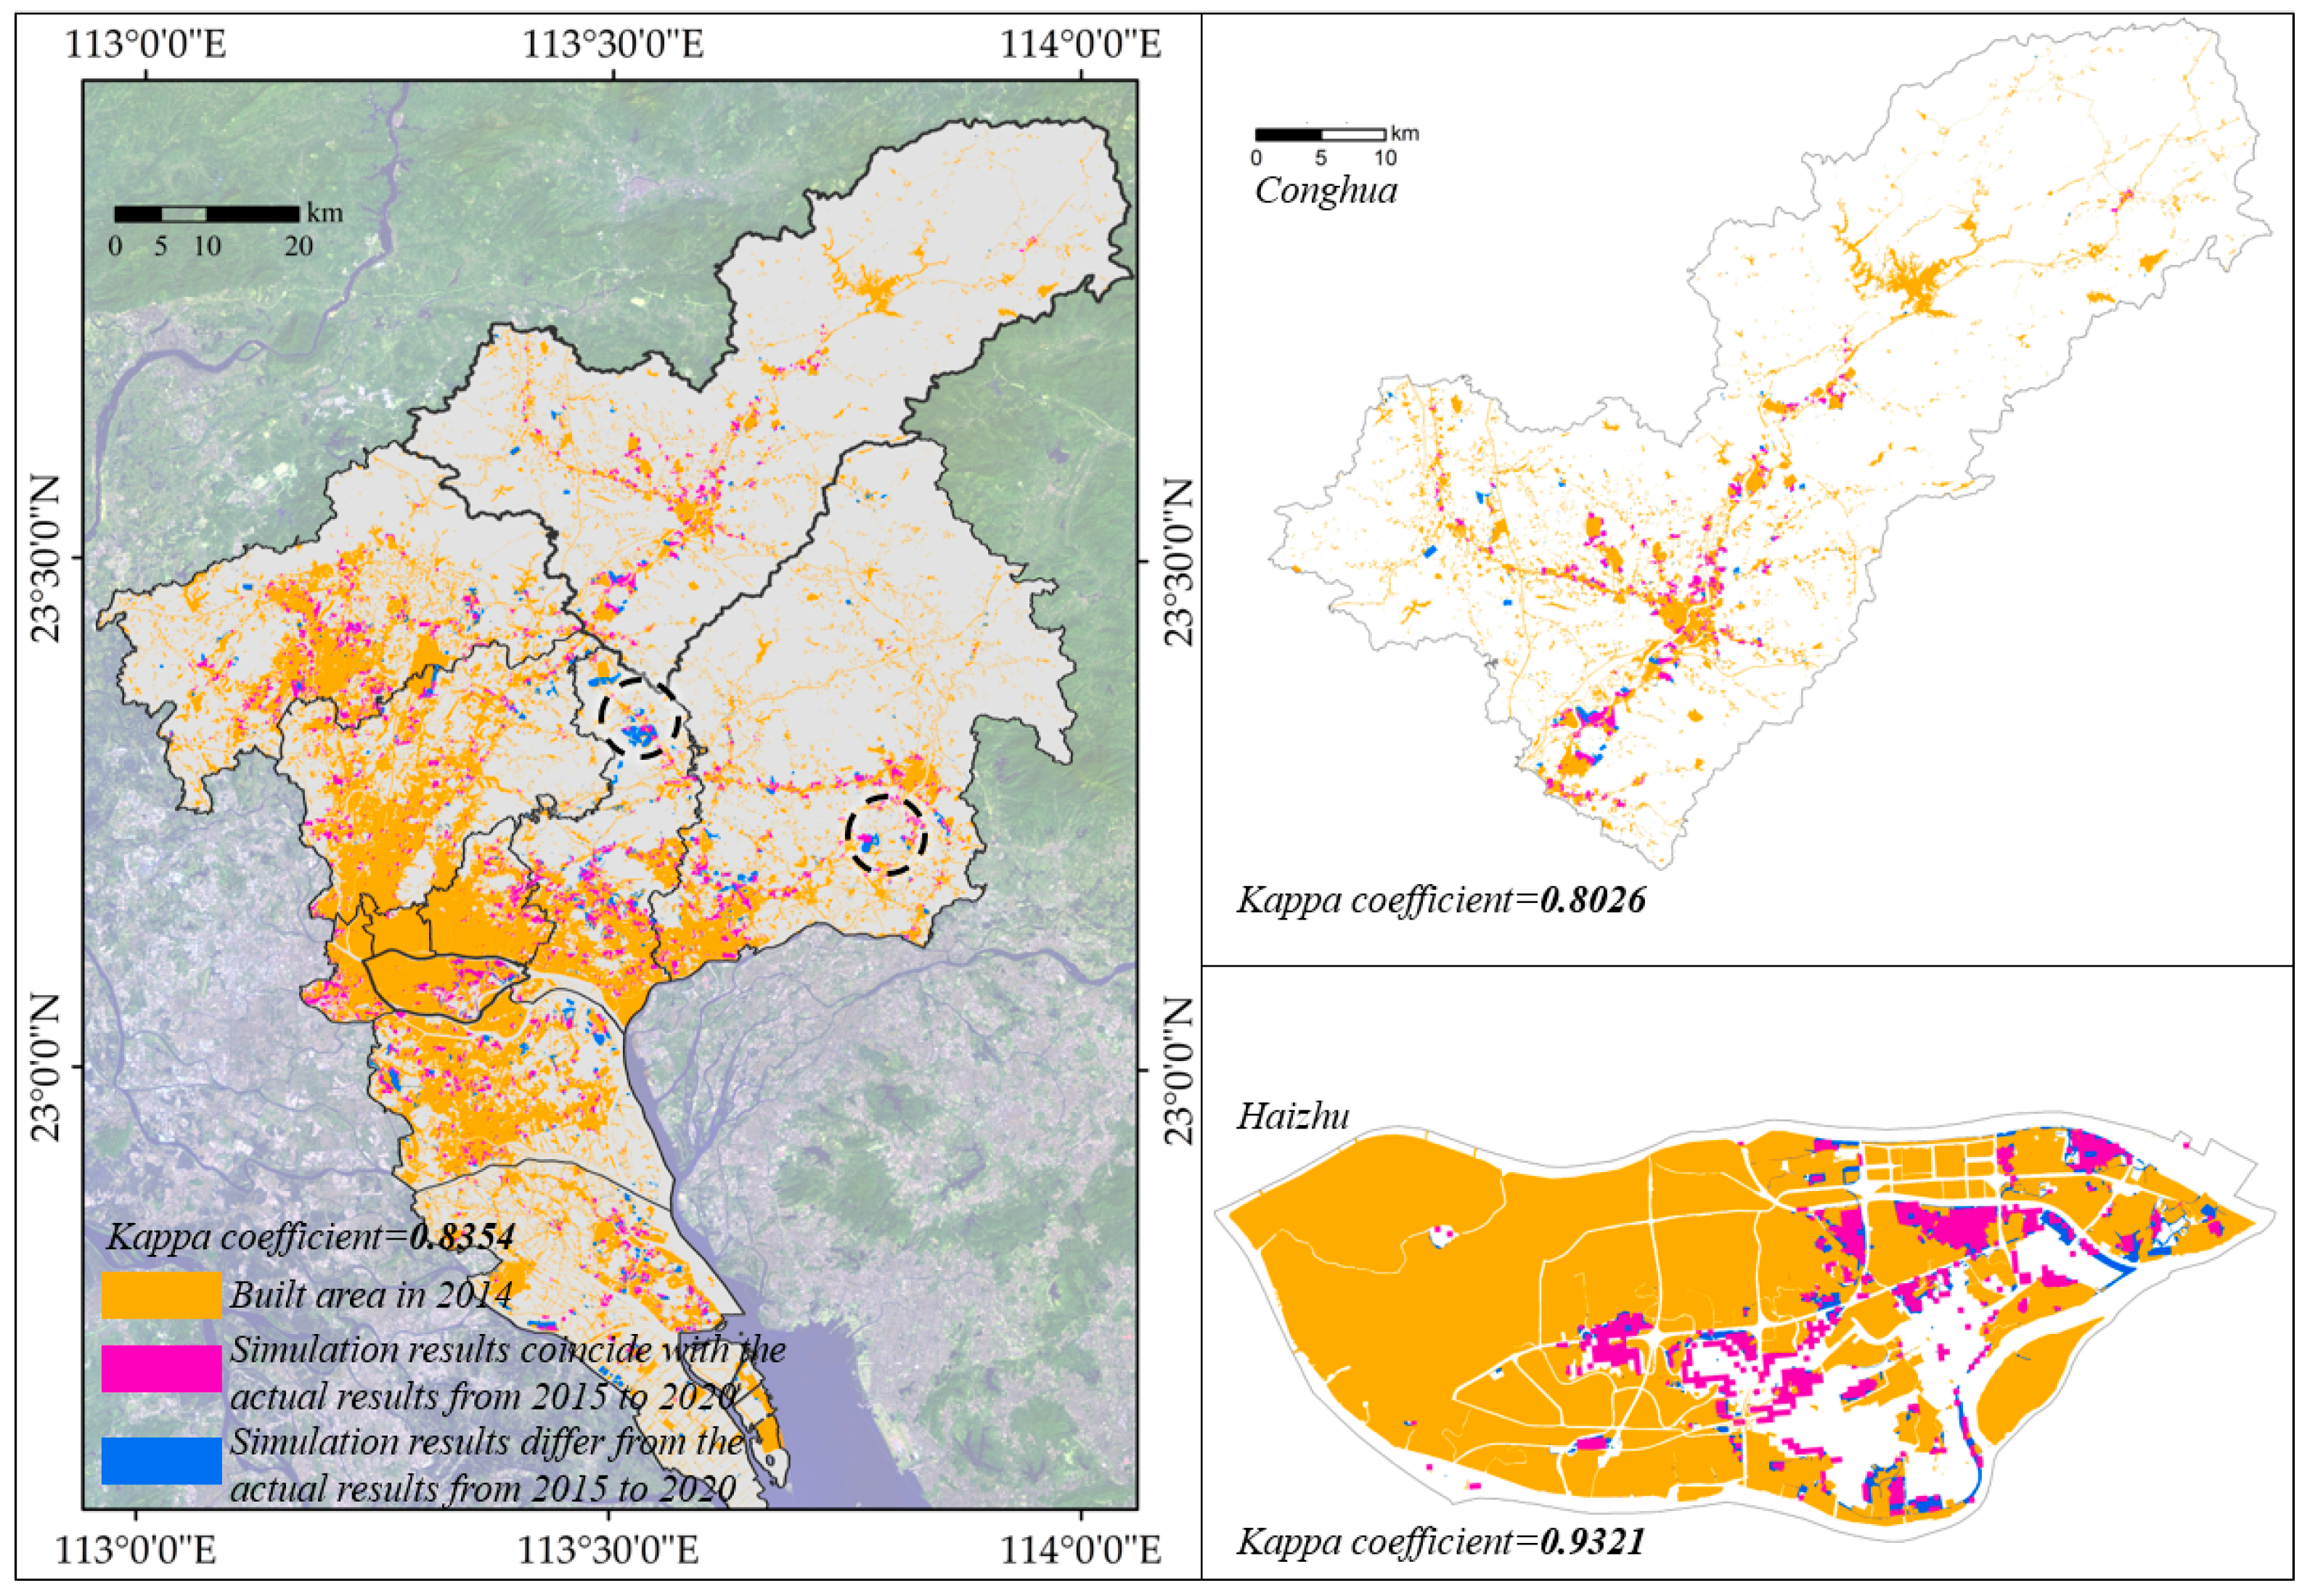
4.1. Accuracy of Urban Simulation Results

Before conducting the urban simulation from 2021–2035, the accuracy of the simulation method used in this study had to be evaluated. Therefore, we first simulated the urban growth from 2015–2020 and validated the simulation results. The Kappa coefficient is the most-widely used indicator of consistency between simulation or image classification and the actual results [56].
The Kappa coefficients of the different districts for the simulated and actual results from 2015–2020 are shown in Table 7, and the results for Guangzhou City and two typical districts are shown in Figure 9. The Kappa coefficient of the Guangzhou City urban growth simulation was 0.8354, which is highly accurate according to the classification of the Kappa coefficient [57]. This indicated that our simulation method is reliable and could be used to simulate urban growth further. Likewise, we found that the districts of the core area (such as Liwan and Haizhu) had higher Kappa coefficients than those of the outer area (such as Conghua, Zengcheng, and others). This indicates that our method can better simulate urban growth in the core than in the outer areas. This can be explained because the population and economic vitality of the core area are relatively high, and the supporting facilities are relatively complete; therefore, the urban growth pattern may better fit the rules summarized by logistic regression, allowing the growth in the core area to be more easily predicted. However, the outer area does not have the same developmental conditions as the core area; therefore, urban growth in the outer area may be more difficult to predict. We marked with circles different areas of the simulated and actual results in Figure 8. These areas are primarily planned economic and technological development zones. In our model, these areas always have a low potential for urban growth, and they can be converted mainly by policy factors. Another reason is that the core area is already developed, and the potential area for urban growth in the core is less than that in the outer area. Therefore, the core area had little choice regarding urban growth, whereas the outer area had sufficient land with urban potential.

4.2. Analysis of Urban Growth Simulation Results of Two Scenarios from 2021–2035

We simulated urban growth in the inertial and constrained scenarios from 2021–2035, as shown in Figure 10. We drew a diagram to describe the space and quota allocation processes of new urban land, shown in Figure 11. Compared with Figure 1, our method started by completing the space allocation of Guangzhou City; then, we counted the new urban land areas as the quota of each district. Thus, we found the synergy between space and quota allocations of new urban land. Overall, the simulation results of the two scenarios differed significantly; for example, parts of Baiyun Mountain were occupied as urban land in the inertial scenario, which is not possible because Baiyun Mountain has a significant ecological value. However, the constrained scenario avoided this error. Specifically, we analyzed the differences in the following three aspects.

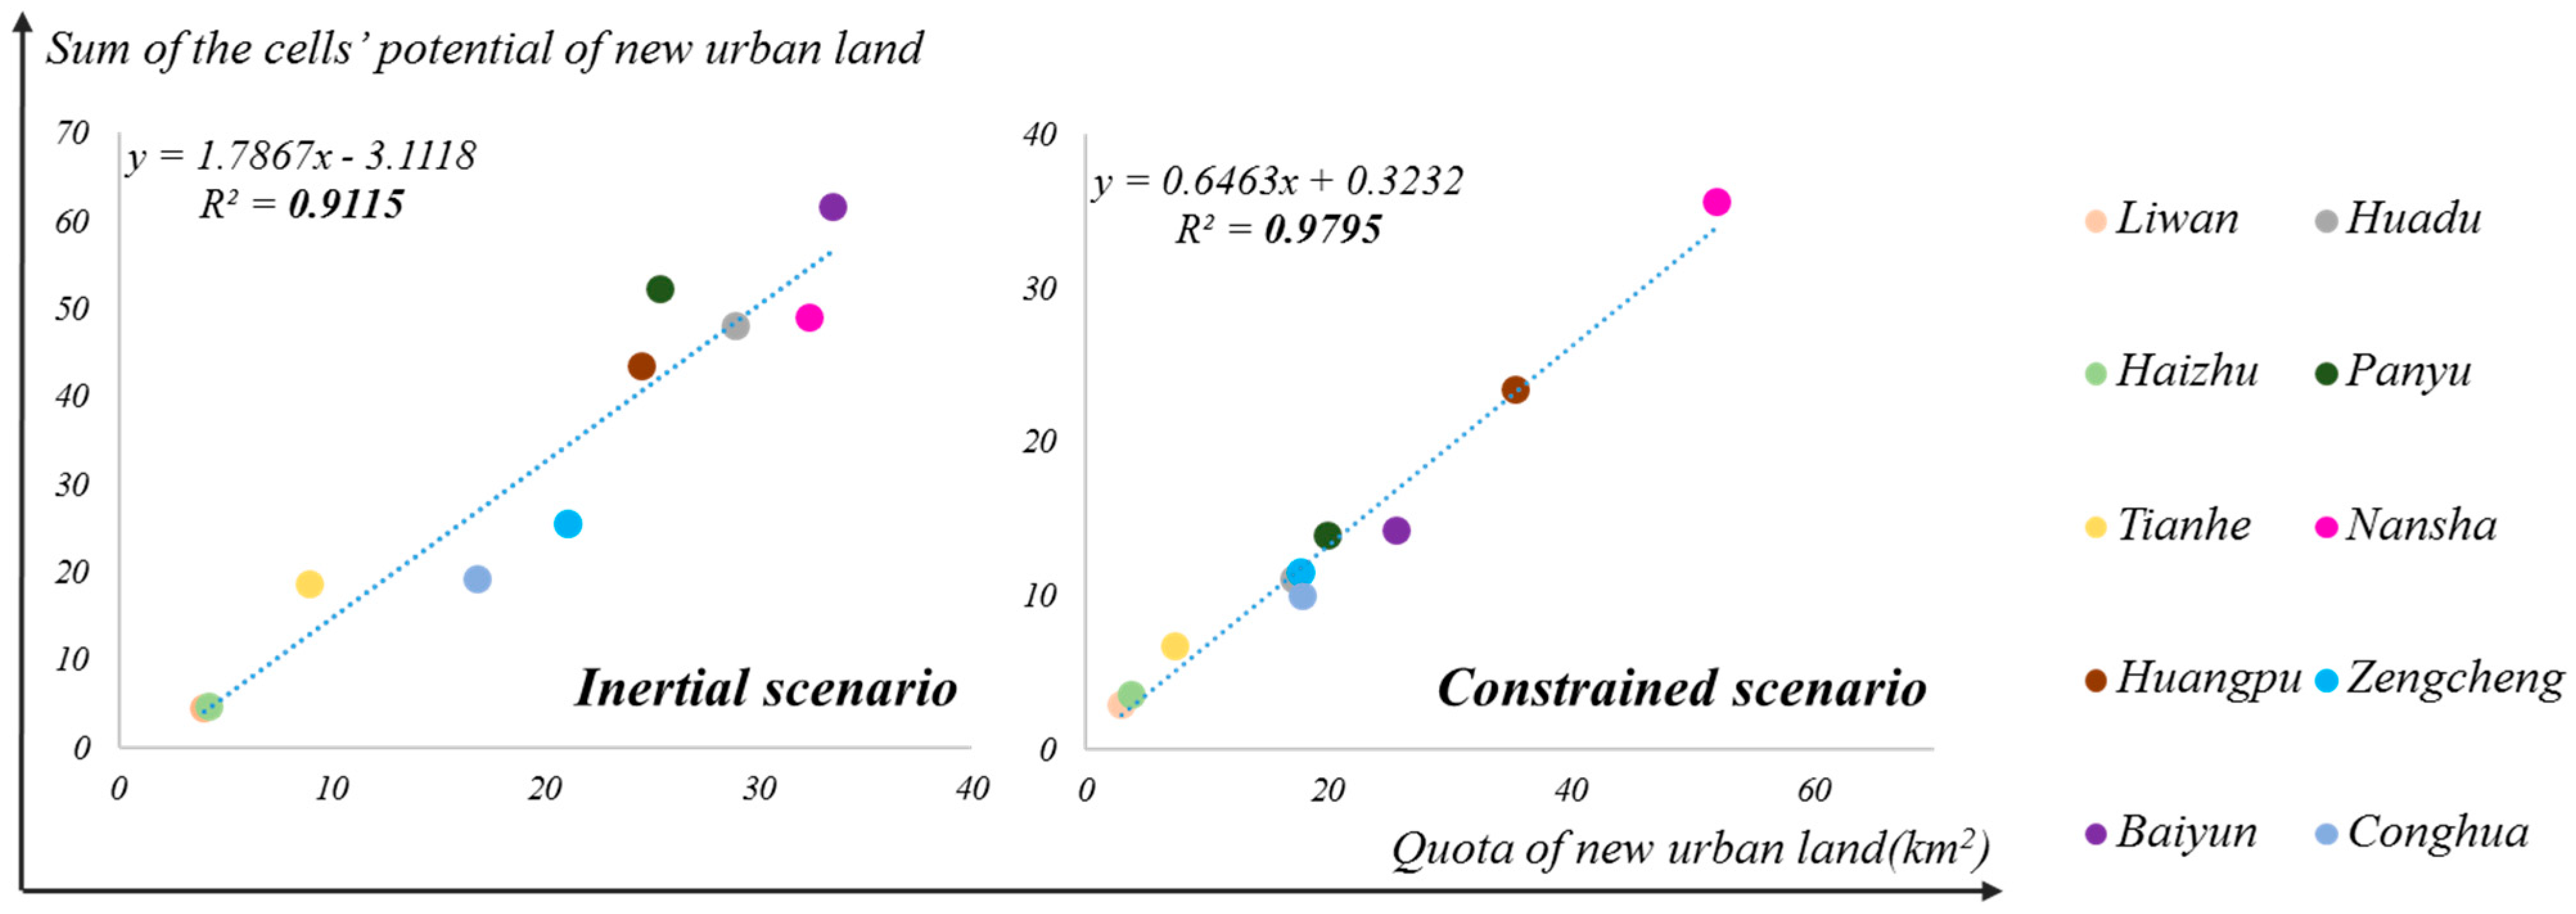
4.2.1. Differential Analysis of Quota Allocation

Using a growth simulation, we coordinated quota and space allocations, finding that the two scenarios showed differences in quota allocation. The quota allocation results are shown in Table 8. We found that Huadu and Baiyun reduced the newest urban land by 11.81 and 7.85 km2, respectively. However, Nansha and Huangpu increased the new urban land by 19.70 and 10.94 km2, respectively. The two scenarios represent two different development patterns, and the increase or decrease in new urban land between districts represents a game of development rights. In addition, we calculated the correlation between the quota of new urban land and the potential of the corresponding cells in each district, as shown in Figure 12. We found that the correlation coefficient between the new urban land quota and the sum of the potential in the constrained scenario was higher than that in the inertial scenario. This result may indicate that the new urban land quota has more synergy with the potential urban growth under a constrained scenario, which implies that the quota allocation is more reasonable in a constrained scenario.
We introduced two tools that could more intuitively display the difference in the new urban land quota allocation, the gravity center and standard deviation ellipse, which are widely used to characterize allocating geographical elements [58]. The concept and calculation method for the gravity center and standard deviation ellipse can be found in Polajzer’s research [59]. In Figure 13, it is evident that the gravity center of the new urban land in the inertial scenario mainly moved to the north by approximately 0.8 km every year. However, in the constrained scenario, the gravity center moved southeast and approximately 0.5 km every year. To a certain extent, new urban land refers to a development space, and the motion of gravity for new urban land represents the development direction of a city. Therefore, we can conclude that, following the previous pattern, Guangzhou City develops to the north, whereas it develops to the southeast under the constraint condition. Moreover, the standard deviation ellipse of the constrained scenario was slenderer, compared to that of the inertial scenario, which implied that the new urban land is more concentrated along the major axis of the ellipse. The Land Space Planning of Guangzhou City proposes an eastward and southward development strategy. Huangpu is the future industrial center of Guangzhou City, and Nansha will be built as the sub-center of Guangzhou City. Therefore, the constraint scenario is more in line with the requirements of farmland and ecological protection, geological security, and the development strategy of Guangzhou City.

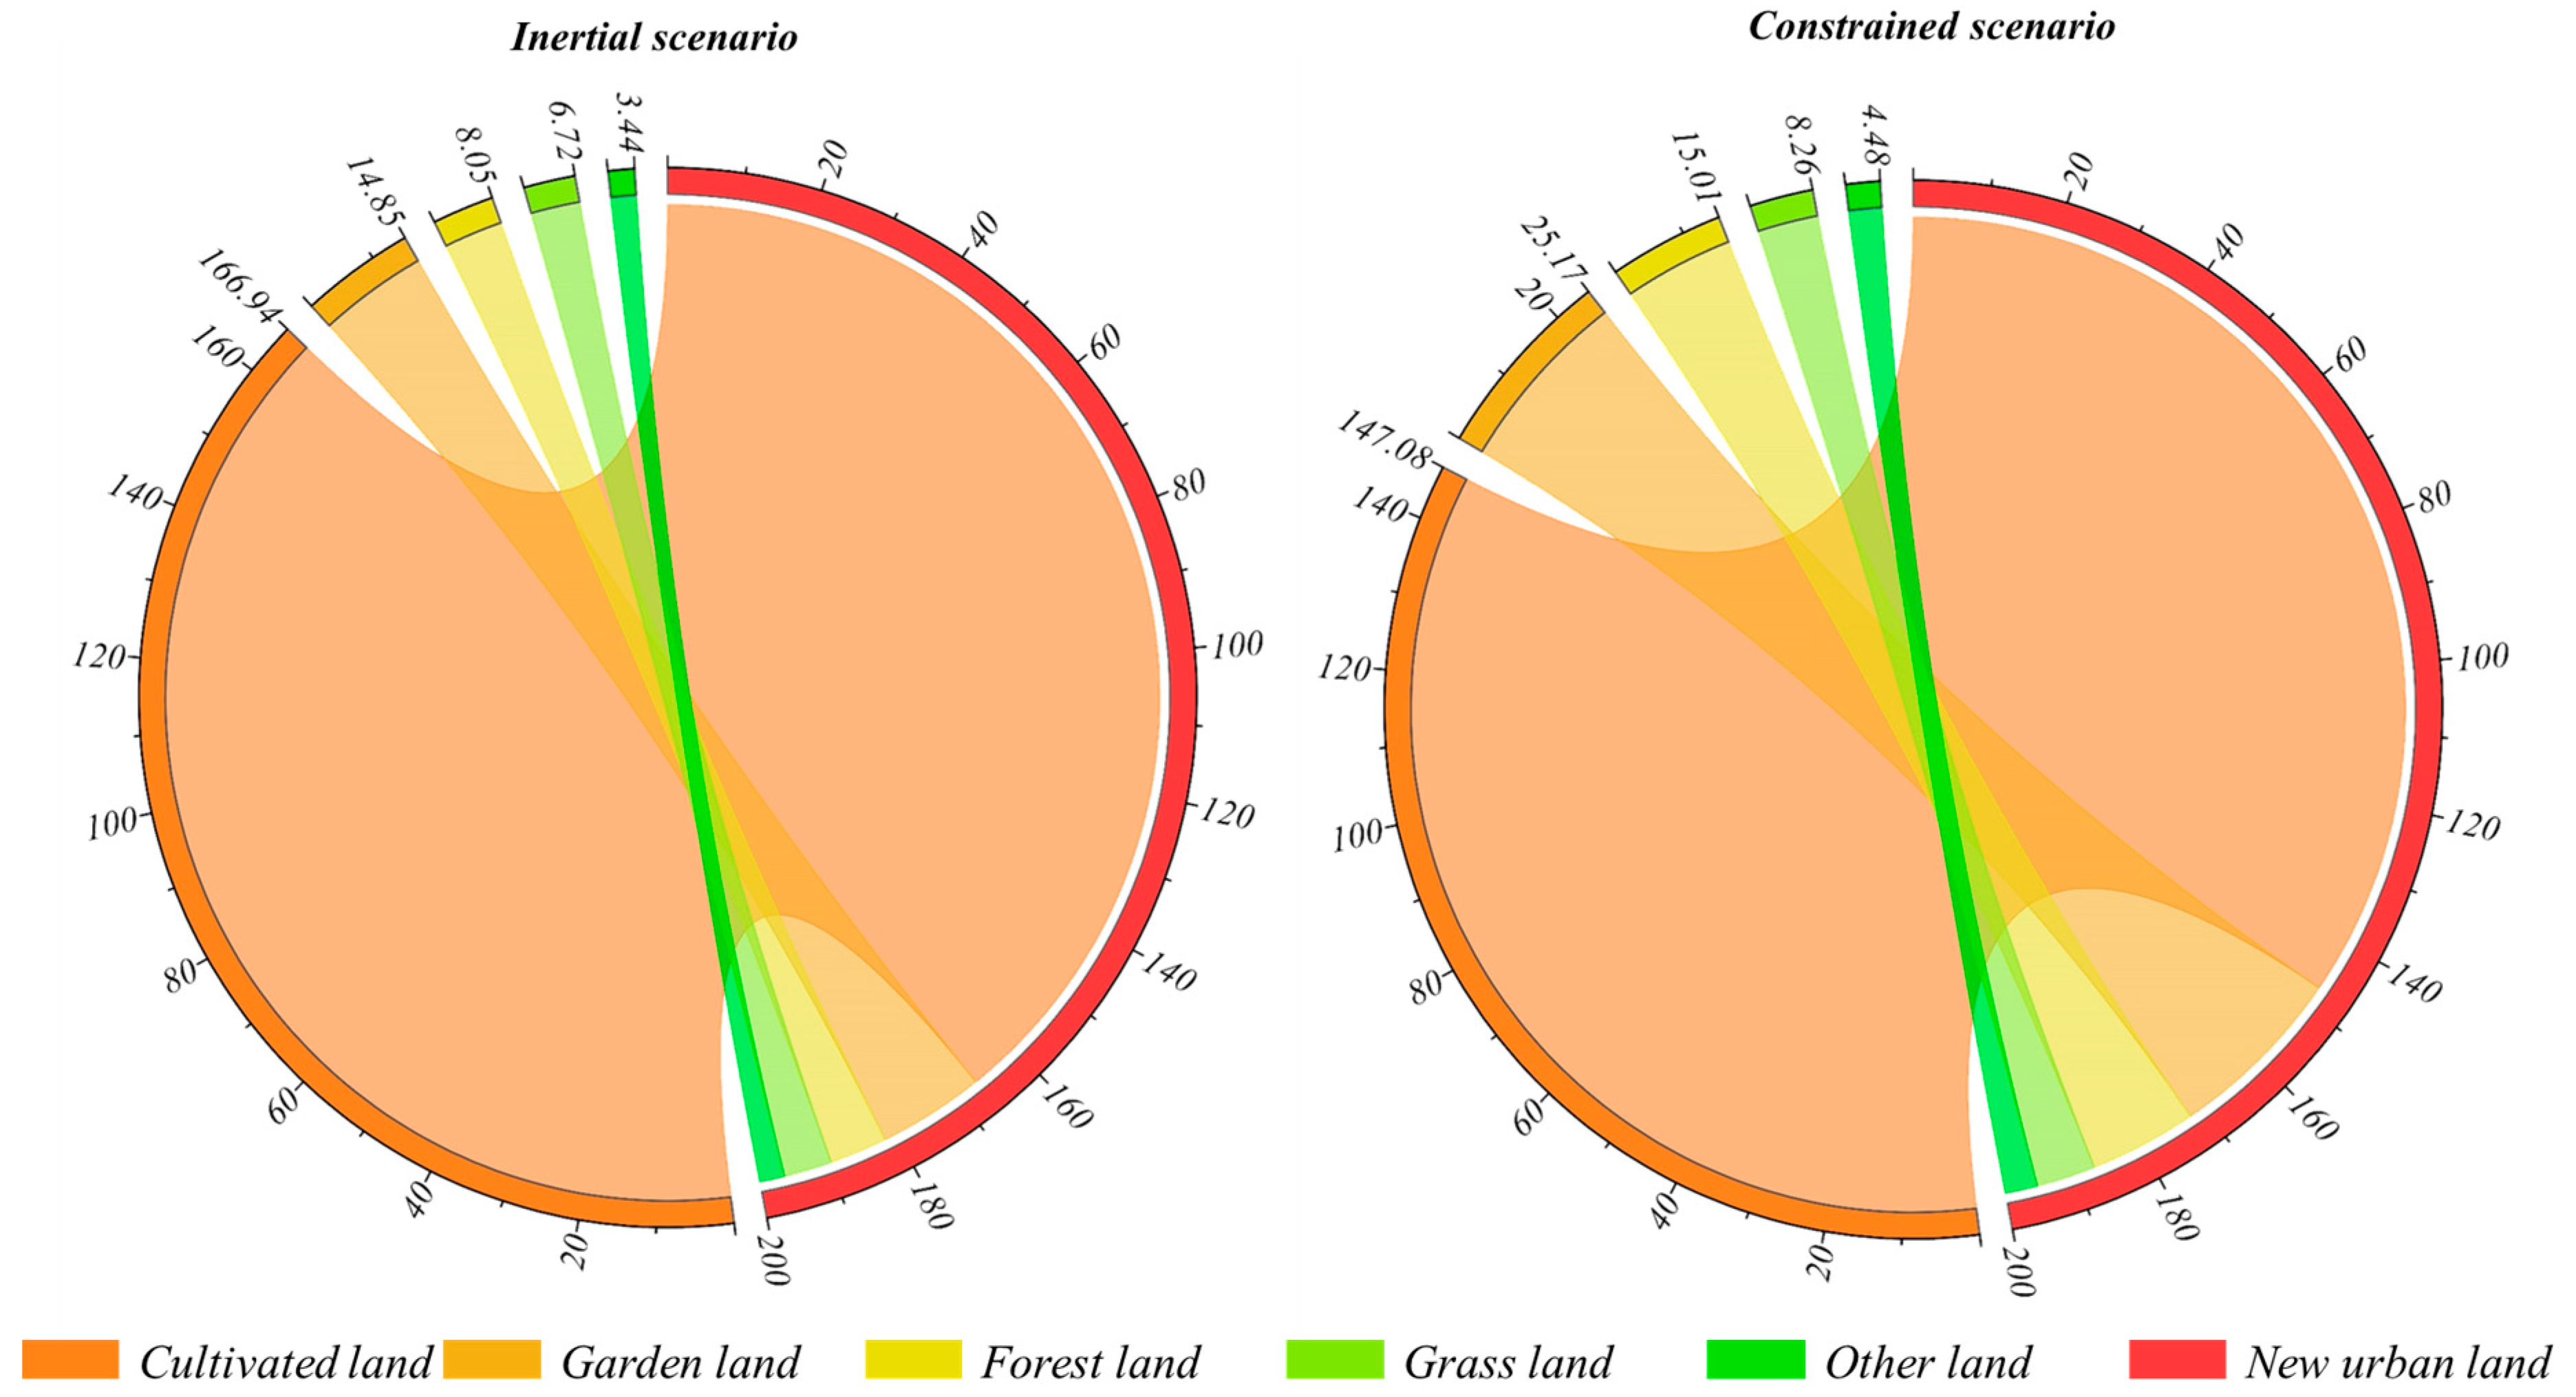
4.2.2. Differential Analysis of Space Allocation

The spatial characteristics of land use are primarily reflected by the space allocation. The Land Space Planning of Guangzhou City advocates for a more concentrated and compact land use pattern. Based on previous studies [60], we selected some of the most representative ecological landscape indicators to reflect the spatial characteristics of the simulation results. Patch density refers to the number of patches per area; high values indicate that the land tends to be broken by the presence of more patches. For the average patch area, its high values are related to more-intensive land use. Likewise, when the values of the landscape shape index are high, the shape of the patches is more irregular, and the land use is more complex. Finally, the larger the landscape aggregation index, the more concentrated the land use.
We used FRAGSTATS 4.2 to calculate the above-mentioned indicators, and the results are displayed in Table 9. The patch density of the inertial scenario was 22.36 Pcs/km2, more than that of the constrained scenario, indicating that the new urban land was more broken in the inertial scenario. On the contrary, the average patch area of the constrained scenario was greater than that of the inertial scenario, indicating that the new urban land in the constrained scenario was more compact. The landscape shape index of the inertial scenario was 27.58, more than that of the constrained scenario, indicating that the new urban land was more regular in the constrained scenario. Finally, for the landscape aggregation index, the value of the constrained scenario was more significant than that of the inertial scenario, indicating that new urban land was more concentrated in the constrained scenario. By constraining the urban potential in an inertial scenario, we reduced the fragmentation of agricultural and ecological spaces caused by urban growth. Thus, large tracts of high-quality farmland and ecological space were preserved, and the potential space for urban growth was limited, thereby increasing the agglomeration of new urban land. These results implied that the constrained scenario provides a more concentrated and compact new urban land pattern, consistent with the requirements of the Land Space Planning of Guangzhou City.
In addition to landscape indicators, growth patterns are critical spatial characteristics [61]. We identified three types of urban growth patterns: infill, adjacency, and leap growths (Figure 14). Furthermore, we calculated the proportion of each of these three growth patterns in the two simulation scenarios from 2021–2035, as shown in Figure 15. In the inertial scenario, the leap growth proportion increased from 15.87 to 26.48%; however, in the constrained scenario, its proportion remained below 20%. For developed cities such as Guangzhou City, infill and adjacency growths are more cost-effective because the leap growth in urban land is similar to islands in the sea, where the building of roads, laying of pipe networks, and other infrastructure are needed to ensure normal operation. However, infill and adjacent growths can fully use the existing infrastructure. Thus, we concluded that the constrained scenario provides a more cost-efficient development pattern.

4.2.3. Differential Analysis of Bottom Line Control

(1) Cultivated land protection:
The protection of cultivated land corresponds to the bottom line of food security. In China, farming and construction suitability are highly correlated [62]; therefore, cultivated land protection and urban expansion have always been the focus of social and economic development. In the constrained scenario, we used quality land as a parameter to limit the urban potential of cultivated land cells. The transformation of land types during urban growth is shown in Figure 16. In the inertial scenario, 166.94 km2 of cultivated land turned into new urban land, whereas only 147.08 km2 changed in the constrained scenario, 11.89% less than that in the inertial scenario. Moreover, the average quality of cultivated land in 2020 was 6.52, and those in the inertial and constrained scenarios in 2035 were 7.36 and 6.85, respectively. Regarding the quality of cultivated land, the larger the number, the lower the quality is. Therefore, the constrained scenario protected the quantity and quality of cultivated land better than the inertial scenario.
(2) Ecological protection:
Ecological protection corresponds to the bottom line of ecological security. The most-important aspect of ecological protection is maintaining the ecological service functions that are directly reflected in the ecological service value [63]. Xie et al. calculated the ecosystem service value per area [64] to monitor the value of ecological services. Following Xie, we calculated the ecological service value per area for different types of land, as shown in Table 10. In addition, the ecological service value had a scale agglomeration effect [65], implying that, for one piece of ecological land, a large scale corresponds to a large value of ecological service. Following the existing research, we determined the adjustment parameters for patches of different scales when calculating the ecological service value, as shown in Table 11. The change and slope of the decline in the ecological service value for the two scenarios are shown in Figure 17. We found that the ecological service value decreased with urban growth in both scenarios. However, the ecological service value was CNY 116,826 million in 2035 in the inertial scenario, whereas it was CNY 117,169 million in the constrained scenario, which is CNY 343 million (0.3%) more compared to the inertial scenario. Furthermore, the ecological service value loss slope from 2021–2035 in the inertial scenario increased, indicating that the ecological service value decreased rapidly. However, the slope in the constrained scenario fluctuated over time and did not show an accelerating trend in ecological service loss. This is because, with the ecological constraint, more ecological land with high ecological importance was reserved, and the fragmentation of urban growth in the ecological space was reduced, concentrating the ecological land. Therefore, the constrained scenario can reduce the impact of urban growth on the ecology.
(3) Geological safety guarantees:
Geological safety guarantees correspond to the bottom line of geological security. In the constrained scenario, we reduced the geological risk levels of each cell with potential for urban growth and statistically analyzed the proportion of new urban land with different geological risk levels for the two scenarios, as shown in Figure 16. Figure 18 shows that only 2.26% of new urban land had high geological risk in the constrained scenario, whereas in the inertial scenario, the value was 12.95%. Therefore, we concluded that our constrained scenario improved geological safety.

5. Discussion

Guangzhou City is beyond its rapid expansion stage, and after 2020, its new construction land will be reduced. From 2010–2020, the average new urban land area in Guangzhou City was approximately 30 km2 per year; however, according to the Land Space Planning, that number will decrease to approximately 13 km2 from 2021–2035. Thus, Guangzhou City must optimize the allocation of new urban land. This study made two significant contributions: first, based on growth simulations, a novel allocation method for new urban land that coordinates quota and space allocations was proposed; second, this study proved that the constrained scenario is more reasonable and effective than the inertial scenario for new urban land allocation. Based on the results, we proposed the following strategies: (1) Delimiting urban growth boundaries: The urban growth boundary is an effective policy tool in the Land Spatial Planning to guide land agglomeration and prevent urban sprawl. With cartographic generalization, the space allocation results can be used for delimiting such boundaries. (2) Delimiting the strategic reserved land: For Guangzhou City, new urban land will become a scarce resource in the future; our results predicted the most-likely areas to become urban land, where the government can delimit some strategic reserved land for future development. (3) Assisting farmland and ecology protection: In the constrained scenario, cultivated and ecological lands are converted into urban land, which is inevitable. The simulation results can help the government decide where to complement cultivated and ecological lands.
This study had limitations that require further investigation. First, we did not integrate policy factors into the growth simulations, which are essential for urbanization [66,67]. Second, we did not integrate negative factors such as low-efficiency and idle land [68] into the allocation processes. In future research, we will find methods to introduce policy factors (such as planned infrastructure and development strategies) into the urban growth simulation processes. In addition, we wish to obtain data on the low-efficiency and idle land of Guangzhou City to evaluate the impact of these negative factors on urban land allocation. Finally, carbon peaking and carbon neutrality have become far-reaching strategies in China; therefore, we will explore “low-carbon” land use patterns [69].

6. Conclusions

In this study, we selected Guangzhou City as the study area and conducted an urban growth simulation with two scenarios. The main conclusions were as follows:
(1) We realized the synergy between the quota and space allocation of new urban land. We proposed a novel method to allocate new urban land through urban growth simulation. Compared with the previous “first quota then space” allocation, we first conducted the space allocation of new urban land, and then, we obtained the quota results of each district by counting the number of raster units in the space allocation results. Using this method, we found the synergy between the quota and space allocations of new urban land, thereby improving the rationality of new urban land allocation. To some extent, this compensated for the shortcomings of unreasonable land use of previous planning methods.
(2) The constrained scenario was more in line with the development strategy of Guangzhou City. For the quota allocation, the constrained scenario increased the new urban land quotas of Nansha and Huangpu, compared to the inertial scenario. These two districts are critical for the future development and urbanization of Guangzhou City, requiring more new urban land. Moreover, the migration of the gravity center of new urban land represents the spatial direction of urban development, whereas the gravity center of the new urban land in the inertial scenario moved to the north, and in the constrained scenario, it moved to the southeast, which is consistent with the future development of Guangzhou City.
(3) The land pattern was more regular and concentrated in the constrained scenario. From the perspective of space allocation, the constrained scenario performed better regarding ecological landscape indicators than the inertial scenario, implying that the new urban land under the constrained scenario was more regular and the spatial distribution more compact and concentrated. In addition, the constrained scenario reduced the proportion of leap growth during stimulation. These characteristics indicated that the constrained scenario was more suitable to guide land use than the inertial scenario.
(4) The constrained scenario can protect the bottom line parameters better. From the perspective of bottom line control, the constrained scenario strengthened the protection of farming and ecological space, alleviating the fragmentation of agricultural and ecological land caused by urban growth. Therefore, in a constrained scenario, the quantity and quality of cultivated land can be better protected, the ecological service value can be better preserved, and the geological risk of urban growth reduced. That is, the constrained scenario was more consistent with the Land Space Planning and smart growth requirements.

Author Contributions

Conceptualization, J.Z. and X.L.; methodology, X.L.; software, T.L.; validation, J.Z. and X.L.; formal analysis, J.Z. and X.L.; investigation, X.Y.; resources, X.Y., Y.L. and H.J.; data curation, J.Y. (Jianlong Yan); writing—original draft preparation, J.Z., X.L., B.B. and Z.C.; writing—review and editing, J.Z. and J.Y. (Jiangchun Yao); visualization, Y.L.; supervision, J.Z.; project administration, J.Z.; funding acquisition, J.Z. All authors have read and agreed to the published version of the manuscript.

Funding

This research was funded by the Guangdong Enterprise Key Laboratory for Urban Sensing, Monitoring, and Early Warning (No. 2020B121202019), the Science and Technology Foundation of the Guangzhou Urban Planning & Design Survey Research Institute (No. RDI2220202138), and the Science and Technology Foundation of the Guangzhou Urban Planning & Design Survey Research Institute (No. RDP2220202015).

Data Availability Statement

The data presented in this study are available upon request from the corresponding author.

Conflicts of Interest

The authors declare no conflict of interest.

References

  1. Grimm, N.B.; Faeth, S.H.; Golubiewski, N.E.; Redman, C.L.; Wu, J.; Bai, X.; Briggs, J.M. Global change and the ecology of cities. Science 2008, 319, 756–760. [Google Scholar] [CrossRef] [Green Version]
  2. Seto, K.C.; Güneralp, B.; Hutyra, L.R. Global forecasts of urban expansion to 2030 and direct impacts on biodiversity and carbon pools. Proc. Natl. Acad. Sci. USA 2012, 109, 16083–16088. [Google Scholar] [CrossRef] [Green Version]
  3. Liang, C.; Penghui, J.; Wei, C.; Manchun, L.; Liyan, W.; Yuan, G.; Yuzhe, P.; Nan, X.; Yuewei, D.; Qiuhao, H. Farmland protection policies and rapid urbanization in China: A case study for Changzhou City. Land Use Policy 2015, 48, 552–566. [Google Scholar] [CrossRef]
  4. Qianwen, C.; Penghui, J.; Lingyan, C.; Jinxia, S.; Yunqian, Z.; Liyan, W.; Manchun, L.; Feixue, L.; Axing, Z.; Dong, C. Delineation of a permanent basic farmland protection area around a city centre: Case study of Changzhou City, China: The International Journal Covering All Aspects of Land Use. Land Use Policy 2017, 60, 73–89. [Google Scholar] [CrossRef]
  5. Yang, L.; Zhang, Z.; Zhang, W.; Zhang, T.; Meng, H.; Yan, H.; Shen, Y.; Li, Z.; Ma, X. Wetland park planning and management based on the valuation of ecosystem services: A case study of the Tieling lotus lake national wetland park (LLNWP), China. Int. J. Environ. Res. Public Health 2023, 20, 2939. [Google Scholar] [CrossRef] [PubMed]
  6. Deng, M.; Zhang, A.; Luo, W.; Hu, C.; Huang, M.; Cheng, C. Impact of governance structure of rural collective economic organizations on trading efficiency of collective construction land of China. Land 2023, 12, 381. [Google Scholar] [CrossRef]
  7. Wu, J. Urban ecology and sustainability: The state-of-the-science and future directions. Landsc. Urban Plan 2014, 125, 209–221. [Google Scholar] [CrossRef]
  8. Liu, Y.; Yin, G.; Ma, L.J.C. Local state and administrative urbanization in post-reform China: A case study of Hebi City, Henan Province. Cities 2012, 29, 107–117. [Google Scholar] [CrossRef]
  9. Yu, D.; Yanxu, L.; Bojie, F. Urban growth simulation guided by ecological constraints in Beijing city: Methods and implications for spatial planning. J. Environ. Manag. 2019, 243, 402–410. [Google Scholar] [CrossRef] [PubMed]
  10. Wang, L.; Zhang, S.; Tang, L.; Lu, Y.; Liu, Y.; Liu, Y. Optimizing distribution of urban land on the basis of urban land use intensity at prefectural city scale in mainland China. Land Use Policy 2022, 115, 106037. [Google Scholar] [CrossRef]
  11. Ma, S.; Cai, Y.; Xie, D.; Zhang, X.; Zhao, Y. Towards balanced development stage: Regulating the spatial pattern of agglomeration with collaborative optimal allocation of urban land. Cities 2022, 126, 103645. [Google Scholar] [CrossRef]
  12. Tan, R.; Zhou, T. Decentralization in a centralized system: Project-based governance for land-related public goods provision in China. Land Use Policy 2015, 47, 262–272. [Google Scholar] [CrossRef]
  13. Wang, H.; Tao, R.; Wang, L.; Su, F. Farmland preservation and land development rights trading in Zhejiang, china. Habitat Int. 2010, 34, 454–463. [Google Scholar] [CrossRef]
  14. Zuo-Chen, L.I. On the relationship between urban population prediction and resource and environment capacity. J. Guangzhou Univ. 2001. [Google Scholar]
  15. Chao-Qi, L.I.; Zhou, X. A summary of population prediction methods in land use planning. Sci. Technol. Manag. Land Resour. 2006, 23, 64–69. [Google Scholar]
  16. Zou, Y.; Yan, L.; Zhang, Y. Game analysis of incremental income allocation in the marketization of rural collectively-owned commercial construction land under fairness preference. Struct. Chang. Econ. Dyn. 2023, 65, 1–14. [Google Scholar] [CrossRef]
  17. Zhang, Y.; Chen, Z.; Cheng, Q.; Zhou, C.; Jiang, P.; Li, M.; Chen, D. Quota restrictions on land use for decelerating urban sprawl of mega city: A case study of Shanghai, China. Sustainability 2016, 8, 968. [Google Scholar] [CrossRef] [Green Version]
  18. Xi, Q.; Mei, L. How did development zones affect China’s land transfers? The scale, marketization, and resource allocation effect. Land Use Policy 2022, 119, 106181. [Google Scholar] [CrossRef]
  19. Tang, P.; Feng, Y.; Li, M.; Zhang, Y. Can the performance evaluation change from central government suppress illegal land use in local governments? A new interpretation of Chinese decentralisation. Land Use Policy 2021, 108, 105578. [Google Scholar] [CrossRef]
  20. Shi, J.; Shi, P.; Wang, Z.; Wang, L.; Li, Y. Multi-scenario simulation and driving force analysis of ecosystem service value in arid areas based on PLUS model: A Case study of Jiuquan City, China. Land 2023, 12, 937. [Google Scholar] [CrossRef]
  21. Mahmoudzadeh, H.; Abedini, A.; Aram, F. Urban growth modeling and land-use/land-cover change analysis in a metropolitan area (case study: Tabriz). Land 2022, 11, 2162. [Google Scholar] [CrossRef]
  22. Wei, C.; Meng, J.; Zhu, L.; Han, Z. Assessing progress towards sustainable development goals for Chinese urban land use: A new cloud model approach. J. Environ. Manag. 2023, 326, 116826. [Google Scholar] [CrossRef] [PubMed]
  23. Azizi, P.; Soltani, A.; Bagheri, F.; Sharifi, S.; Mikaeili, M. An integrated modelling approach to urban growth and land use/cover change. Land 2022, 11, 1715. [Google Scholar] [CrossRef]
  24. Liu, X.; Shi, W.; Zhang, S. Progress of research on urban growth boundary and its implications in Chinese studies based on bibliometric analysis. Int. J. Environ. Res. Public Health 2022, 19, 16644. [Google Scholar] [CrossRef]
  25. Liu, X.; Wei, M.; Li, Z.; Zeng, J. Multi-scenario simulation of urban growth boundaries with an ESP-FLUS model: A case study of the Min Delta region, China. Ecol. Indic 2022, 135, 108538. [Google Scholar] [CrossRef]
  26. Yu, Y.; Zhang, C.; Ma, W.; Xu, Y.; Gao, X. Urban growth boundaries delineation under multi-objective constraints from the perspective of humanism and low-carbon concept. Sustainability 2022, 14, 16100. [Google Scholar] [CrossRef]
  27. Liao, J.; Tang, L.; Shao, G. Multi-scenario simulation to predict ecological risk posed by urban sprawl with spontaneous growth: A case study of Quanzhou. Int. J. Environ. Res. Public Health 2022, 19, 15358. [Google Scholar] [CrossRef]
  28. Zhu, J.; Li, X.; Huang, H.; Yin, X.; Yao, J.; Liu, T.; Wu, J.; Chen, Z. Citation. Int. J. Environ. Res. Public Health 2023, 20, 2075. [Google Scholar] [CrossRef]
  29. Han, B.; Jin, X.; Xiang, X.; Rui, S.; Zhang, X.; Jin, Z.; Zhou, Y. An integrated evaluation framework for Land-Space ecological restoration planning strategy making in rapidly developing area. Ecol. Indic. 2021, 124, 107374. [Google Scholar] [CrossRef]
  30. Zhou, R.; Zhang, H.; Ye, X.-Y.; Wang, X.-J.; Su, H.-L. The delimitation of urban growth boundaries using the CLUE-S land-use change model: Study on Xinzhuang town, Changshu City, China. Sustainability 2016, 8, 1182. [Google Scholar] [CrossRef] [Green Version]
  31. Bathrellos, G.D.; Skilodimou, H.D. Land use planning for natural hazards. Land 2019, 8, 128. [Google Scholar] [CrossRef] [Green Version]
  32. National Bureau of Statistics of China. China Statistical Yearbook 2022; China Statistics Press: Beijing, China, 2022.
  33. Liu, J.; Zhang, G.; Zhuang, Z.; Cheng, Q.; Gao, Y.; Chen, T.; Huang, Q.; Xu, L.; Chen, D. A new perspective for urban development boundary delineation based on SLEUTH-InVEST model. Habitat Int. 2017, 70, 13–23. [Google Scholar] [CrossRef]
  34. Chen, Y.; Hu, Y.; Lai, L. Demography-Oriented Urban Spatial matching of service facilities: Case study of Changchun, China. Land 2022, 11, 1660. [Google Scholar] [CrossRef]
  35. Yang, Y.; Li, J.; Wang, L.; Wang, Z.; Ling, Y.; Xu, J.; Yao, C.; Sun, Y.; Wang, Y.; Zhao, L. The impact of urbanization on the relationship between carbon storage supply and demand in mega-urban agglomerations and response measures: A case of Yangtze River delta region, China. Int. J. Environ. Res. Public Health 2022, 19, 13768. [Google Scholar] [CrossRef] [PubMed]
  36. Tsai, M.T.; Chang, H.W. Contribution of accessibility to urban resilience and evacuation planning using spatial analysis. Int. J. Environ. Res. Public Health 2023, 20, 2913. [Google Scholar] [CrossRef]
  37. Heidenreich, N.-B.; Schindler, A.; Sperlich, S. Bandwidth selection for kernel density estimation: A review of fully automatic selectors. AStA Adv. Stat. Anal. 2013, 97, 403–433. [Google Scholar] [CrossRef] [Green Version]
  38. Lin, G.; Jiang, D.; Yin, Y.; Fu, J. A carbon-neutral scenario simulation of an urban land–energy–water coupling system: A case study of Shenzhen, China. J. Clean. Prod. 2023, 383, 135534. [Google Scholar] [CrossRef]
  39. Zhou, Y.; Huang, C.; Wu, T.; Zhang, M. A novel spatio-temporal cellular automata model coupling partitioning with CNN-LSTM to urban land change simulation. Ecol. Model. 2023, 482, 110394. [Google Scholar] [CrossRef]
  40. Imam, E.; Kushwaha, S.P.S. Habitat suitability modelling for Gaur (Bos gaurus) using multiple logistic regression, remote sensing and GIS. J. Appl. Anim. Res. 2013, 41, 189–199. [Google Scholar] [CrossRef] [Green Version]
  41. Varquez, A.C.G.; Dong, S.; Hanaoka, S.; Kanda, M. Evaluating future railway-induced urban growth of twelve cities using multiple SLEUTH models with open-source geospatial inputs. Sustain. Cities Soc. 2023, 91, 104442. [Google Scholar] [CrossRef]
  42. Plab, C.; Yha, D.; Wj, E. Land use optimization research based on FLUS model and ecosystem services–setting Jinan City as an example. Urban Clim. 2021, 40, 100984. [Google Scholar]
  43. Yang, J.; Yang, S.; Li, J.; Gong, J.; Yuan, M.; Li, J.; Dai, Y.; Ye, J. A distance-driven urban simulation model (DISUSIM): Accounting for urban morphology at multiple landscape levels. Cities 2023, 134, 104156. [Google Scholar] [CrossRef]
  44. Zhang, B.; Hu, S.; Wang, H.; Zeng, H. A size-adaptive strategy to characterize spatially heterogeneous neighborhood effects in cellular automata simulation of urban growth. Landsc. Urban Plan. 2023, 229, 104604. [Google Scholar] [CrossRef]
  45. Ma, Q. Integrating ecological correlation into cellular automata for urban growth simulation: A case study of Hangzhou, China. Urban For. Urban Green. 2020, 51, 126697. [Google Scholar] [CrossRef]
  46. Chen, Y.; Li, X.; Liu, X.; Ai, B. Modeling urban land-use dynamics in a fast developing city using the modified logistic cellular automaton with a patch-based simulation strategy. Int. J. Geogr. Inf. Sci. 2014, 28, 234–255. [Google Scholar] [CrossRef]
  47. Yang, J.; Gong, J.; Tang, W.; Liu, C. Patch-based cellular automata model of urban growth simulation: Integrating feedback between quantitative composition and spatial configuration. Comput. Environ. Urban Syst. 2020, 79, 101402. [Google Scholar] [CrossRef]
  48. Wu, H.; Zeng, B.; Zhou, M. Forecasting the water demand in Chongqing, China using a grey prediction model and recommendations for the sustainable development of urban water consumption. Int. J. Environ. Res. Public Health 2017, 14, 1386. [Google Scholar] [CrossRef] [PubMed] [Green Version]
  49. Thiam, S.; Salas, E.A.L.; Hounguè, N.R.; Almoradie, A.D.S.; Verleysdonk, S.; Adounkpe, J.G.; Komi, K. Modelling land use and land cover in the transboundary mono river catchment of Togo and Benin using Markov chain and stakeholder’s perspectives. Sustainability 2022, 14, 4160. [Google Scholar] [CrossRef]
  50. Arsanjani, J.J.; Helbich, M.; Kainz, W.; Boloorani, A.D. Integration of logistic regression, Markov chain and cellular automata models to simulate urban expansion. Int. J. Appl. Earth Obs. Geoinform. 2013, 21, 265–275. [Google Scholar] [CrossRef]
  51. Feng, Y.; Liu, Y. A cellular automata model based on nonlinear kernel principal component analysis for urban growth simulation. Environ. Plan. B Urban Anal. City Sci. 2013, 40, 117–134. [Google Scholar] [CrossRef]
  52. Mustafa, A.; Saadi, I.; Cools, M.; Teller, J. International journal of geographical information science, a time monte carlo method for addressing uncertainty in land-use change models. Int. J. Geogr. Inf. Sci. 2018, 32, 2317–2333. [Google Scholar] [CrossRef] [Green Version]
  53. Qu, Y.; Zhang, Y.; Wang, S.; Shang, R.; Zong, H.; Zhan, L. Coordinated development of land multi-function space: An analytical framework for matching the supply of resources and environment with the use of land space for ecological protection, agricultural production and urban construction. J. Geogr. Sci. 2023, 33, 311–339. [Google Scholar] [CrossRef]
  54. Tang, H.; Niu, J.; Niu, Z.; Liu, Q.; Huang, Y.; Yun, W.; Shen, C.; Huo, Z. System cognition and analytic technology of cultivated land quality from a data perspective. Land 2023, 12, 237. [Google Scholar] [CrossRef]
  55. Yunqian, Z. Study on the Delineation Method of Urban Development Boundary under the Coordination of Expansion Potential and Ecological Constraint. Master’s Thesis, Nanjing University, Nanjing, China, 2017. [Google Scholar]
  56. Uchaev, D.; Uchaev, D. Small sample hyperspectral image classification based on the random patches network and recursive filtering. Sensors 2023, 23, 2499. [Google Scholar] [CrossRef] [PubMed]
  57. Feinstein, A.R.; Cicchetti, D.V. High agreement but low kappa: I. The problems of two paradoxes. J. Clin. Epidemiol. 1990, 43, 543–549. [Google Scholar] [CrossRef]
  58. Fu, J.; Ding, R.; Zhang, Y.; Zhou, T.; Du, Y.; Zhu, Y.; Du, L.; Peng, L.; Zou, J.; Xiao, W. The spatial-temporal transition and influencing factors of green and low-carbon utilization efficiency of urban land in China under the goal of carbon neutralization. Int. J. Environ. Res. Public Health 2022, 19, 16149. [Google Scholar] [CrossRef]
  59. Polajzer, B.; Brezovnik, R.; Ritonja, J. Evaluation of load frequency control performance based on standard deviational ellipses. IEEE Trans. Power Syst. 2016, 32, 2296–2304. [Google Scholar] [CrossRef]
  60. McGarigal, K.; Marks, B.J.F. RAGSTATS: Spatial Pattern Analysis Program for Quantifying Landscape Structure (General Technical Report PNWGTR-351); USDA Forest Service, Pacific Northwest Research Station: Corvallis, OR, USA, 1995; p. 122.
  61. Jia, T.; Chen, K.; Wang, J. Characterizing the growth patterns of 45 major metropolitans in Mainland China using DMSP/OLS data. Remote Sens. 2017, 9, 571. [Google Scholar] [CrossRef] [Green Version]
  62. Cheng, Y.; Sun, Y.; Peng, L.; He, Y.; Zha, M. An improved retrieval method for Porphyra cultivation area based on suspended sediment concentration. Remote Sens. 2022, 14, 4338. [Google Scholar] [CrossRef]
  63. Yang, Y.; Xiong, K.; Huang, H.; Xiao, J.; Yang, B.; Zhang, Y. A commented review of eco-product value realization and ecological industry and its enlightenment for agroforestry ecosystem services in the karst ecological restoration. Forests 2023, 14, 448. [Google Scholar] [CrossRef]
  64. Xie, G.D.; Zhang, C.X.; Zhang, L.M.; Chen, W.H.; Li, S.M. Improvement of the evaluation method for ecosystem service value based on per UnitArea. J. Nat. Resour. 2015, 30, 1243–1254. [Google Scholar] [CrossRef]
  65. Xu, K.; Yang, Z. Research on the value of land ecological service in Yunnan Province based on the perspective of spatial pattern. Sustainability 2022, 14, 10805. [Google Scholar] [CrossRef]
  66. Yin, H.; Kong, F.; Yang, X.; James, P.; Dronova, I. Exploring zoning scenario impacts upon urban growth simulations using a dynamic spatial model. Cities 2018, 81, 214–229. [Google Scholar] [CrossRef] [Green Version]
  67. Zhang, L.; Han, R.; Cao, H. Understanding urban land growth through a social-spatial perspective. Land 2021, 10, 348. [Google Scholar] [CrossRef]
  68. Wang, M.; Lin, N.; Dong, Y.; Tang, Y. How does new energy demonstration city policy promote urban land use efficiency in China? The mediating effect of industrial structure. Land 2023, 12, 1100. [Google Scholar] [CrossRef]
  69. Chen, Y.; Yue, W.; Liu, X.; Zhang, L.; Chen, Y. Multi-scenario simulation for the consequence of urban expansion on carbon storage: A comparative study in Central Asian republics. Land 2021, 10, 608. [Google Scholar] [CrossRef]
Figure 1. Process diagram of quota and space allocations in The General Land Use Planning.
Land 12 01262 g001
Figure 2. Scope of the study area and dislocation between actual and planning urban land.
Land 12 01262 g002
Figure 3. Spatialization results of some indicators for urban growth simulation in 2015.
Land 12 01262 g003
Figure 4. Original urban growth potential.
Land 12 01262 g004
Figure 5. Processed urban growth potential.
Land 12 01262 g005
Figure 6. Schematic diagram of the simulation process for new urban land.
Land 12 01262 g006
Figure 7. Factors in the constrained scenario: (a) quality of cultivated land, (b) ecological importance, and (c) geological risk level.
Land 12 01262 g007
Figure 8. Schematic diagram of the urban growth potential adjustment process.
Land 12 01262 g008
Figure 9. Kappa coefficient, simulated, and actual results of Guangzhou City development and typical districts from 2015–2020.
Land 12 01262 g009
Figure 10. Inertial (a) and constrained (b) urban growth simulated results from 2021–2035.
Land 12 01262 g010
Figure 11. Process diagram of quota and space allocations in this study.
Land 12 01262 g011
Figure 12. Correlation between the quota of new urban land and the potential of corresponding cells in each district.
Land 12 01262 g012
Figure 13. Gravity center and standard deviation ellipse of new urban land in two scenarios.
Land 12 01262 g013
Figure 14. Inertial and constrained urban growth results from 2021–2035.
Land 12 01262 g014
Figure 15. Proportion of the three types of growth patterns in the two scenarios from 2021–2035.
Land 12 01262 g015
Figure 16. Composition of new urban land in the two scenarios from 2021–2035 (km2).
Land 12 01262 g016
Figure 17. Change and slope of the decline of the ecological service value in the two scenarios.
Land 12 01262 g017
Figure 18. Proportion of different geological risks of new urban land in the two scenarios from 2021–2035.
Land 12 01262 g018
Table 1. Data sources used in this study.
Data CategoryNameSourceTime
Vector
Data
Land use dataGuangzhou Municipal Planning and Natural Resources Bureau2014 and 2020
Administrative divisions2020
Cultivated land quality data2020
Geological hazard susceptibility grade data2019
Roads data at different levelsGaode online map2014, 2020
Points of interest (POI)2014, 2020
Mobile phone signal dataTelecom operators (China Unicom, China Mobile, and China Telecom)2014, 2020
Raster DataDEMResource and Environment Science and Data Center of Chinese Academy of Sciences2014
Soil texture data2020
MODIS EVI dataNational Aeronautics and Space Administration (NASA)2020
NPP-VIIRS night-light dataNational Oceanic and Atmospheric Administration (NOAA)2014
Luojia-1 night-light dataHubei High-Resolution Earth Observation System Hubei Data and Application Network2020
Statistical
Data
GDP statistical data at district levelGuangzhou Bureau of Statistics2014, 2020
Average annual rainfall data at district levelGuangzhou Meteorological Bureau2020
Table 4. Adjustment parameters of quality of cultivated land.
Quality of cultivated land456789
Adjustment parameters0.40.50.60.70.81
Table 5. Adjustment parameters of ecological importance.
Ecological importance[0.0, 0.1)[0.1, 0.2)[0.2, 0.4)[0.4, 0.6)[0.6, 0.8)[0.8, 1)
Adjustment parameters1.00.80.60.40.20.0
Table 6. Adjustment parameters of geological risk level.
Geological risk levelLowMiddle lowMiddleHigh
Adjustment parameters1.00.80.50.3
Table 7. Kappa coefficients of simulated and actual results of urban growth per district.
DistrictYuexiuLiwanHaizhuTianhePanyuBaiyunHuangpuHuaduNanshaZengchengConghua
Kappa coefficient0.99850.90260.93210.84210.82560.86640.81110.85160.81130.79450.8026
Table 8. Quota allocation of new urban land in the two scenarios for different districts from 2021–2035 (km2).
DistrictYuexiuLiwanHaizhuTianhePanyuBaiyunHuangpuHuaduNanshaZengchengConghua
Quota allocation in inertial scenario ①0.004.034.278.9925.3833.4824.5628.9832.3821.1116.82
Quota allocation in constrained scenario ②0.002.883.767.4219.9625.6335.5017.1752.0817.7517.86
② − ①0.00−1.15−0.51−1.57−5.42−7.8510.94−11.8119.70−3.371.05
Table 9. Landscape indicator results in the two scenarios from 2021–2035.
Indicator NameUnitCalculation Results
Inertial ScenarioConstrained Scenario
Patch densityPcs/km222.3615.17
Average patch areakm20.040.06
Landscape shape index/27.5816.85
Landscape aggregation index/64.5672.88
Table 10. Ecological service value per area of different types of land.
Land typeCultivated landGarden landForest landGrass landOther land
Ecological service value per area (CNY 10,000/ha)4.013.0722.955.0716.61
Table 11. Adjustment parameters for different scale patches to calculate the ecological service value.
Patch scale (ha)(0, 0.5](0.5, 1](1, 2](2, +∞]
Adjustment parameters0.900.951.001.05
Disclaimer/Publisher’s Note: The statements, opinions and data contained in all publications are solely those of the individual author(s) and contributor(s) and not of MDPI and/or the editor(s). MDPI and/or the editor(s) disclaim responsibility for any injury to people or property resulting from any ideas, methods, instructions or products referred to in the content.

