Article

Evidence of Global Convergence: Perspectives for Economic and Territory Planning in Times of the COVID-19 Pandemic

by
Vítor João Pereira Domingues Martinho
Agricultural School (ESAV) and CERNAS-IPV Research Centre, Polytechnic Institute of Viseu (IPV), 3504-510 Viseu, Portugal
Land 2023, 12(6), 1251; https://doi.org/10.3390/land12061251
Submission received: 26 April 2023 / Revised: 12 June 2023 / Accepted: 17 June 2023 / Published: 19 June 2023
(This article belongs to the Special Issue Landscapes at Risk. Social Capital Asset in the COVID-Scape Climate)

Abstract

:
Governments and international organizations have implemented efforts to promote the convergence of socioeconomic indicators between countries. The structural funds adopted by the European Union institutions are examples of policy instruments implemented to promote convergence in the GDP (gross domestic product) among the member states. Nonetheless, these policy measures are dependent on several internal and external factors, making these efforts vulnerable to exogenous shocks such as those associated with the global financial crisis and the COVID-19 pandemic. From this perspective, this research aims to analyze the convergence trends over the last few years and assess the respective implications of the pandemic on this framework. For that, statistical information from the World Bank for the GDP per capita was considered for the period 2006–2021 for all countries and organized for each group of levels of income and each world region. These data were analyzed through panel data approaches, considering the developments in convergence theory. The results show that the signs of convergence are different for each level of income and each region, highlighting the idea of clubs of convergence. On the other hand, the pandemic disturbed the trends of convergence verified worldwide, but nonetheless, it seems to be on a smaller scale than the global financial crisis. In any case, these findings should be confirmed in future research with more recent data.

1. Introduction

The convergence approaches may be divided into two groups, one related to absolute convergence and the other associated with conditional convergence. The principle of absolute convergence defends that countries and regions converge to the same “steady-state”, in processes where the poorer areas have lower capital/labor ratios and, in this way, may attract more investment because they have higher marginal productivity for the capital. In the long term, the differences between the growth rates disappear due to free trade and the mobility of the factors. In these frameworks, the technical progress and the input supply are exogenous and easily available [1]. These developments of absolute convergence are associated with the neoclassical theory and are consistent with the exogenous growth theory of Solow [2] of constant or decreasing returns to scale.
The neoclassical approach to absolute convergence analyzes sigma and beta convergence. The sigma concept assesses, through the coefficient of variation (ratio among the standard deviation and the mean), the dispersion of the variable considered (level of income per capita, for example) between the economies taken into account. The beta concept investigates the relationships between the growth rate of the variable analyzed and its initial level. There is convergence if this relation is negative [1]. The concept of beta convergence is associated, for example, with Barro and Sala-i-Martin [3], and it is a necessary condition but not sufficient to have sigma convergence [4].
More recently, the endogenous growth theory with the conditional convergence approach appeared, where regions and countries converge to different “steady-states” depending on the levels of human capital stock, innovation, and technological advance [5]. In these contexts, the economies with similar characteristics present similar convergence processes that are different from those verified for other regions and countries with distinct particularities, in frameworks called clubs of convergence by the theory [6,7].
These are scenarios completely different from those predicted by Keynesian theory [8,9,10,11] or the new economic geography [12]. For these theories, polarization and agglomeration phenomena are expected, respectively, through circular and cumulative processes and increasing returns to scale. In these cases, the richer countries and regions become richer, and the poorer ones become even poorer.
The current reality worldwide and the economic growth dynamics over the last decades show that there is a place for different approaches to providing explanations about the empirical evidence. The adequacy of each theoretical argument depends on the specific scenario taken into account.
Considering the framework described before and the need for more contributions about the influence of the level of income and the location of the countries on the interaction worldwide in times of external shocks (namely to support more adjusted international programs with financial support and policies of cohesion), this research intends to analyze the trends of convergence worldwide since 2006 and assess the impacts of the COVID-19 pandemic on respective tendencies. To achieve these objectives, data from the World Bank [13] for the GDP per capita were considered (this data set is available at the World Bank for those who wish to replicate the results of this research) and explored through panel data approaches and the procedures proposed by Islam [14] and Stata software [15,16,17].
The following relevant published articles, among others, are suggested for further standardization and scholarship:
-
Solow (1956) [2]: the base of the absolute convergence model;
-
Barro and Sala-i-Martin (1991) [3]: associated with the concept of beta convergence;
-
Sala-i-Martin (1996) [4]: relationship among sigma and beta convergence;
-
Barro (1991) [5]: importance of the human capita for conditional convergence;
-
Baumol (1986) [6] and Chatterji (1992) [7]: convergence clubs;
-
Islam (1995) [14]: panel data models.

2. Literature Review

The COVID-19 pandemic impacted the trends of convergence in the European Union countries [18], as well as the global financial crisis. Over the period 2000–2019, the European Union’s average convergence speed was 2.5% and the Eurozone’s was 2.3% [19]. These signs of convergence were visible in the Bulgarian regions, for instance [20]. In general, the GDP per capita is the variable considered in the convergence analyses.
Nonetheless, the concepts associated with the convergence developments (beta convergence, for example) have also been taken into account by the researchers to assess the evolution of the following variables: homicide rates [21]; child stunting [22]; energy consumption per capita [23]; eco-innovation [24]; social conditions [25]; research and development expenditure [26]; population [27]; human well-being [28]; resource productivity [29]; rural sustainable development efficiency [30]; digital economy and society index [31]; religious diversity index [32]; per capita CO2 emissions [33]; and carbon emission intensity [34].
Convergence is a complex process with, in some circumstances, bidirectional characteristics [35]. These processes are challenging worldwide [36], but they pose particular difficulties in African countries [37]. Often, the different countries converge at distinct speeds and follow diverse patterns, creating clubs of convergence [38], dependent on several factors [39]. This is also true for the regional convergence inside the countries [40], such as Poland [41] and the Russian Federation [42]. Regularly, there is convergence inside the clubs and divergence among clubs [43]. Fossil fuel endowments [44] and migration [45] are among the factors that may influence the convergence conditions.
The traditional concepts of convergence developments are sigma and beta convergence; however, recent contributions have brought new approaches [46], where spatial effects [47] and spatial autocorrelation [48] are included. In the convergence processes, the lower and middle-income regions catch up with the high-income ones [49], because they grow faster [50]. These frameworks associated with the convergence have attracted the attention of the scientific community, including for assessments with information from the eighteenth century [51] and before [52].
The idea behind the convergence approaches is that there is a trend for countries and regions to converge at the same level of the variable considered. This is the opposite perspective of the theories associated with the divergence, where polarization [53,54,55] and agglomeration [56] of economic activity and population are expected through circular and cumulative phenomena and trends.

3. Material and Methods

Considering the objectives proposed, statistical information from the World Bank [13] was considered for the period 2006–2021. Some countries were removed because of a lack of data for the whole period or for some years. These data were analyzed through panel data methodologies, considering the concepts of sigma and beta convergence. The sigma concept was analyzed through the coefficient of variation, and the speed of convergence beta was found from the coefficient of convergence, considering the developments of Tondl [57], for example, where beta is calculated through the following equation:
beta = −ln (1 − b)/T
In this equation, b is the coefficient of convergence, and T is the period.
The concepts of sigma and beta convergence have been considered in the scientific literature related to convergence theory. These approaches have also been taken into account in contributions related to divergence theory [58]. In this perspective, these concepts have been validated by the scientific community and have relevance for convergence assessments. Nonetheless, as mentioned before, there are other perspectives on the processes of economic growth [59,60], some of them related to polarization and agglomeration dynamics.
To better understand the processes of convergence and their respective catching-up tendencies worldwide, the statistical information was also organized for several groups by level of income and world regions. These groups were defined by the World Bank, considering the gross national income (GNI) per capita (U.S. dollars) to identify the income groups and regions taken into account for administrative purposes to form the groups of regions [13]. The list of countries considered by income is presented in Table A1. Summary statistics for these groups of countries by income are presented in Table A2. This approach allows for the investigation of the existence of clubs of convergence.
Following the contributions of Islam [14] and Tondl [57], the model taken into account in this study for panel data was the following:
GDP per capita growth rateit = a − b*ln(GDP per capitait-1) + uit
In this equation, a is the constant, b is the coefficient of convergence, i represents the countries, and t is the number of years.
This approach to Islam was influenced by the model of Solow, where economic growth is influenced by the exogenous supply of inputs with constant or decreasing returns to scale. In fact, the existence of constant or decreasing returns to scale is relevant to explaining the processes of convergence between regions or countries.
To investigate potential statistical problems of cross-sectional independence, heteroscedasticity, and autocorrelation, the following tests were carried out: Pesaran’s test of cross-sectional independence; the modified Wald test for groupwise heteroscedasticity; and the Wooldridge test for autocorrelation. To deal with these statistical problems, the correlated panel corrected standard errors (PCSEs) approach was used. This is an adjusted approach to carrying out regressions with panel data when the disturbances are heteroskedastic and contemporaneously correlated across panels [61]. This methodology is supported by the scientific literature [62,63,64,65,66], based on the study of Beck and Katz [67], because with heteroscedasticity, cross-sectional dependence, and autocorrelation, the OLS (ordinary least squares) regressions are not efficient.

4. Sigma Convergence

The global financial crisis of 2007–2008 had an impact on sigma convergence worldwide (Figure 1). The signs of convergence reappeared consistently after 2013 and were only disturbed by the pandemic in 2021. This evidence of divergence caused by COVID-19 seems weaker compared to that promoted by the global financial crisis.
These findings reveal that the global financial crisis was more asymmetric than the COVID-19 pandemic, increasing the disparities between the countries. On the other hand, it seems that governments and international organizations learned from the impacts on the economy of the financial crisis and were better prepared to respond to pandemic shocks.
In any case, a true comparison of the Great Recession and COVID is not possible with the tools in this manuscript. This research should be updated in future studies to reflect this reality, either by adding more recent data or by adding.
The COVID-19 pandemic had similarly implications on the sigma convergence (Table 1) between the low and lower middle income countries (nonetheless here there are also signs of divergence in 2007, 2008, 2010, 2016 and 2017), the low and upper middle countries (in this case the evidence of divergence began in 2020 and there are also signs of divergence in 2007, 2008, 2012, 2017 and 2018), and among the low and high income nations (there is also evidence of divergence in 2010, 2011, 2012, and 2013). The impacts of the pandemic need to be confirmed in future research with more data, namely more recent statistical information. The lower middle-income nations presented signs of divergence in 2007, 2008, 2010, 2016, 2017, and 2021. There is also evidence of divergence among the lower- and upper-middle income countries in 2007, 2008, 2012, 2017, 2018, and 2021 and between the lower middle- and high-income nations in 2010, 2011, 2012, 2013, and 2021. In the upper middle-income countries, the signs of divergence are visible in 2007, 2008, 2012, 2017, 2018, 2020, and 2021. In the high-income nations, this evidence of divergence is present in 2009, 2010, 2011, 2012, 2013, and 2021 (with some signs in 2017). Among the upper middle- and high-income countries, the divergence appears in 2010, 2011, 2013, and 2021. These findings highlight that the different income groups have distinct dynamics with consequences for convergence patterns. These results call for adjusted policies and may be considered support for policymakers and decision-makers. One of the greater challenges will be promoting convergence between low- and high-income countries (this is also visible in Figure 2).
The average coefficient of variation is higher between the low- and high-income countries and among the lower middle- and high-income nations (Figure 2), showing greater dispersion in these cases. The lower average values for the coefficient of variation appear in low, upper middle, and high-income nations.
There is evidence of divergence in 2021 for the following world regions (Table 2): East Asia and the Pacific; East Asia and the Pacific and Europe and Central Asia; East Asia and the Pacific and Latin America and the Caribbean; East Asia and the Pacific and the Middle East and North Africa; East Asia and the Pacific and North America; East Asia and the Pacific and South Asia; and East Asia and the Pacific and Sub-Saharan Africa. In Europe and Central Asia, and between this region and the other world regions, signs of divergence appeared in 2020 (which extended to 2021 only in Europe, Central Asia, and Sub-Saharan Africa). The divergence appeared already in 2019 for Latin America and the Caribbean countries, for the Middle East and North Africa nations, and among these regions and other world regions. This divergence disappeared in 2021, except in the following cases that presented signs of convergence in 2020: Latin America and the Caribbean; Latin America and the Caribbean and South Asia; and Latin America and the Caribbean and Sub-Saharan Africa. There is not any evidence of convergence in the Middle East, North Africa, or sub-Saharan Africa. There are similarly signs of divergence in 2021 for the following regions: North America; North America and Sub-Saharan Africa; South Asia; South Asia and Sub-Saharan Africa; and Sub-Saharan Africa.
In these contexts for the world regions, the big challenge is to deal with the convergence process of Sub-Saharan Africa with the remaining world regions (this can be confirmed in Figure 3).
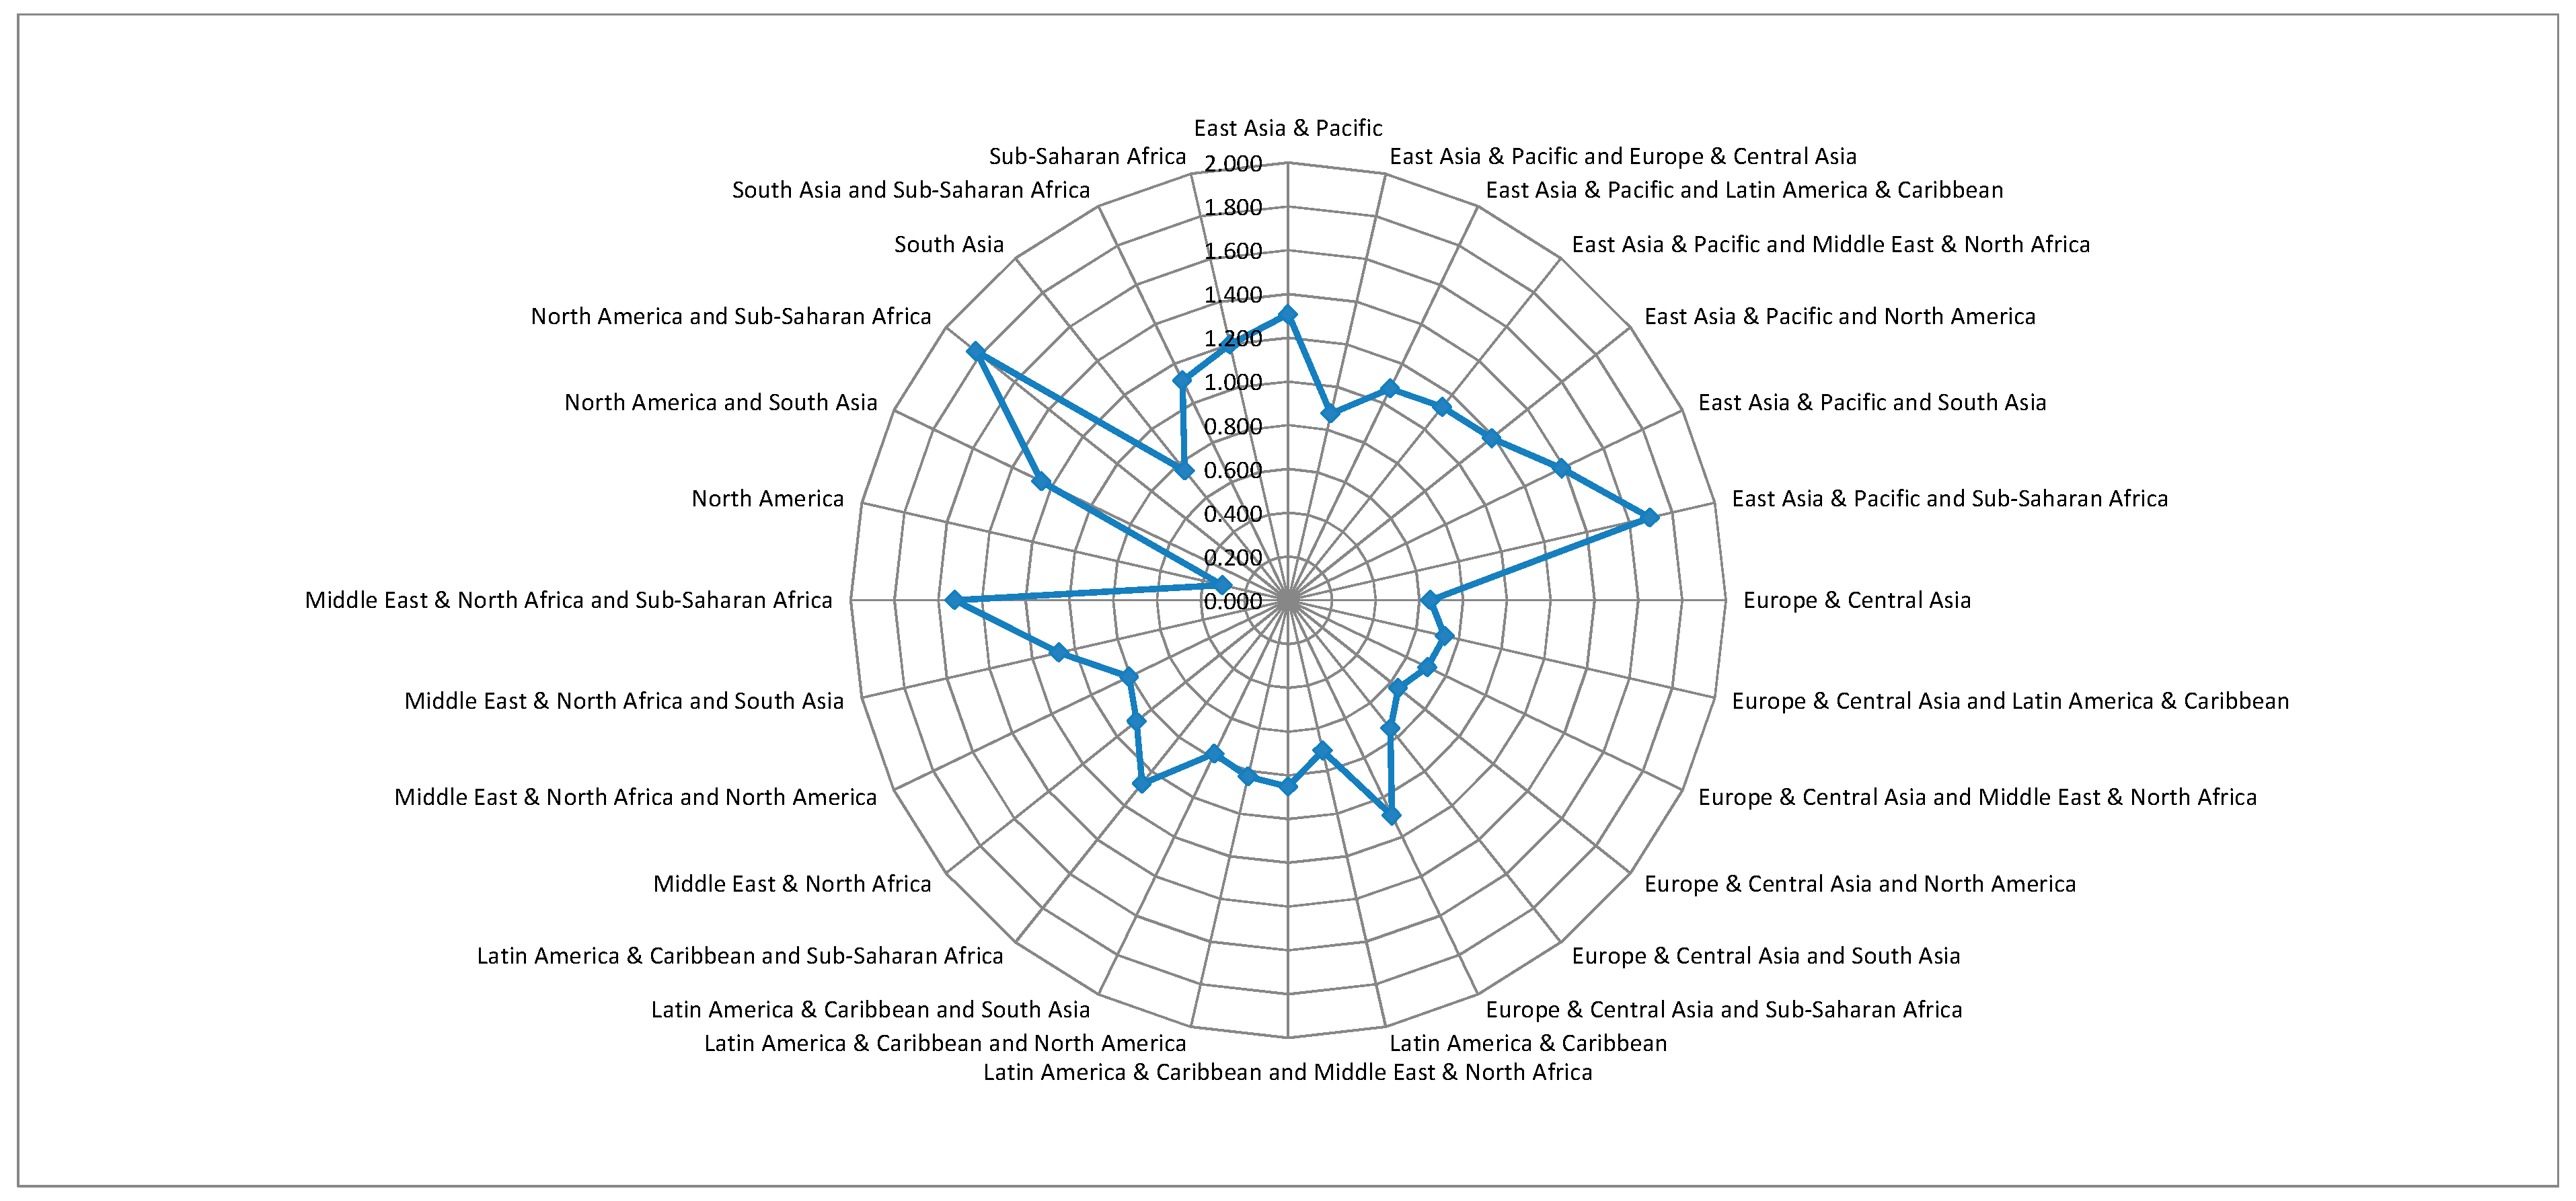
The world regions with the highest averages for the coefficient of variation are the following (Figure 3): North America and Sub-Saharan Africa; East Asia and the Pacific and Sub-Saharan Africa; and the Middle East and North Africa and Sub-Saharan Africa. The lowest averages appear in Latin America and the Caribbean, Europe and Central Asia, and North America.

5. Beta Convergence

The results presented in Table 3 (all results of this regression are presented in Table A3) reveal signs of beta convergence between the world’s countries. This speed of convergence is higher for upper middle-income, high-income, and low-income countries (Table 4 and Table A4). The coefficient of convergence is not statistically significant for the following groups of income levels: low and lower middle; low and upper middle; low and high; and lower and upper middle. The lowest speed of convergence was found for lower middle-income countries and for high- and upper-middle-income countries.
These findings for beta convergence reveal that there are signs of convergence inside each income group; however, this evidence is weaker or inexistent between income groups, showing some signs of convergence clubs.
Table 5 (all results of these regressions are presented in Table A5) highlights that the speed of convergence is higher for the following world regions: North America; Europe and Central Asia and North America; Europe and Central Asia; Latin America and the Caribbean and South Asia; Europe and Central Asia and the Middle East and North Africa; and Europe and Central Asia and South Asia. The lowest values for the speed of convergence are found for Latin America and the Caribbean and North America; East Asia and the Pacific and Latin America and the Caribbean; East Asia and the Pacific and the Middle East and North Africa; and East Asia and the Pacific and North America. For the following regions, the coefficient of convergence is not statistically significant: East Asia and Pacific; East Asia and Pacific and South Asia; East Asia and Pacific and Sub-Saharan Africa; Europe and Central Asia and Sub-Saharan Africa; Latin America and the Caribbean and Sub-Saharan Africa; Middle East and North Africa and Sub-Saharan Africa; North America and Sub-Saharan Africa; South Asia; South Asia and Sub-Saharan Africa; and South Asia and Sub-Saharan Africa.
These findings confirm the problems of convergence between the Sub-Saharan Africa countries and the remaining world regions.

6. Discussion

This research aimed to analyze the convergence of GDP per capita worldwide over the last few years (2006–2021) and assess the consequences of the recent exogenous shocks on this evolution. For that, data from the World Bank were considered for all countries and organized by groups, taking into account the level of income and the region to which each country belongs. This statistical information was analyzed through panel data methodologies, finding the results for sigma and beta convergence.
The literature review highlighted the trends of convergence verified in some parts of the world over the last decades, which were disturbed by the COVID-19 pandemic. This was shown, specifically, for the European Union countries [18]. The difficulties that the African countries have to converge between them and with the other continents are also revealed by the scientific community [37].
The results from the sigma convergence confirm the disruptions caused by the COVID-19 pandemic on the convergence process worldwide; however, its impact seemed weaker when compared to that caused by the global financial crisis. When the analysis was made by groups based on their level of income, these disturbances in 2021 were also verified. More recent statistical information is needed to confirm, in future approaches, these pandemic tendencies. On the other hand, lower average dispersion for the GDP per capita was found inside groups related to low, upper middle, and high income. This average dispersion was great when countries from different groups of levels of income were put together, such as low- and high-income nations and lower middle- and high-income countries. There are some signs of convergence clubs here. In general, the world region groups also presented signs of divergence in 2021. In some cases, these signs appeared in 2020, namely for the groups where European and Central Asian nations were considered. In other cases, the divergence began in 2019 (particularly when Latin America and the Caribbean and the Middle East and North Africa countries were taken into account). These findings highlight that the implications of the pandemic were asymmetric (to be confirmed in future research). This opens up new possibilities for future research in these fields. The average dispersion for the world region groups was lower in North America, Europe and Central Asia and North America, Europe and Central Asia and Latin America and the Caribbean, Europe and Central Asia and the Middle East and North Africa, Europe and Central Asia and Latin America and the Caribbean, Europe and Central Asia and South Asia, South Asia and Latin America and the Caribbean, and South Asia. These findings reveal evidence of clubs of convergence and some signs of catching-up phenomena between countries belonging to different world regions. The sub-Saharan African nations have higher average coefficients of variation.
The beta convergence analysis shows that there are signs of convergence worldwide; nonetheless, the speed of convergence is greater between the nations inside the following groups of income levels: low income; upper middle income; and high income. These findings confirm the idea of clubs of convergence for these groups. There is also evidence of beta convergence (with lower speeds) for the lower middle income, lower middle and high income, and upper middle- and high-income countries, showing signs of catching up processes. The world region groups with the highest speed of convergence have, generally, countries from North America, Europe, and Central Asia, revealing again signs of clubs of convergence and catching up trends.

7. Conclusions

The convergence process verified worldwide over the last few years (since 2006) was disturbed by exogenous shocks, including the global financial crisis and the COVID-19 pandemic. Nonetheless, these disruptions were not symmetric, and the consequences of the pandemic on the convergence process seem weaker globally than those from the financial crisis (to be confirmed in future studies with more recent data). In any case, the process of convergence has continued worldwide, with evidence of clubs of convergence and catching-up phenomena. In fact, there are signs of convergence inside some groups and between countries with different levels of income, revealing the role of the high-income countries in promoting income in the lower-income nations. On the other hand, special attention is needed for the African countries, specifically the sub-Saharan ones.
In terms of practical implications and insights for economic and territory management, it is important to reinforce cooperation worldwide to better promote the convergence in the level of income per capita between the countries, where the richer countries play a fundamental role in creating conditions for catching-up processes. In terms of policy recommendations, it could be important to design programs of financial support for the sub-Saharan countries, where the problems of convergence in GDP per capita seem to be more serious. Balanced economic growth is crucial for sustainable development. For future research, it is suggested to explore the contexts inside each group of countries. It could be interesting, for example, to better understand the frameworks of the sub-Saharan African countries, where the weaknesses are greater and the challenges to improving economic growth are enormous. This is particularly important for territory planning in these nations, where economic growth theories may provide relevant insights. Territory-related dimensions of convergence assessments have been highlighted in the literature [58]. It was also suggested to test other variables that may influence these trends of convergence, considering the approaches to conditional convergence. This research aimed to analyze the influence of the level of income and the location of countries on convergence trends worldwide. For future research, it is suggested to test the size of the pandemic in each group of levels of income and world regions. It could also be interesting to test the socioeconomic differences inside each region, the public policy responses to COVID-19, the European Union policies, cohesion, and differences in the industry structure.

Funding

This work is funded by national funds through the FCT-Foundation for Science and Technology, I.P., within the scope of the project Refª UIDB/00681/2020.

Data Availability Statement

Data will be available upon reasonable request.

Acknowledgments

The author would like to thank the CERNAS Research Center and the Polytechnic Institute of Viseu for their support.

Conflicts of Interest

The author declares no conflict of interest.

Appendix A

Table A1. List of countries by income.
Level of IncomeCountries
Low incomeAfghanistan
Burkina Faso
Burundi
Central African Republic
Chad
Congo, Dem. Rep.
Ethiopia
Gambia, The
Guinea
Guinea-Bissau
Liberia
Madagascar
Malawi
Mali
Mozambique
Niger
Rwanda
Sierra Leone
Sudan
Togo
Uganda
Zambia
Lower middle incomeAlgeria
Angola
Bangladesh
Benin
Bhutan
Bolivia
Cabo Verde
Cambodia
Cameroon
Comoros
Congo, Rep.
Cote d’Ivoire
Egypt, Arab Rep.
El Salvador
Eswatini
Ghana
Haiti
Honduras
India
Indonesia
Iran, Islamic Rep.
Kenya
Kiribati
Kyrgyz Republic
Lao PDR
Lebanon
Lesotho
Mauritania
Micronesia, Fed. Sts.
Mongolia
Morocco
Myanmar
Nepal
Nicaragua
Nigeria
Pakistan
Papua New Guinea
Philippines
Samoa
Sao Tome and Principe
Senegal
Solomon Islands
Sri Lanka
Tajikistan
Tanzania
Timor-Leste
Tunisia
Ukraine
Uzbekistan
Vanuatu
Vietnam
West Bank and Gaza
Zimbabwe
Upper middle incomeAlbania
Argentina
Armenia
Azerbaijan
Belarus
Belize
Bosnia and Herzegovina
Botswana
Brazil
Bulgaria
China
Colombia
Costa Rica
Dominica
Dominican Republic
Ecuador
Equatorial Guinea
Fiji
Gabon
Georgia
Grenada
Guatemala
Guyana
Iraq
Jamaica
Jordan
Kazakhstan
Libya
Malaysia
Maldives
Marshall Islands
Mauritius
Mexico
Moldova
Montenegro
Namibia
North Macedonia
Palau
Paraguay
Peru
Russian Federation
Serbia
South Africa
St. Lucia
St. Vincent and the Grenadines
Suriname
Thailand
Tonga
Turkiye
Tuvalu
High incomeAntigua and Barbuda
Aruba
Australia
Austria
Bahamas, The
Bahrain
Barbados
Belgium
Bermuda
Brunei Darussalam
Canada
Cayman Islands
Chile
Croatia
Curacao
Cyprus
Czechia
Denmark
Estonia
Finland
France
Germany
Greece
Hong Kong SAR, China
Hungary
Iceland
Ireland
Israel
Italy
Japan
Korea, Rep.
Latvia
Lithuania
Luxembourg
Macao SAR, China
Malta
Nauru
Netherlands
New Zealand
Norway
Oman
Panama
Poland
Portugal
Puerto Rico
Qatar
Romania
Saudi Arabia
Seychelles
Singapore
Slovak Republic
Slovenia
Spain
St. Kitts and Nevis
Sweden
Switzerland
Trinidad and Tobago
United Arab Emirates
United Kingdom
United States
Uruguay
Table A2. Summary statistics of the GDP per capita for the groups of countries by income.
VariableObservationsMeanStandard DeviationMinimumMaximum
Low income35217738227055047
Lower middle income84858133424135319,240
Upper middle income80014,4765656333535,689
High income97644,50722,2454401157,603
Table A3. Regression results for the GDP per capita (PPP, constant 2017 international $), over the period 2006–2021, considering all countries.
Independent VariableCoefficientStandard ErrorZP > |z|Beta Convergence (%)Hausman TestPesaran’s Test of Cross Sectional IndependenceModified Wald Test for Groupwise HeteroskedasticityWooldridge Test for Autocorrelation
Logarithm of GDPpc lagged−0.005 *0.002−2.6600.0080.501194.740 *163.010 *32,962.530 *17.909 *
Constant0.063 *0.0144.6300.000
Note: *, Statistically significant at 1%.
Table A4. Regression results for the GDP per capita (PPP, constant 2017 international $), over the period 2006–2021, considering each group of level of income.
Level of Income Independent VariableCoefficientStandard ErrorZP > |z|Beta Convergence (%)Hausman TestPesaran’s Test of Cross Sectional IndependenceModified Wald Test for Groupwise HeteroskedasticityWooldridge Test for Autocorrelation
LowLogarithm of GDPpc lagged−0.020 **0.010−2.0200.0442.02024.410 *5.670 *1400.930 *41.824 *
Constant0.157 **0.0732.1500.032
Low and lower middleLogarithm of GDPpc lagged−0.0020.004−0.4100.682 96.070 *38.331 *7196.360 *87.798 *
Constant0.0290.0281.0600.287
Low and upper middleLogarithm of GDPpc lagged−0.0010.004−0.3200.748 83.490 *52.078 *10,764.370 *10.074 *
Constant0.0280.0281.0100.311
Low and highLogarithm of GDPpc lagged−0.0030.002−1.4000.163 95.400 *83.078 *10,614.300 *126.831 *
Constant0.036 **0.0142.5300.011
Lower middleLogarithm of GDPpc lagged−0.011 ***0.006−1.9200.0551.10655.830 *32.528 *5516.920 *54.034 *
Constant0.113 **0.0462.4600.014
Lower and upper middleLogarithm of GDPpc lagged−0.0090.006−1.5900.112 100.110 *79.747 *23,446.710 *9.709 *
Constant0.102 **0.0472.1800.029
Lower middle and highLogarithm of GDPpc lagged−0.007 *0.002−3.9700.0000.702113.560 *111.357 *16,621.350 *146.453 *
Constant0.083 *0.0155.6300.000
Upper middleLogarithm of GDPpc lagged−0.023 ***0.012−1.8800.0602.32745.000 *51.063 *2962.010 *10.025 *
Constant0.241 **0.1132.1300.034
Upper middle and highLogarithm of GDPpc lagged−0.014 *0.002−5.8800.0001.410106.600 *139.267 *19,356.890 *14.468 *
Constant0.154 *0.0256.1900.000
HighLogarithm of GDPpc lagged−0.022 *0.007−3.3200.0012.22553.710 *88.232 *9086.180 *77.035 *
Constant0.240 *0.0703.4400.001
Note: *, Statistically significant at 1%; **, Statistically significant at 5%; ***, Statistically significant at 10%.
Table A5. Regression results for the GDP per capita (PPP, constant 2017 international $), over the period 2006–2021, considering each world region.
Level of IncomeIndependent VariableCoefficientStandard ErrorZP > |z|Beta Convergence (%)Hausman TestPesaran’s Test of Cross Sectional IndependenceModified Wald Test for Groupwise HeteroskedasticityWooldridge Test for Autocorrelation
East Asia & PacificLogarithm of GDPpc lagged−0.0070.006−1.1900.235 32.610 *21.984 *15,627.300 *58.236 *
Constant0.084 ***0.0481.7400.082
East Asia & Pacific and Europe & Central AsiaLogarithm of GDPpc lagged−0.011 *0.003−4.3700.0001.10660.550 *87.639 *10,192.110 *116.156 *
Constant0.133 *0.0235.6800.000
East Asia & Pacific and Latin America & CaribbeanLogarithm of GDPpc lagged−0.009 **0.005−1.9700.0490.90463.880 *63.222 *12,496.310 *82.474 *
Constant0.101 *0.0382.6600.008
East Asia & Pacific and Middle East & North AfricaLogarithm of GDPpc lagged−0.009 ***0.005−1.8400.0660.90465.400 *27.202 *33,333.320 *5.513 **
Constant0.103 **0.0412.4900.013
East Asia & Pacific and North AmericaLogarithm of GDPpc lagged−0.008 ***0.004−1.8500.0650.80334.840 *26.059 *13,660.390 *63.502 *
Constant0.097 **0.0392.4700.013
East Asia & Pacific and South AsiaLogarithm of GDPpc lagged−0.0080.005−1.4800.138 47.660 *28.625 *18,287.450 *18.211 *
Constant0.097 **0.0442.2000.028
East Asia & Pacific and Sub-Saharan AfricaLogarithm of GDPpc lagged−0.0010.003−0.4800.633 68.240 *43.893 *20,426.910 *125.068 *
Constant0.0280.0211.3500.177
Europe & Central AsiaLogarithm of GDPpc lagged−0.017 *0.003−6.9000.0001.71520.600 *79.307 *1076.020 *48.933 *
Constant0.196 *0.0306.5400.000
Europe & Central Asia and Latin America & CaribbeanLogarithm of GDPpc lagged−0.011 *0.002−4.9100.0001.10657.530 *121.547 *1632.080 *75.389 *
Constant0.124 *0.0264.7400.000
Europe & Central Asia and Middle East & North AfricaLogarithm of GDPpc lagged−0.015 *0.002−6.3200.0001.51173.100 *78.588 *4927.760 *7.852 *
Constant0.171 *0.0286.1800.000
Europe & Central Asia and North AmericaLogarithm of GDPpc lagged−0.018 *0.003−7.1500.0001.81622.050 *85.559 *1023.720 *51.996 *
Constant0.202 *0.0306.6700.000
Europe & Central Asia and South AsiaLogarithm of GDPpc lagged−0.015 *0.002−7.2900.0001.51142.490 *81.794 *1789.310 *13.340 *
Constant0.170 *0.0227.6900.000
Europe & Central Asia and Sub-Saharan AfricaLogarithm of GDPpc lagged−0.0020.002−1.0900.275 58.000 *83.731 *7168.120 *102.275 *
Constant0.036 **0.0152.3700.018
Latin America & CaribbeanLogarithm of GDPpc lagged−0.013 *0.003−3.8000.0001.30935.990 *50.349 *381.770 *34.654 *
Constant0.135 *0.0274.9400.000
Latin America & Caribbean and Middle East & North AfricaLogarithm of GDPpc lagged−0.013 *0.004−3.1400.0021.30996.830 *53.538 *3598.500 *10.780 *
Constant0.132 *0.0353.7700.000
Latin America & Caribbean and North AmericaLogarithm of GDPpc lagged−0.011 *0.002−4.9700.0001.10639.840 *55.668 *419.710 *36.585 *
Constant0.115 *0.0196.1800.000
Latin America & Caribbean and South AsiaLogarithm of GDPpc lagged−0.016 *0.004−4.0800.0001.61350.690 *54.586 *833.540 *20.303 *
Constant0.163 *0.0305.3800.000
Latin America & Caribbean and Sub-Saharan AfricaLogarithm of GDPpc lagged−0.0050.003−1.5400.124 61.150 *68.584 *10,344.340 *78.128 *
Constant0.052 **0.0212.4700.014
Middle East & North AfricaLogarithm of GDPpc lagged−0.013 **0.007−1.9700.0491.30955.980 *6.941 *4645.070 *7.500 **
Constant0.143 **0.0622.2900.022
Middle East & North Africa and North AmericaLogarithm of GDPpc lagged−0.013 *0.004−2.8700.0041.30963.710 *10.038 *4268.200 *7.697 **
Constant0.137 *0.0462.9700.003
Middle East & North Africa and South AsiaLogarithm of GDPpc lagged−0.015 **0.006−2.5300.0111.51155.780 *13.632 *6287.900 *7.578 **
Constant0.157 *0.0503.1300.002
Middle East & North Africa and Sub-Saharan AfricaLogarithm of GDPpc lagged−0.0030.003−0.9400.346 74.580 *30.700 *24,251.450 *6.374 **
Constant0.038 ***0.0221.7300.083
North AmericaLogarithm of GDPpc lagged−0.032 *0.012−2.7000.0073.2522.4004.619 *2.11015.184 ***
Constant0.356 *0.1292.7600.006
North America and South AsiaLogarithm of GDPpc lagged−0.012 *0.004−2.7600.0061.20718.600 *11.165 *708.600 *2.065
Constant0.134 *0.0383.5200.000
North America and Sub-Saharan AfricaLogarithm of GDPpc lagged−0.0030.002−1.4600.143 28.150 *27.741 *5812.410 *59.029 *
Constant0.038 **0.0162.3300.020
South AsiaLogarithm of GDPpc lagged−0.0050.015−0.3400.732 16.250 *6.219 *960.000 *1.675
Constant0.0780.1250.6200.535
South Asia and Sub-Saharan AfricaLogarithm of GDPpc lagged−0.0020.005−0.3500.730 47.970 *29.184 *10,551.060 *13.570 *
Constant0.0280.0330.8500.393
Sub-Saharan AfricaLogarithm of GDPpc lagged−0.0020.004−0.6300.531 25.330 *24.028 *6236.360 *56.352 *
Constant0.0310.0261.1800.239
Note: *, Statistically significant at 1%; **, Statistically significant at 5%; ***, Statistically significant at 10%.

References

  1. Martinho, V.J.P. Análise do Crescimento Regional em Portugal com Base nas Teorias da Polarização e da Aglomeração. Ph.D. Thesis, University of Coimbra, Coimbra, Portugal, 2007. [Google Scholar]
  2. Solow, R.M. A Contribution to the Theory of Economic Growth. Q. J. Econ. 1956, 70, 65–94. [Google Scholar] [CrossRef]
  3. Barro, R.J.; Sala-I-Martin, X. Convergence Across States and Regions. Brook. Pap. Econ. Act. 1991, 1991, 107–182. [Google Scholar] [CrossRef] [Green Version]
  4. Sala-i-Martin, X.X. Regional Cohesion: Evidence and Theories of Regional Growth and Convergence. Eur. Econ. Rev. 1996, 40, 1325–1352. [Google Scholar] [CrossRef] [Green Version]
  5. Barro, R.J. Economic Growth in a Cross Section of Countries. Q. J. Econ. 1991, 106, 407–443. [Google Scholar] [CrossRef] [Green Version]
  6. Baumol, W.J. Productivity Growth, Convergence, and Welfare: What the Long-Run Data Show. Am. Econ. Rev. 1986, 76, 1072–1085. [Google Scholar]
  7. Chatterji, M. Convergence Clubs and Endogenous Growth. Oxf. Rev. Econ. Policy 1992, 8, 57–69. [Google Scholar] [CrossRef]
  8. Verdoorn, P.J. Fattori che Regolano lo Sviluppo Della Produttività del Lavoro; L’Industria; Il Mulino: Bologna, Italy, 1949; pp. 45–53. [Google Scholar]
  9. Kaldor, N. Causes of the Slow Rate of Economic Growth of the United Kingdom: An Inaugural Lecture; Cambridge University Press: London, UK, 1966. [Google Scholar]
  10. Thirlwall, A.P. A Plain Man’s Guide to Kaldor’s Growth Laws. J. Post Keynes. Econ. 1983, 5, 345–358. [Google Scholar] [CrossRef]
  11. Kaldor, N. Causes of Growth and Stagnation in the World Economy; Cambridge University Press: London, UK, 1984. [Google Scholar]
  12. Fujita, M.; Krugman, P.; Venables, A.J. The Spatial Economy: Cities, Regions, and International Trade; The MIT Press: Cambridge, UK, 2001; ISBN 978-0-262-56147-1. [Google Scholar]
  13. World Bank World Bank Open Data|Data. Available online: https://data.worldbank.org/ (accessed on 2 March 2023).
  14. Islam, N. Growth Empirics: A Panel Data Approach. Q. J. Econ. 1995, 110, 1127–1170. [Google Scholar] [CrossRef]
  15. StataCorp. Stata 15 Base Reference Manual. Stata Press: College Station, TX, USA, 2017. Available online: https://www.stata.com/support/faqs/resources/citing-software-documentation-faqs/ (accessed on 2 March 2023).
  16. StataCorp. Stata Statistical Software: Release 15. StataCorp LLC: College Station, TX, USA, 2017. Available online: https://www.stata.com/support/faqs/resources/citing-software-documentation-faqs/ (accessed on 2 March 2023).
  17. Stata Statistical Software for Data Science|Stata. Available online: https://www.stata.com/ (accessed on 2 March 2023).
  18. Abrhám, J.; Vošta, M. Impact of the COVID-19 Pandemic on EU Convergence. J. Risk. Financ. Manag. 2022, 15, 384. [Google Scholar] [CrossRef]
  19. Miron, D.; Holobiuc, A.-M.; Cojocariu, R.C.; Budacia, A.E. Real Convergence in the Euro Area: Mirage or Reality? J. Compet. 2022, 14, 100–117. [Google Scholar] [CrossRef]
  20. Peshev, P. Bulgarian NUTS2 Regions’ Beta- and Sigma-Convergence Towards the Eurozone. J. Pediatr. Pharmacol. Ther. 2022, 28, 17–34. [Google Scholar] [CrossRef]
  21. Adıyaman, E.; Kasman, S. Convergence in Homicide Rates Across the European Union Countries: Toward an Effective and Genuine Security Union. Crime Delinq. 2023, 69, 105–120. [Google Scholar] [CrossRef]
  22. Balla, S.; Goli, S.; Vedantam, S.; Rammohan, A. Progress in Child Stunting across the World from 1990 to 2015: Testing the Global Convergence Hypothesis. Public Health Nutr. 2021, 24, 5598–5607. [Google Scholar] [CrossRef]
  23. Castellanos-Sosa, F.A.; Cabral, R.; Mollick, A.V. Energy Reform and Energy Consumption Convergence in Mexico: A Spatial Approach. Struct. Chang. Econ. Dyn. 2022, 61, 336–350. [Google Scholar] [CrossRef]
  24. Costantini, V.; Delgado, F.J.; Presno, M.J. Environmental Innovations in the EU: A Club Convergence Analysis of the Eco-Innovation Index and Driving Factors of the Clusters. Environ. Innov. Soc. Transit. 2023, 46, 100698. [Google Scholar] [CrossRef]
  25. de Almeida, R.D.C.; Ehrl, P.; Moreira, T.B.S. Social and Economic Convergence Across Brazilian States Between 1990 and 2010. Soc. Indic. Res. 2021, 157, 225–246. [Google Scholar] [CrossRef]
  26. Delgado, F.J.; Mayor, M.; Presno, M.J. Heterogeneity of Research and Development Expenditure: A Convergence Analysis for the Spanish Regions. Int. Reg. Sci. Rev. 2022. [Google Scholar] [CrossRef]
  27. Henning, M.; Westlund, H.; Enflo, K. Urban–Rural Population Changes and Spatial Inequalities in Sweden. Reg. Sci. Policy Pract. 2022, 15, 878–892. [Google Scholar] [CrossRef]
  28. Jiang, L.; Chen, Y.; Liang, W.; Zhang, B. Convergence Analysis of Cross-Province Human Well-Being in China: A Spatiotemporal Perspective. Int. J. Environ. Res. Public Health 2023, 20, 1858. [Google Scholar] [CrossRef]
  29. Kerner, P.; Wendler, T. Convergence in Resource Productivity. World Dev. 2022, 158, 105979. [Google Scholar] [CrossRef]
  30. Khan, S.U.; Cui, Y.; Khan, A.A.; Ali, M.A.S.; Khan, A.; Xia, X.; Liu, G.; Zhao, M. Tracking Sustainable Development Efficiency with Human-Environmental System Relationship: An Application of DPSIR and Super Efficiency SBM Model. Sci. Total Environ. 2021, 783, 146959. [Google Scholar] [CrossRef]
  31. Kovács, T.Z.; Bittner, B.; Huzsvai, L.; Nábrádi, A. Convergence and the Matthew Effect in the European Union Based on the DESI Index. Mathematics 2022, 10, 613. [Google Scholar] [CrossRef]
  32. Lin, X.; Chen, Q.; Wei, L.; Lu, Y.; Chen, Y.; He, Z. Exploring the Trend in Religious Diversity: Based on the Geographical Perspective. PLoS ONE 2022, 17, e0271343. [Google Scholar] [CrossRef]
  33. Matsuki, T.; Pan, L. Per Capita Carbon Emissions Convergence in Developing Asia: A Century of Evidence from Covariate Unit Root Test with Endogenous Structural Breaks. Energy Econ. 2021, 99, 105326. [Google Scholar] [CrossRef]
  34. Yu, B.; Fang, D.; Kleit, A.N.; Xiao, K. Exploring the Driving Mechanism and the Evolution of the Low-Carbon Economy Transition: Lessons from OECD Developed Countries. World Econ. 2022, 45, 2766–2795. [Google Scholar] [CrossRef]
  35. Bacovic, M.; Andrijasevic, Z.; Pejovic, B. Divergence between the Economies of the (Former) Yugoslav Republics: Is It Possible to Change Direction? East. Eur. Econ. 2022, 60, 265–284. [Google Scholar] [CrossRef]
  36. Ram, R. Income Convergence across the U.S. States: Further Evidence from New Recent Data. J. Econ. Financ. 2021, 45, 372–380. [Google Scholar] [CrossRef]
  37. Paprotny, D. Convergence Between Developed and Developing Countries: A Centennial Perspective. Soc. Indic. Res. 2021, 153, 193–225. [Google Scholar] [CrossRef]
  38. Basel, S.; Gopakumar, K.U.; Prabhakara Rao, R. Testing Club Convergence of Economies by Using a Broad-Based Development Index. GeoJournal 2021, 86, 2351–2365. [Google Scholar] [CrossRef]
  39. Basel, S.; Rao, R.P.; Gopakumar, K.U. Analysis of Club Convergence for Economies: Identification and Testing Using Development Indices. Asia-Pac. J. Reg. Sci. 2021, 5, 885–908. [Google Scholar] [CrossRef]
  40. Benavides, D.R.; Mina, O.E.C. Regional Convergence Clubs in Colombia 2000-2016: A Flexible Analysis by Provinces. Investig. Reg. 2022, 2022, 47–65. [Google Scholar] [CrossRef]
  41. Misiak, T. Is the Division of Western and Eastern Poland Still Valid? The Evolution of Regional Convergence in Poland. Econ. Bus. Rev. 2022, 8, 145–169. [Google Scholar] [CrossRef]
  42. Taymaz, E. Regional Convergence or Polarization: The Case of the Russian Federation. Reg. Res. Russ. 2022, 12, 469–482. [Google Scholar] [CrossRef]
  43. Trofimov, I.D.; Sharaan, A. Shadow Economy, Transaction Sector, and Economic Convergence: Evidence from a Global Panel of Countries. Seoul J. Econ. 2022, 35, 359–402. [Google Scholar] [CrossRef]
  44. Oliver, M.E.; Upton, G.B., Jr. Are Energy Endowed Countries Responsible for Conditional Convergence? Energy J. 2022, 43, 205–228. [Google Scholar] [CrossRef]
  45. Schneider, O. Labour Migration in the European Union: The Case of Central and Eastern Europe. Econ. Ann. 2022, 67, 7–38. [Google Scholar] [CrossRef]
  46. Benavides, D.R.; González, M.Á.M.; Hernández, J.A.C. The Convergence Hypothesis in Mexico: A Weak σ-Convergence Approach. Rev. Mex. Econ. Finanz. Nueva. Epoca. 2022, 17, 1–21. [Google Scholar] [CrossRef]
  47. Jankiewicz, M. The Convergence of Energy Use from Renewable Sources in the European Countries: Spatio-Temporal Approach. Energies 2021, 14, 8378. [Google Scholar] [CrossRef]
  48. Martinho, V.J.P.D. Impact of COVID-19 on the Convergence of GDP per Capita in OECD Countries. Reg. Sci. Policy Pract. 2021, 13, 55–72. [Google Scholar] [CrossRef]
  49. Bentzen, J.; Tung, L.T. Regional Income Convergence in an Emerging Asian Economy: Empirical Evidence from Vietnam. Post-Communist Econ. 2021, 33, 64–78. [Google Scholar] [CrossRef]
  50. Kadigi, R.M.J.; Robinson, E.; Szabo, S.; Kangile, J.; Mgeni, C.P.; De Maria, M.; Tsusaka, T.; Nhau, B. Revisiting the Solow-Swan Model of Income Convergence in the Context of Coffee Producing and Re-Exporting Countries in the World. Sustain. Future. 2022, 4, 100082. [Google Scholar] [CrossRef]
  51. Broadberry, S.; Guan, H.; Li, D.D. China, Europe, and the Great Divergence: A Restatement. J. Econ. Hist. 2021, 81, 958–974. [Google Scholar] [CrossRef]
  52. Bruno, L.; Eloranta, J.; Ojala, J.; Pehkonen, J. Road to Unity? Nordic Economic Convergence in the Long Run. Scand. Econ. Hist. Rev. 2022, 1–18. [Google Scholar] [CrossRef]
  53. Goschin, Z. Exploring Regional Economic Convergence in Romania. A Spatial Modeling Approach. East. J. Eur. Stud. 2017, 8, 127–146. [Google Scholar]
  54. Maasoumi, E.; Racine, J.; Stengos, T. Growth and Convergence: A Profile of Distribution Dynamics and Mobility. J. Econom. 2007, 136, 483–508. [Google Scholar] [CrossRef] [Green Version]
  55. Wojcik, P. Was Poland the next Spain? Parallel Analysis of Regional Convergence Patterns after Accession to the European Union. Equilibrium. Q. J. Econ. Econ. Policy 2017, 12, 593–611. [Google Scholar] [CrossRef] [Green Version]
  56. Urban, D.M. Neoclassical Growth, Manufacturing Agglomeration, and Terms of Trade. Rev. Int. Econ. 2007, 15, 1014–1035. [Google Scholar] [CrossRef] [Green Version]
  57. Tondl, G. The Changing Pattern of Regional Convergence in Europe (July 1998). Robert Schuman Centre (EUI), RSC No. 97/53. Available online: https://ssrn.com/abstract=130688 (accessed on 2 March 2023).
  58. Cherodian, R.; Thirlwall, A.P. Regional Disparities in per Capita Income in India: Convergence or Divergence? J. Post Keynes. Econ. 2015, 37, 384–407. [Google Scholar] [CrossRef] [Green Version]
  59. Quah, D. Galton’s Fallacy and Tests of the Convergence Hypothesis. Scand. J. Econ. 1993, 95, 427–443. [Google Scholar] [CrossRef]
  60. Quah, D.T. Empirics for Economic Growth and Convergence. Eur. Econ. Rev. 1996, 40, 1353–1375. [Google Scholar] [CrossRef] [Green Version]
  61. Torres-Reyna, O. Panel Data Analysis Fixed and Random Effects Using Stata. Available online: https://www.princeton.edu/~otorres/Panel101.pdf (accessed on 2 March 2023).
  62. Moutinho, V.; Robaina-Alves, M.; Mota, J. Carbon Dioxide Emissions Intensity of Portuguese Industry and Energy Sectors: A Convergence Analysis and Econometric Approach. Renew. Sustain. Energy Rev. 2014, 40, 438–449. [Google Scholar] [CrossRef]
  63. Pandey, V.L.; Suganthi, D. Fueling Agricultural Growth in India: Some Reflections. Land Use Policy 2015, 42, 227–232. [Google Scholar] [CrossRef]
  64. Moutinho, V.; Madaleno, M.; Elheddad, M. Determinants of the Environmental Kuznets Curve Considering Economic Activity Sector Diversification in the OPEC Countries. J. Clean. Prod. 2020, 271, 122642. [Google Scholar] [CrossRef]
  65. Yang, G.; Zhou, C.; Zhang, J. Does Industry Convergence between Agriculture and Related Sectors Alleviate Rural Poverty: Evidence from China. Env. Dev. Sustain 2022, 1–28. [Google Scholar] [CrossRef]
  66. Youkta, K.; Paramanik, R.N. Convergence Analysis of Health Expenditure in Indian States: Do Political Factors Matter? GeoJournal 2022, 87, 1469–1478. [Google Scholar] [CrossRef]
  67. Beck, N.; Katz, J.N. What to Do (and Not to Do) with Time-Series Cross-Section Data. Am. Political Sci. Rev. 1995, 89, 634–647. [Google Scholar] [CrossRef]
Figure 1. Sigma convergence (coefficient of variation), for the GDP per capita (PPP, constant 2017 international $), over the period 2006–2021, considering all countries.
Land 12 01251 g001
Figure 2. The average coefficient of variation, for the GDP per capita (PPP, constant 2017 international $), over the period 2006–2021, considering each group of levels of income.
Land 12 01251 g002
Figure 3. The average coefficient of variation, for the GDP per capita (PPP, constant 2017 international $), over the period 2006–2021, considering each world region.
Land 12 01251 g003
Table 1. Sigma convergence (coefficient of variation), for the GDP per capita (PPP, constant 2017 international $), over the period 2006–2021, considering each group of levels of income.
Level of Income2006200720082009201020112012201320142015201620172018201920202021Mean
Low0.5530.5490.5370.5030.4930.5090.4670.4690.4670.4620.4600.4480.4260.4070.3990.3980.472
Low and lower middle 0.7590.7770.7800.7740.7820.7760.7640.7450.7280.7160.7250.7290.7280.7180.7000.7060.744
Low and upper middle0.7530.7580.7610.7460.7310.7080.7330.7090.6950.6880.6790.6880.6900.6860.6880.7020.713
Low and high0.8300.8220.8060.8060.8280.8470.8510.8620.8430.7990.7920.7920.7910.7820.7720.7760.812
Lower middle0.6130.6310.6340.6290.6380.6290.6150.5920.5720.5560.5630.5660.5630.5510.5350.5370.589
Lower and upper middle0.6880.6960.7000.6770.6640.6380.6600.6330.6140.6030.5920.5990.6010.5940.5880.6080.635
Lower middle and high0.9990.9880.9690.9600.9790.9960.9971.0060.9850.9410.9310.9310.9300.9200.9060.9150.960
Upper middle0.4450.4490.4530.4380.4180.3870.4190.3860.3670.3560.3430.3540.3560.3490.3590.3700.391
Upper middle and high0.7760.7600.7360.7310.7490.7690.7650.7730.7550.7120.7050.7040.7020.6920.6850.6850.731
High0.5210.5110.4930.4950.5220.5440.5500.5620.5410.4870.4780.4780.4770.4640.4540.4570.502
Note: The coefficient of variation is ratio among the standard deviation and the mean.
Table 2. Sigma convergence (coefficient of variation), for the GDP per capita (PPP, constant 2017 international $), over the period 2006–2021, considering each world region.
World Region2006200720082009201020112012201320142015201620172018201920202021Mean
East Asia & Pacific1.3011.3201.3021.2921.3561.4191.4381.4681.4211.2761.2531.2771.2841.2491.1121.1641.308
East Asia & Pacific and Europe & Central Asia0.9030.9020.8810.8810.9020.9200.9280.9420.9190.8580.8490.8500.8450.8260.7920.8030.875
East Asia & Pacific and Latin America & Caribbean1.0871.0911.0641.0501.1001.1521.1691.1961.1581.0421.0261.0511.0601.0370.9400.9641.074
East Asia & Pacific and Middle East & North Africa1.1601.1371.1121.0991.1511.2191.2131.2381.2121.1171.0951.0971.1001.0821.0101.0381.130
East Asia & Pacific and North America1.2171.2271.2111.1961.2291.2671.2771.2991.2611.1511.1331.1531.1561.1301.0351.0741.189
East Asia & Pacific and South Asia1.3961.4121.3891.3771.4431.5081.5271.5571.5051.3521.3251.3481.3531.3151.1801.2251.388
East Asia & Pacific and Sub-Saharan Africa1.6671.6871.6631.6511.7351.8131.8371.8761.8231.6621.6431.6801.6961.6601.4941.5541.696
Europe & Central Asia0.7090.7000.6770.6780.6740.6580.6520.6460.6410.6410.6400.6260.6150.6050.6220.6170.650
Europe & Central Asia and Latin America & Caribbean0.8030.7940.7690.7590.7500.7340.7240.7150.7100.7130.7140.7080.7030.6990.7270.7200.734
Europe & Central Asia and Middle East & North Africa0.7730.7460.7190.7160.7230.7310.7170.7140.7080.7030.6960.6760.6660.6600.6800.6750.706
Europe & Central Asia and North America0.7130.7030.6810.6800.6730.6550.6450.6390.6300.6290.6270.6160.6050.5950.6080.6030.644
Europe & Central Asia and South Asia0.8160.8070.7830.7820.7750.7590.7510.7440.7370.7370.7350.7220.7110.7010.7220.7150.750
Europe & Central Asia and Sub-Saharan Africa1.1491.1431.1211.1141.1081.0921.0821.0751.0701.0751.0781.0721.0661.0611.0781.0801.092
Latin America & Caribbean0.8570.8320.7970.7530.7150.6960.6830.6710.6620.6600.6570.6580.6620.6680.6640.6480.705
Latin America & Caribbean and Middle East & North Africa0.9720.9130.8730.8480.8620.8900.8690.8610.8490.8380.8240.8000.7960.7970.8300.8160.852
Latin America & Caribbean and North America0.9630.9480.9140.8850.8580.8320.8040.7910.7730.7710.7690.7790.7770.7800.8000.7880.827
Latin America & Caribbean and South Asia0.9460.9180.8830.8350.7940.7740.7600.7460.7360.7310.7250.7230.7240.7270.7230.7070.778
Latin America & Caribbean and Sub-Saharan Africa1.2171.1971.1701.1221.0791.0621.0511.0371.0281.0271.0261.0281.0341.0391.0191.0181.072
Middle East & North Africa0.9650.9010.8650.8460.8830.9540.9080.9160.9170.9030.8810.8420.8360.8420.8730.8670.887
Middle East & North Africa and North America0.8770.8430.8170.7980.8130.8550.8120.8170.8140.8050.7900.7680.7630.7680.7890.7860.807
Middle East & North Africa and South Asia1.1921.1191.0771.0541.0871.1471.1041.1061.0971.0801.0541.0110.9990.9991.0411.0271.075
Middle East & North Africa and Sub-Saharan Africa1.6521.5661.5221.4951.5311.5841.5501.5451.5301.5211.5041.4691.4641.4651.4911.4991.524
North America0.4060.4170.4040.3880.3650.3370.2950.2840.2500.2510.2520.2690.2560.2540.2470.2530.308
North America and South Asia1.4101.4001.3741.3491.3181.2851.2461.2311.2001.1931.1791.1791.1641.1541.1851.1691.252
North America and Sub-Saharan Africa1.9971.9871.9521.9091.8751.8321.7801.7631.7291.7391.7441.7711.7711.7741.7711.7991.825
South Asia0.8820.8640.8800.7850.7740.7850.7600.7610.7580.7320.7240.7190.7170.7160.5840.6880.758
South Asia and Sub-Saharan Africa1.1731.2081.2431.2091.1341.1471.1421.1151.1011.0741.0641.0601.0581.0591.0021.0371.114
Sub-Saharan Africa1.2401.2861.3261.3011.2171.2321.2321.2001.1851.1591.1491.1461.1441.1451.1011.1241.199
Note: The coefficient of variation is ratio among the standard deviation and the mean.
Table 3. Beta convergence, for the GDP per capita (PPP, constant 2017 international $), over the period 2006–2021, considering all countries.
Independent VariableCoefficientBeta Convergence (%)
Logarithm of GDPpc lagged−0.005 *0.501
Note: *, Statistically significant at 1%.
Table 4. Beta convergence, for the GDP per capita (PPP, constant 2017 international $), over the period 2006–2021, considering each group of levels of income.
Level of Income Independent VariableCoefficientBeta Convergence (%)
LowLogarithm of GDPpc lagged−0.020 **2.02
Low and lower middleLogarithm of GDPpc lagged−0.002
Low and upper middleLogarithm of GDPpc lagged−0.001
Low and highLogarithm of GDPpc lagged−0.003
Lower middleLogarithm of GDPpc lagged−0.011 ***1.106
Lower and upper middleLogarithm of GDPpc lagged−0.009
Lower middle and highLogarithm of GDPpc lagged−0.007 *0.702
Upper middleLogarithm of GDPpc lagged−0.023 ***2.327
Upper middle and highLogarithm of GDPpc lagged−0.014 *1.41
HighLogarithm of GDPpc lagged−0.022 *2.225
Note: *, Statistically significant at 1%; **, Statistically significant at 5%; ***, Statistically significant at 10%.
Table 5. Beta convergence, for the GDP per capita (PPP, constant 2017 international $), over the period 2006–2021, considering each world region.
Level of Income Independent VariableCoefficientBeta Convergence (%)
East Asia & PacificLogarithm of GDPpc lagged−0.007
East Asia & Pacific and Europe & Central AsiaLogarithm of GDPpc lagged−0.011 *1.106
East Asia & Pacific and Latin America & CaribbeanLogarithm of GDPpc lagged−0.009 **0.904
East Asia & Pacific and Middle East & North AfricaLogarithm of GDPpc lagged−0.009 ***0.904
East Asia & Pacific and North AmericaLogarithm of GDPpc lagged−0.008 ***0.803
East Asia & Pacific and South AsiaLogarithm of GDPpc lagged−0.008
East Asia & Pacific and Sub-Saharan AfricaLogarithm of GDPpc lagged−0.001
Europe & Central AsiaLogarithm of GDPpc lagged−0.017 *1.715
Europe & Central Asia and Latin America & CaribbeanLogarithm of GDPpc lagged−0.011 *1.106
Europe & Central Asia and Middle East & North AfricaLogarithm of GDPpc lagged−0.015 *1.511
Europe & Central Asia and North AmericaLogarithm of GDPpc lagged−0.018 *1.816
Europe & Central Asia and South AsiaLogarithm of GDPpc lagged−0.015 *1.511
Europe & Central Asia and Sub-Saharan AfricaLogarithm of GDPpc lagged−0.002
Latin America & CaribbeanLogarithm of GDPpc lagged−0.013 *1.309
Latin America & Caribbean and Middle East & North AfricaLogarithm of GDPpc lagged−0.013 *1.309
Latin America & Caribbean and North AmericaLogarithm of GDPpc lagged−0.011 *1.106
Latin America & Caribbean and South AsiaLogarithm of GDPpc lagged−0.016 *1.613
Latin America & Caribbean and Sub-Saharan AfricaLogarithm of GDPpc lagged−0.005
Middle East & North AfricaLogarithm of GDPpc lagged−0.013 **1.309
Middle East & North Africa and North AmericaLogarithm of GDPpc lagged−0.013 *1.309
Middle East & North Africa and South AsiaLogarithm of GDPpc lagged−0.015 **1.511
Middle East & North Africa and Sub-Saharan AfricaLogarithm of GDPpc lagged−0.003
North AmericaLogarithm of GDPpc lagged−0.032 *3.252
North America and South AsiaLogarithm of GDPpc lagged−0.012 *1.207
North America and Sub-Saharan AfricaLogarithm of GDPpc lagged−0.003
South AsiaLogarithm of GDPpc lagged−0.005
South Asia and Sub-Saharan AfricaLogarithm of GDPpc lagged−0.002
Sub-Saharan AfricaLogarithm of GDPpc lagged−0.002
Note: *, Statistically significant at 1%; **, Statistically significant at 5%; ***, Statistically significant at 10%.
Disclaimer/Publisher’s Note: The statements, opinions and data contained in all publications are solely those of the individual author(s) and contributor(s) and not of MDPI and/or the editor(s). MDPI and/or the editor(s) disclaim responsibility for any injury to people or property resulting from any ideas, methods, instructions or products referred to in the content.

