


A Participatory Approach to Assess Social Demand and Value of Urban Waterscapes: A Case Study in San Marcos, Texas, USA

Abstract
:1. Introduction
2. Materials and Methods
2.1. Study Area
2.2. Data Collection
2.3. Assessment Design
2.4. Analyses and Techniques
3. Results
3.1. Social Demand and Emotional Experiences of Waterscapes
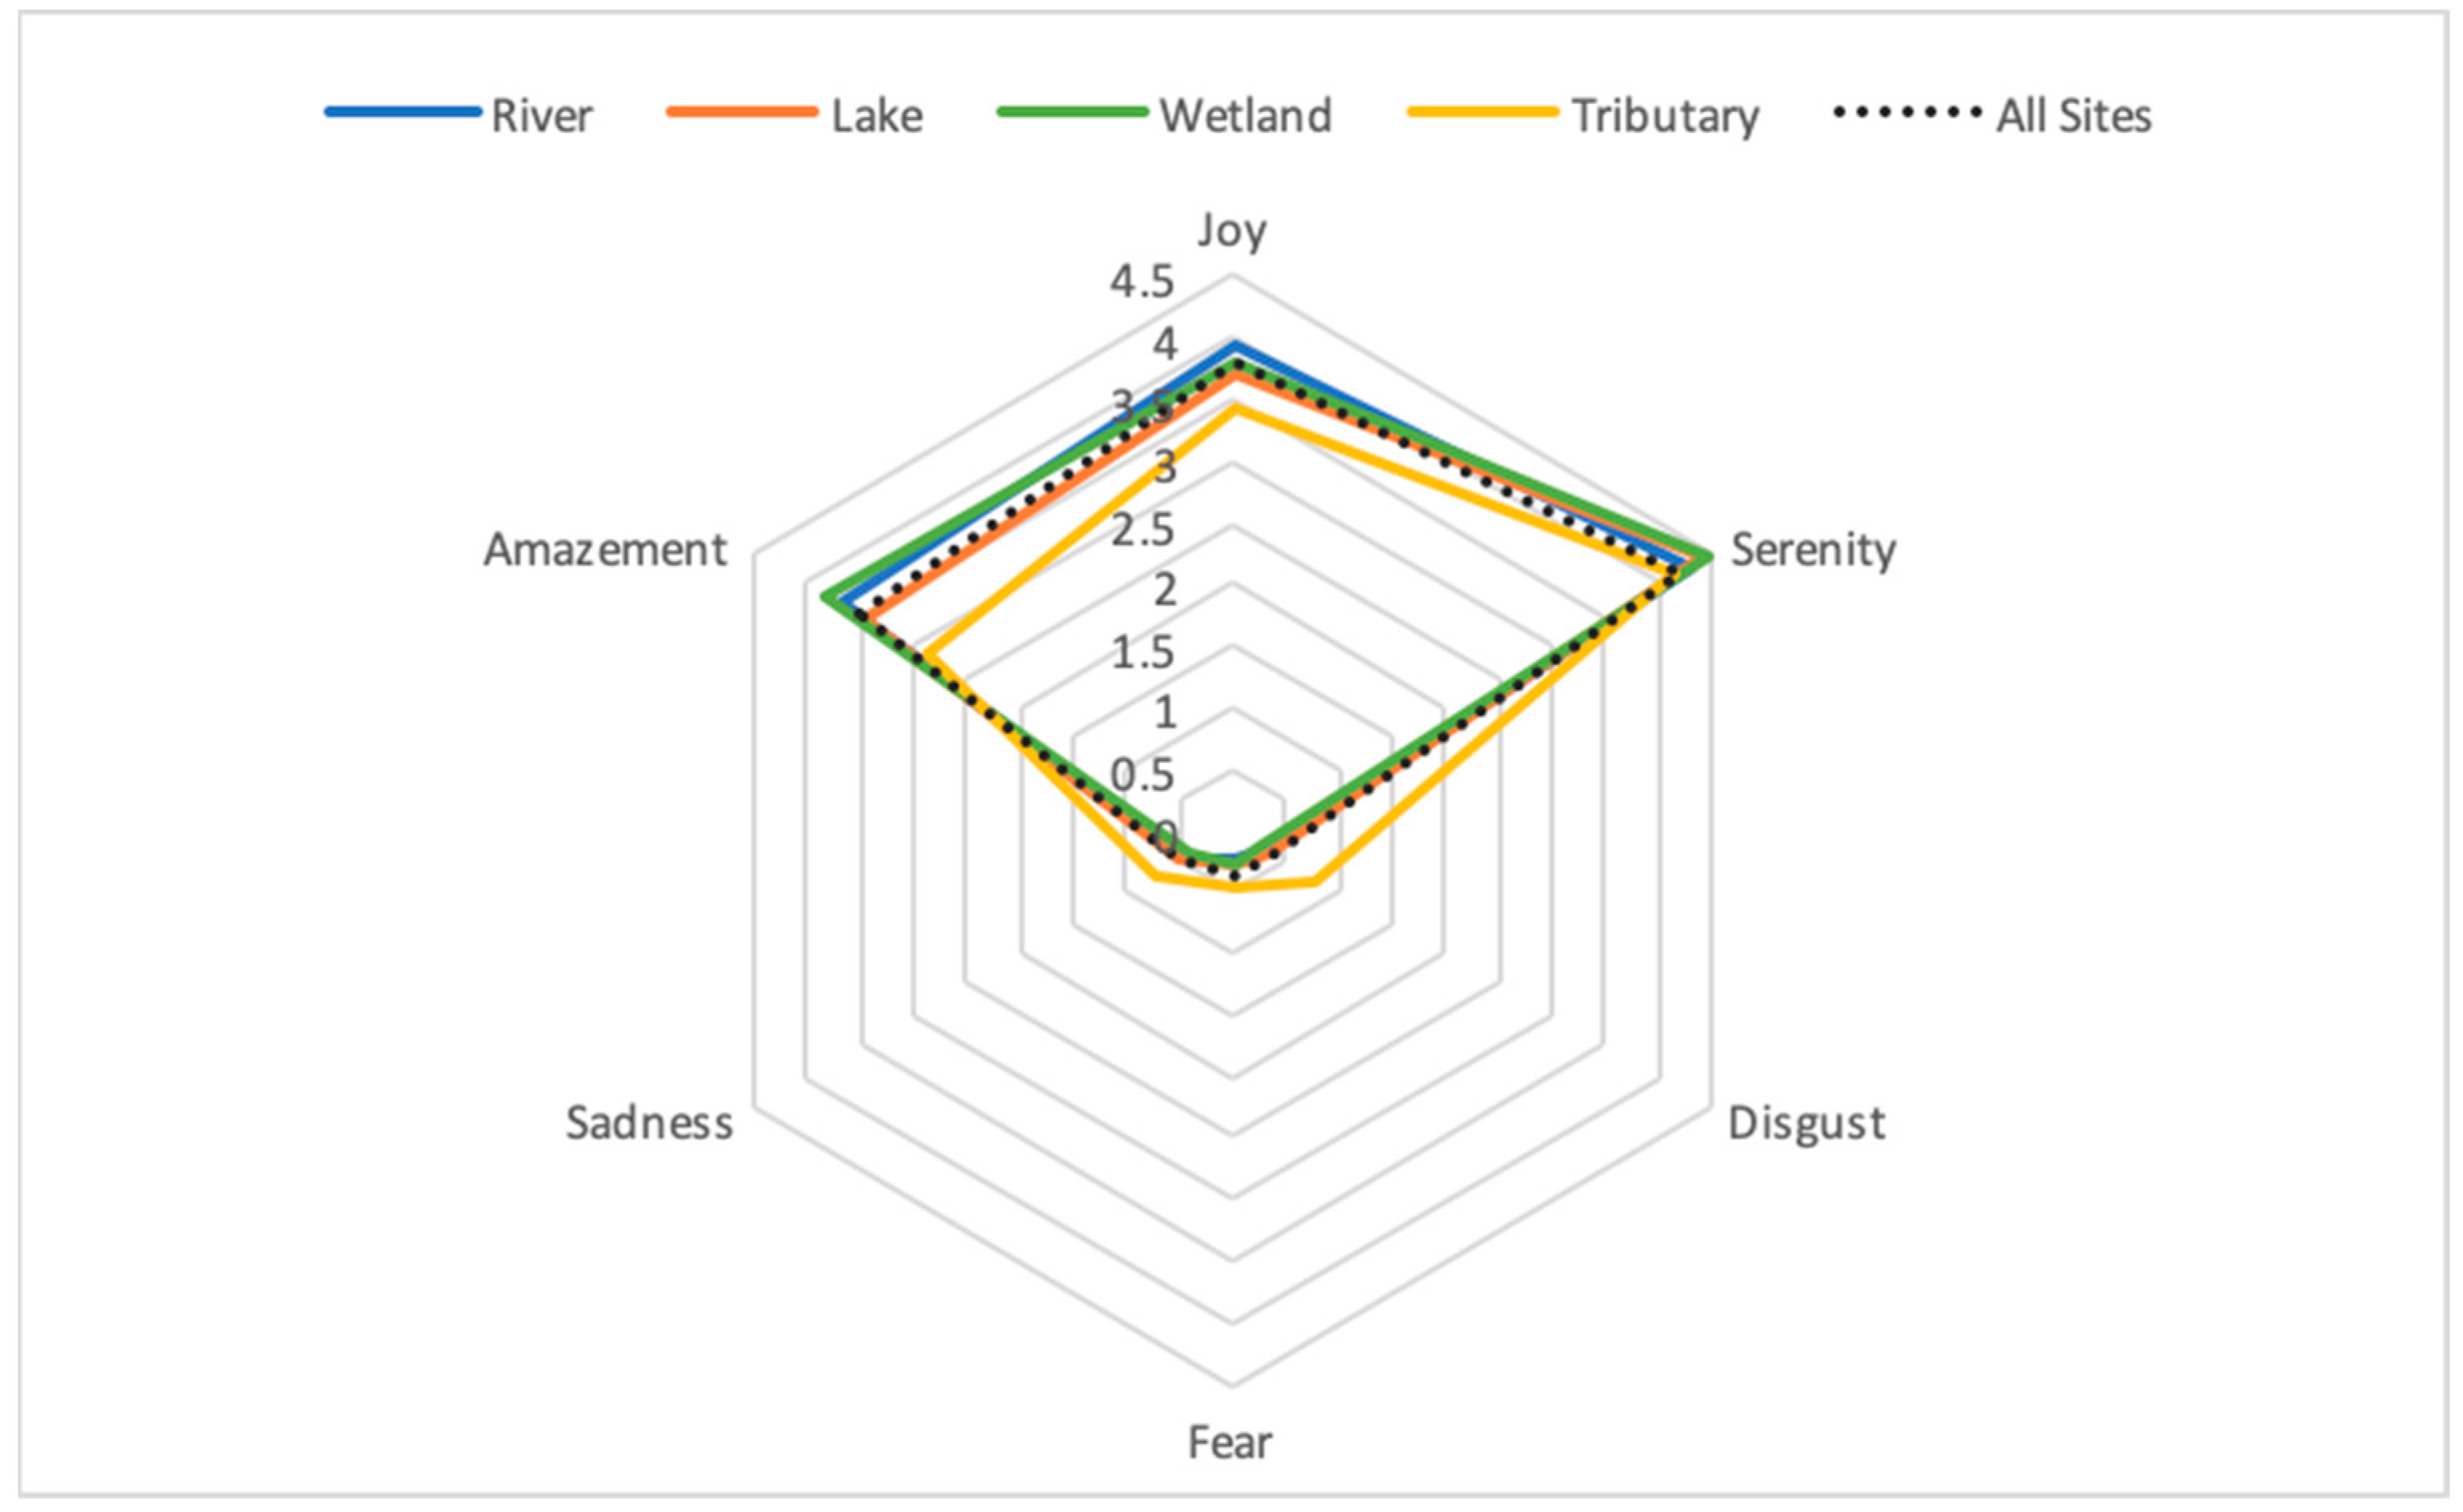
3.2. Differences among Waterscape Biophysical Settings
3.3. Comparative Analysis of Sites along the Perennial Mainstem San Marcos River
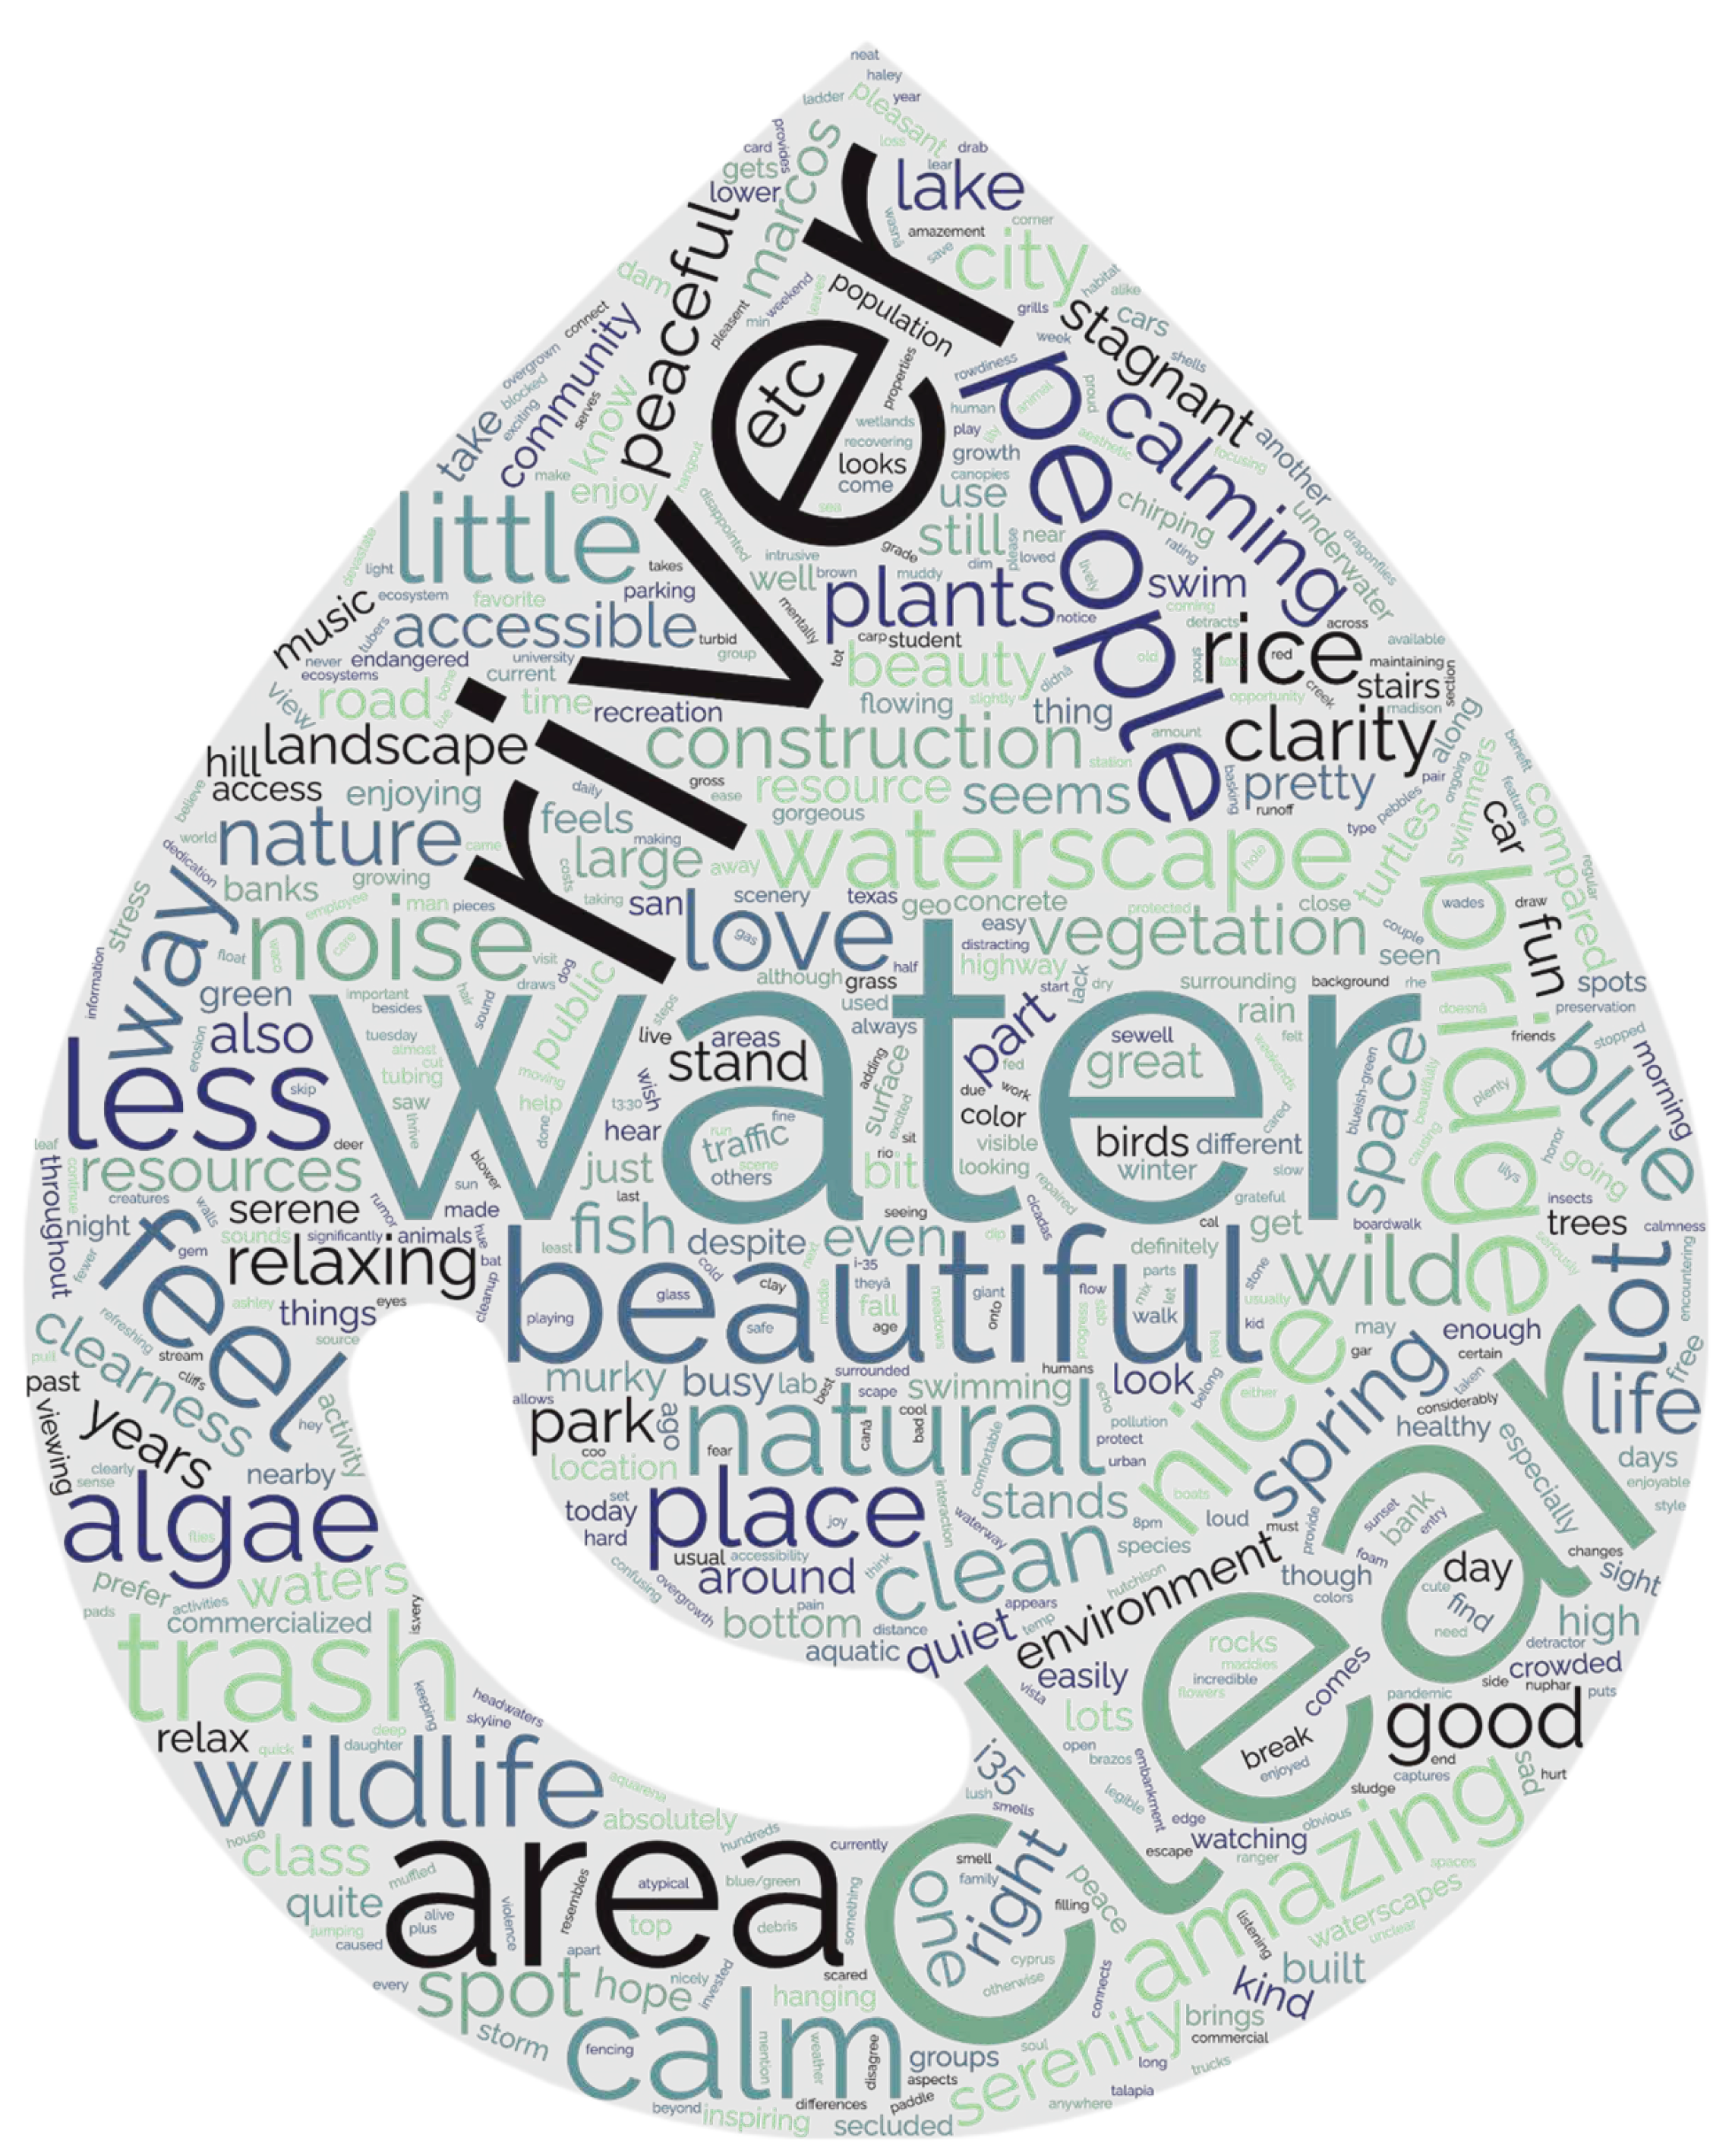
3.4. Qualitative Text Mining Analysis
4. Discussion
4.1. Nature–Human Relationships and SES Values in Blue Spaces
4.2. Quantifying Emotional Experiences as a Measure of Restorative Potential of Waterscapes
4.3. Using Relational Values to Examine Interactions and Perceptions of Waterscapes
4.4. Emerging Effects of COVID-19 on Nature–Human Interactions
4.5. Qualitative Analysis of Photos and Comments
4.6. Limitations to Study
5. Conclusions
Author Contributions
Funding
Data Availability Statement
Acknowledgments
Conflicts of Interest
Appendix A. Waterscape Site Descriptions [All Photos from Anonymous Respondents]
City Park (#2)

City Park on Bridge (#3)

Rio Vista Park (#4 and #5)


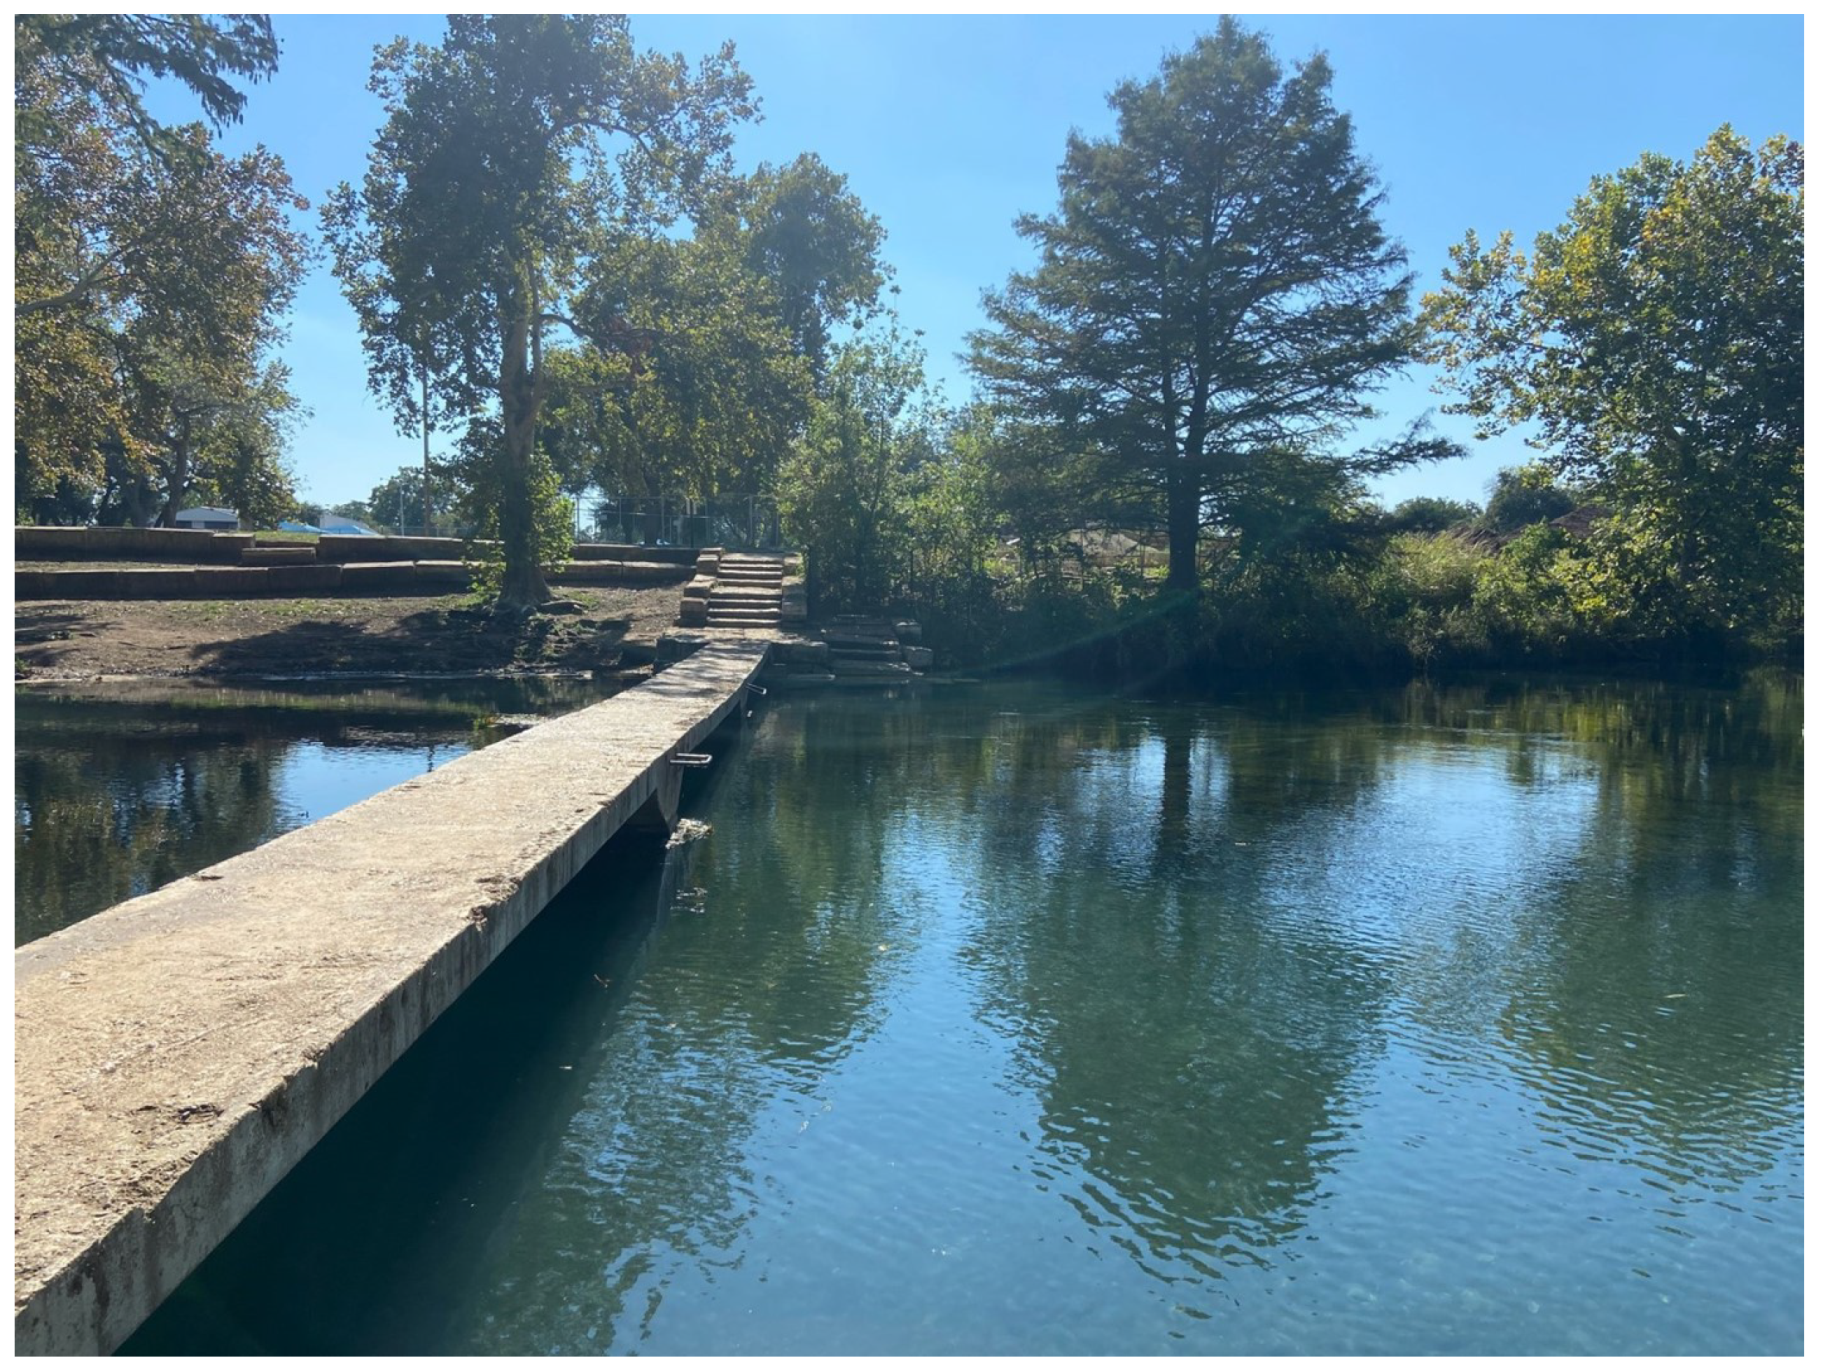
Sewell Park (#6)

Ramon Lucio Park (#7)

Wilderness Park (#8)

Spring Lake near Meadows Center (#9)

Meadows Center Wetland Boardwalk (#10)

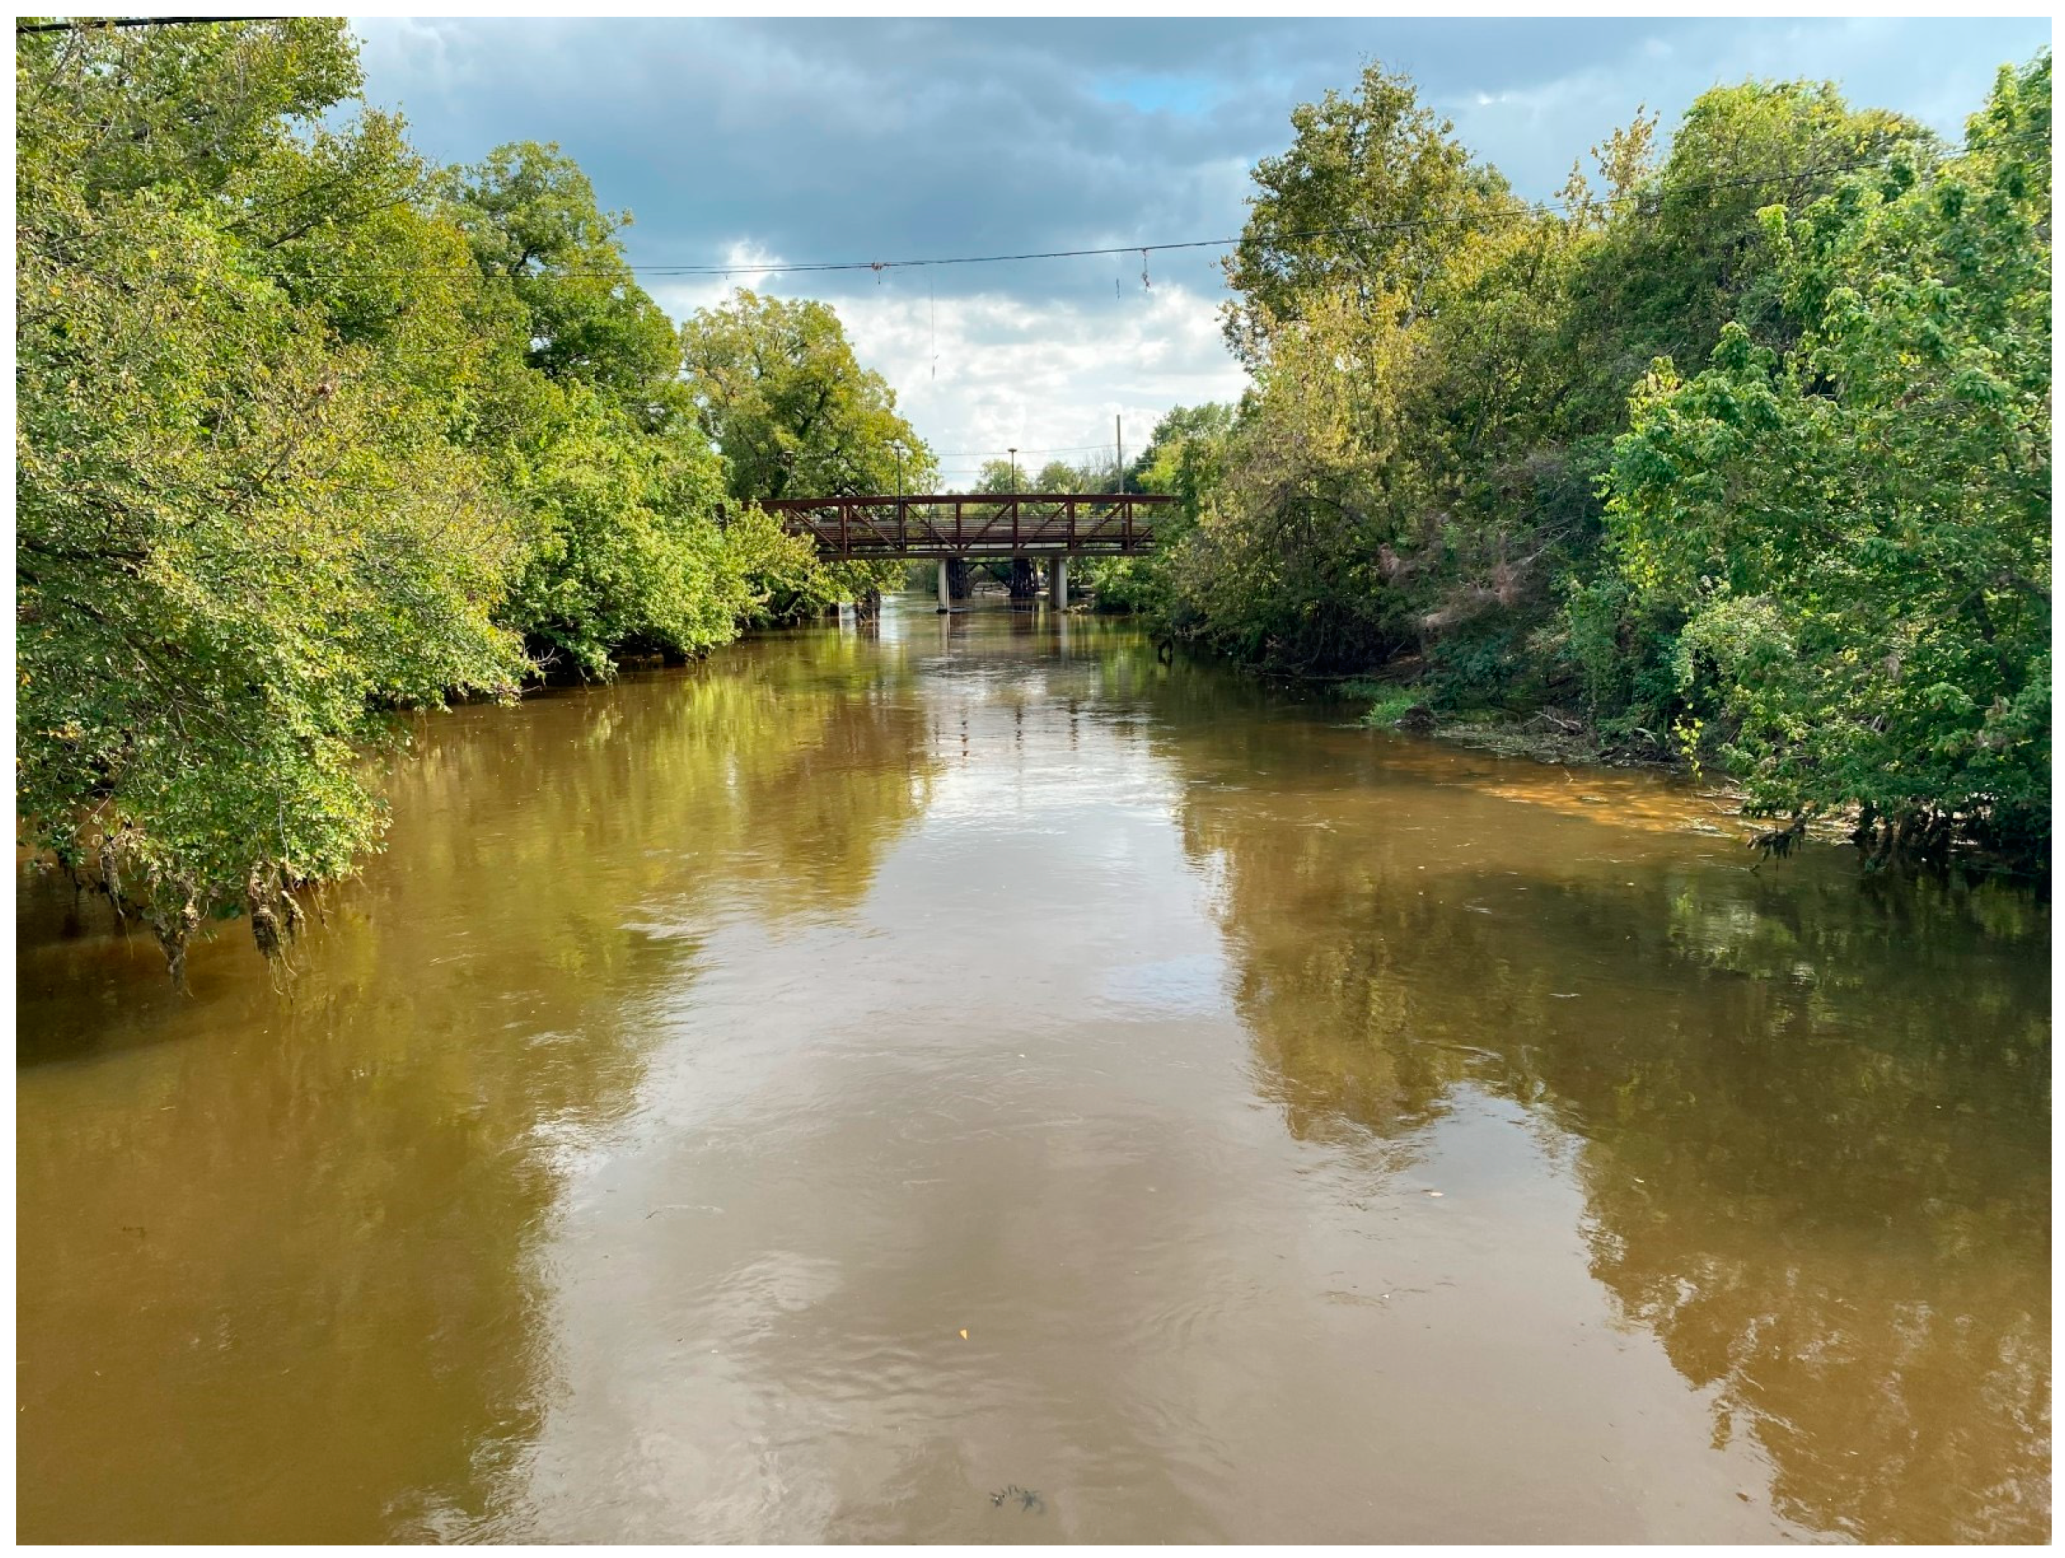
Purgatory Creek at Bicentennial Park (#11)

Appendix B. Blue Index Assessment
Appendix C. Participant Demographics and Waterscape Site Descriptions

| All Waterscapes | City Park (#2) | City Park Bridge (#3) | Rio Vista Island (#4) | Rio Vista Park (#5) | Sewell Park (#6) | Ramon Lucio Park (#7) | Wilderness Park (#8) | Spring Lake (#9) | Wetlands at Spring Lake (#10) | Purgatory Creek (#11) | |
|---|---|---|---|---|---|---|---|---|---|---|---|
| Age (all units % of total responses at each site) | |||||||||||
| 18 to 24 years | 51.3 | 70.0 | 55.6 | 72.7 | 81.0 | 62.4 | 41.2 | 65.4 | 44.6 | 39.0 | 38.2 |
| 25 to 34 years | 20.5 | 6.7 | 24.4 | 18.2 | 9.5 | 21.2 | 27.5 | 15.4 | 24.3 | 20.7 | 19.1 |
| 35 to 44 years | 13.4 | 13.3 | 2.2 | 9.1 | 9.5 | 7.1 | 11.8 | 7.7 | 17.6 | 24.4 | 16.2 |
| 45 to 54 years | 10.1 | 6.7 | 15.6 | 0 | 0 | 9.4 | 9.8 | 11.5 | 8.1 | 14.6 | 10.3 |
| 55 to 64 years | 3.2 | 3.3 | 2.2 | 0 | 0 | 0 | 7.8 | 0 | 2.7 | 1.2 | 10.3 |
| 65+ years | 1.4 | 0 | 0 | 0 | 0 | 0 | 2.0 | 0 | 2.7 | 0 | 5.9 |
| Education (all units % of total responses) | |||||||||||
| Less than high school | 0.2 | 0 | 0 | 0 | 0 | 0 | 2.0 | 0 | 0 | 0 | 0 |
| High-school graduate | 3.7 | 3.3 | 6.8 | 0 | 4.8 | 0 | 5.9 | 0 | 0 | 2.4 | 11.8 |
| Some college—Texas State student | 37.6 | 50.0 | 43.2 | 72.7 | 66.7 | 49.4 | 27.5 | 46.2 | 33.8 | 26.8 | 20.6 |
| Some college—other institution | 4.7 | 0 | 2.3 | 0 | 4.8 | 2.4 | 3.9 | 3.8 | 10.8 | 4.9 | 5.9 |
| Some college—not currently enrolled | 4.5 | 0 | 6.8 | 0 | 4.8 | 1.2 | 3.9 | 11.5 | 5.4 | 4.9 | 5.9 |
| 2 year degree | 3.5 | 0 | 4.5 | 0 | 4.8 | 2.4 | 3.9 | 3.8 | 2.7 | 6.1 | 2.9 |
| 4 year degree | 23.6 | 10.0 | 15.9 | 18.2 | 14.3 | 20 | 27.5 | 23.1 | 21.6 | 35.4 | 27.9 |
| Master’s/professional degree | 17.9 | 33.3 | 15.9 | 9.1 | 0 | 0 | 19.6 | 11.5 | 17.6 | 17.1 | 19.1 |
| Doctorate | 4.5 | 3.3 | 4.5 | 0 | 0 | 0 | 5.9 | 0 | 8.1 | 2.4 | 5.9 |
| Gender of Participants (all units % of total responses) | |||||||||||
| Female | 64 | 66.7 | 68.9 | 63.6 | 71.4 | 60.2 | 60.8 | 61.5 | 59.4 | 71.2 | 59.7 |
| Male | 33.1 | 30 | 26.7 | 36.4 | 28.6 | 32.5 | 35.3 | 38.5 | 37.8 | 26.2 | 38.8 |
| Nonbinary | 2.9 | 3.3 | 2.2 | 0 | 0 | 7.23 | 7.2 | 0 | 2.7 | 2.5 | 1.5 |
| Residency Status (all units % of total responses) | |||||||||||
| Self-described resident | 63.2 | 70 | 62.2 | 81.8 | 81 | 71.8 | 60.8 | 65.3 | 54.1 | 56.6 | 60.3 |
| Self-described nonresident | 36.8 | 30 | 37.8 | 18.2 | 19 | 28.2 | 39.2 | 34.6 | 49.9 | 43.4 | 39.7 |
| 78666 permanent zip code | 42.7 | 55.6 | 42.9 | 30 | 38.1 | 47 | 46.7 | 42.3 | 32.4 | 39.5 | 47.6 |
| Other permanent zip code | 57.3 | 44.4 | 57.1 | 70 | 61.9 | 53 | 53.3 | 57.7 | 67.6 | 60.5 | 52.4 |
| Frequency of Visit (all units % of total responses) | |||||||||||
| Daily | 6.4 | 8.3 | 3.2 | 0 | 0 | 3.9 | 18.8 | 0 | 5.3 | 6.5 | 9.8 |
| Weekly | 28.8 | 37.5 | 29 | 0 | 17.6 | 38.2 | 25 | 53.3 | 10.5 | 15.2 | 41.5 |
| Monthly | 24.5 | 33.3 | 38.1 | 57.1 | 29.4 | 27.6 | 21.9 | 26.7 | 10.5 | 13.0 | 22.0 |
| A few times a year or less | 40.4 | 20.8 | 29 | 42.9 | 52.9 | 30.3 | 34.4 | 20 | 73.7 | 65.2 | 26.8 |
Appendix D. Additional Comments
| Comment | Site |
|---|---|
| After coming back from Houston for winter break, this is the perfect spot to relax and unwind. | City Park (#2) |
| All the different plants and trees along the water. | City Park (#2) |
| Calm. | City Park (#2) |
| Clear, some wild rice. Considerably less due to recreation. | City Park (#2) |
| Fun, exciting, a place to hang out with friends. | City Park (#2) |
| Great station location! Nice water entry points here. | City Park (#2) |
| I came to the river to destress after my run. The river calms me down and allows me to take a deep breath and obtain the much needed break from school, work, and negative things going on in my life. I love how nature can have an extreme impact on our mood. | City Park (#2) |
| I love how accessible it is. It’s a nice place to be connected to nature and other people. | City Park (#2) |
| I love how blocked off this area is from the road. You can still hear road noise, but I feel like I’m tucked away in a little escape. And even the built environment around this section of the river looks really nice. | City Park (#2) |
| I swim here at down at least 3 days a week. I am disabled and use the metal stairs. During sights and sounds, the city removes my access and forces me to use the more dangerous and difficult stone stairs on the other bank. In the water, I am part nature. | |
| It represents gratitude for the gem that it is for its beauty, community connector, and healing source for humans for over 14,000 years, not to mention all its wildlife with the same properties. Thank you for all is done for conservation & preservation of this amazing natural resource! Grateful SMTX Resident | City Park (#2) |
| People kayaking. | City Park (#2) |
| The lush green scenery really stands out to me, plus the calm look of the river. | City Park (#2) |
| The river is beautiful and a space I come to relax at. The swimmers are a bit loud, making it slightly unpleasant. The water is very clean. | City Park (#2) |
| the traffic here in all aspects is significantly less than the last location. | City Park (#2) |
| The water in this area is more calm and very clear. | City Park (#2) |
| The wild rice stand population and trees on the bank stand out the most to me about this waterscape. | City Park (#2) |
| This part of the river has plenty of space and is much quieter and relaxing. | City Park (#2) |
| This waterscape is more quiet in comparison to Sewell Park. There is much less noise here. | City Park (#2) |
| Water clarity. | City Park (#2) |
| What stands out to me most about this waterscape is the broadness of it. Just upstream at the previous waterscape, the river seems more narrow and windy. This waterscape resembles a pool to me. | City Park (#2) |
| Beautiful to see families and groups of friends from many backgrounds enjoying the river. Accessibility is important for all. Keeping Texas rivers clean is so important. | City Park on Bridge (#3) |
| Calm, quiet, a bit of trash. | City Park on Bridge (#3) |
| Clear water, safe space for people and animals. | City Park on Bridge (#3) |
| Endangered wild rice growing. | City Park on Bridge (#3) |
| I like that the riparian environment is being repaired and replanted, it’s nice to see new plants and wildflowers growing in the area. | City Park on Bridge (#3) |
| I loved watching the sea grass wave like hair in the water. | City Park on Bridge (#3) |
| I’ve never seen it this murky I’m scared to float in it, I assume it’s because of the recent rain. | City Park on Bridge (#3) |
| It’s a beautiful place to see the beauty of nature and human architecture together with the bridge you can see. It may not be as swimmable with the reeds in the water, but it’s a beautiful place to see the natural habitats of the river and animal life like the turtles. | City Park on Bridge (#3) |
| Large source of water is easily visible. | City Park on Bridge (#3) |
| My family and I enjoyed the visit to the beautiful landscape. | City Park on Bridge (#3) |
| Nowhere to get in. | City Park on Bridge (#3) |
| Peaceful reprieve in the city. | City Park on Bridge (#3) |
| Seems to be more natural than other spots on this river. | City Park on Bridge (#3) |
| Someone built this place thoughtfully so that others may heal. Too bad the shadows of hatred, violence, loneliness, and pain echo throughout the surrounding region. | City Park on Bridge (#3) |
| The clarity of the water is peaceful to look at. I think there would be more fear if the water was murky. I did not feel fear. | City Park on Bridge (#3) |
| The clarity of water and lack of pollution from an intrusive gas pipeline or other intrusive things. | City Park on Bridge (#3) |
| The clear waters are very pretty, I can even see fish in the water. And I kind of really like the style of bridge that you can see in the distance. It’s kind of industrial which is really pretty paired with the natural environment. | City Park on Bridge (#3) |
| The Texas wild rice is always captivating, relaxing, and mesmerizing to me. My favorite time to come here is in the fall or winter when there are less people in the water which causes the water and sediment to be less disturbed. | City Park on Bridge (#3) |
| The vegetation is very visible and appears to be healthy. | City Park on Bridge (#3) |
| This is my favorite view of the river, the long strands of wild rice flowing with the river is so calming to watch. | City Park on Bridge (#3) |
| Trees. | City Park on Bridge (#3) |
| We find the waters of the SM river to have a certain magic to them—the history, the color, the constant temp—it’s spiritual. | City Park on Bridge (#3) |
| What stand out most to me about this watershed is the plants in the water. | City Park on Bridge (#3) |
| You can’t access the water from this specific part of the bridge. | City Park Bridge (#3) |
| I feel the water color has been impacted by ongoing construction and winter time. | Upper Rio Vista Island (#4) |
| A lot of human activity right by the river, dam presence, manmade and natural canal construction. | Rio Vista Park (#5) |
| Good. | Rio Vista Park (#5) |
| I felt a bit of sadness because I used to come to this park during a rough time in my life, but it is still beautiful. | Rio Vista Park (#5) |
| I saw a large duck swimming in the water. | Rio Vista Park (#5) |
| The Cyprus tread and the blue/green flowing water create a unique and beautiful landscape that elicits feelings of both fun and peace. | Rio Vista Park (#5) |
| the little ecosystems around the area stand out the most. although hundreds of people swim in this river they’re still thriving. | Rio Vista Park (#5) |
| The river shoot that is toward the end of the stream. | Rio Vista Park (#5) |
| This part of the river is definitely more populated and noisy. | Rio Vista Park (#5) |
| This point of the river is currently being used for various recreation activities—tubing, paddle boarding, swimming, and hanging out. It is surprisingly quiet, despite about 20 people at the park. There is quite a bit of construction going on, along with fencing around the river, which concerns me. I know this park gets incredibly busy on weekends with good weather and there is a restaurant across the river that draws in even more. It is also the final stretch of a commercial tubing operation. | Rio Vista Park (#5) |
| As a San Marcos River Ranger, it’s an honor to serve. | Sewell Park (#6) |
| At beautiful as the water is, the construction, leaf blower/grade mowing, and car traffic sound caused the loss of the serenity completely. | Sewell Park (#6) |
| Beautiful wild rice and clear blue water. | Sewell Park (#6) |
| Besides the water, there are a lot of distractions, but focusing on the water is almost hypnotizing. | Sewell Park (#6) |
| Brown water from flood! | Sewell Park (#6) |
| Calm, less crowded than usual. | Sewell Park (#6) |
| Clarity, cleanliness, mystical. | Sewell Park (#6) |
| Clean, quiet, a way to connect with nature in the middle of a busy community. | Sewell Park (#6) |
| Clear beautiful water. | Sewell Park (#6) |
| Clear spring-fed water. | Sewell Park (#6) |
| I absolutely love this space, but I do believe there is a problem of trash that needs to be addressed. Tubers, swimmers, etc. visit and leave their trash and it sinks to the bottom. I’ve collected many pieces of glass that for those without shoes could seriously hurt them. There should also be more easily accessible stairs, either by adding a lower edge or ladder below the stairs. Even if the water is high, it takes a lot of effort to pull yourself up and out onto the stairs. | Sewell Park (#6) |
| I always feel rejuvenated after a swim in the San Marcos River. | Sewell Park (#6) |
| I like how half of it is for nature and the other half is available for humans to use for recreational purposes. It’s a nice blend compared to other natural areas. | Sewell Park (#6) |
| I love how the forced quarantine resulted in the river recovering so nicely. It’s fun that people play in it but I also like the changes. | Sewell Park (#6) |
| It remains a very natural environment despite many people using it. It is a very alive river compared to many other commercialized areas. It’s nice that there is part of the river for people to swim and also an area where water plants can thrive. | Sewell Park (#6) |
| Its openness. | Sewell Park (#6) |
| Lack of calmness or serenity comes from being on campus (rowdiness, stress, etc.). | Sewell Park (#6) |
| Love the water. | Sewell Park (#6) |
| Moderate activity and swimming happening at around 8 p.m. Clean surroundings. | Sewell Park (#6) |
| River rice. | Sewell Park (#6) |
| Recreation, wild rice, clear water. | Sewell Park (#6) |
| Road noise is overwhelming and mashed it tough to enjoy. Beautiful water though, even at night. | Sewell Park (#6) |
| Storm runoff. Atypical. | Sewell Park (#6) |
| The amazement of the waters’ clarity stands out. It is mentally refreshing to see the pebbles at the bottom of the river and see the wild rice dancing in the water. | Sewell Park (#6) |
| The clarity of the water. I’m from the Waco area and the Brazos is very pretty but always muddy. There are obvious differences between this portion of the San Marcos River and the Brazos, but it’s really nice to see water that’s so clean and clear. The other thing that I can’t help but notice is all the concrete. It makes everything accessible which is really nice but it’s a little drab looking. | Sewell Park (#6) |
| The clear spring water makes Sewell Park a magical place to relax. The wild rice flowing in the current brings me peace and is a beautiful sight to behold. | Sewell Park (#6) |
| The clear water and recovering population of wild rice since before the pandemic. | Sewell Park (#6) |
| The clearness and the wild rice. | Sewell Park (#6) |
| The concrete banks stand out to me the most. | Sewell Park (#6) |
| The dedication to the naturalization of the area and preservation of endangered species is amazing and inspiring. | Sewell Park (#6) |
| The growth of vegetation in the river is definitely striking. | Sewell Park (#6) |
| The large amount of vegetation in the water. The clarity of the water is also extremely nice. It’s a place where it feels clean to swim. | Sewell Park (#6) |
| The moving water. | Sewell Park (#6) |
| The park is busy but paying attention to the river puts me at ease. | Sewell Park (#6) |
| The road nearby created a lot of noise and distraction. | Sewell Park (#6) |
| The things that stand out most to me in this waterscape in front of me is the clearness of the water. Most water sources that I have surrounded myself with (usually throughout Texas) are murky and not as opaque as this river. It makes me feel very serene and calm as I look at the slow running that runs through it. | Sewell Park (#6) |
| The vast improvement in the native vegetation over the past decade. | Sewell Park (#6) |
| The waterscape captures the aquatic vegetation and urban landscape at the same time. | Sewell Park (#6) |
| The wild grass growth! | Sewell Park (#6) |
| There is vegetation growing in the river that looks healthy. The water is very clear and is obviously in a protected area. | Sewell Park (#6) |
| Today is concerning; it’s very high, turbid, brown color, has a foam, and has a smell that’s acidic. | Sewell Park (#6) |
| Water necessary for diverse/strong ecosystem with wild rice, different fish species, turtles, dragonflies. | Sewell Park (#6) |
| We love being so close to endangered species—I would love more information about them and what the scientists are doing to help! Parking was confusing, but the river environment is so incredible. | Sewell Park (#6) |
| Wild rice is looking healthy. Another algae cleanup would do it well. Tetras above bridge inspire research ideas and the hope of encountering a nice pair of sunglasses or a Macrobrachium is enough to justify a swim on any day. | Sewell Park (#6) |
| Despite a highway being right across the view, you don’t really hear or notice. It’s so calm and you feel a certain sense of clarity. | Ramon Lucio Park (#7) |
| A little oasis despite being so close to a busy highway. | Ramon Lucio Park (#7) |
| Beauty clear water. | Ramon Lucio Park (#7) |
| Clarity of the water. | Ramon Lucio Park (#7) |
| Great use of our tax dollars! Ty! But could you turn off the noise from I-35? :-) | Ramon Lucio Park (#7) |
| Green algae from fertilizer must be stopped. City ordinance to prohibit its use is the only way. Trash in the bends of river is gross. Must fine offenders through camera evidence. | Ramon Lucio Park (#7) |
| Having waterscapes like this in my community makes me more invested in maintaining their health and conserving their ecosystems. | Ramon Lucio Park (#7) |
| How clear the water is and how it flows. | Ramon Lucio Park (#7) |
| How relaxing the place is compared to other parts of the water. | Ramon Lucio Park (#7) |
| I love how natural with the overgrowth of the banks this part of the river is but the sounds of I-35 make it less enjoyable. | Ramon Lucio Park (#7) |
| I saw a deer and a few ducks. It was cute. | Ramon Lucio Park (#7) |
| It was amazing and calming. | Ramon Lucio Park (#7) |
| It’s a beautiful place. Although there’s other people here, it’s not too crowded, and they’re playing good tunes, so that helps. | Ramon Lucio Park (#7) |
| It’s fall and at 11 a.m. The water is very clear you can see down to the bottom. | Ramon Lucio Park (#7) |
| Live here just walking my dog after a few days of rain nice area to walk considering all other trails are muddy. No swimming today but it’s usually clean. | Ramon Lucio Park (#7) |
| Lots of people uprooting the aquatic plants while swimming. | Ramon Lucio Park (#7) |
| Right off the bat there were peers of my age soaking up the sun and basking in the water. It stood out how clean the water was enough to enjoy. | Ramon Lucio Park (#7) |
| So blue. | Ramon Lucio Park (#7) |
| The blueish-green hue draws the eyes and envelopes me in a sense of serenity and closeness to nature as the soft-touch breeze invites me to observe the ripples on the surface and beckons me to sit on the bridge and stare undisturbed by the more material world around me. I feel not in a bustling city but in the vastness of the natural world. | Ramon Lucio Park (#7) |
| The bridge and the steps. Very calming. | Ramon Lucio Park (#7) |
| The bridge overlooking the water! | Ramon Lucio Park (#7) |
| The clarity of the water, and the number of people enjoying themselves with upbeat but not harsh music playing. | Ramon Lucio Park (#7) |
| The clear water. | Ramon Lucio Park (#7) |
| The cold river. | Ramon Lucio Park (#7) |
| The serenity and nature of this scene is very calming and a pleasant sight. It’s easy to forget I-35 is so close and how busy the city is. | Ramon Lucio Park (#7) |
| The smell here is a little pungent. This is a busier area of the river and with more people comes more smells. | Ramon Lucio Park (#7) |
| The water after the rain. | Ramon Lucio Park (#7) |
| The water and scenery are amazing, but the amount of trash I consistently see is disheartening. So sad to see such a natural beauty disrespected. | Ramon Lucio Park (#7) |
| The water appears to be murky and unclear today and I’m wondering if it is from the construction at Rio Vista. :-( | Ramon Lucio Park (#7) |
| The water clarity is amazing. | Ramon Lucio Park (#7) |
| There is a highway in the background. | Ramon Lucio Park (#7) |
| There was a group of about 15 people hanging out and enjoying the river. Given that it’s a Tuesday afternoon, I imagine that it’s a regular thing. I prefer to hear the water, birds, etc., so no music, but at least their music wasn’t terrible. There’s a large concrete slab beneath the bridge and I don’t really know what its purpose is, but it serves as an area for this group to hangout, although it detracts from the natural beauty of the river. There is also nearby construction noise. | Ramon Lucio Park (#7) |
| Water is more turbid than usual, but I am filling this out on a Sunday evening. | Ramon Lucio Park (#7) |
| Water is murky from rain, but the scene is peaceful and serene with birds chirping in the background. The only detractor is the noise from I-35 (nothing we can do about that). | Ramon Lucio Park (#7) |
| Water is very blue and clear. Bridge was very nice and vegetation as well. Really just a great little spot to chill at; nice and shady and relaxing. | Ramon Lucio Park (#7) |
| Besides the road noise, the calmness and silence in this area are very relaxing. | Wilderness Park (#8) |
| Clean and green. | Wilderness Park (#8) |
| Enjoying a beautiful morning at the clear, wonderful river. | Wilderness Park (#8) |
| It’s so clean and has beautiful colors and is so relaxing I love it. | Wilderness Park (#8) |
| San Marcos river is paradise. | Wilderness Park (#8) |
| Secluded and nice. | Wilderness Park (#8) |
| The clear water that seems to be clear of debris and waste. | Wilderness Park (#8) |
| The clearness of the water in the winter and the ease of access are a few of the things that draw me to this location. | Wilderness Park (#8) |
| The erosion on the embankment causing 5–7 trees to fall into the water over the last 4 years right here. | Wilderness Park (#8) |
| The water color is gorgeous. The light catches the water really beautifully. It feels like a little unknown pocket even though It’s a public park. The shade is really nice and it’s to see the underwater plants and rocks. Makes me want to jump in. | Wilderness Park (#8) |
| The water is clean and moving and easily accessible for a quick dip. | Wilderness Park (#8) |
| There are lots of small pieces of trash which makes me sad. I wish people cared more to take care of this beautiful waterway which brings so much joy and recreation opportunity to students and those alike. | Wilderness Park (#8) |
| This part of the river feels more quiet and secluded, which is nice. Sometimes it’s hard to find a good spot on the river that’s not too busy. | Wilderness Park (#8) |
| This waterscape is much more serene than the one before (#7). While there’s still a bit of noise from construction and traffic, it’s muffled off in the distance. You can hear the wind rustling the leaves and birds chirping. It was slightly less accessible than #7, but still very accessible in my book with less than 5 min walk from the car. There are people enjoying this waterscape as well, but in smaller, quieter groups of 1–2. | Wilderness Park (#8) |
| Traffic noise is only thing bringing lower rating. | Wilderness Park (#8) |
| Water current. | Wilderness Park (#8) |
| Water was very blue, much more than I expected. Also, park was a bit hard to get to because of construction near Sewell. * * This participant was likely referring to construction at Rio Vista Park. | Wilderness Park (#8) |
| Clear water and reflection of the sun. A lot of vegetation and creatures. | Spring Lake near Meadows Discovery Center (#9) |
| Amazement at the spring-fed lake and its incredible beauty and all the fascinating creatures that live in the lake. | Spring Lake near Meadows Discovery Center (#9) |
| Beautiful origin of the start of the river. | Spring Lake near Meadows Discovery Center (#9) |
| Calming way to start the day. Meditative. | Spring Lake near Meadows Discovery Center (#9) |
| Clear water. | Spring Lake near Meadows Discovery Center (#9) |
| Horizon scenery. | Spring Lake near Meadows Discovery Center (#9) |
| How clean the water is you can see fish at the bottom on the banks. | Spring Lake near Meadows Discovery Center (#9) |
| How clear the water is, very nice to see all that is in the water. | Spring Lake near Meadows Discovery Center (#9) |
| I love how you can see the algae/vegetation. It’s clear enough to also see the fish and turtles in the water. I love the type of sand they use for this waterscape! I wish it didn’t have a fence around it but I understand it’s for the environment! I was curious though because I saw an employee throw something inside the water. | Spring Lake near Meadows Discovery Center (#9) |
| It feels very relaxing and idyllic. “Natural” seems like a problematic adjective, I feel like it’s a beautiful place either way but there are clearly anthropogenic influences, like there are in any landscape in one way or another, I especially liked seeing the Nuphar plants. | Spring Lake near Meadows Discovery Center (#9) |
| It’s an amazing natural water space with lots of opportunity to see wildlife, but it is not easily accessible because of university parking. | Spring Lake near Meadows Discovery Center (#9) |
| Listening to all the birds and insects around the headwaters and the occasional jumping fish. This place is good for my soul. | Spring Lake near Meadows Discovery Center (#9) |
| Quite different from the surrounding water areas. It’s standing and gross. | Spring Lake near Meadows Discovery Center (#9) |
| Serenity. | Spring Lake near Meadows Discovery Center (#9) |
| Spring Lake is absolutely gorgeous. I am so grateful this resource is available to the public. | Spring Lake near Meadows Discovery Center (#9) |
| The beautiful skyline and serene calm water. | Spring Lake near Meadows Discovery Center (#9) |
| The calm water stands out the most to me. And the boats! | Spring Lake near Meadows Discovery Center (#9) |
| The clear spring waters, the protected wetlands, the plants and animals. | Spring Lake near Meadows Discovery Center (#9) |
| The clear water. | Spring Lake near Meadows Discovery Center (#9) |
| The clear water and greenery below. | Spring Lake near Meadows Discovery Center (#9) |
| The clearness of the river and the high possibility of seeing wildlife. | Spring Lake near Meadows Discovery Center (#9) |
| The glass bottom boats stand out most to me. | Spring Lake near Meadows Discovery Center (#9) |
| The lake. | Spring Lake near Meadows Discovery Center (#9) |
| The super clear blue water. | Spring Lake near Meadows Discovery Center (#9) |
| The water is blue and calm. | Spring Lake near Meadows Discovery Center (#9) |
| The water is very clear. | Spring Lake near Meadows Discovery Center (#9) |
| This seems to be a very clean and well-balanced ecosystem. | Spring Lake near Meadows Discovery Center (#9) |
| Water is still, feel closer to nature, beautiful nature scape, welcoming, easy to access. | Spring Lake near Meadows Discovery Center (#9) |
| What stands out is how blue the water is in the parts that aren’t covered in seaweed sludge on the surface. | Spring Lake near Meadows Discovery Center (#9) |
| Amazing, verdant, peaceful, free. | Meadows Center Wetland Boardwalk (#10) |
| Beautiful natural area with great wildlife viewing, but not easily accessible because of university parking. | Meadows Center Wetland Boardwalk (#10) |
| Beauty of nature. I hope we can save it for future generations. | Meadows Center Wetland Boardwalk (#10) |
| Birds and fish and flowers. | Meadows Center Wetland Boardwalk (#10) |
| Cal, relaxing, educational, inspiring, stress reducing. Distracting due to road noise. | Meadows Center Wetland Boardwalk (#10) |
| Great habitat for birds. Road noise. Loved the walkways. | Meadows Center Wetland Boardwalk (#10) |
| Healthy fish, turtles, fauna, and clear water. So thankful for it all! | Meadows Center Wetland Boardwalk (#10) |
| How can I get involved? | Meadows Center Wetland Boardwalk (#10) |
| How naturally and peaceful this place is even though we are surrounded by man made things, like cars, streets, etc. | Meadows Center Wetland Boardwalk (#10) |
| I have not seen a waterscape before, very cool. :) | Meadows Center Wetland Boardwalk (#10) |
| I live in urban San Antonio, and most of our waterways have been converted to commercialized or aesthetic spaces, taking away from the natural beauty of these areas. The Meadows Center Boardwalk was a great example of how to make a waterscape accessible to tourists while maintaining the natural landscape of it. | Meadows Center Wetland Boardwalk (#10) |
| I love how comfortable the wildlife is in this environment. | Meadows Center Wetland Boardwalk (#10) |
| I love the river and I hope we can continue to protect it. It would devastate me if all this current construction and influx of people destroyed our river. It’s a sacred land and we need to protect and provide for it at all costs!! | Meadows Center Wetland Boardwalk (#10) |
| I love the spices in reserve and the way it’s taking cake of the turtles and plants. | Meadows Center Wetland Boardwalk (#10) |
| It’s so beautiful. | Meadows Center Wetland Boardwalk (#10) |
| Just beautiful. | Meadows Center Wetland Boardwalk (#10) |
| Lily pads and algae. | Meadows Center Wetland Boardwalk (#10) |
| Loud with cars and trucks. Cicadas are loud too but they belong here. | Meadows Center Wetland Boardwalk (#10) |
| Natural, ecologically mindful. | Meadows Center Wetland Boardwalk (#10) |
| Noise is a downfall of location, but the wetlands are calming and relaxing. | Meadows Center Wetland Boardwalk (#10) |
| Not polluted. | Meadows Center Wetland Boardwalk (#10) |
| The accessibility of the boardwalk stands out most to me. | Meadows Center Wetland Boardwalk (#10) |
| The beauty of it and easy viewing of wildlife. | Meadows Center Wetland Boardwalk (#10) |
| The clear water and absence of trash is remarkable. We could see the different fish nesting and a multitude of turtles. The children were excited to spot so many large gar, and the cichlids had amazing colors that I have not seen anywhere else. | Meadows Center Wetland Boardwalk (#10) |
| The clear water definitely has a lot of life from underwater life to plants. | Meadows Center Wetland Boardwalk (#10) |
| The only thing that detracts is the noise from I-35. | Meadows Center Wetland Boardwalk (#10) |
| The water lilies have taken over Aquarena Springs! | Meadows Center Wetland Boardwalk (#10) |
| The wetland like landscape. | Meadows Center Wetland Boardwalk (#10) |
| This is one of my favorite spots. There are not a lot of people which I really enjoy. The only thing that takes away from it is the highway. (I wish it wasn’t built). | Meadows Center Wetland Boardwalk (#10) |
| Unfortunately, there is a lot of noise pollution in this area. | Meadows Center Wetland Boardwalk (#10) |
| Very relaxing but the car sounds from nearby roads/highway diminish effect on this side of the spring lake. | Meadows Center Wetland Boardwalk (#10) |
| Water is so clear!! Some plants and algae obscure water but that’s natural for the animals. It’s really clear and pretty and calm. | Meadows Center Wetland Boardwalk (#10) |
| What stands out most is how clear the waterscape is. Despite the depth, the algae and grass allow for a very serene waterscape. | Meadows Center Wetland Boardwalk (#10) |
| White people used slaves to build a dam here and impede the free flow state of the river, fuck you. | Meadows Center Wetland Boardwalk (#10) |
| Wildlife. | Meadows Center Wetland Boardwalk (#10) |
| Wildlife is evident but traffic noise is distracting. | Meadows Center Wetland Boardwalk (#10) |
| Algae. | Purgatory Creek at Bicentennial Park (#11) |
| Aquatic plant life. | Purgatory Creek at Bicentennial Park (#11) |
| I like the hill scape beyond the river. The area between the road and the river is a bit overgrown and could benefit from some tending to allow for better interaction with the landscape. | Purgatory Creek at Bicentennial Park (#11) |
| I love jogging through here with my boyfriend, as well as tubing up stream. | Purgatory Creek at Bicentennial Park (#11) |
| I really like watching the water runoff from the rain mix in with the clear(er) water. | Purgatory Creek at Bicentennial Park (#11) |
| It’s cool. | Purgatory Creek at Bicentennial Park (#11) |
| It is just a beautiful place. | Purgatory Creek at Bicentennial Park (#11) |
| It is still because it seems to be an offshoot and not have much flow. | Purgatory Creek at Bicentennial Park (#11) |
| It’s a little stagnant and murky. | Purgatory Creek at Bicentennial Park (#11) |
| It’s beautiful in that a public access bridge is above it and it connects to the river, which is visible from here, and it’s flowing and beautiful. | Purgatory Creek at Bicentennial Park (#11) |
| Looking great but a bunch of green algae is forming at the banks on the surface. | Purgatory Creek at Bicentennial Park (#11) |
| Lots of large carp and tilapia today. | Purgatory Creek at Bicentennial Park (#11) |
| Nice day. | Purgatory Creek at Bicentennial Park (#11) |
| Other than non-native plants, this is a very lively and natural spot. Others may disagree, as it has more aquatic growth than many people prefer. | Purgatory Creek at Bicentennial Park (#11) |
| Sessom Creek * looks cleaner than usual. Less algae, making it more appealing * This participant typed Sessom Creek, but was visiting Purgatory Creek. | Purgatory Creek at Bicentennial Park (#11) |
| Some trash. | Purgatory Creek at Bicentennial Park (#11) |
| The fish eating off the top of the water was the best. | Purgatory Creek at Bicentennial Park (#11) |
| The red flowers near it. | Purgatory Creek at Bicentennial Park (#11) |
| There are many beautiful shades of green and signs if wildlife. The water is clear enough to see the bottom, rocks, fish, flora, and other detritus. There are dragon flies and other insects that are very pleasant. I do see some trash and that is why I am a little disgusted. | Purgatory Creek at Bicentennial Park (#11) |
| This area doesn’t feel very safe, and the water is stagnant. The bridge is pretty, but the surrounding features have large piping, and it looks somewhat like a work in progress with the pipes and large cut stones. It’s quite dim at night. | Purgatory Creek at Bicentennial Park (#11) |
| This area seems more stagnant than others. but it is gorgeous and feels very set apart from the city. | Purgatory Creek at Bicentennial Park (#11) |
| Trash in the water and it seemed still. Otherwise very nice part of our park walk. | Purgatory Creek at Bicentennial Park (#11) |
| Very quiet and nice. I’ve seen deer at this location before and stand and look out once and a while. | Purgatory Creek at Bicentennial Park (#11) |
| Very quiet and peaceful, but the water seems stagnant and there is a scum on the surface. | Purgatory Creek at Bicentennial Park (#11) |
References
- Dudgeon, D.; Arthington, A.H.; Gessner, M.O.; Kawabata, Z.-I.; Knowler, D.J.; Lévêque, C.; Naiman, R.J.; Prieur-Richard, A.-H.; Soto, D.; Stiassny, M.L.J.; et al. Freshwater Biodiversity: Importance, Threats, Status and Conservation Challenges. Biol. Rev. 2006, 81, 163. [Google Scholar] [CrossRef] [PubMed]
- Reid, A.J.; Carlson, A.K.; Creed, I.F.; Eliason, E.J.; Gell, P.A.; Johnson, P.T.J.; Kidd, K.A.; MacCormack, T.J.; Olden, J.D.; Ormerod, S.J.; et al. Emerging Threats and Persistent Conservation Challenges for Freshwater Biodiversity. Biol. Rev. 2018, 94, 849–873. [Google Scholar] [CrossRef] [Green Version]
- Grooten, M.; Almond, R.E.A. Living Planet Report 2018: Aiming Higher; WWF (Organization), Ed.; WWF–World Wide Fund for Nature: Gland, Switzerland, 2018. [Google Scholar]
- Brauman, K.A.; Daily, G.C.; Duarte, T.K.; Mooney, H.A. The Nature and Value of Ecosystem Services: An Overview Highlighting Hydrologic Services. Annu. Rev. Environ. Resour. 2007, 32, 67–98. [Google Scholar] [CrossRef]
- Martin-Ortega, J. Water Ecosystem Services: A Global Perspective; International hydrology series; Cambridge University Press: New York, NY, USA, 2015. [Google Scholar]
- Nichols, W.J. Blue Mind—The Surprising Science that Shows How Being Near, in, on, or under Water Can Make You Happier, Healthier, More Connected, and Better at What You Do; Little, Brown and Company: Boston, Massachusettes, USA, 2014. [Google Scholar] [CrossRef]
- Lopez, C.W.; Wade, M.T.; Julian, J.P. Nature–Human Relational Models in a Riverine Social–Ecological System: San Marcos River, TX, USA. Geographies 2023, 3, 197–245. [Google Scholar] [CrossRef]
- Julian, J.; Daly, G.; Weaver, R. University Students’ Social Demand of a Blue Space and the Influence of Life Experiences. Sustainability 2018, 10, 3178. [Google Scholar] [CrossRef] [Green Version]
- Foley, R.; Kistemann, T. Blue Space Geographies: Enabling Health in Place. Health Place 2015, 35, 157–165. [Google Scholar] [CrossRef] [PubMed] [Green Version]
- Lookingbill, T.; Meitzen, K.; Julian, J.P. Riverscapes. In The Routledge Handbook of Landscape Ecology; Routledge: Abdington, UK, 2021; pp. 411–429. [Google Scholar] [CrossRef]
- Zhang, X.; Zhang, Y.; Zhai, J.; Wu, Y.; Mao, A. Waterscapes for Promoting Mental Health in the General Population. Int. J. Environ. Res. Public Health 2021, 18, 11792. [Google Scholar] [CrossRef] [PubMed]
- Grellier, J.; White, M.P.; Albin, M.; Bell, S.; Elliott, L.R.; Gascón, M.; Gualdi, S.; Mancini, L.; Nieuwenhuijsen, M.J.; Sarigiannis, D.A.; et al. BlueHealth: A Study Programme Protocol for Mapping and Quantifying the Potential Benefits to Public Health and Well-Being from Europe’s Blue Spaces. BMJ Open 2017, 7, e016188. [Google Scholar] [CrossRef] [Green Version]
- Arias-Arévalo, P.; Martín-López, B.; Gómez-Baggethun, E. Exploring Intrinsic, Instrumental, and Relational Values for Sustainable Management of Social-Ecological Systems. Ecol. Soc. 2017, 22, 43. [Google Scholar] [CrossRef] [Green Version]
- Muradian, R.; Pascual, U. A Typology of Elementary Forms of Human-Nature Relations: A Contribution to the Valuation Debate. Curr. Opin. Environ. Sustain. 2018, 35, 8–14. [Google Scholar] [CrossRef]
- Smith, N.; Georgiou, M.; King, A.C.; Tieges, Z.; Webb, S.; Chastin, S. Urban Blue Spaces and Human Health: A Systematic Review and Meta-Analysis of Quantitative Studies. Cities 2021, 119, 103413. [Google Scholar] [CrossRef]
- Church, A.; Fish, R.; Ravenscroft, N.; Stapleton, L. Cultural Ecosystem Services, Water, and Aquatic Environments. In Water Ecosystem Services; Cambridge University Press: New York, NY, USA, 2015; pp. 148–155. [Google Scholar] [CrossRef]
- Völker, S.; Kistemann, T. Developing the Urban Blue: Comparative Health Responses to Blue and Green Urban Open Spaces in Germany. Health Place 2015, 35, 196–205. [Google Scholar] [CrossRef] [PubMed]
- Sander, H.A.; Zhao, C. Urban Green and Blue: Who Values What and Where? Land Use Policy 2015, 42, 194–209. [Google Scholar] [CrossRef]
- McGinnis, M.D.; Ostrom, E. Social-Ecological System Framework: Initial Changes and Continuing Challenges. Ecol. Soc. 2014, 19, 30. [Google Scholar] [CrossRef] [Green Version]
- Biggs, R.; Preiser, R.; de Vos, A.; Schlüter, M.; Maciejewski, K.; Clements, H. The Routledge Handbook of Research Methods for Social-Ecological Systems; Routledge: Abingdon, UK, 2021. [Google Scholar] [CrossRef]
- Martín-López, B.; Iniesta-Arandia, I.; García-Llorente, M.; Palomo, I.; Casado-Arzuaga, I.; Amo, D.G.D.; Gómez-Baggethun, E.; Oteros-Rozas, E.; Palacios-Agundez, I.; Willaarts, B.; et al. Uncovering Ecosystem Service Bundles through Social Preferences. PLoS ONE 2012, 7, e38970. [Google Scholar] [CrossRef] [Green Version]
- Enquist, C.A.; Jackson, S.T.; Garfin, G.M.; Davis, F.W.; Gerber, L.R.; Littell, J.A.; Tank, J.L.; Terando, A.J.; Wall, T.U.; Halpern, B.; et al. Foundations of Translational Ecology. Front. Ecol. Environ. 2017, 15, 541–550. [Google Scholar] [CrossRef] [Green Version]
- Westley, F.R.; Tjornbo, O.; Schultz, L.; Olsson, P.; Folke, C.; Crona, B.; Bodin, Ö. A Theory of Transformative Agency in Linked Social-Ecological Systems. E&S 2013, 18, art27. [Google Scholar] [CrossRef]
- Gascon, M.; Sánchez-Benavides, G.; Dadvand, P.; Martínez, D.; Gramunt, N.; Gotsens, X.; Cirach, M.; Vert, C.; Molinuevo, J.L.; Crous-Bou, M.; et al. Long-Term Exposure to Residential Green and Blue Spaces and Anxiety and Depression in Adults: A Cross-Sectional Study. Environ. Res. 2018, 162, 231–239. [Google Scholar] [CrossRef]
- Dzhambov, A.M. Residential Green and Blue Space Associated with Better Mental Health: A Pilot Follow-Up Study in University Students. Arch. Ind. Hyg. Toxicol. 2018, 69, 340–349. [Google Scholar] [CrossRef] [Green Version]
- Korpela, K.; Borodulin, K.; Neuvonen, M.; Paronen, O.; Tyrväinen, L. Analyzing the Mediators between Nature-Based Outdoor Recreation and Emotional Well-Being. J. Environ. Psychol. 2014, 37, 1–7. [Google Scholar] [CrossRef]
- World Health Organization (WHO). Urban Green Spaces and Health; WHO Regional Office for Europe: Copenhagen, Denmark, 2016. [Google Scholar]
- Roe, J.J.; Aspinall, P.A. Adolescents’ Daily Activities and the Restorative Niches That Support Them. Int. J. Environ. Res. Public Health 2012, 9, 3227–3244. [Google Scholar] [CrossRef] [PubMed] [Green Version]
- White, M.; Smith, A.; Humphryes, K.; Pahl, S.; Snelling, D.; Depledge, M. Blue Space: The Importance of Water for Preference, Affect, and Restorativeness Ratings of Natural and Built Scenes. J. Environ. Psychol. 2010, 30, 482–493. [Google Scholar] [CrossRef]
- Garrett, J.K.; White, M.P.; Huang, J.; Ng, S.; Hui, Z.; Leung, C.; Tse, L.A.; Fung, F.; Elliott, L.R.; Depledge, M.H.; et al. Urban Blue Space and Health and Wellbeing in Hong Kong: Results from a Survey of Older Adults. Health Place 2019, 55, 100–110. [Google Scholar] [CrossRef] [PubMed]
- Foley, R. Performing Health in Place: The Holy Well as a Therapeutic Assemblage. Health Place 2011, 17, 470–479. [Google Scholar] [CrossRef] [Green Version]
- Völker, S.; Kistemann, T. “I’m Always Entirely Happy When I’m Here!” Urban Blue Enhancing Human Health and Well-Being in Cologne and Düsseldorf, Germany. Soc. Sci. Med. 2013, 91, 141–152. [Google Scholar] [CrossRef]
- Britton, E.; Kindermann, G.; Domegan, C.; Carlin, C. Blue Care: A Systematic Review of Blue Space Interventions for Health and Wellbeing. Health Promot. Int. 2020, 35, 50–69. [Google Scholar] [CrossRef] [Green Version]
- Caddick, N.; Smith, B.; Phoenix, C. The Effects of Surfing and the Natural Environment on the Well-Being of Combat Veterans. Qual. Health Res. 2014, 25, 76–86. [Google Scholar] [CrossRef] [Green Version]
- Kjellgren, A.; Edebol, H.; Nordén, T.; Norlander, T. Quality of Life with Flotation Therapy for a Person Diagnosed with Attention Deficit Disorder, Atypical Autism, PTSD, Anxiety and Depression. Open J. Med. Psychol. 2013, 02, 134–138. [Google Scholar] [CrossRef] [Green Version]
- Marshall, J.; Kelly, P.; Niven, A. “When I Go There, I Feel Like I Can Be Myself.” Exploring Programme Theory within the Wave Project Surf Therapy Intervention. J. Environ. Res. Public Health 2019, 16, 2159. [Google Scholar] [CrossRef] [Green Version]
- Hernández-Morcillo, M.; Plieninger, T.; Bieling, C. An Empirical Review of Cultural Ecosystem Service Indicators. Ecol. Indic. 2013, 29, 434–444. [Google Scholar] [CrossRef]
- Klain, S.C.; Olmsted, P.; Chan, K.M.A.; Satterfield, T. Relational Values Resonate Broadly and Differently than Intrinsic or Instrumental Values, or the New Ecological Paradigm. PLoS ONE 2017, 12, e0183962. [Google Scholar] [CrossRef] [PubMed] [Green Version]
- Twedt, E.; Rainey, R.M.; Proffitt, D.R. Beyond Nature: The Roles of Visual Appeal and Individual Differences in Perceived Restorative Potential. J. Environ. Psychol. 2019, 65, 101322. [Google Scholar] [CrossRef]
- Brils, J.; Appleton, A.; van Everdingen, N.; Bright, D. Key Factors for Successful Application of Ecosystem Services-Based Approaches to Water Resources Management: The Role of Stakeholder Participation. Water Ecosyst. Serv. 2015, 138–147. [Google Scholar] [CrossRef]
- Carpenter, S.R.; Mooney, H.A.; Agard, J.; Capistrano, D.; Defries, R.S.; Díaz, S.; Dietz, T.; Duraiappah, A.K.; Oteng-Yeboah, A.; Pereira, H.M.; et al. Science for Managing Ecosystem Services: Beyond the Millennium Ecosystem Assessment. Proc. Natl. Acad. Sci. USA 2009, 106, 1305–1312. [Google Scholar] [CrossRef] [Green Version]
- Himes, A.; Muraca, B. Relational Values: The Key to Pluralistic Valuation of Ecosystem Services. Curr. Opin. Environ. Sustain. 2018, 35, 1–7. [Google Scholar] [CrossRef]
- Kareiva, P.; Lalasz, R.; Marvier, M. Conservation in the Anthropocene: Beyond solitude and fragility. Breakthrough J. 2011, 2, 29–37. [Google Scholar]
- Kahneman, D. Thinking, Fast and Slow; Macmillan: New York, NY, USA, 2011. [Google Scholar]
- Chan, K.M.A.; Goldstein, J.; Satterfield, T.; Hannahs, N.; Kikiloi, K.; Naidoo, R.; Vadeboncoeur, N.; Woodside, U. Cultural Services and Non-Use Values. Nat. Cap. 2011, 206–228. [Google Scholar] [CrossRef]
- Chan, K.M.A.; Balvanera, P.; Benessaiah, K.; Chapman, M.; Díaz, S.; Gómez-Baggethun, E.; Gould, R.; Hannahs, N.; Jax, K.; Klain, S.; et al. Opinion: Why Protect Nature? Rethinking Values and the Environment. Proc. Natl. Acad. Sci. USA 2016, 113, 1462–1465. [Google Scholar] [CrossRef] [Green Version]
- Piccolo, J.J. Intrinsic Values in Nature: Objective Good or Simply Half of an Unhelpful Dichotomy? J. Nat. Conserv. 2017, 37, 8–11. [Google Scholar] [CrossRef]
- Perrotti, D.; Hyde, K.; Otero Peña, D. Can Water Systems Foster Commoning Practices? Analysing Leverages for Self-Organization in Urban Water Commons as Social–Ecological Systems. Sustain. Sci. 2020, 15, 781–795. [Google Scholar] [CrossRef]
- Fox, N.; Marshall, J.; Dankel, D.J. Ocean Literacy and Surfing: Understanding How Interactions in Coastal Ecosystems Inform Blue Space User’s Awareness of the Ocean. Int. J. Environ. Res. Public Health 2021, 18, 5819. [Google Scholar] [CrossRef] [PubMed]
- Misiune, I.; Julian, J.P.; Veteikis, D. Pull and Push Factors for Use of Urban Green Spaces and Priorities for Their Ecosystem Services: Case Study of Vilnius, Lithuania. Urban For. Urban Green. 2021, 58, 126899. [Google Scholar] [CrossRef]
- Ellis, E.C.; Pascual, U.; Mertz, O. Ecosystem Services and Nature’s Contribution to People: Negotiating Diverse Values and Trade-Offs in Land Systems. Curr. Opin. Environ. Sustain. 2019, 38, 86–94. [Google Scholar] [CrossRef]
- Sabatier, P.A.; Focht, W.; Lubell, M.; Trachtenberg, Z.; Vedlitz, A.; Matlock, M. Swimming Upstream: Collaborative Approaches to Watershed Management; The MIT Press: Cambridge, MA, USA, 2005. [Google Scholar] [CrossRef]
- Jeffery, K.; Davidson, S. Blue Index Austin: A New Approach to Urban Waterscape Design and Watershed Protection; unpublished report; Blue Index: Austin, TX, USA, 2020. [Google Scholar]
- Oteros-Rozas, E.; Martín-López, B.; Fagerholm, N.; Bieling, C.; Plieninger, T. Using Social Media Photos to Explore the Relation between Cultural Ecosystem Services and Landscape Features across Five European Sites. Ecol. Indic. 2018, 94, 74–86. [Google Scholar] [CrossRef]
- Zhu, X.; Gao, M.; Zhang, R.; Zhang, B. Quantifying Emotional Differences in Urban Green Spaces Extracted from Photos on Social Networking Sites: A Study of 34 Parks in Three Cities in Northern China. Urban For. Urban Green. 2021, 62, 127133. [Google Scholar] [CrossRef]
- Rice, W.L.; Mateer, T.J.; Reigner, N.; Newman, P.; Lawhon, B.; Taff, B.D. Changes in Recreational Behaviors of Outdoor Enthusiasts during the COVID-19 Pandemic: Analysis across Urban and Rural Communities. J. Urban Ecol. 2020, 6, juaa020. [Google Scholar] [CrossRef]
- Venter, Z.S.; Barton, D.N.; Gundersen, V.; Figari, H.; Nowell, M. Urban Nature in a Time of Crisis: Recreational Use of Green Space Increases during the COVID-19 Outbreak in Oslo, Norway. Environ. Res. Lett. 2020, 15, 104075. [Google Scholar] [CrossRef]
- Samus, A.; Freeman, C.; Dickinson, K.J.M.; van Heezik, Y. Relationships between Nature Connectedness, Biodiversity of Private Gardens, and Mental Well-Being during the COVID-19 Lockdown. Urban For. Urban Green. 2022, 69, 127519. [Google Scholar] [CrossRef]
- Pouso, S.; Borja, Á.; Fleming, L.E.; Gómez-Baggethun, E.; White, M.P.; Uyarra, M.C. Contact with Blue-Green Spaces during the COVID-19 Pandemic Lockdown Beneficial for Mental Health. Sci. Total. Environ. 2021, 756, 143984. [Google Scholar] [CrossRef]
- Ugolini, F.; Massetti, L.; Calaza-Martínez, P.; Cariñanos, P.; Dobbs, C.; Ostoic, S.K.; Marin, A.M.; Pearlmutter, D.; Saaroni, H.; Šaulienė, I.; et al. Effects of the COVID-19 Pandemic on the Use and Perceptions of Urban Green Space: An International Exploratory Study. Urban For. Urban Green. 2020, 56, 126888. [Google Scholar] [CrossRef]
- US Census Bureau. Census 2010. US Census Bureau, 2010. Available online: http://quickfacts.census.gov/qfd/states/13/13135.html (accessed on 1 March 2021).
- US Census Bureau. County Population Totals 2010–2020. US Census Bureau, 2020. Available online: https://www.census.gov/programs-surveys/popest/technical-documentation/research/evaluation-estimates/2020-evaluation-estimates/2010s-counties-total.html (accessed on 5 October 2021).
- Osborn, C. Census: San Marcos Fastest-Growing US City—Again. Austin American Statesman, 2016. Available online: https://www.statesman.com/story/news/2016/09/23/census-san-marcos-fastest-growing-us-city-again/10040009007/ (accessed on 3 February 2023).
- The Meadows Center for Water and the Environment (MCWE). The Meadows Center: 2018–2019 Annual Report (Report No. 2019-14); Texas State University: San Marcos, TX, USA, 2019. [Google Scholar]
- Texas Hill Country Alliance (HCA). A Look at the Texas Hill Country. 2008. Available online: https://hillcountryalliance.org/our-work/texas-hill-country-conservation-network/state-of-the-hill-country/ (accessed on 20 April 2023).
- Kimmel, J. The San Marcos: A River’s Story; Texas A&M University Press: College Station, TX, USA, 2006. [Google Scholar]
- Plutchik, R. A General Psychoevolutionary Theory of Emotion. In Theories of Emotion; Academic Press: New York, NY, USA, 1980; pp. 3–33. [Google Scholar] [CrossRef]
- Keeler, B.L.; Wood, S.A.; Polasky, S.; Kling, C.; Filstrup, C.T.; Downing, J.A. Recreational Demand for Clean Water: Evidence from Geotagged Photographs by Visitors to Lakes. Front. Ecol. Environ. 2015, 13, 76–81. [Google Scholar] [CrossRef] [PubMed] [Green Version]
- Meredith, G.R.; Rakow, D.A.; Eldermire, E.R.B.; Madsen, C.G.; Shelley, S.P.; Sachs, N.A. Minimum Time Dose in Nature to Positively Impact the Mental Health of College-Aged Students, and How to Measure It: A Scoping Review. Front. Psychol. 2020, 10, 2942. [Google Scholar] [CrossRef] [PubMed] [Green Version]
- Jackson, S.B.; Stevenson, K.T.; Larson, L.R.; Peterson, M.N.; Seekamp, E. Outdoor Activity Participation Improves Adolescents’ Mental Health and Well-Being during the COVID-19 Pandemic. Int. J. Environ. Res. Public Health 2021, 18, 2506. [Google Scholar] [CrossRef] [PubMed]
- Lerner, J.S.; Li, Y.; Valdesolo, P.; Kassam, K.S. Emotion and Decision Making. Annu. Rev. Psychol. 2015, 66, 799–823. [Google Scholar] [CrossRef] [Green Version]
- Stålhammar, S.; Thorén, H. Three Perspectives on Relational Values of Nature. Sustain. Sci. 2019, 14, 1201–1212. [Google Scholar] [CrossRef] [Green Version]
- Cottet, M.; Robert, A.; Tronchère-Cottet, H.; Datry, T. “It’s Dry, It Has Fewer Charms!”: Do Perceptions and Values of Intermittent Rivers Interact with Their Management? Environ. Sci. Policy 2023, 139, 139–148. [Google Scholar] [CrossRef]
- Williams, R. Keywords: A Vocabulary of Culture and Society; Oxford University Press: Oxford, UK; New York, NY, USA, 2015. [Google Scholar]
- Pasanen, T.P.; White, M.P.; Wheeler, B.W.; Garrett, J.K.; Elliott, L.R. Neighbourhood Blue Space, Health and Wellbeing: The Mediating Role of Different Types of Physical Activity. Environ. Int. 2019, 131, 105016. [Google Scholar] [CrossRef]
- Hermanski, A.; McClelland, J.; Pearce-Walker, J.; Ruiz, J.; Verhougstraete, M. The Effects of Blue Spaces on Mental Health and Associated Biomarkers. Int. J. Ment. Health 2021, 51, 203–217. [Google Scholar] [CrossRef]
- Cullen, W.; Gulati, G.; Kelly, B.D. Mental Health in the COVID-19 Pandemic. QJM 2020, 113, 311–312. [Google Scholar] [CrossRef]
- Holmes, E.A.; O’Connor, R.C.; Perry, V.H.; Tracey, I.; Wessely, S.; Arseneault, L.; Ballard, C.; Christensen, H.; Cohen Silver, R.; Everall, I.; et al. Multidisciplinary Research Priorities for the COVID-19 Pandemic: A Call for Action for Mental Health Science. Lancet Psychiatry 2020, 7, 547–560. [Google Scholar] [CrossRef]
- Galea, S.; Merchant, R.M.; Lurie, N. The Mental Health Consequences of COVID-19 and Physical Distancing. JAMA Intern. Med. 2020, 180, 817. [Google Scholar] [CrossRef] [PubMed] [Green Version]
- Kronenberg, J.; Andersson, E.; Barton, D.N.; Borgström, S.T.; Langemeyer, J.; Björklund, T.; Haase, D.; Kennedy, C.; Koprowska, K.; Łaszkiewicz, E.; et al. The Thorny Path toward Greening: Unintended Consequences, Trade-Offs, and Constraints in Green and Blue Infrastructure Planning, Implementation, and Management. Ecol. Soc. 2021, 26, 36. [Google Scholar] [CrossRef]


| Joy | Serenity | Disgust | Fear | Sadness | Amazement | Relax | Access | Flow | Clean | Natural | Refuge | |
|---|---|---|---|---|---|---|---|---|---|---|---|---|
| Overall | 3.80 | 4.23 | 0.40 | 0.35 | 0.49 | 3.52 | 4.08 | 4.44 | 4.12 | 4.08 | 4.29 | 4.38 |
| Intrinsic (n = 227) | 3.80 | 4.34 | 0.36 | 0.33 | 0.52 | 3.58 | 4.15 | 4.47 | 3.91 | 3.87 | 4.39 | 4.40 |
| Relational (n = 233) | 3.90 | 4.28 | 0.37 | 0.34 | 0.47 | 3.49 | 4.15 | 4.49 | 4.37 | 4.28 | 4.40 | 4.48 |
| Utilitarian (n = 49) | 3.38 | 3.61 | 0.53 | 0.28 | 0.36 | 3.25 | 3.73 | 4.14 | 4.31 | 4.37 | 3.41 | 3.98 |
| Dependent Variable | p-Value of Kruskal–Wallis Test | p-Values of Pairwise Wilcoxon Test by SES Value | Summary of Significant Differences | ||
|---|---|---|---|---|---|
| Joy | 0.009 | I | R | Utilitarian lower than relational or intrinsic | |
| R | 0.35 | - | |||
| U | 0.05 | 0.01 | |||
| Serenity | 0.009 | I | R | Utilitarian lower than relational or intrinsic | |
| R | 0.59 | - | |||
| U | 0.003 | 0.006 | |||
| Disgust | 0.57 | I | R | Utilitarian higher than relational or intrinsic | |
| R | 0.35 | - | |||
| U | 0.05 | 0.01 | |||
| Fear | 0.81 | I | R | ||
| R | 0.67 | - | |||
| U | 0.74 | 0.56 | |||
| Sadness | 0.98 | I | R | ||
| R | 1 | - | |||
| U | 0.86 | 0.85 | |||
| Amazement | 0.45 | I | R | ||
| R | 0.43 | - | |||
| U | 0.25 | 0.46 | |||
| Relaxation | 0.04 | I | R | Utilitarian lower than relational or intrinsic | |
| R | 0.41 | - | |||
| U | 0.03 | 0.02 | |||
| Access | 0.12 | I | R | Utilitarian lower than relational | |
| R | 1 | - | |||
| U | 0.06 | 0.05 | |||
| Flow | <0.001 | I | R | Intrinsic lower than relational | |
| R | <0.001 | - | |||
| U | 0.06 | 0.62 | |||
| Clean | 0.002 | I | R | Intrinsic lower than relational or utilitarian | |
| R | <0.001 | - | |||
| U | 0.03 | 0.79 | |||
| Natural | <0.001 | I | R | Utilitarian lower than intrinsic or relational | |
| R | 0.7 | - | |||
| U | <0.001 | <0.001 | |||
| Refuge | 0.009 | I | R | Utilitarian lower than intrinsic or relational | |
| R | 0.17 | - | |||
| U | 0.03 | 0.002 | |||
| Dependent Variable | p-Value of Kruskal–Wallis Test | p-Values of Pairwise Wilcoxon Tests | Summary of Significant Differences by Waterscape | |||
|---|---|---|---|---|---|---|
| Joy | 0.01 | R | L | W | Joy was higher at wetland than tributary | |
| L | 0.16 | - | - | |||
| W | 0.78 | 0.22 | - | |||
| T | 0.73 | 0.27 | 0.04 | |||
| Serenity | <0.001 | R | L | W | Serenity was higher at the wetland than the tributary | |
| L | 0.36 | - | - | |||
| W | 0.27 | 0.82 | - | |||
| T | 0.46 | 0.10 | 0.07 | |||
| Sadness | 0.078 | R | L | W | Higher at tributary than lake or wetland | |
| L | 0.70 | - | - | |||
| W | 0.84 | 0.85 | - | |||
| T | 0.06 | 0.03 | 0.04 | |||
| Amazement | 0.009 | R | L | W | Lowest at tributary | |
| L | 0.91 | - | - | |||
| W | 0.39 | 0.33 | - | |||
| T | 0.01 | 0.01 | 0.001 | |||
| Disgust | <0.001 | R | L | W | Highest at tributary | |
| L | 0.35 | - | - | |||
| W | 0.95 | 0.38 | - | |||
| T | <0.001 | 0.001 | <0.001 | |||
| Fear | 0.283 | R | L | W | Higher at tributary than river | |
| L | 0.25 | - | - | |||
| W | 0.71 | 0.44 | - | |||
| T | 0.02 | 0.23 | 0.06 | |||
| Flow | <0.001 | R | L | W | River higher than all; lake higher than wetland and tributary; wetland higher than tributary; tributary lower than all | |
| L | <0.001 | - | - | |||
| W | <0.001 | 0.12 | - | |||
| T | <0.001 | <0.001 | <0.001 | |||
| Clean | <0.001 | R | L | W | River higher than all others; lake higher than wetland; wetland higher than tributary; tributary lower than all others | |
| L | 0.001 | - | - | |||
| W | <0.001 | 0.01 | - | |||
| T | <0.001 | <0.001 | <0.001 | |||
| Natural | <0.001 | R | L | W | Wetland and tributary higher than river and lake setting | |
| L | 0.73 | - | - | |||
| W | <0.001 | 0.003 | - | |||
| T | 0.002 | 0.01 | 0.91 | |||
| Refuge | <0.001 | R | L | W | Tributary lower than all other settings | |
| L | 0.80 | - | - | |||
| W | 0.92 | 0.78 | - | |||
| T | <0.001 | <0.001 | <0.001 | |||
| Access | 0.09 | R | L | W | Tributary lower than river | |
| L | 0.18 | - | - | |||
| W | 0.32 | 0.65 | - | |||
| T | 0.02 | 0.25 | 0.09 | |||
| Relative restoration (relaxation) | <0.001 | R | L | W | Tributary lower than all other settings | |
| L | 0.11 | - | - | |||
| W | 0.76 | 0.19 | - | |||
| T | <0.001 | 0.01 | <0.001 | |||
| Reason for Visiting | River (n = 91) | Lake (n = 98) | Wetland (n = 89) | Tributary (n = 82) | All Settings (n = 565) |
|---|---|---|---|---|---|
| Art/photography | 10 | 6 | 9 | 0 | 38 |
| Community event/music event/special occasion | 3 | 6 | 1 | 1 | 29 |
| Commuting | 5 | 1 | 1 | 2 | 10 |
| Dog walking | 19 | 3 | 5 | 9 | 45 |
| Exercising | 28 | 7 | 16 | 33 | 45 |
| Family outing/date/socializing | 4 | 30 | 37 | 23 | 182 |
| Fishing | 5 | 0 | 0 | 0 | 8 |
| Relaxing/stress relief/meditating | 40 | 20 | 30 | 33 | 199 |
| Solitude | 21 | 5 | 15 | 14 | 90 |
| Water sport/tubing | 20 | 2 | 2 | 2 | 54 |
| Wildlife viewing/exploring nature | 35 | 35 | 47 | 19 | 207 |
| Work/school | 43 | 37 | 24 | 10 | 188 |
| City Park (#2) | City Park Bridge (#3) | Rio Vista Island (#4) | Rio Vista Park near Rapids (#5) | Sewell Park (#6) | Ramon Lucio Park (#7) | Wilderness Park (#8) | |
|---|---|---|---|---|---|---|---|
| # of Responses | 32 | 48 | 12 | 26 | 91 | 59 | 27 |
| Mean emotional scores where 5 represents the highest rating | |||||||
| Joy | 4.03 | 3.65 | 3.00 | 3.62 | 3.96 | 4.05 | 3.81 |
| Serenity | 4.16 | 4.33 | 4.00 | 3.38 | 4.29 | 3.97 | 4.18 |
| Disgust | 0.33 | 0.58 | 0.09 | 0.24 | 0.32 | 0.36 | 0.32 |
| Fear | 0.20 | 0.64 | 0.30 | 0.27 | 0.22 | 0.46 | 0.29 |
| Sadness | 0.37 | 0.49 | 0.42 | 0.42 | 0.46 | 0.43 | 0.50 |
| Amazement | 3.5 | 3.53 | 3.17 | 3.35 | 3.68 | 3.36 | 3.85 |
| Mean score of perceptions of waterscape characteristics where 5 represents the highest rating | |||||||
| Relaxation | 4.55 | 4.00 | 4.25 | 3.46 | 4.24 | 3.91 | 4.41 |
| Access | 4.71 | 4.46 | 4.27 | 4.39 | 4.55 | 4.54 | 4.67 |
| Flow | 4.81 | 4.54 | 4.64 | 4.78 | 4.91 | 4.57 | 4.96 |
| Clean | 4.94 | 4.15 | 4.82 | 4.83 | 4.65 | 4.31 | 4.89 |
| Natural | 4.16 | 4.52 | 4.18 | 3.35 | 3.94 | 4.26 | 4.59 |
| Refuge | 4.68 | 4.35 | 4.73 | 4.26 | 4.50 | 4.30 | 4.63 |
| SES value frequency | |||||||
| Intrinsic | 9 | 19 | 2 | 3 | 24 | 19 | 7 |
| Relational | 19 | 24 | 8 | 5 | 51 | 31 | 17 |
| Utilitarian | 3 | 4 | 1 | 13 | 11 | 2 | 2 |
| City Park (#2) | City Park Bridge (#3) | Rio Vista Island (#4) | Rio Vista Park near Rapids (#5) | Sewell Park (#6) | Ramon Lucio Park (#7) | Wilderness Park (#8) | |
|---|---|---|---|---|---|---|---|
| Art/photography | 4 | 5 | 0 | 1 | 10 | 4 | 4 |
| Community event/music event/special occasion | 3 | 3 | 0 | 4 | 3 | 1 | 0 |
| Commuting | 1 | 1 | 0 | 0 | 5 | 1 | 0 |
| Dog walking | 2 | 5 | 0 | 2 | 19 | 9 | 5 |
| Exercising | 13 | 11 | 0 | 6 | 28 | 17 | 10 |
| Family outing/date/socializing | 14 | 17 | 1 | 3 | 4 | 21 | 8 |
| Fishing | 1 | 1 | 0 | 0 | 5 | 2 | 0 |
| Relaxing/stress relief/meditating | 16 | 16 | 1 | 5 | 40 | 24 | 14 |
| Solitude | 8 | 8 | 1 | 3 | 21 | 8 | 7 |
| Water sport/tubing | 8 | 8 | 4 | 20 | 1 | 6 | |
| Wildlife viewing/exploring nature | 12 | 15 | 1 | 5 | 35 | 25 | 15 |
| Work/school | 13 | 12 | 8 | 17 | 43 | 12 | 12 |
| Dependent Variable | Predictor Variables | Spearman’s Rho | p-Value |
|---|---|---|---|
| Joy | Access | 0.1 | 0.11 |
| Flow | 0.18 | 0.003 | |
| Clean | 0.28 | <0.001 | |
| Natural | 0.24 | <0.001 | |
| Refuge | 0.38 | <0.001 | |
| Serenity | Access | 0.05 | 0.43 |
| Flow | 0.2 | <0.001 | |
| Clean | 0.21 | <0.001 | |
| Natural | 0.22 | <0.001 | |
| Refuge | 0.42 | <0.001 | |
| Disgust | Access | −0.10 | 0.14 |
| Flow | −0.10 | 0.15 | |
| Clean | −0.22 | <0.001 | |
| Natural | −0.11 | 0.11 | |
| Refuge | −0.15 | 0.02 | |
| Fear | Access | −0.02 | 0.78 |
| Flow | −0.18 | 0.008 | |
| Clean | −0.17 | 0.009 | |
| Natural | −0.11 | 0.1 | |
| Refuge | −0.21 | 0.001 | |
| Sadness | Access | −0.03 | 0.6 |
| Flow | −0.06 | 0.39 | |
| Clean | −0.17 | 0.008 | |
| Natural | −0.16 | 0.01 | |
| Refuge | −0.18 | 0.005 | |
| Amazement | Access | 0.1 | 0.1 |
| Flow | 0.16 | 0.01 | |
| Clean | 0.25 | <0.001 | |
| Natural | 0.2 | 0.001 | |
| Refuge | 0.39 | <0.001 | |
| Relaxation | Access | 0.18 | 0.003 |
| Flow | 0.23 | <0.001 | |
| Clean | 0.31 | <0.001 | |
| Natural | 0.22 | <0.001 | |
| Refuge | 0.5 | <0.001 |
| Emotion | Number of Times Mentioned |
|---|---|
| Peace/peaceful | 9 |
| Happy/happiness | 6 |
| Nostalgic/nostalgia | 6 |
| Love | 3 |
| Wonder | 3 |
| Relaxation/relaxing | 3 |
| Appreciation | 2 |
| Excitement | 2 |
| Hope | 2 |
| Pride | 2 |
| Setting | Most Common Keywords |
|---|---|
| River setting (Sewell Park) |
|
| Lake setting |
|
| Wetland setting |
|
| Tributary setting |
|
| Across all settings |
|
Disclaimer/Publisher’s Note: The statements, opinions and data contained in all publications are solely those of the individual author(s) and contributor(s) and not of MDPI and/or the editor(s). MDPI and/or the editor(s) disclaim responsibility for any injury to people or property resulting from any ideas, methods, instructions or products referred to in the content. |
© 2023 by the authors. Licensee MDPI, Basel, Switzerland. This article is an open access article distributed under the terms and conditions of the Creative Commons Attribution (CC BY) license (https://creativecommons.org/licenses/by/4.0/).
Share and Cite
Wade, M.T.; Julian, J.P.; Jeffery, K.S.; Davidson, S.M. A Participatory Approach to Assess Social Demand and Value of Urban Waterscapes: A Case Study in San Marcos, Texas, USA. Land 2023, 12, 1137. https://doi.org/10.3390/land12061137
Wade MT, Julian JP, Jeffery KS, Davidson SM. A Participatory Approach to Assess Social Demand and Value of Urban Waterscapes: A Case Study in San Marcos, Texas, USA. Land. 2023; 12(6):1137. https://doi.org/10.3390/land12061137
Chicago/Turabian StyleWade, Madeline T., Jason P. Julian, Kevin S. Jeffery, and Sarah M. Davidson. 2023. "A Participatory Approach to Assess Social Demand and Value of Urban Waterscapes: A Case Study in San Marcos, Texas, USA" Land 12, no. 6: 1137. https://doi.org/10.3390/land12061137