Article

Can China Achieve Its Carbon Emission Peak Target? Empirical Evidence from City-Scale Driving Factors and Emission Reduction Strategies

Department of Urban Planning, School of Architecture, Tianjin University, Tianjin 300072, China
*
Author to whom correspondence should be addressed.
Land 2023, 12(6), 1129; https://doi.org/10.3390/land12061129
Submission received: 27 February 2023 / Revised: 28 March 2023 / Accepted: 4 April 2023 / Published: 25 May 2023

Abstract

:
The development of differentiated emission reduction strategies plays an important role in achieving carbon compliance targets. Each city should adopt carbon reduction strategies according to its carbon emission characteristics. China is a vast country, and there are significant differences between cities. Therefore, this study classifies 340 Chinese cities according to their carbon emission characteristics since 2020 and proposes differentiated emission reduction strategies accordingly. The results of the research show that Chinese cities can be divided into four categories, and they can strive to achieve their carbon peak targets by adopting differentiated emission reduction strategies. In the baseline scenario, Chinese cities will not be able to meet the peak carbon target by 2030. In the differentiated scenario, eco-agricultural cities, industry-led cities, and high-resource-availability cities will be able to achieve peak carbon by 2030. Unfortunately, resource-poor cities will not reach their peak. However, the extent to which their total carbon emissions contribute to the achievement of national goals is low, and their carbon emissions can be traded off for economic development by appropriately relaxing the constraints on carbon emissions. Therefore, in order to achieve China’s peak carbon goal, this study proposes emission reduction recommendations that should be adopted by different types of cities to form differentiated emission reduction strategies.

1. Introduction

Carbon emissions are a significant factor in the economic downturn, resource depletion, and extreme weather with which humans are faced [1,2]. The Chinese government recognizes the need to control carbon emissions and is committed to reaching the nation’s carbon peak by 2030 and finally becoming carbon neutral by 2060 [3]. In order to achieve this goal, each city needs to develop measures to limit local carbon emissions. In addition to technology upgrades, differentiated carbon control is important. Differentiated carbon control is the idea that carbon control emission reduction should be oriented toward the problem of differences in urban development and the complexity of governance. It is considered to have an important role in proposing precise response strategies. For example, differentiated carbon control can help to propose more precise, synergistic, regional approaches to emissions reduction based on the characteristics of total carbon emissions and efficiency [3]. The resource endowments of individual cities vary significantly, and all cities cannot be required to adopt the same mitigation strategies. Therefore, each city needs an abatement strategy that fits its characteristics. City classification studies can categorize cities with similar carbon emission characteristics and, thus, help to propose more precise and differentiated emission reduction strategies.
Chinese cities are of particular interest in the study of differentiated carbon control. Chinese cities have significant differences in terms of population, economic development, and carbon emissions [4,5,6]. Therefore, Chinese policymakers must have a deeper understanding of the differentiated characteristics of urban carbon emissions. This is because it is necessary to develop differentiated emission reduction strategies. China has made great progress in reducing carbon emissions [7,8,9,10]. Cities are the basic administrative unit for implementing mitigation strategies. As efforts to reduce carbon emissions continue to intensify, policymakers need new, more specific, and detailed measures to address climate change. Given the variability among cities, such strategies are much more complex to propose than macro-level formulations at the national and provincial levels. Therefore, it is necessary to develop more precise strategies in terms of city characteristics to help policymakers provide ideas for reducing emissions.
There are a large number of studies in the field of low-carbon cities, and some of them have proposed drivers that influence urban carbon emissions [11,12]. They provide a taxonomic basis for the study of the classification of Chinese cities. Moreover, some studies have improved the precision of research results through work on differential carbon control [6,13]. These studies clarify the need for differentiated carbon control. The combination of city classification and differentiated carbon control can improve the level of accuracy in emission reduction strategy development. This has important implications for differential carbon control research. However, relevant studies do not address the city level, and national- and provincial-level studies only propose macroscopic emission reduction targets based on potential spatial heterogeneity [3,14]. Since carbon reduction strategies need to be tailored to different city characteristics, these studies can help develop overall reduction targets but not specific reduction strategies. In addition, these studies ignore numerous differences between regions, such as the topographic setting and spatial structure. It is unrealistic to directly propose abatement strategies without classifying cities with similar characteristics in the study.
The purpose of this paper is to propose differentiated emission reduction strategies based on city characteristics. To this end, this paper focuses on answering a research question: how can we classify cities according to their characteristics and propose differentiated mitigation strategies based on this classification? This was also the innovation of this paper. This study contributes to the field in the following two ways: (1) the driving factors influencing the characteristics of urban carbon emissions are clarified and cities are classified accordingly; and (2) considering the differences in the carbon emission characteristics of cities, emission reduction strategies for their characteristics are proposed. This can help policymakers formulate reasonable emission reduction measures.
The rest of this paper is organized in the following way. Section 2 reviews the related literature. Section 3 describes the methodology in detail. Section 4 presents the results and discussion. Section 5 provides the main conclusions.

2. Literature Review

2.1. Research on Carbon Emission Characteristics

In recent decades, scholars have studied low-carbon cities and the factors that influence carbon emissions. It is well-documented that population size has a fairly significant positive impact on carbon emissions compared to the more complex impact of economic factors [15,16,17]. For example, the authors of [18] found that an E-KEC relationship exists between economic growth and carbon emissions. However, other scholars have argued that an inverted U-shaped relationship exists between the economy and carbon emissions [19,20]. Two approaches are usually used to assess technology. The first interprets technology progress (T) as a residual term [21]. This approach classifies what cannot be explained by population (P) or affluence (A) as technology progress (T). However, this approach does not reflect the true impact of technology progress (T) on the environment because the error term represents not only the technological impact but also social and other impacts on carbon emissions [11,22]. The second approach expresses technology progress (T) as a set of variables that can capture different technological factors, such as energy intensity (E) [23,24,25,26], urbanization (U) [27,28,29], and industrial structure (I) [19,21,30,31]. All of these factors have been shown to play a significant role in carbon emissions.
Regarding the study of carbon emission characteristics, scholars usually use the IDEAM model [20,32], LMDI method [33], or STIRPAT model [34] for impact factor analysis. The IDEAM model allows for a dynamic assessment of various carbon emission sources over time. It has the advantage of allowing a more comprehensive analysis of carbon emissions. However, it requires a large amount of data to be effective, and these data are difficult to obtain in some regions and countries. The IDEAM approach can be complex and difficult to understand for policymakers and the public, which may limit the effectiveness of promoting low-carbon actions. Both the LMDI method [33] and STIRPAT model can be used to analyze the impact factors, but they differ in their scope of application and methodology. The LMDI method is mainly used to decompose the amount of change in a factor. The STIRPAT model is mainly used to measure the degree of impact of factors such as population, wealth, and technology on the environment. The population, affluence, technology (IPAT) model reflects the combined social, economic, and technological factors affecting carbon emissions [35].
The above studies outline numerous factors that influence carbon emissions and various research methods, which helped the investigation of the characteristics of urban carbon emissions in this paper.

2.2. Research on Carbon Peak Prediction

Due to the heterogeneity of different regions and industries, the results of carbon peak predictions differ. In some existing studies, researchers have used sectors, regions, industrial structures, and per capita carbon emissions as the objects of study for carbon peak projections. In terms of sectors (industry, construction, transportation, and agriculture), only the agricultural sector will reach its peak in 2030 [36]. Analyzing by region (western, central, and eastern), the eastern region will not achieve the target peak without policy intervention [37]. Looking at the industrial structure (primary, secondary, and tertiary sectors) shows that all regions will be able to achieve peak carbon emissions by 2030 [38]. In terms of carbon emissions per capita (high-, medium-, and low-carbon cities) analysis, the results show that only 44% of cities would achieve the target peak under unregulated development [39]. It is noteworthy that relevant studies at the level of urban characteristics have not been conducted. In addition, most of the previous studies have provided projections and analyses regarding carbon peaking without further analysis of urban heterogeneity. Therefore, it is difficult to propose targeted emission reduction strategies.
Considering the heterogeneity among cities, scholars usually use a classification approach to solve this problem. Commonly used classification research methods include the k-nearest neighbors (K-NN) algorithm and the k-means clustering algorithm. The K-NN algorithm is designed to determine which specific categories of study subjects are known. The k-means clustering algorithm is designed to divide complex research objects into classes, with no categories being determined beforehand. In terms of classification characteristics at the national city scale, the k-means clustering algorithm is more appropriate, as shown in [40]. At the same time, scholars have modeled and calculated projections of peak carbon emissions in an attempt to help policymakers develop reasonable emission reduction strategies. The commonly used research method is scenario projection [41,42,43,44].
Due to the heterogeneity among cities, different carbon control strategies should be developed. In order to achieve national emission reduction targets, more precise emission reduction strategies must be proposed. Classification studies are a good way to improve the precision, as they can classify cities with similar carbon emission characteristics according to the changes in influencing factors so that emission reduction strategies can be proposed based on common problems. However, in previous studies, there are no analyses that combine characteristics with carbon attainment targets. In order to fill this research gap, this paper proposes differentiated emission reduction strategies based on city carbon emission characteristics for 340 Chinese cities. This study had two objectives: (1) to identify the driving factors affecting urban carbon emissions and classify cities accordingly; and (2) considering the differences in city characteristics, to propose differentiated emission reduction strategies to address the common problems of cities.

3. Data Sources and Methods

3.1. Experimentation Framework

Figure 1 shows the experimental framework of this study, and the steps are briefly described below:
  • Driving factors analysis: Based on the STIRPAT model, the drivers that significantly affect the level of carbon emissions in Chinese cities were selected as variables;
  • City classification analysis: A k-means clustering algorithm was used to classify 340 Chinese cities according to their carbon emission characteristics; characterization was carried out based on the classification results;
  • Carbon emission prediction analysis: A ridge regression model was used to test each of the classified cities, and the optimal ridge regression model was selected for carbon emission trend prediction;
  • A scenario simulation analysis was used to explore carbon emission trends under the influence of differentiated carbon control policies.

3.2. STIRPAT Model

The early IPAT model, which decomposes environmental pressure (I) into the product of population (P), affluence (A), and technological progress (T), has the expression I = P × A × T [45]. The model is widely used in academia, but when one of the independent variables changes, there is no guarantee that the other independent variables will remain fixed. Therefore, other scholars [46] have proposed the STIRPAT model, which is an iteration of the original model and is widely used for the quantitative analysis of the factors that influence carbon emissions. The model’s specific form is shown in Equation (1).
I = a P b A c T d  
Here, I, P, A, and T have the same meanings as in the IPAT model; b, c, and d are indices of population (P), affluence (A), and technology progress (T); and e is the error term. In practical applications, Equation (2) is usually subjected to a logarithmic treatment in order to determine the relevant parameters by regression analysis.
I n I = α + b   ( I n P )   + c   ( I n A )   + d   ( I n T )   + e
In order to explore the multivariate influences on city carbon emissions in greater depth, this study further extends the STIRPAT model with the following equation (Equation (3)):
I n I = α + b   ( I n P )   + c   ( I n A )   + d   ( I n T )   + d   ( I n U R )   + d   ( I n S T )   + e
In Equation (4), carbon emissions, which significantly represent the total levels of carbon emissions from all sectors, are selected as the explanatory variable; the relevant independent variables are decomposed and improved accordingly [47]. As regions experience similar human actions, there are commonalities in the influencing factors. Therefore, we searched the relevant literature, and influencing factors were extracted. The model variables are shown in Table 1.
In this study, population (P) was treated as a proxy for the number of permanent residents [40]. The indications are that the larger a population is, the higher the carbon emissions are. Next, affluence (A) was measured in terms of GDP per capita [48]. The indications are that the higher the GDP per capita of a region is, the more energy that region consumes and the higher its carbon emissions are. Then, technology progress (T) was expressed using energy efficiency [49], which represents the ratio of total GDP to total energy carbon emissions. State-of-the-art technologies, such as renewable energy systems and energy-efficient appliances, can reduce the environmental impacts associated with energy consumption. By incorporating energy efficiency into the model, the role of technological advances in mitigating environmental impacts can be studied. The urbanization (UR) of city centers is usually quite distinct from that in nearby villages and towns. To effectively capture this difference, this study used the proportion of the urban resident population compared to the total resident population, which represents the population concentration, as a supplementary indicator. Many cities are currently in an intermediate stage of industrialization. In this phase, structural changes (ST) within the secondary sector often serve as an accurate reflection of the industrialization progress. Therefore, this study employed the share of carbon emissions from the city’s secondary sector relative to the total carbon emissions as an indicator to assess the level of industrialization.

3.3. k-Means Clustering Algorithm

Due to the large number of cities in China, this study used a k-means clustering algorithm to group cities with similar characteristics together. The different groups were then analyzed to generate peak carbon predictions. Conventional k-means clustering is mainly adapted to machine learning and pattern recognition problems. This algorithm is highly sensitive to initial centroid points, but it cannot guarantee that it will arrive at a better solution because initial centroids are computed randomly for a given cluster. In order to overcome this shortcoming, we used the sum of the squared errors as the number of clustering centers to avoid randomization and to improve the performance of the algorithm. Its effectiveness is well-demonstrated in the literature [50].
The elbow method is one of the most popular methods for determining the k-optimal value, which is the key to the k-means clustering algorithm. The core metric of the elbow method is the sum of error squares, as detailed in Equation (4).
SSE = i = 1 k p C i x m i 2 2
where Ci is the ith cluster, p indicates the sample points in Ci, mi is the center of mass of Ci, and SSE is the clustering error for all samples, which represents a good or bad clustering effect.
As the number of clusters k increases, the samples are divided more finely and the degree of aggregation of each cluster gradually increases; then, the sum of squared errors (SSE) naturally decreases gradually. When k is less than the true number of clusters, the SSE decreases greatly, and when k reaches the true number of clusters, the degree of aggregation obtained by increasing k again rapidly becomes smaller in return, so the decrease in SSE decreases abruptly and then tends to level off as the value of k increases, which means that the graph of SSE and k has the shape of an elbow, and the value of k corresponding to this elbow is the true number of clusters for the data.

3.4. Ridge Regression

Ridge regression analysis is a biased estimation regression method dedicated to the analysis of covariance data. The core idea is that XTX approaches singularity when there are multiple covariances. By adding XTX to an integer constant matrix kl, the likelihood of it approaching singularity will be greatly reduced. The probability that |XTX + kl| = 0 is much smaller than that |XTX|=0. Ridge regression is actually a modified form of least squares that obtains more realistic regression coefficients by abandoning the unbiased nature of least squares at the expense of losing some information and reducing accuracy. The principle is detailed in Equation (5):
β ^ k = X T X + k I 1 X T y
In Equation (5), β ^ ( k ) is the ridge regression estimate of the parameter, X is the design matrix after normalization, kl is the normal number matrix, l is the unit matrix, and 0 ≤ k ≤ ∞ is called the ridge parameter.
In order to avoid the problem of multiple colinearities arising from variable variance inflation factors greater than 10, this study used ridge regression methods to analyze four categories of Chinese cities. The ridge regression method can eliminate the interference from multiple colinearities in the results by adding a non-negative factor K to the main diagonal of the standardized matrix of independent variables. In the ridge regression, R2 changes with the value of K. In this study, the optimal ridge regression model was chosen for carbon emission prediction.

3.5. Scenario Simulation

In order to project different carbon peaking pathways for Chinese cities, two scenarios were identified that can be used to project levels of carbon emissions from Chinese cities up to 2050. The two scenarios were the baseline scenario and the differentiated scenario. In the baseline scenario, the factors’ growth rates should be judged in line with national policies and relevant historical trends (Table 2), with most factors showing a small downward trend. Due to the large number of cities in China, these values are only average values.
In terms of population size, according to the National Bureau of Statistics [51] projections, China’s population will peak around 2030 and then experience negative growth. Therefore, this variable assumes that China’s population growth rate will decline year-by-year in the future, with negative growth occurring after the population growth rate falls to 0 in 2030. In terms of GDP per capita, the average GDP per capita growth rate for 2016–2020 was 6.28% according to the National Bureau of Statistics Yearbook (2016–2021). The International Energy Outlook 2021 [52] provides a detailed forecast of China’s GDP for 2020–2050. Their results were, therefore, referenced in the GDP per capita growth rates in this study. The 13th Five-Year Plan proposes an average annual increase of 3.4% in energy efficiency from 2016 to 2020, 4.4% from 2021 to 2040, and 5.6% from 2041 to 2050. In terms of urbanization rates, according to the National Development and Reform Commission [53], the rate was expected to slow down to 0.8–1.0% per annum over the last decade, with a further slowdown after 2020, reaching 60% in 2020, 68% in 2030, and 80% in 2050. In terms of industrial structure, the World Development Report [12,54] shows that, when GDP per capita exceeds USD 10,000, the primary sector will remain at around 5%, the secondary sector at 40%, and the tertiary sector at around 55%. The secondary sector is therefore expected to saturate in the decade between 2020 and 2030, before China enters the late industrialization phase (see [55,56] for changes in this variable and projected trends in this paper). The baseline scenario variables are shown in Table 3.
The baseline scenario sets out differentiated scenarios through both enhanced and combined policy instruments. The rates of change in the differentiated scenarios allocate the national policy data from the baseline scenario to the individual indicators through the principle of constant aggregation and differentiation of indicators. This process draws on the research in [12]. The average growth rates set in the differentiated scenarios are shown in Table 4.

3.6. Data Sources

We used panel data from 340 cities in China (from 2020) to conduct an empirical study. Data on population, GDP per capita, industrial structure, and technology level were taken from the China Urban CO2 Emissions Dataset (2020) published by the China Urban Greenhouse Gas Working Group (CCG). Data on urbanization levels were taken from the 2021 Statistical Yearbook for each city and were assumed to remain constant over the study period.

4. Results and Discussion

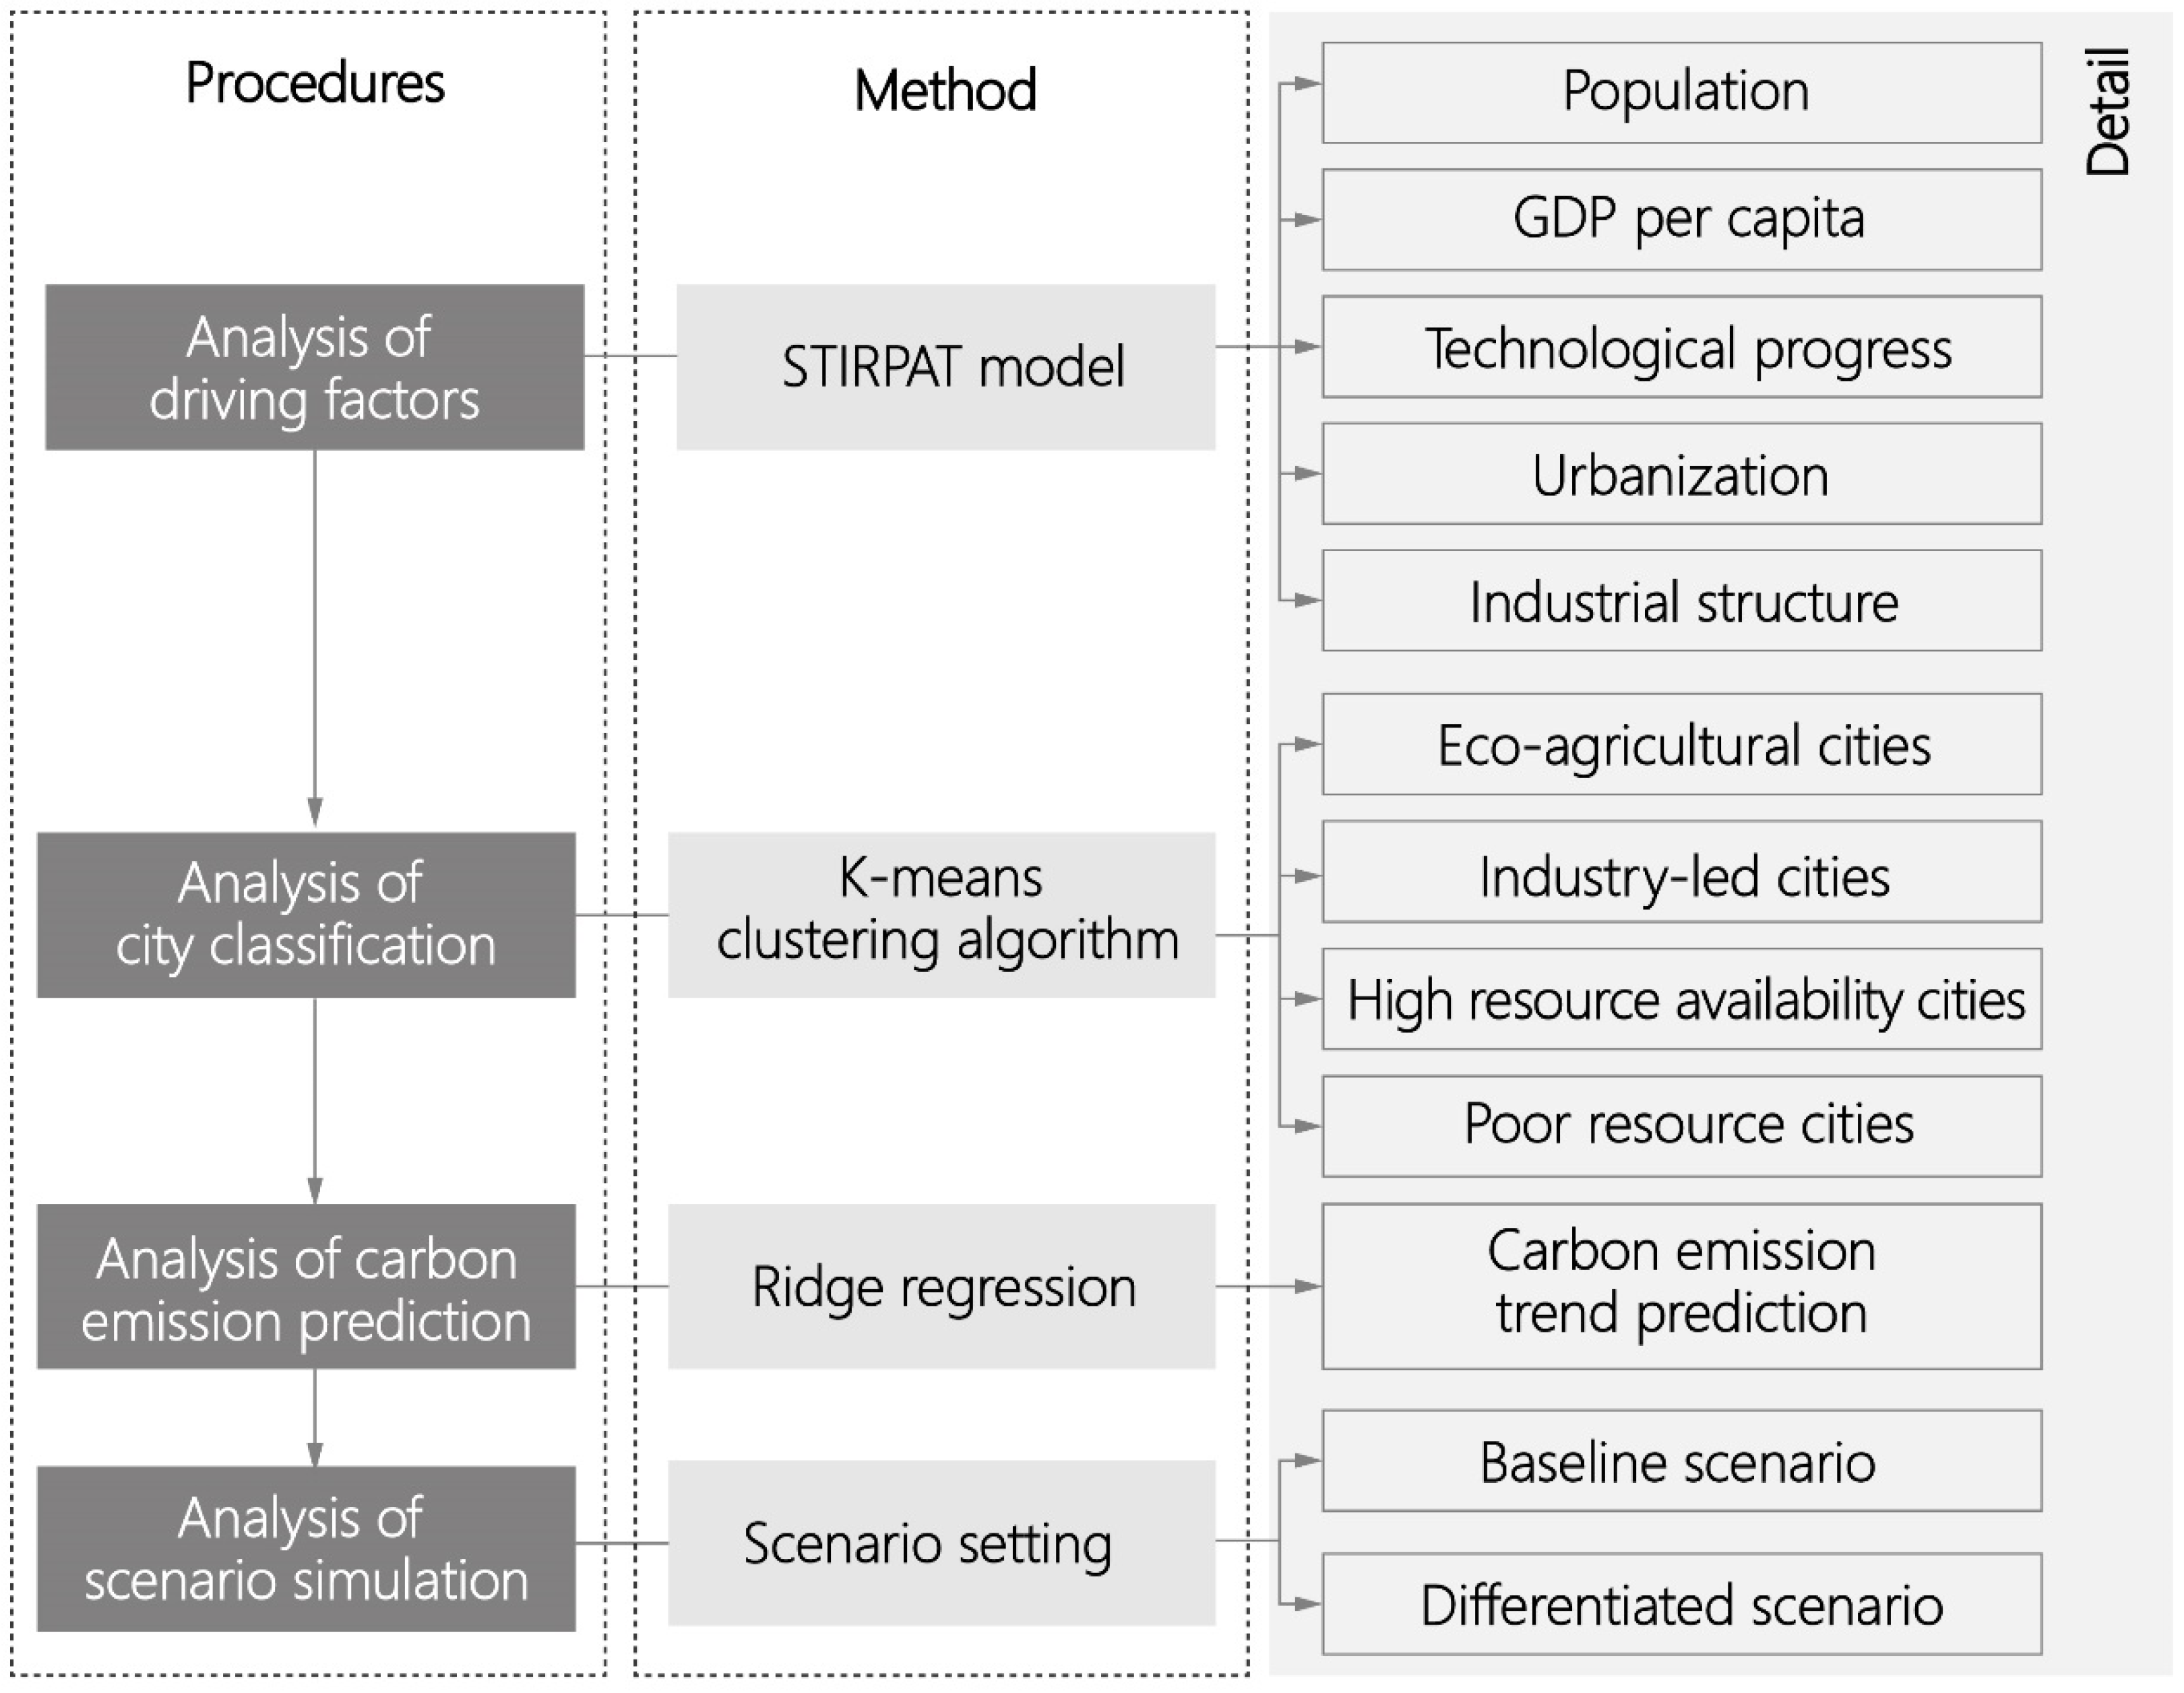
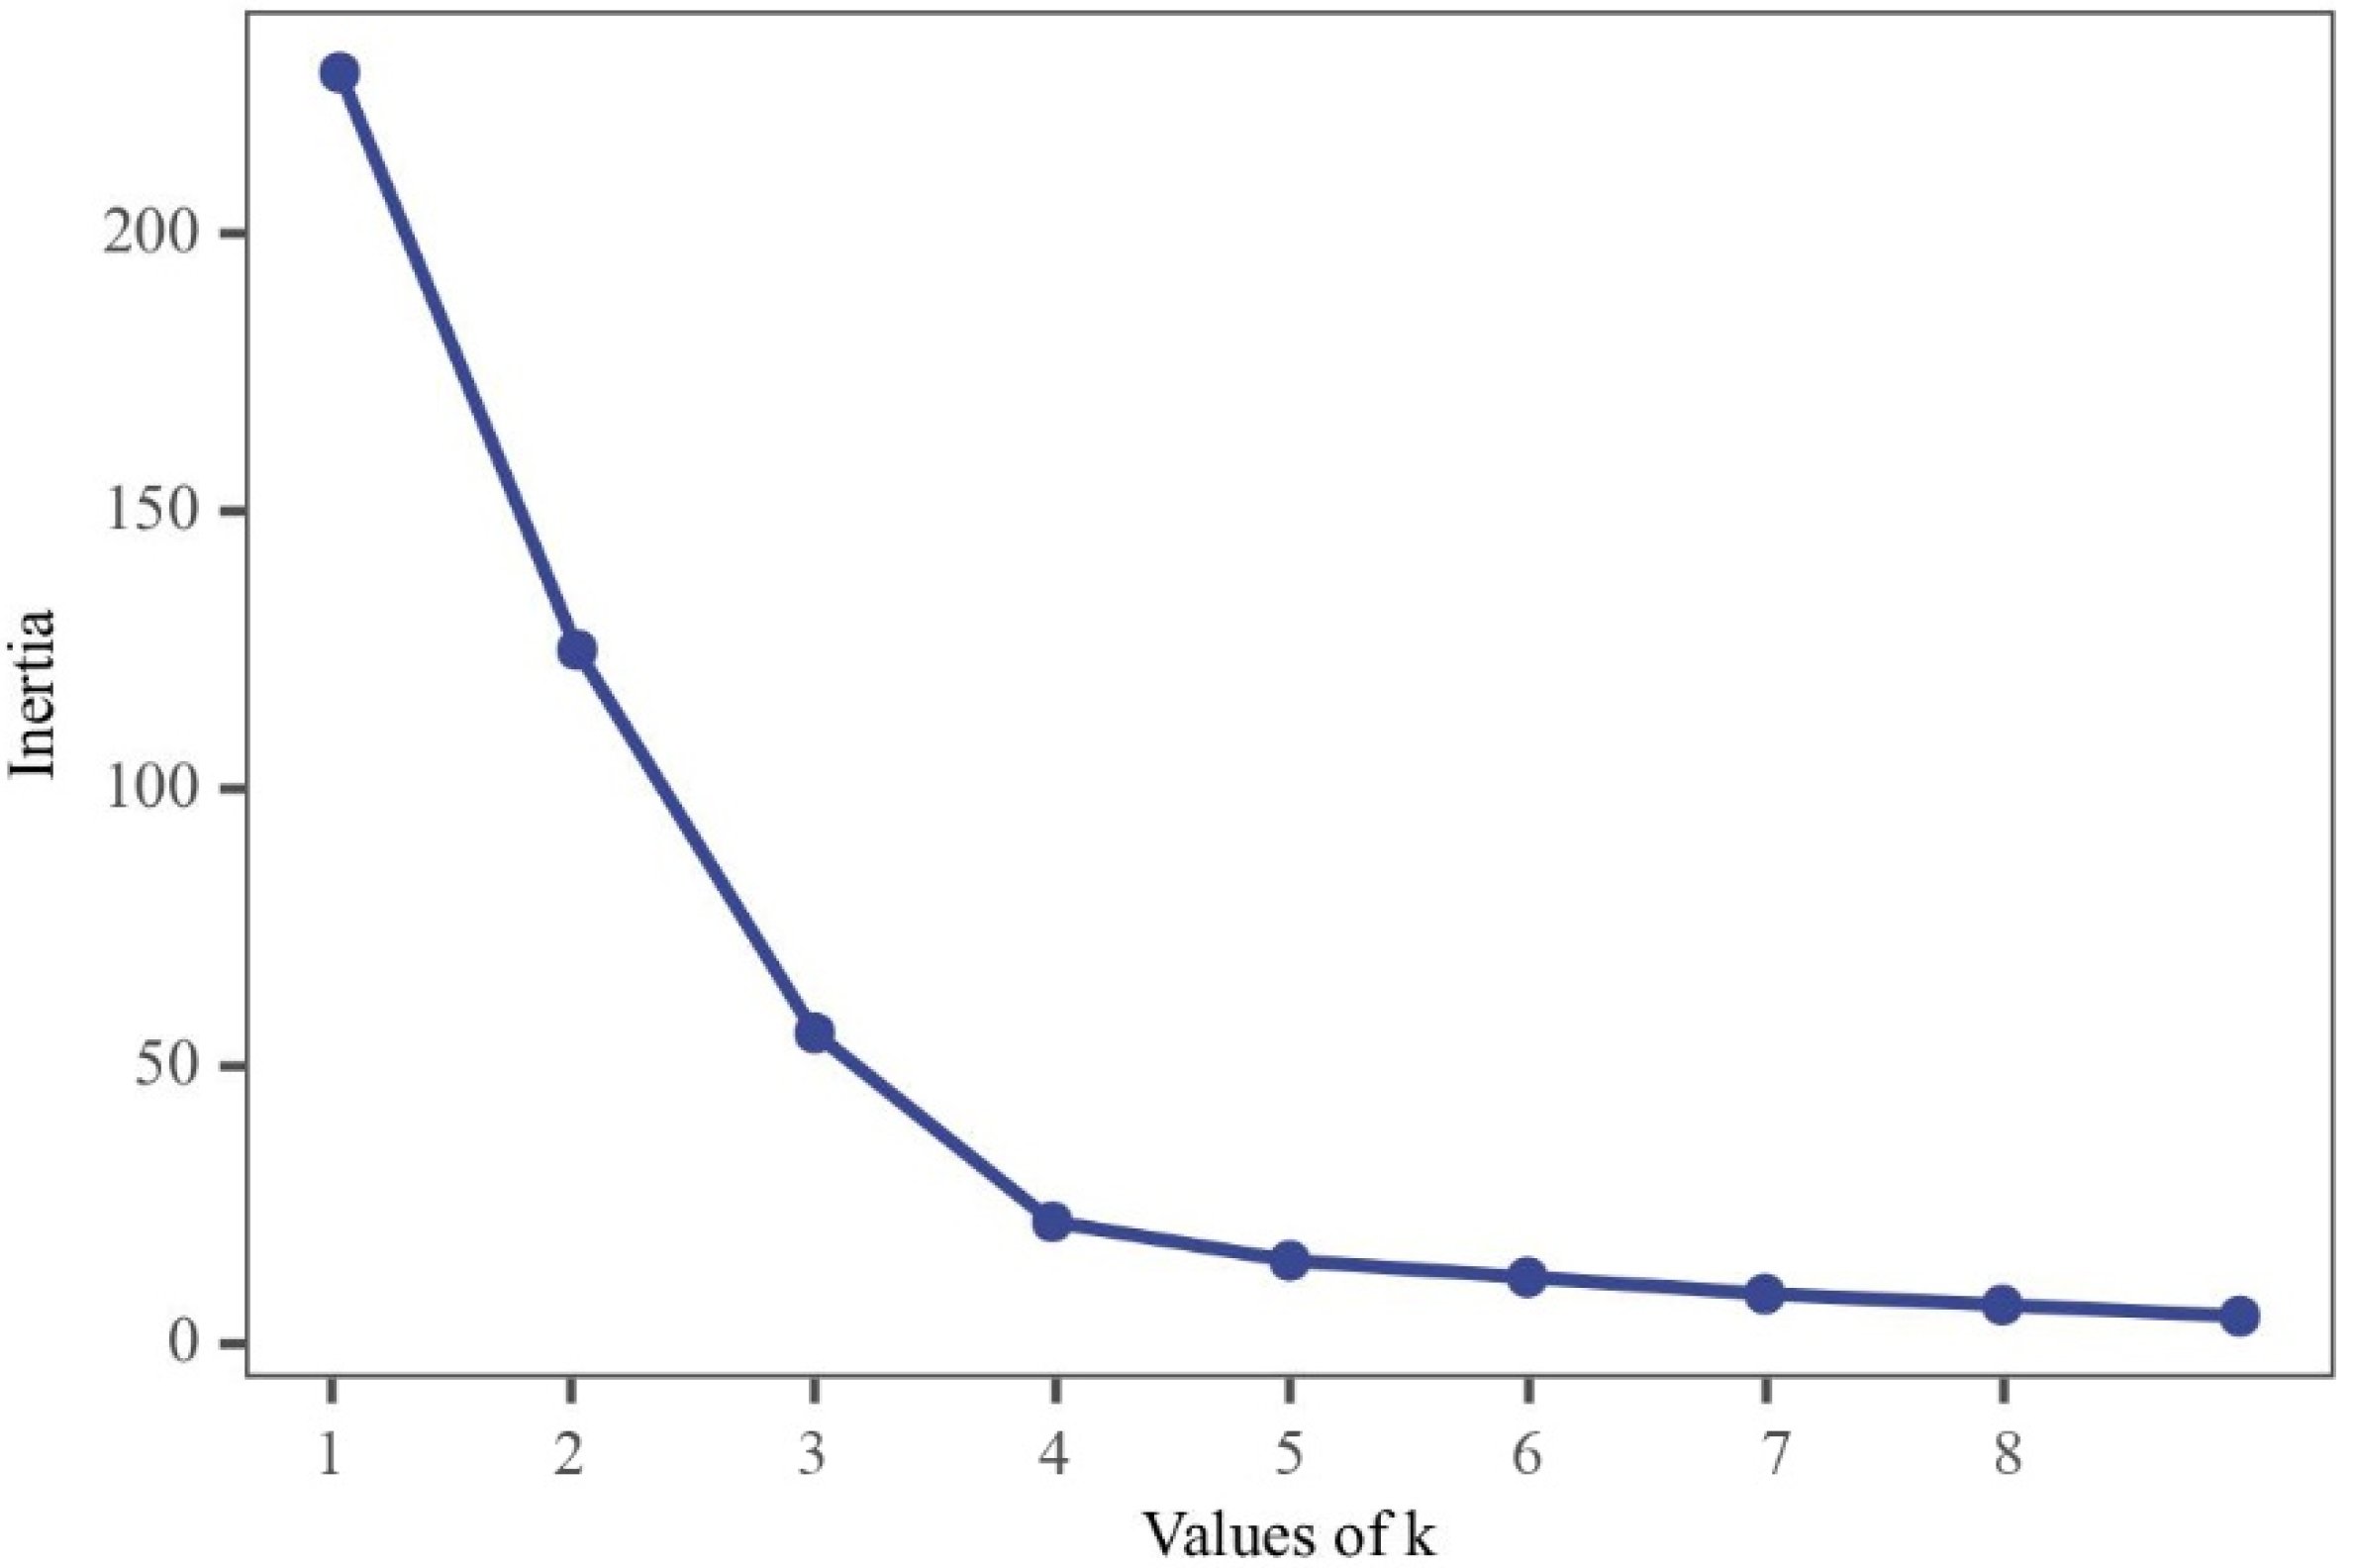
4.1. Classification Results

To determine the optimal number of clusters, the elbow method was used to select the k value at the “elbow”, which is the point where inertia begins to decrease in a linear fashion (Figure 2). Therefore, the optimal number of clusters for the data was four.
When the number of clusters was four, the results for the groupings provided a complete and reasonable picture of the carbon emission characteristics of cities across the country, with each grouping having more typical carbon emission characteristics. The final clustering results, based on the k-means clustering algorithm, are shown in Table 5.
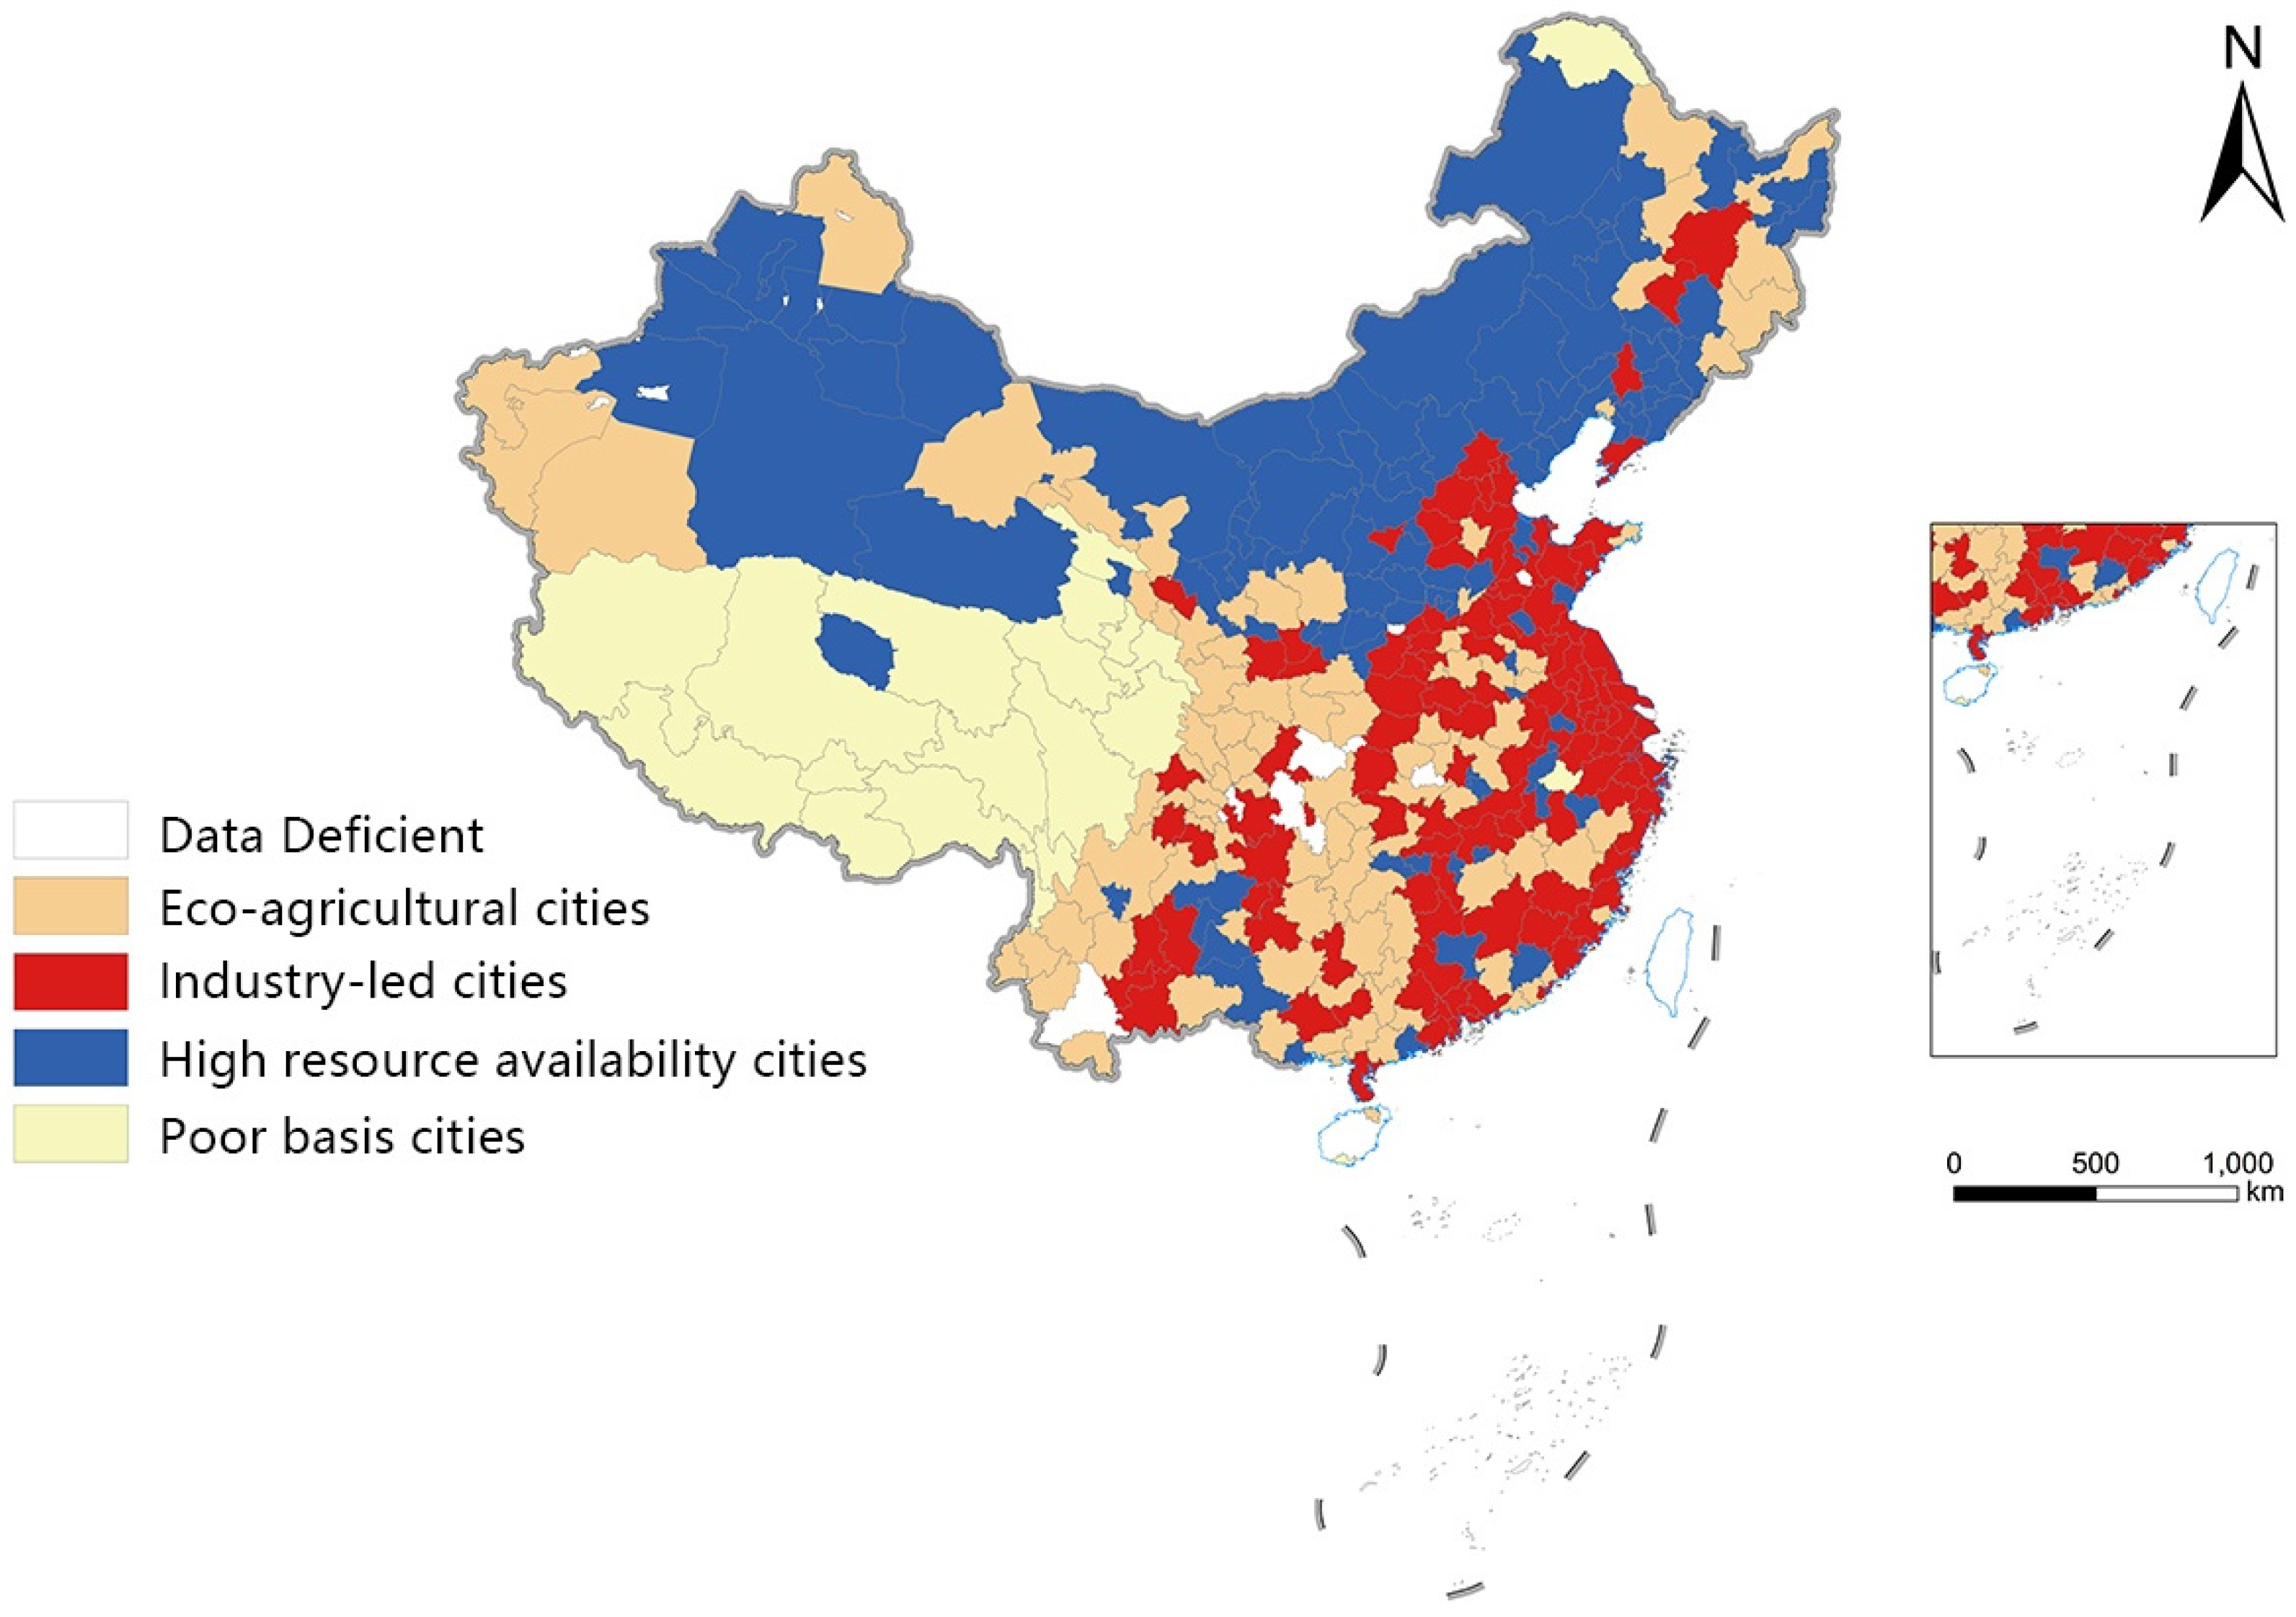
The results show that, currently, Chinese cities can be broadly characterized with four categories of carbon emissions (Table 6). The first category can be summarized as “eco-agricultural cities” and comprises 101 cities, which are scattered and concentrated in the eastern outer edge of the Tibetan Plateau. The second group, which can be summarized as “industry-led cities”, comprises 114 cities, mainly in the eastern provinces of China, including cities such as Shandong, Jiangsu, and Zhejiang. The third category can be summarized as “high-resource-availability cities” and comprises 104 cities, mainly located in northern China in provinces such as Inner Mongolia, Xinjiang, and Qinghai. The fourth category, which can be summarized as “resource-poor cities”, is composed of a relatively small number of cities (20), located mainly in the western regions of China, such as Tibet and Qinghai. In order to make the classification of cities more intuitive, GIS software was used to draw a cluster analysis map of Chinese cities (Figure 3).
Eco-agricultural cities are focused on agricultural production and ecological conservation. Due to the uniqueness of their ecological and agricultural resources, these cities have relatively low levels of economic development, urbanization, technology, and industrialization. The development of such cities depends on the primary industry and the processing industry of the primary industry. At the same time, the tertiary sector based on agricultural resources is well-developed. For example, in cities such as Altai and Mudanjiang, agriculture, forestry, animal husbandry, and livestock industries have their own characteristics. These cities also undertake some external supply tasks. They are less industrialized but in a rapid development stage. In addition, cities such as Guilin and Beihai are rich in natural resources and have high proportions of tertiary industries. The tourism and service industries in these cities are developing rapidly, attracting large numbers of tourists and investments. In the context of economic restructuring, the focus of development in these cities is gradually shifting from traditional industries to service and innovation industries.
Industry-led cities are those where industrial production and its industrial chain are the main economic pillars. Their distinctive feature is the abundance of population resources, meaning that these cities have more labor and consumer markets. At the same time, these cities also possess a high level of urbanization, and their urban scale and well-developed infrastructure provide good conditions for economic development. The main source of the economy in these cities is the secondary industry; for example, light industry and heavy industry. These industries play a vital role in the development of these cities. With its efficient production mode and diversified product structure, light industry plays an important role in such cities’ economies. Examples include the textile industry and the food processing industry. Heavy industries, on the other hand, are one of the main pillars of these cities’ economies, such as iron and steel, machinery, and chemicals. The strong development of these industries has also led to the development of other industries in these cities; for example, the financial industry and service industry.
High-resource-availability cities are those that depend on specific natural resources for their development. These cities usually have relatively small populations but more significant economic development. Their economic sources are mainly resource extraction and the development of traditional industries, which represent 87% of the secondary sector. However, these cities have low energy efficiency and high carbon emissions, which are associated with their overreliance on traditional industries and resource extraction. As such cities have many distinctive resources, such as metals, ores, and biology, these resources are some of the key factors that make them competitive in the global market. However, these cities also face many challenges. One of the most significant challenges is the strong positive correlation between the economic development of these cities and their carbon emissions. As a city’s economy grows, its energy demand grows with it. As a result, this leads to energy inefficiencies and increased carbon emissions.
Resource-poor cities are those with low levels of economic development and inadequate infrastructure. Due to their remote location, poor infrastructure, and low level of economic development, these cities contribute little to the total carbon emissions. Considering the actual situation of these cities, carbon emissions can be appropriately exchanged for economic development. This approach requires a reasonable balance between economic development and environmental protection. In strategy formulations, various factors, such as the sustainability of urban development, ecology, and social equity, need to be considered to ensure that the reduction in total carbon emissions is coordinated with the sustainable development of the urban economy.

4.2. Ridge Regression Results

Table 7 shows the ridge regression coefficients for the four categories of Chinese cities. In order to verify the validity of each model, the relevant variables for the four categories of cities were substituted into their respective ridge regression equations to calculate the simulated carbon emissions in 2020. The calculated results were then fitted to the actual values for comparison. The results showed that the error between the actual and simulated values was within 10%, which met the accuracy requirements of this study.
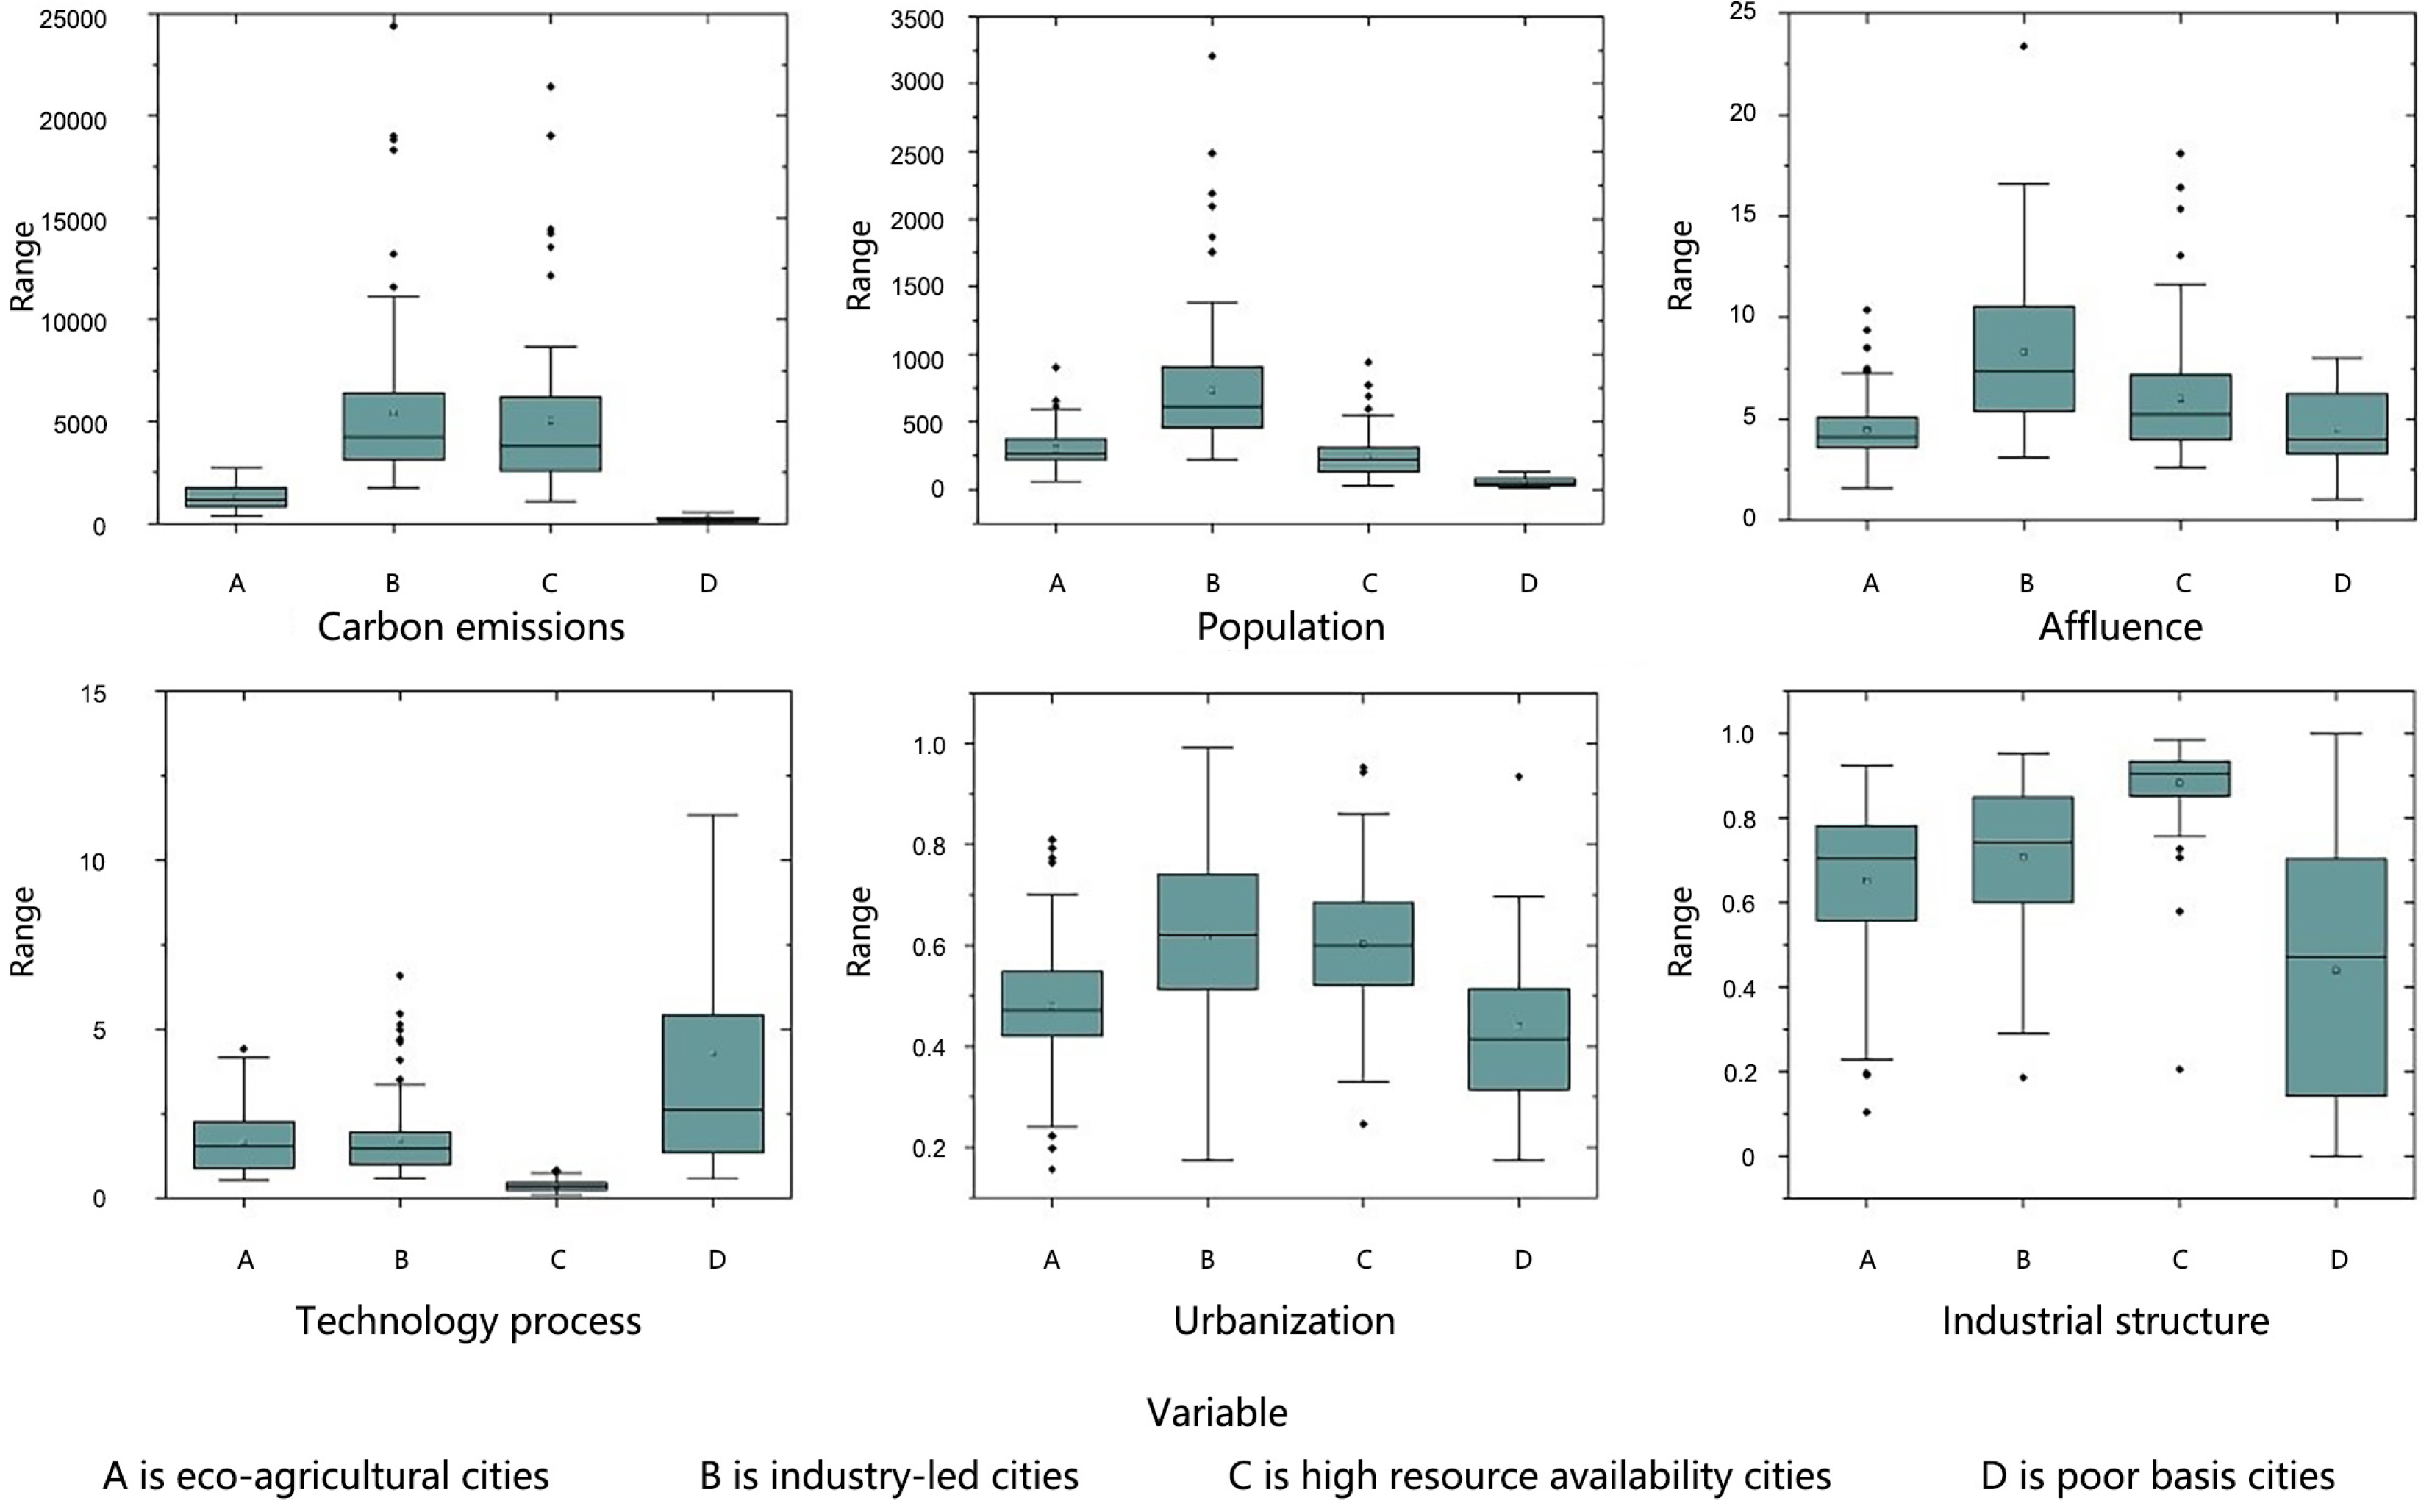
The regression results for the four categories of Chinese cities showed that population and the level of economic development have the greatest degrees of influence on urban emissions. Meanwhile, the level of urbanization and industrial structure have relatively small effects. In particular, the level of technology has a significant negative impact on carbon emissions, indicating a downward trend in carbon emissions as energy efficiency increases. This finding confirms that technological progress is the main driver of the decline in carbon emissions. The level of urbanization and industrial structure have different influencing factors for each type of city, with positive or negative effects, depending on the characteristics of the city category. The characteristics of the different types of cities are detailed in Figure 4.
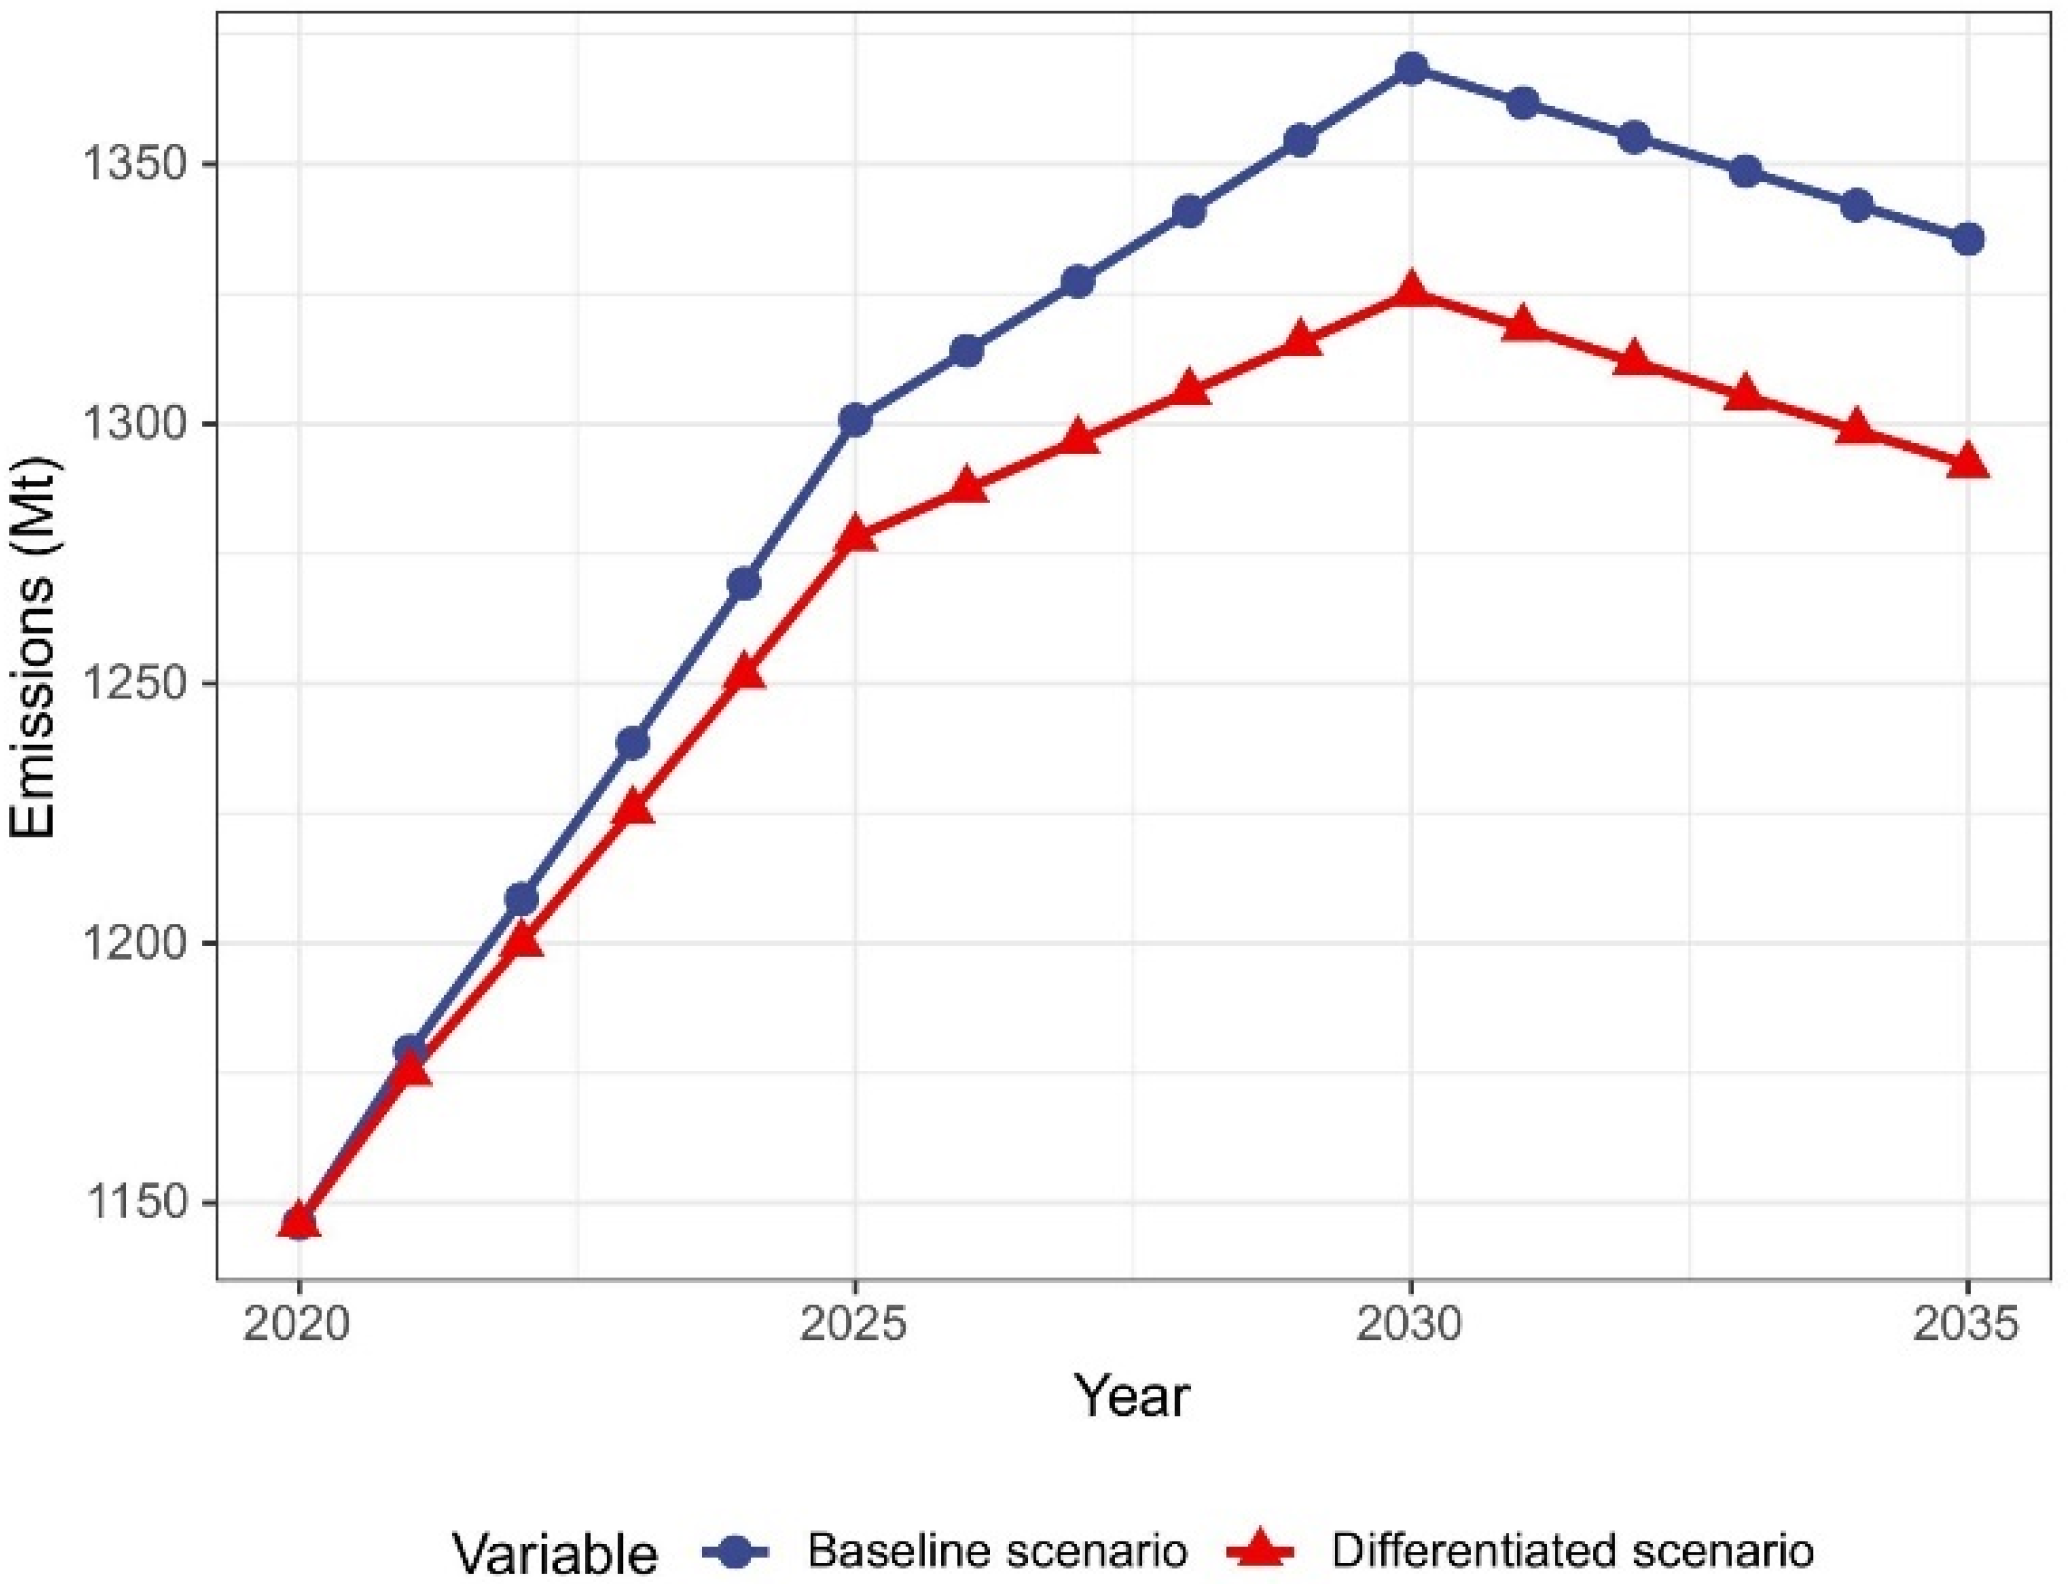
The main factors influencing carbon emissions in eco-agricultural cities are the population, technology progress, and the level of economic development. Of these, technology progress has a negative impact on carbon emissions. The level of urbanization has a small impact, and the industrial structure has the least impact.
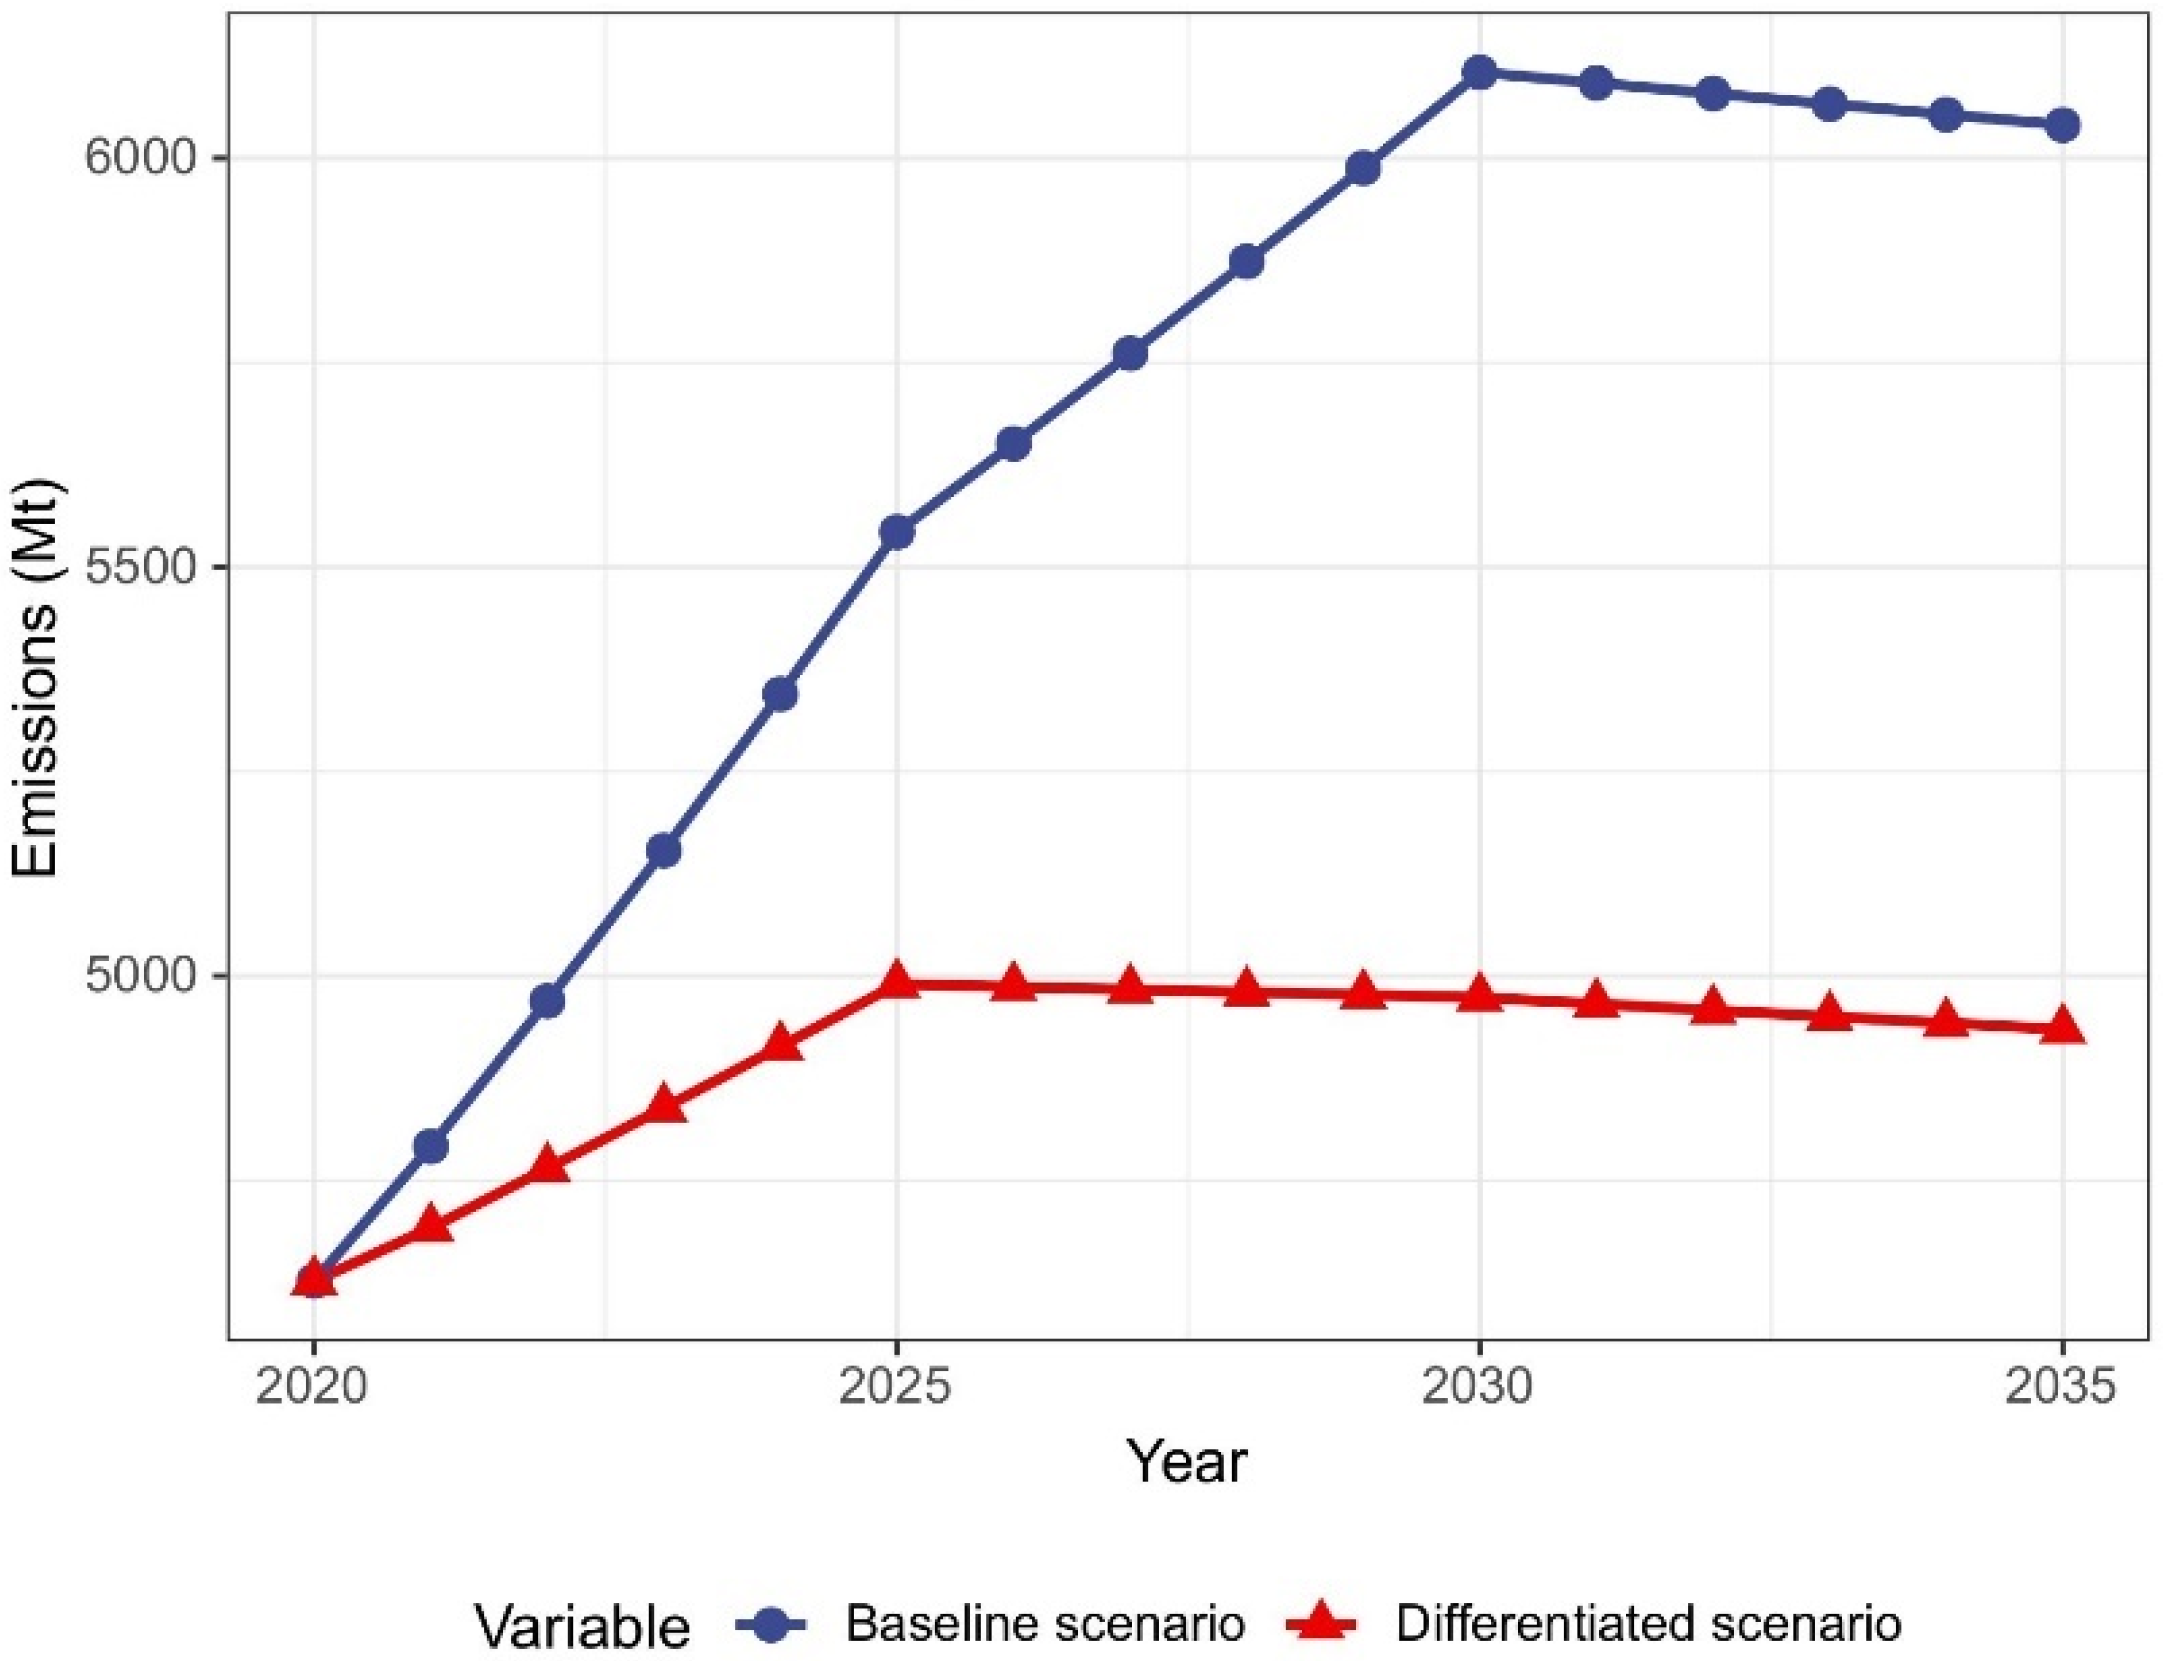
The main factors influencing the level of carbon emissions in industry-led cities are population, technology progress, and the level of economic development. The secondary factor is the influence of industrial structure, while the urbanization rate has the least influence. Among all the factors, energy efficiency and industrial structure show negative influences.
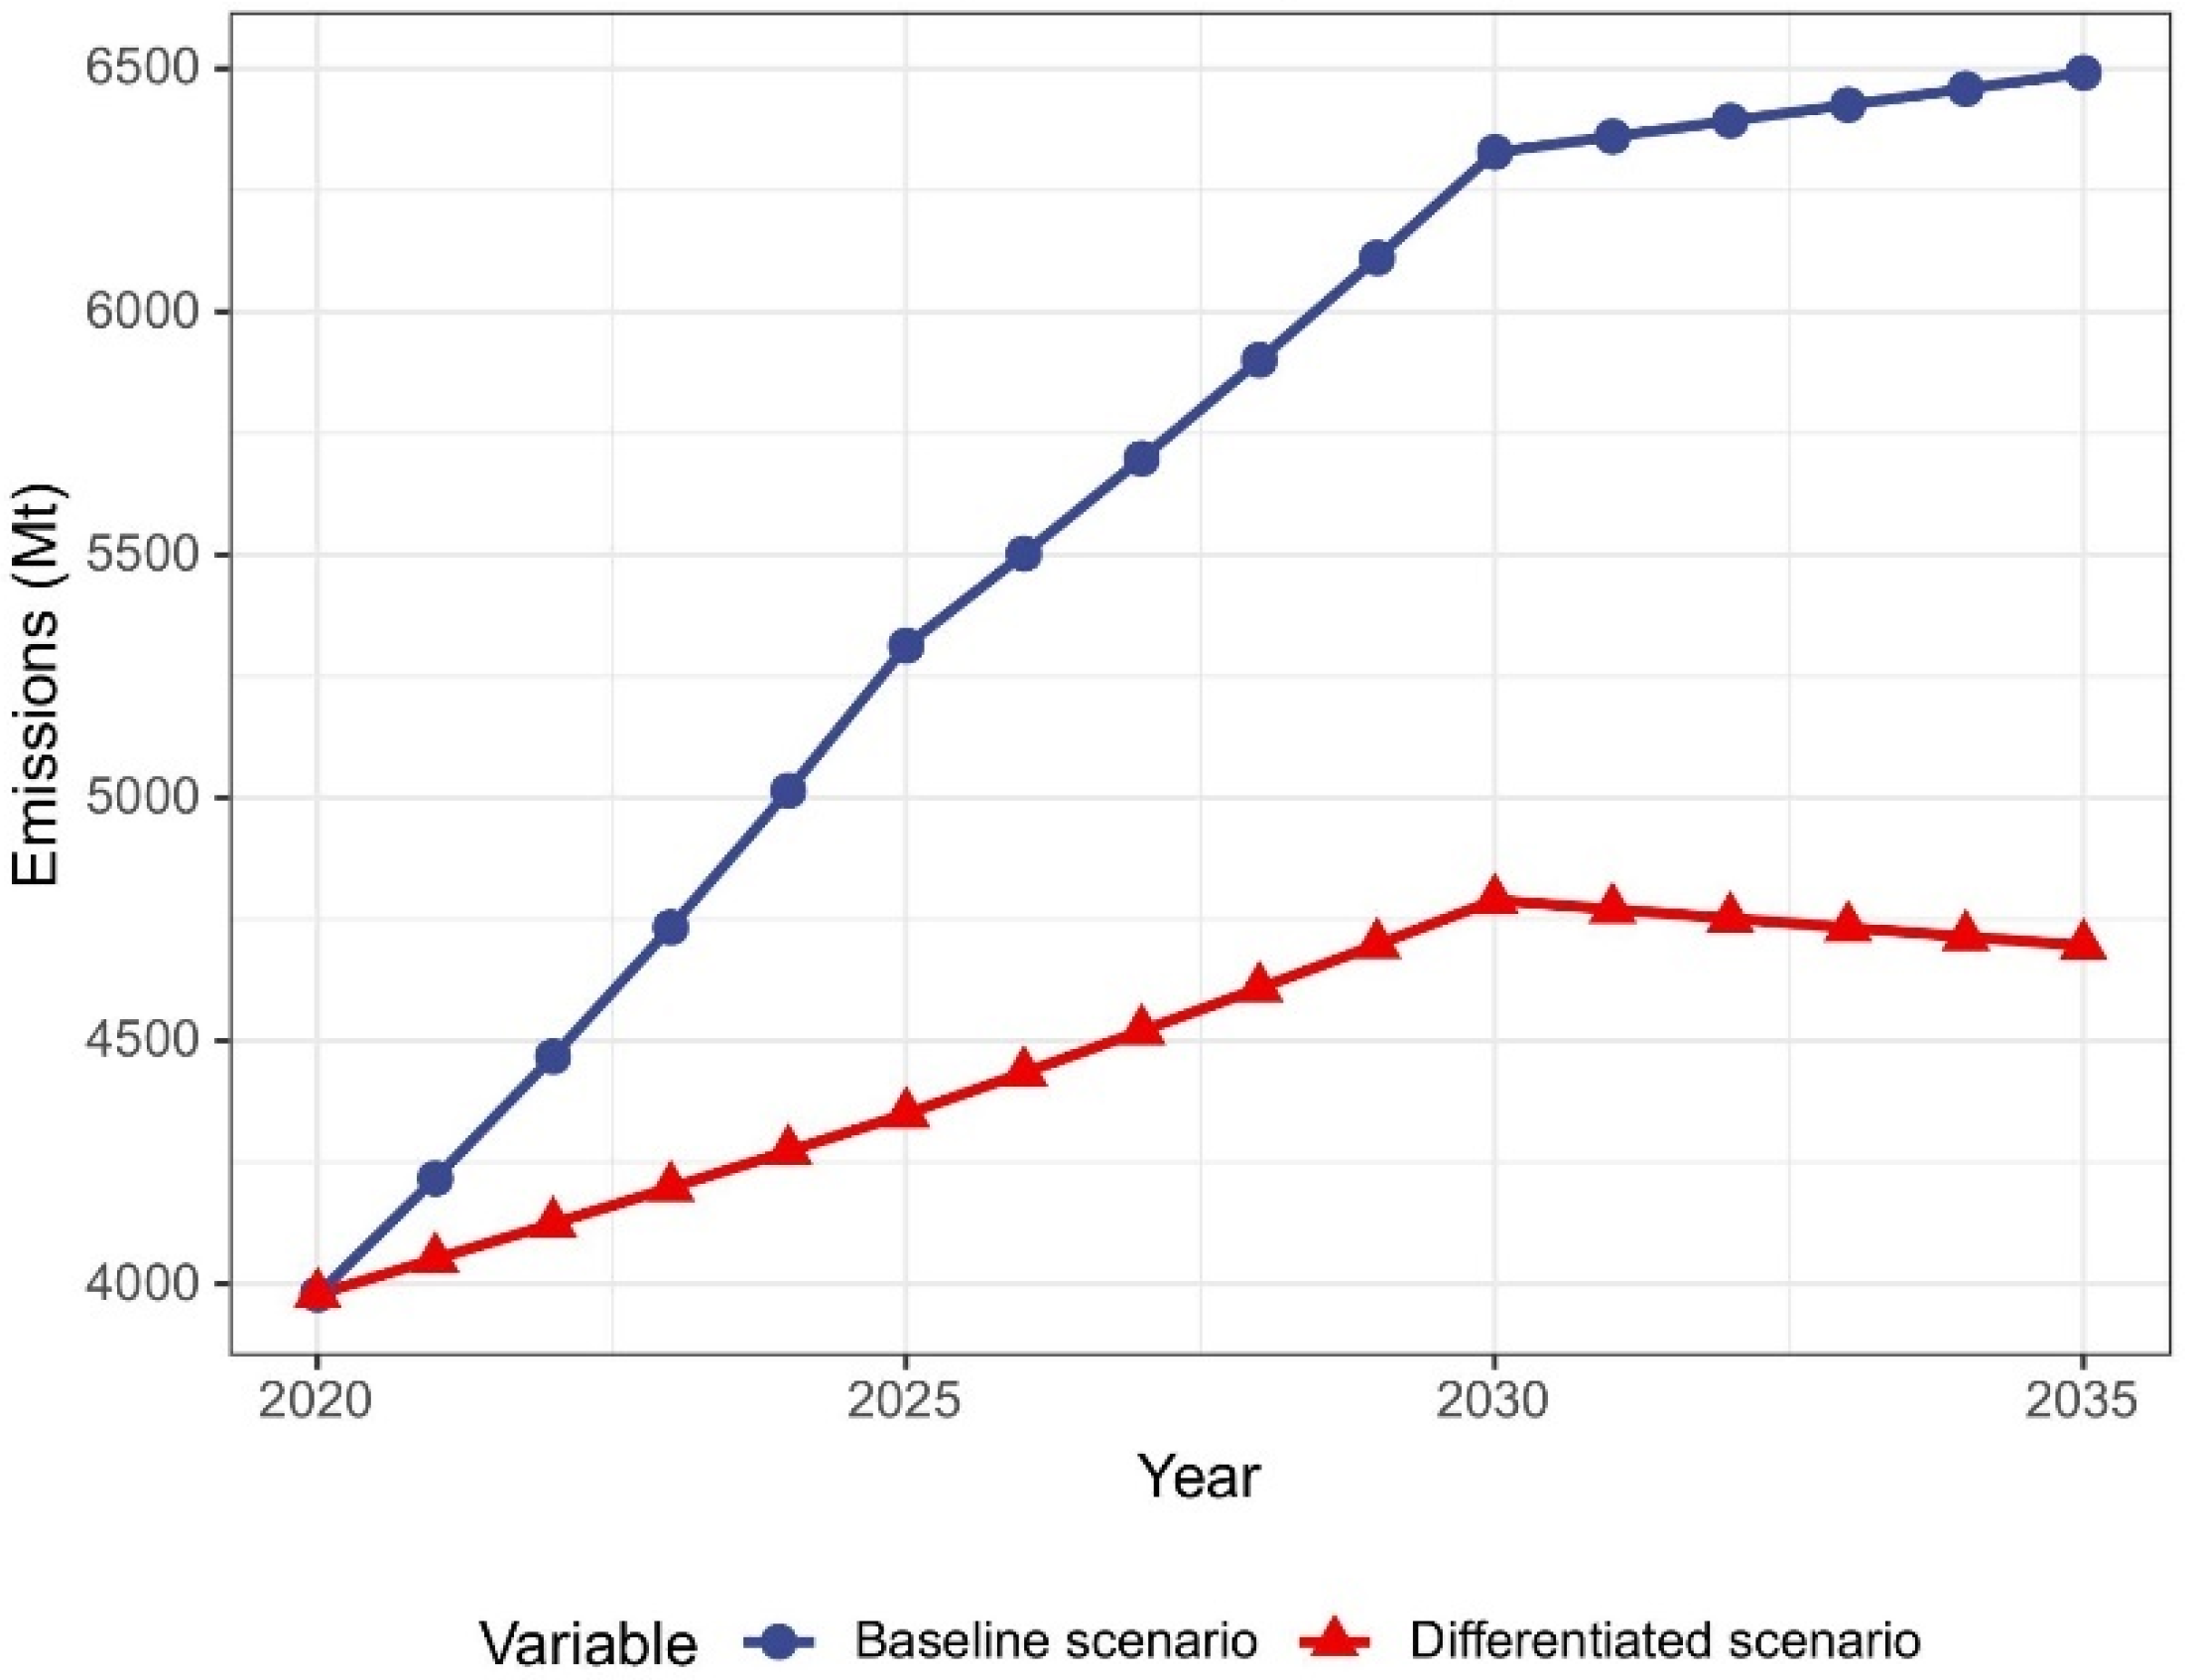
The factors affecting carbon emissions in high-resource-availability cities are the level of economic development, population, technology progress, and industrial structure. The level of urbanization has a smaller impact. Among all the factors, energy efficiency, industrial structure, and urbanization level show negative influences.
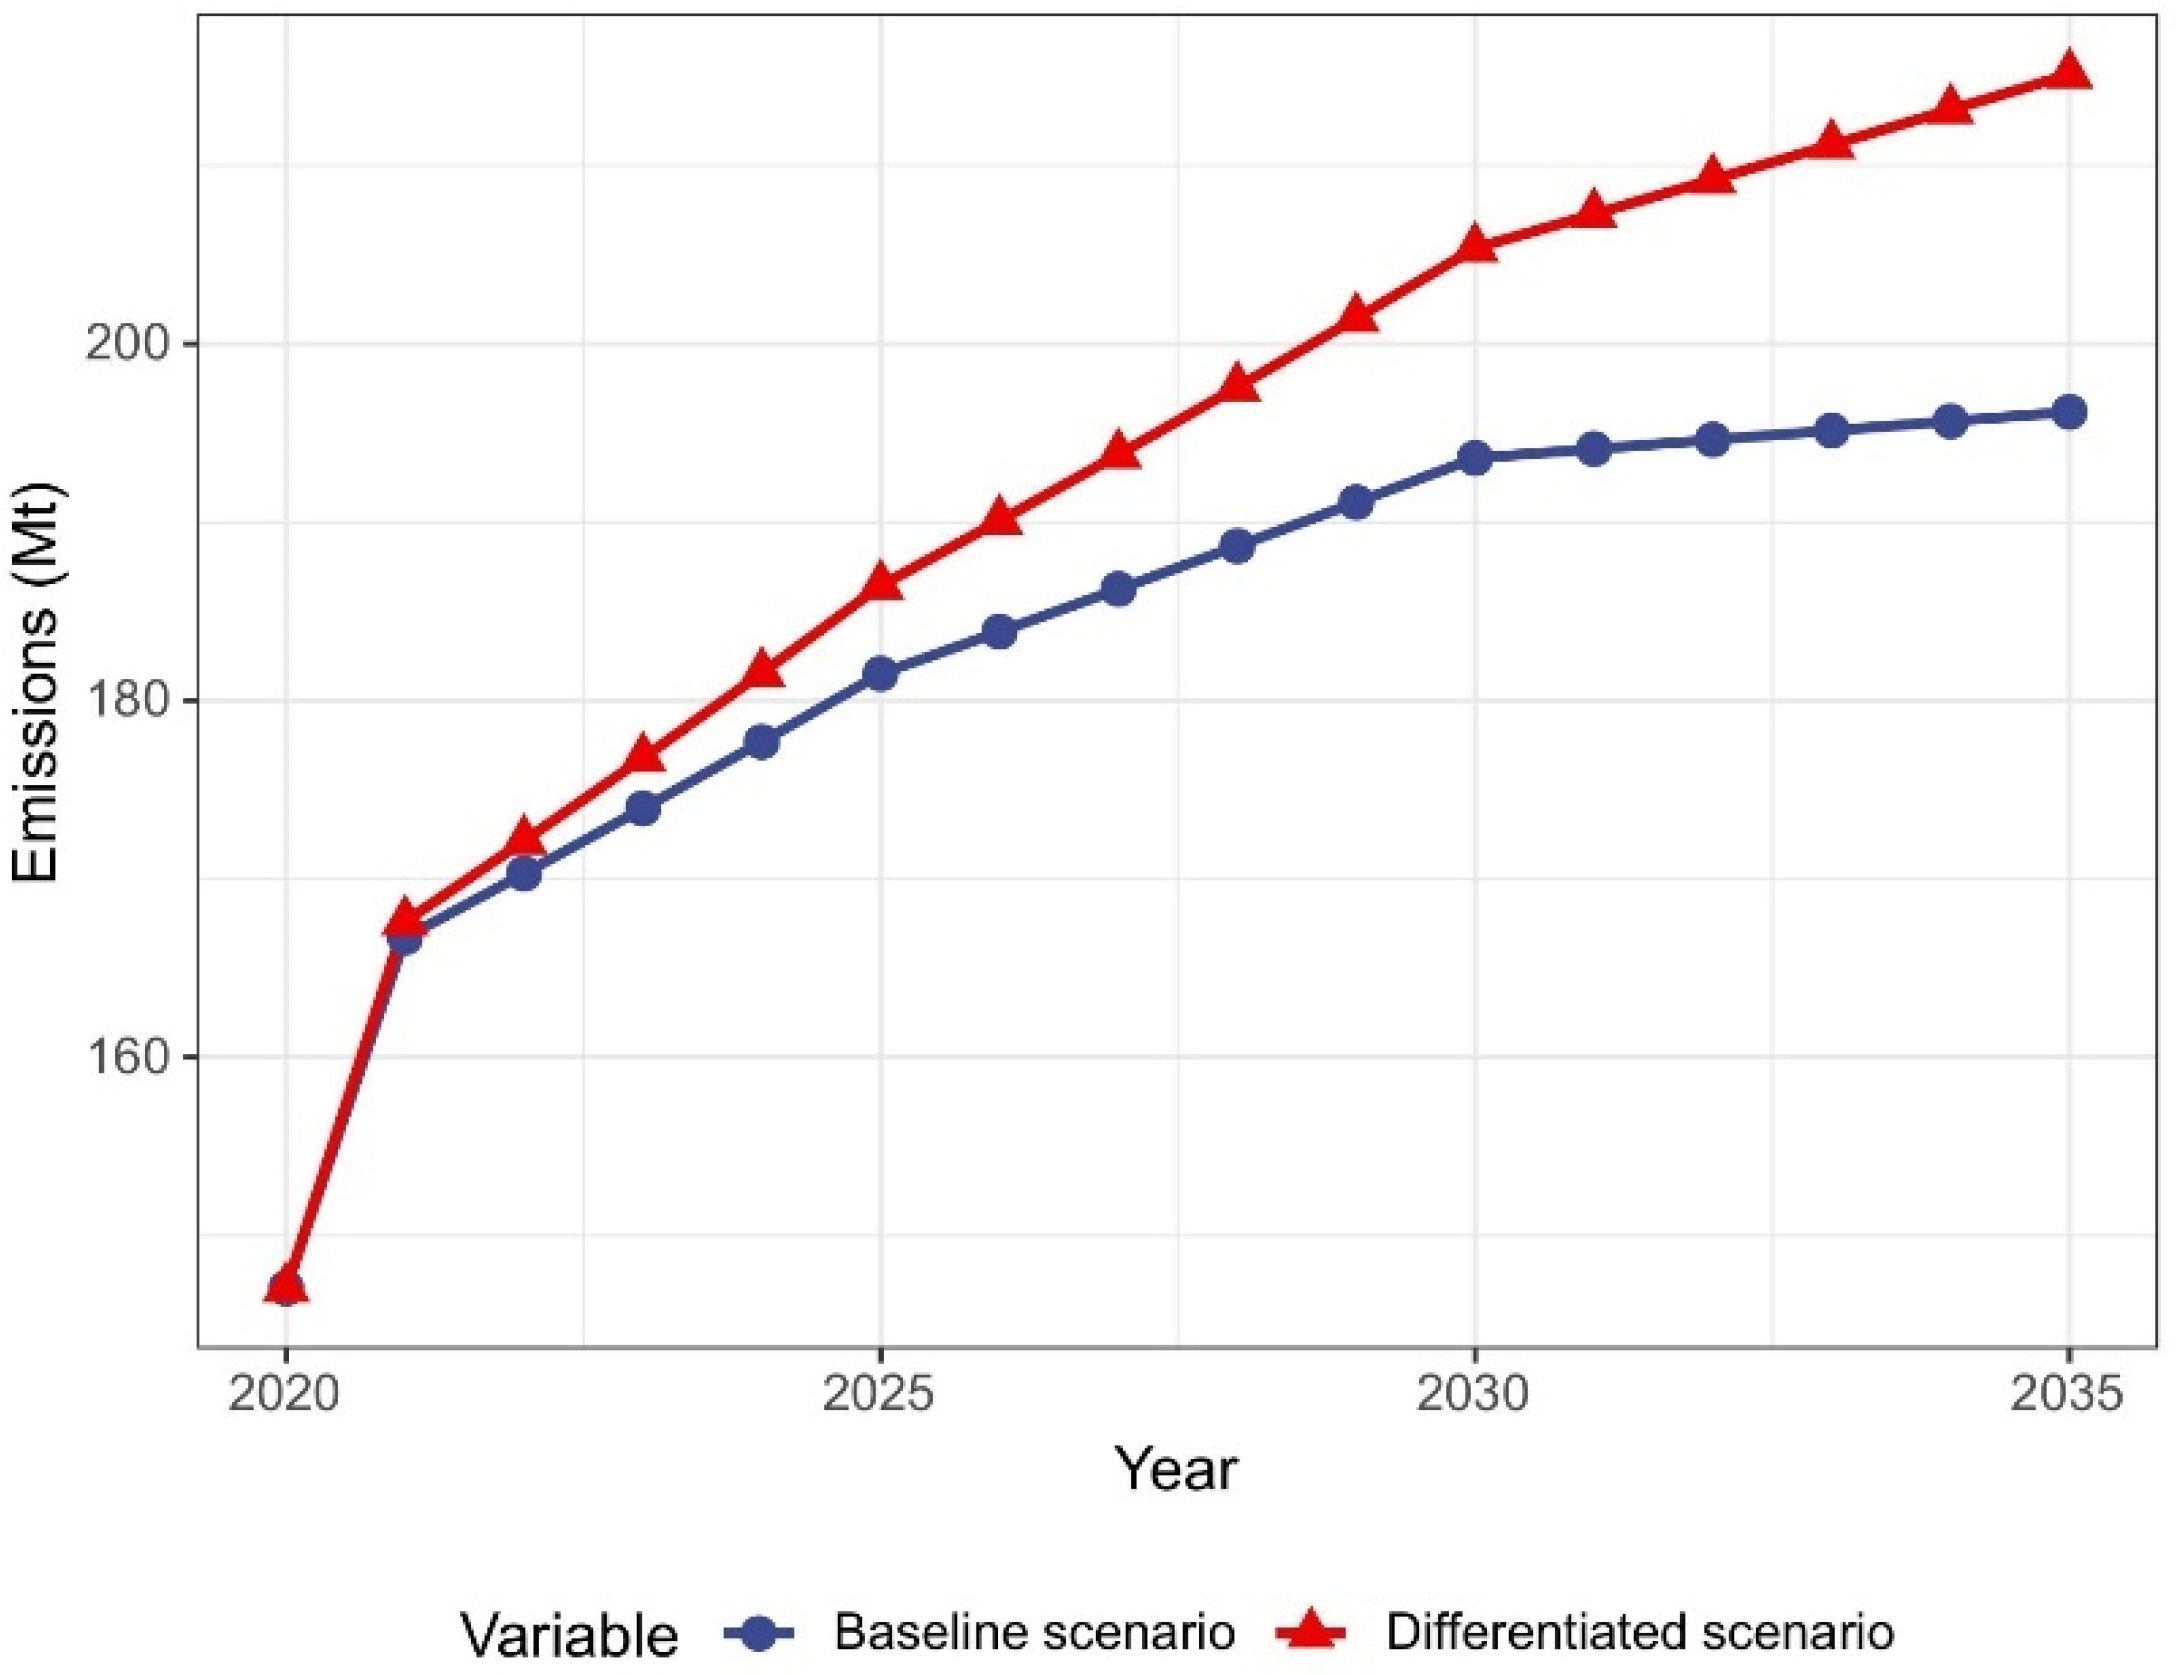
Among the factors affecting the carbon emissions of resource-poor cities, the level of urbanization has a significant impact on carbon emissions. This is followed by the size of the population, the level of economic development, and the level of technology. The influence of industrial structure is smaller. The level of technology and industrial structure factors have negative impacts on carbon emissions in cities of this type.

4.3. Analysis of Trend Forecasts

4.3.1. Analysis of Eco-Agricultural Cities

Projections of carbon emission trends in eco-agricultural cities are shown in Figure 5. This group of cities peaks in the baseline scenario after 2030, with an average peak of 13,684,100 million tons of carbon. The differentiated scenario shows the ability to achieve a carbon peak in 2025–2030, with an average peak of 13,251,800 tons, a decrease of 3.16% compared to the baseline scenario. The largest influencing factor for carbon emissions in eco-agricultural cities is population, where a 1% change in population will result in a 0.651% change in total carbon emissions. This factor is followed by GDP per capita. Eco-agricultural cities are dominated by the primary and tertiary sectors but have a lower level of technology. This is the main reason for the low total carbon emissions of this type of city. The positive influences affecting the carbon emissions trend in this category are ranked as follows: population > GDP per capita > energy efficiency (negative) > urbanization (negative) > industrial structure. Therefore, in the differentiated scenario, the focus should be on upgrading the level of technology and energy efficiency.

4.3.2. Analysis of Industry-Led Cities

Projections of carbon emission trends for industry-led cities are shown in Figure 6. Cities of this type peak in carbon in the baseline scenario after 2030, with an average peak of 61,048,900 tons. Peaks can be achieved earlier than 2025 under the differentiated scenario, with an average peak of 49,898,900 ton, a decrease of 18.26% from the baseline scenario. The largest influence on carbon emissions in industry-led cities is population, where a 1% change in population size results in a 0.764% change in total carbon emissions. The second largest influence is the level of economic development. However, at the same time, an increase in the level of technology has a significant effect on the reduction in emissions in this category of cities. Specifically, each 1% increase in the level of technology results in a 0.69% reduction in total carbon emissions. The economic and social development of these cities is rapid and not entirely dependent on energy and resource drivers. These cities have a relatively large and rapidly growing secondary sector. Their industry has entered a post-industrial phase of development. The positive influences affecting the carbon emissions trend in this category of cities are ranked as follows: population > energy efficiency (negative) > GDP per capita > industrial structure (negative) > urbanization. Industry-led cities are characterized by a large population and a level of economic development that is in the upper middle class of the country. They have a relatively large share of secondary industries and rely on traditional industries for economic development, which directly leads to high carbon emissions per capita in these cities.

4.3.3. Analysis of High-Resource-Availability Cities

Projections of carbon emission trends in high-resource-availability cities are shown in Figure 7. This type of city will not achieve the 2030 carbon peak target in the baseline scenario, and total carbon emissions will continue to grow. However, in the differentiated carbon control scenario, the target is expected to be achieved on schedule (by 2030). Total carbon emissions will be reduced by 24.31% over the same period compared to the baseline scenario, which is a significant reduction. The biggest influence on carbon emissions in the high-resource-availability cities is the level of economic development. Specifically, a 1% change in the level of economic development will result in a 0.986% change in total carbon emissions. High-resource-availability cities have a larger population base and larger total carbon emissions. The overreliance on local resource extraction in exchange for economic development has led to a lag and even a decline in the transformation of traditional industries. The current industrial structure of this type of city is at an early stage of industrialization, and the level of economic development is significantly lower than that of other types of cities. High-resource-availability cities have very high and rapidly increasing carbon emissions per capita compared to other types of cities. They have a single industrial structure and a very low level of technology. The positive influences affecting the carbon emissions trend in this category are ranked as follows: GDP per capita > population > energy efficiency (negative) > industrial structure (negative) > urbanization (negative).

4.3.4. Analysis of Resource-Poor cities

Projections of the carbon emission trends for resource-poor cities are shown in Figure 8. The trend for cities of this type in the baseline scenario does not achieve the 2030 carbon peaking goal. However, given the backward development of this category of cities, the low level of resources, the low development potential, and the low levels of total carbon emissions and all indicators, as well as the extremely low contribution to the achievement of the national target, a continuous increase in carbon emissions may be allowed. This increase in emissions would be in exchange for an increase in economic development and urbanization levels, as well as an increase in industrial structure. The largest influencing factor for carbon emissions in resource-poor cities is the level of urbanization; specifically, a 1% change in urbanization level will result in a 0.523% change in total carbon emissions. The carbon emissions of such cities are characterized by a low base and a small population base. Their slow urbanization is a result of local constraints, such as a lack of physical resources and geographical remoteness. The current industrial structure of this type of city is in the beginning stages of industrialization, and the level of economic development is significantly lower than that of other types of cities. These cities have the lowest per capita carbon emissions and the slowest growth in carbon emissions compared to other city types. The positive influences affecting the carbon emissions trend in this category are ranked as follows: urbanization > population > GDP per capita > energy efficiency (negative) > industrial structure (negative).

4.3.5. Comparison of Total Volume Changes

Taken together (Figure 9), the baseline scenario shows continued growth in total city-wide carbon emissions, increasing at a lower rate after 2030 but failing to meet the carbon peaking target. In the differentiated scenario, by controlling different elements for the different types of cities, the cities as a whole reach peak carbon emissions in 2030 and achieve a 20.83% reduction in carbon emissions compared to the baseline scenario over the same period. It is possible to reach the 2030 carbon peak target on time based on the differentiated development of the various cities. The carbon intensity in 2025 under the differentiated scenario would be 18.81% lower than in 2020, which would achieve the 18% target in China’s 14th Five-Year Development Plan, and, when carbon peaks in 2030, 31.27% lower than in 2020.

4.4. Further Discussions and Suggestions

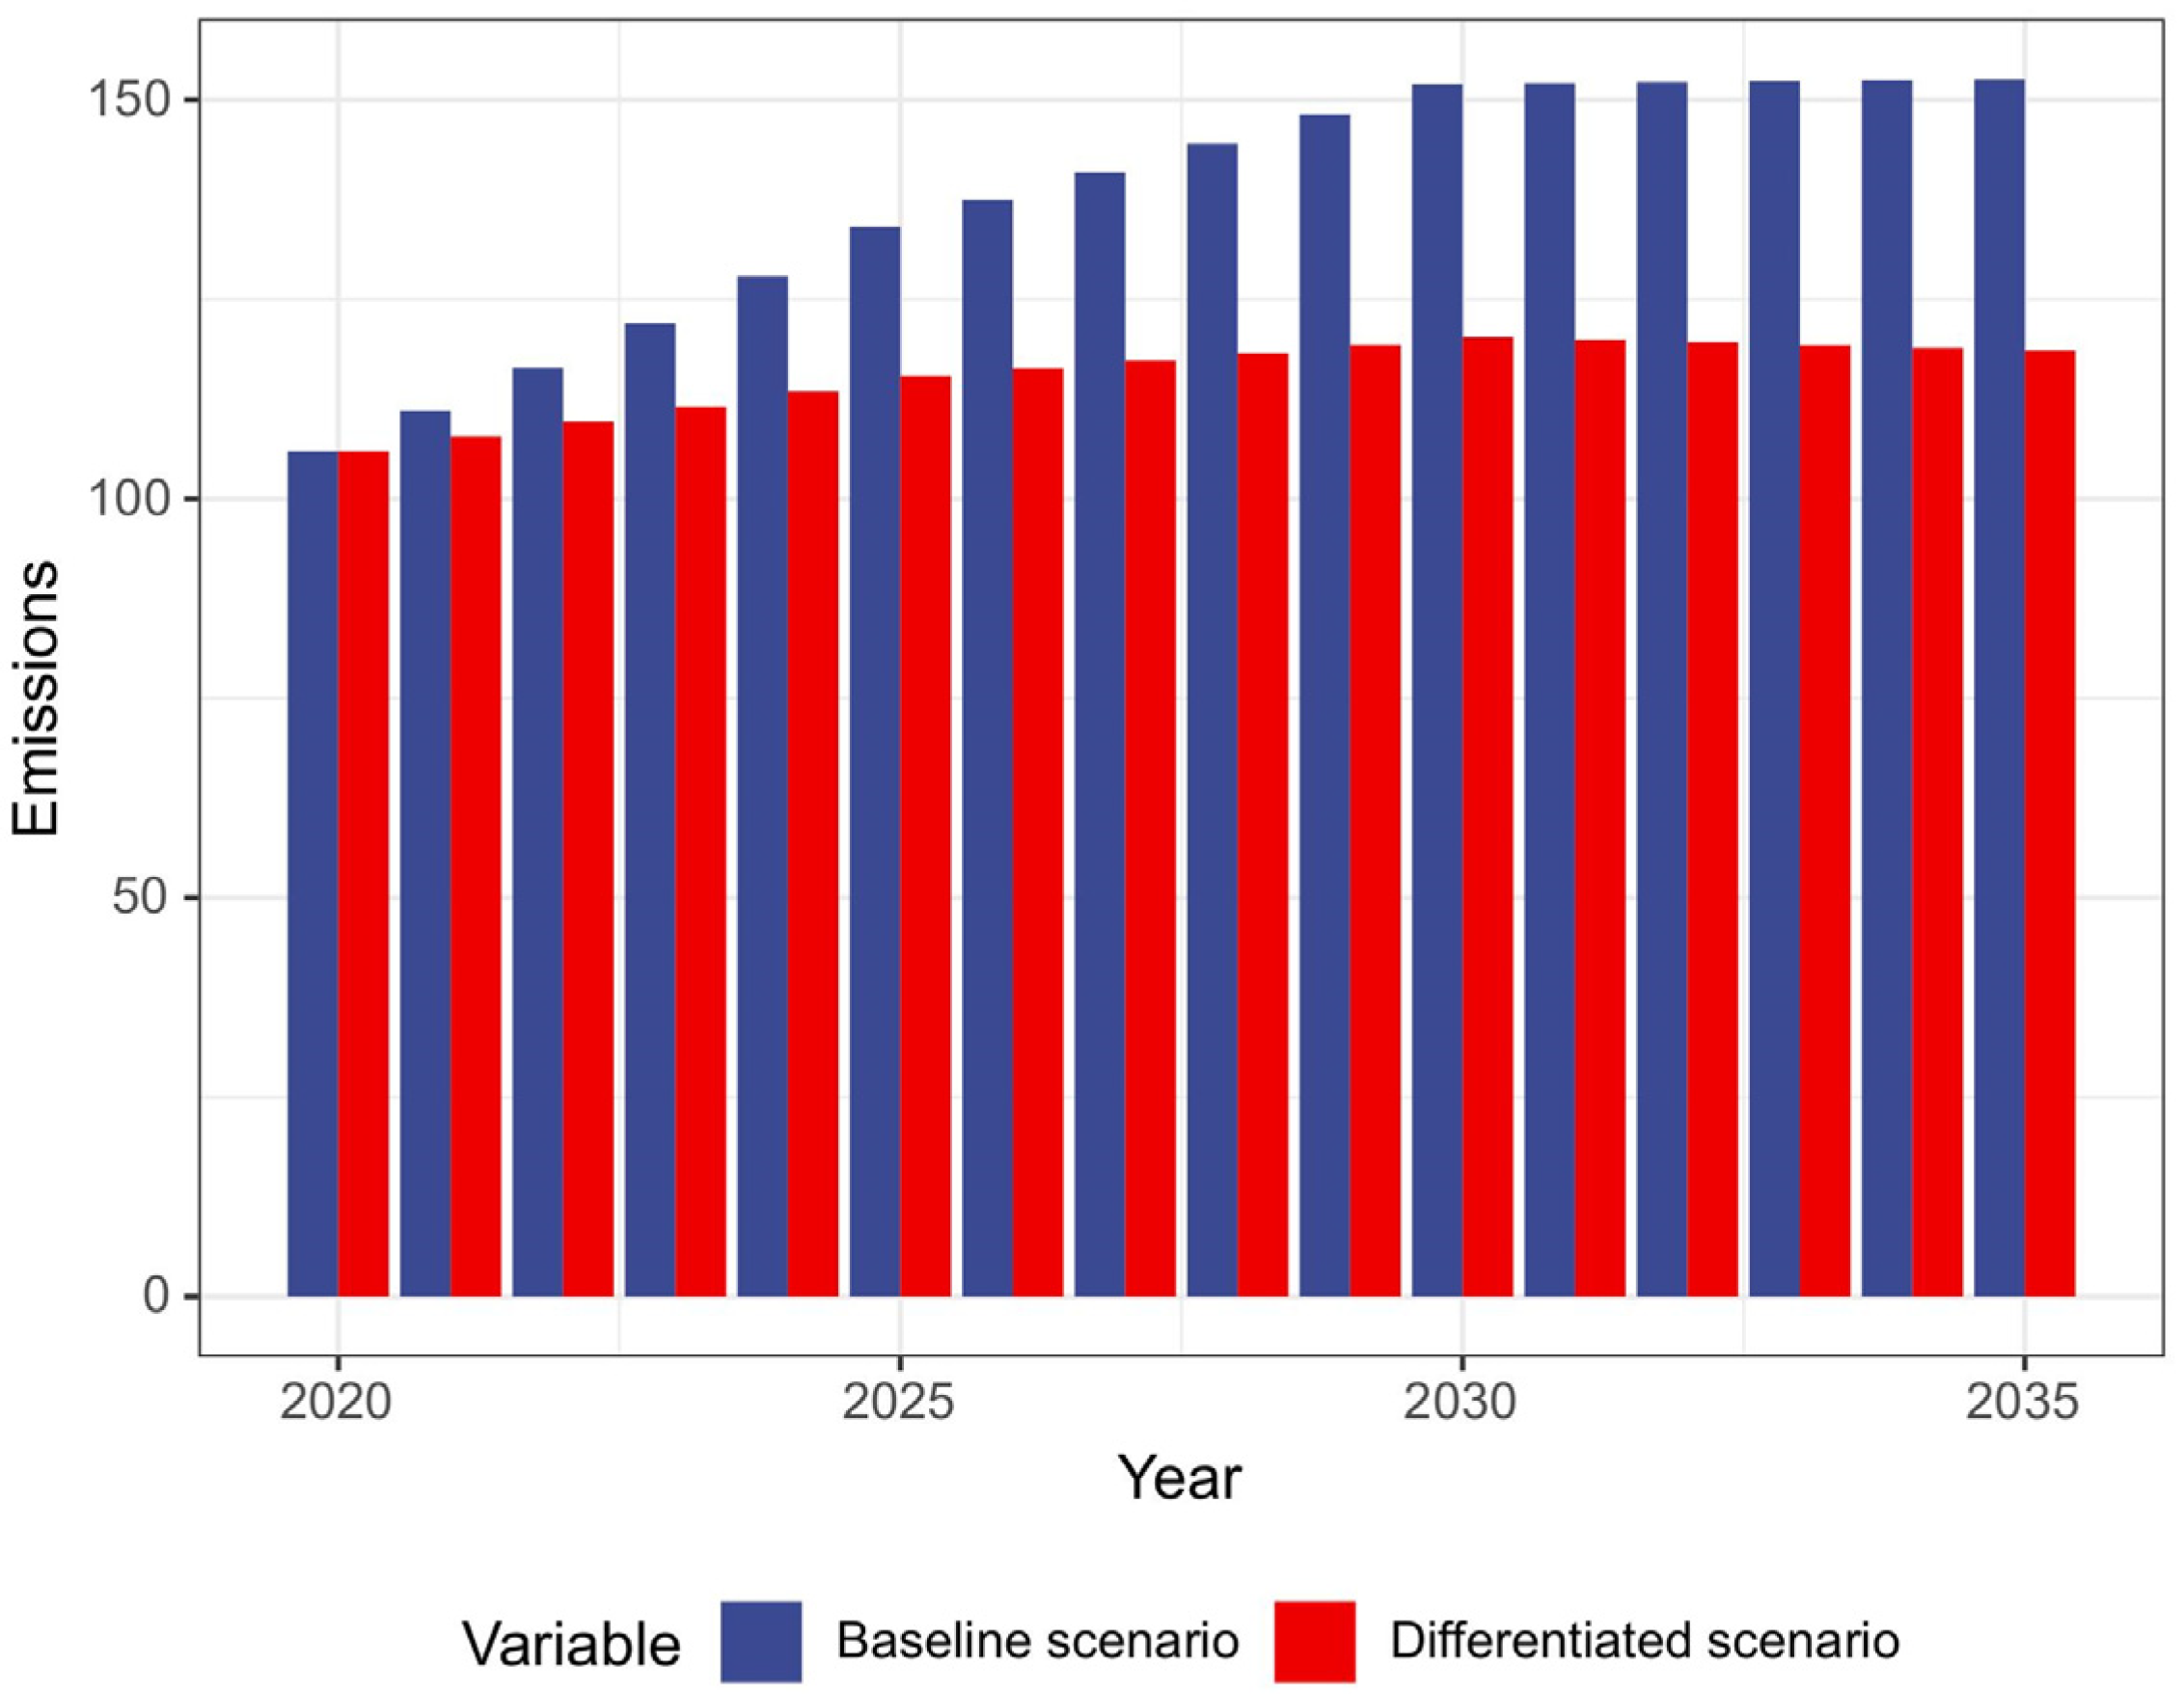
The results of the China urban carbon emission trends experiment suggest that, without enhanced carbon control and reduction efforts, the goal of reaching the country’s carbon peak by 2030 will be difficult to achieve. This finding is in line with those of [57]. According to urban characteristics, Chinese cities can be classified as eco-agricultural, industry-led, high-resource-availability, and resource-poor cities. Considering that there are significant differences between different types of cities, their abatement strategies may also vary. However, in the analysis, it was found that the heterogeneity of these cities can be explained, which justifies the results of the study. This study found that two important factors contributing to city heterogeneity are population and GDP per capita, which have only positive effects on carbon emissions. This finding is consistent with most studies [58,59]. However, energy efficiency, urbanization rate, and industrial structure exert different degrees of positive or negative influence on the carbon emissions of cities. Furthermore, the predicted results from carbon peaking found that, even with differentiated carbon control, resource-poor cities will still fail to achieve carbon peaking. This suggests that such cities have more difficulties in developing emission reduction strategies.
Based on the analysis and discussion of the research results, further suggestions can be explored.
Eco-agricultural cities need to make some necessary adjustments in their future carbon reduction actions. First, reform of the household registration system needs to be accelerated in order to facilitate population mobility and resource allocation between urban and rural areas. This will allow for a more rational layout of public resources, such as education and health, in cities and towns, as well as ensure equity in education and provide more development opportunities for farmers moving to cities. It is worth mentioning that population is the main factor affecting carbon emissions, but carbon emissions should not be controlled by suppressing population growth, which is not scientific. Therefore, consumption culture and structure can be further optimized so as to promote a low-carbon lifestyle. Second, in order to promote carbon emission reduction in eco-agricultural cities, an innovative industrial system needs to be developed. By formulating moderate support policies, leading industries with special characteristics, such as tourism and organic food industries, can be cultivated. Such an industrial model can not only connect with the primary and tertiary industries but also promote intra-industry division of labor, active innovation, and positive interaction to form a healthy intra-industry ecosystem. This can effectively promote the economic development of the city, while also reducing carbon emissions. Third, in order to transform the eco-agricultural city into a green ecosystem, carbon emissions from agriculture and animal husbandry need to be controlled. Carbon emissions from agriculture and animal husbandry can be reduced by promoting advanced agricultural technologies and management methods and optimizing land use and planting structures. In addition, it is also necessary to cultivate residents’ awareness of energy conservation and environmental protection to reduce carbon emissions in their lives. This can be achieved through publicity and education, demonstration and leadership, and policy guidance, which can raise residents’ awareness of environmental protection and further improve energy efficiency, thereby effectively reducing carbon emissions.
Industry-led cities have significantly higher GDP per capita than other types of cities because these cities have more industries, especially manufacturing. They provide strong support for the cities’ economic development. These cities typically have more international trade and foreign direct investment, which also contribute to their economic strength and international status. However, this economic model has also led to serious environmental problems, including air pollution, water pollution, and land degradation. In the future, we need to take a series of measures to mitigate these environmental problems. First, people should be guided to adopt a low-carbon lifestyle, which can be achieved through active guidance from government departments. The government should promote the concept of environmental protection among the public and educate residents on how to adopt a low-carbon lifestyle, such as cycling, walking, using public transportation, and reducing meat consumption. In addition, the government should encourage companies to produce and sell low-carbon products to reduce carbon emissions. Second, we need to optimize the industrial structure and set strict carbon control standards and evolution timelines. The government should take measures to limit the production of high-energy-consuming and high-polluting enterprises or even close these enterprises to reduce carbon emissions. In addition, the government should encourage the use of clean energy, such as solar and wind energy, to reduce the reliance on electricity and increase the share of green power employed. In order to achieve this goal, the government should also increase research, development, and promotion regarding clean power generation technologies. Finally, the government should develop financial subsidies to encourage consumers to purchase low-carbon products and services. These subsidies can serve as a push-back mechanism to force manufacturers to produce and offer energy-efficient, green, and low-carbon products, thereby accelerating the development of a low-carbon economy. In conclusion, the joint efforts of the government, enterprises, and the public are needed to alleviate the environmental problems in industry-dominated cities.
High-resource-availability cities typically use specific natural resources to generate revenue. While this type of development can bring short-term economic benefits to cities, it can also have negative environmental and climate impacts in the long run. Therefore, in order to reduce emissions and control carbon, these cities need to take the following actions. First, they need to take measures to intensively develop local resources and achieve a scale of resource utilization. This can be achieved by establishing environmentally friendly technologies and improving the efficiency of resource use. For example, cities can adopt new technologies, such as smart manufacturing and digital technologies, to improve resource use efficiency. In addition, cities can promote low-carbon urban planning from the perspective of revitalizing the stock. This would include measures such as building new green buildings and promoting low-carbon transportation. Second, cities need to upgrade outdated industries and industries that rely on local resources for development while also developing green mining and fostering alternative industries. This will help industries to transform and reduce carbon emissions while also helping the development of the service sector. To achieve this goal, China is actively improving traditional manufacturing processes and bringing in relevant talent to improve the technological content and efficiency of the industry. Third, companies can improve logistics management and optimize transportation routes to improve transportation efficiency and reduce carbon emissions. As mentioned above, resource-dependent cities need to take a variety of measures to reduce emissions and control carbon, including intensive development of local resources, improving traditional manufacturing processes, and changing traditional transportation methods. These strategies can effectively reduce the carbon emissions of resource-dependent cities.
Resource-poor cities face the dual task of achieving economic development and improving the quality of life of their residents under the goal of carbon peaking. However, these cities are relatively economically backward, and the problems of population loss and unemployment are more prominent. If these cities are excessively constrained, it may lead to the limitation of their economic development and, more seriously, aggravate the problems of population loss and unemployment, which will negatively affect the quality of life of local residents. Therefore, in future efforts to reduce emissions and control carbon, the government can appropriately relax the constraints on carbon emissions in these types of cities. This means that these cities can be given some room for carbon emission growth and flexible peak hours to prioritize economic development and address population loss and unemployment. In this way, these cities should be able to achieve a balance between economic development and environmental protection, improving the quality of life of local residents while also easing the pressure to meet carbon peak targets. Once the economies of these cities have been properly developed and supported, the government can then gradually tighten its control over their carbon emissions. It is worth mentioning that, when the government relaxes carbon emission constraints, it will also need to establish a sound regulatory system and institutional mechanism to ensure a balance between economic development and environmental protection in these cities. Only in this way can we achieve a win-win situation for both sustainable economic development and environmental protection.
This study established different carbon control scenarios, which led to the formation of differentiated recommendations for carbon emission reduction in cities. Emissions reduction can be achieved through the control constraints on the influencing factors affecting carbon emissions in each given scenario. The focus with regard to carbon emission trends in Chinese cities should be on different planning points depending on each city’s characteristics. For cities with better urban resources and infrastructure, the exploration of carbon decoupling pathways should be accelerated to steer in the direction of a green economy while maintaining steady economic growth. For cities with a predominantly traditional primary and tertiary sector, low-carbon development should be reconciled with economic growth and population. For cities in the late stages of industrialization, the use of high-carbon-emission energy sources should be restricted. The transformation of the energy mix should also be strengthened to achieve a basic and comprehensive improvement in quality and optimization. Cities with economic growth that depends on local resources should control the practice of blind and rough urban expansion. Plans should be put in place for a low-carbon industrial system, and low-carbon transport construction should be increased and strengthened. In addition, cities that are lagging behind in economic development and lacking in basic conditions should implement a lenient management policy to accomplish a moderate transfer of carbon emission rights. It is necessary to encourage the exchange of carbon emissions for economic development and social progress, but this should be undertaken on the basis of low and manageable growth in carbon emissions. Through differentiated policy control, the overall carbon goal for China’s cities can be achieved.

5. Conclusions

This study classifies cities according to their carbon emission characteristics and proposes differentiated carbon control strategies based on the results. Most previous studies only analyze the carbon emission characteristics of cities or propose emission reduction strategies with carbon peaking as the goal. No studies have pointed out that carbon peaking is the target and proposed differentiated emission reduction strategies from the perspective of the carbon emission characteristics of cities. This study combines the two aspects to propose more targeted emission reduction strategies based on the common problems of cities. This study uses data from 340 Chinese cities from 2020 to propose differentiated emission reduction strategies using a classification followed by projection approach.
The main findings of this study are as follows:
  • The drivers of carbon emissions affecting Chinese cities are population, GDP per capita, energy efficiency, urbanization, and industrial structure. According to the regression results, different types of cities have different carbon emission factors, and future carbon emission trends are characterized by these differences;
  • Based on the degree of variation in carbon emission factors and trends in different cities, the 340 Chinese cities were classified in this study into four types regarding carbon emission attainment: eco-agricultural cities, industry-led cities, high-resource-availability cities, and resource-poor cities;
  • A carbon emission trend forecasting model was established. The coefficients of the variables for different types of cities were derived from the results of ridge regression in order to build a prediction model for carbon emission trends based on city characteristics;
  • The scenario analysis showed that, under the baseline scenario, Chinese cities will not be able to meet their carbon peak targets by 2030. Under the differentiated carbon control scenario, eco-agricultural, industry-led, and resource-dependent cities will be able to peak in 2030, with lower total carbon emissions. In this scenario, resource-poor cities will not peak. However, the total amounts of carbon emissions and all indicators for resource-poor cities are at low levels. They contribute very little to the achievement of the national target, which basically allows for a continuous increase in carbon emissions in exchange for increases in economic development and urbanization, as well as improvements in industrial structure. The results of the projections of carbon emission trends in cities showed that, as a whole, China has a huge amount of work to do to achieve the ambitious goal of reaching peak carbon by 2030. However, differentiated and targeted carbon control targets can be controlled according to the different types of cities, with a view to minimizing the negative impact of reducing carbon emissions on urban development in the short term.
In this paper, corresponding carbon control strategies are developed according to four categories of Chinese cities with different characteristics. It can be used as a reference for national policymakers to develop relevant strategies. Our study also summarizes the common problems that need to be addressed by the government to help policymakers explore the key issues. Second, this paper identifies national-level targets, and our research can help policymakers develop corresponding low-carbon strategies based on actual urban conditions. In addition, this paper provides a basis for policymakers.
However, this paper also has certain limitations that need to be addressed in future studies. This study only considered the common problems of each type of city in the characterization, thus neglecting the small differences between each city. Future research can incorporate more influencing factors into the study of city characteristics in order to propose more precise and differentiated mitigation strategies.

Author Contributions

Conceptualization, H.Z., R.W. and Y.Z.; methodology, Y.Z. and X.Y.; software and validation, Y.Z. and X.Y.; formal analysis and investigation, Y.Z.; resources and data curation, Y.Z. and X.Y.; writing—original draft preparation, Y.Z.; writing—review and editing, visualization and supervision, Y.Z. and R.W.; project administration and funding acquisition, H.Z. and R.W. All authors have read and agreed to the published version of the manuscript.

Funding

This research was funded by the National Natural Science Foundation of China, grant numbers 52078328 and 52208073.

Institutional Review Board Statement

Not applicable.

Informed Consent Statement

Not applicable.

Data Availability Statement

The data were taken from the China City Greenhouse Gas Working Group (http://www.cityghg.com/toArticleDetail?id=203) [accessed on 1 January 2023] and the China City Statistical Yearbook. The data in this paper can be obtained from the authors.

Conflicts of Interest

The authors declare no conflict of interest.

References

  1. Fang, K.; Li, C.; Tang, Y.; He, J. China’s pathways to peak carbon emissions: New insights from various industrial sectors. Appl. Energy 2022, 306, 118039. [Google Scholar] [CrossRef]
  2. Zhang, Y.; Wang, F.; Zhang, B. The impacts of household structure transitions on household carbon emissions in China. Ecol. Econ. 2023, 206, 107734. [Google Scholar] [CrossRef]
  3. Liu, C.; Sun, W.; Li, P.; Zhang, L.; Li, M. Differential characteristics of carbon emission efficiency and coordinated emission reduction pathways under different stages of economic development: Evidence from the Yangtze River Delta, China. J. Environ. Manag. 2023, 330, 117018. [Google Scholar] [CrossRef] [PubMed]
  4. Zhou, C.; Wang, S. Examining the determinants and the spatial nexus of city-level CO2 emissions in China: A dynamic spatial panel analysis of China’s cities. J. Clean. Prod. 2018, 171, 917–926. [Google Scholar] [CrossRef]
  5. Liu, K.; Xue, Y.; Chen, Z.; Miao, Y.; Shi, J. Economic spatial structure of China’s urban agglomerations: Regional differences, distribution dynamics, and convergence. Sustain. Cities Soc. 2022, 87, 104253. [Google Scholar] [CrossRef]
  6. Zhao, C.; Wang, K.; Dong, K. How does innovative city policy break carbon lock-in? A spatial difference-in-differences analysis for China. Cities 2023, 136, 104249. [Google Scholar] [CrossRef]
  7. Anwar, A.; Malik, S. Cogitating the role of technological innovation and institutional quality on environmental degradation in G-7 countries. Int. J. Green Econ. 2021, 15, 213–232. [Google Scholar] [CrossRef]
  8. Syed, Q.R.; Bhowmik, R.; Adedoyin, F.F.; Alola, A.A.; Khalid, N. Do economic policy uncertainty and geopolitical risk surge CO2 emissions? New insights from panel quantile regression approach. Environ. Sci. Pollut. Res. 2022, 29, 27845–27861. [Google Scholar] [CrossRef]
  9. Zeng, S.; Jin, G.; Tan, K.; Liu, X. Can low-carbon city construction reduce carbon intensity? Empirical evidence from low-carbon city pilot policy in China. J. Environ. Manag. 2023, 332, 117363. [Google Scholar] [CrossRef]
  10. Yang, G.; Zhang, G.; Gao, D.; Zha, D.; Su, B. China’s ambitious low-carbon goals require fostering city-level renewable energy transitions. iScience 2023, 26, 106263. [Google Scholar] [CrossRef]
  11. Zhao, L.; Zhao, T.; Yuan, R. Scenario simulations for the peak of provincial household CO2 emissions in China based on the STIRPAT model. Sci. Total Environ. 2022, 809, 151098. [Google Scholar] [CrossRef]
  12. Xie, P.; Liao, J.; Pan, X.; Sun, F. Will China’s carbon intensity achieve its policy goals by 2030? Dynamic scenario analysis based on STIRPAT-PLS framework. Sci. Total Environ. 2022, 832, 155060. [Google Scholar] [CrossRef]
  13. Tong, Y.; Wang, K.; Liu, J.; Zhang, Y.; Gao, J.; Dan, M.; Yue, T.; Zuo, P.; Zhao, Z. Refined assessment and decomposition analysis of carbon emissions in high-energy intensive industrial sectors in China. Sci. Total Environ. 2023, 872, 162161. [Google Scholar] [CrossRef]
  14. Ji, Y.; Dong, J.; Jiang, H.; Wang, G.; Fei, X. Research on carbon emission measurement of Shanghai expressway under the vision of peaking carbon emissions. Transp. Lett. 2022, 1–15. [Google Scholar] [CrossRef]
  15. Li, K.; Lin, B. Impacts of urbanization and industrialization on energy consumption/CO2 emissions: Does the level of development matter? Renew. Sustain. Energy Rev. 2015, 52, 1107–1122. [Google Scholar] [CrossRef]
  16. Zhang, C.; Tan, Z. The relationships between population factors and China’s carbon emissions: Does population aging matter? Renew. Sustain. Energy Rev. 2016, 65, 1018–1025. [Google Scholar] [CrossRef]
  17. Sarkodie, S.A.; Strezov, V. Effect of foreign direct investments, economic development and energy consumption on greenhouse gas emissions in developing countries. Sci. Total Environ. 2019, 646, 862–871. [Google Scholar] [CrossRef]
  18. Balsalobre-Lorente, D.; Shahbaz, M.; Roubaud, D.; Farhani, S. How economic growth, renewable electricity and natural resources contribute to CO2 emissions? Energy Policy 2018, 113, 356–367. [Google Scholar] [CrossRef]
  19. Jia, J.; Deng, H.; Duan, J.; Zhao, J. Analysis of the major drivers of the ecological footprint using the STIRPAT model and the PLS method—A case study in Henan Province, China. Ecological Economics 2009, 68, 2818–2824. [Google Scholar] [CrossRef]
  20. Huo, T.; Xu, L.; Liu, B.; Cai, W.; Feng, W. China’s commercial building carbon emissions toward 2060: An integrated dynamic emission assessment model. Applied Energy 2022, 325, 119828. [Google Scholar] [CrossRef]
  21. Vélez-Henao, J.-A.; Vivanco, D.F.; Hernández-Riveros, J.-A. Technological change and the rebound effect in the STIRPAT model: A critical view. Energy Policy 2019, 129, 1372–1381. [Google Scholar] [CrossRef]
  22. Wen, L.; Shao, H. Influencing factors of the carbon dioxide emissions in China’s commercial department: A non-parametric additive regression model. Sci. Total Environ. 2019, 668, 1–12. [Google Scholar] [CrossRef] [PubMed]
  23. Zhou, Y.; Liu, Y.; Wu, W.; Li, Y. Effects of rural–urban development transformation on energy consumption and CO2 emissions: A regional analysis in China. Renew. Sustain. Energy Rev. 2015, 52, 863–875. [Google Scholar] [CrossRef]
  24. Sheng, P.; Guo, X. The Long-run and Short-run Impacts of Urbanization on Carbon Dioxide Emissions. Econ. Model. 2016, 53, 208–215. [Google Scholar] [CrossRef]
  25. Xu, R.; Lin, B. Why are there large regional differences in CO2 emissions? Evidence from China’s manufacturing industry. J. Clean. Prod. 2017, 140, 1330–1343. [Google Scholar] [CrossRef]
  26. Liu, Y.; Xiao, H.; Lv, Y.; Zhang, N. The effect of new-type urbanization on energy consumption in China: A spatial econometric analysis. J. Clean. Prod. 2017, 163, S299–S305. [Google Scholar] [CrossRef]
  27. Liu, L.-C.; Cao, D.; Wei, Y.-M. What drives intersectoral CO2 emissions in China? J. Clean. Prod. 2016, 133, 1053–1061. [Google Scholar] [CrossRef]
  28. Ji, X.; Chen, B. Assessing the energy-saving effect of urbanization in China based on stochastic impacts by regression on population, affluence and technology (STIRPAT) model. J. Clean. Prod. 2017, 163, S306–S314. [Google Scholar] [CrossRef]
  29. Yang, L.; Xia, H.; Zhang, X.; Yuan, S. What matters for carbon emissions in regional sectors? A China study of extended STIRPAT model. J. Clean. Prod. 2018, 180, 595–602. [Google Scholar] [CrossRef]
  30. Wu, L.; Kaneko, S.; Matsuoka, S. Dynamics of energy-related CO2 emissions in China during 1980 to 2002: The relative importance of energy supply-side and demand-side effects. Energy Policy 2006, 34, 3549–3572. [Google Scholar] [CrossRef]
  31. Zhang, S.; Zhao, T. Identifying major influencing factors of CO2 emissions in China: Regional disparities analysis based on STIRPAT model from 1996 to 2015. Atmos. Environ. 2019, 207, 136–147. [Google Scholar] [CrossRef]
  32. Tan, X.; Lai, H.; Gu, B.; Zeng, Y.; Li, H. Carbon emission and abatement potential outlook in China’s building sector through 2050. Energy Policy 2018, 118, 429–439. [Google Scholar] [CrossRef]
  33. Zhao, Y.; Su, Q.; Li, B.; Zhang, Y.; Wang, X.; Zhao, H.; Guo, S. Have those countries declaring “zero carbon” or “carbon neutral” climate goals achieved carbon emissions-economic growth decoupling? J. Clean. Prod. 2022, 363, 132450. [Google Scholar] [CrossRef]
  34. York, R.; Rosa, E.A.; Dietz, T. STIRPAT, IPAT and ImPACT: Analytic tools for unpacking the driving forces of environmental impacts. Ecol. Econ. 2003, 46, 351–365. [Google Scholar] [CrossRef]
  35. Danish, B.O.; Ulucak, R. An empirical investigation of nuclear energy consumption and carbon dioxide (CO2) emission in India: Bridging IPAT and EKC hypotheses. Nucl. Eng. Technol. 2021, 53, 2056–2065. [Google Scholar] [CrossRef]
  36. Chen, X.; Shuai, C.; Wu, Y.; Zhang, Y. Analysis on the carbon emission peaks of China’s industrial, building, transport, and agricultural sectors. Sci. Total Environ. 2020, 709, 135768. [Google Scholar] [CrossRef]
  37. Liu, D.; Xiao, B. Can China achieve its carbon emission peaking? A scenario analysis based on STIRPAT and system dynamics model. Ecol. Indic. 2018, 93, 647–657. [Google Scholar] [CrossRef]
  38. Wu, J.; Mohamed, R.; Wang, Z. An Agent-Based Model to Project China’s Energy Consumption and Carbon Emission Peaks at Multiple Levels. Sustainability 2017, 9, 893. [Google Scholar] [CrossRef]
  39. Zheng, H.; Hu, J.; Wang, W. When Will 100 Chinese Cities Reach Peak Carbon? China Popul. Resour. Environ. 2016, 26, 48–54. [Google Scholar]
  40. Chen, S.; Yao, S.; Xue, C. Identifying carbon emission characteristics and carbon peak in China based on the perspective of regional clusters. Environ. Sci. Pollut. Res. 2023, 30, 30700–30713. [Google Scholar] [CrossRef]
  41. Shi, Q.; Liang, Q.; Wang, J.; Huo, T.; Gao, J.; You, K.; Cai, W. Dynamic scenario simulations of phased carbon peaking in China’s building sector through 2030–2050. Sustain. Prod. Consum. 2023, 35, 724–734. [Google Scholar] [CrossRef]
  42. Zhang, J.; Yan, Z.; Bi, W.; Ni, P.; Lei, F.; Yao, S.; Lang, J. Prediction and scenario simulation of the carbon emissions of public buildings in the operation stage based on an energy audit in Xi’an, China. Energy Policy 2023, 173, 113396. [Google Scholar] [CrossRef]
  43. Huo, T.; Ma, Y.; Xu, L.; Feng, W.; Cai, W. Carbon emissions in China’s urban residential building sector through 2060: A dynamic scenario simulation. Energy 2022, 254, 124395. [Google Scholar] [CrossRef]
  44. Ma, H.; Sun, W.; Wang, S.; Kang, L. Structural contribution and scenario simulation of highway passenger transit carbon emissions in the Beijing-Tianjin-Hebei metropolitan region, China. Resour. Conserv. Recycl. 2019, 140, 209–215. [Google Scholar] [CrossRef]
  45. Song, M.; Wang, S.; Yu, H.; Yang, L.; Wu, J. To reduce energy consumption and to maintain rapid economic growth: Analysis of the condition in China based on expended IPAT model. Renew. Sustain. Energy Rev. 2011, 15, 5129–5134. [Google Scholar] [CrossRef]
  46. Dietz, T.; Rosa, E.A. Effects of population and affluence on CO2 emissions. Proc. Natl. Acad. Sci. USA 1997, 94, 175–179. [Google Scholar] [CrossRef]
  47. Cui, W.; Lin, X.; Wang, D.; Mi, Y. Urban Industrial Carbon Efficiency Measurement and Influencing Factors Analysis in China. Land 2022, 12, 26. [Google Scholar] [CrossRef]
  48. Shuai, C.; Shen, L.; Jiao, L.; Wu, Y.; Tan, Y. Identifying key impact factors on carbon emission: Evidences from panel and time-series data of 125 countries from 1990 to 2011. Appl. Energy 2017, 187, 310–325. [Google Scholar] [CrossRef]
  49. Wang, C.-H.; Chen, N.; Chan, S.-L. A gravity model integrating high-speed rail and seismic-hazard mitigation through land-use planning: Application to California development. Habitat Int. 2017, 62, 51–61. [Google Scholar] [CrossRef]
  50. Manochandar, S.; Punniyamoorthy, M.; Jeyachitra, R.K. Development of new seed with modified validity measures for k-means clustering. Comput. Ind. Eng. 2020, 141, 106290. [Google Scholar] [CrossRef]
  51. Statistics (NBS), N.B.o. China Statistical Yearbook; 2021. Available online: http://www.stats.gov.cn/ (accessed on 3 January 2023).
  52. EIA. International Energy Outlook. 2021. Available online: https://hfbfha90afc5c02954637svpu6un5c0cv06x5kfgac.eds.tju.edu.cn/outlooks/ieo/tables_side_pdf.php (accessed on 6 December 2022).
  53. Commission, N.D.a.R. Data on Development and Reform; 2013. Available online: https://www.ndrc.gov.cn/fgsj/tjsj/ssjj/index_4.html (accessed on 6 December 2022).
  54. Group (WBG), W.B. World Development Report. 2012. Available online: https://www.worldbank.org/en/home (accessed on 15 November 2022).
  55. Yuan, J.; Xu, Y.; Hu, Z.; Zhao, C.; Xiong, M.; Guo, J. Peak energy consumption and CO2 emissions in China. Energy Policy 2014, 68, 508–523. [Google Scholar] [CrossRef]
  56. Zhou, S.; Wang, Y.; Yuan, Z.; Ou, X. Peak energy consumption and CO2 emissions in China’s industrial sector. Energy Strategy Rev. 2018, 20, 113–123. [Google Scholar] [CrossRef]
  57. Chen, X.; Meng, Q.; Shi, J.; Liu, Y.; Sun, J.; Shen, W. Regional Differences and Convergence of Carbon Emissions Intensity in Cities along the Yellow River Basin in China. Land 2022, 11, 1042. [Google Scholar] [CrossRef]
  58. Raftery, A.E.; Zimmer, A.; Frierson, D.M.W.; Startz, R.; Liu, P. Less than 2 degrees C warming by 2100 unlikely. Nat. Clim. Chang. 2017, 7, 637–641. [Google Scholar] [CrossRef]
  59. Lohwasser, J.; Schaffer, A.; Brieden, A. The role of demographic and economic drivers on the environment in traditional and standardized STIRPAT analysis. Ecol. Econ. 2020, 178, 106811. [Google Scholar] [CrossRef]
Figure 1. Experimental framework diagram.
Land 12 01129 g001
Figure 2. Results of elbow method.
Land 12 01129 g002
Figure 3. City clustering results.
Land 12 01129 g003
Figure 4. Various types of cities’ features.
Land 12 01129 g004
Figure 5. Projected trends in eco-agricultural cities.
Land 12 01129 g005
Figure 6. Forecast trends for industry-led cities.
Land 12 01129 g006
Figure 7. Projected trends in high-resource-availability cities.
Land 12 01129 g007
Figure 8. Projected trends in resource-poor cities.
Land 12 01129 g008
Figure 9. Trend for total city-wide carbon emissions.
Land 12 01129 g009
Table 1. Description of model variables.
VariableDefinitionUnit
Carbon emissions (I)Total carbon emissions from all sectorsMt
Population (P)Total populationMillion people
Affluence (A)GDP per capita104 CNY /person
Technology progress (T)GDP/total energy consumption carbon emissions104 CNY/tons
Urbanization (UR)City population size/total population%
Industrial structure (ST)Share of secondary sector%
Table 2. Sources of scenario-setting factors.
IndicatorsData Sources
Population (P)National Bureau of Statistics (2021b)
Affluence (A)NBS Yearbook (2016–2021); EIA
Technology progress (T)Outline of the Thirteenth Five-Year Plan for National Economic and Social Development of the People’s Republic of China
Urbanization (UR)National Development and Reform Commission (2013)
Industrial structure (ST)World Development Report
Table 3. Baseline scenario variable settings.
Variable2021–20252026–20302031–2035
P3.26%1.5%−0.5%
A5.99%4.2%3.56%
T4.4%3.4%3.4%
UR0.8%0.8%0.6%
ST−1.4%−1.6%−0.7%
Table 4. Differentiated scenario variable settings.
VariableCities Category2021–20252026–20302031–2035
PEco-agricultural cities3%1.5%0.5%
Industry-led cities1%0.5%−0.5%
High-resource-availability cities3%1%0.5%
Resource-poor cities5%3%1%
AEco-agricultural cities6.99%5.20%4.56%
Industry-led cities4.2%3.56%3.56%
High-resource-availability cities3%1%1%
Resource-poor cities6%5%4%
TEco-agricultural cities4.4%4.4%4.4%
Industry-led cities3.4%3.4%3.4%
High-resource-availability cities6%4.4%3.4%
Resource-poor cities4.4%3.4%3.4%
UREco-agricultural cities0.8%0.8%0.6%
Industry-led cities0.6%0.4%0.4%
High-resource-availability cities0.8%0.6%0.5%
Resource-poor cities0.8%0.8%0.6%
STEco-agricultural cities−1%−1%−0.5%
Industry-led cities−1.6%−1.4%−1%
High-resource-availability cities−0.5%−1.5%−1%
Resource-poor cities1.6%1%−0.7%
Table 5. Final cluster centers.
VariableCluster Center
Eco-Agricultural CitiesIndustry-Led CitiesHigh-Resource Availability-CitiesResource-Poor CitiesSig.
P1.441.460.322.750.000
A271.66635.23193.4448.770.000
T4.207.565.474.020.000
UR0.460.590.590.410.000
ST0.610.680.870.300.000
I1146.014626.753978.30147.050.000
Table 6. Clustering results for total carbon emissions.
Types of citiesNumberExamplesProportion
Eco-agricultural cities101Altai, Beihai, Guilin, Mudanjiang, Lincang, Jieyang, etc.29.80%
Industry-led cities114Baoji, Cangzhou, Beijing, Hangzhou, Chongqing, Shenzhen, Tianjin, etc.33.63%
High-resource-availability cities104Aksu, Baotou, Datong, Handan, Panzhihua, Zhoushan, etc.30.67%
Resource-poor cities20Aba City, Yushu, Linzhi, Lhasa, Sanya, Daxinganling, etc.5.89%
Table 7. Ridge regression coefficients and model test results.
SortConstantlnPlnAlnTlnURlnSTR2F
Eco-agricultural cities2.8260.6510.456−0.486−0.1560.0510.738F(5, 95) = 53.461, p = 0.000
Industry-led cities2.4080.7640.65−0.690.074−0.2280.843F(5, 108) = 115.715, p = 0.000
High-resource-availability cities0.7090.9080.986−0.862−0.098−0.650.942F(5, 98) = 319.309, p = 0.000
Resource-poor cities3.9510.3770.229−0.2040.523−0.0320.600F(5, 12) = 3.594, p = 0.032
Disclaimer/Publisher’s Note: The statements, opinions and data contained in all publications are solely those of the individual author(s) and contributor(s) and not of MDPI and/or the editor(s). MDPI and/or the editor(s) disclaim responsibility for any injury to people or property resulting from any ideas, methods, instructions or products referred to in the content.

