Article

Patterns, Trends, and Causes of Vegetation Change in the Three Rivers Headwaters Region

1
Key Laboratory of Terrestrial Surface Pattern and Simulation, Institute of Geographic Sciences and Natural Resources Research, Chinese Academy of Sciences, Beijing 100101, China
2
University of Chinese Academy of Sciences, Beijing 100049, China
*
Author to whom correspondence should be addressed.
Land 2023, 12(6), 1127; https://doi.org/10.3390/land12061127
Submission received: 28 March 2023 / Revised: 20 May 2023 / Accepted: 23 May 2023 / Published: 25 May 2023
(This article belongs to the Special Issue Ecosystem-Based Regional Planning)

Abstract

:
The Three Rivers Headwaters Region (TRHR), situated in the high-altitude region of the Tibetan Plateau, represents a critical ecological security barrier for both China and Southeast Asia. In addition to providing a vital freshwater supply for China, it is also one of the most biodiverse areas in the world. However, the region is characterized by a fragile and sensitive ecosystem, which makes it particularly vulnerable to environmental disturbances. Given the role of vegetation as a reliable indicator of ecosystem changes, investigating the patterns and drivers of vegetation change in the TRHR can provide valuable insights into the state and trajectory of its ecological system. To assess the spatiotemporal dynamics of vegetation changes in TRHR, this study constructed a comprehensive vegetation index (CVI) based on leaf area index (LAI), fractional vegetation cover (FVC), and net primary productivity (NPP). Trend analysis and significance testing were employed to detect and quantify the magnitude and direction of vegetation changes over the past two decades. Moreover, correlation analysis, spatial overlay, and statistical modeling techniques were applied to examine the relative contributions of climate, land use/cover changes, and slope altitude to CVI changes. The results showed the following: (1) the CVI in the TRHR showed an overall increasing trend from 2000 to 2019, with an average annual increase of 0.6%, indicating a positive development trend of vegetation, but with obvious spatial differences. (2) The vegetation in the TRHR has shown a marked increase over the past two decades, with significant increase accounting for 19% of the total area, mainly concentrated in the Yellow River Basin. Conversely, a significant decline in vegetation was observed in 3% of the total area, predominantly in the Yangtze River Basin. (3) Both temperature and precipitation had a positive impact on vegetation restoration in the TRHR, but the area affected by temperature was larger than that affected by precipitation. (4) The land-use regime had a discernible impact on vegetation increase, with the conversion of land use to ecological land promoting vegetation restoration. However, the efficacy of restoration efforts might have varied depending on natural resource endowments in certain regions. (5) With increasing altitude, vegetation conditions initially improved before eventually deteriorating. Conversely, as the slope increased, vegetation experienced an initial improvement before ultimately stabilizing. This study helps to understand the overall changes and driving mechanisms of vegetation in the TRHR and provides a scientific basis and decision-making reference for the dynamic adjustment of vegetation restoration and ecological engineering in the region in the future.

1. Introduction

Vegetation dynamically affects ecosystem services [1] including soil and water conservation, climate regulation, air purification, soil improvement [2,3], ecosystem health [4,5], regional or global ecological security [6], economic development, and human well-being [7]. However, existing research suggests that vegetation status and change are driven by a complexity of factors such as climate change, land use, altitude, slope, temperature, precipitation, soil carbon, and nitrogen [8,9,10,11,12,13] as well as fire risk [14], overgrazing and excessive mowing [15,16]. Accurate vegetation status mapping and analyses of impacts from different drivers in different climatic, human, and environmental setting are therefore necessary for effective ecological protection and restoration [17]. Therefore, research on vegetation change remains a hotspot in geography, ecology, and environmental science.
In recent years, with the continuous development and updating of remote sensing observation technology, large-scale, multi-scale vegetation change processes can be accurately characterized and analyzed [18,19,20]. Vegetation change is often analyzed using single or combined indices, such as Normalized Difference Vegetation Index (NDVI) [19,21,22], Leaf Area Index (LAI) [23,24], Fractional Vegetation Cover (FVC) [25,26], Net Primary Productivity (NPP), and Gross Primary Productivity (GPP), for long-term trend analysis at different scales [26,27,28,29,30]. In contrast to previous approaches that rely on a single vegetation index to assess vegetation change, the China Meteorological Administration has developed the Meteorological Vegetation Quality Index by combining fractional vegetation cover and net primary productivity to evaluate vegetation eco-logical quality in typical ecosystems and key ecological engineering areas in China [31,32,33,34,35]. The EQI ecosystem quality index, as specified in the Technical Specification for Investigation and Assessment of National Ecological Status-Ecosystem Quality Assessment environmental standard by China’s Ministry of Ecology and Environment, utilizes the relative density of FVC, LAI, and GPP to reflect the overall ecological quality of a region’s ecosystems. However, in the TRHR, which experiences high altitude and low temperature, the vegetation growth and survival conditions differ significantly. Therefore, relying solely on a single vegetation index may not accurately reflect the region’s actual vegetation conditions. Additionally, based on expert knowledge and experience, the relative density approach used to construct the EQI may not be appropriate in this region.
The TRHR is one of the most concentrated areas for nurturing large rivers in Asia and even the world, where the Yangtze River, Yellow River, and Lancang River originate. It is also one of the world’s most concentrated and rich regions for high-altitude biodiversity, known as the “water tower of China” and a natural gene pool of high-altitude biological resources. It is an important ecological security barrier for China and Southeast Asian countries’ ecological environment safety and sustainable economic development [36]. However, the TRHR is also an ecologically sensitive and vulnerable area [37,38]. Due to climate change and human activities, prominent ecological problems such as grassland degradation, soil erosion, lake reduction, and glacier shrinkage have occurred in the region [36]. In order to protect and enhance the ecosystem service functions of the TRHR, China established the Qinghai Three Rivers National Ecological Protection Comprehensive Pilot Zone in 2000 and implemented the first and second phases of the Three Rivers Source Ecological Protection and Construction Project, as well as a series of major eco-logical projects such as grassland restoration, cropland conversion to forest or grassland, and local protection ecological projects. However, vegetation restoration is a coupling effect of the socio-economic-ecological system, and its effectiveness is also influenced by many natural and socio-economic factors [39,40]. After the implementation of numerous ecological projects, what is the vegetation change status in the TRHR? Which regions still have vegetation degradation issues? What are the main influencing factors of vegetation change in the TRHR?
We first used the NDVI data provided by MODIS to calculate the vegetation cover data. Then, we constructed a comprehensive vegetation index (CVI) by combining the LAI and NPP data provided by MODIS. The Delphi method was employed to determine the weight coefficients of FVC, LAI, and NPP in the TRHR, which were used to derive the annual CVI for the area from 2000 to 2019. Trend analysis and significance tests were conducted to analyze the vegetation changes. The partial correlation method was used to explore the relationship between the CVI and temperature and precipitation, while the impact of factors such as land use, elevation, and slop on the CVI was also analyzed. This study contributes to an understanding of the overall vegetation changes and driving mechanisms in the TRHR, providing scientific evidence and decision-making references for the dynamic adjustment of future vegetation restoration and ecological engineering in the region.

2. Materials and Methods
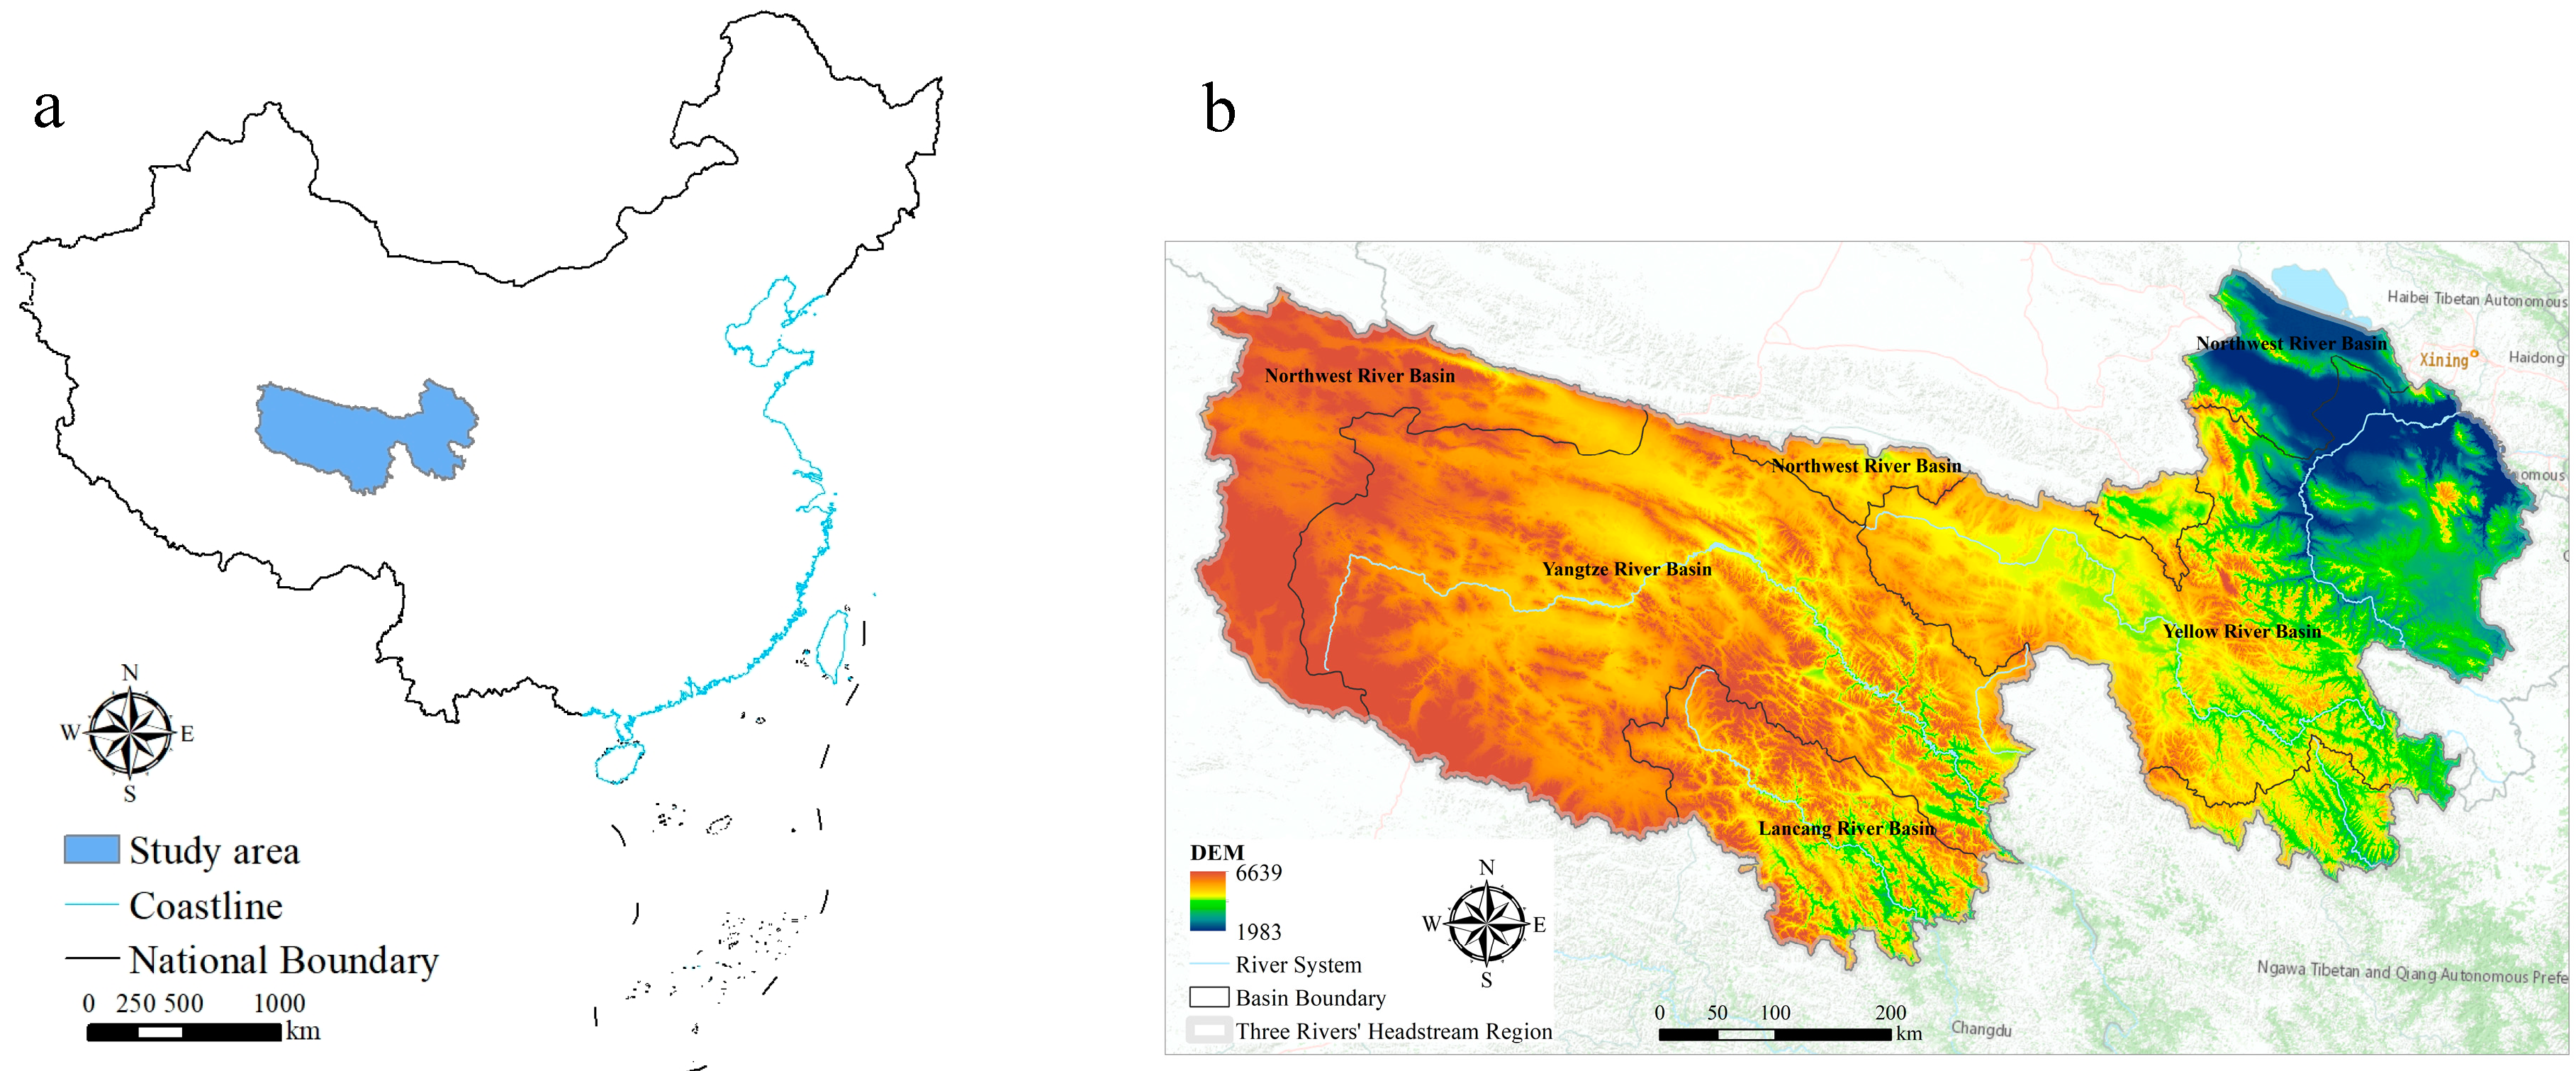
2.1. Study Area

The TRHR is located in the hinterland of the Qinghai-Tibet Plateau, at 31°39′~36°12′ N and 89°45′~102°23′ E, with a total area of 363,000 km2 [41] (Figure 1a). It is the headwater catchment of the Yangtze River, Yellow River, and Lancang River. The region is mainly composed of glacial, mountainous, high plateau, and hilly landscapes, situated in a frigid zone with an average altitude ranging from 3500 to 4800 m. The climate of the TRHR is a typical highland continental climate, characterized by alternations of cold and hot seasons, distinct dry and wet seasons, small annual temperature differences, large diurnal temperature ranges, long sunshine hours, strong radiation, and no significant seasonal climate variation. The annual average temperature ranges from −5.6 to 3.8 °C, annual precipitation ranges from 730 to 1700 mm, and sunshine hours range from 2300 to 2900 h. The TRHR is primarily composed of grasslands, followed by deserts and water and wetland. The grassland types, from southeast to northwest, are generally high altitude meadow, temperate grassland, high altitude steppe, and high altitude desert, with productivity gradually decreasing. This study divides the TRHR into the Yangtze River Basin (YTRB), Yellow River Basin (YLRB), Lancang River Basin (LCRB), and Northwestern Rivers Basin (NWRB) based on the watershed boundaries (Figure 1b).

2.2. Data and Processing

2.2.1. Vegetation Coverage

Using the MODIS MOD13Q1 NDVI data product with a time resolution of 16 days and a spatial resolution of 250 m from 2000 to 2019 (https://lpdaac.usgs.gov/products/mod13q1v061, accessed on 12 November 2022), format conversion, projection transformation, image stitching, and pre-processing such as Savitzky–Golay filtering were performed using the MRT tool provided by NASA and the TIMESAT tool. Based on the pixel dichotomy model and the maximum synthesis method, the 250 m vegetation coverage dataset was calculated, and the specific formula is as follows [42]:
F V C = N D V I N D V I m i n N D V I m a x N D V I m i n × 100 %
where FVC represents the vegetation coverage percentage (%); NDVImin is the NDVI value of the bare land pixel, which is taken as the NDVI value at the 5th percentile, and if lower than this value, it is replaced by the minimum value; NDVImax is the NDVI value of the pixel that is completely covered by vegetation, which is taken as the NDVI value at the 95th percentile, and if higher than this value, it is replaced by the maximum value. The ArcGIS 10.3 software was used with the nearest neighbor assignment method (NEAREST) in the resampling tool to obtain the 1 km resolution vegetation coverage dataset for the TRHR from 2000 to 2019.

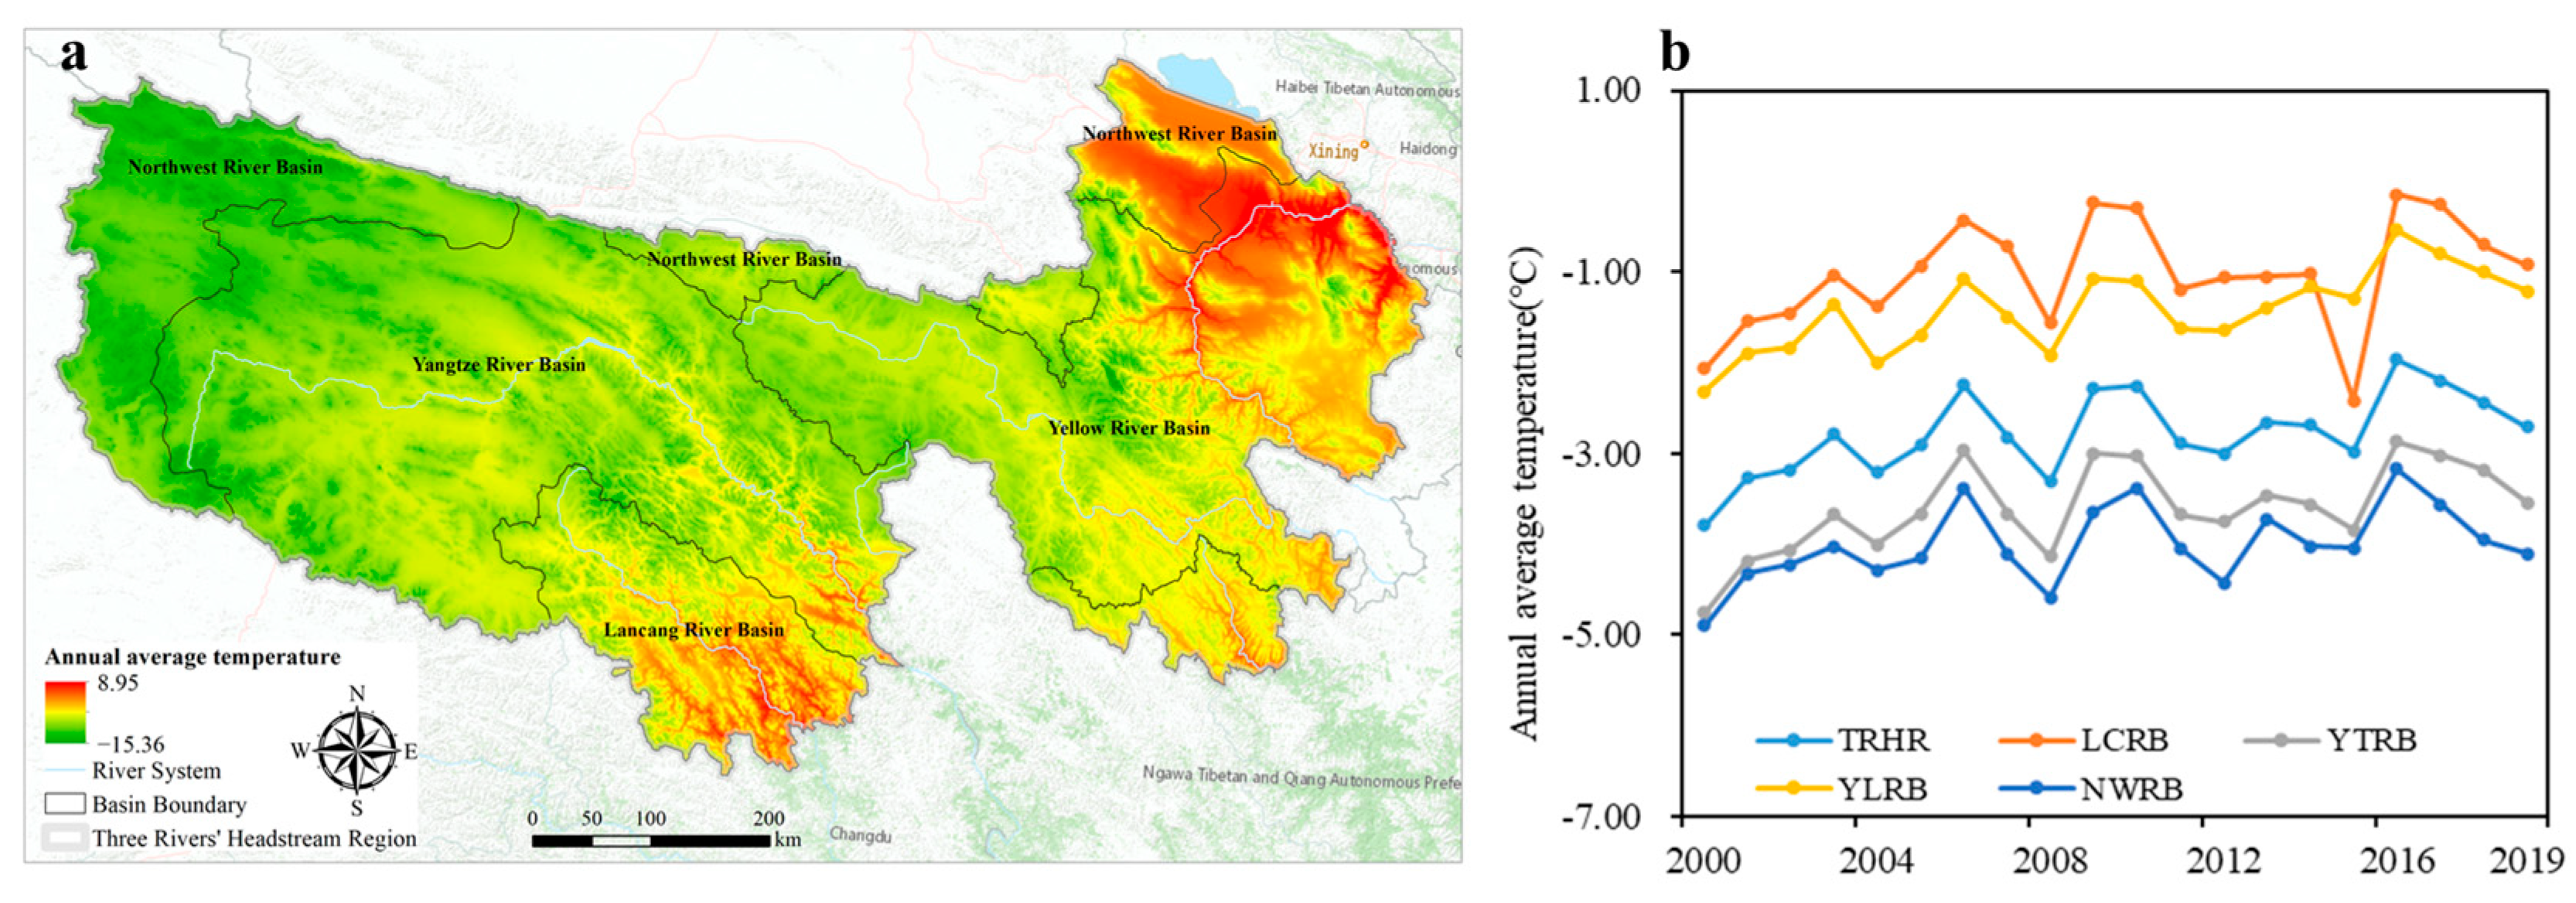
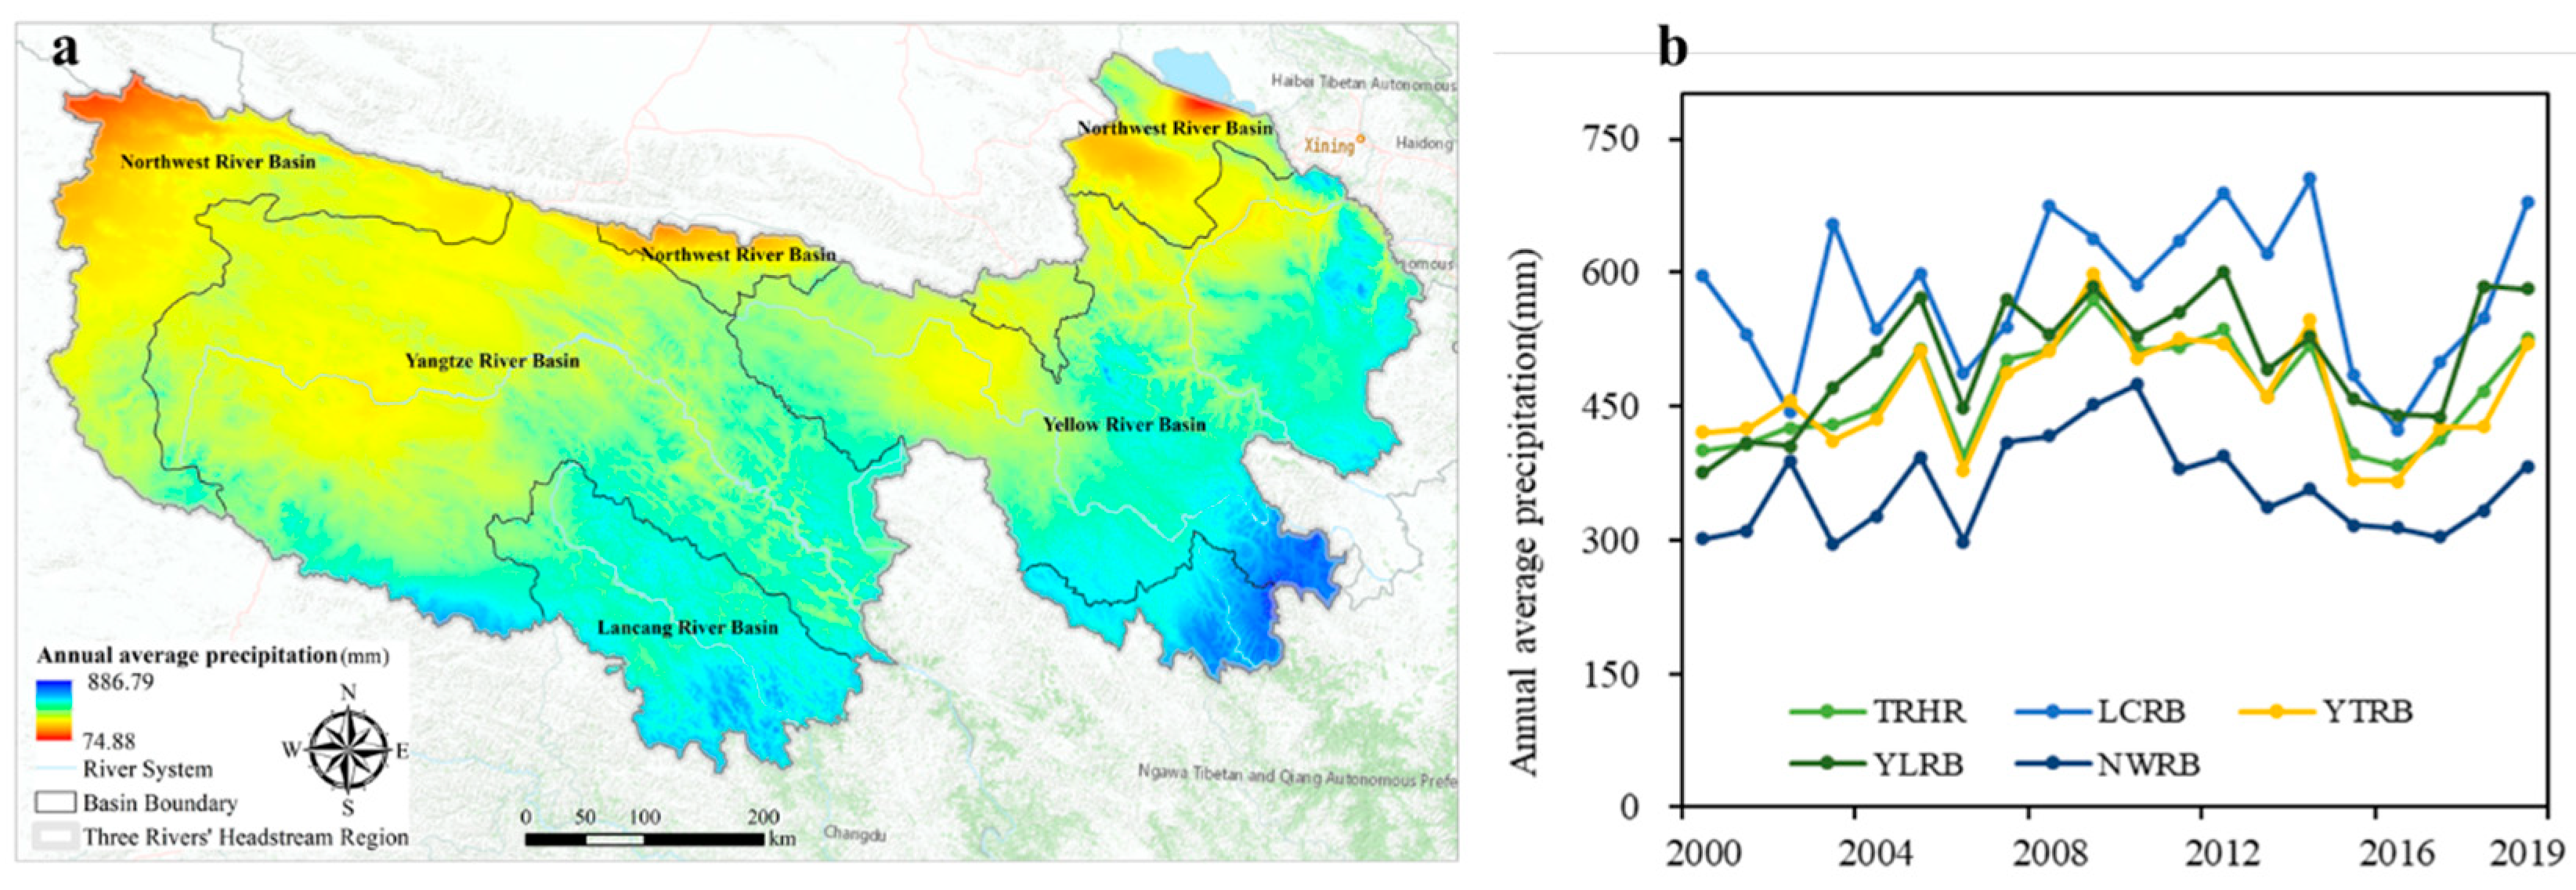
2.2.2. Meteorological Data

The temperature and precipitation data used in this study were obtained from the China Meteorological Data Service Center (http://data.cma.cn, accessed on 12 November 2022) and their shared dataset of daily ground-based climatic data for over 2400 meteorological stations in China from 1951 to 2020. The dataset includes daily values of meteorological elements such as temperature, precipitation, evaporation, and relative humidity. The annual average temperature and annual accumulated precipitation were calculated based on the data from the meteorological stations. The spatial distribution of temperature and precipitation data were interpolated using AUNSPLINE software(Version 4.3), which considered topographic factors during spatial interpolation. To improve the accuracy of precipitation spatial distribution, the 0.25° × 0.25° precipitation grid data provided by the National Meteorological Information Center and the ANUSPLIN-interpolated precipitation data were merged to obtain more accurate 1 km-scale precipitation spatial data.

2.2.3. Land Use/Cover Data

In the TRHR, the impact of human activities is mainly reflected in land use/cover change. The land use/cover data in the TRHR of 2000, 2005, 2010, 2015, and 2020 were used in this study. The data were obtained from the 1:100,000 land use/cover dataset of the Resource and Environment Science Data Center of the Chinese Academy of Sciences (https://www.resdc.cn, accessed on 20 November 2022). The land use/cover data of 2000, 2005, and 2010 were mainly based on Landsat-TM/ETM remote sensing image data, while those of 2015 and 2020 were based on Landsat 8 satellite remote sensing data. The basic land use/cover data were obtained through image processing including band extraction, false color synthesis, geometric correction, and image mosaic using ERDAS, ENVI, and ArcGIS software. The accuracy of the first-level land use type was verified to be above 90% through field validation [43,44]. Because the other data used in this study were from 2000 to 2019, and the land use data were collected every five years, the 2020 land use data were used for analysis.

2.2.4. Other Data

The Leaf Area Index (LAI) data used in this study were obtained from the MODIS MOD15A2H.061 data product (https://lpdaac.usgs.gov/products/mod15a2hv006, accessed on 22 November 2022), with a temporal resolution of 8 days and a spatial resolution of 500 m, covering the period from 2000 to 2019. Annual LAI data were generated using the maximum value composite method. The nearest-neighbor allocation method (NEAREST) was applied to resample the data to a resolution of 1 km for the TRHR, which was used to produce the 1 km vegetation net primary productivity (NPP) dataset for the same period.
The NPP data were derived from the MODIS MOD17A3 data product (https://lpdaac.usgs.gov/products/mod17a3hgfv006, accessed on 22 November 2022) with a spatial resolution of 500 m and a temporal resolution of 1 year for the period of 2000 to 2019. The NEAREST method was used to resample the data to a resolution of 1 km for the TRHR to generate the 1 km vegetation NPP dataset for the same period.
The digital elevation model (DEM) was obtained from the Geospatial Data Cloud (http://www.gscloud.cn/search, accessed on 25 November 2022) with a spatial resolution of 30 m. The NEAREST method was used to resample the data to a resolution of 1 km for the TRHR. The slope and aspect data were calculated from the DEM data using the slope and aspect tools in ArcGIS 10.2, and the resulting data were resampled to a resolution of 1 km.

2.3. Methods

In this study, a comprehensive vegetation index was constructed using the Delphi method, incorporating three indicators, FVC, LAI, and NPP. The trend of vegetation change in the TRHR was examined using trend analysis. The effect of temperature and precipitation on the CVI was explored through partial correlation analysis. The impact of land use/cover, elevation, and slope on the CVI was also investigated by means of spatial overlay and statistical analysis. The study’s overall framework is depicted in Figure 2.

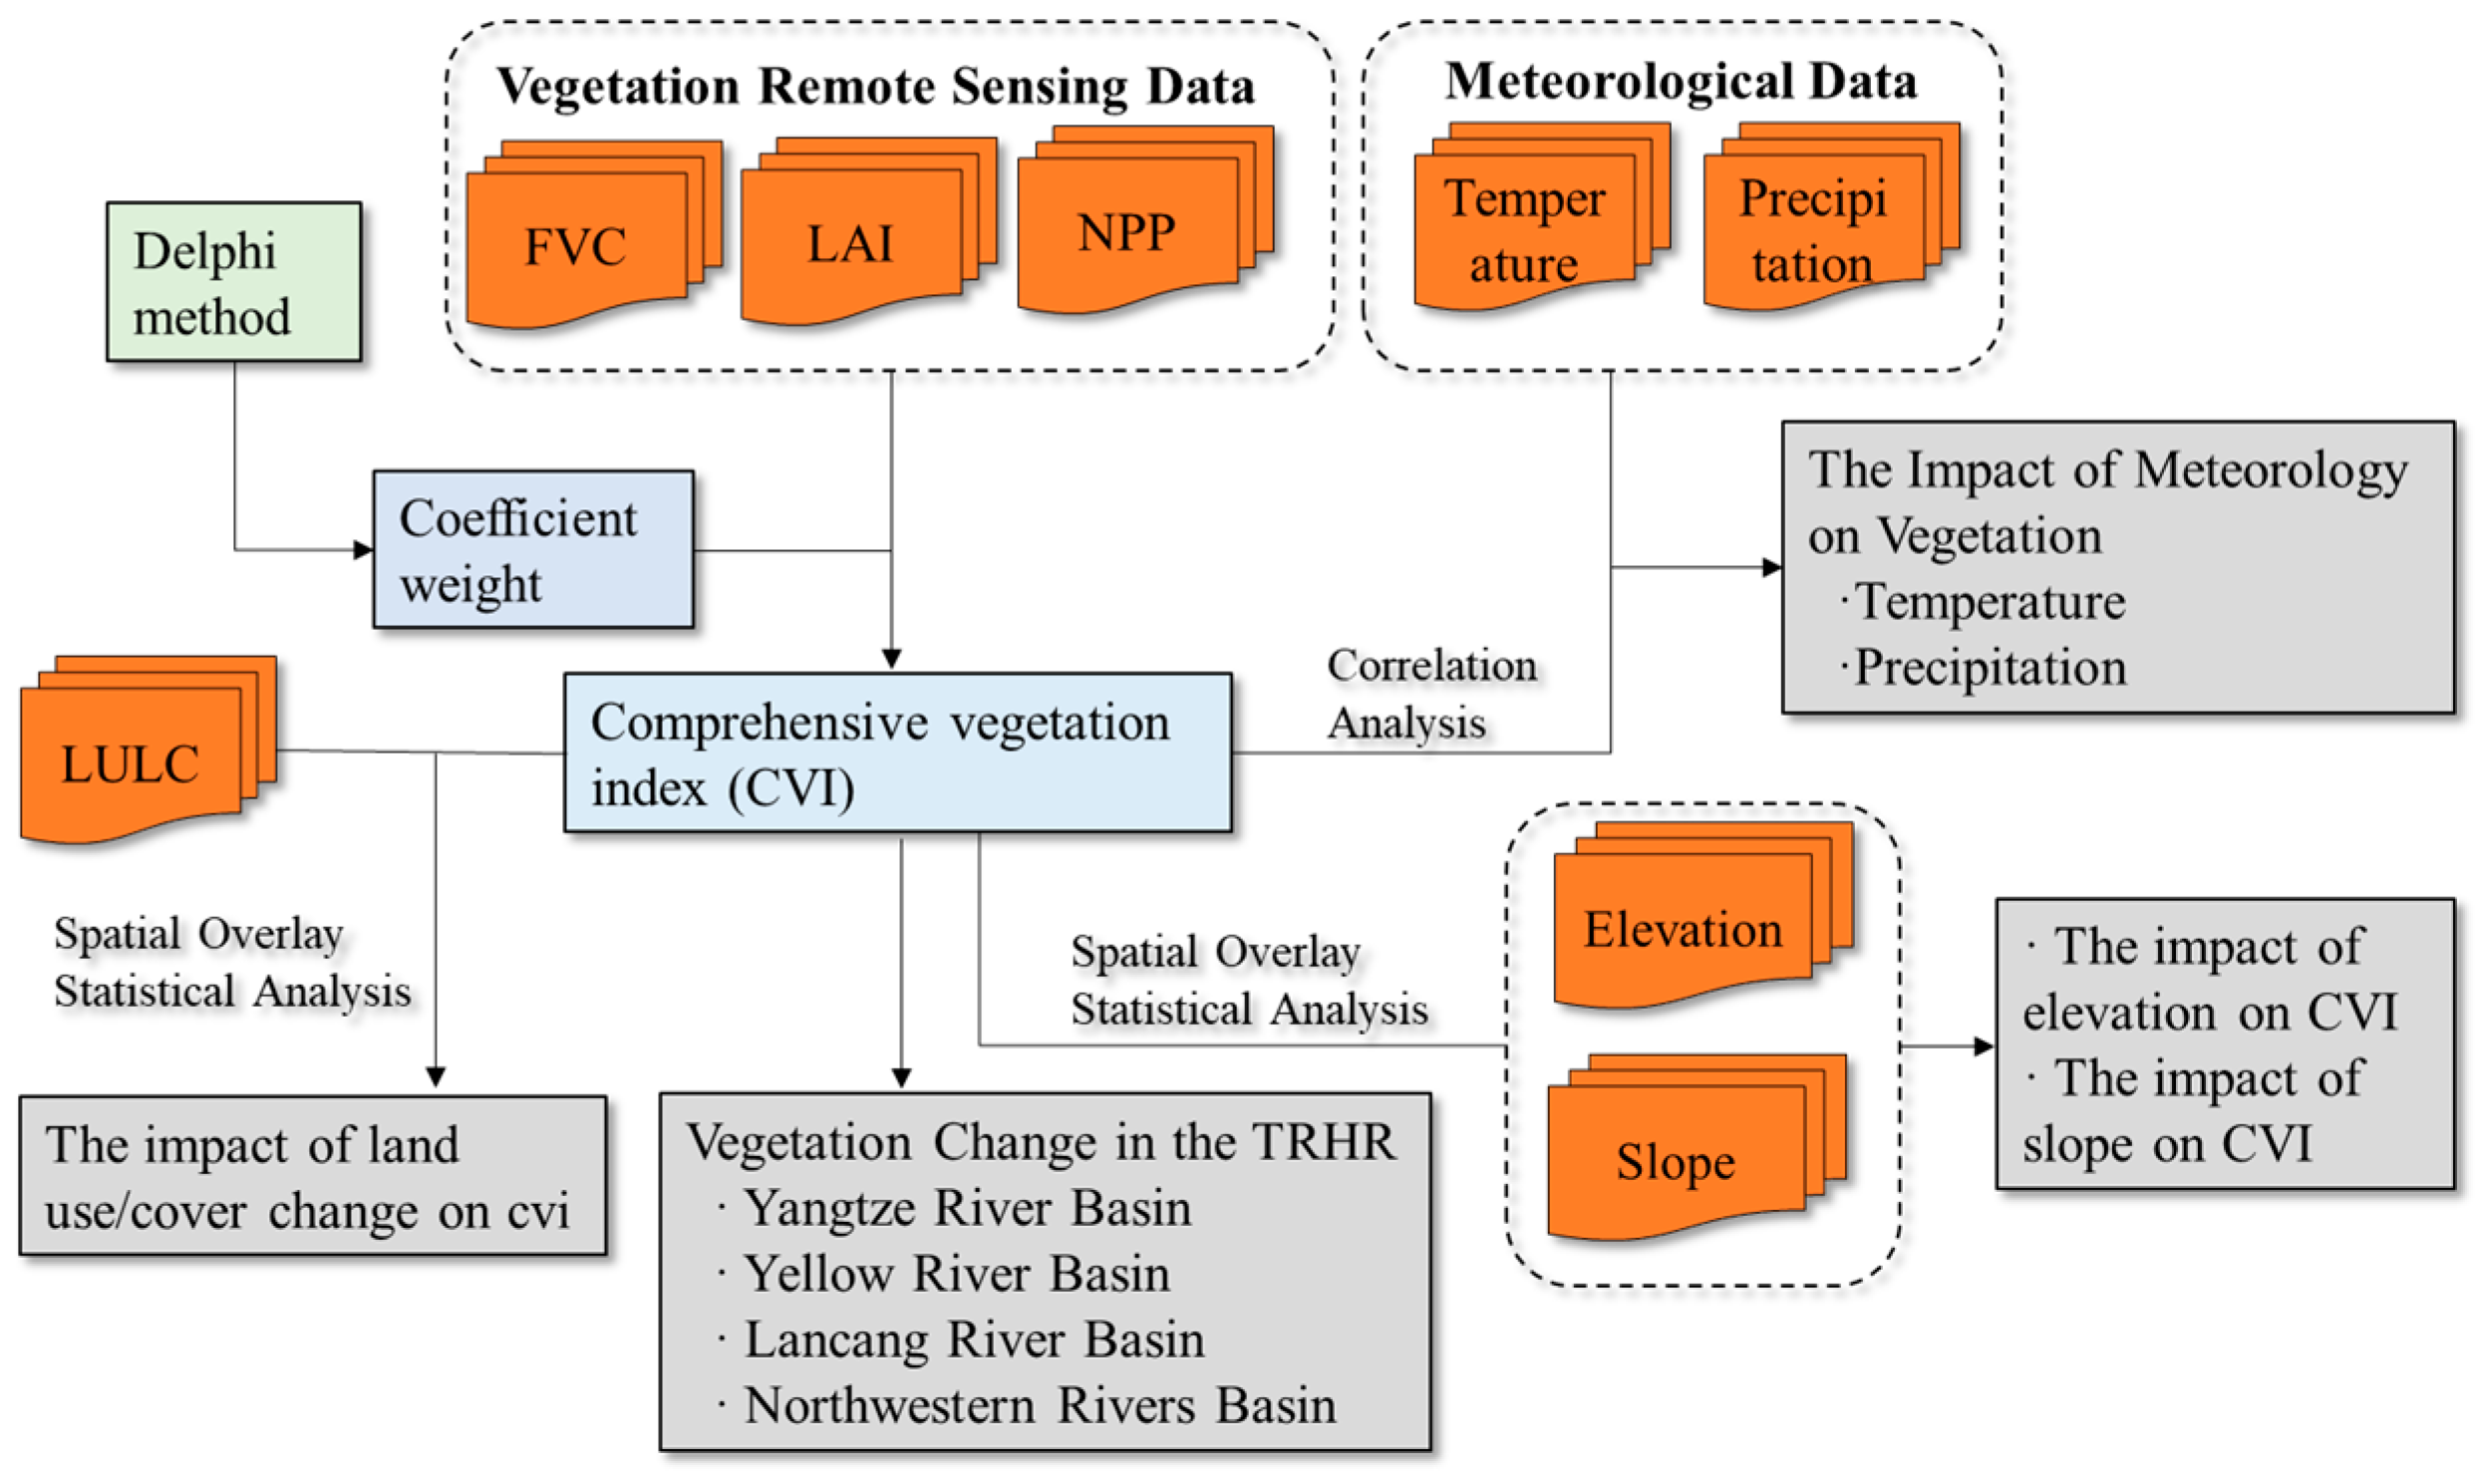
2.3.1. Comprehensive Vegetation Index

The degree of vegetation growth and ecological quality cannot be solely reflected by a single indicator such as vegetation cover or net primary productivity. It is necessary to comprehensively consider the quality and advantages and disadvantages of ecological conditions. We selected three indicators, namely vegetation cover, leaf area index (LAI), and net primary productivity (NPP), to construct a comprehensive vegetation index. Vegetation cover mainly characterizes the complexity of the horizontal structure of vegetation [45], LAI mainly characterizes the vertical structure of vegetation, and NPP mainly characterizes the total amount of organic matter accumulated by vegetation through photosynthesis, reflecting the strength of vegetation’s photosynthetic capacity. These three indicators can effectively reflect the vegetation condition from a horizontal-vertical-total perspective. We calculated the comprehensive vegetation index using the following formula:
C V I i j = a × F V C i j + b × L A I i j + c × N P P i j
where C V I i j is the comprehensive vegetation index; F V C i j is the normalized vegetation coverage value on the j-th grid in the i-th year, a is the weight value of FVC in the TRHR. L A I i j is the normalized Leaf Area Index value on the j-th grid in the i-th year b is the weight value of LAI in the TRHR. N P P i j is the normalized Net Primary Productivity value on the j-th grid in the i-th year, c is the weight value of NPP in the TRHR. We used the Delphi Method [46] to determine the weights of FVC, LAI, NPP. In this study, a Likert scale was developed for three vegetation indicators, FVC, LAI, and NPP, in the TRHR. Scoring sheets were distributed to experts who have extensive research experience in the region, such as those from the Chinese Academy of Sciences and China Agricultural University. After analyzing the scoring results, a scientifically based weighting scheme was obtained that aligns with the characteristics of the TRHR and reflects expert knowledge and experience. The final coefficients for a, b, and c are 0.3, 0.3, and 0.4, respectively. It should be noted that the weighting scheme is specific to the TRHR in this study, and further scientific research is required for other regions.

2.3.2. Vegetation Change Detection

In this study, the Theil–Sen median method was employed to determine the trend of the Vegetation Index. The Theil–Sen median method is an efficient non-parametric statistical method for trend calculation that is less sensitive to outliers, measurement errors, and abnormal data [47,48]. It is suitable for analyzing trends in long time series data. The formula is as follows:
β = M e d i a n X j X i j i , j > i
where β represents the trend, and X j and X i are the assessment values for year i and year j, respectively. If β > 0, it indicates an upward trend, while if β < 0, it indicates a decreasing trend.
The combination of the Mann–Kendall and Theil–Sen median methods has been widely applied in fields such as hydrology, meteorology, and ecology for analyzing trends in long time series data. This method does not assume data to follow a specific distribution and is not affected by missing or abnormal values. It has a solid statistical theory foundation for testing significance levels and provides high reliability.
s g n X j X i = 1 , X j X i > 0 0 , X j X i = 0 1 , X j X i < 0
S = i = 1 n 1 j = i + 1 n s g n ( X j X i )
v a r S = n ( n 1 ) ( 2 n + 5 ) 20
Z = S + 1 v a r ( S ) , S < 0 0 , S = 0 S 1 v a r ( S ) , S > 0
where s g n ( ) represents the sign function, v a r S is the variance of sample S, X j and X i are the CVI indices corresponding to the same grid unit for the i-th and j-th year (j > i) in the time series, respectively, and n is the length of the data sample.
A value greater than 1.96 indicates that the trend of the data sequence has passed a significance test at a 95% confidence level (p < 0.05), while a value greater than 1.65 indicates that the trend has passed a significance test at a 90% confidence level (p < 0.1). In addition, combining the trend calculated using Theil–Sen Median, this study defines four types of vegetation increase status (categories that did not exhibit significant changes were not taken into consideration in this study): significantly degraded, moderately degraded, moderately recovered, and significantly recovered (Table 1). In that study, we considered the changing trend of CVI in the TRHR during the research period from 2000 to 2019, an increase in CVI indicated recovery, while a decrease indicated degradation.

2.3.3. Correlation Analysis

Correlation analysis is a method used to measure the correlation or closeness between two or more variables [49,50]. In this study, partial correlation coefficients were calculated using Matlab software (Version R2016a) to investigate the correlation and significance levels between the vegetation index and two meteorological factors, temperature and precipitation. The formula used for calculation is as follows:
r x y = i = 1 n x i x ¯ y i y ¯ i = 1 n x i x ¯ 2 i = 1 n y i y ¯ 2
where r x y represents the correlation coefficient, with a value range of −1 to 1. When r x y > 0, it indicates that the two variables, x and y, are positively correlated. When r x y < 0, it indicates that the two variables, x and y, are negatively correlated. Additionally, the larger the absolute value of r x y , the stronger the correlation between the variables. x i and y i represent the values of the two variables, while x and y ¯ represent their means. n is the number of years studied.
r a b . c = r a b r a c r b c 1 r a c 2 1 r b c 2
where r a b . c represents the partial correlation coefficient between variables a and b under the condition that variable c remains constant. r a b denotes the correlation between variables a and b, r a c denotes the correlation between variables a and c, and r b c denotes the correlation between variables b and c. The significance of the partial correlation results was tested using t-test method:
t = r a b . c 1 r a b . c 2 × n m 1
where n is the sample size and m is the number of independent variables.

2.3.4. Spatial Statistical Analysis

Based on previous relevant studies, this research opted for land use data with high precision from various sources. However, as these data are only updated every five years, Table 2 was utilized to conduct spatial overlay and statistical analysis of the CVI index corresponding to the land use data in the same spatial unit. The aim was to investigate the influence of land use changes on the CVI index.
In this study, elevation and slope data were limited to a single time period. To address this, spatial overlay and statistical analysis were used to examine the slope of CVI changes across different elevations and slopes within the same spatial unit from 2000 to 2019. The aim was to assess the impact of elevation and slope on the vegetation status of the TRHR.

3. Results

3.1. Vegetation Change in the TRHR

From 2000 to 2019, the overall trend of the CVI index in the TRHR showed an upward trend with an annual average growth rate of 0.63%/year, indicating that the vegetation in the region is gradually recovering and the ecological protection and restoration efforts are significantly effective. The average CVI index for the past 20 years was 0.28, with the lowest value occurring in 2000 at 0.24 and the highest value appearing in 2010 at 0.32. The CVI index of each river basin in the TRHR showed a gradient distribution; however, the overall trend of change was consistent. Among them, the Yellow River basin had the highest annual average CVI index of 0.40, followed by the Lancang River basin and the Yangtze River basin, with annual average CVI values of 0.37 and 0.23, respectively. The annual average CVI index in the Northwest Rivers basin was the lowest at 0.14, indicating that the vegetation condition in the Yellow River basin was the best, followed by that in the Lancang River basin and the Yangtze River basin, while the vegetation condition in the Northwest Rivers basin was the worst (Figure 3a).
A significance test of the CVI changes in the TRHR area from 2000 to 2019 reveals that vegetation restoration was the main trend, with 18.99% of the area showing significant increase, 51.70% showing no significant increase, 3.07% showing significant decline, and 26.24% showing no significant decline. The Yellow River Basin had the largest area of significant increase; however, the Northwestern river basin had the highest proportion of the watershed area showing significant increase. On the other hand, the Yangtze River Basin had the largest area of significant decline, which also accounted for the largest proportion of the watershed area (Figure 3b).
According to Figure 3, the areas with significant vegetation increase (p < 0.05) in the TRHR area from 2000 to 2019 were mainly located in the junction area of Xinghai, Tongde, and Guinan counties in the Yellow River Basin, the central part of Jiantang county and Guided county (Figure 4Ⅰ), and the northern part of Mado county (Figure 4Ⅱ). Additionally, the northwestern (Figure 4Ⅰ) and northeastern (Figure 4Ⅲ) parts of the Northwestern river basin also showed significant vegetation increase. The areas with significant vegetation decline (p < 0.05) were mainly located in the junction area of Qumalai county and Zhiduo county in the Yangtze River Basin (Figure 4Ⅳ), the junction area of Gandai county and Darlag county in the Yellow River Basin, and the western part of Jiu Zhi county (Figure 4Ⅴ). The areas with no significant decline or increase were widely distributed in the TRHR area’s various river basins.

3.2. The Impact of Climate Factors on Vegetation Restoration

There is a significant coupling relationship between climate factors and vegetation, and climate controls the growth and changes of vegetation in terms of physiological structure and processes by changing environmental conditions. Therefore, this study selected the CVI index from 2000 to 2019 and temperature and precipitation data to conduct a partial correlation analysis and explore the impact of climate factors on vegetation conditions.
The temperature in the TRHR is affected by various factors such as altitude and terrain, exhibiting significant spatial heterogeneity with an overall east-high and northwest-low spatial distribution. The northwest part of the northern region, the northwest basin of the Northwest Rivers, has significantly higher temperatures, while the northwest part has significantly lower temperatures. The Lancang River Basin in the southern region also has higher temperatures; however, the temperature in the Yellow River Basin and the Yangtze River Basin is lower (Figure 5a). From 2000 to 2019, the temperature in the TRHR and each basin showed a fluctuating upward trend (Figure 5b) with a growth rate of 0.109 °C/10a. The growth rate of the Lancang River Basin, Yangtze River Basin, Yellow River Basin, and Northwest Rivers Basin was 0.057 °C/10a, 0.060 °C/10a, 0.055 °C/10a, and 0.040 °C/10a, respectively.
The TRHR exhibits a gradient increase in precipitation from north to south, with the Northwestern river basins having the least amount of rainfall, followed by the central basins of the Yangtze and Yellow Rivers, and the southern basins of the Lancang and Yangtze Rivers having the most abundant rainfall (Figure 6a). From 2000 to 2019, the precipitation in the TRHR and its basins also showed a fluctuating upward trend (Figure 6b), with an average increase rate of 9.30 mm/10a. Among them, the Yellow River basin had the fastest annual precipitation increase rate, reaching 19.08 mm/10a, while the Lancang River, Yangtze River, and Northwestern river basins had increase rates of 4.99 mm/10a, 5.03 mm/10a, and 5.19 mm/10a, respectively.
Partial correlation analysis was performed between the CVI, temperature, and precipitation in the TRHR from 2000 to 2019, and the regions were identified as significant through significance testing (p < 0.05). Due to differences in natural resource endowments and ecological background, the effects of temperature and precipitation on CVI varied among regions in the TRHR. Overall, the average partial correlation coefficient between CVI and temperature in the TRHR (significant regions through significance testing) was 0.55. The area with significant positive correlation between temperature and CVI covered 86215 km2, scattered across the various river basins in the TRHR, with a more pronounced concentration in the eastern area. The area with significant negative correlation covered 1290 km2 and was concentrated at the junction of the Yellow River and Yangtze River basins and surrounding areas (Figure 7). The average partial correlation coefficient between CVI and precipitation in the TRHR (significant regions through significance testing) was also 0.55. The area with significant positive correlation between precipitation and CVI covered 3620 km2, mainly distributed in the southeast of the TRHR, concentrated at the junction of the Yellow River and northwest rivers basin, while the area with significant negative correlation covered 72,115 km2, scattered in the northwest rivers basin and Yangtze River basin junction area in the western TRHR, as well as in the central areas of the Lancang River and Yellow River basins (Figure 8).

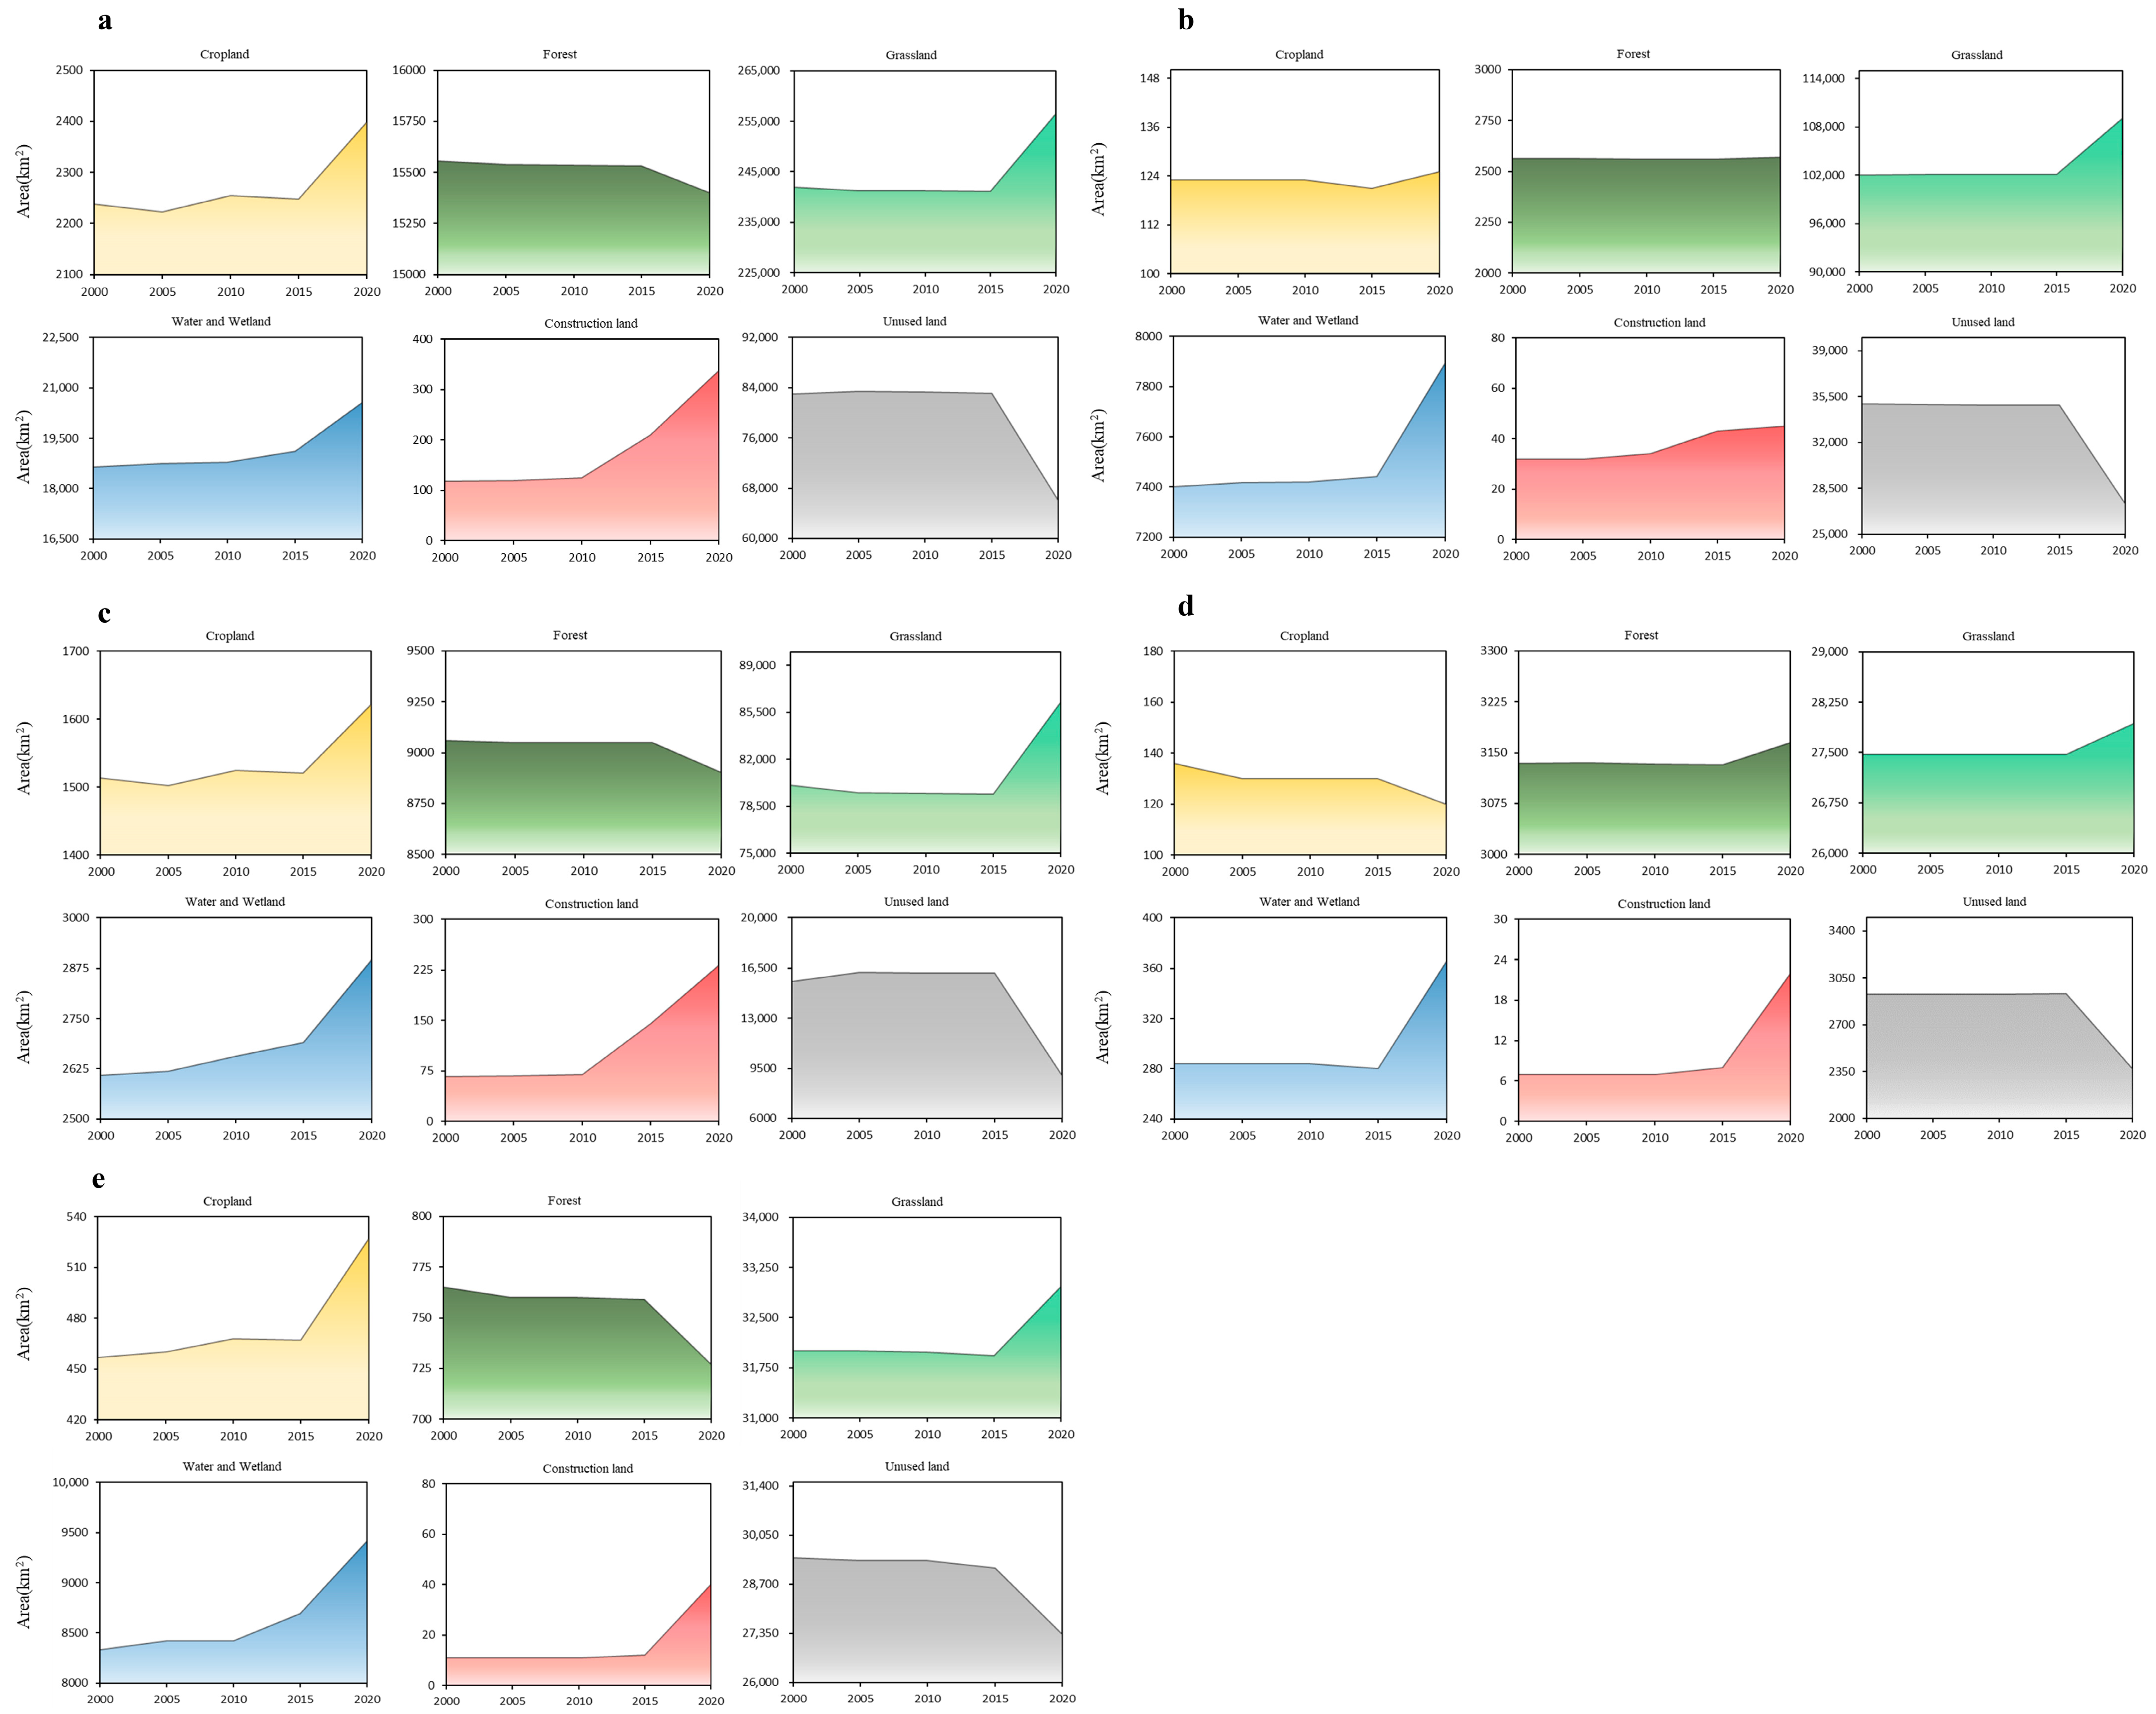
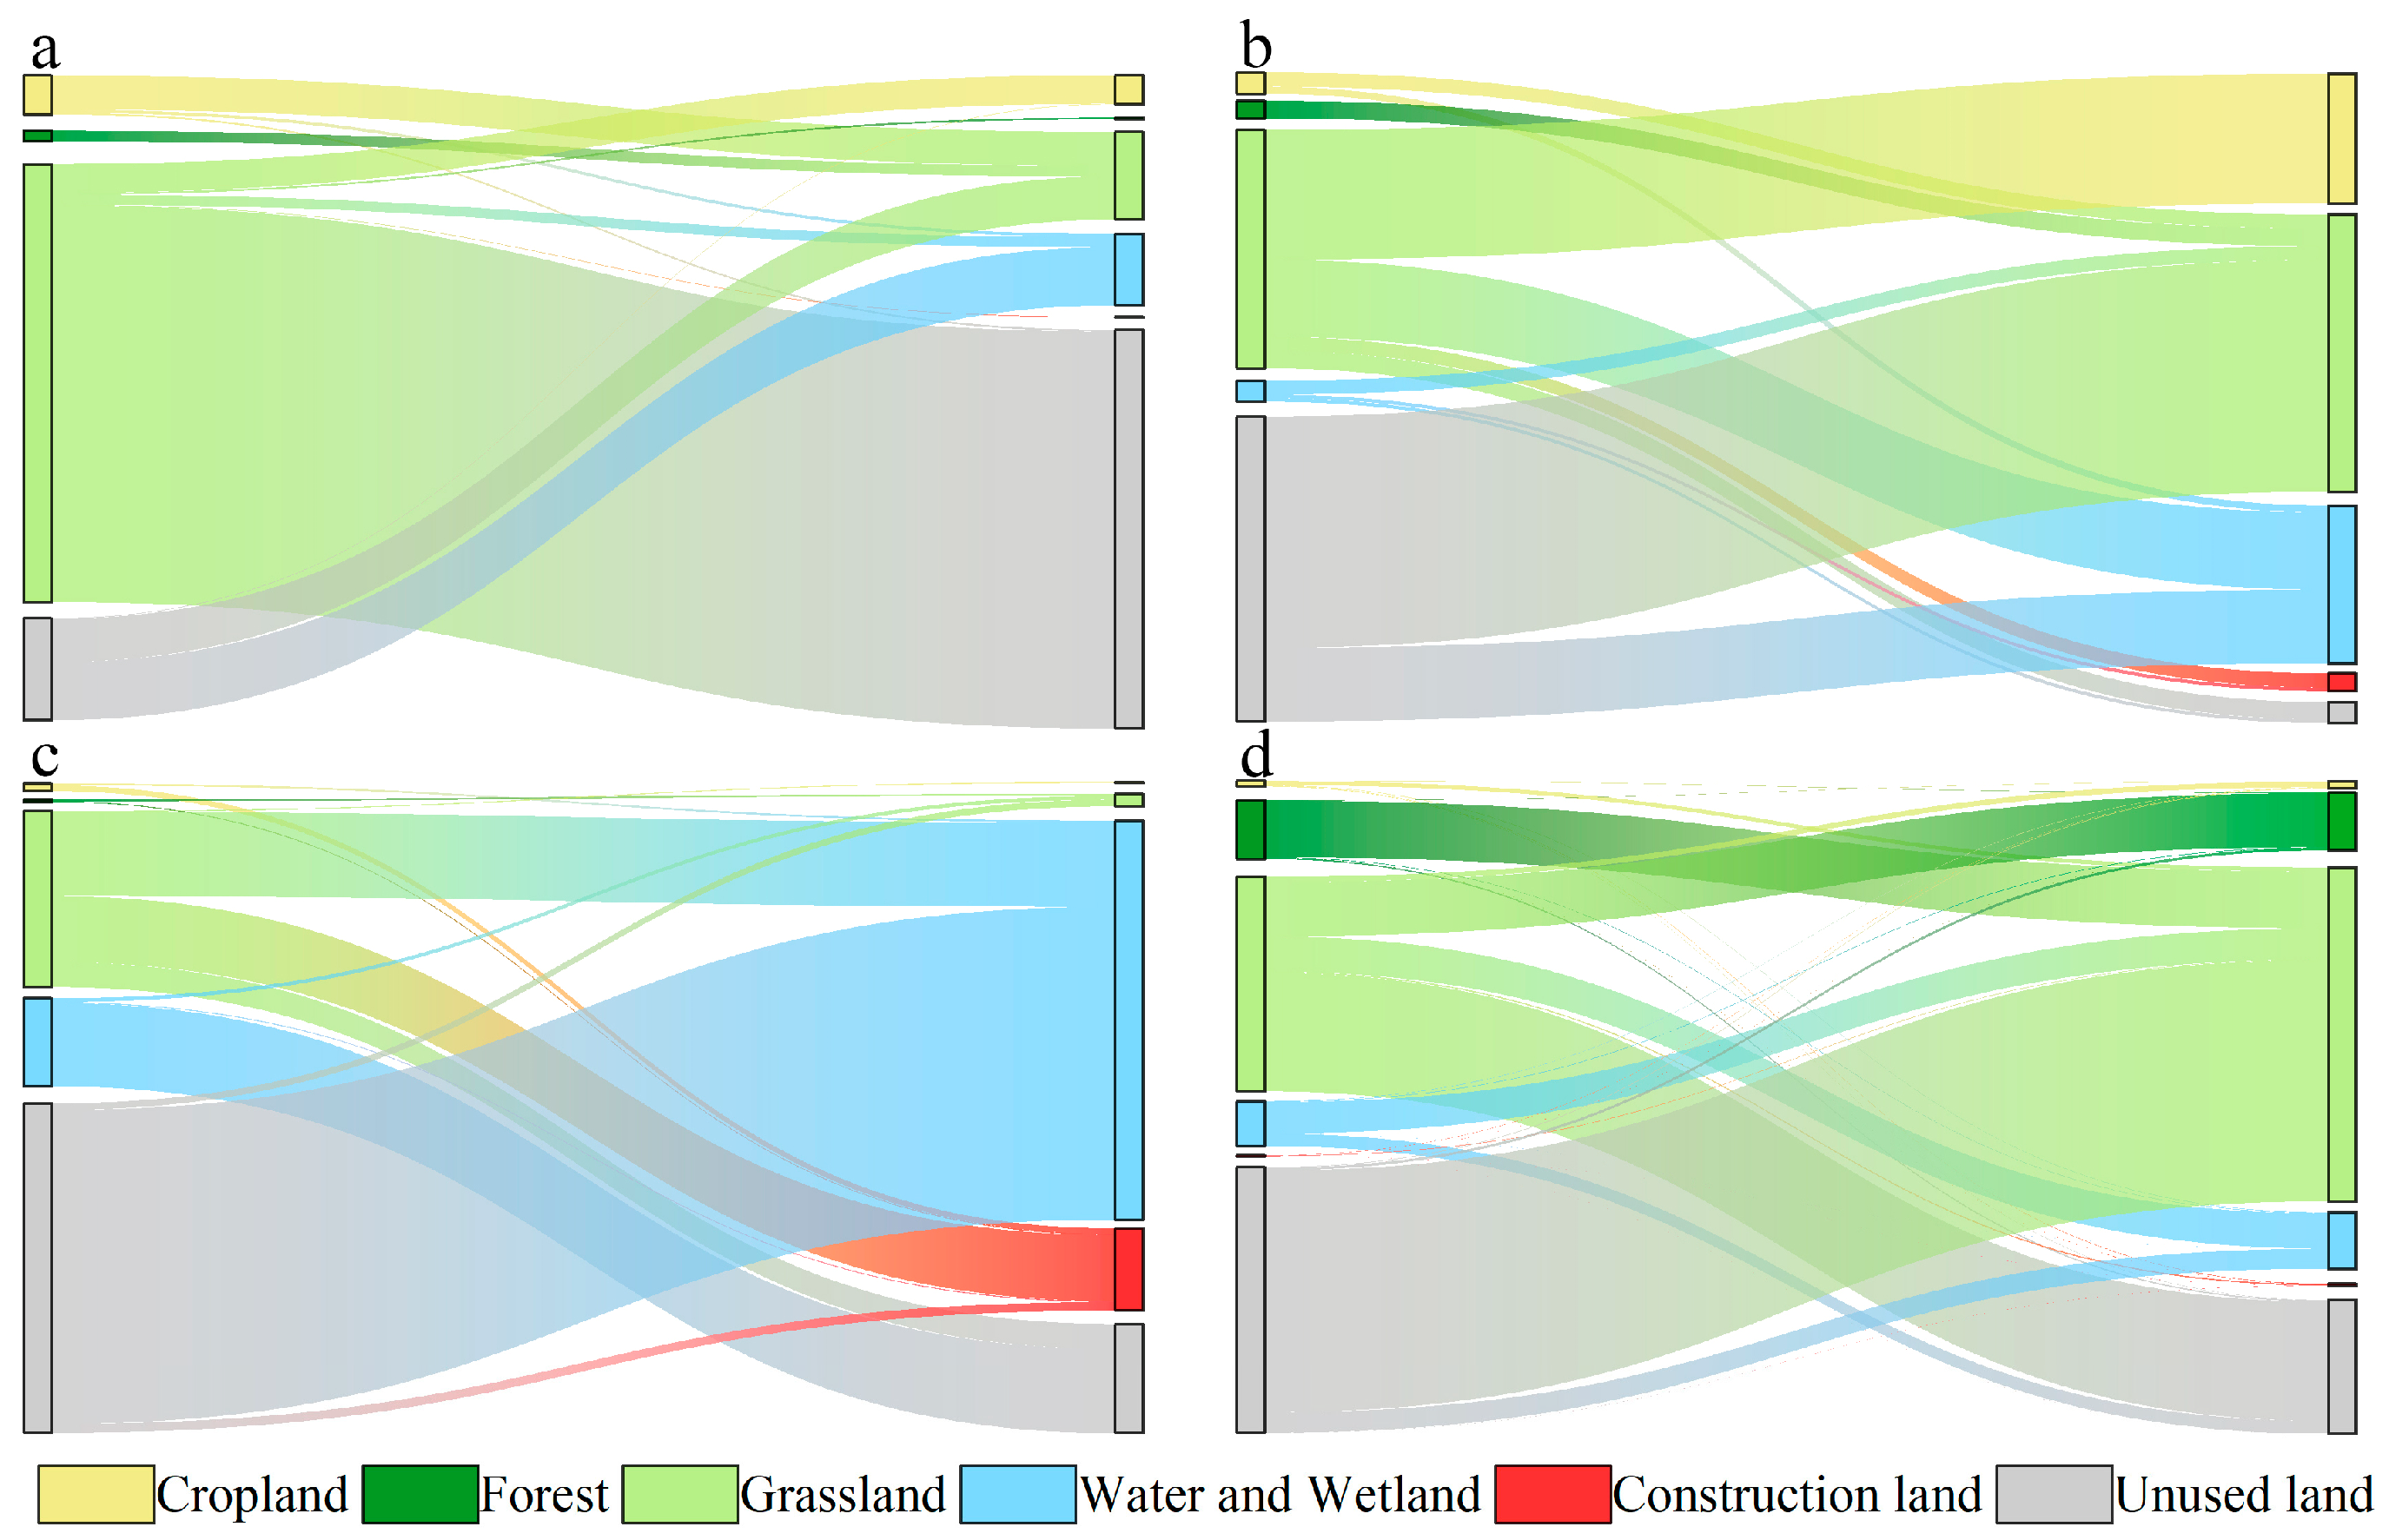
3.3. The Impact of Land Use Change on Vegetation Index

Human activities and climate-driven land use and land cover changes profoundly affect the structure and function of natural ecosystems on the earth’s surface. Vegetation, as an important component of natural ecosystems, is also deeply affected by land use and land cover changes. Therefore, this study explores the impact of land use changes from 2000 to 2019 on the CVI index.
From 2000 to 2019, grassland was the main land use type in the TRHR, accounting for 66.36–70.59% of the total area, followed by unused land, accounting for 18.20–22.96% of the total area. Construction land accounted for only 0.03–0.09% of the total area. The changes in land use in the TRHR from 2000 to 2019 were mainly characterized by a significant increase in grassland and construction land area, and a sharp decrease in unused land area. The dynamic trends of each land use type are shown in the Figure 9. The areas of cropland, grassland, water and wetland, and construction land increased by 160 km2, 14,663 km2, 1933 km2, and 220 km2, respectively, with an increase in the area of 7.15%, 6.06%, 10.37%, and 186.44% compared to 2000. The areas of forest land and unused land decreased by 157 km2 and 16,839 km2, respectively, with a decrease in the area of 1.01% and 20.29% compared to 2000. Significant variations were observed in land use/cover change among the different basins, with distinct increasing trends observed in grasslands, water and wetlands, and construction land, and a corresponding decrease in unused land by the end of the study period. The fluctuations in forest land were found to be different across the basins (Figure 10).
From 2000 to 2019, the dynamic changes in land use/cover types in the TRHR were shown in Figure 9. From 2000 to 2005, the changes in land use were mainly the conversion of grassland to unused land, unused land to water and wetland, and grassland. From 2005 to 2010, the changes in land use were mainly the conversion of grassland to cropland, construction land, water and wetland, and unused land to grassland and water and wetland. From 2010 to 2015, the changes in land use were mainly the conversion of grassland to construction land and water and wetland, water and wetland to unused land, and unused land to water and wetland. From 2015 to 2020, the changes in land use were mainly the conversion of forest land to grassland, grassland to forest land, unused land, and water and wetland, and unused land mainly converted to grassland.
According to the findings of this study, the CVI values of different land types in the TRHR exhibited a distinct hierarchy from 2000 to 2019, with forest land occupying the topmost position, followed by cropland, grassland, and unused land, respectively. (Notably, this study did not take into account the vegetation status of construction land, water and wetland). The annual average CVI of forest land, grassland, and unused land remained relatively stable during the study period, while the annual average CVI of cropland showed a fluctuating upward trend. Spatial overlap analysis revealed that the rapid urban-rural expansion in the TRHR had led to a significant loss of grassland, as it was mainly converted into construction land. As a result, the vegetation index of the area decreased, indicating that urban expansion and the increase in construction land were critical factors contributing to the decline of the CVI index. In addition, human activities and climatic factors, such as extreme weather events and overgrazing, have also led to decline of some grassland and forest areas. Nonetheless, the ecological environment of the TRHR, which is dominated by grassland, has been improved due to the implementation of various ecological environment protection policies and projects, including returning cropland to forest (or grassland), banning grazing, rotational grazing, and rest grazing. Overall, the results of this study suggest that the transformation of land use towards ecological land use is essential for the restoration of vegetation. However, the effectiveness of restoration efforts may vary in different areas due to differences in natural resource endowments.

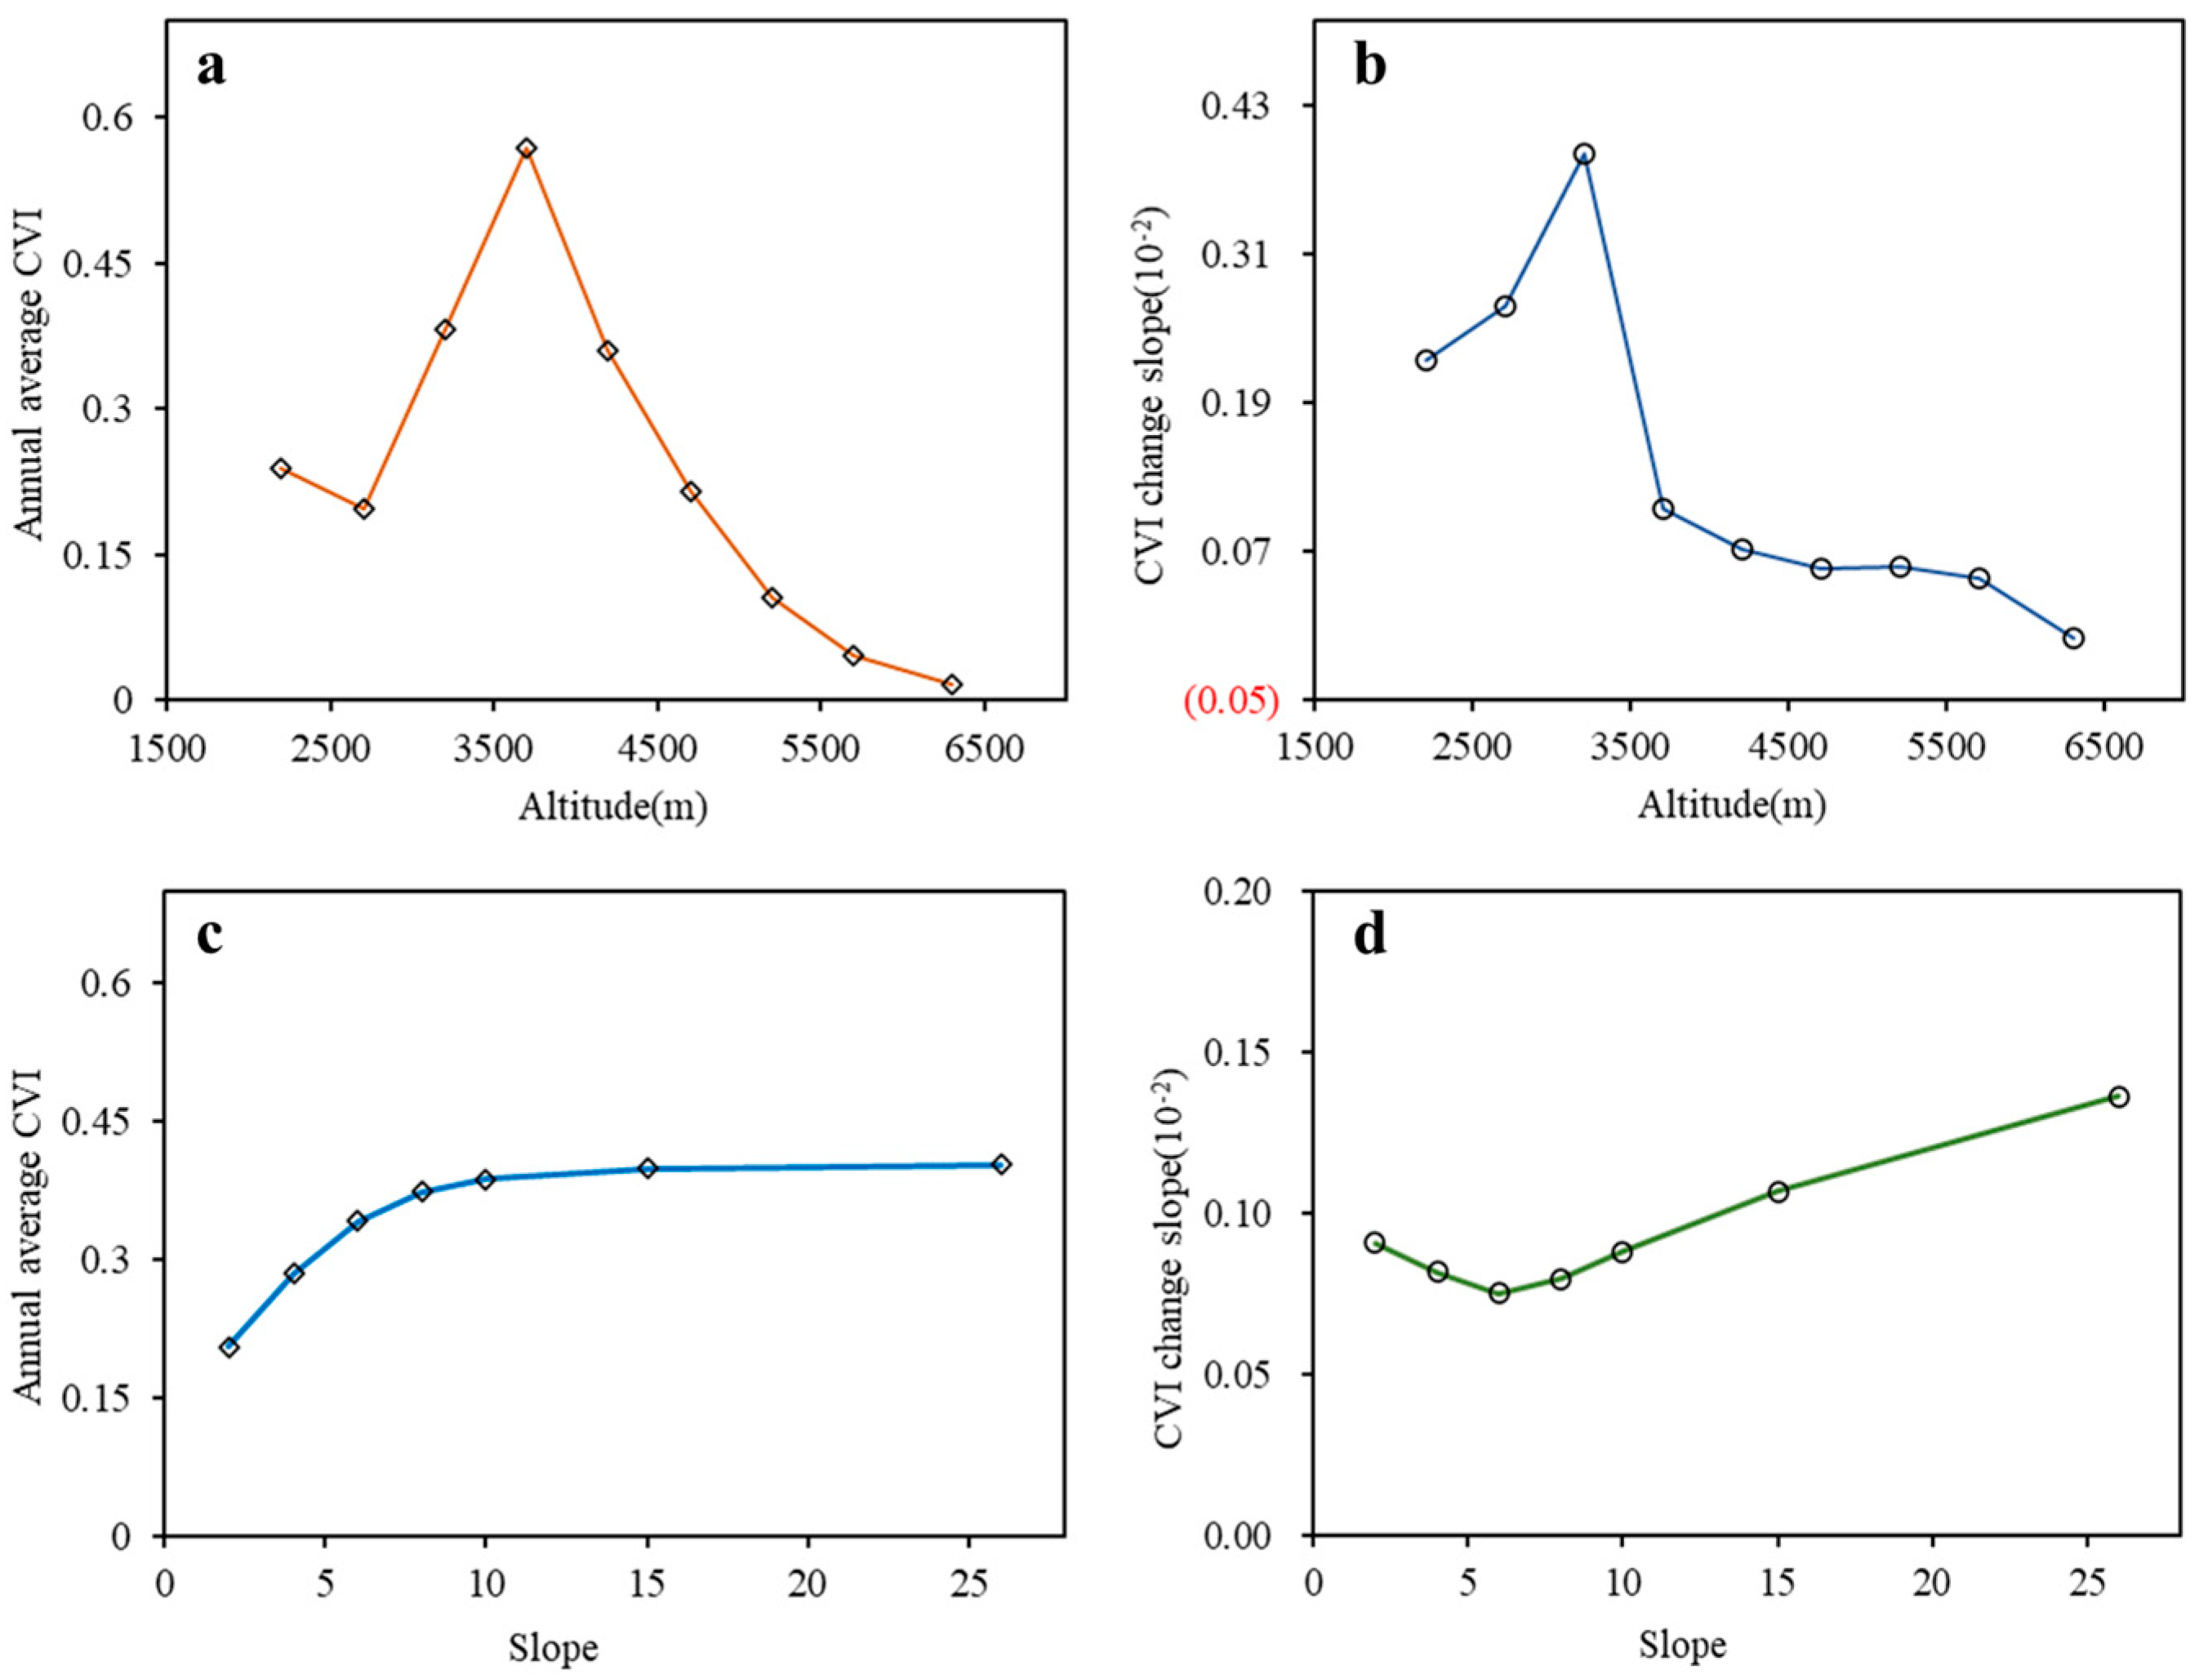
3.4. The Impact of Altitude and Slope on CVI

Based on the analysis of the comprehensive vegetation index (CVI) and its change slope under different altitudes in the TRHR from 2000 to 2019, it was found that the CVI value showed an initial increase followed by a significant decrease with increasing altitude. The high CVI values were mainly concentrated at altitudes between 3200–4200 m, while low values were observed at higher altitudes. After 3500 m, the CVI value decreased significantly with increasing altitude (Figure 11a). The change slope of the CVI from 2000 to 2019 exhibited a similar trend to that of the CVI values with altitude. Between 1800 and 3200 m, the CVI change slope increased gradually with altitude, and after 3200 m, the decrease in the CVI slope with increasing altitude became more pronounced. Different degrees of decline were observed beyond an altitude of 5700 m (Figure 11b). These findings suggest that altitude has a significant impact on the vegetation index in the TRHR. From 2000 to 2019, the annual average CVI in the TRHR increased with a slope between 0 and 10, and the annual average CVI value tended to be stable when the slope was greater than 10 (Figure 11c). When the slope is between 0 and 7, the change slope of CVI in the TRHR decreases with the increase in the slope, and when the slope is higher than 7, the change slope of the CVI increases with the increase in the slope (Figure 11d).

4. Discussion

This study employed a multi-source remote sensing approach to developing a comprehensive vegetation index (CVI) to examine the spatiotemporal changes of vegetation and its principal drivers in the TRHR from 2000 to 2019. Our results indicated an overall improvement in the vegetation condition of the study area over the examined period, Consistent with the research findings of Shen and Bai et al. [51,52], our study also confirms the existence of evident degradation areas. This is in line with the research results of Shen and Cao et al. [51,53]. China has prioritized the ecological environment construction and sustainable development of Qinghai Province, particularly the TRHR, since the beginning of the 21st century, investing substantial funds in ecological protection projects and ecological compensation annually, which had demonstrated positive ecological protection outcomes in the region [54]. Our study also revealed significant climate variations in the Three Rivers Source region, such as warming temperatures (at a rate of 0.109 °C/10a) and increased precipitation (at a rate of 9.30 mm/10a), in line with previous research [52,55]. The changes in the phased average maximum snow depth and rapid decrease in the annual maximum frozen soil depth also suggest an increasingly warmer and wetter climate, favorable to the growth and development of vegetation, thereby improving the ecological conditions of the region.
The TRHR has undertaken a series of significant ecological projects, including the Natural Forest Conservation Project initiated in 2000, the Grazing Withdrawal and Grassland Restoration Project launched in 2003, and the Phase I and Phase II projects of the Three Rivers Source Region Ecological Conservation and Construction Program initiated in 2005 [56]. In addition, the local government has introduced ecological conservation policies, such as rotational grazing, resting pastures, and grazing prohibition, in consideration of the balance between grass and livestock [57,58]. Over the period from 2000 to 2019, the region has observed a 6.06% increase in grassland and a 10.37% increase in water and wetland. However, some areas of the TRHR remain in a degraded state due to early stage human activities, including overgrazing, cultivation, and mining, as well as natural resource limitations such as high altitude, coldness, and poor soil quality [59,60]. The restoration of these areas poses a significant challenge, and this aspect deserves particular attention and prioritization in future ecological conservation and construction initiatives within the TRHR.
In this study, we developed a comprehensive vegetation index to investigate the changing vegetation patterns in the TRHR, and evaluated the impacts of various factors, including temperature, precipitation, land use, and altitude. However, our research was subject to several uncertainties. Firstly, when assessing the effects of climate factors on vegetation changes, the role of human activities should also be considered, as climate change and human activities have complex and interconnected impacts on vegetation dynamics [61,62]. Secondly, due to limitations in data availability and processing, our study only accounted for temperature and precipitation, which may not fully capture the complexity of the underlying mechanisms. Future studies should incorporate other relevant factors, such as solar radiation, CO2, and nitrogen deposition [28,63,64], to provide a more complete understanding of vegetation changes in the TRHR.
The CVI developed in this study served as a reliable indicator of the general vegetation condition. However, it is critical to acknowledge that the comprehensive nature of this index may obscure specific processes and trends, such as FVC, LAI, and NPP. Future research endeavors could entail conducting separate analyses to compare and contrast the comprehensive index with individual indices. This approach would provide a more nuanced understanding of vegetation dynamics and enhance the comprehensiveness of our assessments. Although this study established an association between increased CVI and vegetation recovery, as well as decreased CVI and vegetation degradation during the 2000–2019 period, it was imperative to integrate rigorous ground validation methods to fine-tune the numerical values assigned to various vegetation categories. Furthermore, the acquisition of extensive long-term ground monitoring data within the Three Rivers Source Region became crucial in accurately evaluating the true state of vegetation changes and facilitating a robust comparison against the findings presented in this study, thereby ensuring the validity of the results. It is important to acknowledge that the conducted correlation analysis in this study did not incorporate the effects of spatiotemporal autocorrelation that exist within each variable. The omission of accounting for spatial autocorrelation undermines the suitability of this correlation analysis in accurately capturing the underlying relationships between the variables. To enhance the reliability and precision of our findings, future investigations should employ suitable methodologies to address the spatial and temporal autocorrelation inherent in the dataset. This approach would result in a more comprehensive comprehension of the interdependencies among the variables under scrutiny. The exclusion of spatial autocorrelation analysis for individual variables in this study represents a notable limitation. However, it is crucial to acknowledge and address this constraint in future research endeavors, as doing so would significantly enhance the depth and breadth of spatial understanding of the variables. Furthermore, leveraging the generalized additive model (GAM) presents a valuable approach for investigating the specific changes attributable to each low-level spatial factor. Through the utilization of the GAM model, researchers can effectively capture and analyze the intricate impacts of these spatial factors on the studied phenomena. Thus, the integration of spatial autocorrelation analysis and the implementation of the GAM model would yield substantial improvements in the robustness and accuracy of future research findings [65].

5. Conclusions

This study constructs a vegetation comprehensive index (CVI) from three aspects of vegetation horizontal structure, vertical structure, and the total amount of accumulated organic matter. The index is based on the selection of FVC, LAI, and NPP. It quantifies the spatiotemporal changes in vegetation status in the TRHR from 2000 to 2019 and explores the main areas where vegetation increases and decreases. The study analyzes the impact of land use, climate, altitude, and slope on CVI. The main findings are as follows:
(1)
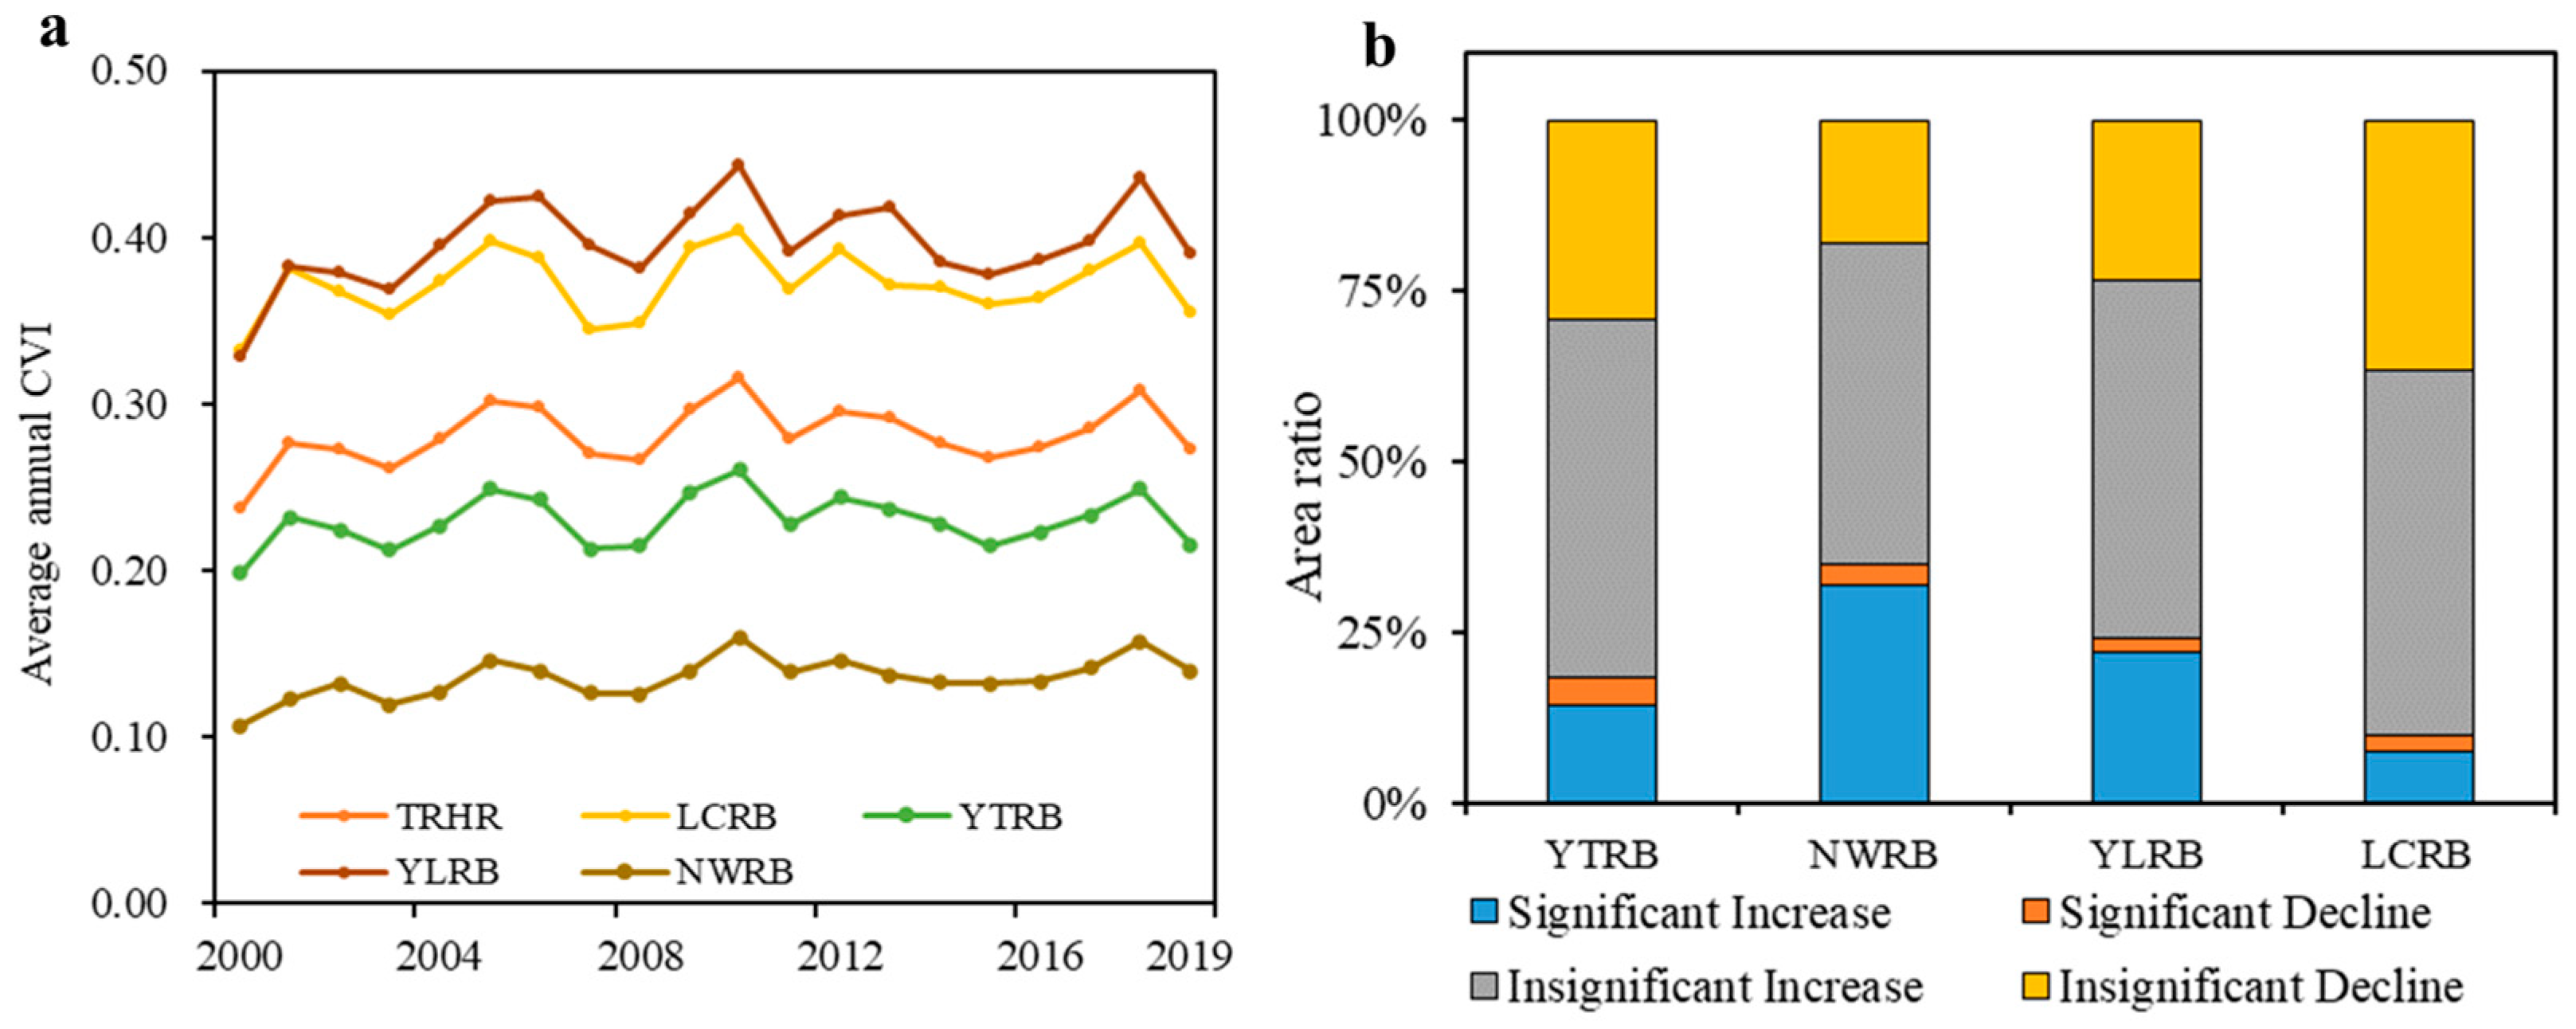
The overall vegetation status of the TRHR is ranked as follows: Yellow River basin > Lancang River basin > Yangtze River basin > Northwest river basins. Although the average CVI increased by 0.63% per year, indicating a trend of vegetation improvement, significant spatial differences and areas of decline were evident.
(2)
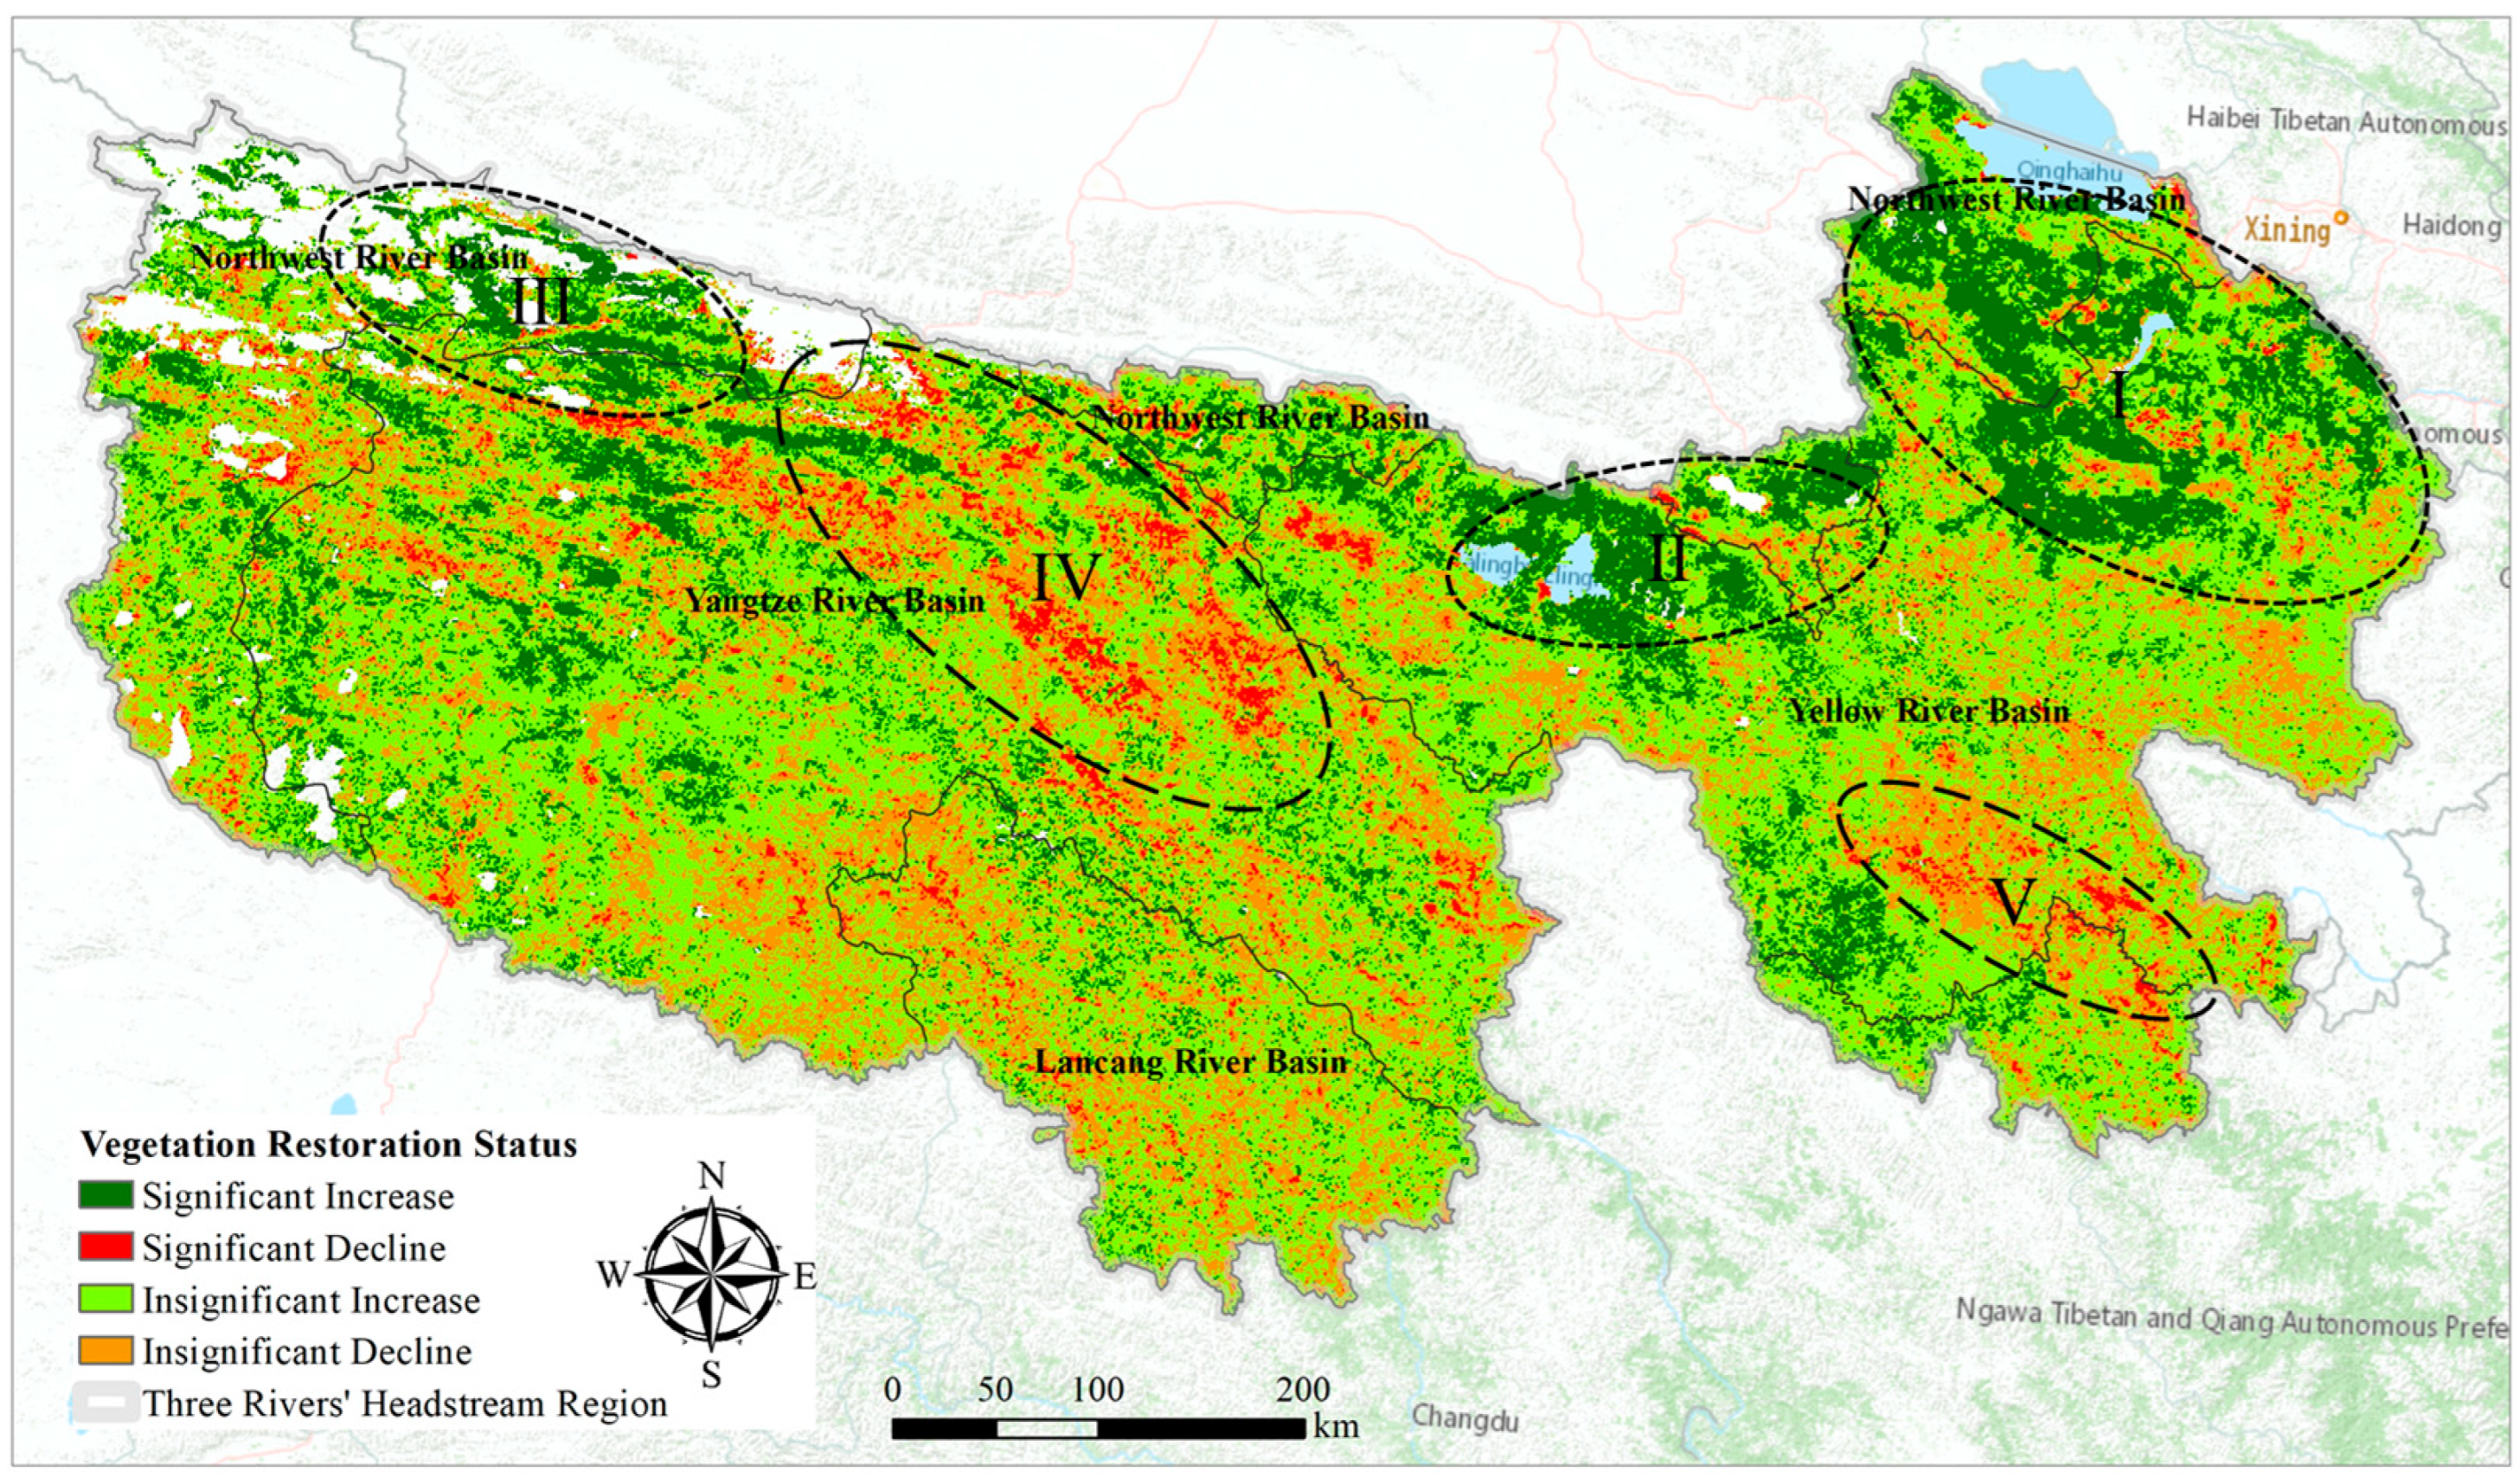
Vegetation in the TRHR was primarily in a state of increase, with 18% of the total area significantly recovered, 52% non-significantly recovered, 3% significantly degraded, and 26% non-significantly degraded. There were significant areas of vegetation decline (p < 0.05) in the Yangtze and Yellow River basins.
(3)
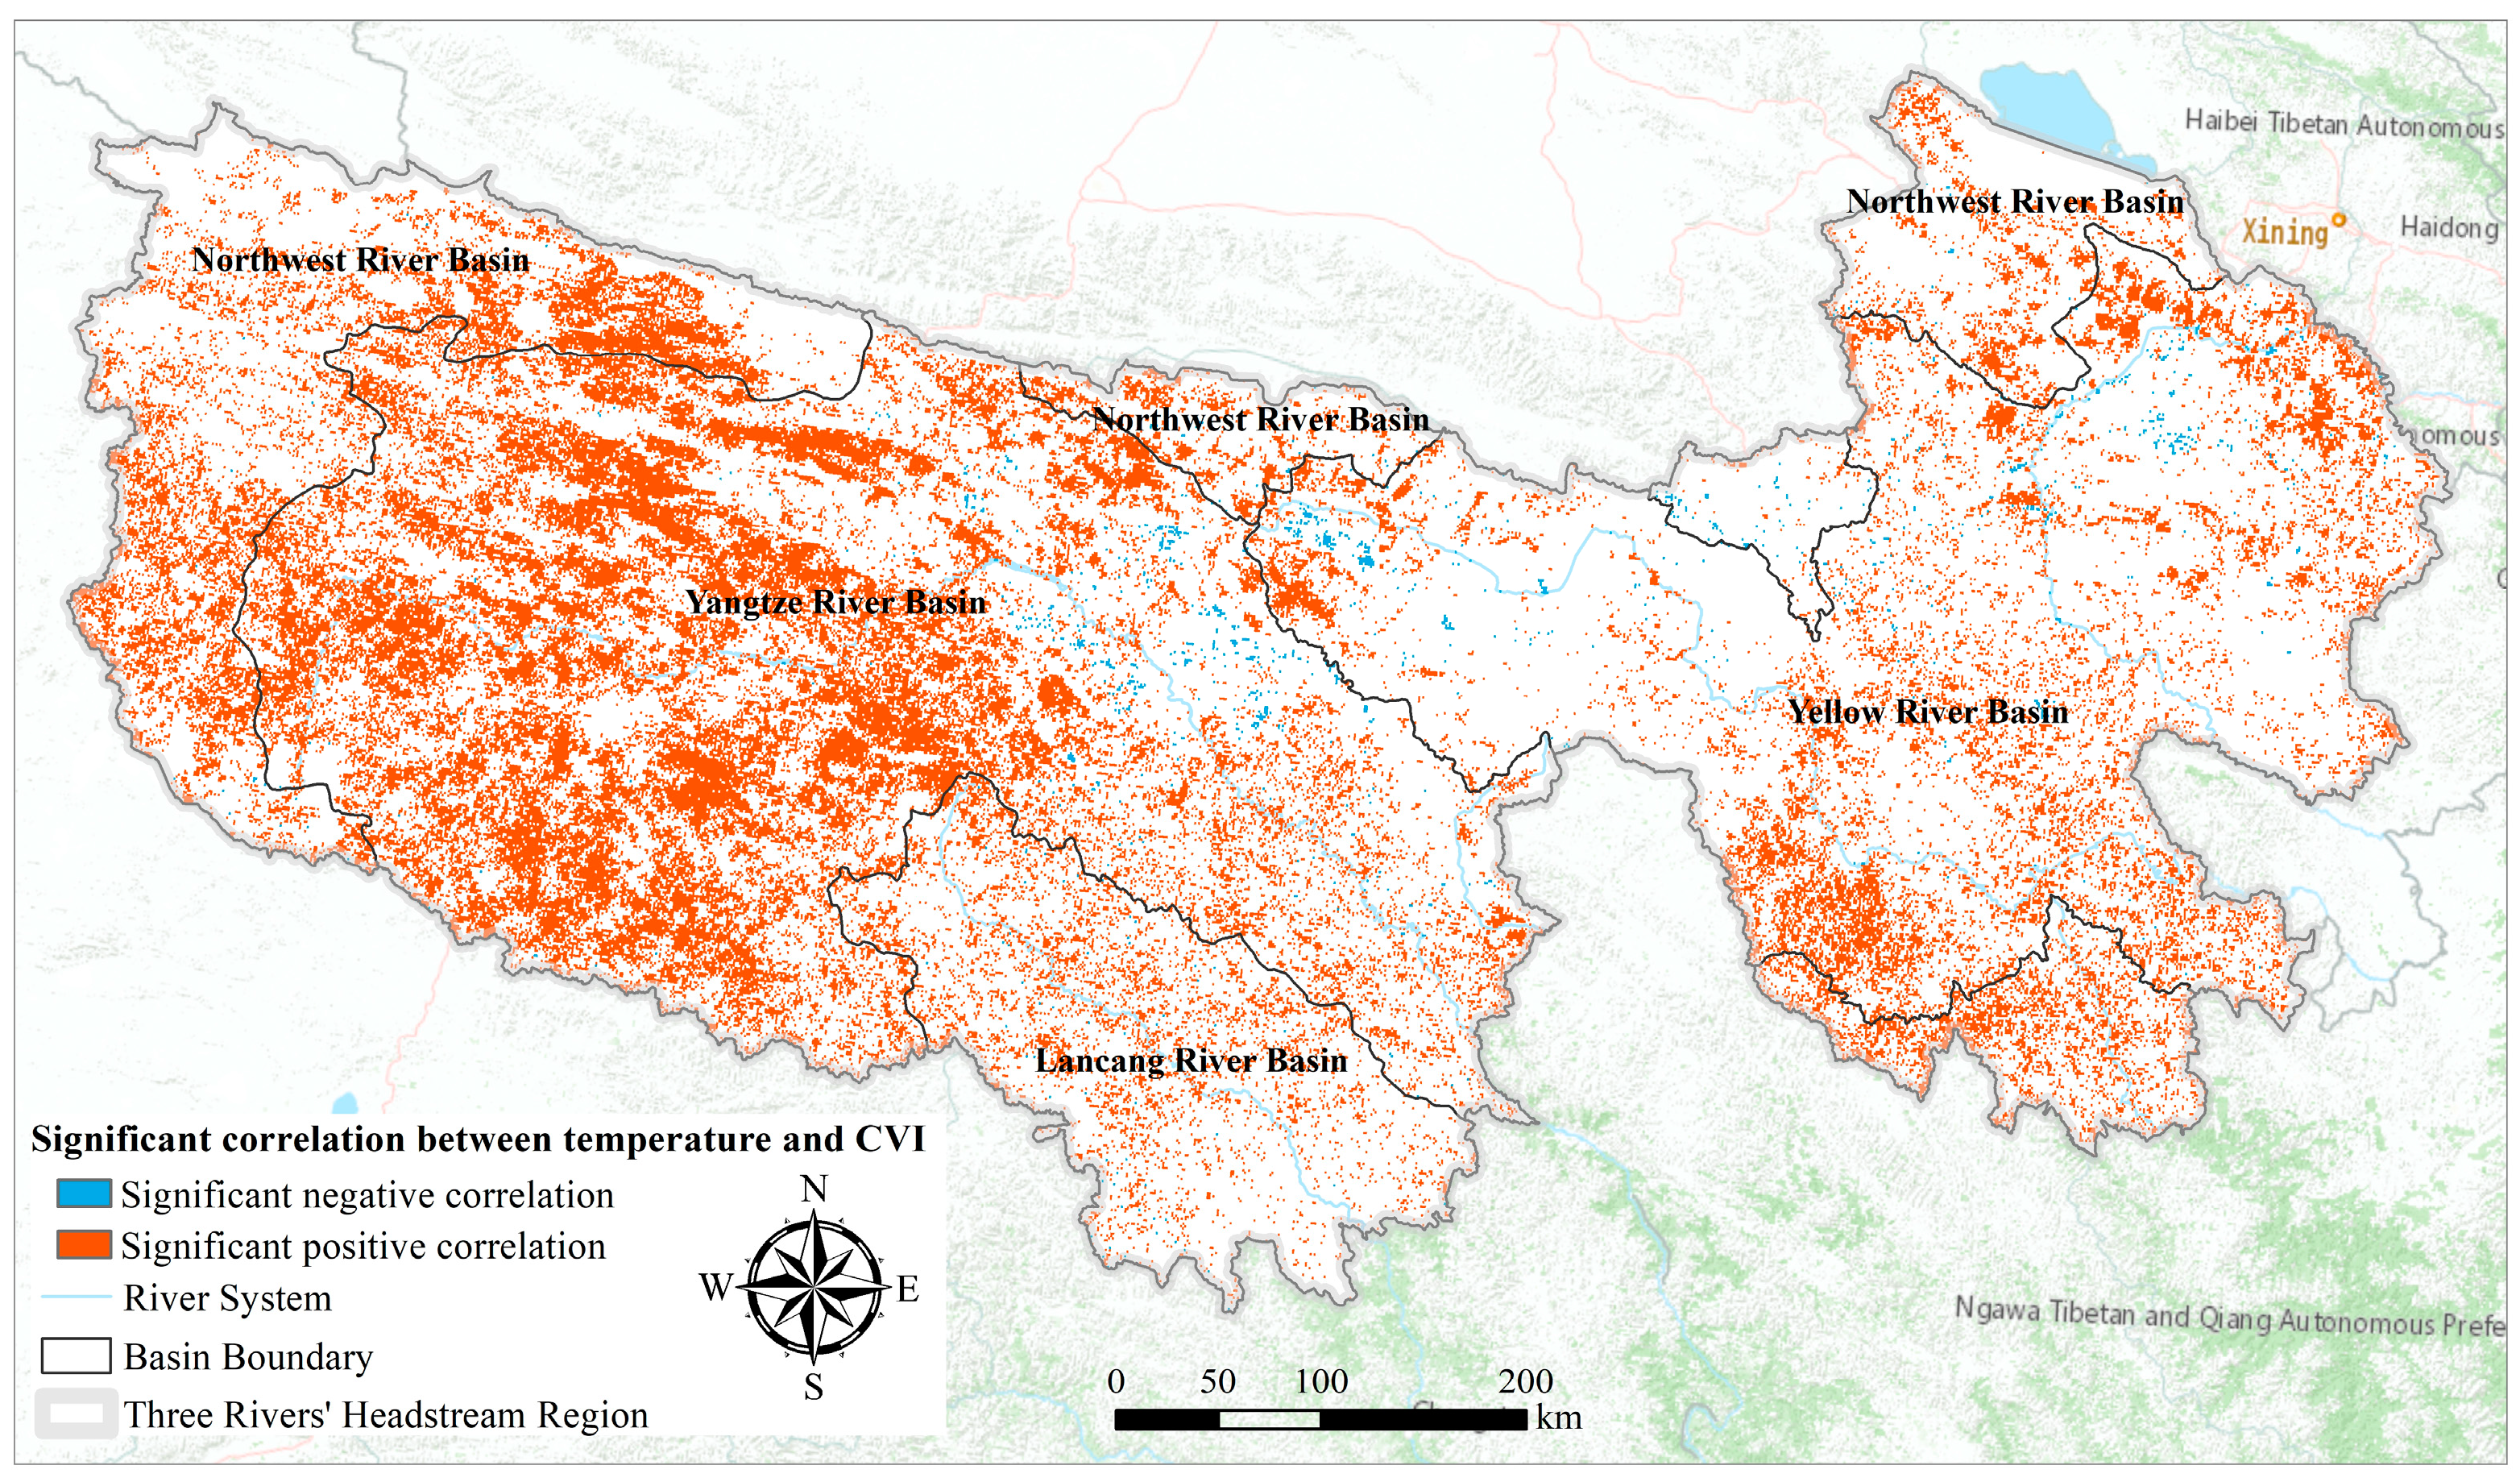
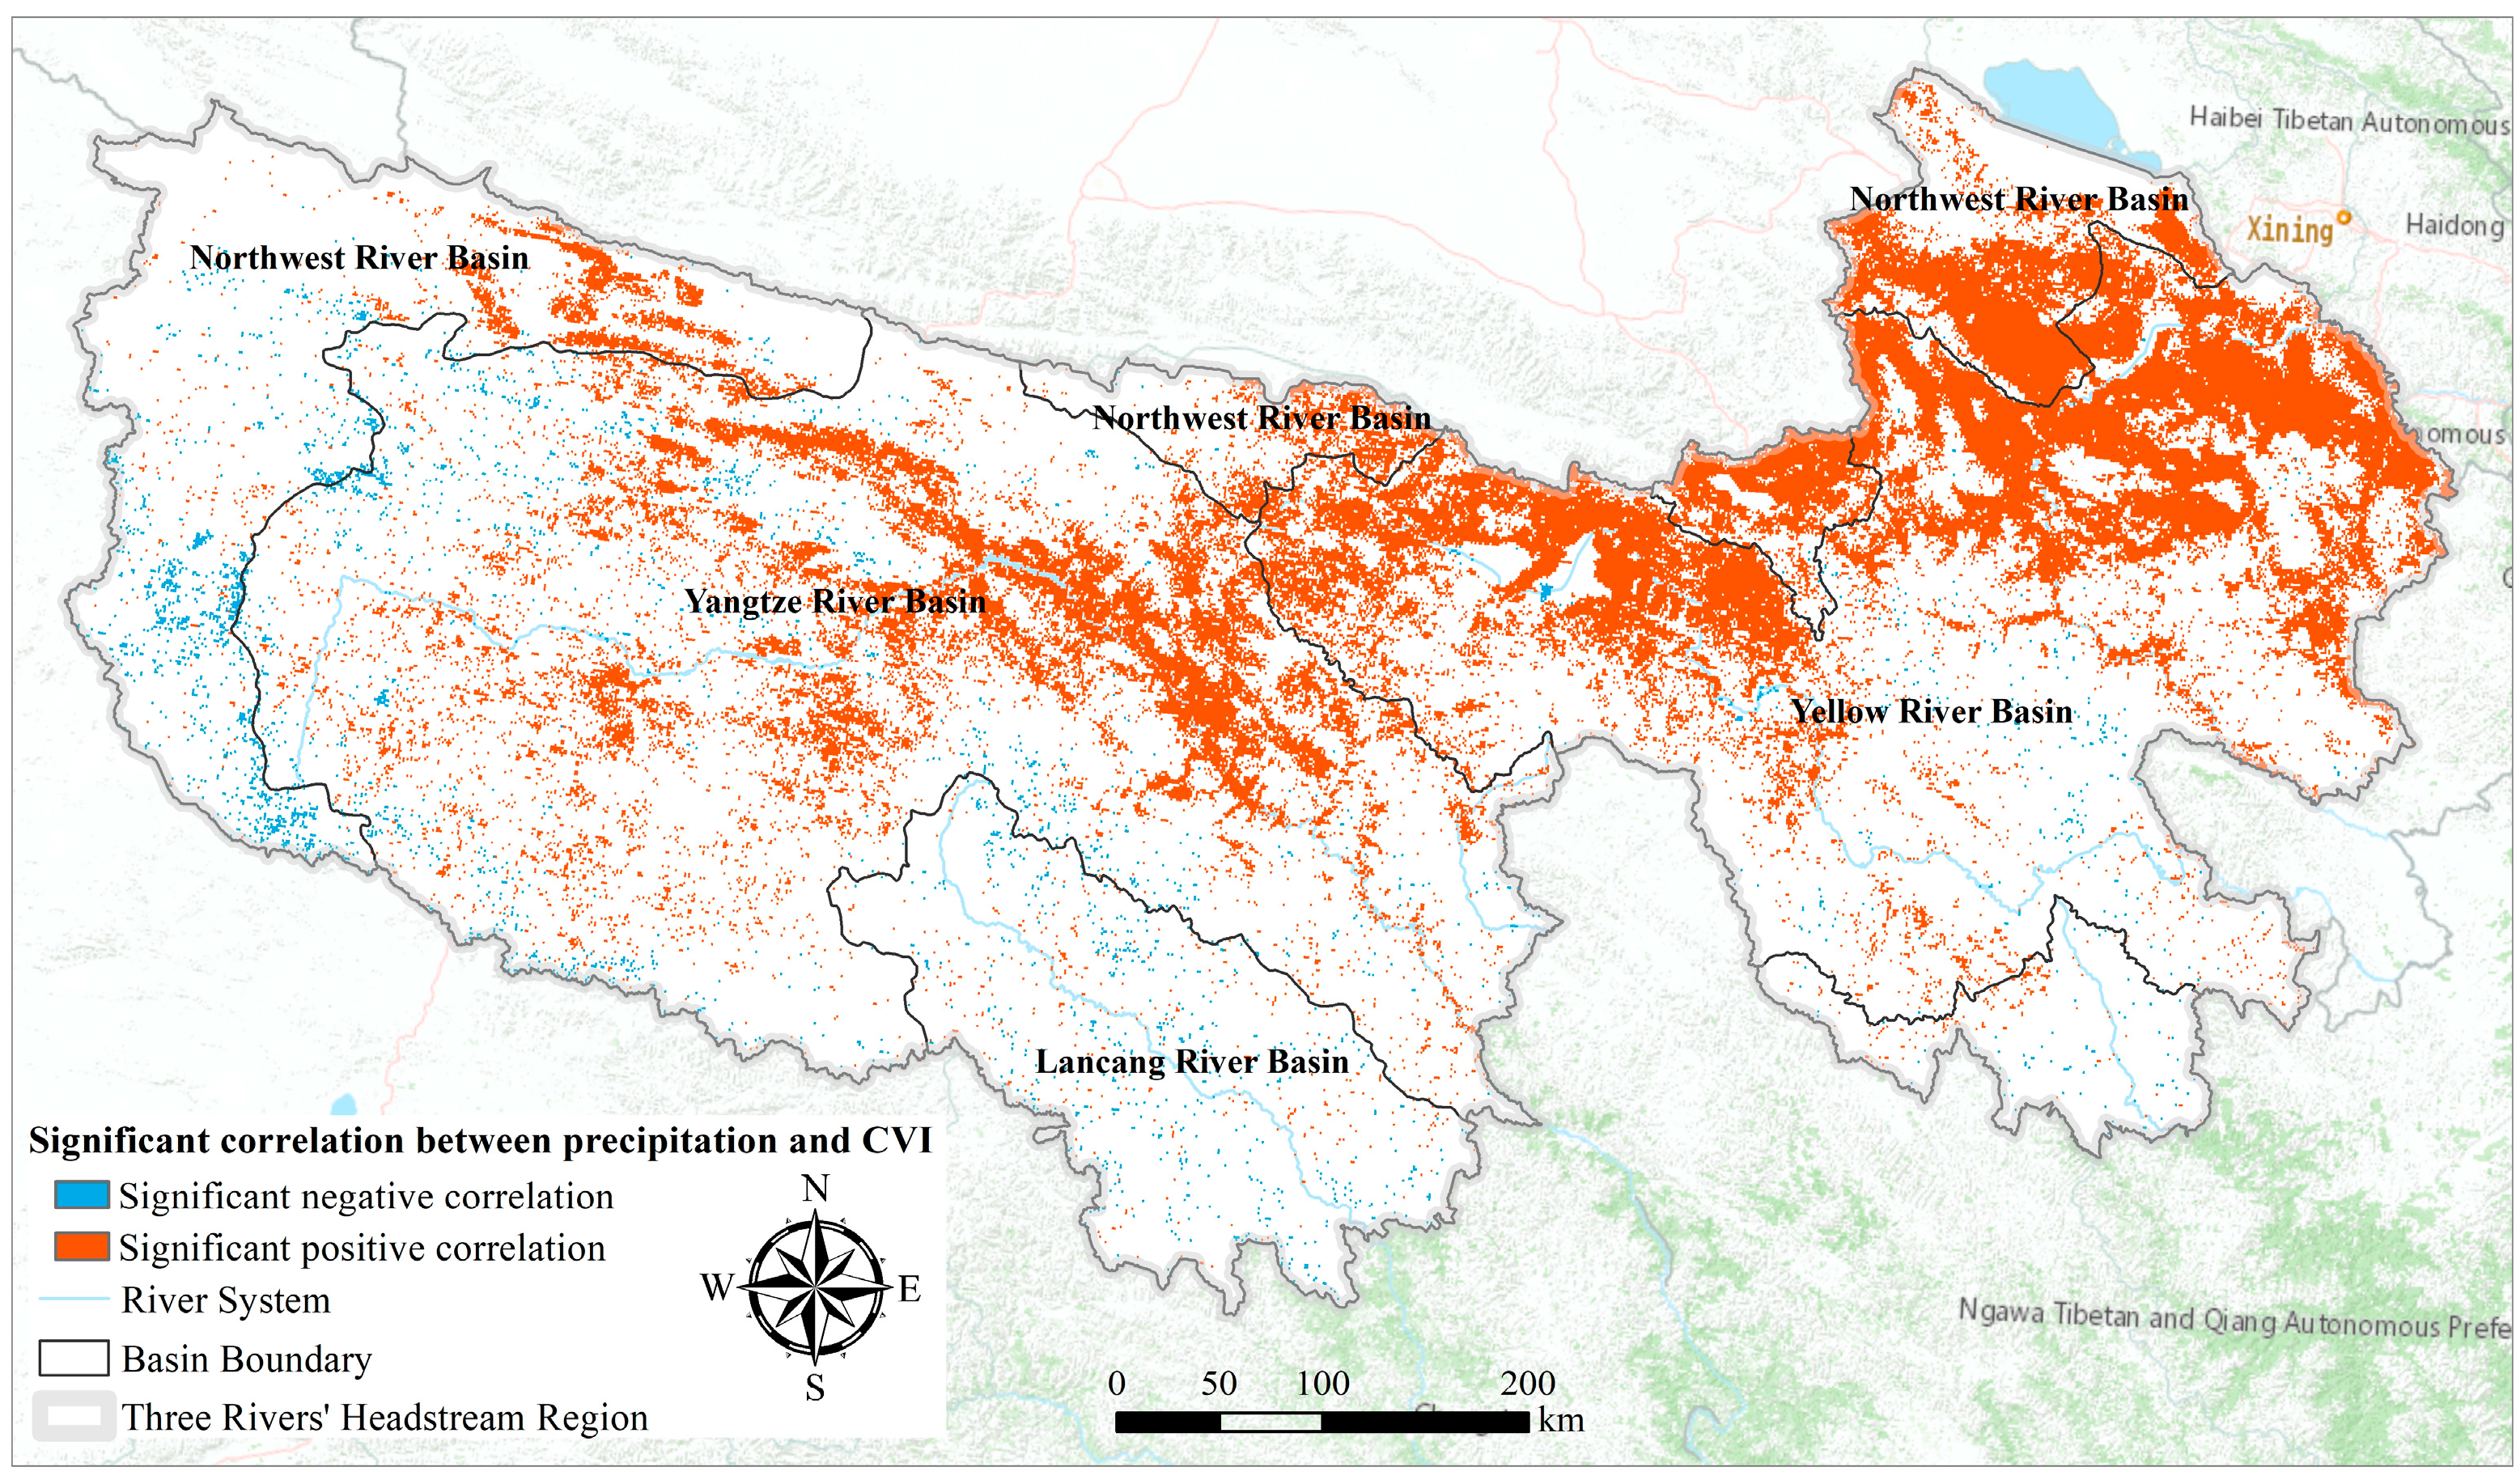
Temperature and precipitation both had a positive impact on vegetation change in the TRHR, with correlation coefficients between 0.54 and 0.55. However, the temperature had a slightly stronger impact than precipitation. The area positively affected by temperature was 14,100 km2 greater than that positively affected by precipitation, while the negatively affected area was 2330 km2 smaller.
(4)
The transformation of land use to ecological land use promoted vegetation increase in the TRHR. However, the effectiveness of increase varied in some areas due to natural resource endowment constraints. Altitude had a certain influence on vegetation increase, with the vegetation showing an increasing trend followed by a decreasing trend as altitude increased in the TRHR. With an increasing slope, the vegetation first increased and then tended to stabilize.

Author Contributions

Conceptualization, J.N.; Data curation, X.Z. and J.N.; Formal analysis, X.Z.; Investigation, X.Z.; Methodology, X.Z. and J.N.; Software, X.Z.; Supervision, X.Z.; Validation, X.Z.; Visualization, X.Z. and J.N.; Writing original draft, X.Z.; Writing—review and editing, X.Z. and J.N. All authors have read and agreed to the published version of the manuscript.

Funding

This research was funded by the National Natural Science Foundation of China, Grant No. 42171368.

Data Availability Statement

The data that support the findings of this study are available from the corresponding author upon reasonable request.

Conflicts of Interest

The authors declare no conflict of interest.

References

  1. Erb, K.H.; Fetzel, T.; Plutzar, C.; Kastner, T.; Lauk, C.; Mayer, A.; Niedertscheider, M.; Korner, C.; Haberl, H. Biomass turnover time in terrestrial ecosystems halved by land use. Nat. Geosci. 2016, 9, 674–678. [Google Scholar] [CrossRef]
  2. Bardgett, R.D.; Bowman, W.D.; Kaufmann, R.; Schmidt, S.K. A temporal approach to linking aboveground and belowground ecology. Trends Ecol. Evol. 2005, 20, 634–641. [Google Scholar] [CrossRef]
  3. Duveiller, G.; Hooker, J.; Cescatti, A. The mark of vegetation change on Earth’s surface energy balance. Nat. Commun. 2018, 9, 12. [Google Scholar] [CrossRef]
  4. Geng, G.; Zhou, H.; Wang, T. Assessing the relationship between drought and vegetation dynamics in northern China during 1982–2015. Theor. Appl. Climatol. 2022, 148, 467–479. [Google Scholar] [CrossRef]
  5. Hill, M.J.; Guerschman, J. Global trends in vegetation fractional cover: Hotspots for change in bare soil and non-photosynthetic vegetation. Agric. Ecosyst. Environ. 2022, 324, 107719. [Google Scholar] [CrossRef]
  6. Wu, Q.; Zhu, J.; Zhao, X. Effects of Human Social-Economic Activities on Vegetation Suitability in the Yellow River Basin, China. Forests 2023, 14, 234. [Google Scholar] [CrossRef]
  7. Richards, D.R.; Belcher, R.N.; Carrasco, L.R.; Edwards, P.J.; Fatichi, S.; Hamel, P.; Masoudi, M.; McDonnell, M.J.; Peleg, N.; Stanley, M. Global variation in contributions to human well-being from urban vegetation ecosystem services. One Earth 2022, 5, 522–533. [Google Scholar] [CrossRef]
  8. Shi, S.; Wang, X.; Hu, Z.; Zhao, X.; Zhang, S.; Hou, M.; Zhang, N. Geographic detector-based quantitative assessment enhances attribution analysis of climate and topography factors to vegetation variation for spatial heterogeneity and coupling. Glob. Ecol. Conserv. 2023, 42, e02398. [Google Scholar] [CrossRef]
  9. Meng, X.; Gao, X.; Li, S.; Lei, J. Spatial and temporal characteristics of vegetation NDVI changes and the driving forces in Mongolia during 1982–2015. Remote Sens. 2020, 12, 603. [Google Scholar] [CrossRef]
  10. Li, K.; Tong, Z.; Liu, X.; Zhang, J.; Tong, S. Quantitative assessment and driving force analysis of vegetation drought risk to climate change: Methodology and application in Northeast China. Agric. For. Meteorol. 2020, 282, 107865. [Google Scholar] [CrossRef]
  11. Yin, L.; Dai, E.; Zheng, D.; Wang, Y.; Ma, L.; Tong, M. What drives the vegetation dynamics in the Hengduan Mountain region, southwest China: Climate change or human activity? Ecol. Indic. 2020, 112, 106013. [Google Scholar] [CrossRef]
  12. Guerra, A.; de Oliveira Roque, F.; Garcia, L.C.; Ochoa-Quintero, J.M.; de Oliveira, P.T.S.; Guariento, R.D.; Rosa, I.M. Drivers and projections of vegetation loss in the Pantanal and surrounding ecosystems. Land Use Policy 2020, 91, 104388. [Google Scholar] [CrossRef]
  13. Abel, C.; Horion, S.; Tagesson, T.; De Keersmaecker, W.; Seddon, A.W.; Abdi, A.M.; Fensholt, R. The human–environment nexus and vegetation–rainfall sensitivity in tropical drylands. Nat. Sustain. 2021, 4, 25–32. [Google Scholar] [CrossRef]
  14. Wang, Z.; Huang, R.; Yao, Q.C.; Zong, X.Z.; Tian, X.R.; Zheng, B.; Trouet, V. Strong winds drive grassland fires in China. Environ. Res. Lett. 2023, 18, 015005. [Google Scholar] [CrossRef]
  15. Li, A.; Wu, J.G.; Zhang, X.Y.; Xue, J.G.; Liu, Z.F.; Han, X.G.; Huang, J.H. China’s new rural “separating three property rights” land reform results in grassland degradation: Evidence from Inner Mongolia. Land Use Policy 2018, 71, 170–182. [Google Scholar] [CrossRef]
  16. Dubyna, D.V.; Ennan, A.A.A.; Dziuba, T.P.; Vakarenko, L.P.; Shykhaleyeva, G.M.; Kiryushkina, H.M. Anthropogenic Transformations of Vegetation in the Kuyalnik Estuary Valley (Ukraine, Odesa District). Diversity 2022, 14, 1115. [Google Scholar] [CrossRef]
  17. Gao, J.; Zhang, Y.; Zheng, Z.; Cong, N.; Zhao, G.; Zhu, Y.; Chen, Y.; Sun, Y.; Zhang, J.; Zhang, Y. Ecological Engineering Projects Shifted the Dominance of Human Activity and Climate Variability on Vegetation Dynamics. Remote Sens. 2022, 14, 2386. [Google Scholar] [CrossRef]
  18. Li, X.; Qu, Y.; Xiao, Z. Reponses of Land Surface Albedo to Global Vegetation Greening: An Analysis Using GLASS Data. Atmosphere 2022, 14, 31. [Google Scholar] [CrossRef]
  19. Gao, W.; Zheng, C.; Liu, X.; Lu, Y.; Chen, Y.; Wei, Y.; Ma, Y. NDVI-based vegetation dynamics and their responses to climate change and human activities from 1982 to 2020: A case study in the Mu Us Sandy Land, China. Ecol. Indic. 2022, 137, 108745. [Google Scholar] [CrossRef]
  20. Chu, H.; Venevsky, S.; Wu, C.; Wang, M. NDVI-based vegetation dynamics and its response to climate changes at Amur-Heilongjiang River Basin from 1982 to 2015. Sci. Total Environ. 2019, 650, 2051–2062. [Google Scholar] [CrossRef]
  21. Elmore, A.J.; Mustard, J.F.; Manning, S.J.; Lobell, D.B. Quantifying vegetation change in semiarid environments: Precision and accuracy of spectral mixture analysis and the normalized difference vegetation index. Remote Sens. Environ. 2000, 73, 87–102. [Google Scholar] [CrossRef]
  22. Peng, W.; Kuang, T.; Tao, S. Quantifying influences of natural factors on vegetation NDVI changes based on geographical detector in Sichuan, western China. J. Clean. Prod. 2019, 233, 353–367. [Google Scholar] [CrossRef]
  23. Peng, J.; Jiang, H.; Liu, Q.; Green, S.M.; Quine, T.A.; Liu, H.; Qiu, S.; Liu, Y.; Meersmans, J. Human activity vs. climate change: Distinguishing dominant drivers on LAI dynamics in karst region of southwest China. Sci. Total Environ. 2021, 769, 144297. [Google Scholar] [CrossRef]
  24. Hu, Y.; Li, H.; Wu, D.; Chen, W.; Zhao, X.; Hou, M.; Li, A.; Zhu, Y. LAI-indicated vegetation dynamic in ecologically fragile region: A case study in the Three-North Shelter Forest program region of China. Ecol. Indic. 2021, 120, 106932. [Google Scholar] [CrossRef]
  25. Mu, B.; Zhao, X.; Wu, D.; Wang, X.; Zhao, J.; Wang, H.; Zhou, Q.; Du, X.; Liu, N. Vegetation cover change and its attribution in China from 2001 to 2018. Remote Sens. 2021, 13, 496. [Google Scholar] [CrossRef]
  26. Cai, Y.; Zhang, F.; Duan, P.; Jim, C.Y.; Chan, N.W.; Shi, J.; Liu, C.; Wang, J.; Bahtebay, J.; Ma, X. Vegetation cover changes in China induced by ecological restoration-protection projects and land-use changes from 2000 to 2020. Catena 2022, 217, 106530. [Google Scholar] [CrossRef]
  27. Guo, B.; Han, B.; Yang, F.; Chen, S.; Liu, Y.; Yang, W. Determining the contributions of climate change and human activities to the vegetation NPP dynamics in the Qinghai-Tibet Plateau, China, from 2000 to 2015. Environ. Monit. Assess. 2020, 192, 663. [Google Scholar] [CrossRef]
  28. Bai, Y.; Li, S.; Liu, M.; Guo, Q. Assessment of vegetation change on the Mongolian Plateau over three decades using different remote sensing products. J. Environ. Manag. 2022, 317, 115509. [Google Scholar] [CrossRef] [PubMed]
  29. Zhou, S.; Zhang, W.; Wang, S.; Zhang, B.; Xu, Q. Spatial–Temporal Vegetation Dynamics and Their Relationships with Climatic, Anthropogenic, and Hydrological Factors in the Amur River Basin. Remote Sens. 2021, 13, 684. [Google Scholar] [CrossRef]
  30. Deng, Y.; Li, X.; Shi, F.; Hu, X. Woody plant encroachment enhanced global vegetation greening and ecosystem water-use efficiency. Glob. Ecol. Biogeogr. 2021, 30, 2337–2353. [Google Scholar] [CrossRef]
  31. Zhou, Z.; Ding, Y.; Shi, H.; Cai, H.; Fu, Q.; Liu, S.; Li, T. Analysis and prediction of vegetation dynamic changes in China: Past, present and future. Ecol. Indic. 2020, 117, 106642. [Google Scholar] [CrossRef]
  32. Wang, F.; Pan, X.; Gerlein-Safdi, C.; Cao, X.; Wang, S.; Gu, L.; Wang, D.; Lu, Q. Vegetation restoration in N orthern China: A contrasted picture. Land Degrad. Dev. 2020, 31, 669–676. [Google Scholar] [CrossRef]
  33. Zhu, Y.; Zhang, J.; Zhang, Y.; Qin, S.; Shao, Y.; Gao, Y. Responses of vegetation to climatic variations in the desert region of northern China. Catena 2019, 175, 27–36. [Google Scholar] [CrossRef]
  34. He, C.; Yan, F.; Wang, Y.; Lu, Q. Spatiotemporal Variation in Vegetation Growth Status and Its Response to Climate in the Three-River Headwaters Region, China. Remote Sens. 2022, 14, 5041. [Google Scholar] [CrossRef]
  35. Diao, C.; Liu, Y.; Zhao, L.; Zhuo, G.; Zhang, Y. Regional-scale vegetation-climate interactions on the Qinghai-Tibet Plateau. Ecol. Inform. 2021, 65, 101413. [Google Scholar] [CrossRef]
  36. Cao, W.; Wu, D.; Huang, L.; Liu, L. Spatial and temporal variations and significance identification of ecosystem services in the Sanjiangyuan National Park, China. Sci. Rep. 2020, 10, 6151. [Google Scholar] [CrossRef] [PubMed]
  37. Sun, Q.; Liu, W.; Gao, Y.; Li, J.; Yang, C. Spatiotemporal variation and climate influence factors of vegetation ecological quality in the sanjiangyuan national park. Sustainability 2020, 12, 6634. [Google Scholar] [CrossRef]
  38. Liu, D.; Cao, C.; Dubovyk, O.; Tian, R.; Chen, W.; Zhuang, Q.; Zhao, Y.; Menz, G. Using fuzzy analytic hierarchy process for spatio-temporal analysis of eco-environmental vulnerability change during 1990–2010 in Sanjiangyuan region, China. Ecol. Indic. 2017, 73, 612–625. [Google Scholar] [CrossRef]
  39. Qu, S.; Wang, L.; Lin, A.; Zhu, H.; Yuan, M. What drives the vegetation restoration in Yangtze River basin, China: Climate change or anthropogenic factors? Ecol. Indic. 2018, 90, 438–450. [Google Scholar] [CrossRef]
  40. Gong, Y.; Ye, C.; Zhang, Q. Effects of flooding outweigh those of vegetation restoration on key processes of carbon and nitrogen cycling in a degraded riparian zone. Catena 2023, 220, 106610. [Google Scholar] [CrossRef]
  41. Zheng, D.; Wang, Y.; Hao, S.; Xu, W.; Lv, L.; Yu, S. Spatial-temporal variation and tradeoffs/synergies analysis on multiple ecosystem services: A case study in the Three-River Headwaters region of China. Ecol. Indic. 2020, 116, 106494. [Google Scholar] [CrossRef]
  42. Yang, D.; Shao, W.; Yeh, P.J.F.; Yang, H.; Kanae, S.; Oki, T. Impact of vegetation coverage on regional water balance in the nonhumid regions of China. Water Resour. Res. 2009, 45. [Google Scholar] [CrossRef]
  43. Ning, J.; Liu, J.; Kuang, W.; Xu, X.; Zhang, S.; Yan, C.; Li, R.; Wu, S.; Hu, Y.; Du, G. Spatiotemporal patterns and characteristics of land-use change in China during 2010–2015. J. Geogr. Sci. 2018, 28, 547–562. [Google Scholar] [CrossRef]
  44. Kuang, W.; Zhang, S.; Du, G.; Yan, C.; Wu, S.; Li, R.; Lu, D.; Pan, T.; Ning, J.; Guo, C.; et al. Remotely sensed mapping and analysis of spatio-temporal patterns of land use change across China in 2015–2020. Acta Geogr. Sin. 2022, 77, 1056–1071. [Google Scholar]
  45. Mu, X.; Song, W.; Gao, Z.; McVicar, T.R.; Donohue, R.J.; Yan, G. Fractional vegetation cover estimation by using multi-angle vegetation index. Remote Sens. Environ. 2018, 216, 44–56. [Google Scholar] [CrossRef]
  46. Galanis, P. The Delphi method. Arch. Hell. Med. 2018, 35, 564–570. [Google Scholar]
  47. Liu, G.; Shao, Q.; Fan, J.; Ning, J.; Huang, H.; Liu, S.; Zhang, X.; Niu, L.; Liu, J. Spatio-Temporal Changes, Trade-Offs and Synergies of Major Ecosystem Services in the Three-River Headwaters Region from 2000 to 2019. Remote Sens. 2022, 14, 5349. [Google Scholar] [CrossRef]
  48. Sen, P.K. Estimates of the regression coefficient based on Kendall’s tau. J. Am. Stat. Assoc. 1968, 63, 1379–1389. [Google Scholar] [CrossRef]
  49. Piao, S.; Nan, H.; Huntingford, C.; Ciais, P.; Friedlingstein, P.; Sitch, S.; Peng, S.; Ahlström, A.; Canadell, J.G.; Cong, N. Evidence for a weakening relationship between interannual temperature variability and northern vegetation activity. Nat. Commun. 2014, 5, 5018. [Google Scholar] [CrossRef]
  50. Song, Y.; Ma, M. A statistical analysis of the relationship between climatic factors and the Normalized Difference Vegetation Index in China. Int. J. Remote Sens. 2011, 32, 3947–3965. [Google Scholar] [CrossRef]
  51. Shen, X.; An, R.; Feng, L.; Ye, N.; Zhu, L.; Li, M. Vegetation changes in the three-river headwaters region of the tibetan plateau of china. Ecol. Indic. 2018, 93, 804–812. [Google Scholar] [CrossRef]
  52. Bai, Y.; Guo, C.; Degen, A.A.; Ahmad, A.A.; Wang, W.; Zhang, T.; Li, W.; Ma, L.; Huang, M.; Zeng, H. Climate warming benefits alpine vegetation growth in Three-River Headwater Region, China. Sci. Total Environ. 2020, 742, 140574. [Google Scholar] [CrossRef] [PubMed]
  53. Gao, S.; Dong, G.; Jiang, X.; Nie, T.; Yin, H.; Guo, X. Quantification of Natural and Anthropogenic Driving Forces of Vegetation Changes in the Three-River Headwater Region during 1982–2015 Based on Geographical Detector Model. Remote Sens. 2021, 13, 4175. [Google Scholar] [CrossRef]
  54. Guo, B.; Wang, J.; Mantravadi, V.S.; Zhang, L.; Liu, G. Effect of climate and ecological restoration on vegetation changes in the “Three-River Headwaters” region based on remote sensing technology. Environ. Sci. Pollut. Res. 2022, 29, 16436–16448. [Google Scholar] [CrossRef] [PubMed]
  55. Wang, K.; Zhou, Y.; Han, J.; Chen, C.; Li, T. Long-Term Tibetan Alpine Vegetation Responses to Elevation-Dependent Changes in Temperature and Precipitation in an Altered Regional Climate: A Case Study for the Three-Rivers Headwaters Region, China. Remote Sens. 2023, 15, 496. [Google Scholar] [CrossRef]
  56. Shao, Q.; Cao, W.; Fan, J.; Huang, L.; Xu, X. Effects of an ecological conservation and restoration project in the Three-River Source Region, China. J. Geogr. Sci. 2017, 27, 183–204. [Google Scholar] [CrossRef]
  57. Wang, Y.; Cheng, C.; Xie, Y.; Liu, B.; Yin, S.; Liu, Y.; Hao, Y. Increasing trends in rainfall-runoff erosivity in the Source Region of the Three Rivers, 1961–2012. Sci. Total Environ. 2017, 592, 639–648. [Google Scholar] [CrossRef]
  58. Han, Z.; Song, W.; Deng, X.; Xu, X. Grassland ecosystem responses to climate change and human activities within the Three-River Headwaters region of China. Sci. Rep. 2018, 8, 9079. [Google Scholar] [CrossRef]
  59. Fan, J.-W.; Shao, Q.-Q.; Liu, J.-Y.; Wang, J.-B.; Harris, W.; Chen, Z.-Q.; Zhong, H.-P.; Xu, X.-L.; Liu, R.-G. Assessment of effects of climate change and grazing activity on grassland yield in the Three Rivers Headwaters Region of Qinghai–Tibet Plateau, China. Environ. Monit. Assess. 2010, 170, 571–584. [Google Scholar] [CrossRef]
  60. He, X.; Yu, Y.; Cui, Z.; He, T. Climate change and ecological projects jointly promote vegetation restoration in three-river source region of China. Chin. Geogr. Sci. 2021, 31, 1108–1122. [Google Scholar] [CrossRef]
  61. Mu, B.; Zhao, X.; Zhao, J.; Liu, N.; Si, L.; Wang, Q.; Sun, N.; Sun, M.; Guo, Y.; Zhao, S. Quantitatively Assessing the Impact of Driving Factors on Vegetation Cover Change in China’s 32 Major Cities. Remote Sens. 2022, 14, 839. [Google Scholar] [CrossRef]
  62. Zhu, Z.; Piao, S.; Myneni, R.B.; Huang, M.; Zeng, Z.; Canadell, J.G.; Ciais, P.; Sitch, S.; Friedlingstein, P.; Arneth, A. Greening of the Earth and its drivers. Nat. Clim. Chang. 2016, 6, 791–795. [Google Scholar] [CrossRef]
  63. Shi, S.Y.; Yu, J.J.; Wang, F.; Wang, P.; Zhang, Y.C.; Jin, K. Quantitative contributions of climate change and human activities to vegetation changes over multiple time scales on the Loess Plateau. Sci. Total Environ. 2021, 755, 142419. [Google Scholar] [CrossRef]
  64. Shi, Y.; Jin, N.; Ma, X.L.; Wu, B.Y.; He, Q.S.; Yue, C.; Yu, Q. Attribution of climate and human activities to vegetation change in China using machine learning techniques. Agric. For. Meteorol. 2020, 294, 108146. [Google Scholar] [CrossRef]
  65. Wood, S.N. Inference and computation with generalized additive models and their extensions. Test 2020, 29, 307–339. [Google Scholar] [CrossRef]
Figure 1. Geographical location (a) and elevation spatial distribution (b) of the TRHR.
Land 12 01127 g001
Figure 2. The process framework in this study.
Land 12 01127 g002
Figure 3. Trend of CVI changes in various watersheds in the TRHR (a) and the proportion of different vegetation increase levels in each watershed (b).
Land 12 01127 g003
Figure 4. Spatial distribution of vegetation restoration status in the TRHR.
Land 12 01127 g004
Figure 5. Spatial distribution of annual average temperature (a) and trend of annual average temperature change (b) in the TRHR from 2000 to 2019.
Land 12 01127 g005
Figure 6. Spatial distribution of annual average precipitation (a) and trend of annual average precipitation change (b) in the TRHR from 2000 to 2019.
Land 12 01127 g006
Figure 7. Significant correlation between temperature and CVI.
Land 12 01127 g007
Figure 8. Significant correlation between precipitation and CVI.
Land 12 01127 g008
Figure 9. Changes in different land use/ cover types in the TRHR (a), YTRB (b), YLRB (c), LCRB (d), and LCRB (e).
Land 12 01127 g009
Figure 10. The transfer status of different land use/cover types in the TRHR from 2000 to 2005 (a), 2005 to 2010 (b), 2010 to 2015 (c), and 2015 to 2020 (d).
Land 12 01127 g010
Figure 11. The annual average (a) and change slope (b) of CVI at different altitudes, and the annual average (c) and change slope (d) of CVI at different slopes.
Land 12 01127 g011
Table 1. Three-River Headwaters Region vegetation restoration assessment form from 2000 to 2019.
CategoriesTheil-Sen Median
β Value
Mann–Kenddall
p Value
Significant decline<0p ≤ 0.05
Significant increase>0p ≤ 0.05
Insignificant decline<0p > 0.05
Insignificant increase>0p > 0.05
Table 2. CVI corresponding to land use data in different years of the TRHR.
NumberLUCCCorresponding CVIProcessing Method
120002000–2002Average
220052003–2007Average
320102008–2012Average
420152013–2017Average
520202018–2019Average
Disclaimer/Publisher’s Note: The statements, opinions and data contained in all publications are solely those of the individual author(s) and contributor(s) and not of MDPI and/or the editor(s). MDPI and/or the editor(s) disclaim responsibility for any injury to people or property resulting from any ideas, methods, instructions or products referred to in the content.

