
Bioeconomy Innovation Networks in Urban Regions: The Case of Stuttgart


1
Department of Innovation Economics (520i), University of Hohenheim, 70599 Stuttgart, Germany
2
Department of Bioeconomy (520m), University of Hohenheim, 70599 Stuttgart, Germany
*
Author to whom correspondence should be addressed.
Land 2023, 12(4), 935; https://doi.org/10.3390/land12040935
Submission received: 17 March 2023
/
Revised: 16 April 2023
/
Accepted: 18 April 2023
/
Published: 21 April 2023
(This article belongs to the Special Issue Sustainable Land-Based Bioeconomy Development)
Abstract
:For a successful transformation towards a sustainable bioeconomy, cooperative knowledge creation leading to innovations through research at the company and academic level are important. Urban regions are the centre of economic and research activities. The example of the region of Stuttgart, which aims to complement its mature industrial structure with new opportunities related to the knowledge-based bioeconomy, is an interesting case for the application of social network analysis to shed light on the dynamics of innovation networks to support the transformation of urban regions. As with smaller spatial levels of observation connectivity in network decreases, we find a scale-free network structure for the supra-regional network and a star-like network structure for the regional network, with two universities and one transfer-oriented research institutes at the core. While research collaborations beyond regional borders and across different industries foster knowledge co-creation, the central actors can be recognized as gatekeepers who dominantly influence knowledge flows. To potentially strengthen the resilience of the network, policy and industry associations serving as network facilitators can foster collaboration between periphery actors. The case of the Stuttgart region impressively illustrates the opportunities of the knowledge-based bioeconomy for urban regions and the complementary role traditional manufacturing sectors can take in the transformation towards higher degrees of sustainability.
1. Introduction
In light of grand sustainability challenges (e.g., natural disasters, poverty, climate change, ecosystem decline, and depleting natural resources), the bioeconomy concept has gained political momentum in recent years and entered national and international economic strategies. With the implementation of new bio-based products, processes, and methods, the bioeconomy aims to overcome existing path dependencies on fossil resources [1,2,3,4] and promote a bio-based (and digital) knowledge society [5,6,7], generating opportunities for ‘green growth’ [8]. Thereby, the potential of the bioeconomy is often emphasized, particularly for peripheral regions with predominant agricultural land use [8,9]. However, the integration of bioeconomic knowledge can also play an important role in industrial sectors by providing new technological opportunities. The potential for cross-fertilization between bioeconomic knowledge and the knowledge and competences of different manufacturing sectors is enormous. Process engineering, informatics and robotics, machine tools, energy, packaging, and pharmaceutical industries are examples of sectors where the bioeconomy opens up new technological opportunities [1]. Against this background, urban spaces that are not initially in the focus of bioeconomy considerations become relevant. This also holds true for the role of knowledge generation and innovation networks, which has long been emphasized in innovation research, but mainly in agricultural-dominated, peripheral regions or with a specific technological focus (e.g., on biotechnology) rather than in highly developed metropolitan areas. With our research, we attempt to include urban regions into this important debate by highlighting the potential of the knowledge-based bioeconomy for metropolitan areas.
Bioeconomy is defined as “the production, exploitation and use of biological resources, processes and systems to provide products, processes and services across all economic sectors within the framework of a future-oriented economy” [2]. With the importance of new technologies and processes in mind, the concept is also referred to as knowledge-based bioeconomy [10,11]. In bioeconomy strategies, such as the bioeconomy strategy of Germany or Baden-Wuerttemberg, rural development is stressed as particularly important for sustainable development, as the establishment of local production facilities close to the origin of biomass providers fosters economic development in these regions. Thereby, value creation in rural areas increases, making these areas more attractive for qualified labour [2,12], relieving urban centres, and reducing agglomeration disadvantages, such as high prices, social inequalities, or high environmental pollution. While the potential for rural areas is undisputed, the role of urban regions in the bioeconomy also needs to be discussed. We argue that in the context of the bioeconomy, a high complementarity exists between rural and urban areas, as well as the potential for the cross-fertilization of competencies that can be found in metropolitan areas. Urban regions are usually the centre of economic activity and knowledge creation, leading to (interdisciplinary) innovation through research on the company and academic level, which are emphasized by the German national bioeconomy strategy [2]. Knowledge, necessary for a bioeconomy transformation, should be created cooperatively by diverse stakeholders from all system levels [13], for example, through research associations and through cooperation. The production of new knowledge and the recombination of existing knowledge provide the foundation for innovation [14]. Research networks play a crucial role in these processes, and, thus, for the competitiveness of companies, sectors, and regions as they facilitate novel ideas, enable access and exchange of resources, and enhance knowledge transfer [15,16]. Research collaborations between industry and research at an early stage in the innovation process are especially relevant to integrate market considerations [2].
Innovation policy can promote research collaborations and innovations with bioeconomy focus through funding. For Germany, the extent to which the bioeconomy transformation is reflected in research funds and projects has been analysed in terms of stakeholders involved and the thematic focus [17,18]. Bioeconomy research and development networks in Germany [19] as well as German biotechnology clusters have been assessed with regard to knowledge flows and spillovers at the firm and/or public organization level [20,21,22,23] as well as at the regional level [24,25]. Other studies analysed the German wood-based bioeconomy network [26] and German-Danish marine biotechnology value chains [27]. In the context of urban areas, bioeconomy has been discussed with regard to an “urban bioeconomy metabolism” [28], green innovation areas [29], urban green infrastructure [30] and urban agriculture [30,31] as well as the circular economy, waste management, and environmental value creation [32,33,34]. Green infrastructure, urban farming, and biowaste valorisation are also main associations with the term “urban bioeconomy” [35]. Hence, the existing literature on urban bioeconomy focuses on ecosystem services and resources that can be provided in metropolitan areas. Thus far, knowledge processes in bioeconomy innovation networks in urban regions are not explored.
To address this gap, we raise two research questions: (1) What is the structure of the bioeconomic innovation network in the Stuttgart region? (2) How does this structure influence bioeconomic knowledge processes and innovation? We attempt to answer our research questions by drawing on the example of the industrial region of Stuttgart, encompassing six NUTS 3 regions, namely the state capital Stuttgart and five surrounding districts 1. By conducting a social network analysis based on research cooperations related to bioeconomy topics, we identify relevant actors, their networks, and important bioeconomic research fields in the region. Therefore, our research objectives are twofold. First, we aim to analyse knowledge creation processes in terms of the actors involved in publicly funded bioeconomy research and development projects and the thematic focus of these projects. Second, we discuss the effect of the network structure on the creation and diffusion of bioeconomic knowledge within the region. Our results reveal that the structure of the bioeconomy research network in the Stuttgart region depends on the spatial level of observation. While we find a scale-free network structure for the supra-regional network, the structure of the network composed only of local actors exhibits a star-like structure. We identify three central actors: The University of Hohenheim, the Fraunhofer institutes, and the University of Stuttgart. While the high number of research cooperations beyond the regional border enables the flow of new knowledge into the region, the central actors can be recognized as gatekeepers who can influence—either foster or inhibit—the diffusion of knowledge within the region. Moreover, the wide range of actors from different industries participating in bioeconomic research projects depict the intersectoral nature of the bioeconomy. To increase the resilience of the network, we conclude that the ties between the central actors should be strengthened and that collaboration between currently less connected or unconnected actors should be supported.
2. Materials and Methods
By means of a social network analysis [36,37], bioeconomic projects, topics, and actors in the region of Stuttgart are identified based on collaborations in research and development projects. Knowledge networks are extensively studied in the form of scientific collaboration networks [38,39,40,41,42]. The analysis of regional knowledge networks helps to illustrate knowledge flows as well as their barriers and can reveal promising fields of action for fostering innovation, considering the particularities of the region and the respective actors.
2.1. Data Collection and Preparation
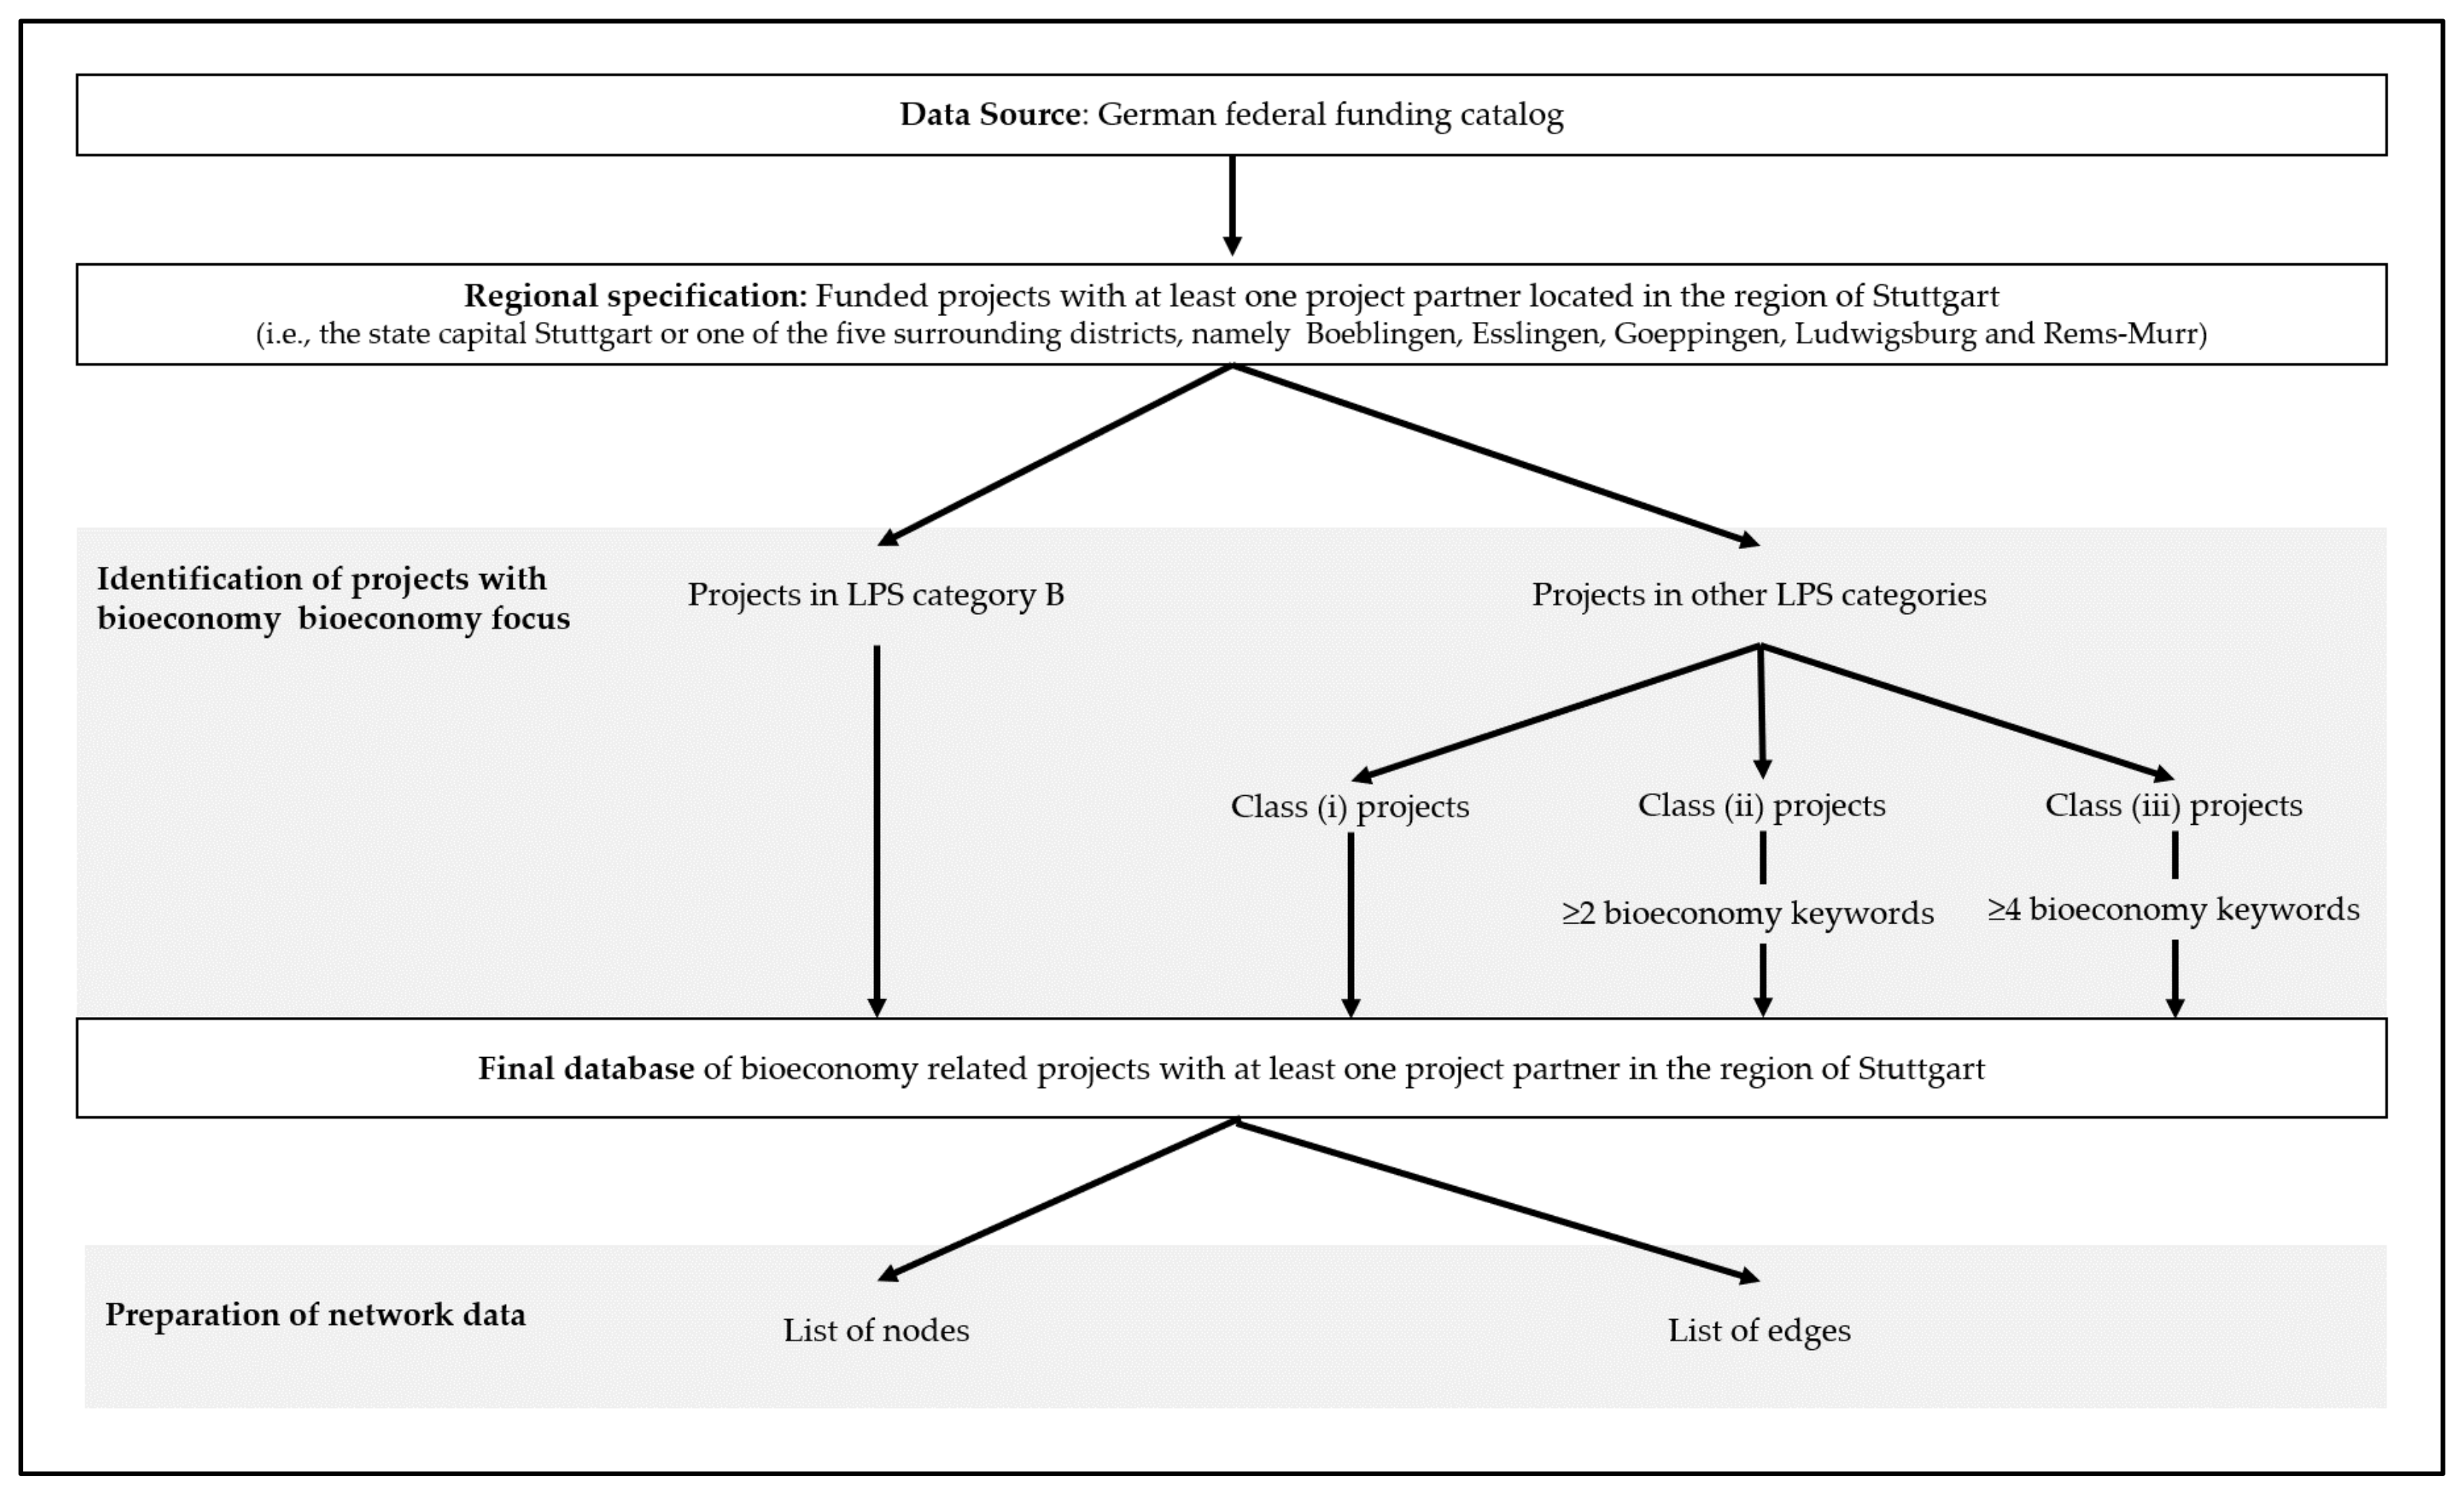
Following existing research on innovation networks [17,19,43,44,45], the German federal government’s funding catalogue [46] serves as the primary data source for our analysis. We extracted the data on 5 September 2022. As a publicly available database, the funding catalogue contains information on more than 110,000 completed and ongoing projects funded by the German federal government. The first entry in the database is dated 1968. The projects listed in the database are grouped into 21 different research areas with subordinate research priorities according to the federal government’s performance plan system (called Leistungsplanssystematik (LPS)). A separate LPS category “B—Bioeconomy” exists for projects in the bioeconomy field. However, with respect to the database and the LPS classification, two aspects stand out which [19] and [18] also highlight. First, the earliest entry in the LPS category “B—Bioeconomy” dates to 1968. However, the first bioeconomy strategy was not published until 2010. The author of [19] explains this by pointing out that until 2012, the LPS category “B” was still referred to as biotechnology instead of bioeconomy. Since biotechnology is an integral component of the bioeconomy, this is not a limitation for our analysis. Second, many projects that consider bioeconomy issues are classified in other LPS categories. For example, [18] identify topics such as “EB1920—Energetic use of biomass,” “GC2060—Organic electronics,” or “KA1210—Nanobiotechnology” that can clearly be assigned to the bioeconomy concept but are not in the corresponding LPS category. To include bioeconomic projects assigned to other LPS categories in the analysis, we replicate the computational keyword analysis from [18] with an adjusted keyword list (see Appendix A) in an R code to match our understanding of the bioeconomy concept. In doing so, we identify those projects that have a bioeconomic focus and in which at least one project partner is located in the Stuttgart region. We assign those LPS categories not assigned to a project class by [18] (see Figure 1) manually.
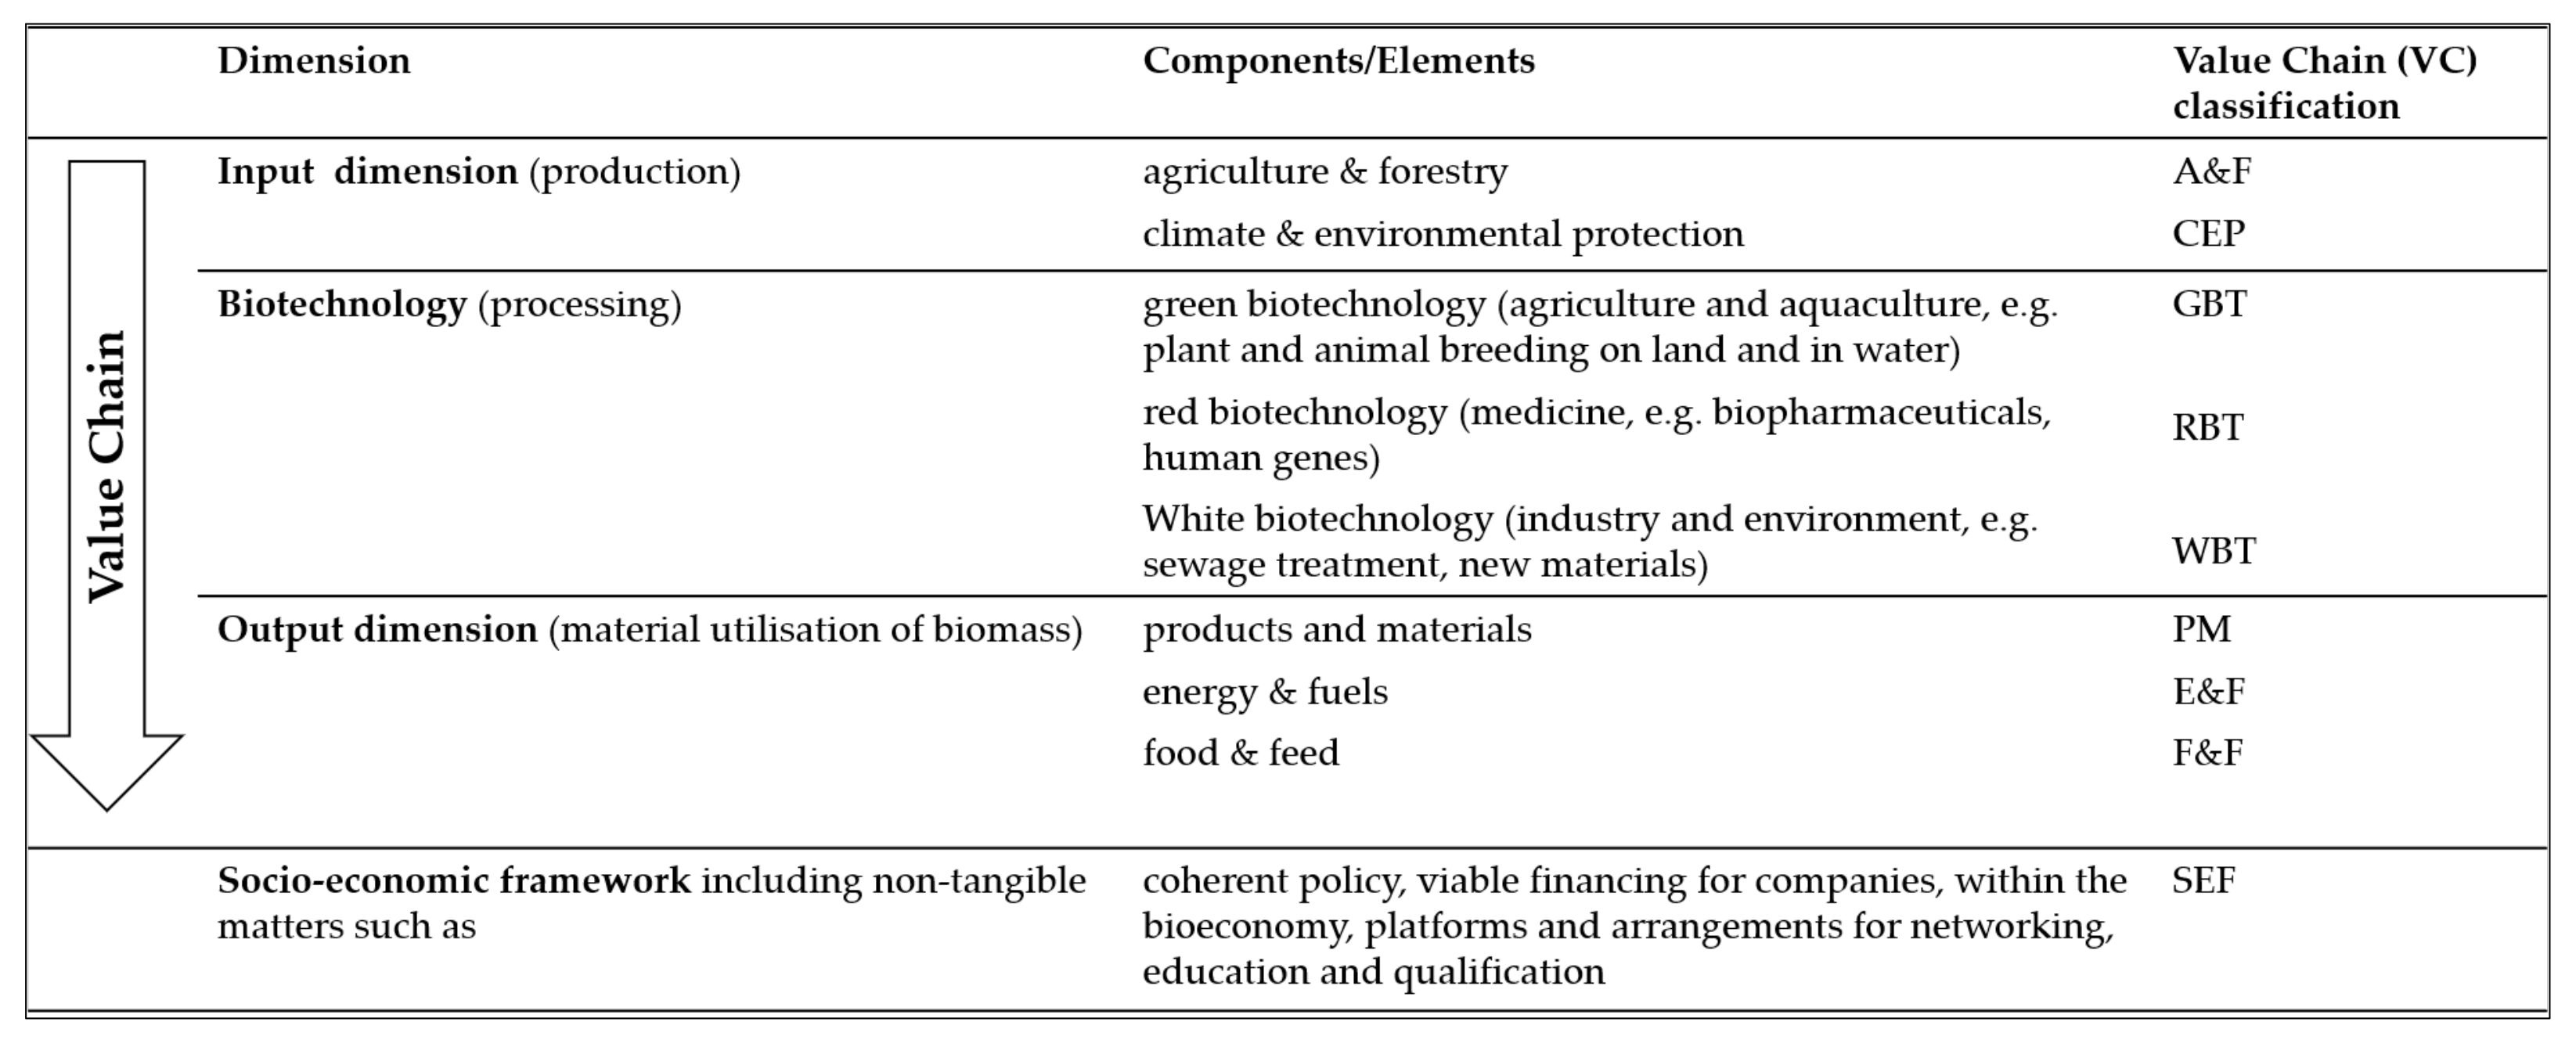
The network data cannot be extracted directly from the funding catalogue but is created from the project information in this database. To identify the actors (i.e., nodes) in the network, we use information on the recipients of the funds. While the information on the executing entities (i.e., departments or institutes within the funding receiving organization that carry out the project) allows for a more precise analysis of the actors involved in the project, it would lead to data noise and would make it difficult to identify central actors in the network, since some organizations would be depicted multiple times under different department names. To identify the cooperative links (i.e., edges) between the actors, we used information on the collaborative projects. Moreover, we classify the projects according to the proposed structure of the bioeconomy along the value creation process from [18], as outlined in Figure 2.
We extract and prepare the network data using a second computational R code. This R code creates a list of nodes and a list of edges for the network construction. In the nodes list, a unique identifier is added to each actor (i.e., node) in order to compile the edge list in the next step. By matching the list of nodes with the database, we add information on the time period in which each actor engaged in a bioeconomic project and the location of the actor (i.e., in the Stuttgart Region, outside the Stuttgart Region in Baden-Württemberg, or outside the Baden-Württemberg Region). Data on the period of the collaboration between the actors, the value chain (VC) classification according to [18], and the name of the project are appended to the list of edges. Apart from the VC classification outlined in Figure 2, a category (MIX) for projects that cannot be clearly assigned to one of the other VC categories, as well as for nodes that engage in multiple projects with different VC categories, is added in line with [18]. Figure 1 summarizes the data collection and preparation process.
2.2. Social Network Analysis
For the representation and statistical analysis of the network data, we use the open-source software Gephi [47]. For the network representation, we apply the Force Atlas layout 2 [48] and rank the nodes according to their degree 3. In addition to a static examination of the network, we perform a dynamic analysis to observe changes in the network over time. The examination of the overall network is based firstly on the locality of the actors and secondly on the bioeconomic focus of the project based on the VC categories. In addition, we analyse the current regional bioeconomy network in 2022 in detail to identify regional peculiarities. In this context, the actors are manually classified according to relevant bioeconomic sectors following [49] by two researchers.
In addition to visual observations of the network, statistical calculations provide information on the network structures and their changes. Measures on the global network level and individual actor level allow inferences on knowledge diffusion in the network. At the network level, besides an analysis of the general network structure, we calculate the graph density [50], the average clustering coefficient [51], and the number of connected components [52]. At the actor level, we look at the regional actors in the bioeconomy network. Not all nodes play an equally important role with regard to the network structure. Actor-related centrality measures (e.g., degree, closeness, and betweenness centrality) provide insights into the relative importance of a node in a network [53,54]. All of these statistical values are automatically calculated by the open-source software Gephi [47].
3. Results
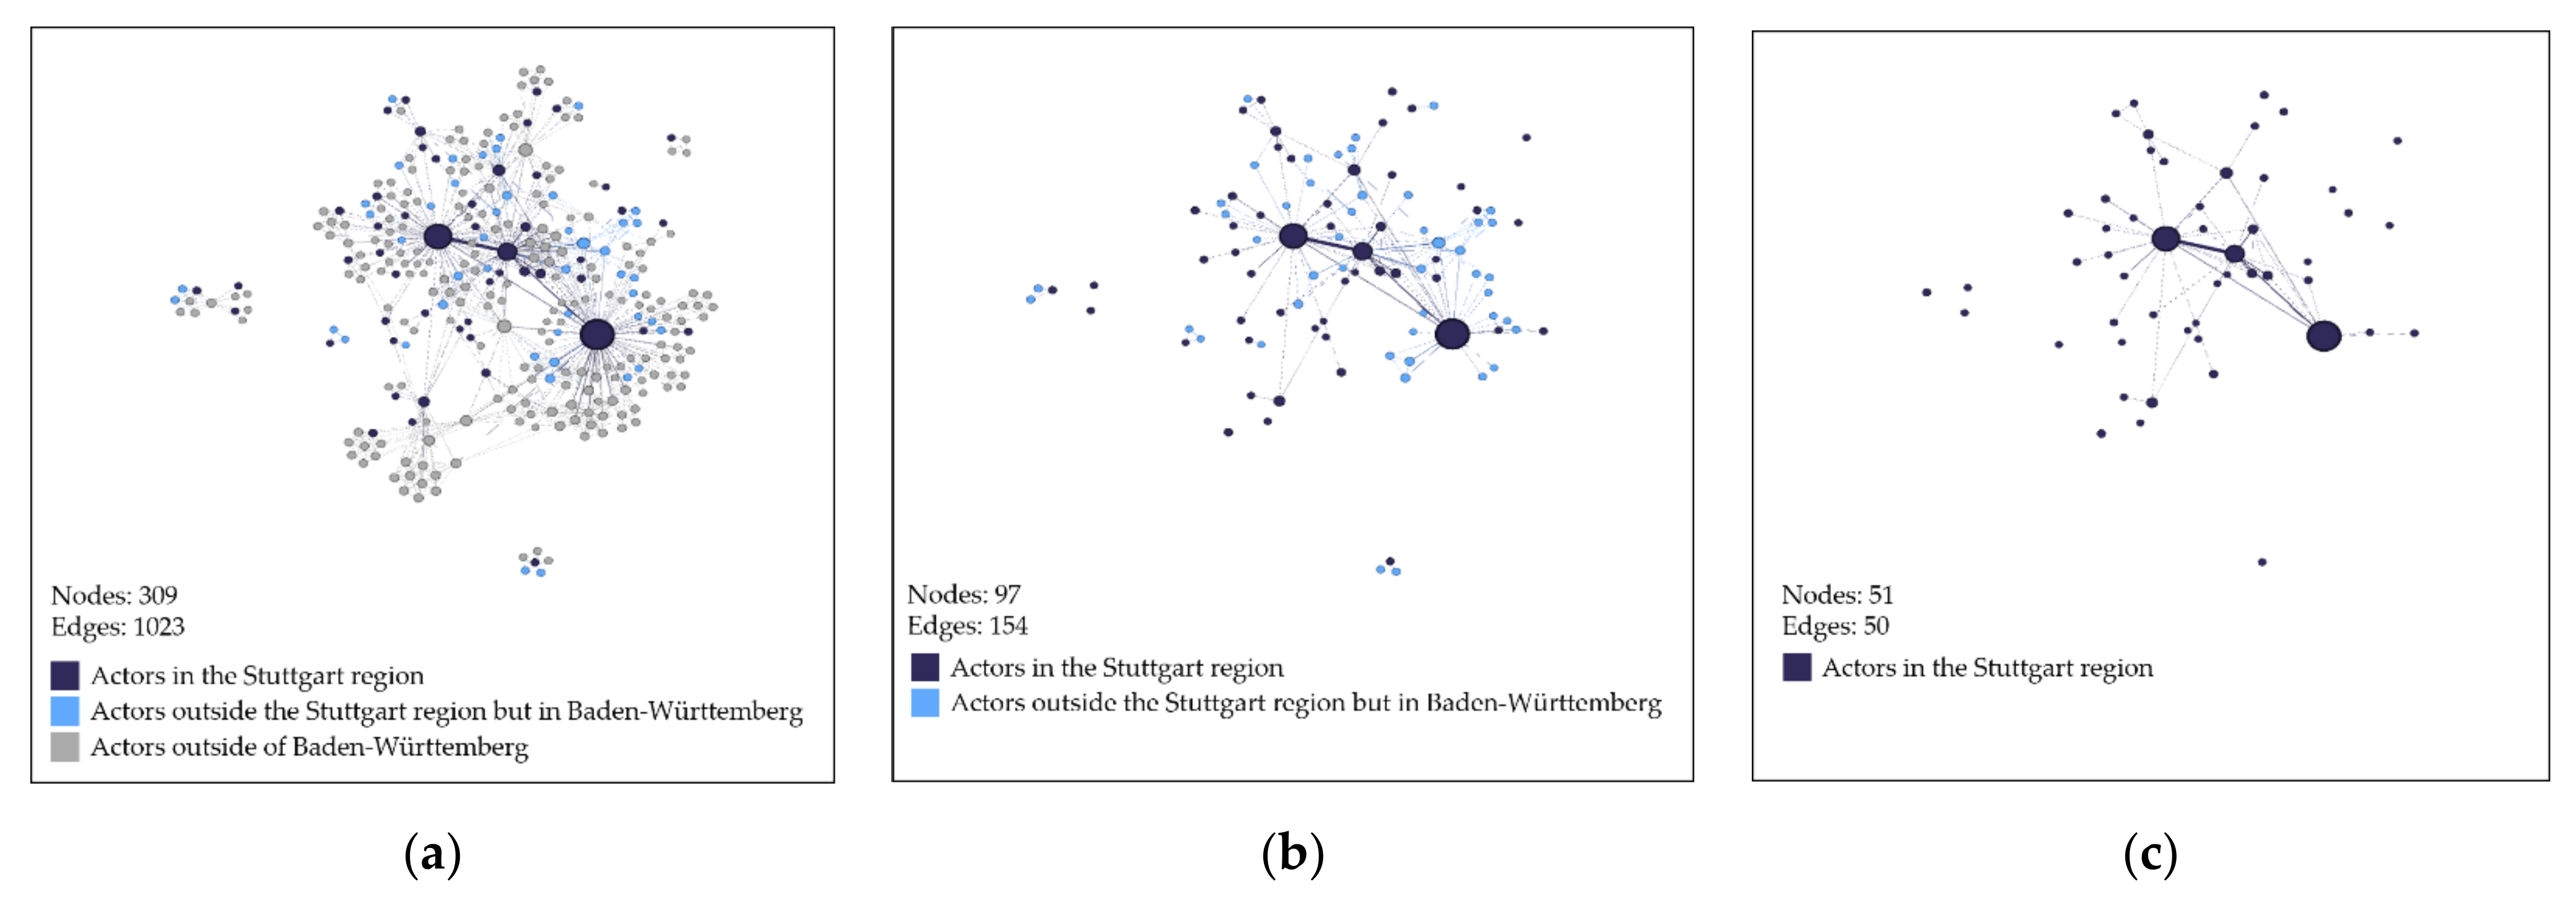
The overall network constructed includes 309 nodes (i.e., actors) and 1023 edges (i.e., collaborative relationships between the actors in the network). Our dataset covers a time period from 2017 to 2025. Since the data was extracted in September 2022 and information on project data is uploaded to the database after a project’s start (and, thus, the data for 2023–2025 is incomplete), we choose to analyse data up to 2022. The following sub-chapters outline the results of our analysis.
3.1. The (Supra-)Regional Bioeconomy Network
An examination of the overall network (see Figure 3) reveals some initial insights. First, the majority of collaborative bioeconomy research projects in the region of Stuttgart is not limited to cooperation between regional actors but involves regional and supra-regional actors. The representation of the overall network (see Figure 3a) depicts research collaborations between actors in the Stuttgart region (16.5% of nodes), actors outside the Stuttgart region but in Baden-Wuerttemberg (14.89% of nodes), and actors outside Baden-Wuerttemberg (68.61% of nodes). Research collaborations beyond regional borders increase the likelihood that new, relevant knowledge flows into the region that would otherwise not be available to local actors [55]. Second, there is a high degree of networking within the clusters. The layered representation of the network (see Figure 3a–c) illustrates that connectivity between the nodes decreases towards more narrowly defined regional levels. In the network that only shows actors located in the Stuttgart region (see Figure 3c), there are many nodes that have only one or no connection to other nodes in the network. Third, the depiction of the regional bioeconomy network highlights three central nodes. From the dataset, we can derive that these key actors are the University of Hohenheim (UH), the Fraunhofer Institutes (FIs), and the University of Stuttgart (US). In addition to the three central nodes, four clusters stand out that are located on the periphery of the network and have no connection to the overall network (see Figure 3a).
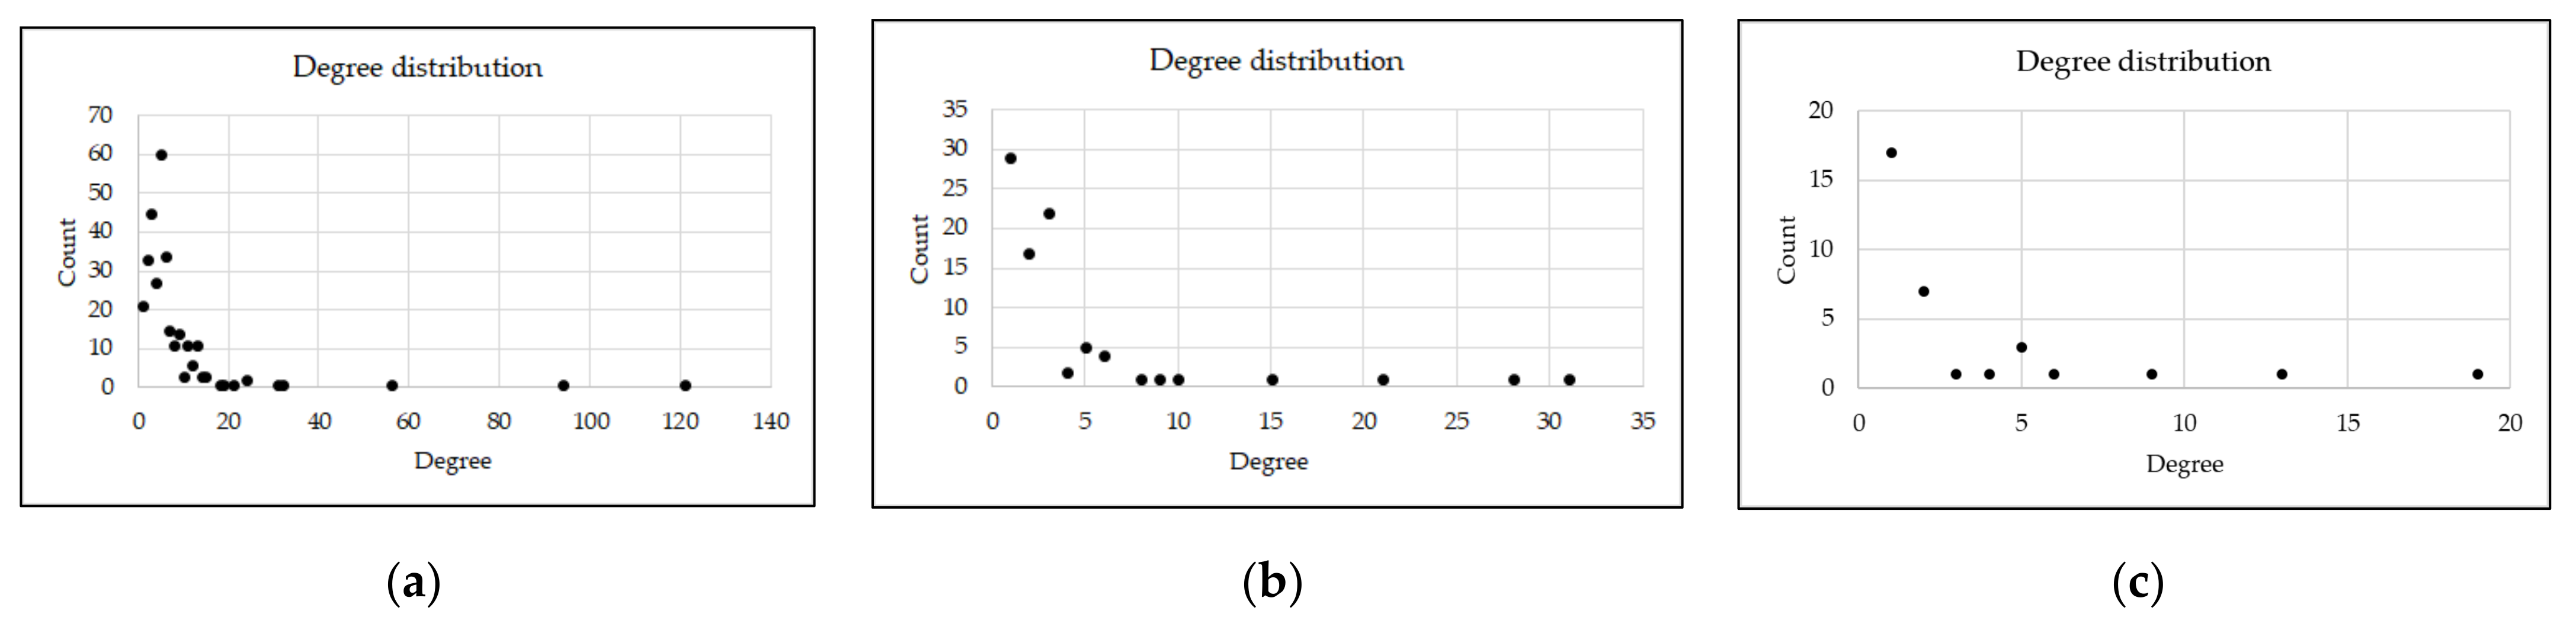
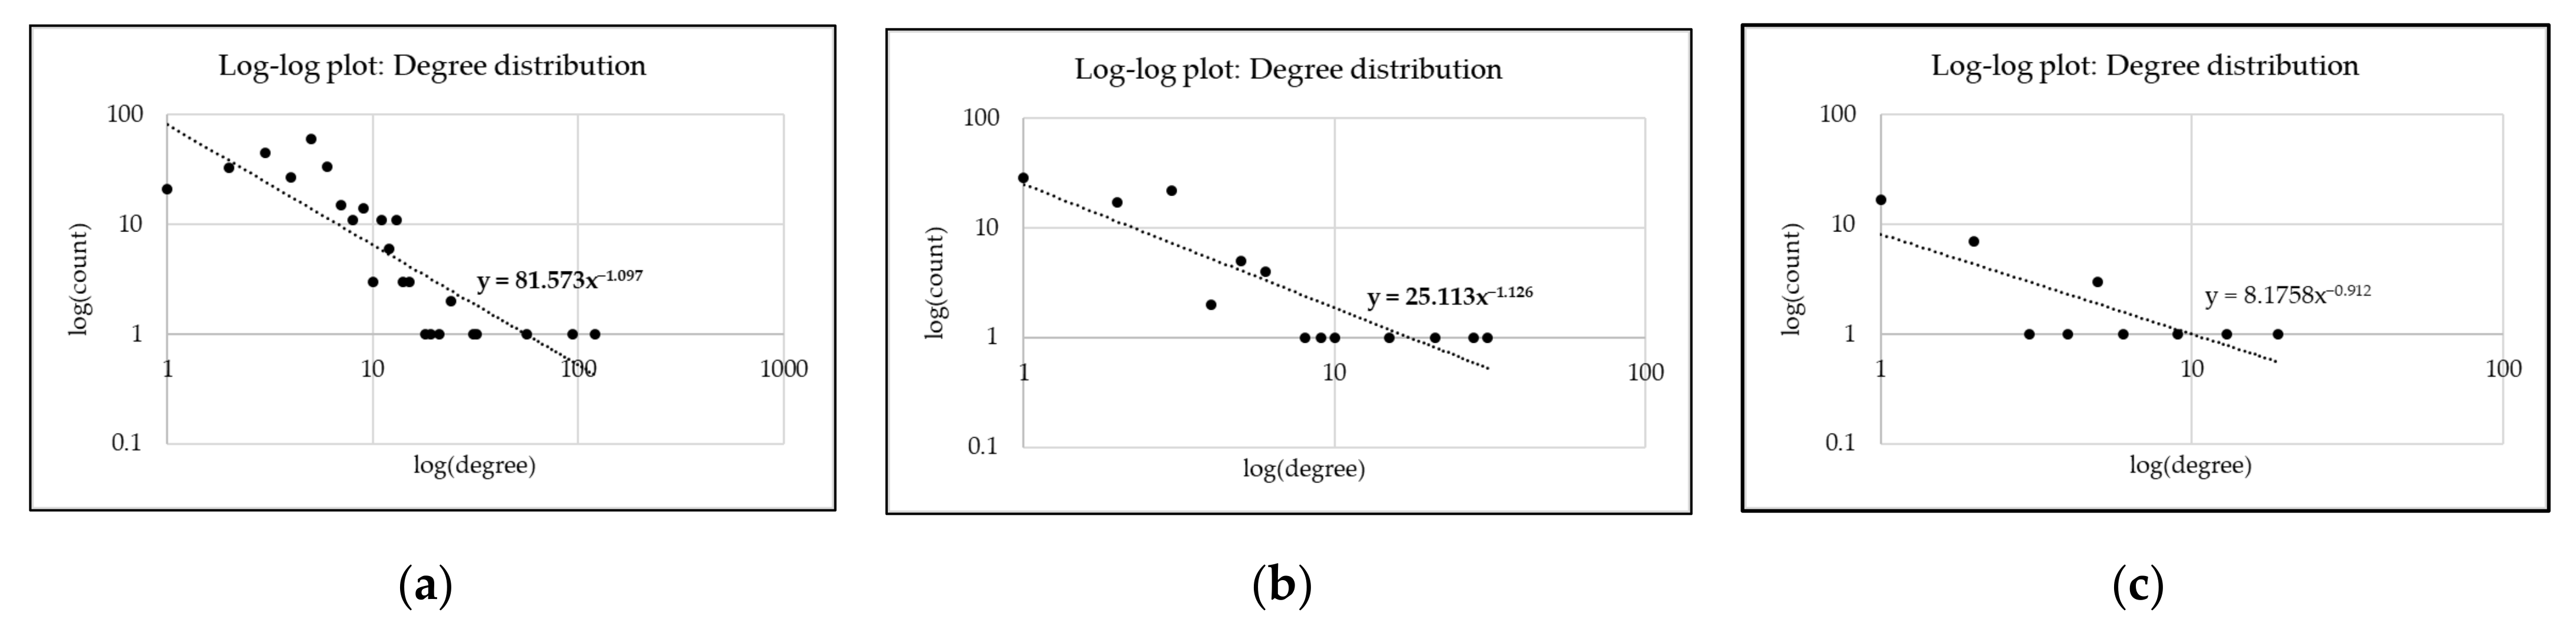
The structure of a social network influences the production and diffusion of knowledge within the network [56,57]. The super-regional bioeconomy network (see Figure 3a) is centralized, as can be derived from the degree distribution (see Figure 4). More specifically, the network can be classified as a scale-free network [58]. As Figure 4a depicts, there are many nodes with few links, and few nodes with a high degree of connectivity. Figure 5a underlines this argument, as scale-free networks usually have a power-law distribution [59]. The same holds true for the network depicted in Figure 3b, as Figure 4b and Figure 5b. The formation of scale-free networks can be explained by the theory of preferential attachment [58], which states that newcomers are more likely to join forces with already well-connected actors. This is likely an explanation in this case as well. The three actors with high degrees, the hubs in the network, are well-known, highly networked, and by definition knowledge-based and research-oriented actors in the Stuttgart region. The degree distribution (see Figure 4c) and log-log plot of the degree distribution (see Figure 5c) of the regional network displayed in Figure 3c exhibit not so clear scale-free network propositions, since the exponent in the logarithmic functions has a value smaller than one [58,59]. Likewise, the network graph in Figure 3c shows a star-like network structure [60] with the three central actors at the core. This implies that the regional network is extremely centralized with three well-connected actors, while the rest of the actors have either few or no direct links to each other.
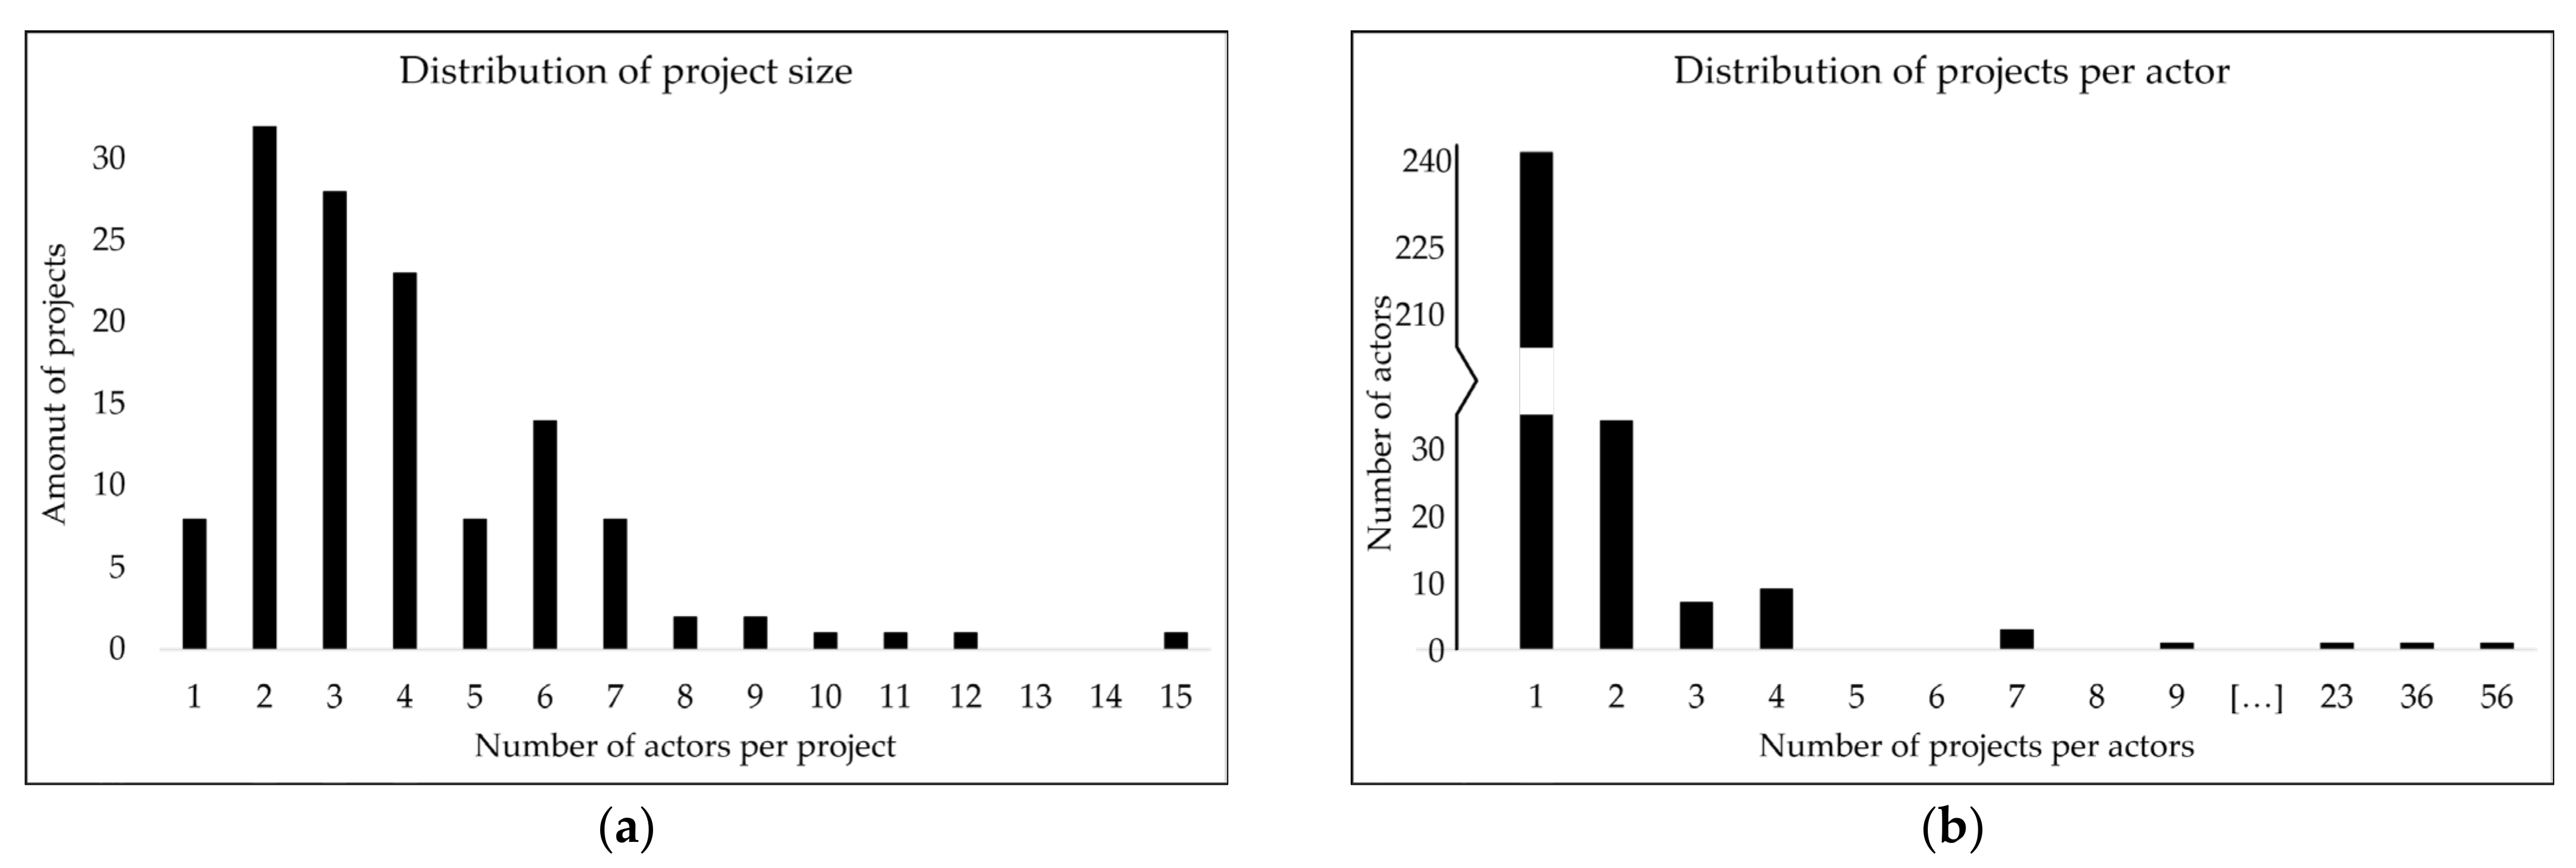
The structure of the bioeconomy network in the Stuttgart region can, on the one hand, be very efficient in terms of knowledge diffusion, as knowledge can be passed on very quickly to neighbouring nodes via the few central nodes in the network [61]. On the other hand, the networks can be very fragile to specific removal of nodes [62]; a default of a central node in the network can interrupt important knowledge flows. The fragility of the network also becomes apparent in an examination of the distribution of the research projects among the actors in the network (see Figure 6a) and the project size (see Figure 6b). Most projects are small, and most actors in the network are or have been part of only one or two projects over the observed time period. Here again, the three central actors stand out with a comparatively large number of projects: University of Hohenheim (56 research projects), Fraunhofer institutes (36 projects), and University of Stuttgart (23 projects). This and the previous observations indicate that federal funding is distributed primarily to projects involving large, established research actors.
3.2. Dynamic Network Analysis
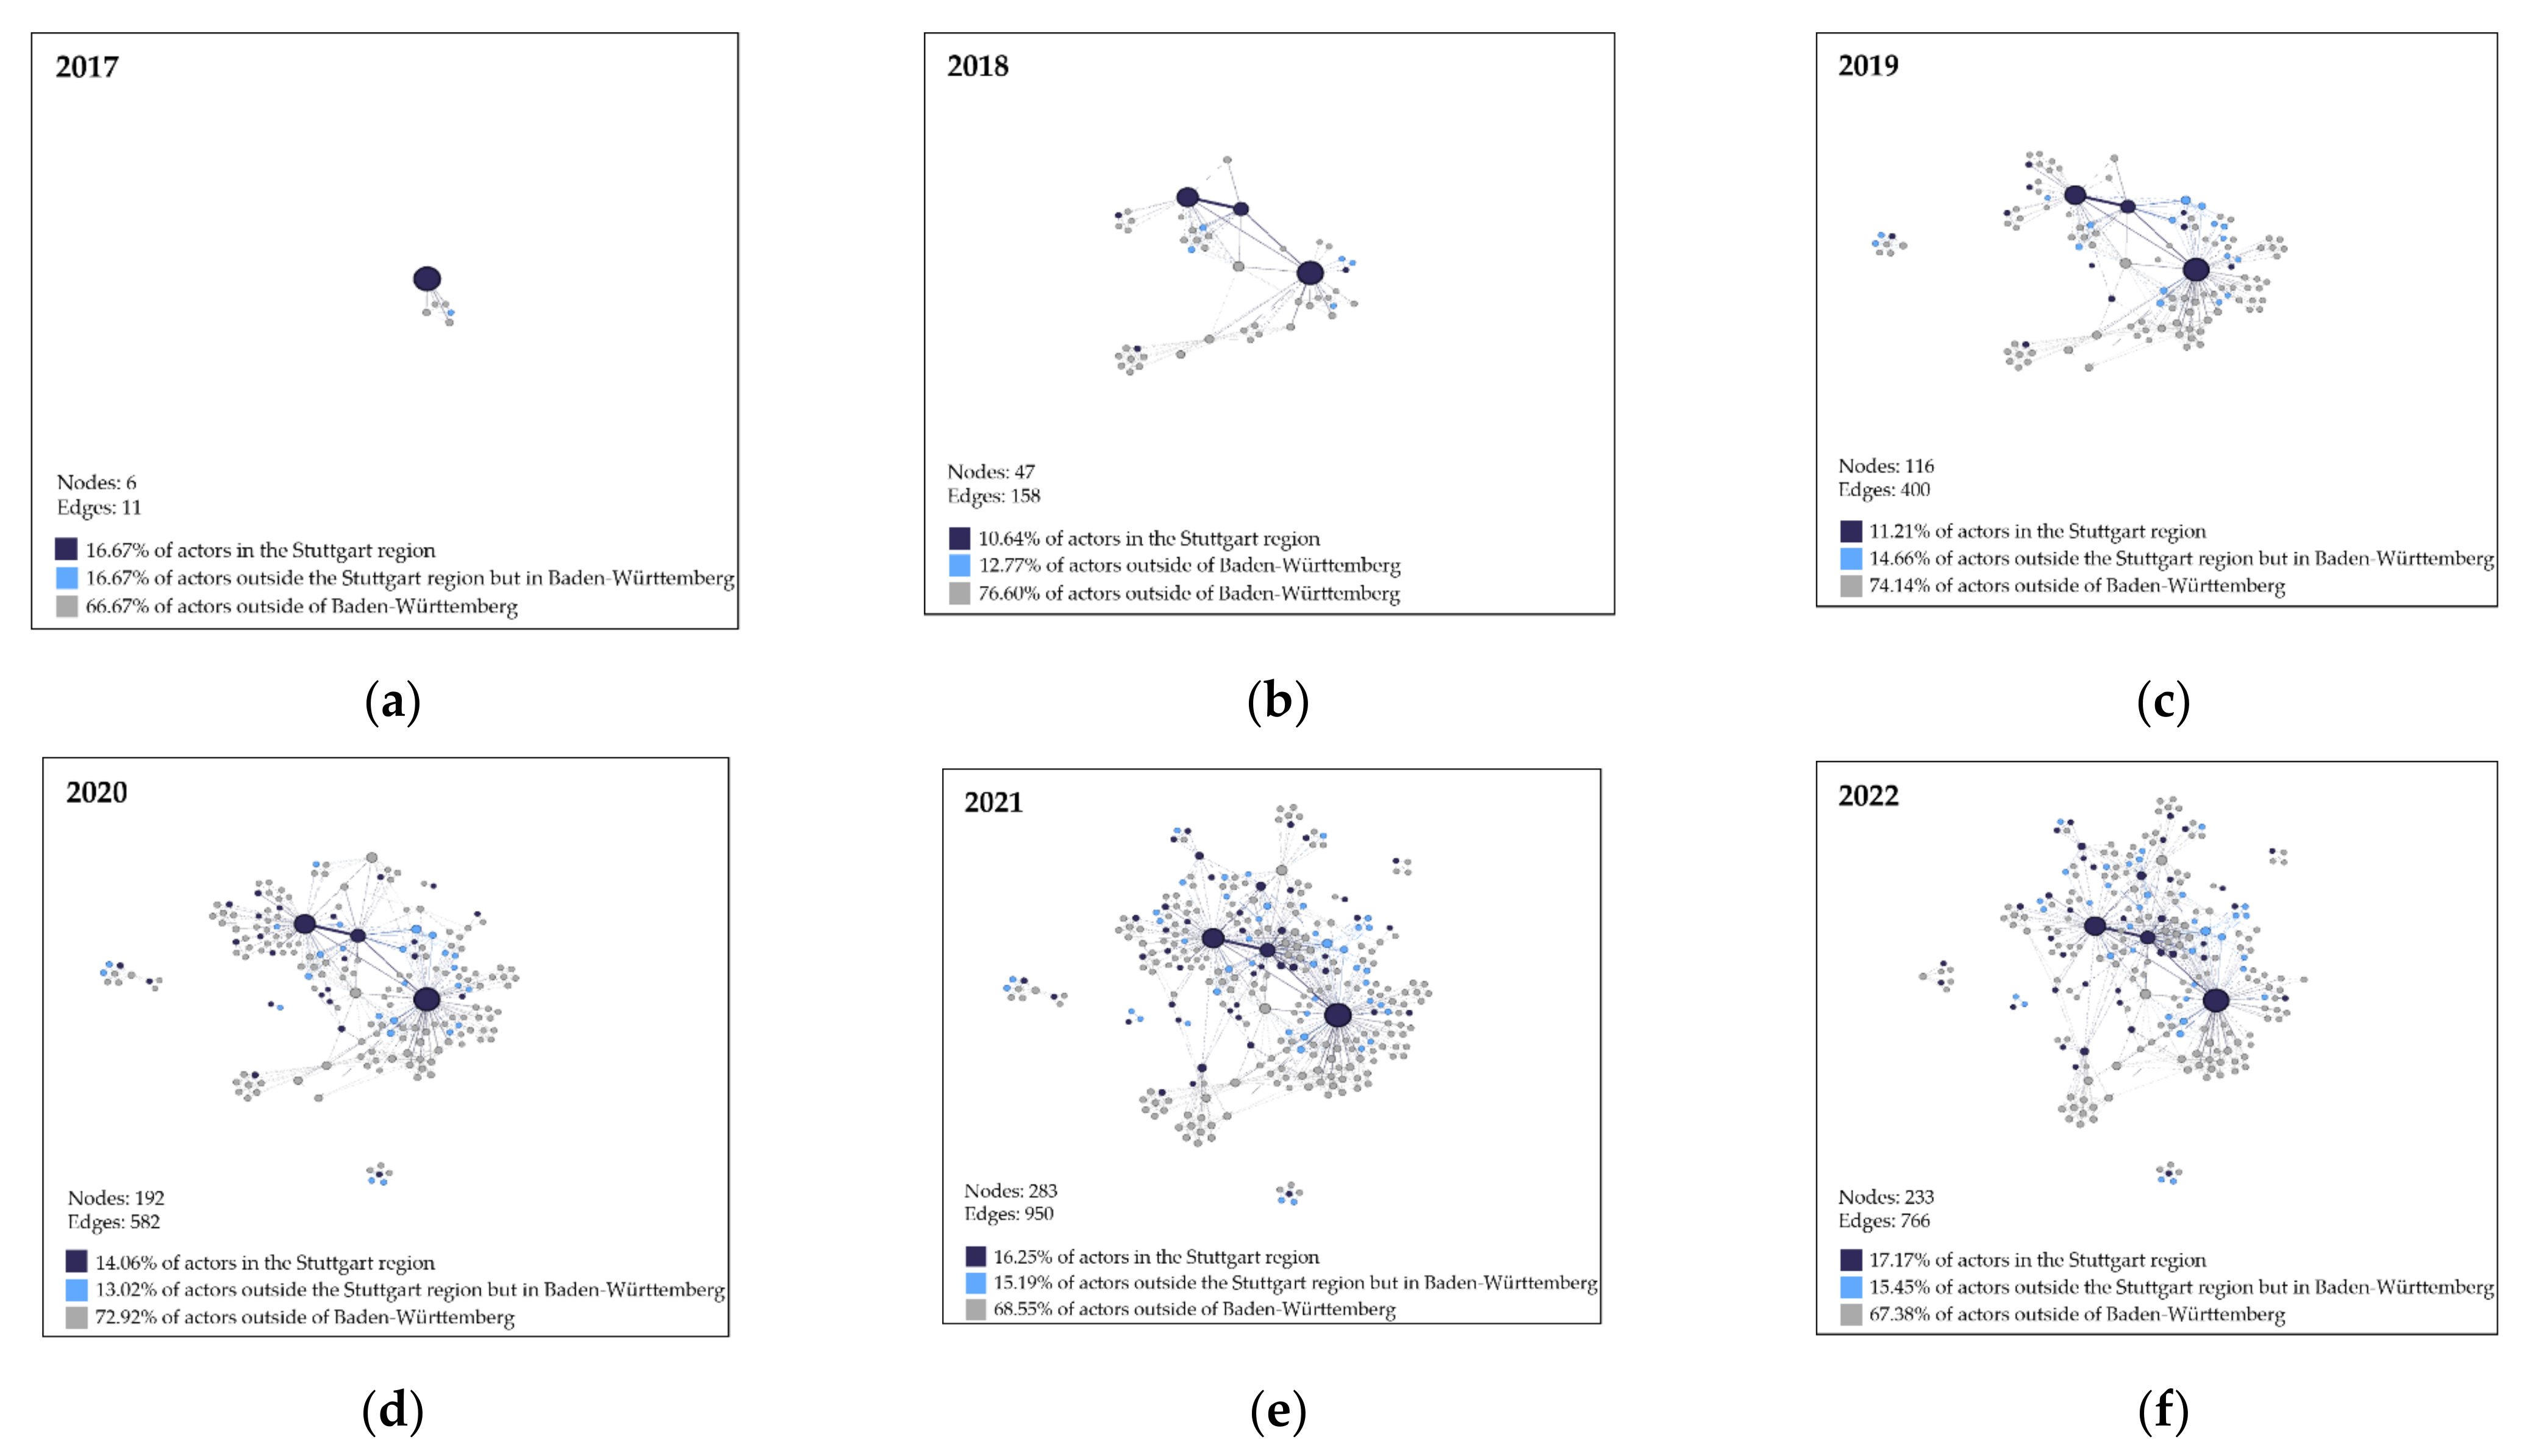
The above static view on the network does not allow inferences on the persistence of the network over time. A dynamic analysis is thus necessary to observe changes in the network and the interconnectedness of the actors. Figure 7 illustrates the supra-regional bioeconomy network over the years from 2017 to 2022. The dynamic representation reveals that the number of bioeconomic actors and projects increases over time, as the number of nodes and edges in the network graph increases. This can be explained with a growing political interest in the topic [2,63]. In 2022, the number of edges and nodes decreases compared to the previous year (see Figure 7f). This may be due to the incompleteness of data for 2022, as projects added to the database after 5 September 2022 are not considered. Hence, it is likely that the actual number of nodes and edges in the network graph for 2022 is higher than represented in our analysis. The proportional distribution of supra-regional and regional actors in the network fluctuates slightly but remains relatively constant over time.
The statistical results in Table 1 support the visual inspection of the network dynamics shown in Figure 7. The density of the network graph decreases over time. While in 2017 the graph density is equal to 0.733, in 2021 and 2022 this value has dropped to 0.024 and 0.028, respectively. The density of a network shows the ratio of existing connections between the actors in the network to the maximum number of possible connections [50]. Whether a high degree of networking is desirable depends on the time of analysis, as for example the stage of the industry life cycle [64]. Since the bioeconomy is a relatively new field of research that is still in the exploration phase, low density is likely and can be advantageous. In the exploration phase, the inclusion of new actors in a network lowers the density, but at the same time significantly increases the creativity of the network through new knowledge gained [64]. The average clustering coefficient [51] lies consistently between 0.908 and 0.92, indicating a high degree of formation of subgroups in the network. This was to be expected given the interconnectedness of the actors within the bioeconomy projects. Moreover, the number of connected components increases over time. While in 2017 and 2018 the network graph is one giant component, meaning that all actors are connected through other actors, from 2019 onwards there have been several connected components. This can be attributed to the increasing number of new actors engaging in research projects with actors not part of the main network component. In light of new knowledge flowing into the network and increased creativity, this can be beneficial in the current research phase [65]. However, in future, more exploitative phases, knowledge and information exchange on bioeconomy topics and research results should be facilitated between the presently unconnected components to foster innovation.
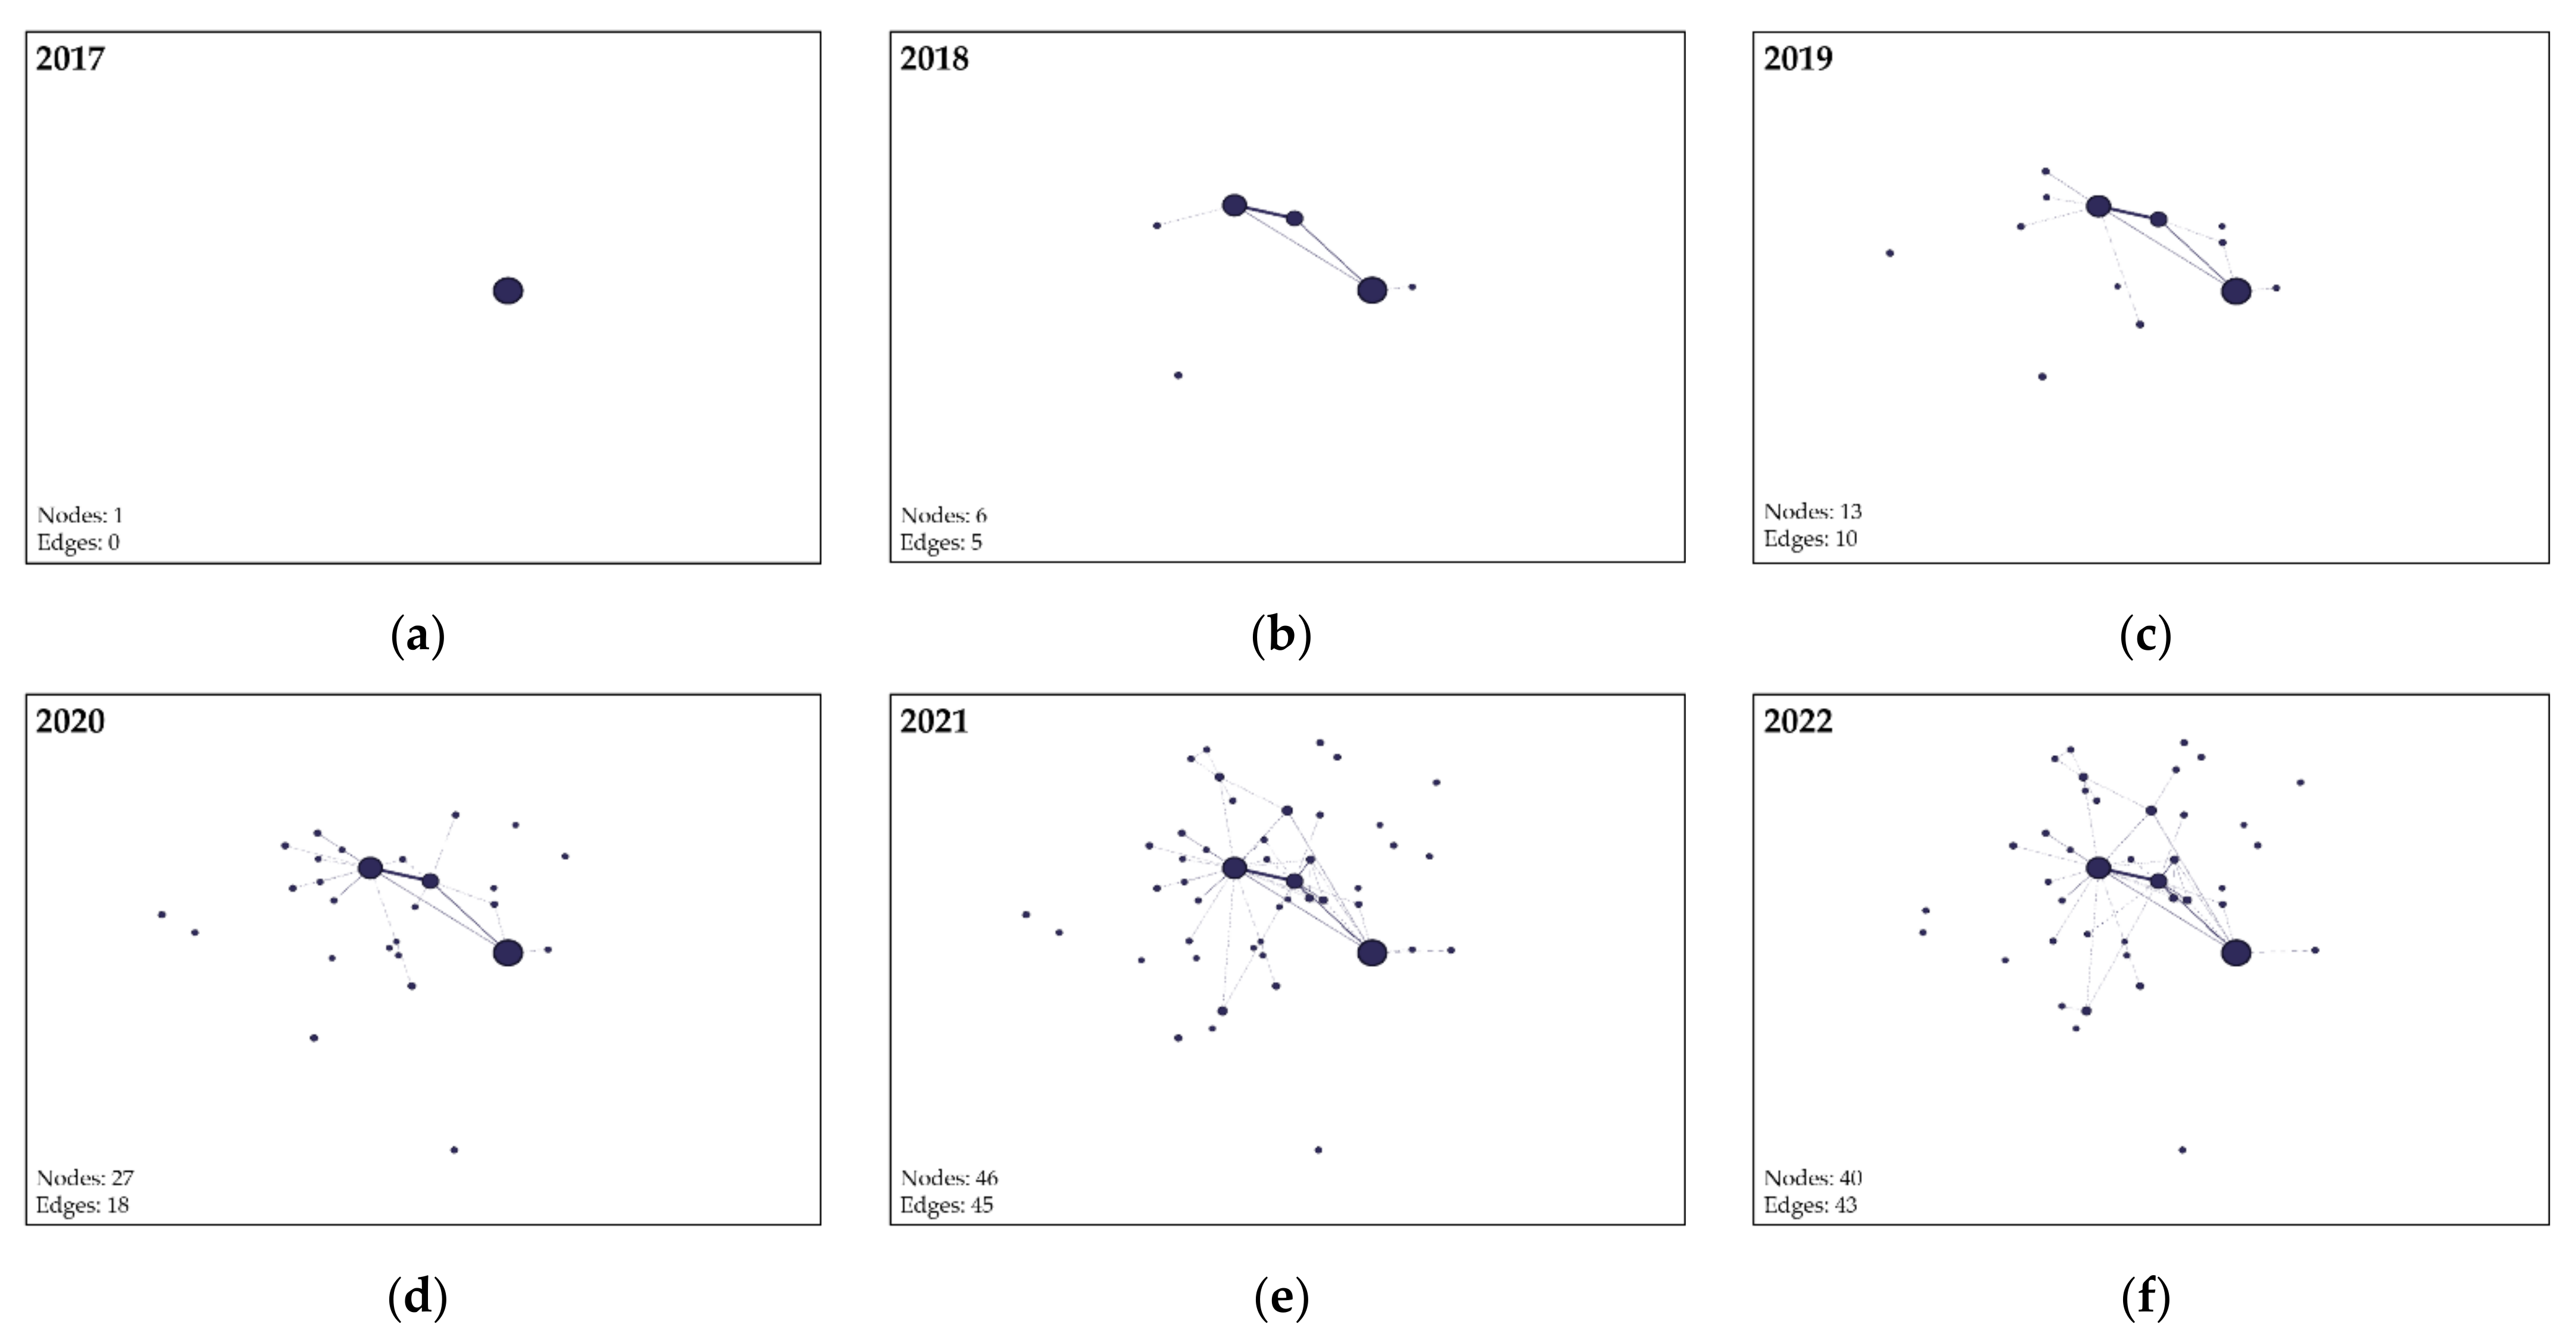
Figure 8 shows the regional bioeconomy network over the years 2017 to 2022. The dynamic representation of the regional network graphs shows an increasing number of nodes over time. Hence, the number of bioeconomy actors in the Stuttgart region, who participate in publicly funded bioeconomy research and development projects, has increased. Moreover, the regional network graphs for the more recent years (see Figure 8d–f) show that some actors are not yet collaborating with other regional actors in funded projects, as there are some nodes at the periphery that are not connected to other regional actors, resulting in a more dispersed network graph.
The statistical results in Table 2 support the previous observations. The network graph density remains low over the observed time period. Moreover, the number of connected components is higher and increasing compared with the supra-regional network. For 2021, 18 components can be observed. In 2022, this number slightly decreased to 14 components. The average clustering increases over time but remains lower than for the supra-regional network (see Table 1). The compilation of the research projects explains this. In general, the statistical network measures underline the observations in this as well as the previous sub-chapter.
3.3. Detailed Examination of the Regional Bioeconomy Network
For the purpose of drawing conclusions specific to the regional bioeconomy network and relevant actors, the following two subchapters take a closer look at the regional network. In particular, we take a look at all regional bioeconomic actors (Section 3.3.1), and we analyse the three most central actors and their ego networks over time (Section 3.3.2).
3.3.1. Regional Bioeconomic Actors
Table 3 provides an overview of all regional actors in the network and assigns them to their related bioeconomy sector. For many actors, a clear classification to a specific bioeconomy sector is not possible due to their diverse economic activities. Nevertheless, we can derive several insights from this classification. First, most actors from our network that are located in the Stuttgart region are assigned to process and mechanical engineering, research, or biotechnology. The high share of companies in the sector of process and mechanical engineering is not unexpected for the Stuttgart region given the presence of various mechanical engineering firms and automotive suppliers. The appearance of many research institutes comes also naturally as our network analysis is based on funded research projects. The last major group are actors from the field of biotechnology. This is not surprising as the WBT, also called industrial biotechnology, is closely related to the local industry [18]. Second, the distribution across sectors shows the relevance of the bioeconomy for companies not directly working with bio-based resources. For example, process technology and mechanical engineering may not be the first sector that comes to mind with respect to the bioeconomy. However, the development of the bioeconomy relies on what [49] call cross-sectional technologies that can support bioeconomic activities. Third, seeing the participation in a project as a form of innovation activity, the bioeconomy is economically relevant for a surprisingly wide range of regional industries. Referring to the structure of the bioeconomy displayed in Figure 2, the bioeconomic focus of the Stuttgart region is on the processing and material utilization dimension of the value chain.
3.3.2. Analysis of the Three Most Central Actors
To identify the three most central and thus most relevant actors in the network, we calculate the degree centrality of all actors in the supra-regional network. Table 4 shows the values for the degree, closeness, and betweenness centrality measures of the University of Hohenheim, the University of Stuttgart, and the Fraunhofer institutes, which were identified as the most central actors in the network (supporting our previous observation based on the network graph), for each year. The central actor ranking is based on the degree centrality of all actors in the network for each year.
Of the three key actors in the network, the University of Hohenheim is the most central based on the values presented in Table 4. Moreover, the University of Hohenheim was the first regional actor collaborating in publicly funded research projects since 2017. This is not surprising given the university’s bioeconomy focus in research and teaching since 2013 [66]. The Fraunhofer institutes, which comprise a variety of research institutes in different fields that cooperate with industry actors, are the second most central actors in the network since 2018. The Stuttgart region is home to the Fraunhofer institutes for industrial engineering (IAO), building physics (IBP), interfacial engineering and biotechnology (IGB), and manufacturing engineering and automation (IPA) as well as the Fraunhofer information centre space and construction (IRB). The regional Fraunhofer institutes are closely collaborating with the University of Stuttgart in research and teaching. While the other two actors have maintained their very central position since the emergence of the bioeconomy network, the University of Stuttgart has only moved up to third rank since 2020. Nevertheless, the University of Stuttgart was still a central and important actor in the network beforehand.
The comparison of the three actors shows a significant difference in degree centrality, which is defined by the node’s number of direct links [54], and betweenness centrality, which measures how often a node is between two other nodes’ shortest path [67,68], while closeness centrality, a node’s average distance to other nodes based on direct and indirect links [53], differs considerably less between the three actors. The degree centrality can be understood as a measure of direct influence [53]. The University of Hohenheim has the most direct links to other actors in the network, and thus the strongest influence on other actors within the scope of research collaborations, followed by the Fraunhofer institutes, and more recently the University of Stuttgart. Moreover, a higher betweenness centrality indicates that the node plays a more central role in the exchange of knowledge and information in the network, as more nodes are connected via this node on their shortest path [67,68]. One reason for the higher value for betweenness centrality of the University of Hohenheim is the higher number of direct connections to other actors. In addition, a high value indicates a strong involvement in various bioeconomy projects. This further implies that the loss of one of these central actors could significantly impair the knowledge flow in the whole network. The importance of the three players for the entire network is highlighted by their closeness centrality. A high closeness centrality means that these nodes are not only affected quickly by changes in the network but also affect changes [53]. Thus, all three actors are a central part of the regional bioeconomy network, and their disappearance would severely impact the performance of the entire network.
Since the two universities and the transfer-oriented research institutes are key players, an examination of their ego-networks (see Figure 9) can provide further insights concerning their roles in the network as well as the network as a whole. A distributed, decentralized network structure [60] can be observed in all three ego-networks. By comparing the network graphs in Figure 9a–c, it becomes apparent that there is a large overlap between the three ego-networks. While the ego-networks of the University of Hohenheim and the University of Stuttgart show only some similarities, the overlaps in the ego-network of the University of Stuttgart and the Fraunhofer Institutes are particularly evident. The previously mentioned close relationship between the two explains this. Despite the close links between the central actors, they individually collaborate with other actors from the region, as well as beyond the region. Thereby, they gain access to new knowledge regarding bioeconomic topics and due to their central position, they can contribute to the diffusion of knowledge in the region. In comparison with the other two actors, the University of Hohenheim is more involved in research projects with partners outside the Stuttgart region and Baden-Württemberg (see Figure 9a) in comparison with Figure 9b,c. As previously mentioned, research collaboration with actors outside the region can bring external and new knowledge into the region.
3.4. Relevant Bioeconomic Topics in the Region of Stuttgart
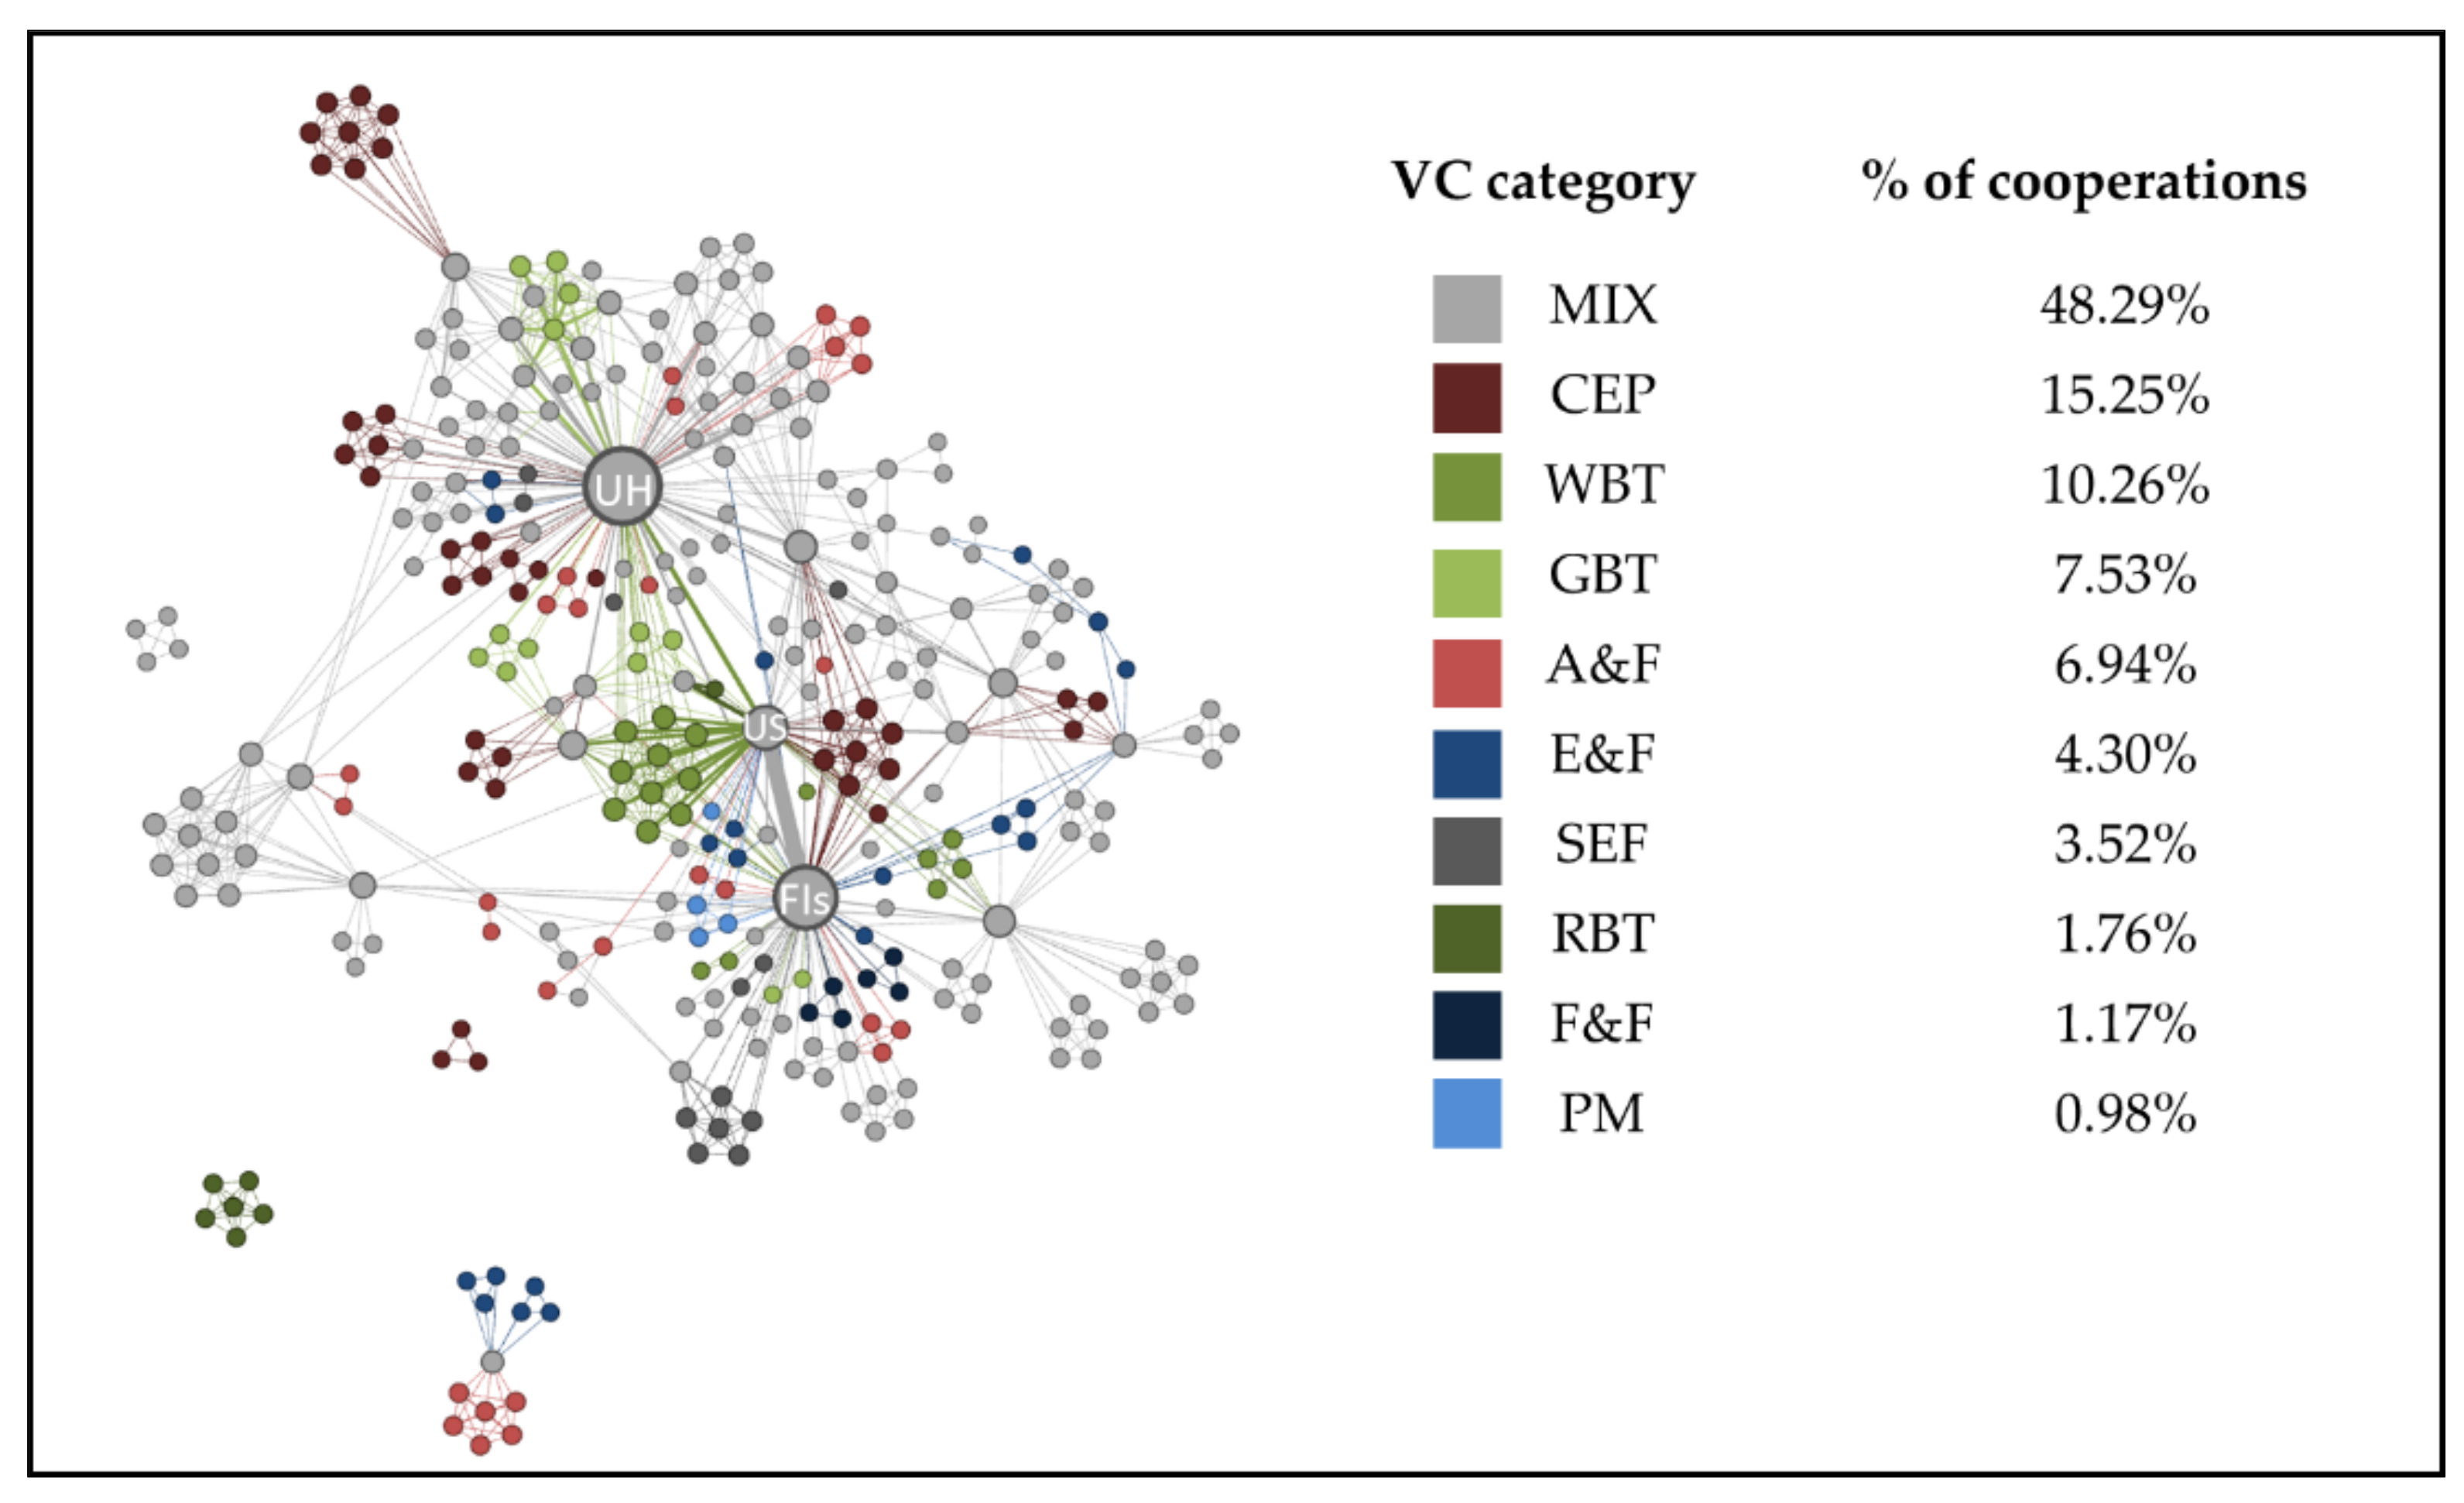
In addition to the network structure and the actors in the network, the thematic focus of the projects provides further insights for answering our research question. To aggregate the content of the research projects, we used the classification of the research projects along the value creation process (see Figure 2). Figure 10 presents the supra-regional network, with nodes and edges coloured according to their VC category. The percentage distribution refers to the research cooperations between the nodes (i.e., the colouring of the edges). Most of the research collaborations are classified into the MIX category (i.e., most research collaborations cannot be clearly assigned to one of the other VC categories or span over several projects that are assigned to different VC categories). The second most represented category in the network (CEP) includes projects that address climate and environmental protection in the input dimension. This stresses the strong potential of the bioeconomy for environmental sustainability [69]. The strong focus on WBT and GBT within the research projects may be due to the specialization of the region and the focus of the three central actors. For example, engineering is a major focus of the University of Stuttgart and, in particular, of the Fraunhofer institutes. WBT, often referred to as industrial biotechnology, is closely linked to engineering, as this area of biotechnology is primarily concerned with the use of biotechnological procedures in industrial production processes [18]. The focus on agriculture (reflected in the VC categories GBT and A&F) is also expected given the University of Hohenheim’s central position in the network and its reputation for agricultural expertise. GBT is closely related to agriculture and includes research and breeding of crop and livestock [18].
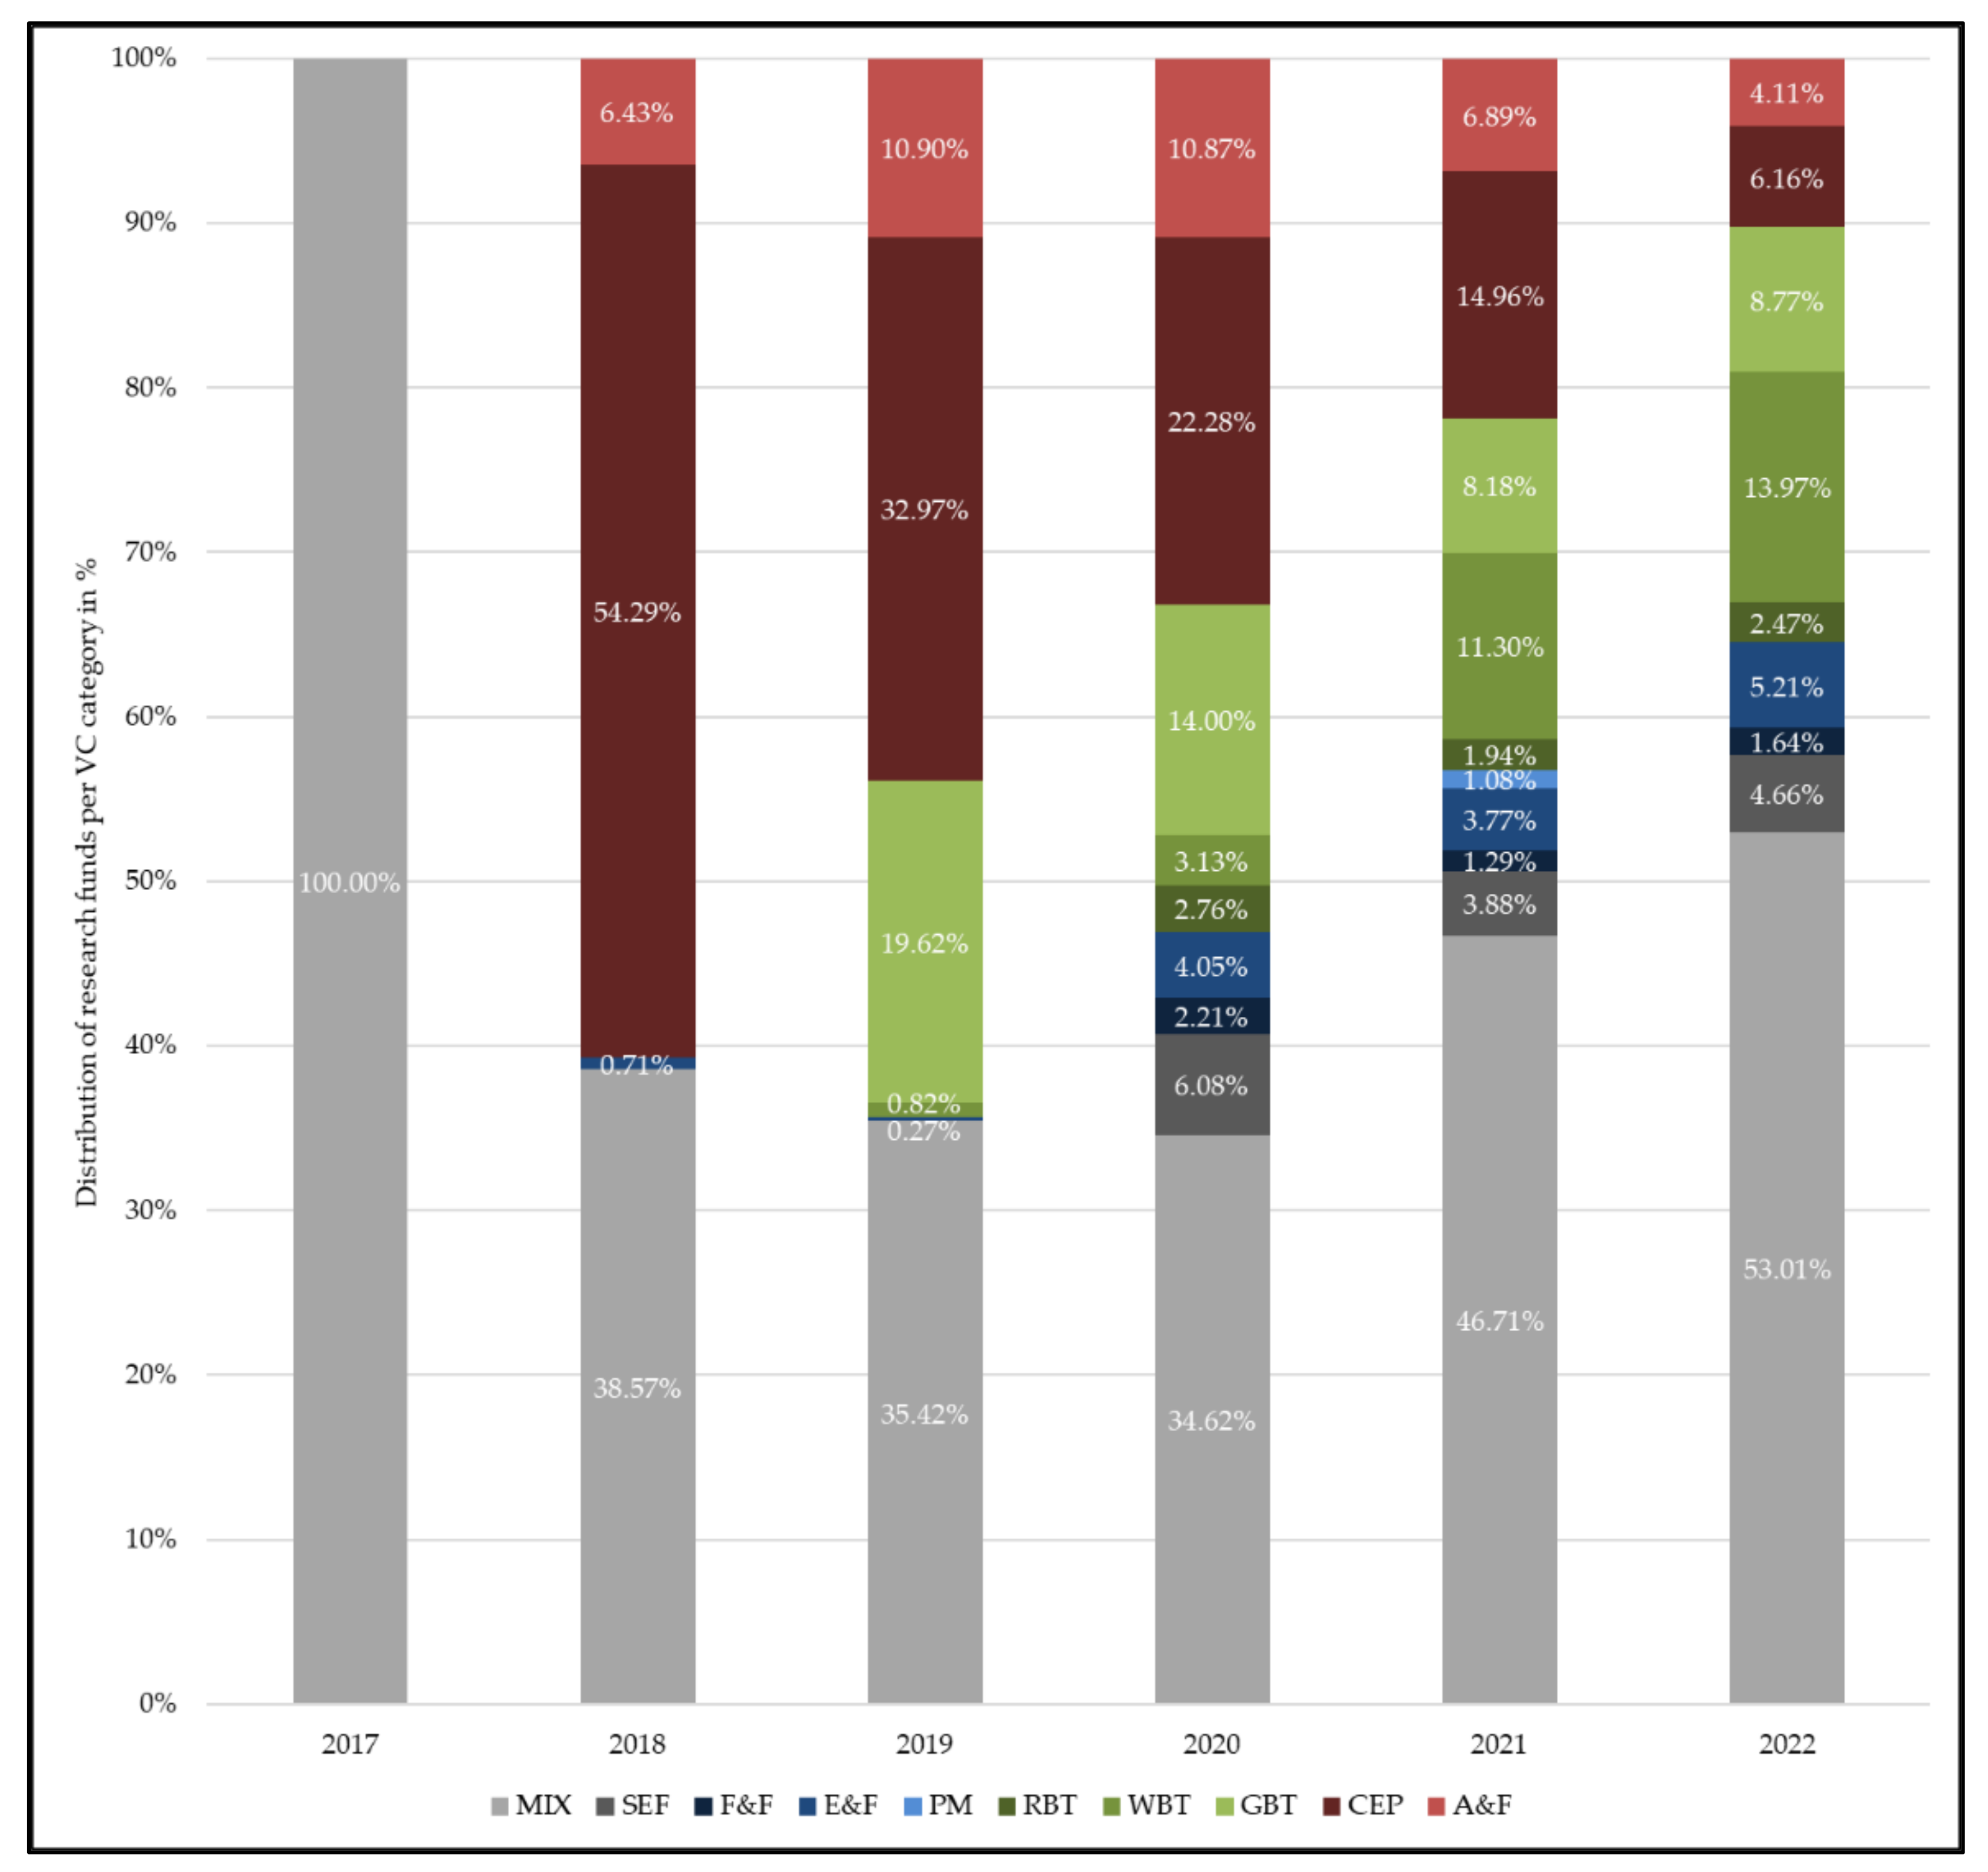
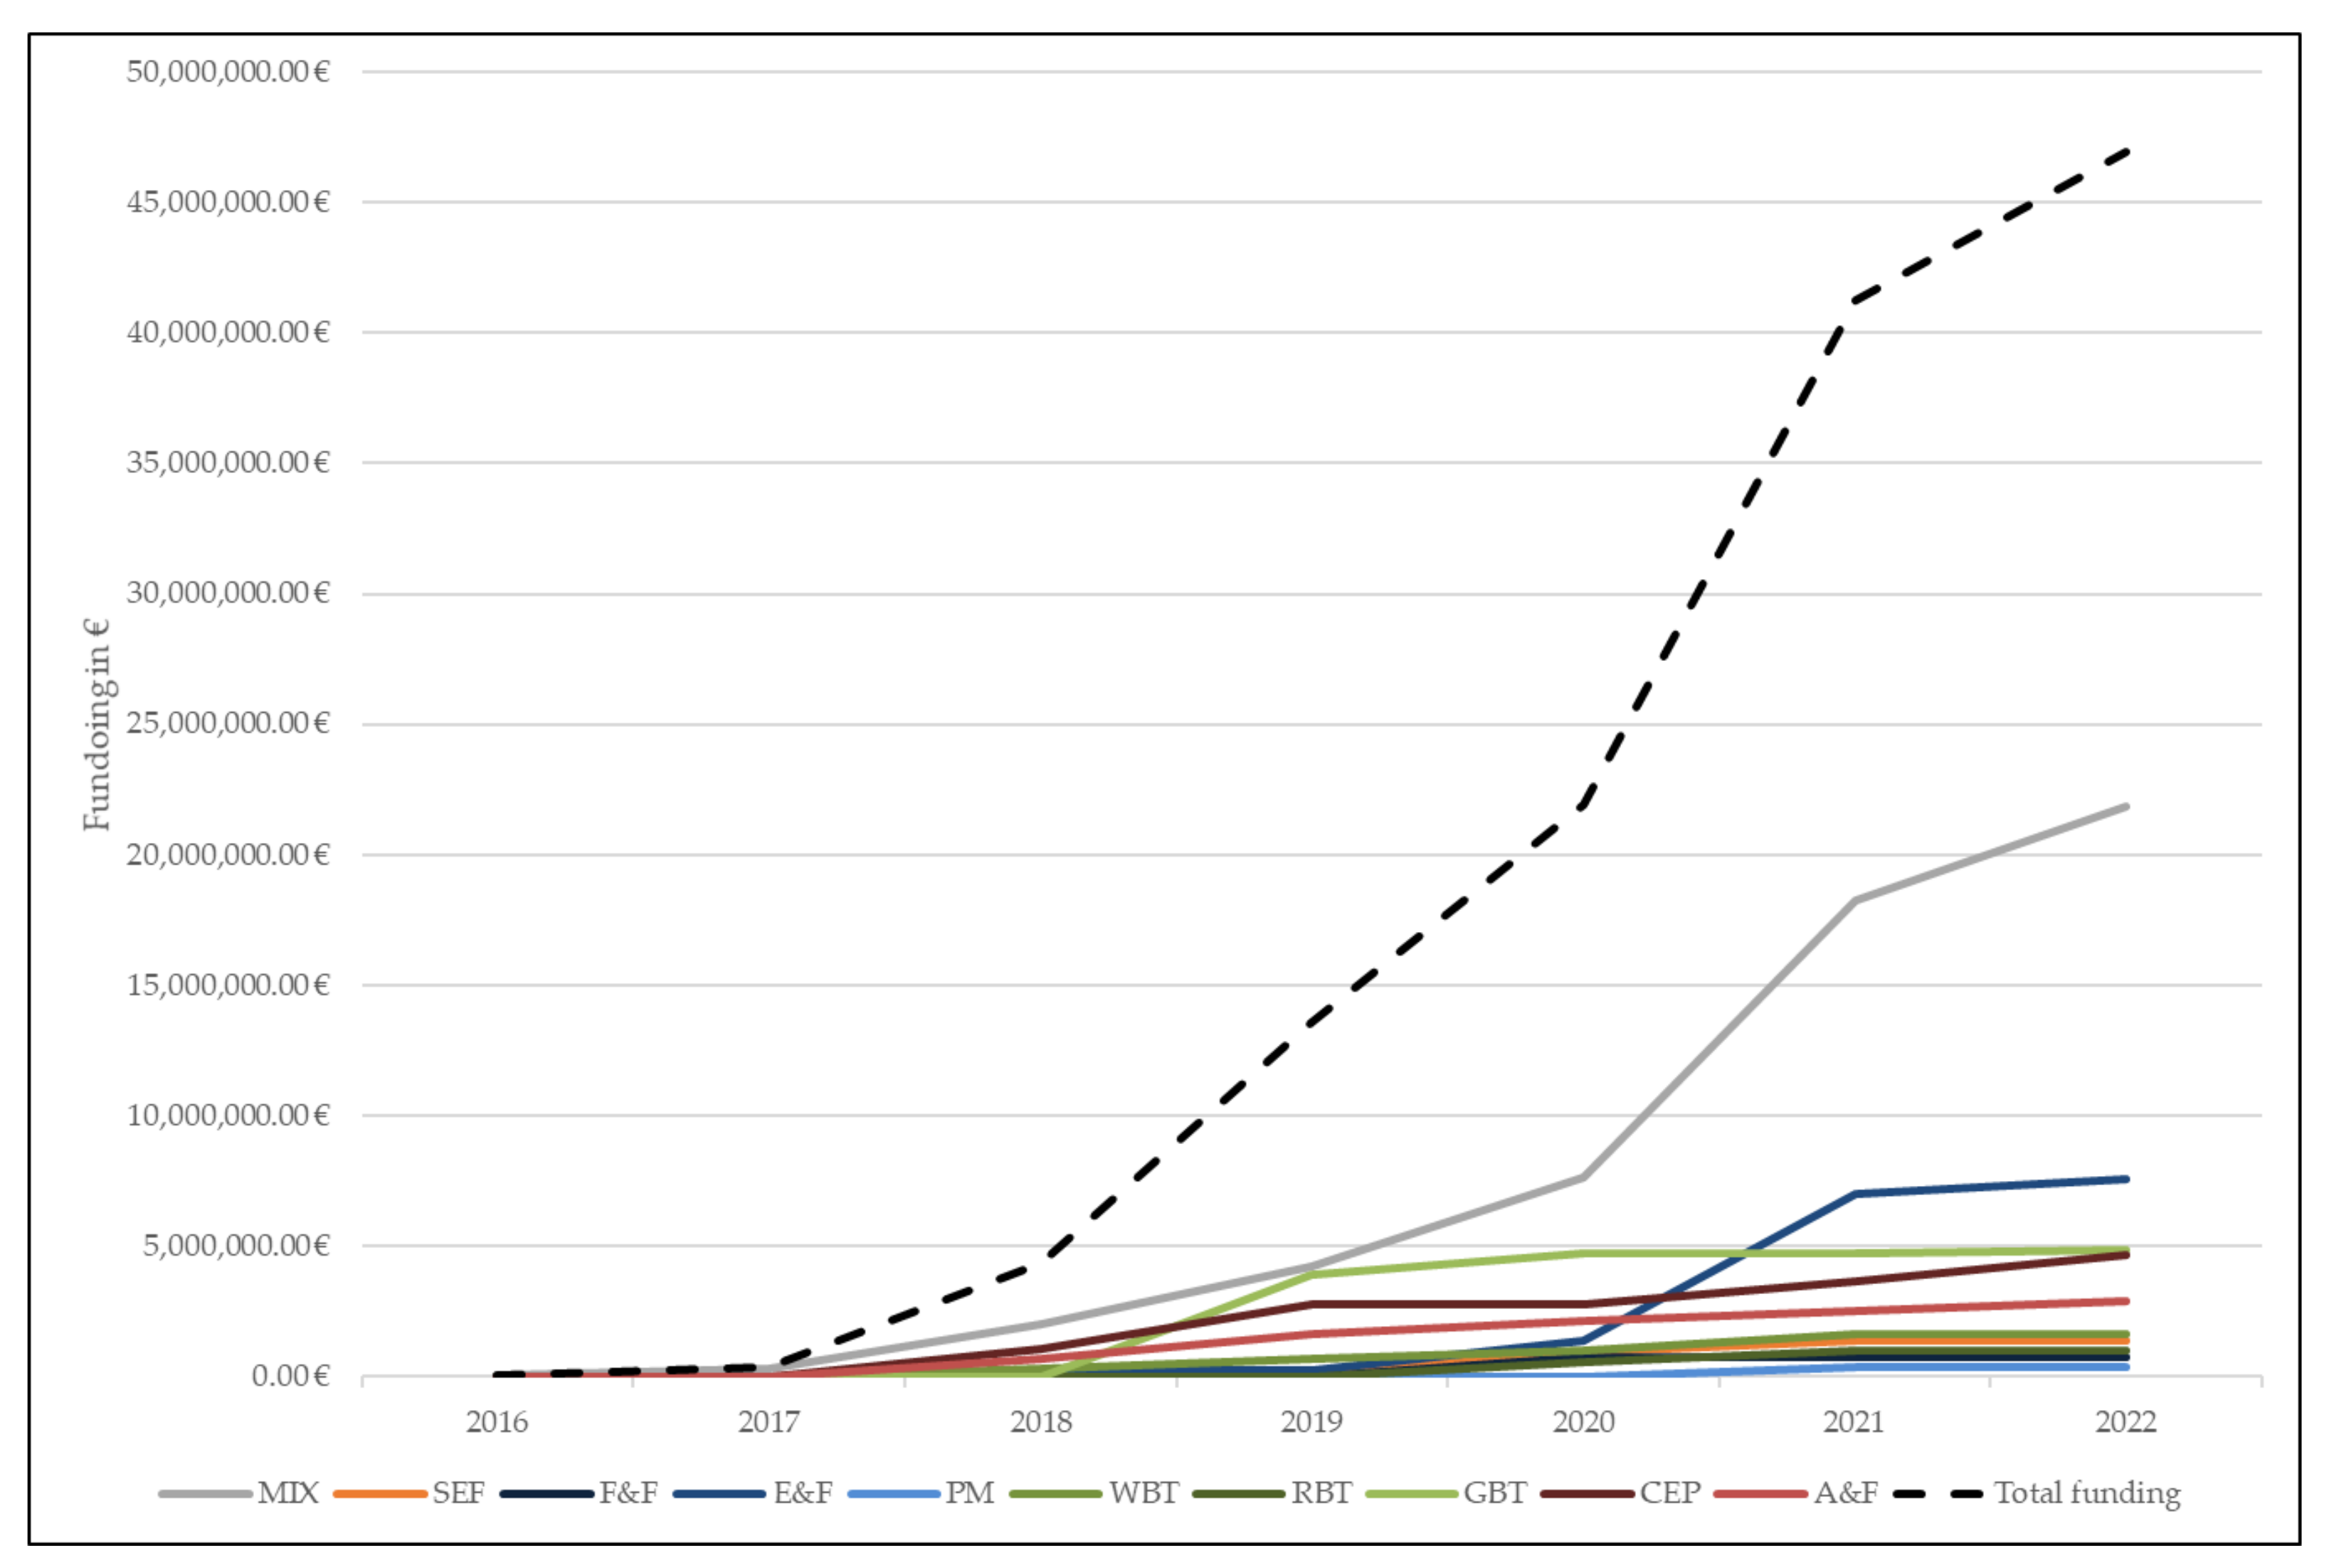
For a differentiated analysis and to observe changes in the thematic focus within the research projects, the proportional distribution of the bioeconomic topics across the research projects from 2017 to 2022 are considered. As depicted in Figure 11, there are only marginal changes in the proportions of research collaborations in each thematic field. The variations may be due to the increasing number of bioeconomic research projects and the addition of new bioeconomic topics to the research landscape over the years. While in 2017, the bioeconomic projects fall exclusively into the MIX category, from 2018 onwards several bioeconomic topics are addressed in research projects. However, the share of the MIX category remains one of the largest, which can be explained by the cross-sectional nature of the bioeconomy. Only in 2018 does the share of projects in the CEP category exceed the share of the MIX category. It is noteworthy that research collaborations with a biotechnology focus have not declined over time, although previous research has found a clear shift in the funding of biotechnology projects in favour of projects with an agricultural focus in Germany [18]. Figure 11 refers to the proportional distribution of research collaborations, but not to the amount of funding. Figure 12 shows that more funding has been allocated to research projects with a focus on GBT and A&F than to projects addressing other biotechnology fields over the last years.
4. Discussion
Our analysis and results are consistent with previous research [17,18,19] and confirm the most important results to also be valid for the urban innovation network. Based on the same database for publicly funded projects in Germany, [17] found a similar centralized, scale-free network structure with a small group of well-connected actors participating in the majority of all funded bioeconomic projects across Germany. Moreover, [19] who analysed the bioeconomic research network in Germany between 1988 and 2017 finds a stable core of research institutes that collaborate with varying project partners over time. Likewise, we identified three research institutes as the most central actors in the bioeconomic research network in the region of Stuttgart, namely the University of Hohenheim, the University of Stuttgart, and the Fraunhofer institutes.
The Stuttgart region has favourable conditions for a prolific integration of the knowledge-based bioeconomy. The presence of universities and research institutes can have positive effects on the innovative and economic performance of a region via research collaborations [70] and knowledge spillovers [71,72,73]. New entrants in knowledge-intensive industries or emerging business areas such as the bioeconomy are most likely to locate near universities and research institutes that conduct research in this field in order to benefit from knowledge spillovers [74,75,76,77]. Entrepreneurship in high-technology fields is strongly affected by regional knowledge production through research and industry [77]. For the biotechnology sector, a key component of the bioeconomy, researchers have found that the regional knowledge base plays a crucial role in promoting entry and attracting entrepreneurs [78,79]. Due to the range of research institutes and universities that participate in bioeconomic research projects and due to the centrality of three research-oriented actors, the Stuttgart region is attractive for new entrants and existing companies alike, which in turn can have a positive impact on economic activity and job creation. The demand for labour can, at least in part, be met by graduates from regional academic institutions. Through a wide range of bioeconomy related study programs, they not only generate new knowledge in research projects, but also educate and train future workforce.
The knowledge-based bioeconomy is still at an early stage and many new insights, processes, products, and materials are being researched, which makes collaborations between universities or research institutes and firms even more important to enable the translation of new knowledge into innovation [73]. The main branches of the manufacturing sector in the region of Stuttgart are the automotive industry, construction of machinery and equipment, and electric engineering [80]. Our results show that especially the latter two branches are engaged in bioeconomy related research. As the bioeconomy is so far only marginally present in these branches [81] and as little has been invested in the application of bioeconomic knowledge to date and actual applications have not yet met expectations [18], collaborations between science and industry are even more important for application-oriented development and have a high potential to result in new ideas and business opportunities.
Furthermore, our results indicate that a high degree of collaboration in the bioeconomic network takes place between regional and supra-regional actors. Previous research mostly shows that collaboration in knowledge-intensive sectors, such as the biotechnology industry, is more likely to generate innovation when geographic, social, and knowledge distance is low [82,83]. However, the supra-regionality is unlikely to pose a problem for the performance of the bioeconomy network in the Stuttgart region. On the one hand, geographical proximity is not a prerequisite for successful collaboration. Other forms of proximity, such as organizational, social, or institutional proximity can overcome physical distance and even enhance the knowledge exchange [84]. On the other hand, as supra-regional actors in the network are still located either in Baden-Wuerttemberg or in Germany, the geographical distance is not too high and the actors’ institutional proximity builds trust based on common institutions [84], compensating for a potential lack of frequent face-to-face interaction. Moreover, too much proximity can have a negative effect on innovation in terms of lock-in, inertia, and missing openness [84]. Therefore, research collaborations beyond regional borders can have a positive impact on the innovative performance of a region, bringing new knowledge into the region that would otherwise not be available to regional actors [55]. This allows the three central actors in particular to function as gatekeepers for knowledge inflows into the regional network [83]. Thereby, they can either support or inhibit knowledge flows in the network. Knowledge can be passed on very quickly via the central actor(s) to the neighbouring cooperation partners in the network [61]. How well knowledge is distributed also depends on the effectiveness of the organization’s internal communication channels, as only specific departments of each organization participate in the research project. However, the network centrality around the three central actors can also lead to dependency on the dominant partners and to so-called weak network failures [85,86]. Weak network failures occur when there is too little interaction between the actors in an innovation network; weak or missing connections can prevent important learning and innovation cycles [86]. The loss of a central actor in the network can interrupt important knowledge flows, or one of the central actors passes on information inefficiently due to poor communication or because the actor uses the knowledge advantage for their own benefit.
5. Conclusions
In this paper, we have extended the discussion on urban bioeconomy with an innovation economics perspective by examining the bioeconomic innovation network in the Stuttgart region to draw conclusions on knowledge processes and innovation. Given the consistency of our results with previous investigations, a research focus on innovation networks proves to be much more precise compared with the mainstream emphasis on technological spillovers. Networks allow for both a specific consideration of the varying roles and strategic considerations of single actors and well-specified policy recommendations for innovation policy. The still dominant analytical concept of technological spillovers instead is not capable of providing insights of similar depth and precision due to the assumption of involuntary knowledge flows [87].
We identify a scale-free network structure [58] of research cooperations for the supra-regional network and a star-like structure [60] with three central actors from the academic field. This network structure has several implications for regional knowledge and innovation processes. First, the high number of links to supra-regional actors increases the probability that new, relevant knowledge from other regions, which might otherwise not be available, flows into the region. Second, the decreasing connectivity of actors at more narrowly defined regional levels may limit the knowledge flow within the region and prevent desired cross-fertilization between different bioeconomy knowledge fields. Third, the high centrality of the three actors can result in an efficient knowledge diffusion on the one hand, but on the other hand it can also lead to a negative dependency. The high centrality of the two largest regional universities and the non-university research institute further implies that these actors are especially efficient in applying for funding. However, this comes with the risk that they soak up funding and relevant knowledge. A stronger integration of the so far less-connected actors in the network could initiate the creation of new, relevant knowledge. Finally, the diversity of the projects’ topics as well as the variety of actors from different industry branches participating in the projects reflect the relevance of the bioeconomy across different sectors and industries.
Stronger links between the three main actors may reduce fragility and strengthen the resilience of the network. This could be achieved through jointly operated research institutes (e.g., non-university research institutes). In Stuttgart, all Fraunhofer institutes are currently linked to the University of Stuttgart, which explains their strong ties; so far, no non-university research institution is tied to the University of Hohenheim. Moreover, the cooperation between less connected actors in the network should be fostered to generate more direct knowledge flows, and, thus, reduce weak network failures. This could be achieved through additional science and collaboration hubs or networking organizations. Such hubs could also support non-academic actors in applying for funding for their bioeconomic research and development projects.
Our analysis is subject to limitations that should be considered in the interpretation of our results and that offer potential for future research. First, even though the data for the year 2022 already provides a good basis for the analysis, it may be that a later extraction of the data from the database leads to a different picture of the network in that year, as information on bioeconomy research projects that started after we extracted the data has now been uploaded to the database. Secondly, the short observation period (2017–2022), which is due to our database, limits our conclusions as research projects are usually planned for a period of a few years. The non-academic actors might not engage in several bioeconomy research projects simultaneously. It would be interesting to see how the network evolves in terms of follow-up projects and long-term collaboration and whether connectivity among the actors will increase in the future.
The joint research projects in the federal funding database represent, although relevant, only a fraction of the actual research activities on bioeconomy in the region of Stuttgart. The inclusion of further data sources or the collection of primary data could therefore alter our results. Moreover, our network construction is based on data aggregation with regard to the VC categories as well as the nodes in the network. To reduce data noise, we constructed the network’s nodes based on the organization receiving the funding and not the department executing the research project. In the case of the Fraunhofer institutes, for example, this means that our investigation does not reveal which institutes in particular participated in the research projects. The aggregated data for the Fraunhofer institutes contains research institutes in as well as outside the Stuttgart region. Hence, these results should be treated with caution. An analysis on the department level could allow a more distinct evaluation and interpretation.
Our results only allow limited generalization for urban and industrialized regions with similar premises, as our research is based on a single case and potentially specific to the Stuttgart region due to regional peculiarities. Therefore, similar analyses across different urban regions should be performed to validate the robustness of our results and to uncover differences in terms of bioeconomy innovation networks due to regional prerequisites.
Author Contributions
Conceptualization: A.P., L.F.S., M.B. and F.S.; methodology: L.F.S.; software: L.F.S. (Gephi & R) and M.B. (R); validation: L.F.S. and M.B.; formal analysis: L.F.S.; investigation: L.F.S.; data curation: L.F.S.; writing—original draft preparation: L.F.S. and M.B.; writing—review and editing: L.F.S., F.S. and A.P.; visualization: L.F.S.; supervision: A.P. (research project) and L.F.S. (paper); project administration: A.P.; funding acquisition: A.P., F.S., L.F.S. and M.B. All authors have read and agreed to the published version of the manuscript.
Funding
This research was funded by Wirtschaftsförderung Region Stuttgart GmbH (WRS) as part of a cluster report on the bioeconomy in the region of Stuttgart.
Data Availability Statement
Not applicable.
Acknowledgments
The technical implementation of the R code for the creation of the lists of nodes and edges (data preparation) was supported by Karsten Schweikert (Core Facility Hohenheim (640), Modul Data & Statistical Consulting, University of Hohenheim) and by Patrick Wolf (Center for Solar Energy and Hydrogen Research Baden-Württemberg (ZSW)).
Conflicts of Interest
The authors declare no conflict of interest.
Appendix A
bioeconomy_words_main = c (“actinomy”, “aeruginosa”, “agrar”, “agri”, “agro”, “aktinomycet”, “alga”, “alge”, “algi”, “alkaloid”, “allelop”, “amino”, “anbau”, “antig”, “antikörp”, “apfelanbau”, “apheres”, “apoptos”, “aptam”, “arabidopsis”, “archae”, “array”, “assay”, “astacus”, “autotroph”, “baccatin”, “bacillus”, “bact”, “bakt”, “barley”, “basidiomycet”, “baum”, “bäum”, “beet”, “bio”, “blut”, “bodenfruchtbarkeit”, “brassica”, “breed”, “canola”, “carotin”, “cellulose”, “cereal”, “cerevisia”, “chitin”, “chitosan”, “chlorophyll”, “chloroplast”, “chromosom”, “clib”, “coli”, “coryne”, “cuphea”, “cyto”, “denitrifikation”, “derivat”, “diversitat”, “dna”, “drosophila”, “edelkreb”, “eiwei”, “elisa”, “embryo”, “endog”, “enzym”, “epilyz”, “epitop”, “erblich”, “ernte”, “erreger”, “escherichia”, “esteras”, “eukary”, “eutropha”, “farming”, “fauna”, “feedstock”, “ferkel”, “ferment”, “fett”, “fettsaeur”, “fettsäur”, “flachsfaser”, “flavonoid”, “fleisch”, “flora”, “food”, “forst”, “freiland”, “frucht”, “frücht”, “fruecht”, “fungeos”, “fungus”, “fusarium”, “futter”, “gartenbau”, “geflügel”, “gehirn”, “gerst”, “getraenke”, “getränke”, “getreid”, “gewachs”, “gewächs”, “gewaechs”, “glioblastom”, “glucos”, “glutamat”, “glutamicum”, “glyc”, “glyk”, “golgi”, “grain”, “haploid”, “harnstoff”, “hefe”, “hepatozyten”, “heterotroph”, “hoelz”, “holz”, “hölz”, “homolog”, “homozygot”, “honigbi”, “hormon”, “hortinlea”, “human”, “hydroformyl”, “hydrolys”, “inhibitor”, “insekt”, “interferon”, “inulin”, “ipas”, “kairomon”, “kartoffel”, “kartoffelkreb”, “kaskad”, “kautschuk”, “keim”, “kiefer”, “klonal”, “kohlenhy”, “koksaghyz”, “kollag”, “kolorektal”, “korn”, “kultivierung”, “landrass”, “landwirtschaft”, “leben”, “leber”, “legehenn”, “leguminos”, “lektin”, “liganden”, “lignin”, “ligno”, “lipas”, “lipid”, “lockstoff”, “lymph”, “lysin”, “lyso”, “maeus”, “mais”, “malign”, “marin”, “markergestützt”, “maus”, “mäus”, “meliloti”, “mesenchymal”, “metabol”, “methylier”, “mikroalg”, “mikroben”, “mikrobie”, “milch”, “miscanthus”, “mistel”, “mitochond”, “mizell”, “monozyt”, “morbus”, “morphism”, “mrna”, “mutant”, “mutation”, “mykorr”, “nachwachs”, “naehr”, “nahr”, “nähr”, “napus”, “natuer”, “natür”, “nematod”, “neuron”, “nukleas”, “nuklease”, “nuklein”, “okolog”, “okosys”, “oled”, “oligom”, “oligonukleotid”, “omega”, “omics”, “organ”, “osmose”, “palmoel”, “palmöl”, “papier”, “pappel”, “pathog”, “pcr”, “pektin”, “peptid”, “pferd”, “pflanz”, “phaeno”, “phano”, “phäno”, “phanomics”, “phenom”, “pheromon”, “photosynth”, “phytopathog”, “pilz”, “plant”, “plantag”, “plasmid”, “pluripotent”, “polymerase”, “polyoma”, “pradikativ”, “prädikativ”, “praedikativ”, “praparat”, “prokaryot”, “proteas”, “protein”, “proteom”, “protoplast”, “pseudomonas”, “qtl”, “raps”, “rekomb”, “resistenzg”, “retikulum”, “rezeptor”, “rhizobium”, “rhizosph”, “ribosom”, “rogg”, “saat”, “sacch”, “samen”, “schädling”, “schaedling”, “schwein”, “sequenzanalys”, “serum”, “sinapin”, “sirna”, “snp”, “solanum”, “somat”, “sonnenblum”, “staphylococcus”, “staphylokinas”, “starkevarietat”, “stärkevarietät”, “steroid”, “stofflich”, “stoffumwandl”, “stoffwechsel”, “streptomycet”, “stroh”, “subtilis”, “tannen”, “taraxacum”, “tarulin”, “thaliana”, “thuringiensis”, “tierisch”, “tilling”, “tissu”, “transgen”, “transkriptom”, “tropi”, “vakzin”, “vegeta”, “vitamin”, “vitro”, “vivo”, “vulgaris”, “wald”, “wein”, “weißstängel”, “weissstängel”, “weiz”, “wheat”, “wood”, “wuchsstoff”, “xylos”, “zebra”, “zellkultur”, “zerocarbfp”, “zoonos”, “zucht”, “zücht”, “zucker”, “zuecht”, “zwitter”).
| 1 | In Germany: NUTS 3 regions correspond to the districts and autonomous cities. With regard to the region of Stuttgart, this includes the state capital Stuttgart and its five surrounding administrative districts, namely Boeblingen, Esslingen, Goeppingen, Ludwigsburg, and Rems-Murr. |
| 2 | We set the Force Atlas layout to the following parameters: inertia = 0.1, repulsion strength = 150.0, attraction strength = 1.0, maximum displacement = 1.0, autostab strength = 80.0, autostab sensibility =0.2, gravity = 30.0, speed = 1.0, and adjust by sizes was checked. |
| 3 | The minimum size was set to 15 and the maximum size to 70. |
References
- Pyka, A. Dedicated innovation systems to support the transformation towards sustainability: Creating income opportunities and employment in the knowledge-based digital bioeconomy. J. Open Innov. 2017, 3, 1–18. [Google Scholar] [CrossRef]
- Federal Ministry of Education and Research; Federal Ministry of Food and Agriculture. National Bioeconomy Strategy: Summary 2020, Berlin, Germany. Available online: https://www.bmel.de/SharedDocs/Downloads/EN/Publications/national-bioeconomy-strategy-summary.pdf?__blob=publicationFile&v=6 (accessed on 20 January 2023).
- Dabbert, S.; Lewandowski, I.; Weiss, J.; Pyka, A. (Eds.) Knowledge-Driven Developments in the Bioeconomy: Technological and Economic Perspectives; Springer: Cham, Switzerland, 2017; ISBN 9783319583747. [Google Scholar]
- Lewandowski, I.; Gaudet, N.; Lask, J.; Maier, J.; Tchouga, B.; Vargas-Carpintero, R. Context. In Bioeconomy; Lewandowski, I., Ed.; Springer: Cham, Switzerland, 2018; pp. 5–16. ISBN 9783319681528. [Google Scholar]
- Pyka, A. Transformation of Economic Systems: The Bio-Economy Case. In Knowledge-Driven Developments in the Bioeconomy: Technological and Economic Perspectives; Dabbert, S., Lewandowski, I., Weiss, J., Pyka, A., Eds.; Springer: Cham, Switzerland, 2017; pp. 3–16. ISBN 9783319583747. [Google Scholar]
- Bell, J.; Paula, L.; Dodd, T.; Németh, S.; Nanou, C.; Mega, V.; Campos, P. EU ambition to build the world’s leading bioeconomy-Uncertain times demand innovative and sustainable solutions. N. Biotechnol. 2018, 40, 25–30. [Google Scholar] [CrossRef]
- Bringezu, S.; Banse, M.; Ahmann, L.; Bezama, A.; Billig, E.; Bischof, R.; Blanke, C.; Brosowski, A.; Brüning, S.; Borchers, M.; et al. Pilotbericht zum Monitoring der Deutschen Bioökonomie; Center for Environmental Systems Research (CESR): Kassel, Germany, 2020. [Google Scholar] [CrossRef]
- Andersen, M.S.; Christensen, L.D.; Donner-Amnell, J.; Eikeland, P.O.; Hedeler, B.; Hildingsson, R.; Johansson, B.; Khan, J.; Kronsell, A.; Inderberg, T.H.J.; et al. To facilitate a fair bioeconomy transition, stronger regional-level linkages are needed. Biofuels Bioprod. Biorefining 2022, 16, 929–941. [Google Scholar] [CrossRef]
- D’Amato, D.; Droste, N.; Allen, B.; Kettunen, M.; Lähtinen, K.; Korhonen, J.; Leskinen, P.; Matthies, B.D.; Toppinen, A. Green, circular, bio economy: A comparative analysis of sustainability avenues. J. Clean. Prod. 2017, 168, 716–734. [Google Scholar] [CrossRef]
- Virgin, I.; Fielding, M.; Sundell, M.F.; Hoff, H.; Granit, J. Benefits and challenges of a new knowledge based bioeconomy. In Creating Sustainable Bioeconomies: The Bioscience Revolution in Europe and Africa; Virgin, I., Morris, J., Eds.; Routledge: Abingdon, UK, 2017; pp. 11–25. [Google Scholar]
- Pyka, A.; Prettner, K. Economic Growth, Development, and Innovation: The Transformation Towards a Knowledge-Based Bioeconomy. In Bioeconomy; Lewandowski, I., Ed.; Springer International Publishing: Cham, Switzerland, 2018; pp. 331–342. ISBN 9783319681528. [Google Scholar]
- Ministerium für Ernährung, ländlichen Raum und Verbraucherschutz (MLR) und Ministerium für Umwelt, Klima und Energiewirtschaft. Landesstrategie nachhaltige Bioökonomie Baden-Württemberg 2019, Stuttgart, Germany. Available online: https://um.baden-wuerttemberg.de/fileadmin/redaktion/m-um/intern/Dateien/Dokumente/6_Wirtschaft/Biooekonomie/Landesstrategie-Nachhaltige-Biooekonomie-barrierefrei.pdf (accessed on 12 April 2022).
- Dupont-Inglis, J.; Borg, A. Destination bioeconomy—The path towards a smarter, more sustainable future. N. Biotechnol. 2018, 40, 140–143. [Google Scholar] [CrossRef]
- Edquist, C. Systems of Innovation: Perspectives and Challenges. In The Oxford Handbook of Innovation; Fagerberg, J., Mowery, D.C., Eds.; Oxford University Press: Oxford, UK, 2006; pp. 181–208. [Google Scholar]
- Powell, W.; Grodal, S. Network of Innovators. In The Oxford Handbook of Innovation; Fagerberg, J., Mowery, D., Nelson, R.R., Eds.; Oxford University Press: Oxford, UK, 2006; pp. 56–85. ISBN 9780191577314. [Google Scholar]
- Herstad, S.J.; Sandven, T.; Solberg, E. Location, education and enterprise growth. Appl. Econ. Lett. 2013, 20, 1019–1022. [Google Scholar] [CrossRef]
- Bogner, K.; Dahlke, J. Born to transform? German bioeconomy policy and research projects for transformations towards sustainability. Ecol. Econ. 2022, 195, 107366. [Google Scholar] [CrossRef]
- Prochaska, L.; Schiller, D. An evolutionary perspective on the emergence and implementation of mission-oriented innovation policy: The example of the change of the leitmotif from biotechnology to bioeconomy. Rev. Evol. Political Econ. 2021, 2, 141–249. [Google Scholar] [CrossRef]
- Bogner, K.; Knowledge Networks in the German Bioeconomy: Network Structure of Publicly Funded R&D Networks. Hohenh. Discuss. Pap. Bus. Econ. Soc. Sci. 2019. Available online: https://wiso.uni-hohenheim.de/fileadmin/einrichtungen/wiso/Forschungsdekan/Papers_BESS/dp_2019-03_online.pdf (accessed on 3 May 2022).
- Abbasiharofteh, M.; Broekel, T. Still in the shadow of the wall? The case of the Berlin biotechnology cluster. Environ. Plan A 2021, 53, 73–94. [Google Scholar] [CrossRef]
- Schmidt, S. Balancing the spatial localisation ‘Tilt’: Knowledge spillovers in processes of knowledge-intensive services. Geoforum 2015, 65, 374–386. [Google Scholar] [CrossRef]
- Al-Laham, A.; Amburgey, T.L. Staying Local or Reaching Globally? Analyzing Structural Characteristics of Project-Based Networks in German Biotech. In Project-Based Organizing and Strategic Management; Cattani, G., Ferriani, S., Frederiksen, L., Täube, F., Eds.; Emerald Group Publishing Limited: Bingley, UK, 2011; pp. 323–356. ISBN 978-1-78052-192-3. [Google Scholar]
- Plum, O.; Hassink, R. On the Nature and Geography of Innovation and Interactive Learning: A Case Study of the Biotechnology Industry in the Aachen Technology Region, Germany. Eur. Plan. Stud. 2011, 19, 1141–1163. [Google Scholar] [CrossRef]
- Mitze, T.; Strotebeck, F. Centrality and get-richer mechanisms in interregional knowledge networks. Reg. Stud. 2018, 52, 1477–1489. [Google Scholar] [CrossRef]
- Mitze, T.; Strotebeck, F. Determining factors of interregional research collaboration in Germany’s biotech network: Capacity, proximity, policy? Technovation 2019, 80–81, 40–53. [Google Scholar] [CrossRef]
- Giurca, A.; Metz, T. A social network analysis of Germany’s wood-based bioeconomy: Social capital and shared beliefs. Environ. Innov. Soc. Transit. 2018, 26, 1–14. [Google Scholar] [CrossRef]
- Giones, F.; Laufs, D.; Schultz, C. Co-creating Science Commercialization Opportunities for Blue Biotechnologies: The FucoSan Project. Sustainability 2020, 12, 5578. [Google Scholar] [CrossRef]
- Bezama, A.; Mittelstädt, N.; Thrän, D. A Systematic Approach for Assessing and Managing the Urban Bioeconomy. In Bio#Futures; Koukios, E., Sacio-Szymańska, A., Eds.; Springer International Publishing: Cham, Switzerland, 2021; pp. 393–410. ISBN 978-3-030-64969-2. [Google Scholar]
- Pallagst, K.; Vargas-Hernández, J.; Hammer, P. Green Innovation Areas—En Route to Sustainability for Shrinking Cities? Sustainability 2019, 11, 6674. [Google Scholar] [CrossRef]
- Schneider, P.; Meyer, A.; Plat, K. Potential of Bioeconomy in Urban Green Infrastructure. In Bioeconomy for Sustainable Development; Keswani, C., Ed.; Springer: Singapore, 2020; pp. 251–276. ISBN 978-981-13-9431-7. [Google Scholar]
- Winkler, B.; Maier, A.; Lewandowski, I. Urban Gardening in Germany: Cultivating a Sustainable Lifestyle for the Societal Transition to a Bioeconomy. Sustainability 2019, 11, 801. [Google Scholar] [CrossRef]
- Taylor Buck, N.; While, A. The urban bioeconomy: Extracting value from the ecological and biophysical. J. Environ. Plan Manag. 2021, 64, 182–201. [Google Scholar] [CrossRef]
- Taffuri, A.; Sciullo, A.; Diemer, A.; Nedelciu, C.E. Integrating Circular Bioeconomy and Urban Dynamics to Define an Innovative Management of Bio-Waste: The Study Case of Turin. Sustainability 2021, 13, 6224. [Google Scholar] [CrossRef]
- Ddiba, D.; Andersson, K.; Rosemarin, A.; Schulte-Herbrüggen, H.; Dickin, S. The circular economy potential of urban organic waste streams in low- and middle-income countries. Environ. Dev. Sustain. 2022, 24, 1116–1144. [Google Scholar] [CrossRef]
- Yang, N.-H.N.; Yang, A. Urban bioeconomy: Uncovering its components, impacts and the Urban Bio-Symbiosis. Clean Prod. Lett. 2022, 3, 100015. [Google Scholar] [CrossRef]
- Borgatti, S.P.; Everett, M.G.; Johnson, J.C. Analyzing Social Networks; SAGE: Thousand Oaks, CA, USA, 2013; ISBN 9781446247419. [Google Scholar]
- Borgatti, S.P.; Everett, M.G.; Johnson, J.C. Analyzing Social Networks, 2nd ed.; SAGE: Thousand Oaks, CA, USA, 2018; ISBN 9781526404107. [Google Scholar]
- Barabási, A.; Jeong, H.; Néda, Z.; Ravasz, E.; Schubert, A.; Vicsek, T. Evolution of the social network of scientific collaborations. Phys. A Stat. Mech. Its Appl. 2002, 311, 590–614. [Google Scholar] [CrossRef]
- Demirkan, I.; Deeds, D.L.; Demirkan, S. Exploring the Role of Network Characteristics, Knowledge Quality, and Inertia on the Evolution of Scientific Networks. J. Manag. 2013, 39, 1462–1489. [Google Scholar] [CrossRef]
- Guimerà, R.; Uzzi, B.; Spiro, J.; Amaral, L.A.N. Team assembly mechanisms determine collaboration network structure and team performance. Science 2005, 308, 697–702. [Google Scholar] [CrossRef] [PubMed]
- Lee, D.; Goh, K.-I.; Kahng, B.; Kim, D. Complete trails of coauthorship network evolution. Phys. Rev. E Stat. Nonlin. Soft Matter Phys. 2010, 82, 26112. [Google Scholar] [CrossRef] [PubMed]
- Tang, X.; Yang, C.C.; Song, M. Understanding the evolution of multiple scientific research domains using a content and network approach. J. Am. Soc. Inf. Sci. Technol. 2013, 64, 1065–1075. [Google Scholar] [CrossRef]
- Broekel, T.; Graf, H. Structural Properties of Cooperation Networks in Germany: From Basic to Applied Research; Friedrich-Schiller-University: Jena, Germany, 2010; Available online: https://econpapers.repec.org/paper/jrpjrpwrp/2010-078.htm (accessed on 1 February 2023).
- Broekel, T.; Graf, H. Public research intensity and the structure of German R&D networks: A comparison of 10 technologies. Econ. Innov. New Technol. 2012, 21, 345–372. [Google Scholar] [CrossRef]
- Buchmann, T.; Kaiser, M. The effects of R&D subsidies and network embeddedness on R&D output: Evidence from the German biotech industry. Ind. Innov. 2019, 26, 269–294. [Google Scholar] [CrossRef]
- Bundesministerium für Bildung und Forschung. Förderkatalog. Available online: https://foerderportal.bund.de/foekat (accessed on 13 March 2023).
- Bastian, M.; Heymann, S.; Jacomy, M. Gephi: An Open Source Software for Exploring and Manipulating Networks. ICWSM 2009, 3, 361–362. [Google Scholar] [CrossRef]
- Jacomy, M.; Venturini, T.; Heymann, S.; Bastian, M. ForceAtlas2, a continuous graph layout algorithm for handy network visualization designed for the Gephi software. PLoS ONE 2014, 9, e98679. [Google Scholar] [CrossRef]
- Zinke, H.; El-Chichakli, B.; Dieckhoff, P.; Wydra, S.; Hüsing, B. Bioökonomie für die Industrienation: Ausgangslage für biobasierte Innovationen in Deutschland verbessern 2016. Available online: https://www.biooekonomierat.de/media/pdf/archiv/hintergrundpapier-isa-veroeffentlichung.pdf (accessed on 4 April 2022).
- Scott, J. Social Network Analysis, 3rd ed.; Sage: Los Angeles, CA, USA, 2013; ISBN 9781446209042. [Google Scholar]
- Wasserman, S.; Faust, K. Social Network Analysis: Methods and Applications; Reprinted; Cambridge University Press: Cambridge, UK, 1994; ISBN 9780521387071. [Google Scholar]
- Clark, J.; Holton, D.A. A First Look at Graph Theory; Allied Publication with World Scientific Singapore: Singapore, 1995; ISBN 9788170234630. [Google Scholar]
- Borgatti, S.P. Centrality and network flow. Soc. Netw. 2005, 27, 55–71. [Google Scholar] [CrossRef]
- Freeman, L.C. Centrality in social networks conceptual clarification. Soc. Netw. 1978, 1, 215–239. [Google Scholar] [CrossRef]
- Vermeulen, B.; Pyka, A. The Role of Network Topology and the Spatial Distribution and Structure of Knowledge in Regional Innovation Policy: A Calibrated Agent-Based Model Study. Comput. Econ. 2018, 52, 773–808. [Google Scholar] [CrossRef]
- Cowan, R.; Jonard, N. Network structure and the diffusion of knowledge. J. Econ. Dyn. Control. 2004, 28, 1557–1575. [Google Scholar] [CrossRef]
- Kim, H.; Park, Y. Structural effects of R&D collaboration network on knowledge diffusion performance. Expert Syst. Appl. 2009, 36, 8986–8992. [Google Scholar] [CrossRef]
- Barabasi, A.L.; Albert, R. Emergence of scaling in random networks. Science 1999, 286, 509–512. [Google Scholar] [CrossRef]
- Stephen, A.T.; Toubia, O. Explaining the power-law degree distribution in a social commerce network. Soc. Netw. 2009, 31, 262–270. [Google Scholar] [CrossRef]
- Baran, P. On Distributed Communications Networks. IEEE Trans. Commun. Syst. 1964, 12, 1–9. [Google Scholar] [CrossRef]
- Alkemade, F.; Castaldi, C. Strategies for the Diffusion of Innovations on Social Networks. Comput. Econ. 2005, 25, 3–23. [Google Scholar] [CrossRef]
- Wang, X.F.; Chen, G. Synchronization in scale-free dynamical networks: Robustness and fragility. IEEE Trans. Circuits Syst. I 2002, 49, 54–62. [Google Scholar] [CrossRef]
- European Commission. A Sustainable Bioeconomy for Europe: Strengthening the Connection between Economy, Society and the Environment: Updated Bioeconomy Strategy; Publications Office: Brussels, Belgium, 2018. [Google Scholar]
- Lazer, D.; Friedman, A. The network structure of exploration and exploitation. Adm. Sci. Q 2007, 52, 667–694. [Google Scholar] [CrossRef]
- Pyka, A. Avoiding evolutionary inefficiencies in innovation networks. Prometheus 2014, 32, 265–279. [Google Scholar] [CrossRef]
- Universität Hohenheim. Bioökonomie 2020: Komplexe Systeme Verstehen und Gestalten; Universität Hohenheim: Stuttgart, Germany, 2013. [Google Scholar]
- Saramäki, J.; Kivelä, M.; Onnela, J.-P.; Kaski, K.; Kertész, J. Generalizations of the clustering coefficient to weighted complex networks. Phys. Rev. E Stat. Nonlin. Soft Matter Phys. 2007, 75, 27105. [Google Scholar] [CrossRef] [PubMed]
- Watts, D.J.; Strogatz, S.H. Collective dynamics of ‘small-world’ networks. Nature 1998, 393, 440–442. [Google Scholar] [CrossRef]
- Heimann, T. Bioeconomy and SDGs: Does the Bioeconomy Support the Achievement of the SDGs? Earth’s Future 2019, 7, 43–57. [Google Scholar] [CrossRef]
- Lööf, H.; Broström, A. Does knowledge diffusion between university and industry increase innovativeness? J. Technol. Transf. 2008, 33, 73–90. [Google Scholar] [CrossRef]
- Jaffe, A.B. Real Effects of Academic Research. Am. Econ. Rev. 1989, 79, 957–970. [Google Scholar]
- Harhoff, D. Firm Formation And Regional Spillovers—Evidence From Germany. Econ. Innov. New Technol. 1999, 8, 27–55. [Google Scholar] [CrossRef]
- Fischer, M.M.; Varga, A. Spatial knowledge spillovers and university research: Evidence from Austria. Ann. Reg. Sci. 2003, 37, 303–322. [Google Scholar] [CrossRef]
- Audretsch, D.B.; Feldman, M.P. Innovative clusters and the industry life cycle. Rev. Ind. Organ. 1996, 11, 253–273. [Google Scholar] [CrossRef]
- Döring, T.; Schnellenbach, J. What do we know about geographical knowledge spillovers and regional growth?: A survey of the literature. Reg. Stud. 2006, 40, 375–395. [Google Scholar] [CrossRef]
- Audretsch, D.B.; Lehmann, E.E.; Warning, S. University spillovers and new firm location. Res. Policy 2005, 34, 1113–1122. [Google Scholar] [CrossRef]
- Hülsbeck, M.; Pickavé, E.N. Regional knowledge production as determinant of high-technology entrepreneurship: Empirical evidence for Germany. Int. Entrep. Manag. J. 2014, 10, 121–138. [Google Scholar] [CrossRef]
- Swann, P.; Prevezer, M. A comparison of the dynamics of industrial clustering in computing and biotechnology. Res. Policy 1996, 25, 1139–1157. [Google Scholar] [CrossRef]
- Engel, D.; Heneric, O. Localization of knowledge and entrepreneurs’ mobility: The case of Germany’s biotechnology industry. Rev. Reg. Res. 2013, 33, 173–192. [Google Scholar] [CrossRef]
- Entwicklung von Wirtachaft und Beschäftigung im Zeichen von Transformation und Corona-Pandemie; Dispan, J.; Koch, A.; König, T.; Seibold, B. (Eds.) Verband Region Stuttgart: Stuttgart, Germany, 2021; ISBN 9783934859654. [Google Scholar]
- Cingiz, K.; Gonzáles Hermoso, H.; Heijman, W.; Wesseler, J.H.H. BIOMONITOR—Bioeconomc Shares. Available online: http://data.europa.eu/89h/cde85443-3e27-4b52-8349-0945a733ff93 (accessed on 17 February 2023).
- Fernandes, C.I.; Ferreira, J.J.M. Knowledge spillovers: Cooperation between universities and KIBS. R&D Manag. 2013, 43, 461–472. [Google Scholar] [CrossRef]
- Roesler, C.; Broekel, T. The role of universities in a network of subsidized R&D collaboration: The case of the biotechnology-industry in Germany. Rev. Reg. Res. 2017, 37, 135–160. [Google Scholar] [CrossRef]
- Boschma, R. Proximity and Innovation: A Critical Assessment. Reg. Stud. 2005, 39, 61–74. [Google Scholar] [CrossRef]
- Weber, K.M.; Rohracher, H. Legitimizing research, technology and innovation policies for transformative change. Res. Policy 2012, 41, 1037–1047. [Google Scholar] [CrossRef]
- Klein Woolthuis, R.; Lankhuizen, M.; Gilsing, V. A system failure framework for innovation policy design. Technovation 2005, 25, 609–619. [Google Scholar] [CrossRef]
- Pyka, A.; Gilbert, N.; Ahrweiler, P. Agent-Based Modelling of Innovation Networks—The Fairytale of Spillover. In Innovation Networks: New Approaches in Modelling and Analyzing; Scharnhorst, A., Pyka, A., Eds.; Springer: Berlin/Heidelberg, Germany, 2009; pp. 101–126. ISBN 978-3-540-92266-7. [Google Scholar]
Figure 1.
Data collection and preparation process. [Note: class (i) projects that can certainly be assigned to the bioeconomy, class (ii) projects that can partly be assigned to the bioeconomy, and class (iii) projects with a thematic focus that cannot be assigned to the bioeconomy are constructed according to Ref. [18].

Figure 2.
Structure of the bioeconomy according to [18]. Source: Own representation based on Ref. [18].

Figure 3.
(a) Collaboration in bioeconomic projects between actors in the Stuttgart region, in Baden-Württemberg, and outside Baden-Württemberg; (b) Collaboration in bioeconomic projects between actors in the Stuttgart region and actors in Baden-Württemberg; (c) Collaboration in bioeconomic projects between actors in the Stuttgart region.

Figure 4.
(a) Degree distribution of the network depicted in Figure 3a; (b) Degree distribution of the network depicted in Figure 3b; (c) Degree distribution of the network depicted in Figure 3c.

Figure 5.
(a) Log-log plot of degree distribution depicted in Figure 4a; (b) Log-log plot of degree distribution depicted in Figure 4b; (c) Log-log plot of degree distribution depicted in Figure 4c.

Figure 6.
(a) Distribution of project size (i.e., number of actors per project); (b) Distribution of research projects per actors.
Figure 6.
(a) Distribution of project size (i.e., number of actors per project); (b) Distribution of research projects per actors.

Figure 7.
Dynamic representation of the supra-regional bioeconomy network: (a) supra-regional bioeconomy network in 2017; (b) supra-regional bioeconomy network in 2018; (c) supra-regional bioeconomy network in 2019; (d) supra-regional bioeconomy network in 2020; (e) supra-regional bioeconomy network in 2021; (f) supra-regional bioeconomy network in 2022.

Figure 8.
Dynamic representation of the regional bioeconomy network: (a) regional bioeconomy network in 2017; (b) regional bioeconomy network in 2018; (c) regional bioeconomy network in 2019; (d) regional bioeconomy network in 2020; (e) regional bioeconomy network in 2021; (f) regional bioeconomy network in 2022.

Figure 9.
Ego networks of the three most central actors: (a) ego-network of the University of Hohenheim (UH) (b) ego-network of the Fraunhofer institutes (FIs); (c) ego-network of the University of Stuttgart (US).
Figure 9.
Ego networks of the three most central actors: (a) ego-network of the University of Hohenheim (UH) (b) ego-network of the Fraunhofer institutes (FIs); (c) ego-network of the University of Stuttgart (US).

Figure 10.
Distribution of bioeconomic topics in the supra-regional network based on the thematic focus of the research collaborations.
Figure 10.
Distribution of bioeconomic topics in the supra-regional network based on the thematic focus of the research collaborations.

Figure 11.
Proportional distribution of bioeconomic thematic focus of research collaborations in the period 2017–2022.
Figure 11.
Proportional distribution of bioeconomic thematic focus of research collaborations in the period 2017–2022.

Figure 12.
Distribution of funding across bioeconomic thematic areas in the supra-regional bioeconomy network in the period 2017–2022.
Figure 12.
Distribution of funding across bioeconomic thematic areas in the supra-regional bioeconomy network in the period 2017–2022.


Table 1.
Global network measures for the dynamic analysis of the supra-regional network from 2017 to 2022.
Table 1.
Global network measures for the dynamic analysis of the supra-regional network from 2017 to 2022.
| 2017 | 2018 | 2019 | 2020 | 2021 | 2022 | |
|---|---|---|---|---|---|---|
| Number of nodes | 6 | 47 | 116 | 192 | 283 | 233 |
| Number of edges | 11 | 158 | 400 | 582 | 950 | 766 |
| Graph density | 0.733 | 0.146 | 0.06 | 0.032 | 0.024 | 0.028 |
| Average clustering coefficient | 0.92 | 0.908 | 0.913 | 0.92 | 0.919 | 0.915 |
| Connected Components | 1 | 1 | 3 | 7 | 9 | 7 |
Table 2.
Global network measures for the dynamic analysis of the regional network from 2017 to 2022.
Table 2.
Global network measures for the dynamic analysis of the regional network from 2017 to 2022.
| 2017 | 2018 | 2019 | 2020 | 2021 | 2022 | |
|---|---|---|---|---|---|---|
| Number of nodes | 1 | 6 | 13 | 27 | 46 | 40 |
| Number of edges | 0 | 5 | 10 | 18 | 45 | 43 |
| Graph density | - | 0.333 | 0.128 | 0.051 | 0.043 | 0.055 |
| Average clustering coefficient | - | 0.556 | 0.517 | 0.514 | 0.750 | 0.713 |
| Connected Components | 1 | 2 | 5 | 12 | 18 | 14 |
Table 3.
Classification of the regional actors in the bioeconomy network of the Stuttgart region by sectors.
Table 3.
Classification of the regional actors in the bioeconomy network of the Stuttgart region by sectors.
| Bioeconomy Sector | Regional Bioeconomy Actor(s) | Count |
|---|---|---|
| Process and mechanical engineering | plasma technology GmbH, e-flox GmbH, KE-Technologie GmbH, WS Reformer GmbH, Hubl GmbH, iat-Ingenieurberatung GmbH, Deutsches Zentrum für Luft- und Raumfahrt e.V., Coperion GmbH | 8 |
| Research | University of Hohenheim, University of Stuttgart, Fraunhofer Institutes, Steinbeis Innovation gGmbH, DIALOGIK, Duale Hochschule Baden-Württemberg (DHBW), Hochschule für Wirtschaft und Umwelt Nürtingen-Geislingen (HfWU) | 7 |
| Biotechnology | Subitec GmbH, FUMATECH BWT GmbH, Curetis GmbH, ITV Denkendorf Produktservice GmbH, nadicom—Gesellschaft für angewandte Mikrobiologie mbH, Robert Bosch Gesellschaft für medizinische Forschung mbH, candidum GmbH | 7 |
| Chemical products | Blaser Swisslube GmbH, REMSGOLD-CHEMIE GmbH & Co. KG, Schill + Seilacher GmbH, oelheld GmbH | 4 |
| Agriculture, forestry and fishery | Felsengartenkellerei Besigheim eG, Staatsschule für Gartenbau Stuttgart-Hohenheim, Fairventures Worldwide FVW gGmbH | 3 |
| Consultancy and audit | LKV Baden-Wuerttemberg, ABCERT AG, LASSO Ingenieurgesellschaft mbH | 3 |
| Electrical engineering | Institut für Mikroelektronik Stuttgart, Deutsche METROHM Prozessanalytik GmbH & Co. KG, Festo SE & Co. KG | 3 |
| Residual materials, recycling | BEM Umweltservice GmbH, PROPAKMA GmbH, PlasmaAir AG | 3 |
| Construction | Alfred Kiess GmbH, Helix Pflanzensysteme GmbH | 2 |
| Automotive | Mercedes-Benz AG, Robert Bosch GmbH | 2 |
| Other processing industries | BARiT GmbH, CIKONI GmbH | 2 |
| Wood, paper, textile, plastics etc. | Deutsche Institute für Textil- und Faserforschung Denkendorf (DITF) | 1 |
| Energy technology | Hitachi Zosen Inova Etogas GmbH | 1 |
| Industrial image processing | Matrix Vision GmbH | 1 |
| Pharmaceuticals/Medical Technology | ORTEMA GmbH | 1 |
| Associations | AT-Verband (Association for the promotion of adapted, socially and environmentally sound technologies) | 1 |
| Administration | State capital Stuttgart | 1 |
| Other | State Museum of Natural History Stuttgart | 1 |
Table 4.
Centrality measures of the three most central actors over time.
| 2017 | 2018 | 2019 | 2020 | 2021 | 2022 | |
|---|---|---|---|---|---|---|
| University of Hohenheim | ||||||
| Central actor ranking | 1 | 1 | 1 | 1 | 1 | 1 |
| Degree | 5 | 24 | 70 | 91 | 121 | 90 |
| Closeness centrality * | 1.0 | 0.676 | 0.743 | 0.68 | 0.650 | 0.618 |
| Betweenness centrality * | 0.4 | 0.585 | 0.628 | 0.528 | 0.486 | 0.418 |
| Fraunhofer institutes | ||||||
| Central actor ranking | - | 2 | 2 | 2 | 2 | 2 |
| Degree | - | 17 | 33 | 61 | 89 | 70 |
| Closeness centrality * | - | 0.554 | 0.566 | 0.535 | 0.588 | 0.540 |
| Betweenness centrality * | - | 0.292 | 0.299 | 0.089 | 0.327 | 0.302 |
| University of Stuttgart | ||||||
| Central actor ranking | - | 5 | 5 | 3 | 3 | 3 |
| Degree | - | 11 | 18 | 32 | 51 | 46 |
| Closeness centrality * | - | 0.517 | 0.525 | 0.535 | 0.533 | 0.540 |
| Betweenness centrality * | - | 0.055 | 0.041 | 0.089 | 0.097 | 0.124 |
* normalized centralities [1, 0].
Disclaimer/Publisher’s Note: The statements, opinions and data contained in all publications are solely those of the individual author(s) and contributor(s) and not of MDPI and/or the editor(s). MDPI and/or the editor(s) disclaim responsibility for any injury to people or property resulting from any ideas, methods, instructions or products referred to in the content. |
© 2023 by the authors. Licensee MDPI, Basel, Switzerland. This article is an open access article distributed under the terms and conditions of the Creative Commons Attribution (CC BY) license (https://creativecommons.org/licenses/by/4.0/).
Share and Cite
MDPI and ACS Style
Stöber, L.F.; Boesino, M.; Pyka, A.; Schuenemann, F. Bioeconomy Innovation Networks in Urban Regions: The Case of Stuttgart. Land 2023, 12, 935. https://doi.org/10.3390/land12040935
AMA Style
Stöber LF, Boesino M, Pyka A, Schuenemann F. Bioeconomy Innovation Networks in Urban Regions: The Case of Stuttgart. Land. 2023; 12(4):935. https://doi.org/10.3390/land12040935
Chicago/Turabian StyleStöber, Lea F., Marius Boesino, Andreas Pyka, and Franziska Schuenemann. 2023. "Bioeconomy Innovation Networks in Urban Regions: The Case of Stuttgart" Land 12, no. 4: 935. https://doi.org/10.3390/land12040935
Note that from the first issue of 2016, this journal uses article numbers instead of page numbers. See further details here.