Article

Wetland Evolution and Driving Force Analysis in the Qingtongxia Reservoir Area

1
Huaneng Tibet Hydropower Safety Engineering Technology Research Center, Chengdu 610093, China
2
State Key Laboratory of Simulation and Regulation of Water Cycle in River Basin, China Institute of Water Resources and Hydropower Research, Beijing 100038, China
3
Key Laboratory of River Basin Digital Twinning of Ministry of Water Resources, Beijing 100038, China
*
Author to whom correspondence should be addressed.
Land 2023, 12(4), 930; https://doi.org/10.3390/land12040930
Submission received: 1 March 2023 / Revised: 12 April 2023 / Accepted: 17 April 2023 / Published: 21 April 2023

Abstract

:
In recent years, the combination of river disruption and irrational human activities has caused serious damage to wetlands. Based on long-time-series remote-sensing images, this study applied the land use transfer matrix and landscape index method to investigate the dynamic evolution and driving forces of the Qingtongxia wetland in the upper reaches of the Yellow River from 1999 to 2020. The results show that the land use types of Qingtongxia wetland changed insignificantly from 1999 to 2020, with the area of water and grassland decreasing and the area of reed wetland, beach, farmland and forest increasing. The spatial changes in the watershed changed the distribution of other land uses within the wetland, with the watershed concentrating in a southwest–northeast direction and shrinking in the southwestern part of the wetland area between years. From 1999 to 2011, the wetlands were restored, the landscape became less fragmented and simpler in shape and the dominant species developed significantly. From 2010 to 2020, the wetlands were disturbed and, as a new tourist destination, the planning and renovation work increased fragmentation and the complexity of the patches. The complexity of the patch shape increased, and, at the same time, with the implementation of various conservation measures, the development of the dominant species within recovered. The drivers of change in the different land use areas within the wetlands of the Qingtongxia reservoir are dominated by flow, and the drivers of the evolution of landscape patterns within the wetlands are closely related to the population and gross regional product, in addition to being influenced by flow. In recent years, increased fragmentation has been the main reason for the decline in bird habitat quality. Maintaining bird diversity in the wetlands of the Qingtongxia reservoir can be based on rational planning of the proportion of different land uses within the wetlands, reducing landscape fragmentation by limiting human activities in the corresponding areas, as well as appropriate flow control measures. This study provides some reference for biodiversity conservation within wetlands.

1. Introduction

Wetlands are unique ecosystems with a mix of terrestrial and aquatic organisms [1]. As a valuable natural capital, wetlands cover approximately 6% of the world’s land but contribute 40% of ecosystem services, including providing breeding and feeding habitat for wetland species, enhancing soil moisture and nutrient cycling, purifying water resources, recharging groundwater and mitigating floods [2,3,4], which has rich market value [5,6]. However, with climate change and increased human activities, wetland ecosystems have been greatly damaged [7,8]. According to statistics, approximately 50% of the world’s wetlands have been degraded since 1990 [9,10]. Wetland loss and degradation not only negatively affect waterbirds that depend on wetland habitats but also reduce the ecosystem services that they can provide [11]. The restoration and management of wetland ecosystems face numerous challenges due to incomplete knowledge of the drivers and trajectories of wetland degradation [12,13]. Therefore, an accurate monitoring and understanding of wetland change is important for driving efficient management decisions and improving the resilience and sustainability of wetlands [1,7,14,15,16].
The land use transfer matrix is effective in revealing the direction of change in time and space for different land use types. The landscape pattern is an important indicator of landscape heterogeneity and the interaction of various ecological processes and contains two components: landscape composition (the proportion and scale of each land use/land cover, LULC type) and landscape configuration (the distribution and spatial characteristics of landscape patches). Changes in landscape composition and configuration reveal the complexity of spatially distributed characteristics and temporal changes in wetland land use that may affect the ecosystem service functions of wetlands [17,18,19,20]. Therefore, it is important to analyze the evolution of landscape patterns [21,22,23].
The natural environment and human activities are the main driving forces affecting wetland evolution and play different roles in wetland evolution at different times. In addition to temperature and precipitation [1,24], elevation, slope, irrigation system construction, watercourse diversions and damming projects may also influence wetland hydrological processes by altering the inundation frequency [5,8,25]. The input and output of hydrology affects soil biochemistry, drives the germination and growth of vegetation and changes the living environment of organisms, so wetland hydrology is the main determinant of wetland ecological composition and ecosystem services [12]. Urban construction, cultivated land development and oil exploitation have aggravated the fragmentation of the landscape, destroyed the original ecosystem and caused the degradation of wetlands by changing the area and internal structure of wetlands [26]. The Qingtongxia wetland is the largest and most biodiverse Yellow River wetland in Ningxia, and is an important migration route and habitat for birds in northwest China and East Asia–Australia around the world. Taking the wetland in the Qingtongxia reservoir area from 1999 to 2020 as an example, this study tried to (1) explore the temporal and spatial change characteristics of wetland and the evolution trend of the landscape pattern; (2) explore the driving forces of different land use types and landscape pattern changes in wetlands; (3) explore the evolution of rare bird habitats in wetlands and provide corresponding suggestions for habitat protection.

2. Materials and Methods
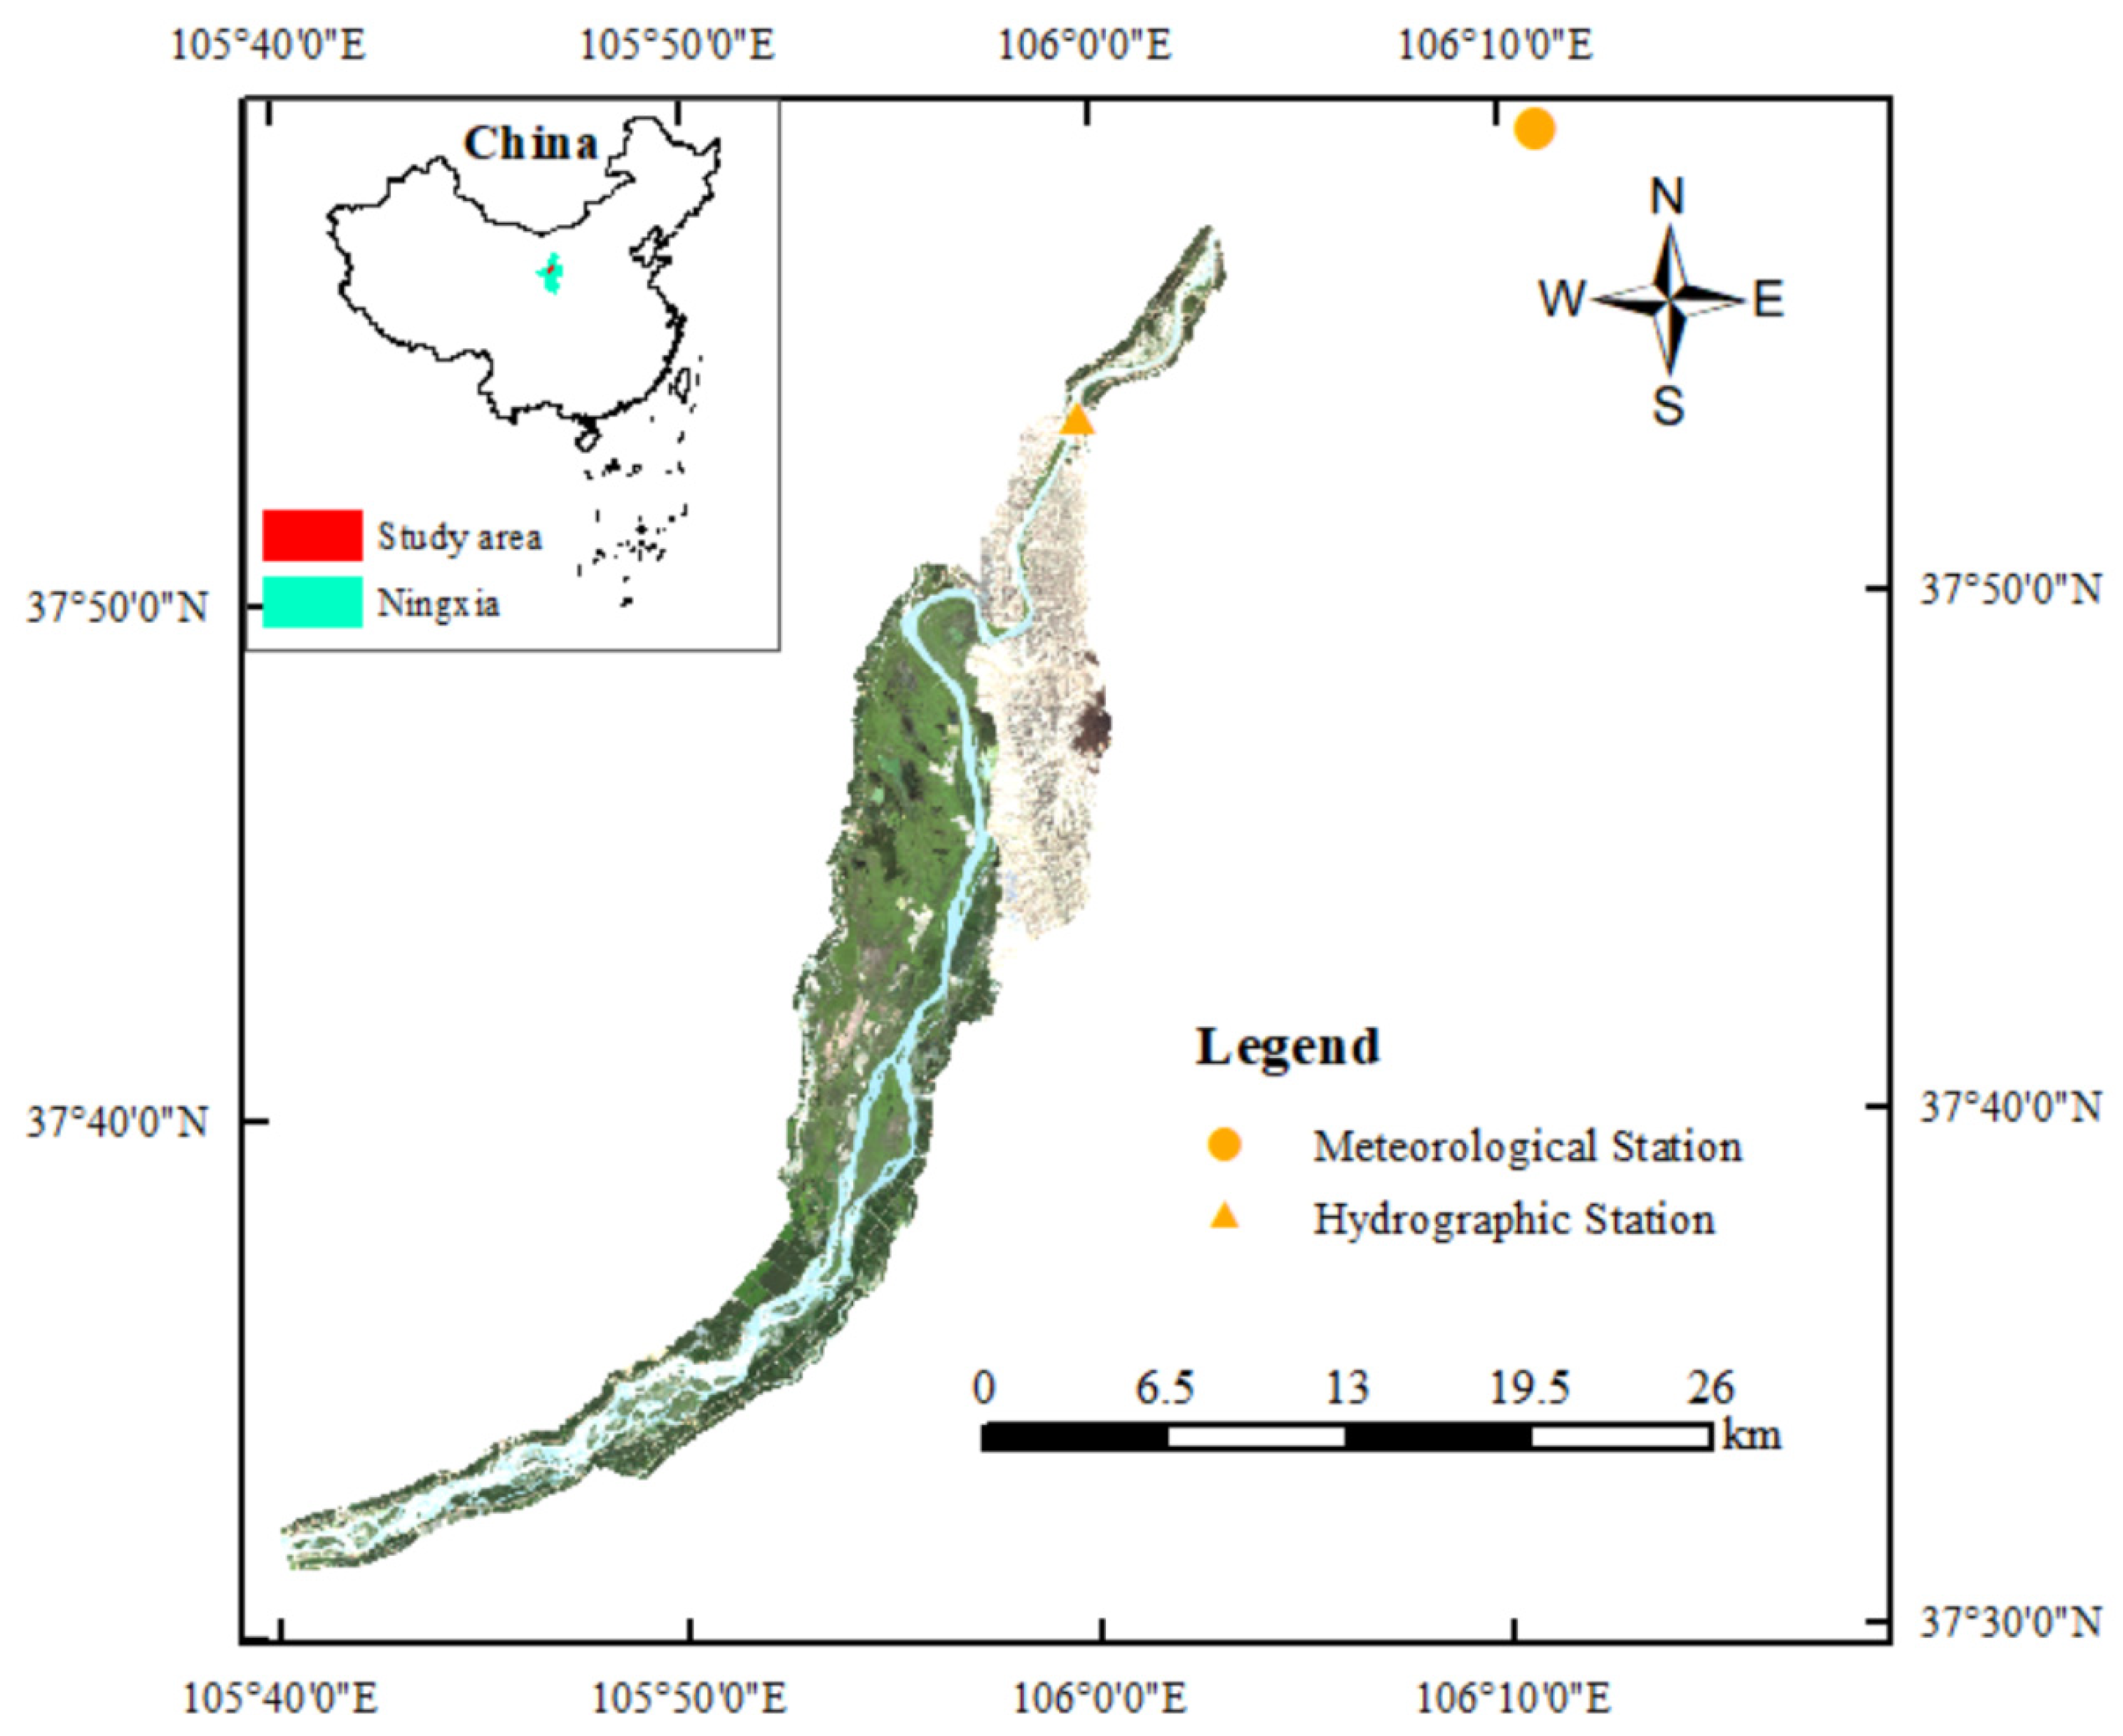
2.1. Study Area

Ningxia Qingtongxia Reservoir Area Wetland (105°47′30.31″ E–106°0′10.74″ E, 37°33′13.53″ N–37°53′22.03″ N) is located in the northwest of the Weining Plain of Ningxia Hui Autonomous Region, and the junction area between the southern part of Qingtongxia City and the northern part of Zhongning County in the lower reaches of the Yellow River (Figure 1),which is a native wetland ecosystem formed by decades of siltation by the Qingtongxia Water Conservancy Project [27,28]. This area is located in the northwest inland and belongs to the arid medium temperature climate zone, distributed at the intersection of the eastern monsoon region and the western arid region, and has a typical continental monsoon climate. The area contains four geomorphological forms: alluvial plains, low and middle mountains, hills and undulating plains, with a variety of natural geological landform landscape types and ecosystem characteristics. The distribution types of animals and plants in the area are diverse, and abundant water resources and years of sediment siltation provide suitable habitats for aquatic organisms, especially emergent plants, and abundant food resources for fish and birds.

2.2. Data Preparation

The Landsat series of remote sensing images from 1999–2020 used in the study were derived from geospatial data clouds (http://www.gscloud.cn, accessed on 15 August 2022), and images without cloud cover were selected from July to October in the study area. The meteorological data (temperature, precipitation) during 1999–2020 came from the National Meteorological Information Center (http://data.cma.cn, accessed on 6 March 2022), and the statistical data of Wuzhong meteorological station (the location can be seen in Figure 1) were selected, which were distributed near the research area and could represent the temperature and precipitation status of wetlands in the Qingtongxia reservoir area; the population and regional GDP data were derived from the Ningxia Statistical Yearbook, and the annual statistical data of Qingtongxia City were selected; the flow data were derived from the measured data of Qingtongxia Hydrological Station (Table 1).

2.3. Method

2.3.1. Land Use Classification

Remote sensing images can provide information about surrounding land use and its changes over time, which is of great significance for understanding wetland changes [14]. According to incomplete statistics, there are 18 orders, 47 families, 110 genera and 187 species (subspecies) of birds distributed in the Qingtongxia wetland. Different birds have different ecological habits and diversified habitat preferences. Therefore, it is necessary to conduct land use classification based on birds’ habitat needs. Based on existing research, the feeding behavior and preferred habitat of national first-class key protected birds (which have appeared in the Qingtongxia Wetland) were counted (Table 2). Based on Landsat images from 1999 to 2020, land use in the study area was divided into six categories: water, reed wetland, beach, farmland, forest and grassland, considering the actual land use inside the wetland and birds’ demands for habitat. ENVI5.3 was used for image preprocessing, the Radiometric Correction module and FLAASH module were used for radiation calibration and atmospheric correction and the normalized vegetation index, normalized water index and artificial visual interpretation were used for image interpretation [24]. Ground observations were used to evaluate the accuracy of the classification results, and the classification accuracy was more than 90%, which met the accuracy requirements of this study.

2.3.2. Analysis of Spatial Patterns and Temporal Evolution in Land Use

The land use transfer matrix reflects the structure and characteristics of the land use map of the two phases of the Qingtongxia wetland and the change direction of each land use type [21]. To reflect the changes in the internal waters of Qingtongxia, this paper proposes a multiangle method to display the cumulative effect of the spatial and temporal distribution of the waters. The images of 1999, 2005, 2011, 2017 and 2020 were selected, and the attribute values of grid images of the Qingtongxia wetland were determined according to the presence or absence of water in the images. For example, 10000 indicates that this grid is water area only in 2020. The other years were nonwater areas, reflecting the temporal and spatial evolution characteristics of the internal water area of wetlands.

2.3.3. Selection and Calculation of Landscape Index

Landscape features influence the movement patterns and distribution of organisms [44]. Habitat fragmentation is a manifestation of landscape characteristics such as patch size, distribution and connectivity. It changes the physical and functional interactions within the ecosystem, is a major threat to biodiversity, reduces habitat availability and connectivity and is not conducive to species migration. In particular, when fragmented patches are small and isolated, they are prone to great damage to key ecosystem functions [45,46,47,48]. Therefore, studying the landscape characteristics of the Qingtongxia wetland is of great significance for protecting the bird habitat and maintaining bird diversity. The landscape index is an index reflecting highly concentrated landscape pattern information, which can represent the characteristics of landscape structure composition and spatial configuration [49]. Fragstats 4.2 is software specifically designed for the landscape pattern analysis of raster data, and is capable of calculating landscape indices at three levels: patch, class and landscape. Among the many landscape indices, patch density (PD) can characterize landscape fragmentation, landscape shape index (LSI) can characterize patch shape, largest patch index (LPI) can characterize patch size, Shannon’s evenness index (SHEI) can characterize patch distribution and patch cohesion index (COHESION) and contagion (CONTAG) are capable of characterizing landscape connectivity [45,46,47,48]. Therefore, the four landscape indices PD, LSI, LPI and COHESION were selected at the class level, and, in addition to PD, LSI, LPI and cohesion, CONTAG and SHEI were also selected at the landscape level to quantitatively evaluate the trend of landscape pattern evolution in the study area.

3. Results and Discussion

3.1. Temporal and Spatial Changes in the Qingtongxia Wetland

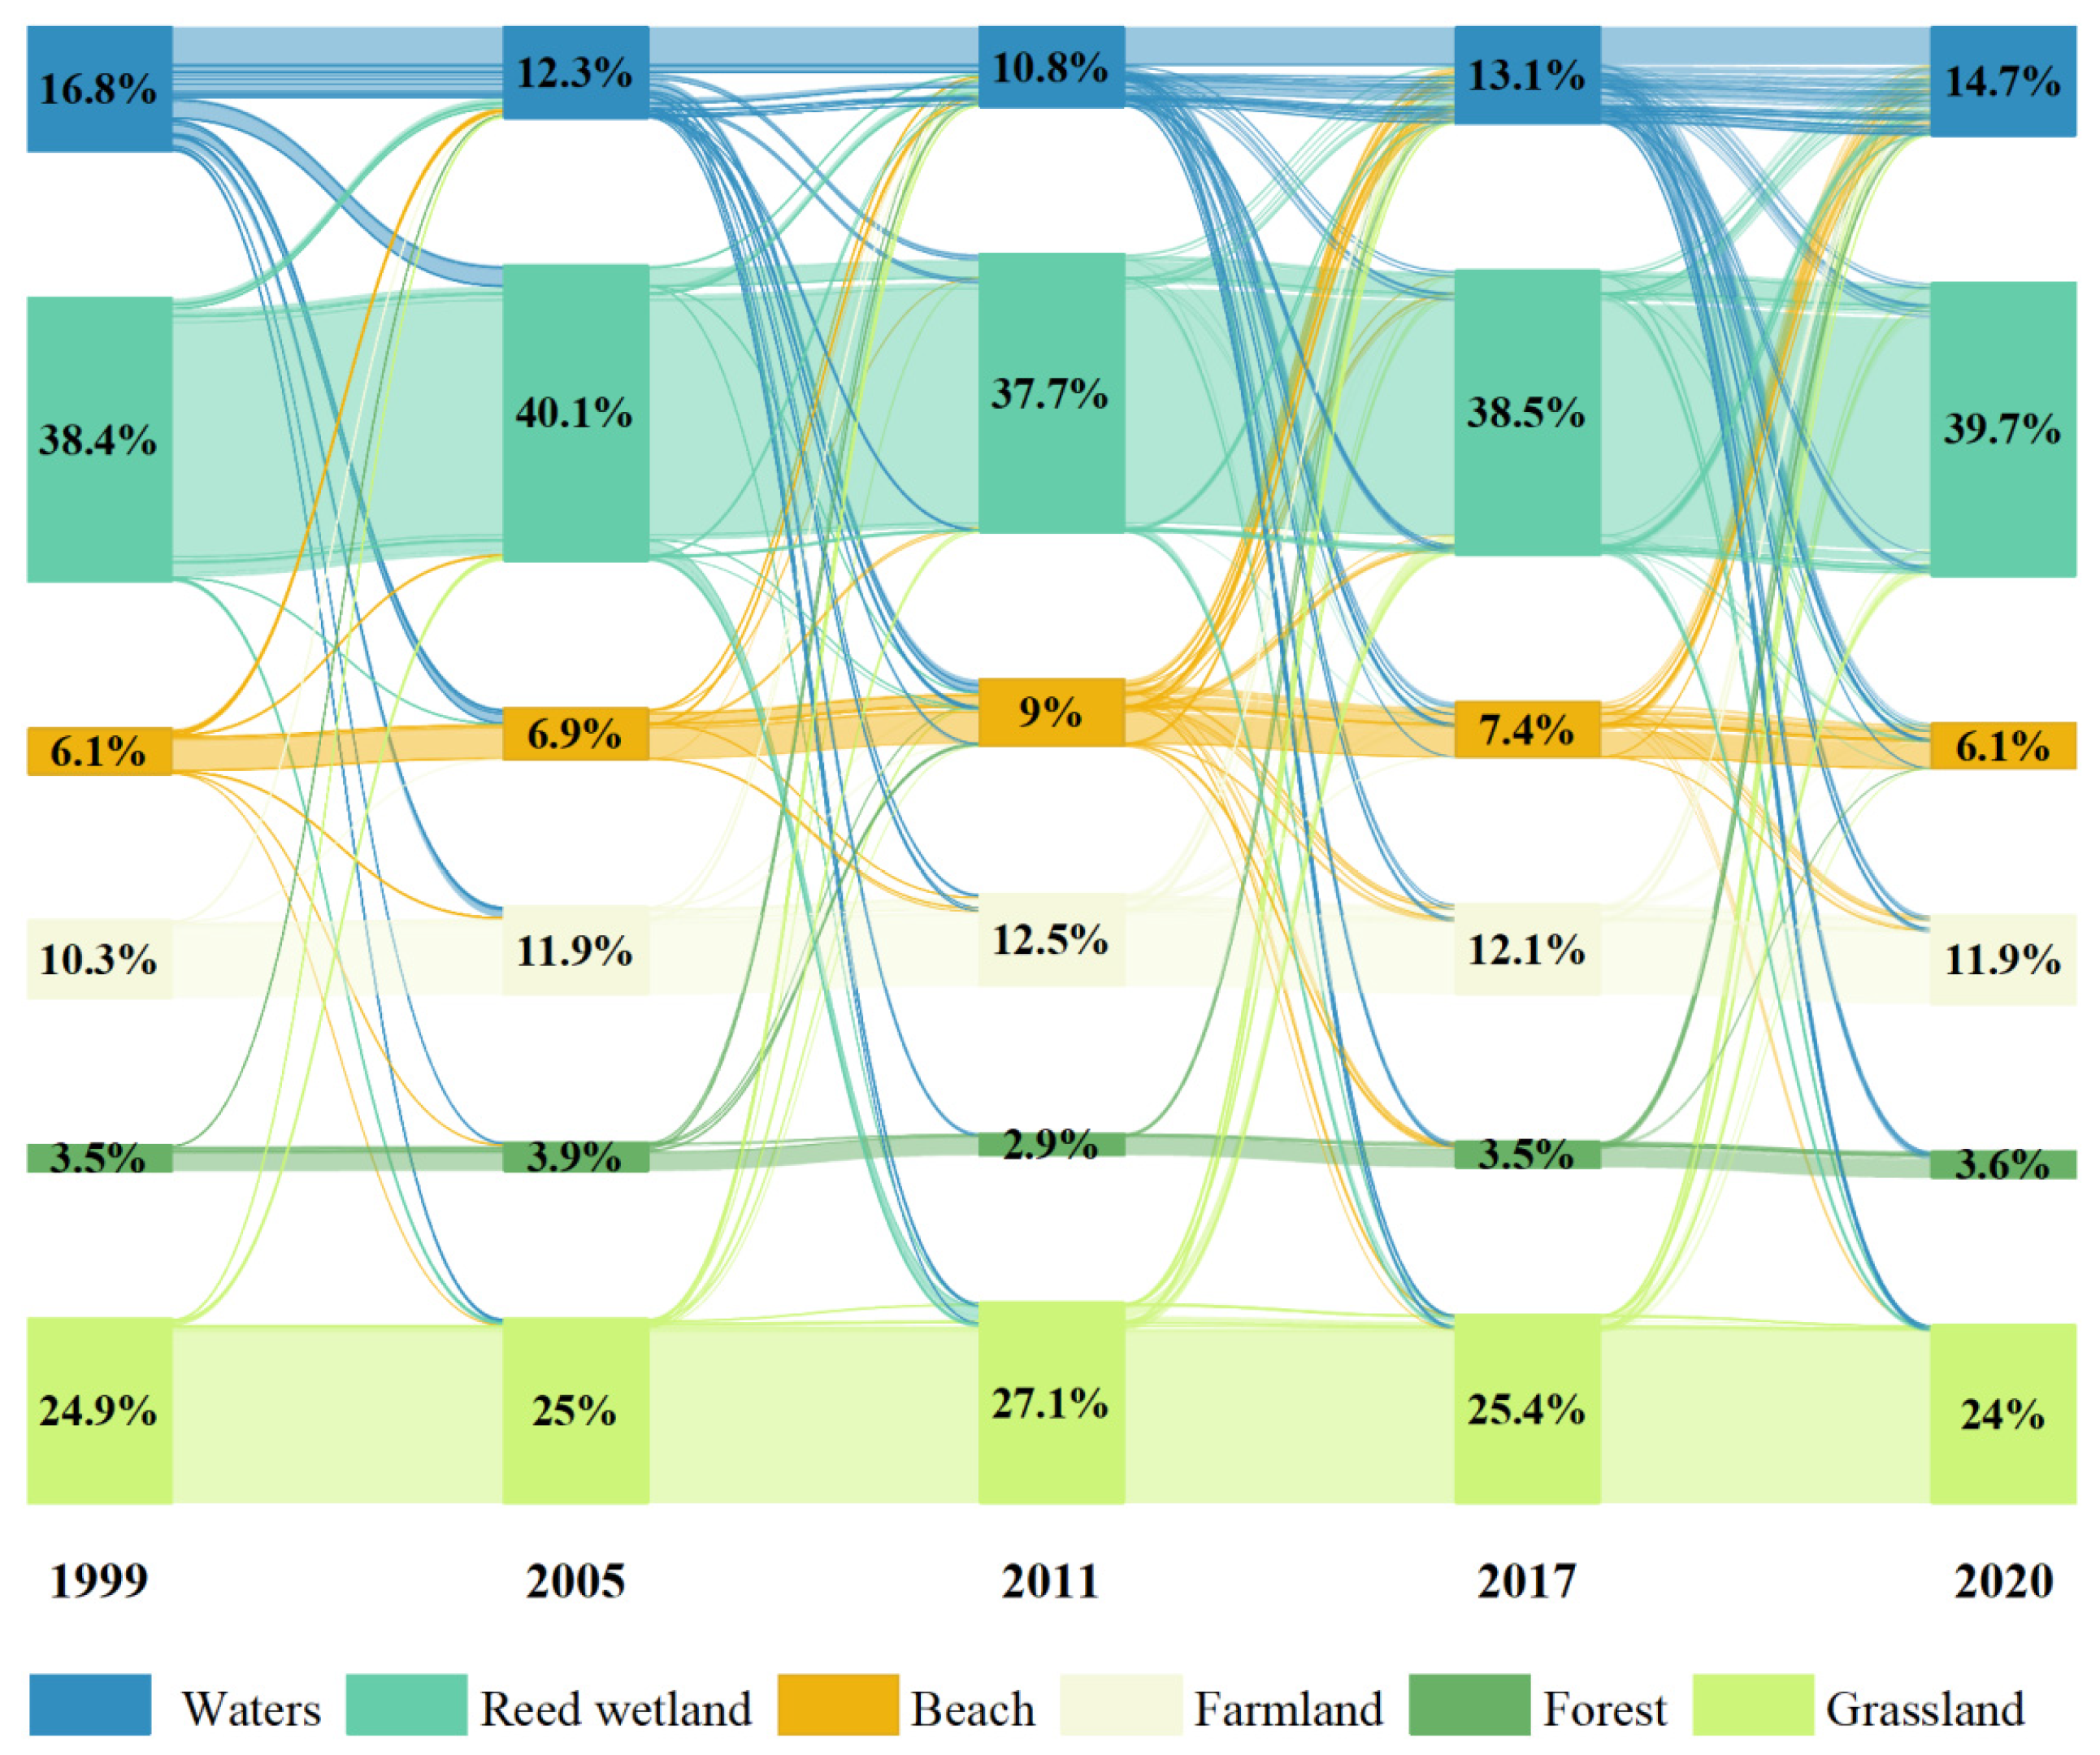
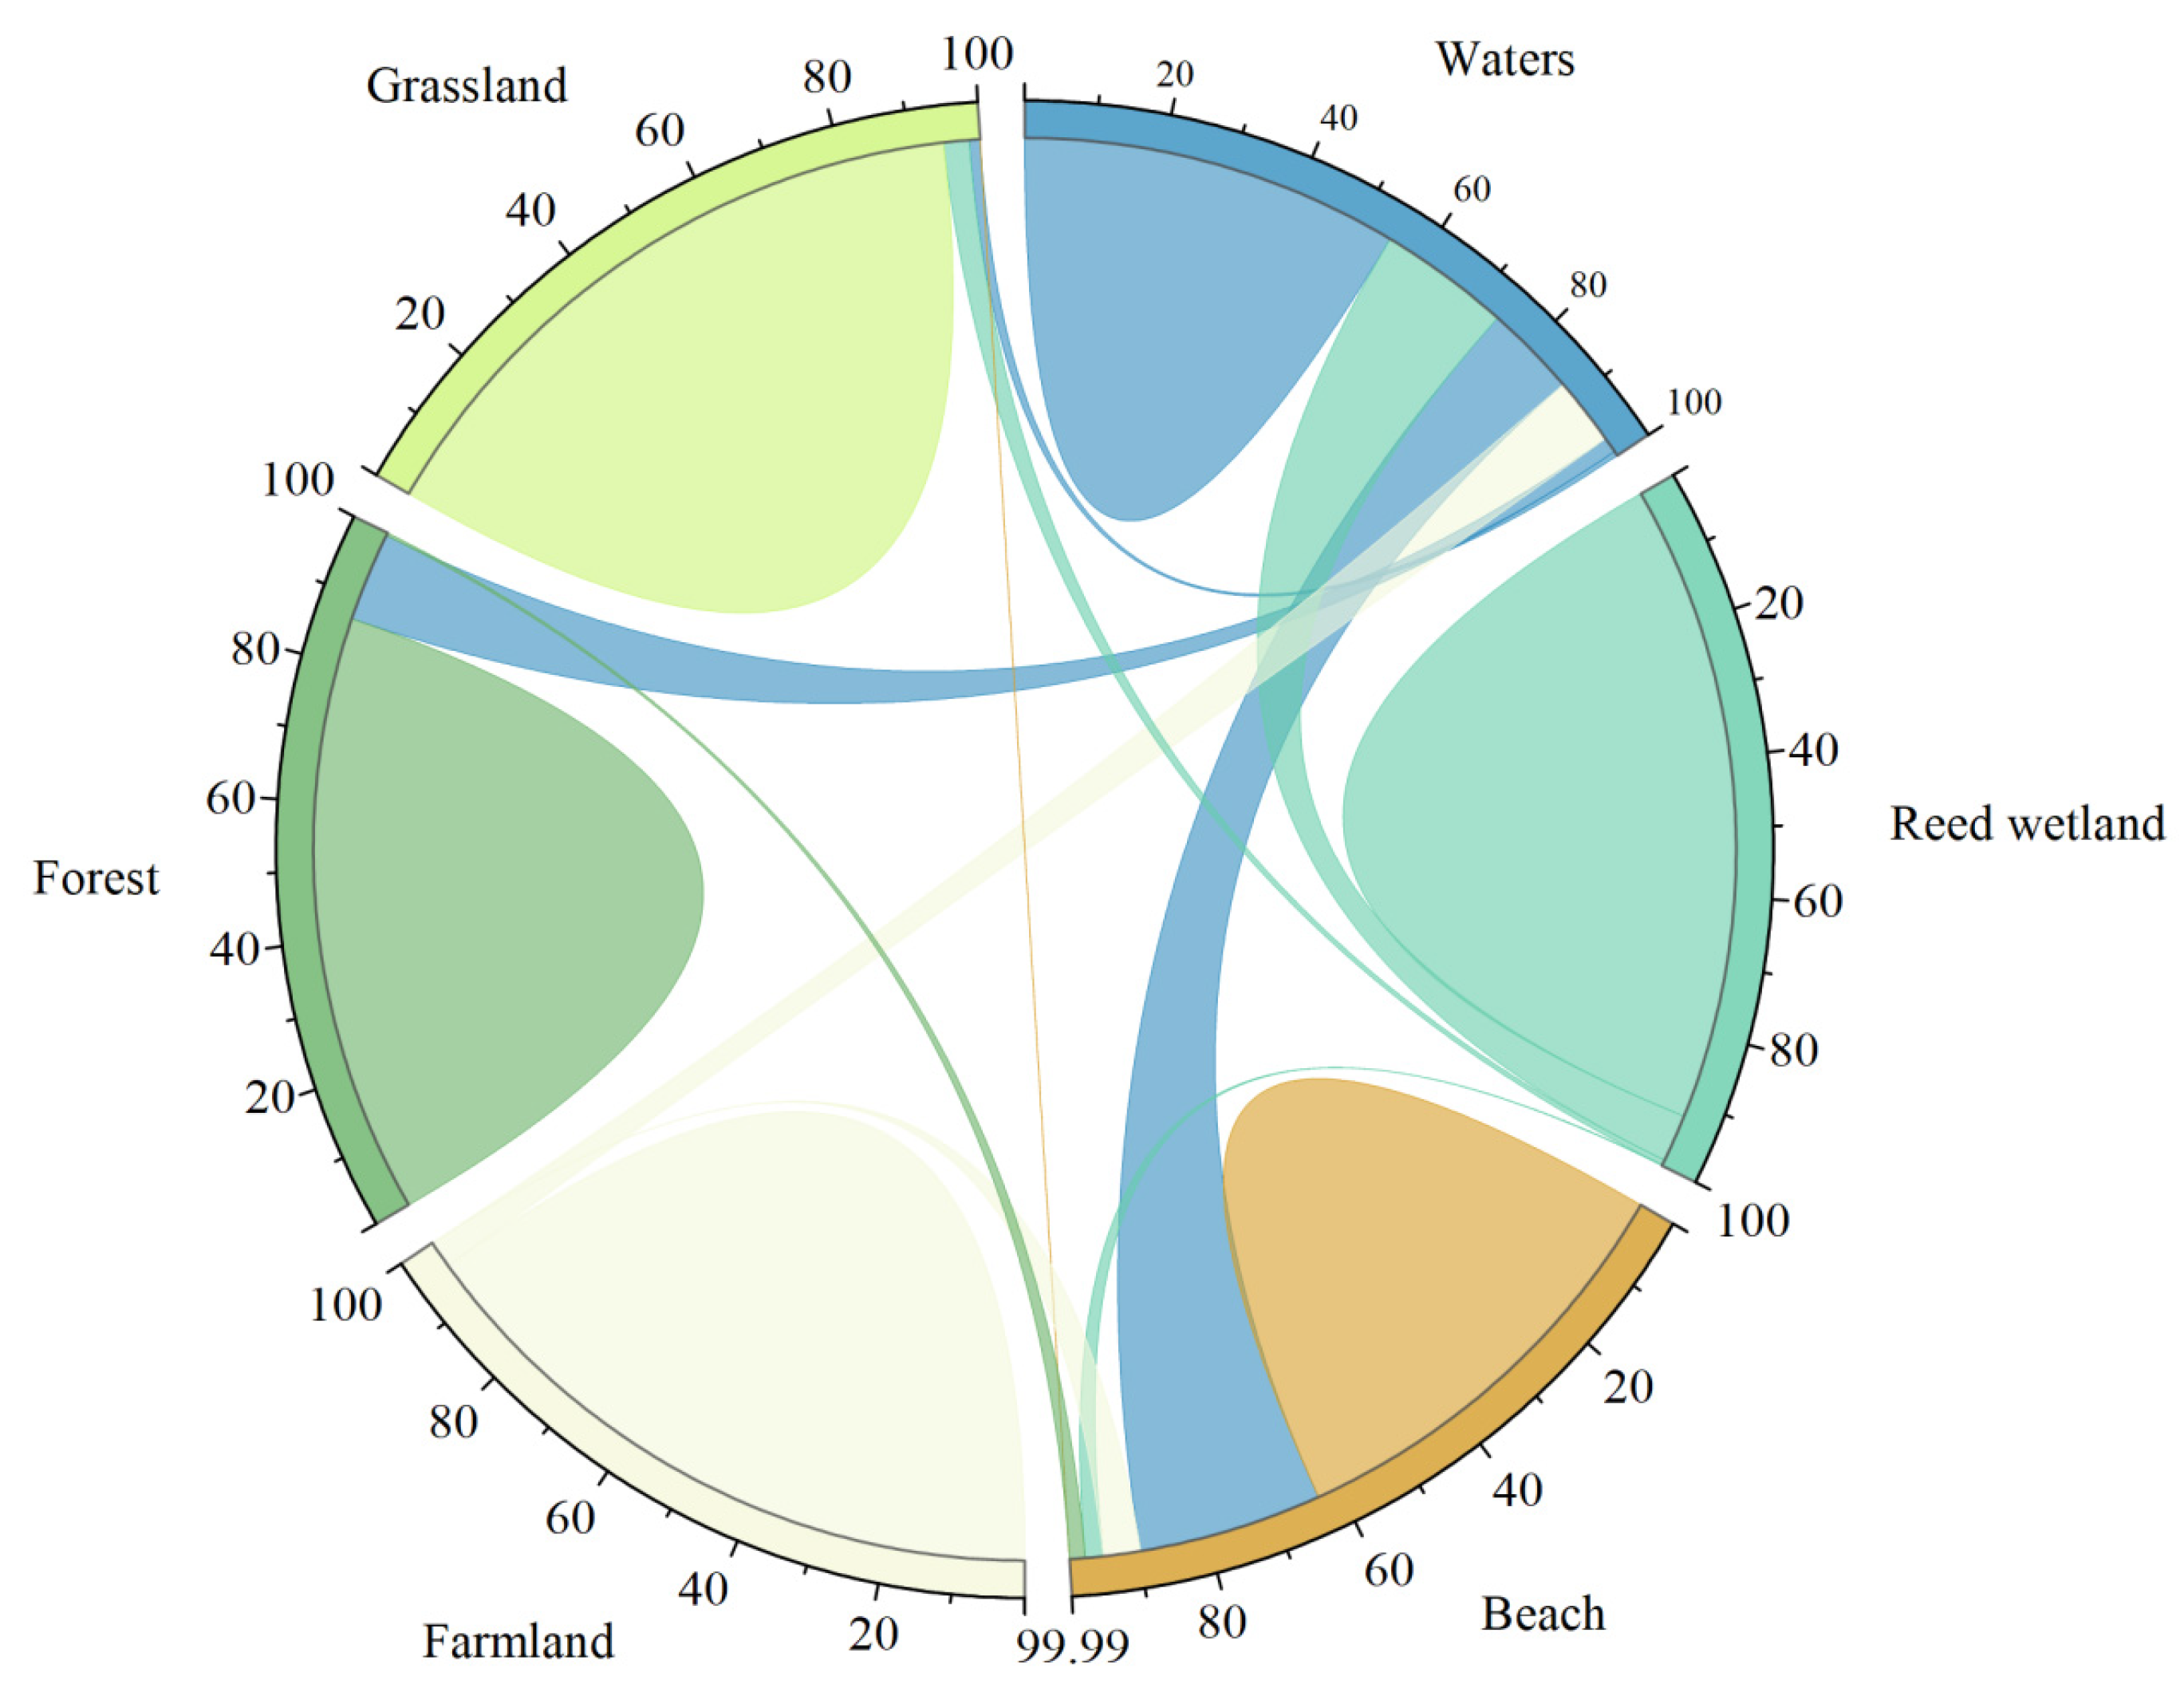
3.1.1. Area Variation and Conversion Relationship of Wetland Internal Composition

The years 1999, 2005, 2011, 2017 and 2020 were selected to explore the changing trend of the internal composition of the Qingtongxia wetland during 1999–2020. The results are shown in Figure 2 and Figure 3. (1) Spatially, the reed wetland is concentrated in the west of the study area—the west bank of the river—the grassland is concentrated in the mountains on the east bank of the river, the farmland is distributed in the southern area of the east bank of the river, the beach land is mainly distributed in the south of the study area, surrounded by the river to form the center of the river, and the forest is concentrated in the northernmost bank of the river in the study area. (2) Except for the water area, which is slightly lower than farmland in 2011, the land use area in other years is reed wetland, grassland, water area, farmland, beach and forest in descending order. (3) From 1999–2020, there were three trends of different land uses: the change in water area showed a decreasing–increasing trend, with a maximum area of 44.8 km2, distributed in 1999, and the area has increased since 2011, which is a relatively significant change in land use type; reed wetland and forest showed an increasing–decreasing–increasing trend, and the area decreased from 2005 to 2011; beach, farmland and grassland showed an increasing–decreasing trend, decreasing since 2011. (4) The maximum areas of water, reed wetland, beach, farmland, forest and grassland were 44.8 km2, 107.1 km2, 24.2 km2, 33.3 km2, 10.3 km2 and 72.2 km2, respectively, which appeared in 1999, 2005, 2011, 2011, 2005 and 2011. (5) The land use transfer effect of water areas and beach land in different time periods is significant, and the conversion relationship with the other five types of land use is involved.
Compared with 1999, the areas of water and grassland decreased, and the areas of reed wetland, beach, farmland and forest increased in 2020. Combined with the proportional chord diagram of different wetland types in Figure 4, the width of the connecting line represents the conversion ratio between the two types of land use data, the two ends of the connecting line represent the transmission direction and different colors represent different types of land use. Combined with the statistical results of Table 3, the significant changes in the original wetland types during the 21-year period were water, beach, forest, reed wetland, grassland and farmland. Between 1999 and 2020, only 54.81% of the spatial distribution of waters remained unchanged, 19.08% were transformed into reed wetlands, 13.32% were transformed into beaches and the rest were transformed into farmland, forests and grasslands. The spatial distribution of beaches remained unchanged in 63.13%, and 26.6% were transformed into water. The spatial distribution of forests remained unchanged in 86.72%, and 12.88% were converted to water. The spatial distribution of reed wetlands, grasslands and farmland all remained the same for over 90%. The transfer of watersheds into and out of watersheds drives the change in land use types within the wetlands.

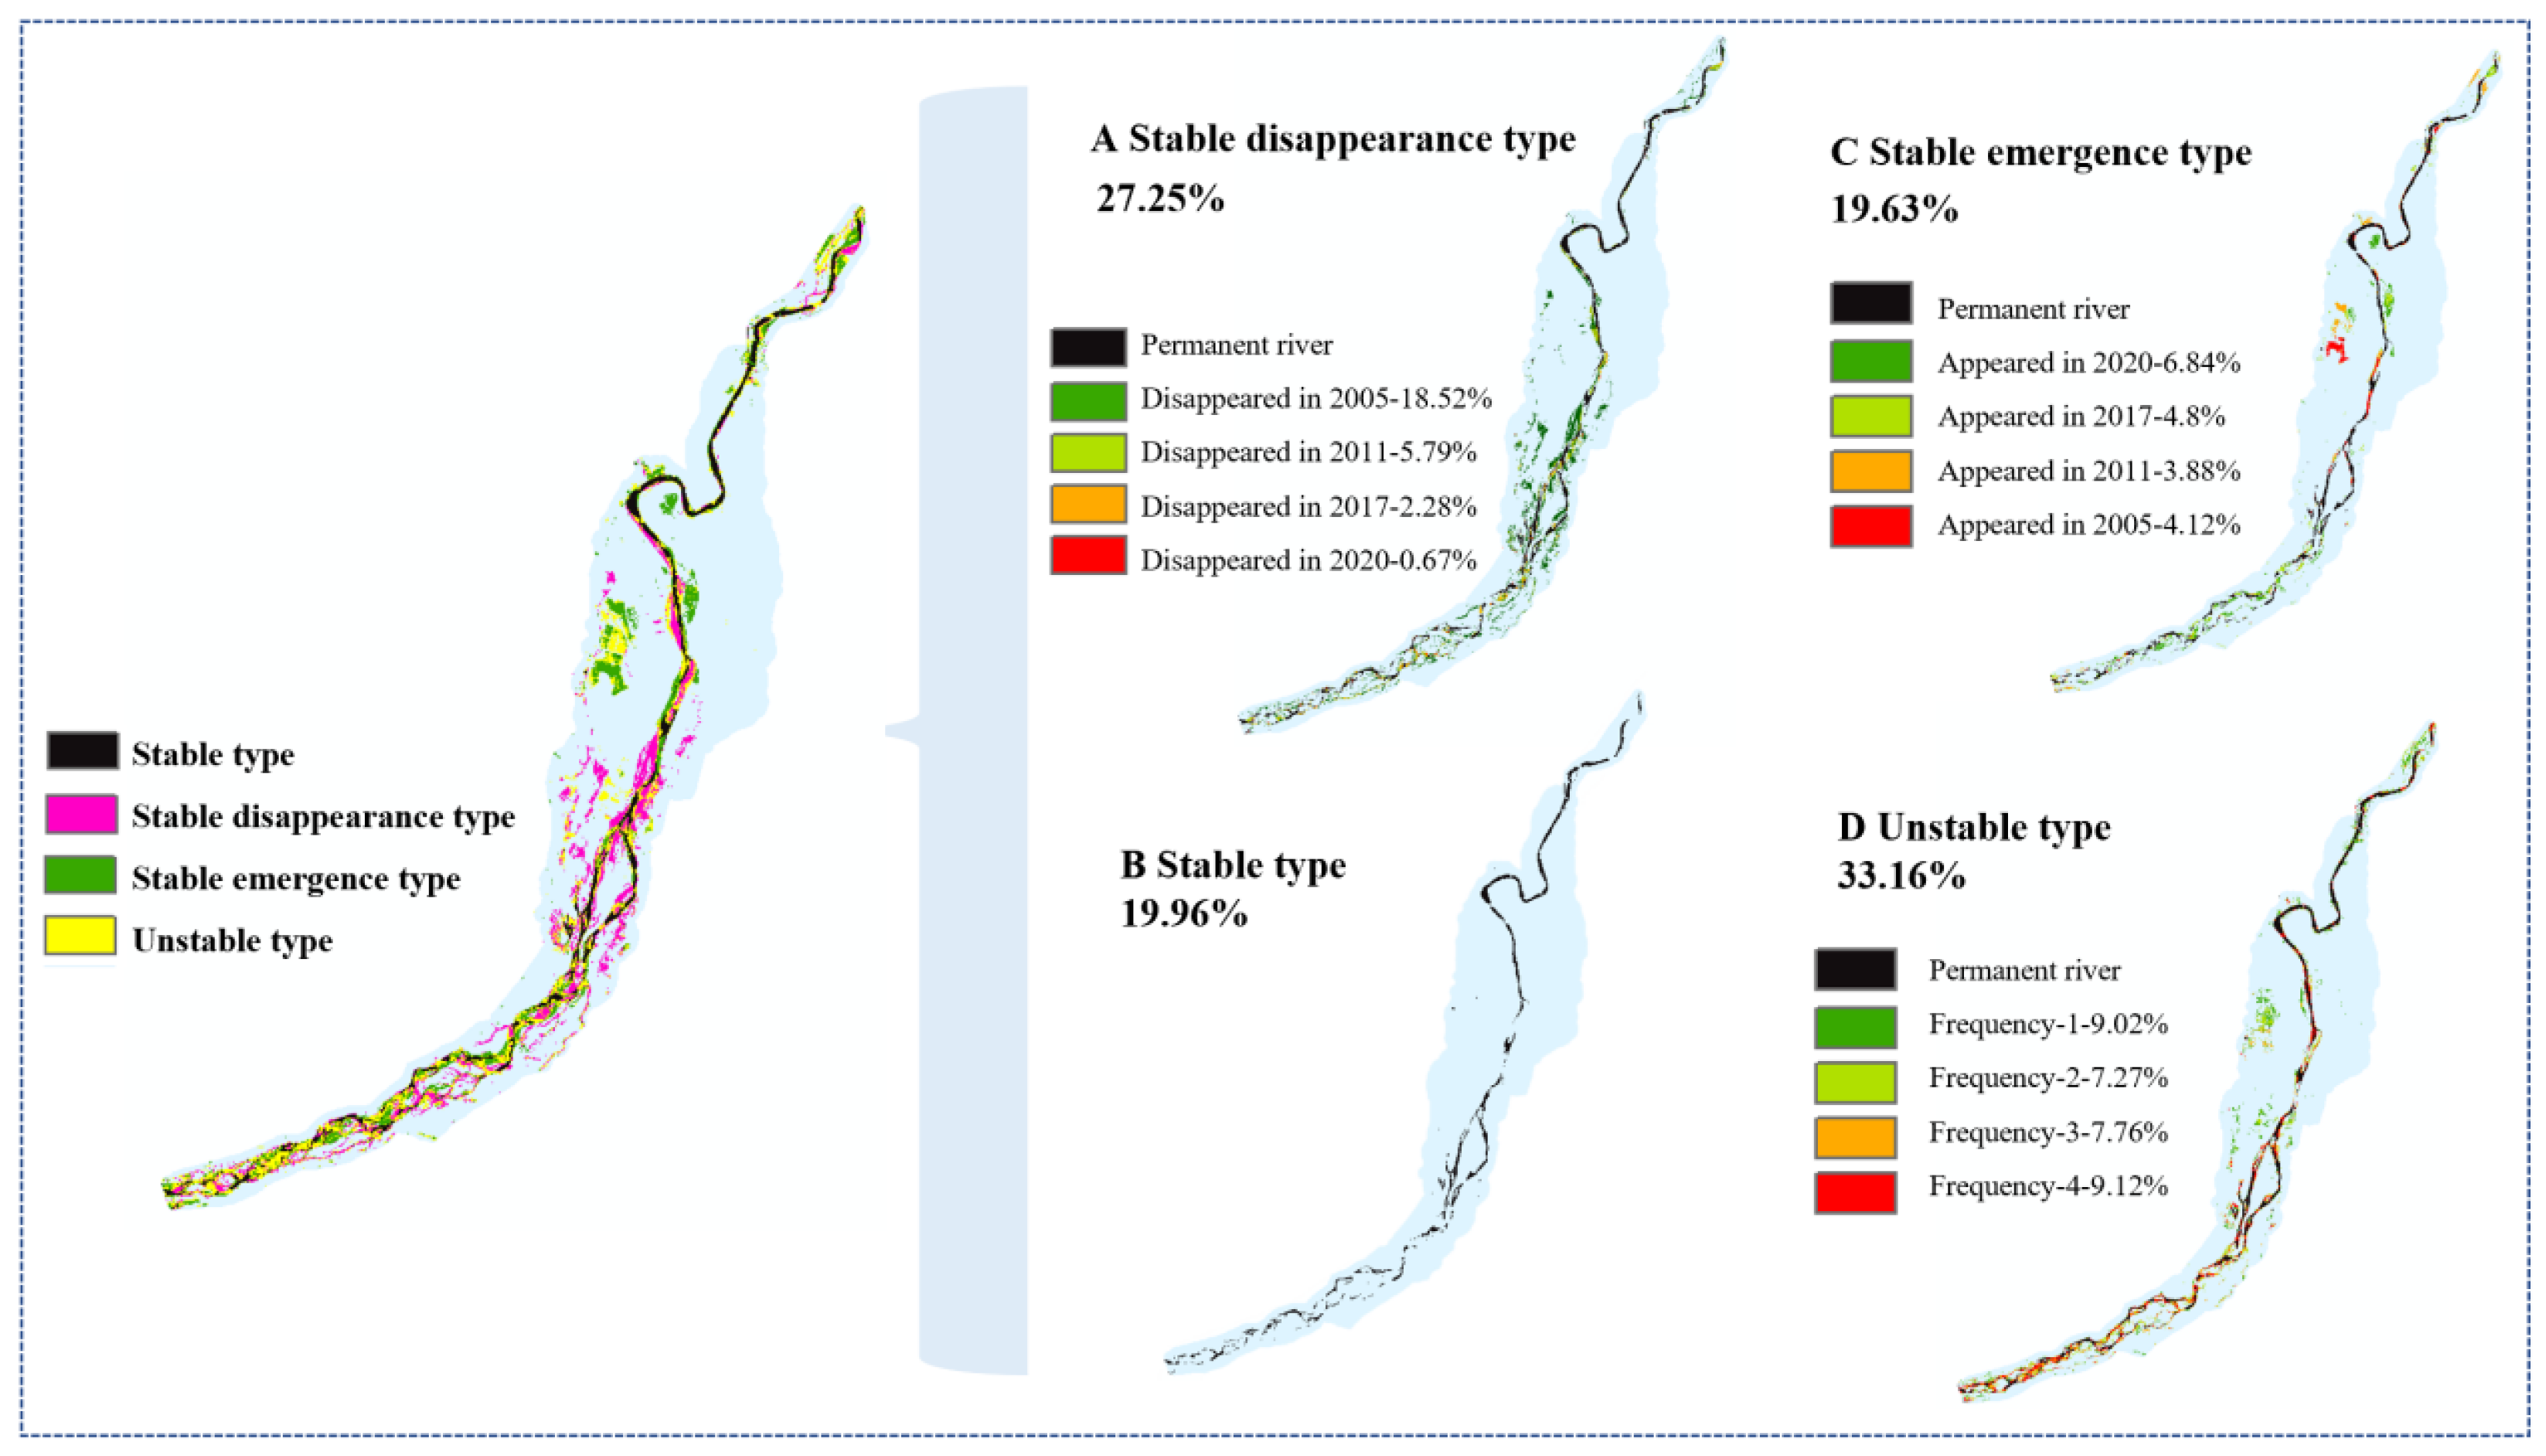
3.1.2. Change Pattern of Water Area in Wetlands

Since the formation of the wetland, the relevant departments have comprehensively considered the natural conditions, such as topography and soil, in the wetland and adjusted them to determine the spatial distribution of different land uses; subsequently, the changes in land use space within the wetland are mainly due to the subsidence or emergence of other land uses due to the change in water area, so it is of great significance to explore the change in water for the study of the internal change in the whole wetland. As shown in Figure 5, from the frequency of water areas in different spaces in the five years of 1999, 2005, 2011, 2017 and 2020, although the water areas that appeared in the five years were concentrated on the main roads of the rivers, they were not completely connected, and there were many disconnected connections, indicating that there was a phenomenon of river interruptions in these five years. The frequency of water areas that occur in the reed wetland for 4, 3 and 2 years is relatively concentrated, and the distribution of 1 year is relatively scattered. In terms of area, the area of water area in 5 consecutive years is approximately 13.48 km2, the water area in 4 years is 9.4 km2, the water area in 3 years is 9.4 km2, the water area in 2 years is 12.05 km2 and the water area in only 1 year is 23.23 km2.
The method proposed in this paper to calculate the cumulative distribution of water at the spatial and temporal scales not only shows the cumulative time of the corresponding grid water, but also shows the specific time of the existence of the water. Time and space information were closely combined to provide a large amount of data information. Based on the appearance, disappearance and stability of water areas, this study divided water areas into four types: stable type, stable emergence type, stable disappearance type and unstable type, of which the stable type is 11111, which belongs to the permanent river in this time period. The stable occurrence type includes 10000, 11000, 11100 and 11110, which indicate the waters that appeared in 2020, the waters that appeared in 2017, the waters that appeared in 2011 and the waters that appeared in 2005, respectively. The stable disappearance type includes 00001, 00011, 00111 and 01111, which indicate the waters that disappeared in 2005, the waters that disappeared in 2011, the waters that disappeared in 2017 and the waters that disappeared in 2020. The unstable type contains the remaining part, which is divided into four categories according to the frequency of occurrence: frequency 1, frequency 2, frequency 3 and frequency 4. The stable emergence type was concentrated in the interior of the reed wetland, the stable disappearance type was mainly concentrated in the periphery of the stable type (permanent river) and the unstable type was concentrated upstream of the river. Among them, only 00001 of the stable disappearance type and 11111 of the stable disappearance type have a spatial distribution area of more than 10: 12.51 km2 and 13.48 km2, respectively; that is, 12.51 km2 was the unique water distribution area in 1999. This water area is mainly distributed in reed wetlands. This may be related to the sharp decrease in the original irrigation area caused by the project of returning farmland to forest.
As shown in Figure 6, the stable disappearing type occupies 27.25% of all water areas, and shows a decreasing trend year by year. Water bodies disappearing in 2005 and 2011 are concentrated in reed wetlands, whereas water areas disappearing in 2017 and 2020 are scattered throughout the whole area. The waters of the stable emerging type occupy 19.63% of all of the waters, of which the waters of 2005 and 2011 are concentrated in the upper reaches of rivers, accounting for 4.12% and 3.88%, respectively. The waters of 2017 and 2020 are concentrated in reed wetlands, which is different from the stable disappearing type. The water area appearing in the reed wetland is distributed in the interior and concentrated, and exists in blocky form. The water area disappearing into reed wetlands is distributed at the edge, showing a long strip shape. The stable water area occupies 19.96% of the total water area and belongs to the permanent river. However, the river is not completely connected and there may be cut-off phenomena. The unstable water area occupied 33.16%, the water areas with frequencies of 3 and 4 were concentrated in the river area and the water areas with frequencies of 1 and 2 were concentrated in the reed wetland. Overall, the water concentration area in different interannual periods is roughly distributed in the direction of southwest to northeast, and the wetland shrinks in the southwest direction.

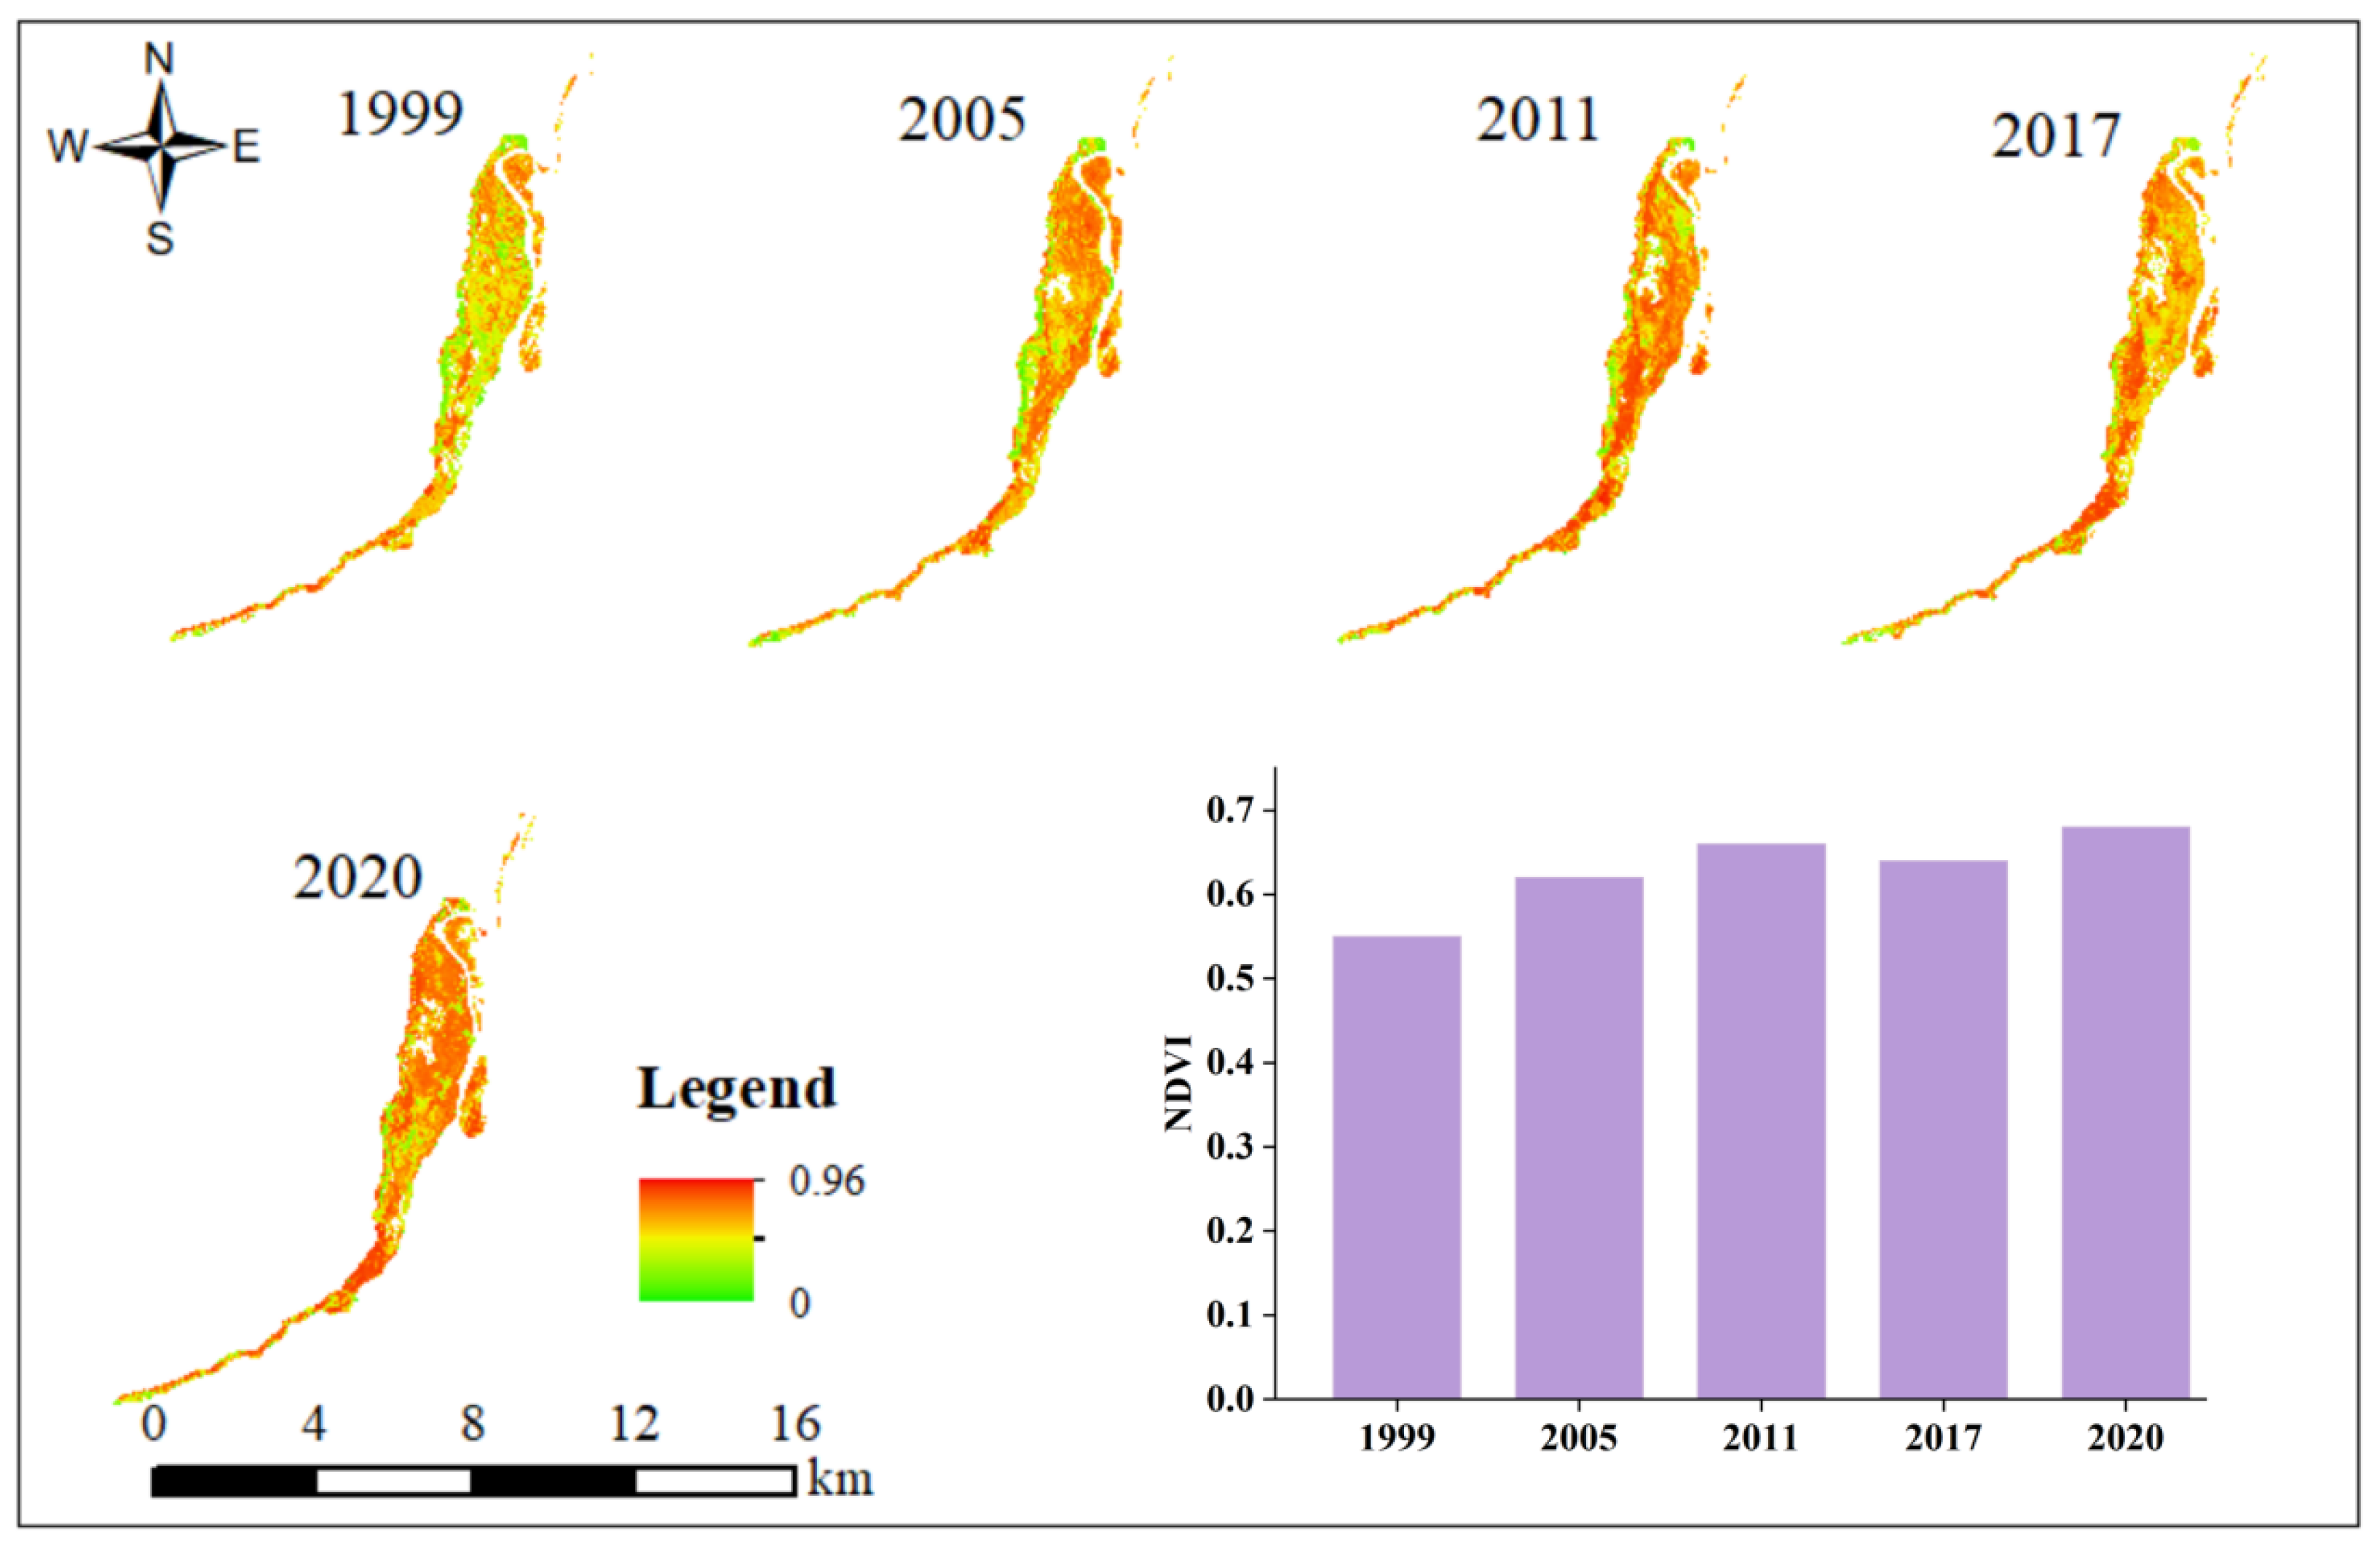
3.1.3. Analysis of Vegetation Growth in Reed Wetlands

The reed wetland has dense vegetation and a wide variety of vegetation; not only reed but also natural wet and aquatic vegetation such as Tamarix chinensis Lour and Acorus calamus L. Vegetation provides a secret place for birds, isolating human vision from foreign interference, and is an important habitat for birds. Therefore, the growth of vegetation in reed wetlands is very important for the habitat and survival of birds. To this end, this study counted the average NDVI in the region in 1999, 2005, 2011, 2017 and 2020 (Figure 7), and the results show that, except for a slight decrease in NDVI in 2017, NDVI increased in 1999–2020. In 1999, the distribution of NDVI in reed wetlands was uneven, especially in the central and northern regions, where the NDVI value was relatively small, indicating the state of vegetation growth in general. In 2005, 2011 and 2020, the proportion of high NDVI values increased in the central and northern regions, indicating that the vegetation growth state continued to improve. The NDVI value decreased slightly in 2017 compared to 2011, and the weakening of vegetation growth may be closely related to the temperature and precipitation in that month. Overall, changes in NDVI in recent years are favorable for bird habitats.

3.1.4. Analysis of Habitat Evolution of Rare Birds

Combined with the results of literature research and field visits, it is shown that the reed wetland is a more preferred habitat environment for rare birds, which has the advantages of environmental concealment, not easily being disturbed by humans, abundant biological resources for inhabiting birds to peck, a close proximity to water sources and convenient access to aquatic food resources. Therefore, a larger habitat area, smaller fragmentation and better vegetation growth are more conducive to the habitat of rare birds. With the goal of the largest habitat area, the smallest fragmentation and the best vegetation growth, the evaluation criteria of reed wetlands as bird habitats were proposed. The maximum score was set on a 10-point scale, and the calculation method for each year based on different target habitat scores was the corresponding indicator value/optimal indicator value × 10 (the corresponding indicator value in the year is less than the optimal indicator value) or the optimal index value/the corresponding indicator value under the year × 10 (the corresponding indicator value in the year is greater than the optimal indicator value). The scores of each index were superimposed to obtain a comprehensive score considering the habitat area, fragmentation and vegetation growth. The details can be found in Equations (1)–(4), and the results are as follows (Table 4, Figure 8). The difference between the area score and vegetation growth score was not significant, but there was a significant difference in the fragmentation score between years, and the overall score was 2005, 2011, 2020, 1999 and 2017 in descending order. With the exception of 2005, fragmentation was the primary factor in the low overall score in other years. The overall score in 2005 was slightly below the perfect score, which was due to vegetation growth. In summary, fragmentation is a major factor affecting the habitat quality of rare birds.
Habitat   Area   Score = Reed   Wetland   Area 107.06 × 10
Fragmentation   Score = 0.17 PD × 10
Vegetation   Growth   Score = NDVI 0.68 × 10
Comprehensive   score   =   habitat   area   score +   fragmentation   score +   vegetation   growth   score
Rivers and beaches are also important habitats for waterbirds. The scores for rivers and beaches were calculated separately for different years using a similar scoring scheme to that used for reed wetlands, and the results show that the scores for river habitat were in descending order of 2011, 2005, 2020, 1999 and 2017 (Table 5). The scores for beach habitat were in descending order of 2011, 2017, 2005, 2020 and 1999 (Table 6). The ratings for combined river, beach and reed wetlands and from highest to lowest were 2005, 2011, 2017, 2020 and 1999. In summary, the quality of the waterbird habitat has declined since 2005.

3.2. Evolution Trend of the Landscape Pattern of the Qingtongxia Wetland

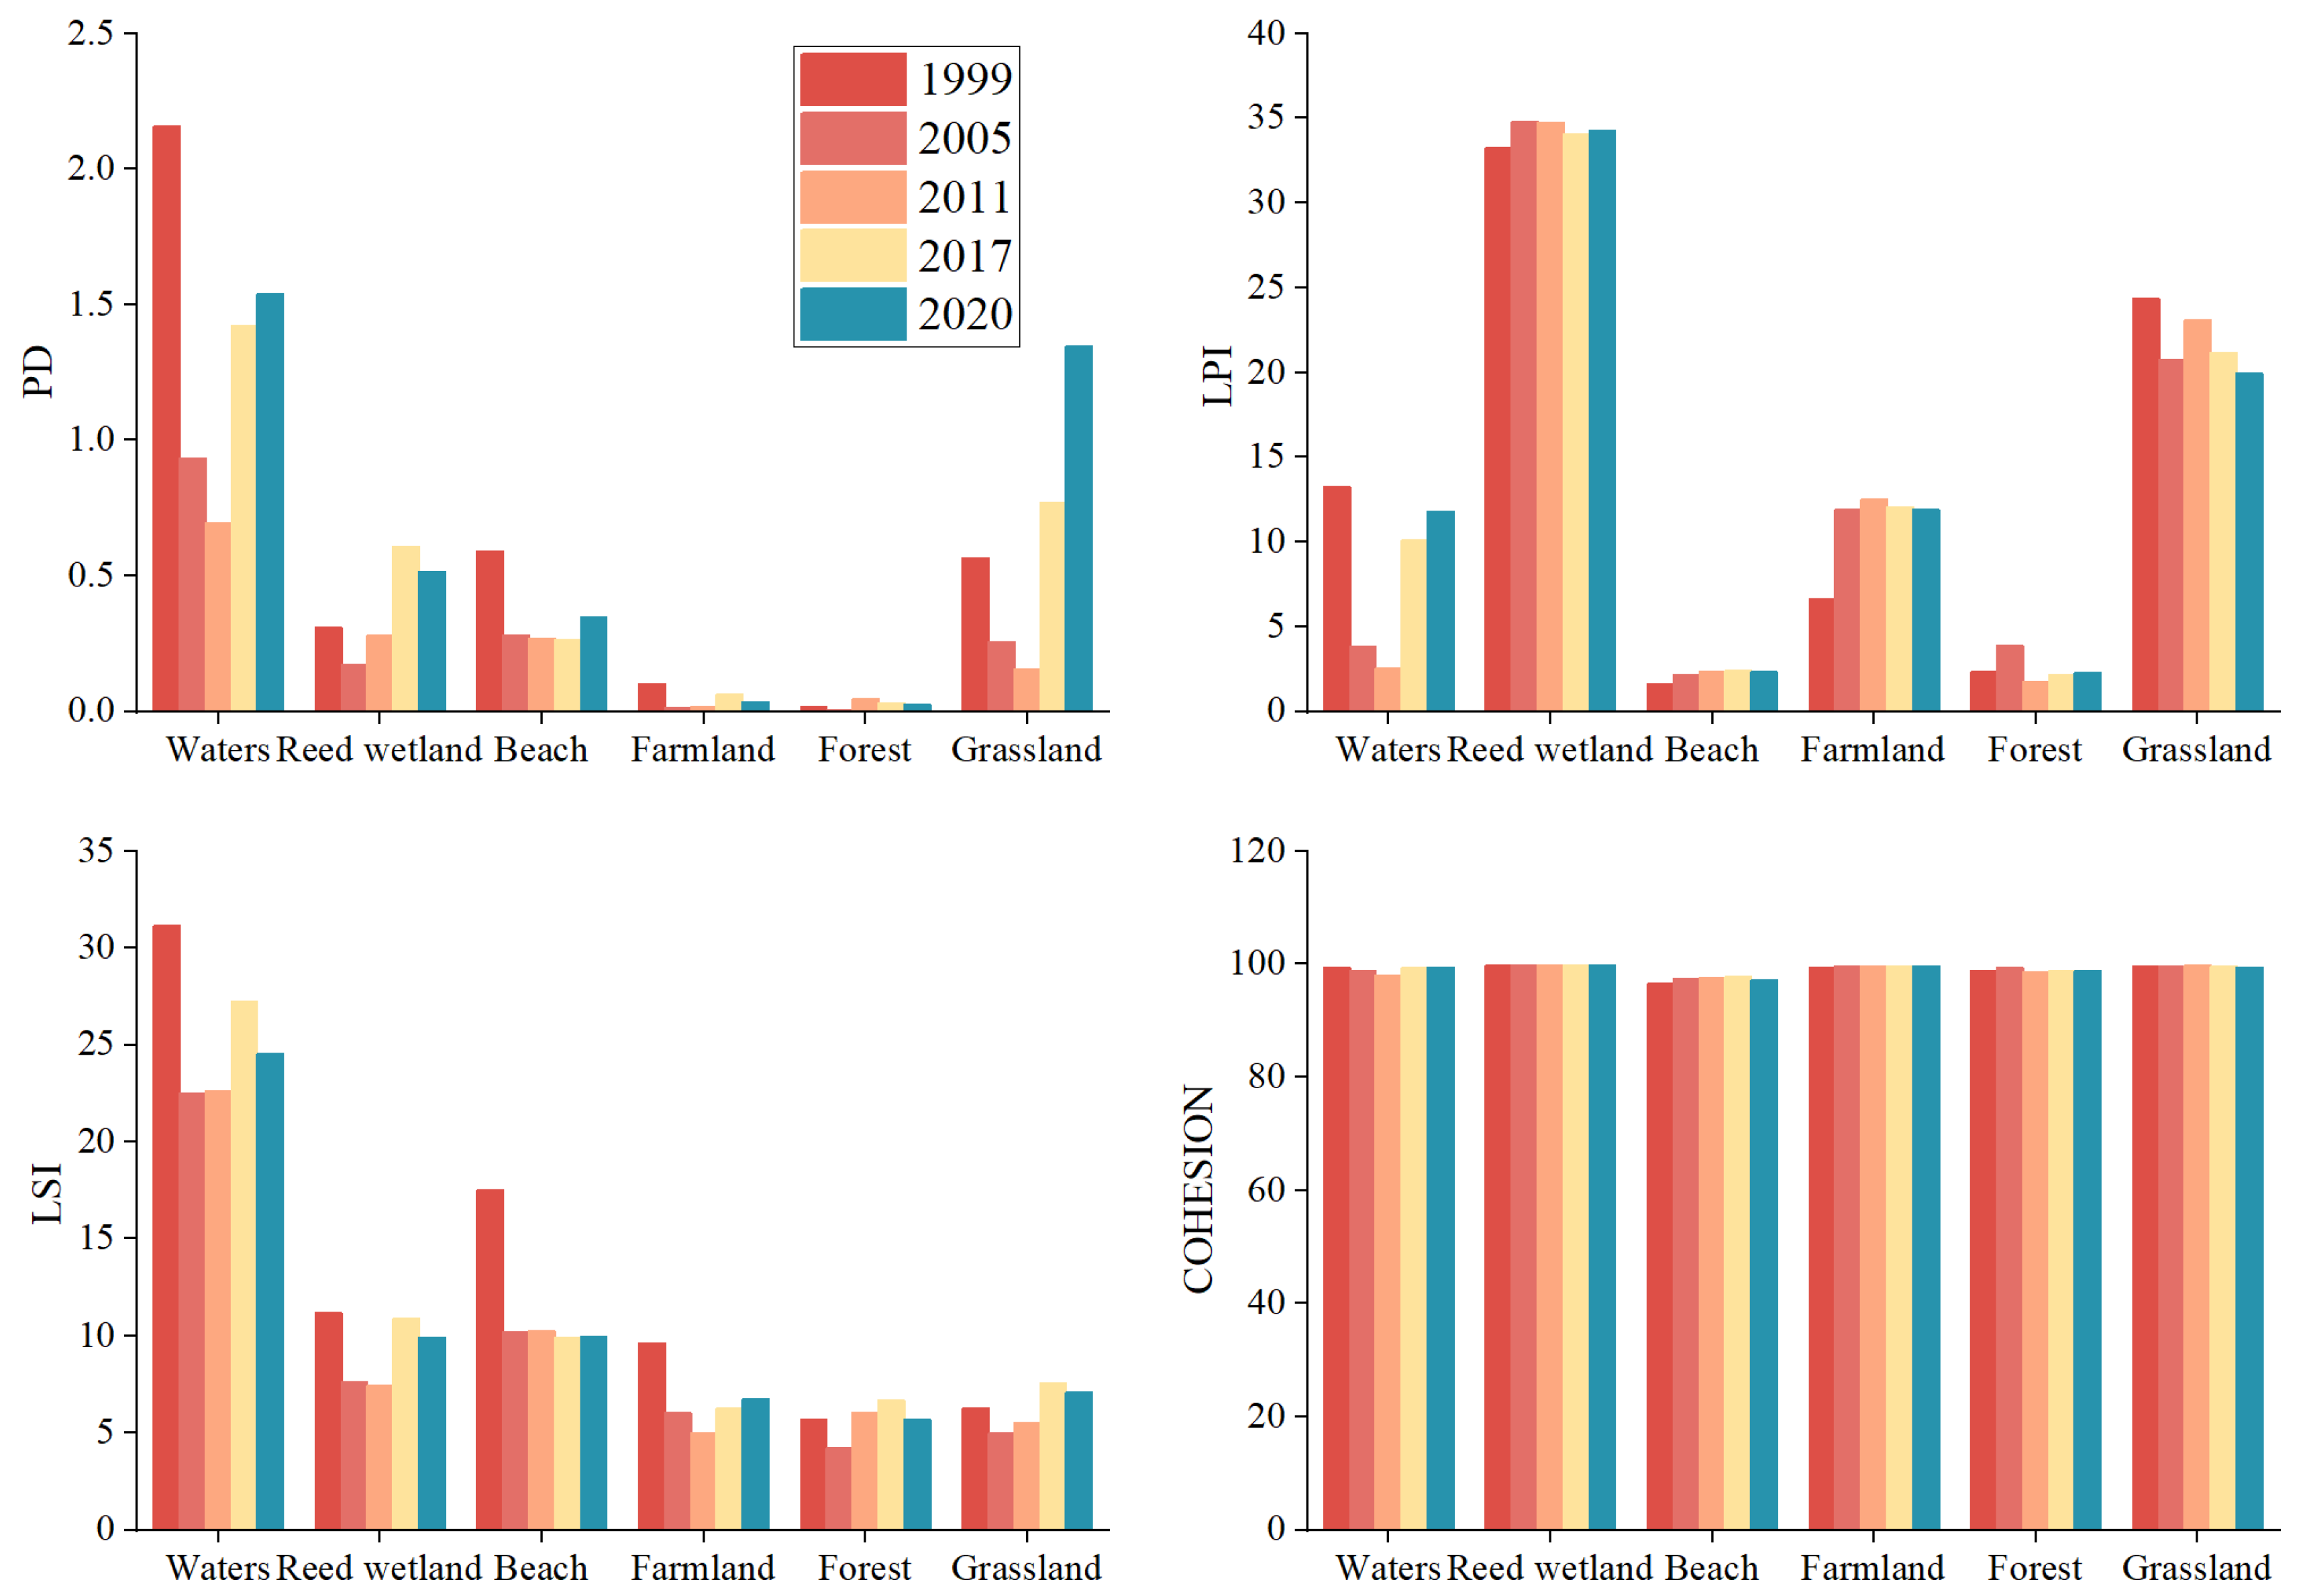
3.2.1. Evolution of Landscape Patterns of Different Wetland Types

As the basic unit used to describe the landscape pattern, the characteristics and spatial configuration of patches can reflect changes in the landscape pattern (Figure 9). PD is a characterization of the degree of patch fragmentation, and PD changes in water and grassland are significant between different years. The change in farmland and forest is the smallest, and reed wetlands and beach land are in between. Among them, the water area had the largest PD in 1999, and the area of the water area at that time was also the largest, which was manifested in the abundant water volume that caused different branches of water to appear. The area of water was the smallest in 2011, when the water area was the smallest, indicating that the value of PD can be used to characterize the relative area of the water. LPI describes the proportion of the largest patch area, which is the characterization of the dominant patch in the landscape/patch, and the largest LPI in reed wetland and grassland in different years, which is related to the larger area of reed wetland and grassland itself, the smallest LPI in beach land and forest, and the water area and farmland in between. LSI describes the complexity of patch shapes, with significant changes in water and beach areas between different years. The beaches are located in the center of the river, and the shape is most affected by the water, so the complexity is second only to the water, especially from 1999 to 2005, indicating that the flow has also changed significantly at this stage. The variations in forest and grassland were relatively stable between different years. COHESION measures natural connectivity within the same patch type, with little difference between different land use types and weak interannual differences between the same land use types. In summary, (1) water areas and grasslands are the most fragmented areas; (2) the LPIs of different patch types are closely related to their own area; and (3) although the connectivity of various land use types in the study area was different, the difference was not significant.

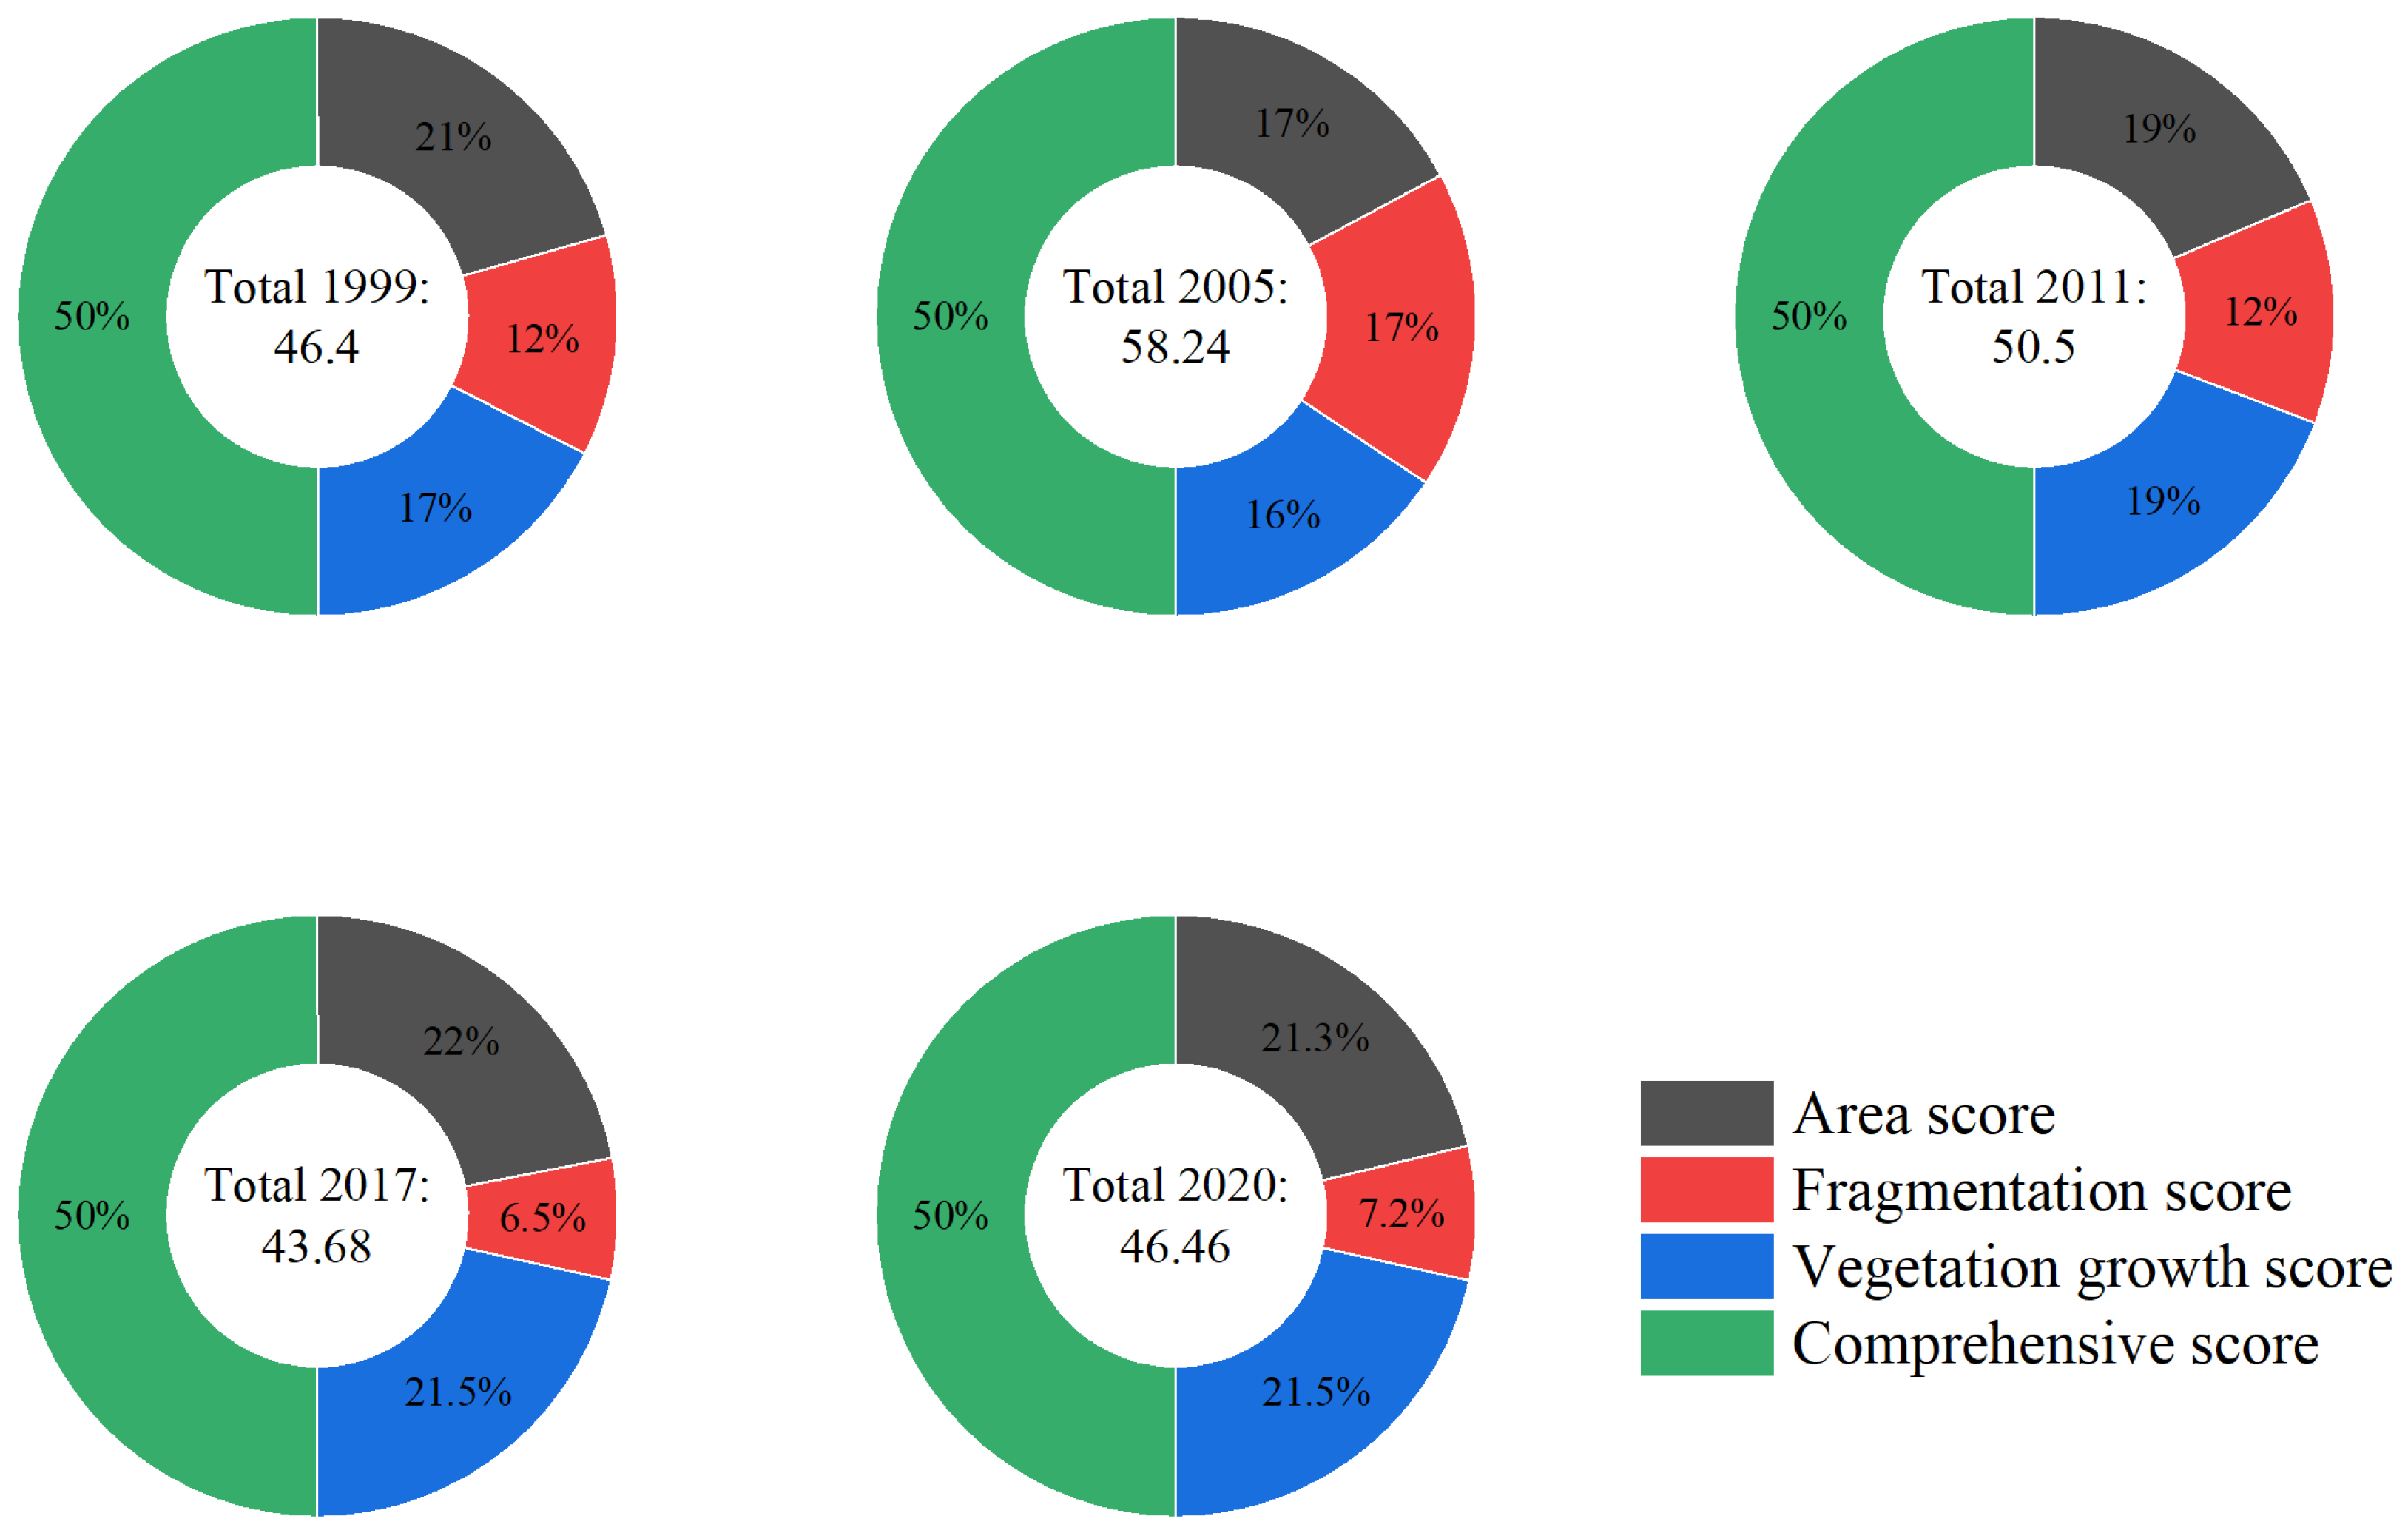
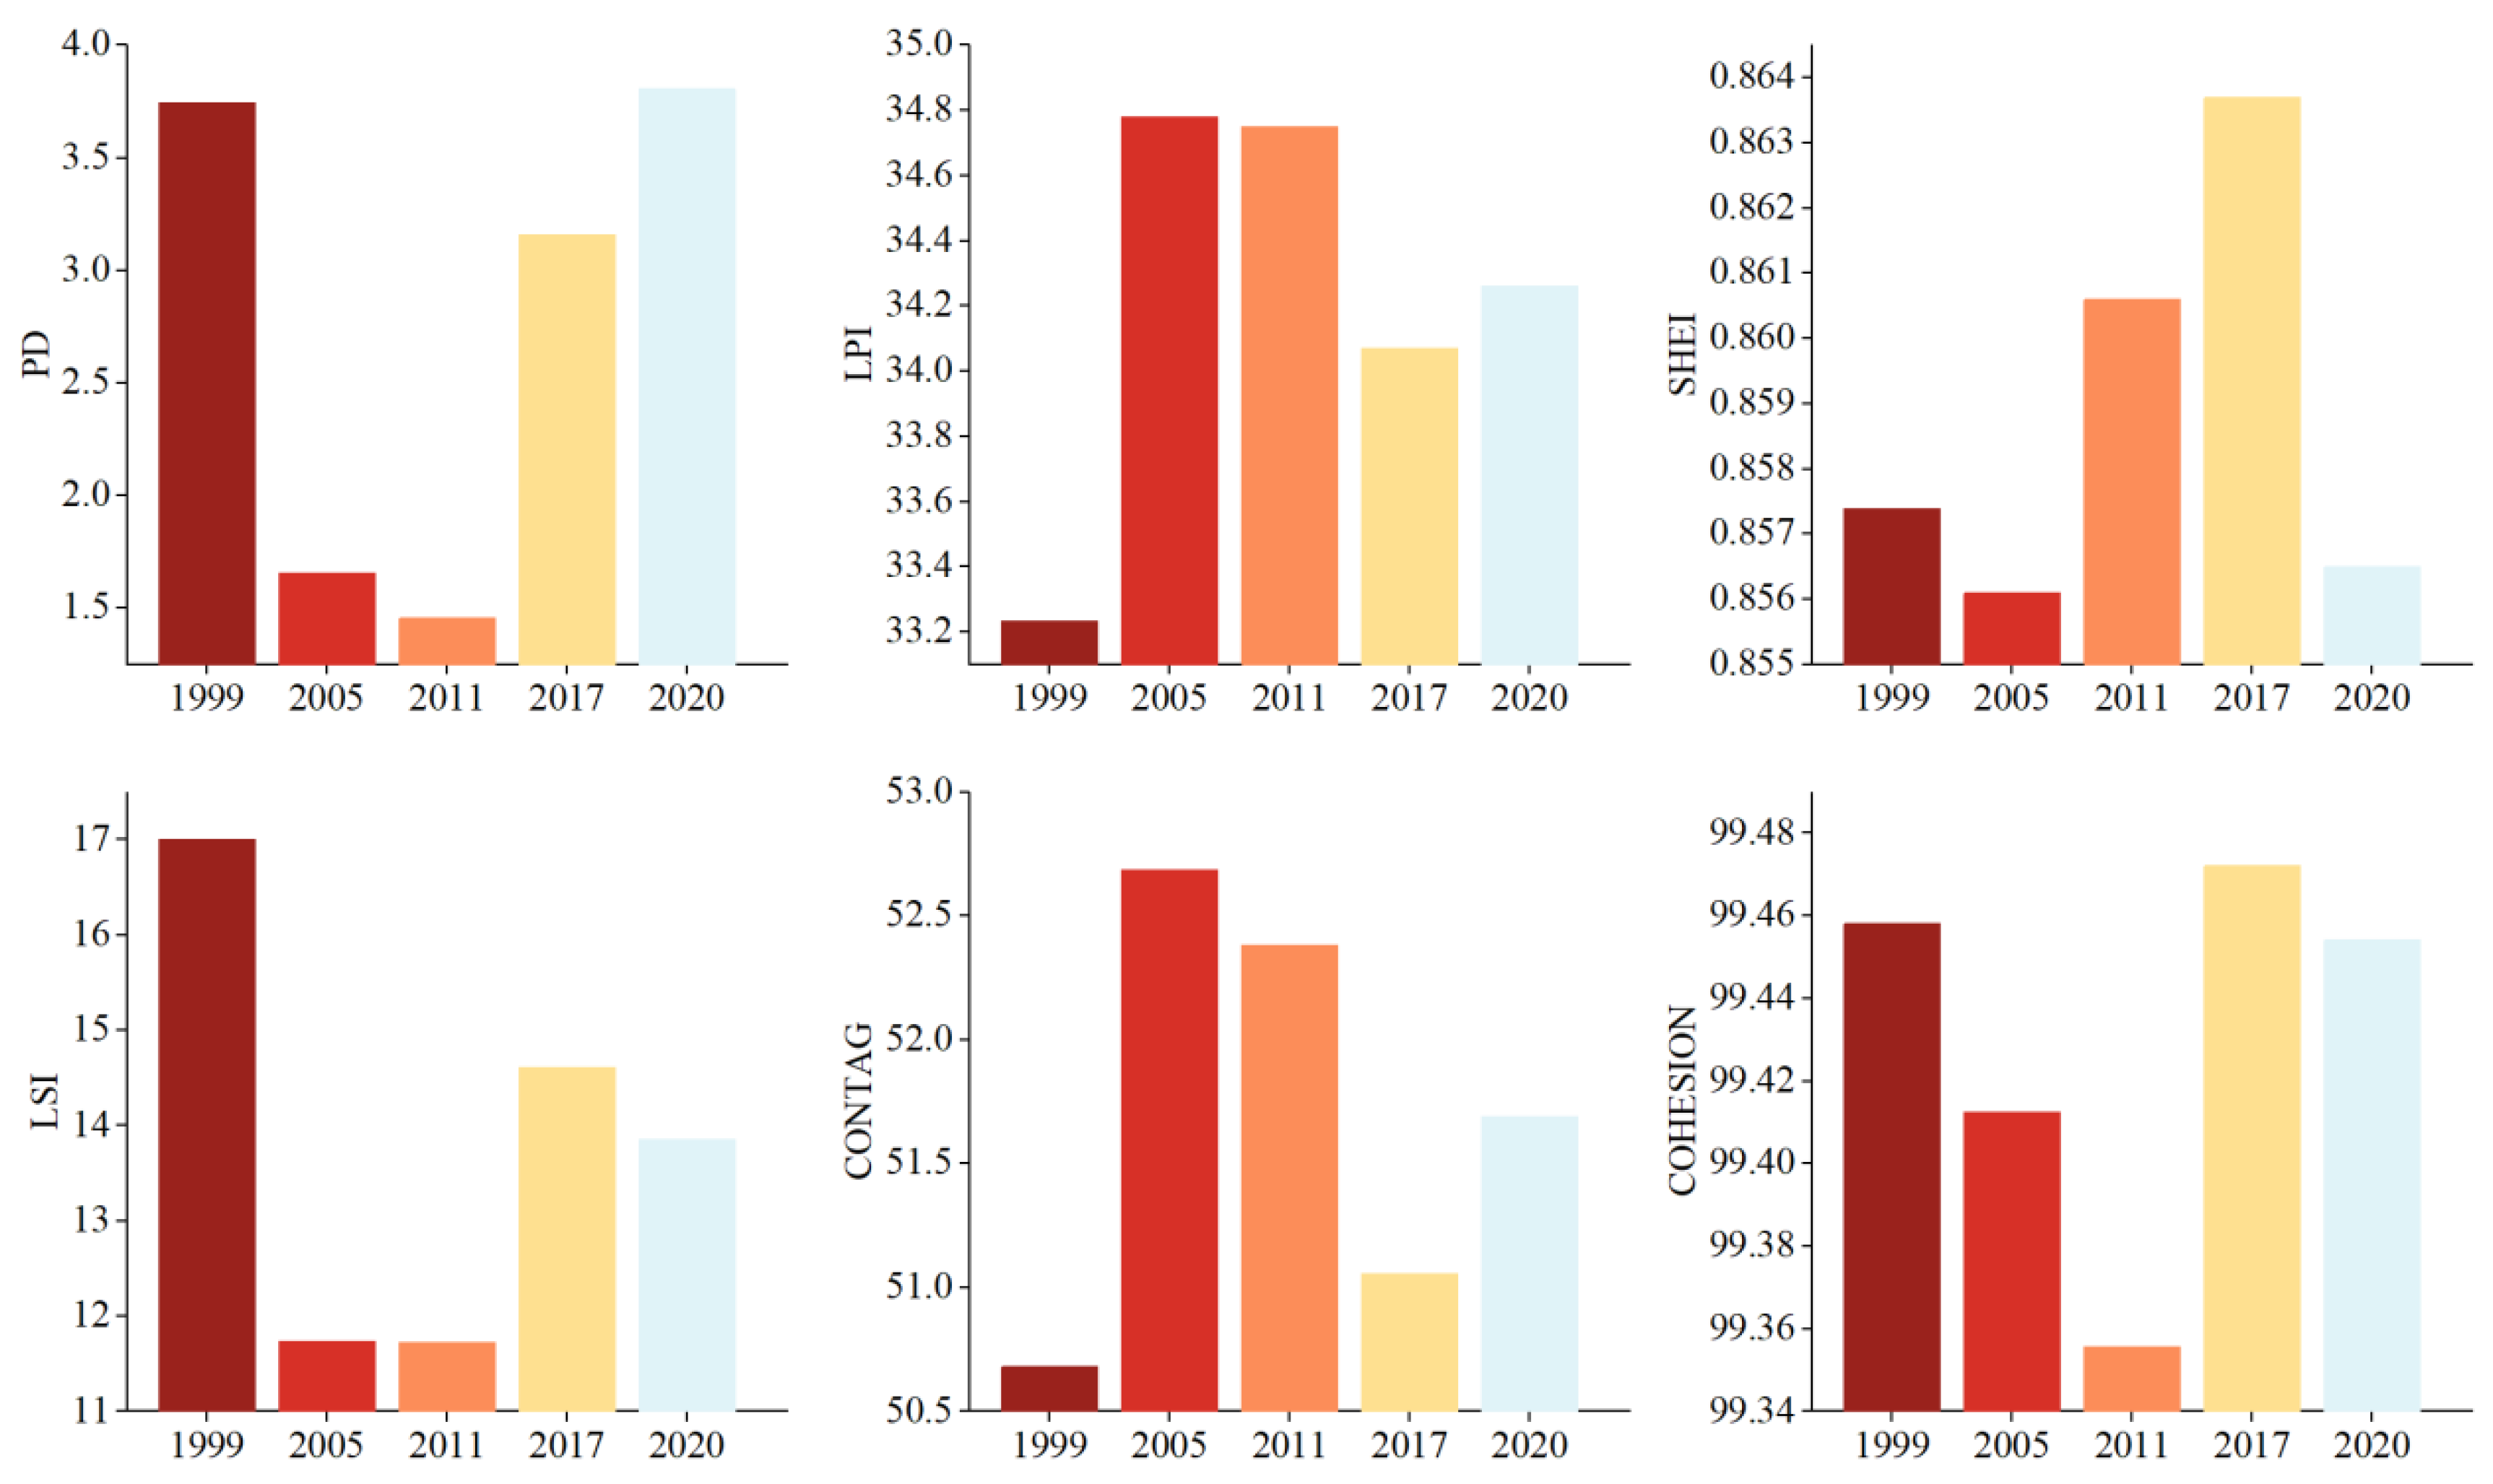
3.2.2. The Overall Evolution Trend of the Landscape Pattern of the Qingtongxia Wetland

Six landscape indices were selected at the landscape level, among which the CONTAG index contains spatial information and describes the agglomeration degree or extension trend of different patch types in the landscape. SHEI describes the uniformity of patch distribution, with smaller values indicating the possible presence of dominant patch types in the landscape, and larger values indicating uniform patch distribution without obvious dominant patches. The calculation results are shown in Figure 10. In 1999, 2017 and 2020, PD was larger, and landscape fragmentation in wetlands was more significant. In 2005 and 2011, fragmentation was the smallest, LPI and CONTAG were the largest, there were dominant patches spread and clustered together in the wetland and the smallest LSI showed that the shape of patches was simple. In 2017, the SHEI values were slightly higher, the distribution in wetlands was more uniform and the dominant patches were not significant. The results were mutually verified with LPI and CONTAG. COHESION was minimal in 2011, where, although there was a cluster of dominant patches within the region, there may be a large number of scattered patches that could not be effectively connected.
Overall, the evolution of the landscape pattern of the study area in 1999–2020 was divided into two stages from the perspective of fragmentation: fragmentation decreased in 1999–2011 and increased in 2011–2020. From the perspective of connectivity, it was divided into three stages: connectivity decreased in 1999–2011, increased in 2011–2017 and decreased in 2017–2020. From the perspective of patch spread agglomeration, it was divided into three stages: the spread agglomeration effect increased in 1999–2005, decreased in 2005–2017 and increased in 2017–2020.

3.3. Analysis of the Driving Forces of Wetland Evolution

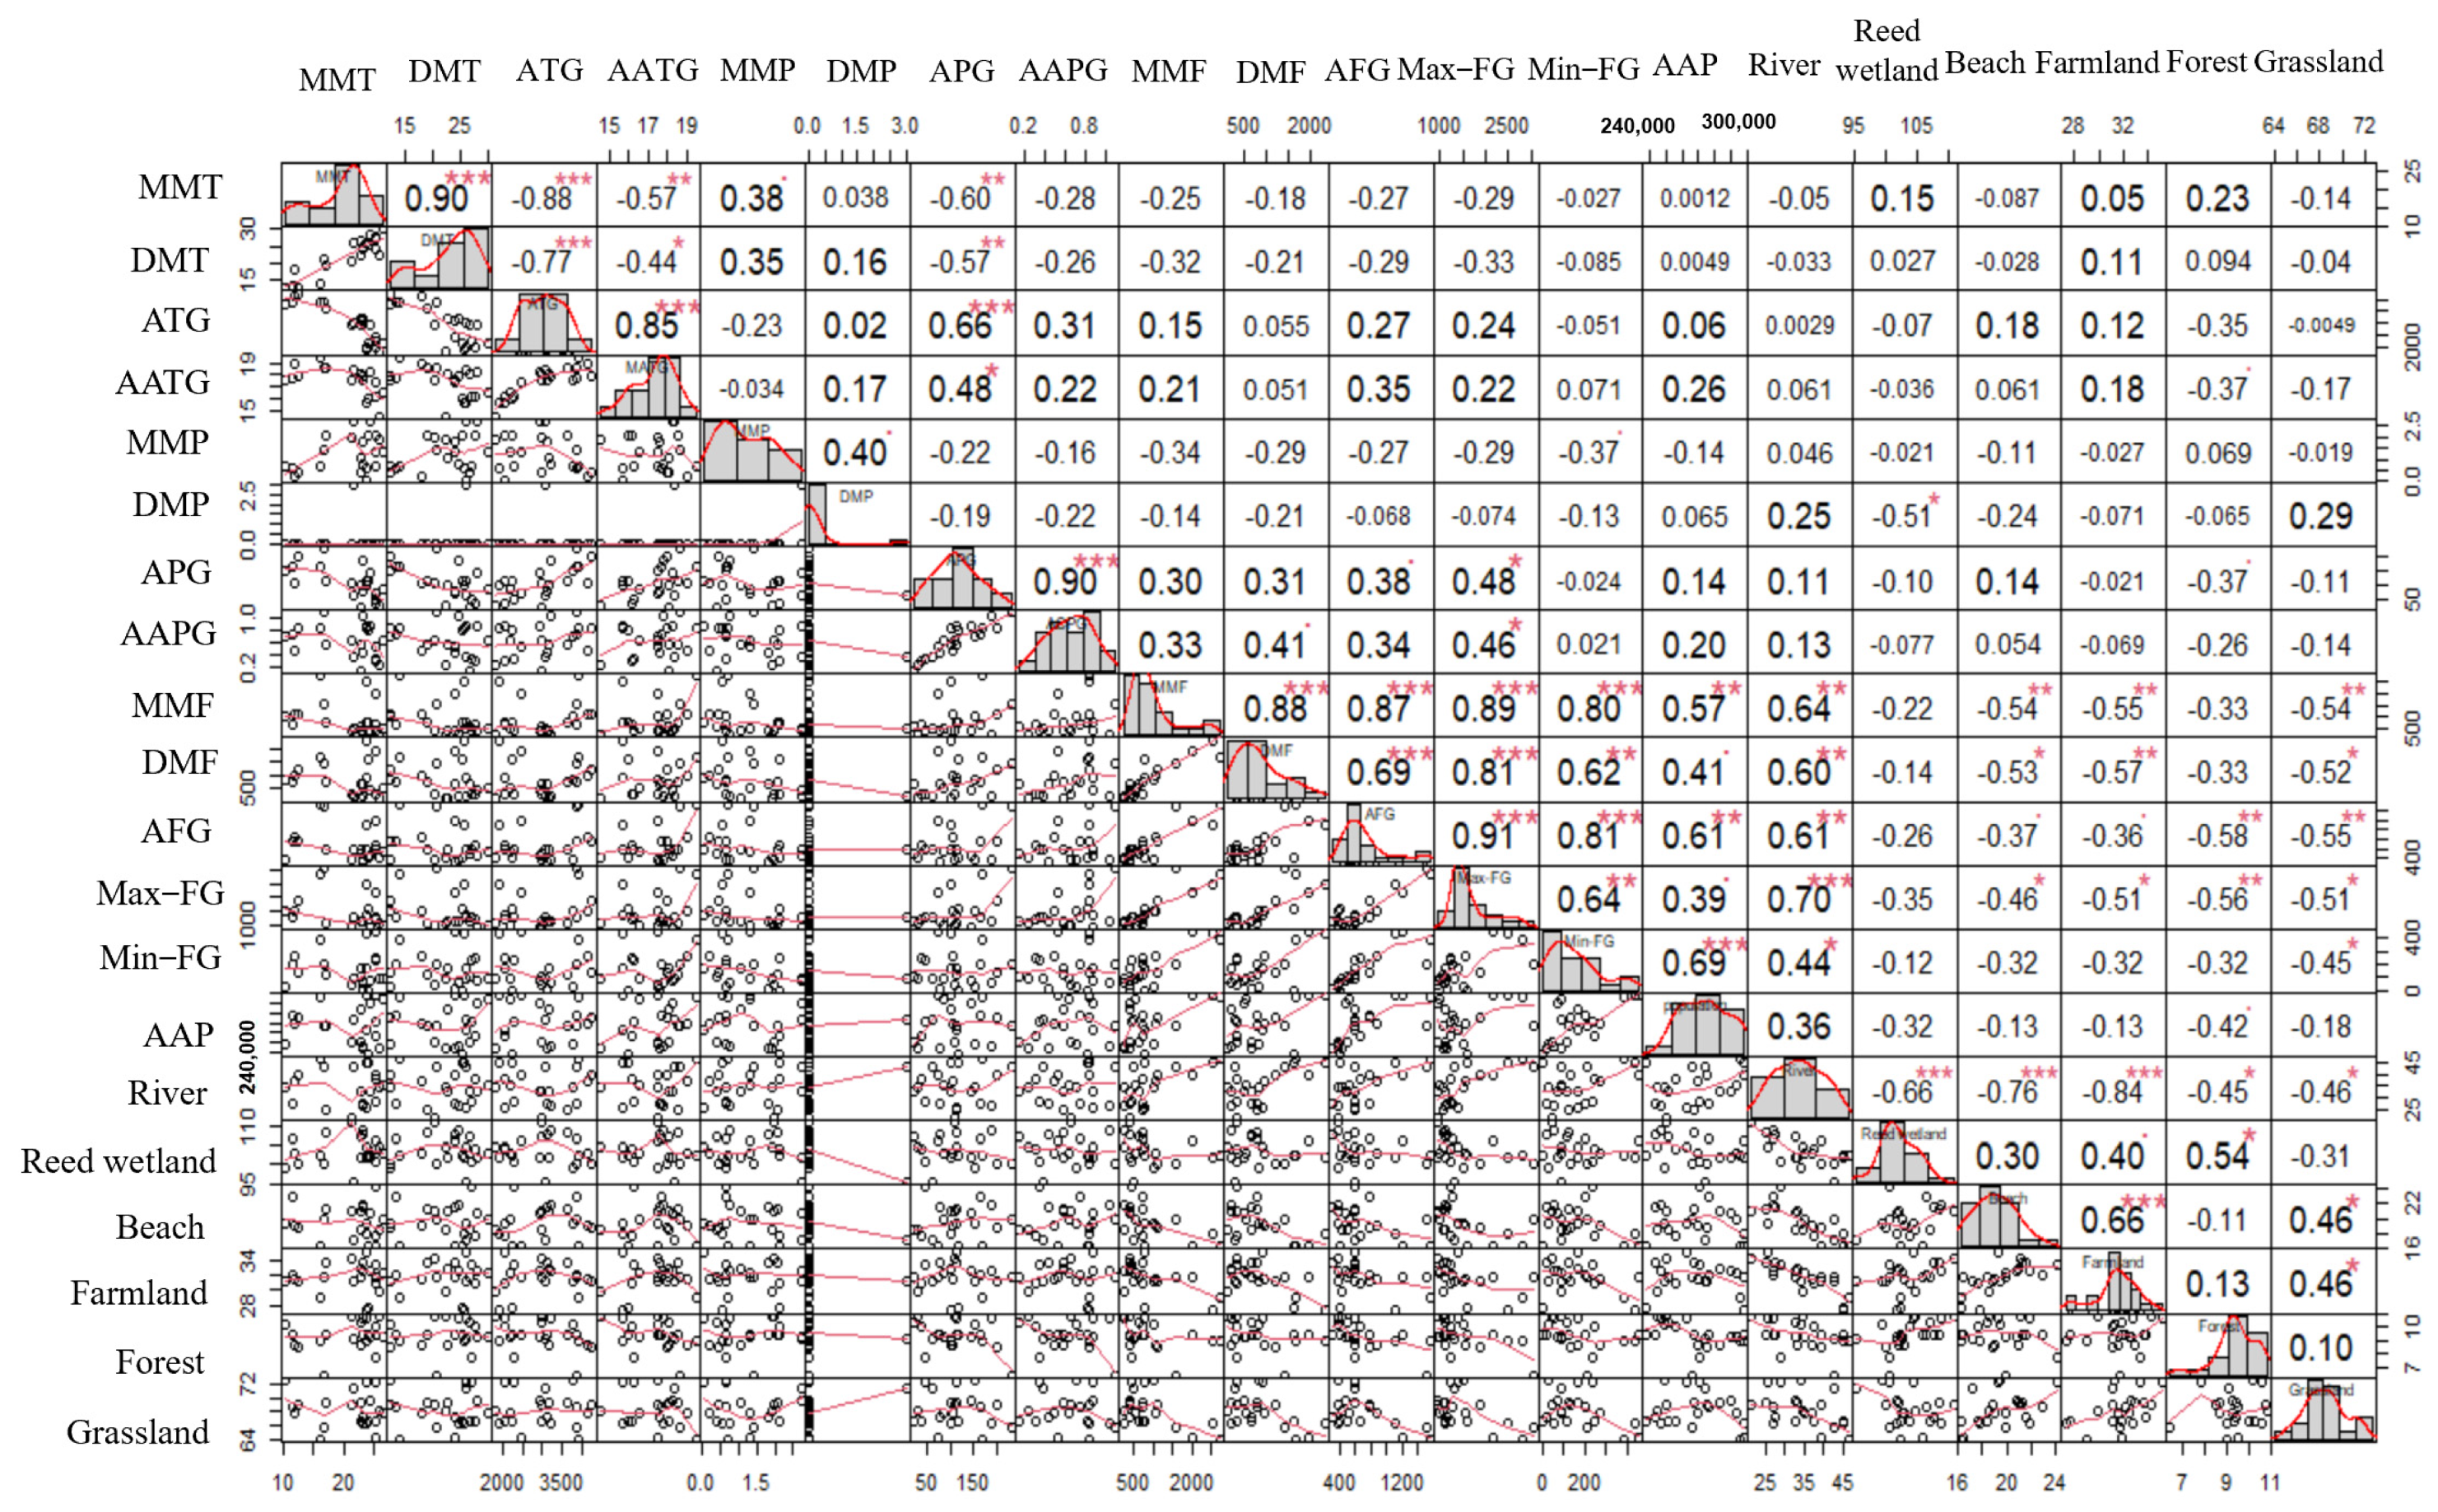
3.3.1. Analysis of the Driving Forces of Wetland Type Evolution

Based on a large number of studies in the literature, precipitation, temperature, population and regional GDP are the first factors used to explore the driving forces of wetland evolution. Precipitation changes the area distribution of wetlands in water areas and directly affects wetland hydrological processes. Temperature indirectly affects wetland hydrological processes by affecting evapotranspiration. Population and regional GDP provide feedback from human activities, and these factors drive the evolution of wetlands [50,51]. In addition, the flow as a result of reservoir scheduling not only changes the area distribution of the water but may also affect the growth of vegetation [52,53]. In this study, five basic elements of flow, temperature, precipitation, population and regional GDP were selected for 22 years from 1999 to 2020, considering that the growth of vegetation and the state of water areas are the result of cumulative effects; thus, for the three elements of temperature, precipitation and flow, the monthly mean temperature, daily mean temperature, accumulated temperature during the growing period, mean accumulated temperature during the growing period, monthly mean precipitation, daily mean precipitation, accumulated precipitation during the growing period, average cumulative precipitation during the growing period, monthly mean flow, daily mean flow, average flow during the growth period, maximum flow during the growth period and minimum flow during the growth period were used to explore the driving forces of wetland evolution. Due to the long expression of each factor, this paper adopted the abbreviated method in the relevant analysis chart. The monthly mean temperature is expressed by MMT, the daily mean temperature is expressed by DMT, the accumulated temperature during the growing period is expressed by ATG, the mean accumulated temperature during the growing period is expressed by AATG, the monthly mean precipitation is expressed by MMP, the daily mean precipitation is represented by DMP, the accumulated precipitation during the growing period is represented by APG, the average cumulative precipitation during the growing period is represented by AAPG, the monthly mean flow is expressed by MMF, the daily mean flow is represented by DMF, the average flow during the growth period is expressed by AFG, the maximum flow during the growth period is expressed by Max-FG, the minimum flow during growth period is expressed in Min-FG, the population is expressed in AAP and the results are shown (Figure 11). The water area was positively correlated with the monthly mean flow, daily mean flow, average flow during the growth period, maximum flow during the growth period, minimum flow during the growth period and regional GDP, and the correlation coefficients were 0.644 (p < 0.01), 0.604 (p < 0.05), 0.605 (p < 0.05), 0.703 (p < 0.01), 0.436 (p < 0.05) and 0.593 (p < 0.01). The area of reed wetland was significantly negatively correlated with the daily mean precipitation, and the correlation coefficient was −0.509 (p < 0.05). The beach area was significantly negatively correlated with the monthly mean flow, daily mean flow and maximum flow during the growth period, and the correlation coefficients were −0.537 (p = 0.01), −0.532 (p < 0.05) and −0.458 (p < 0.05). Farmland was negatively correlated with the monthly mean flow, daily mean flow, maximum flow during the growth period and regional GDP, and the correlation coefficients were −0.548 (p < 0.01), −0.569 (p < 0.01), −0.514 (p < 0.05) and −0.485 (p < 0.05), respectively. There was a significant negative correlation between forestland and average flow during the growth period, maximum flow during the growth period and regional GDP, and the correlation coefficients were −0.583 (p < 0.01), −0.564 (p < 0.01) and −0.546 (p < 0.05), respectively. There was a significant negative correlation between grassland and monthly mean flow, daily mean flow, average flow during the growth period, maximum flow during the growth period and minimum flow during the growth period, and the correlation coefficients were −0.541 (p < 0.01), −0.524 (p < 0.05), −0.552 (p < 0.01), −0.514 (p < 0.05) and −0.449 (p < 0.05), respectively. Except for water, all other land use types were significantly negatively correlated with correlation factors. Water is the main body in the whole wetland change process, and other land use changes are the increase and decrease in the area around the change in water area.

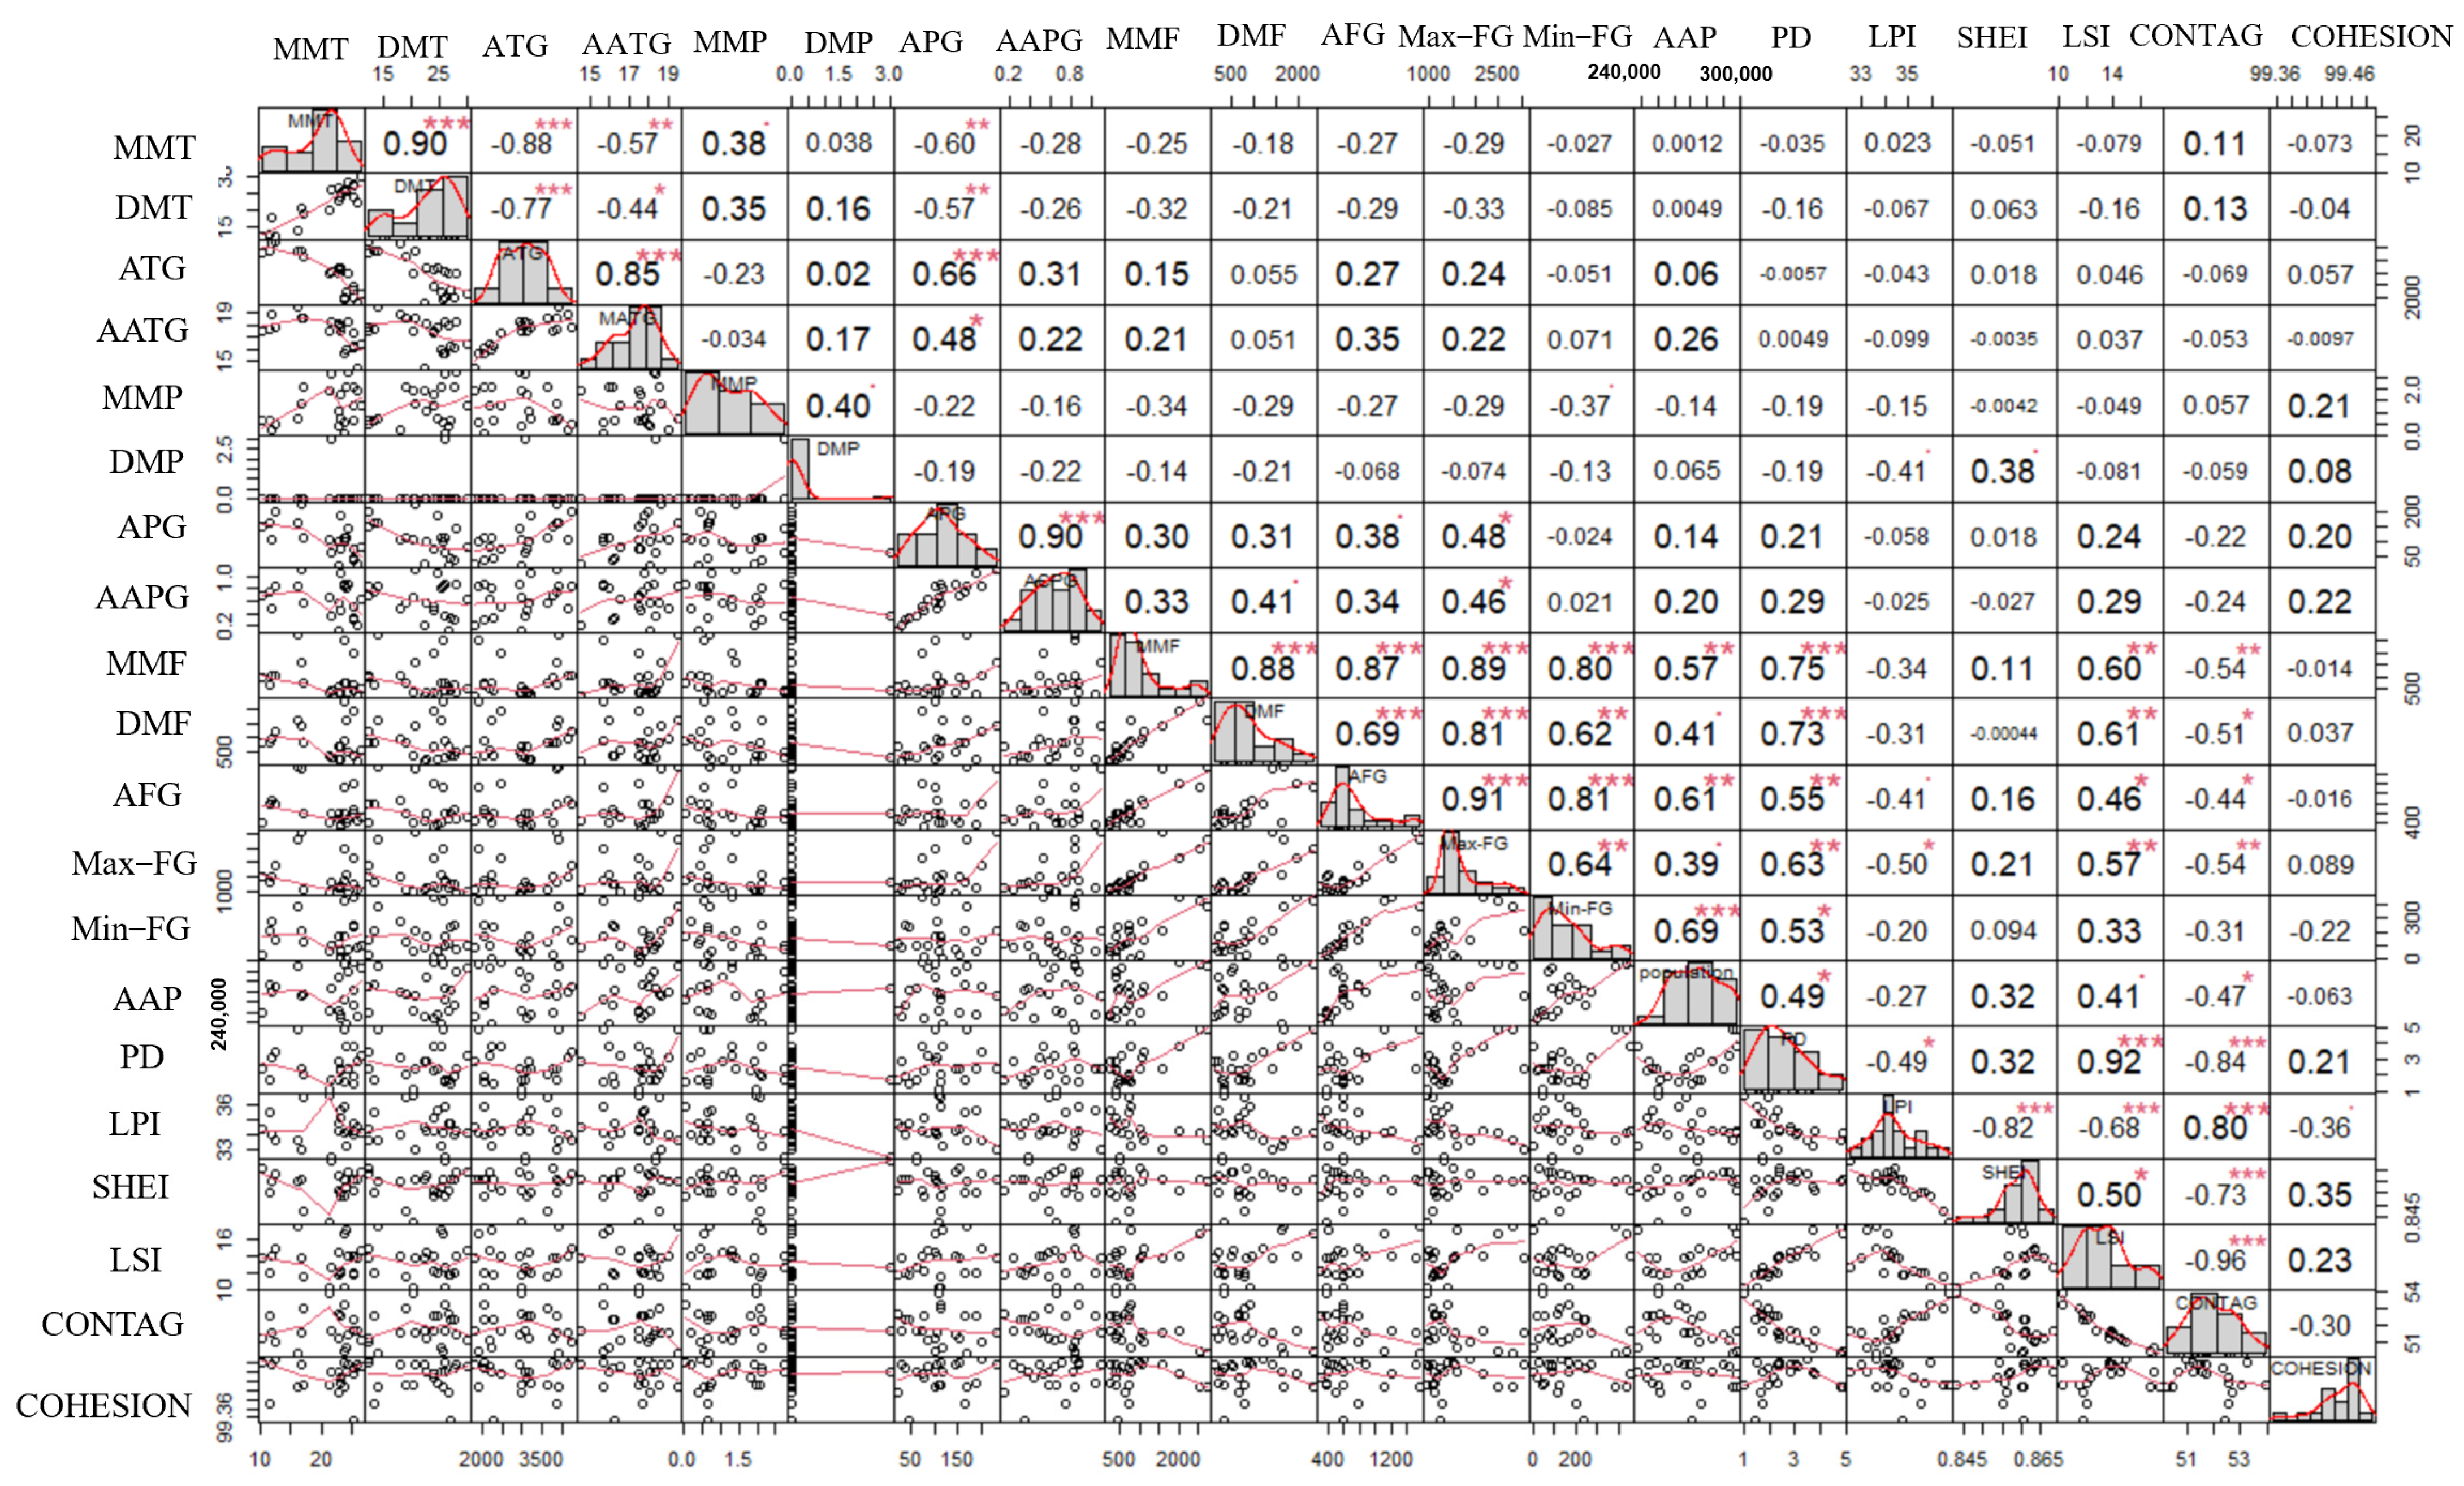
3.3.2. Analysis of Driving Forces for Landscape Pattern Evolution

The correlation analysis results between landscape indices and environmental factors show that (Figure 12) PD and LSI were positively correlated with monthly mean flow, daily mean flow, average flow during the growth period, maximum flow during the growth period, population and regional GDP, while PD and minimum flow during the growth period were significantly positively correlated. CONTAG was significantly negatively correlated with the monthly mean flow, daily mean flow, average flow during the growth period, maximum flow during the growth period, population and regional GDP. LPI was significantly negatively correlated with maximum flow during the growth period and regional GDP; that is, temperature and precipitation have little impact on the landscape pattern in the study area, and the flow changes caused by reservoir dispatch, population and regional GDP are the leading factors in the evolution of the landscape pattern.

3.3.3. Attribution Analysis

Human activities and policy changes are important causes of wetland change [25]. Since the 1990s, the duration and scope of the discontinuity of the Yellow River have increased [21], so the water area of the Yellow River has decreased from 1999 to 2011. With the progress of the water diversion and sand diversion project, the water conveyance channel of the Yellow River was dredged, and the water area gradually recovered [26], which showed a straight upwards trend after 2011. The beach is surrounded by water, and when the amount of water is large, it is prone to submergence, resulting in a decrease in area. Conversely, the area increases, and the change is opposite to the change in the area of the water.
The evolution of the landscape pattern of the whole Qingtongxia wetland shows that, in the early 1990s, some farmers in Zhongning County and Qingtongxia City entered the wetland to repair embankments to open up land for farming, which destroyed the diversity of the natural wetland ecosystem; thus, the fragmentation of the landscape with a high PD in 1999 was significant. With the proposal and implementation of a series of policies, such as the promotion of the world’s most important ecological protection project, the project of returning farmland to forest was launched in 1999 [17] (Figure 13). In 2002, the executive meeting of the Ningxia People’s Government decided to designate the Qingtongxia reservoir area as an autonomous region-level nature reserve. In May 2004, the People’s Government of the autonomous region approved the overall plan of the Qingtongxia reservoir area nature reserve. On 27 October 2006, the Qingtongxia Municipal People’s Government was responsible for the management of the wetland nature reserve in the Qingtongxia reservoir area and established relevant management institutions. Since the establishment of the Qingtongxia Reservoir Area Wetland Protection and Construction Management Bureau in 2007, protective measures have been taken, such as returning farmland to wetlands, setting up fences, boundary monuments and publicity boards and setting up management and protection stations, which have restored the ecological environment to a certain extent, reflecting that, in 2005 and 2011, the PD was very small, the degree of landscape fragmentation was reduced, the shape tended to be simplified and the development of dominant species was obvious. After 2011, various planning and renovation efforts within wetland reserves and human activities such as tourism have led to an increased landscape fragmentation [50], and the complexity of the patch shape within wetlands has increased. At the same time, with the implementation of various conservation measures, the dominant species in the wetlands have resumed development.
In summary, the driving force of different land use area changes in wetlands in the Qingtongxia reservoir area is mainly flow, and the driving force of wetland landscape pattern evolution is closely related to population and regional GDP in addition to being affected by flow.

3.4. Applications and Limitations

The analysis of wetland evolution and its driving force provides theoretical support for meeting the ecological needs of wetlands at different stages, adjusting the internal structure of wetlands and improving the comprehensive value of wetlands. The optimization objective of wetlands in the Qingtongxia reservoir area is mainly to maintain bird diversity, and the maintenance of bird diversity includes two parts: the maintenance of bird habitat and the maintenance of bird feeding ground. Bird habitats include reed wetlands, beaches, woodlands, grasslands and farmlands, and bird feeding grounds include farmland, grasslands and waters. Therefore, maintaining bird diversity requires the reasonable planning of the proportion of different land uses in wetlands, appropriate control of flow and a reduction in landscape fragmentation [54].
This study is of great significance for promoting wetland management planning, but it also has certain limitations. As a typical case of a reservoir operation promoting wetland formation, the Qingtongxia wetland has not been able to explore how reservoir operation plays a role in wetland formation due to the lack of video data in the 10 years before and after the completion of the project. In addition, the evolution of wetlands in this study focuses more on macroevolution, and microevolution is also an important part of wetland evolution, which can help us to deeply understand the internal mechanism and structure of wetlands. Therefore, how to combine macroevolution and microevolution is of great significance for future research on wetland evolution.

4. Conclusions

Based on the interpretation and analysis of remote sensing images of wetland nature reserves in the Qingtongxia reservoir area from 1999 to 2020, this paper determined the evolution trend and driving force of wetlands, which laid the foundation for the establishment of wetland optimization systems based on ecological needs. The main results are as follows:
(1)
In 1999–2020, the land use type of the Qingtongxia wetland changed, the water area and grassland area decreased by 5.6 km2 and 2.4 km2 and the areas of reed wetland, beach, farmland and forest increased by 3.5 km2, 0.1 km2, 4.2 km2 and 0.1 km2, respectively.
(2)
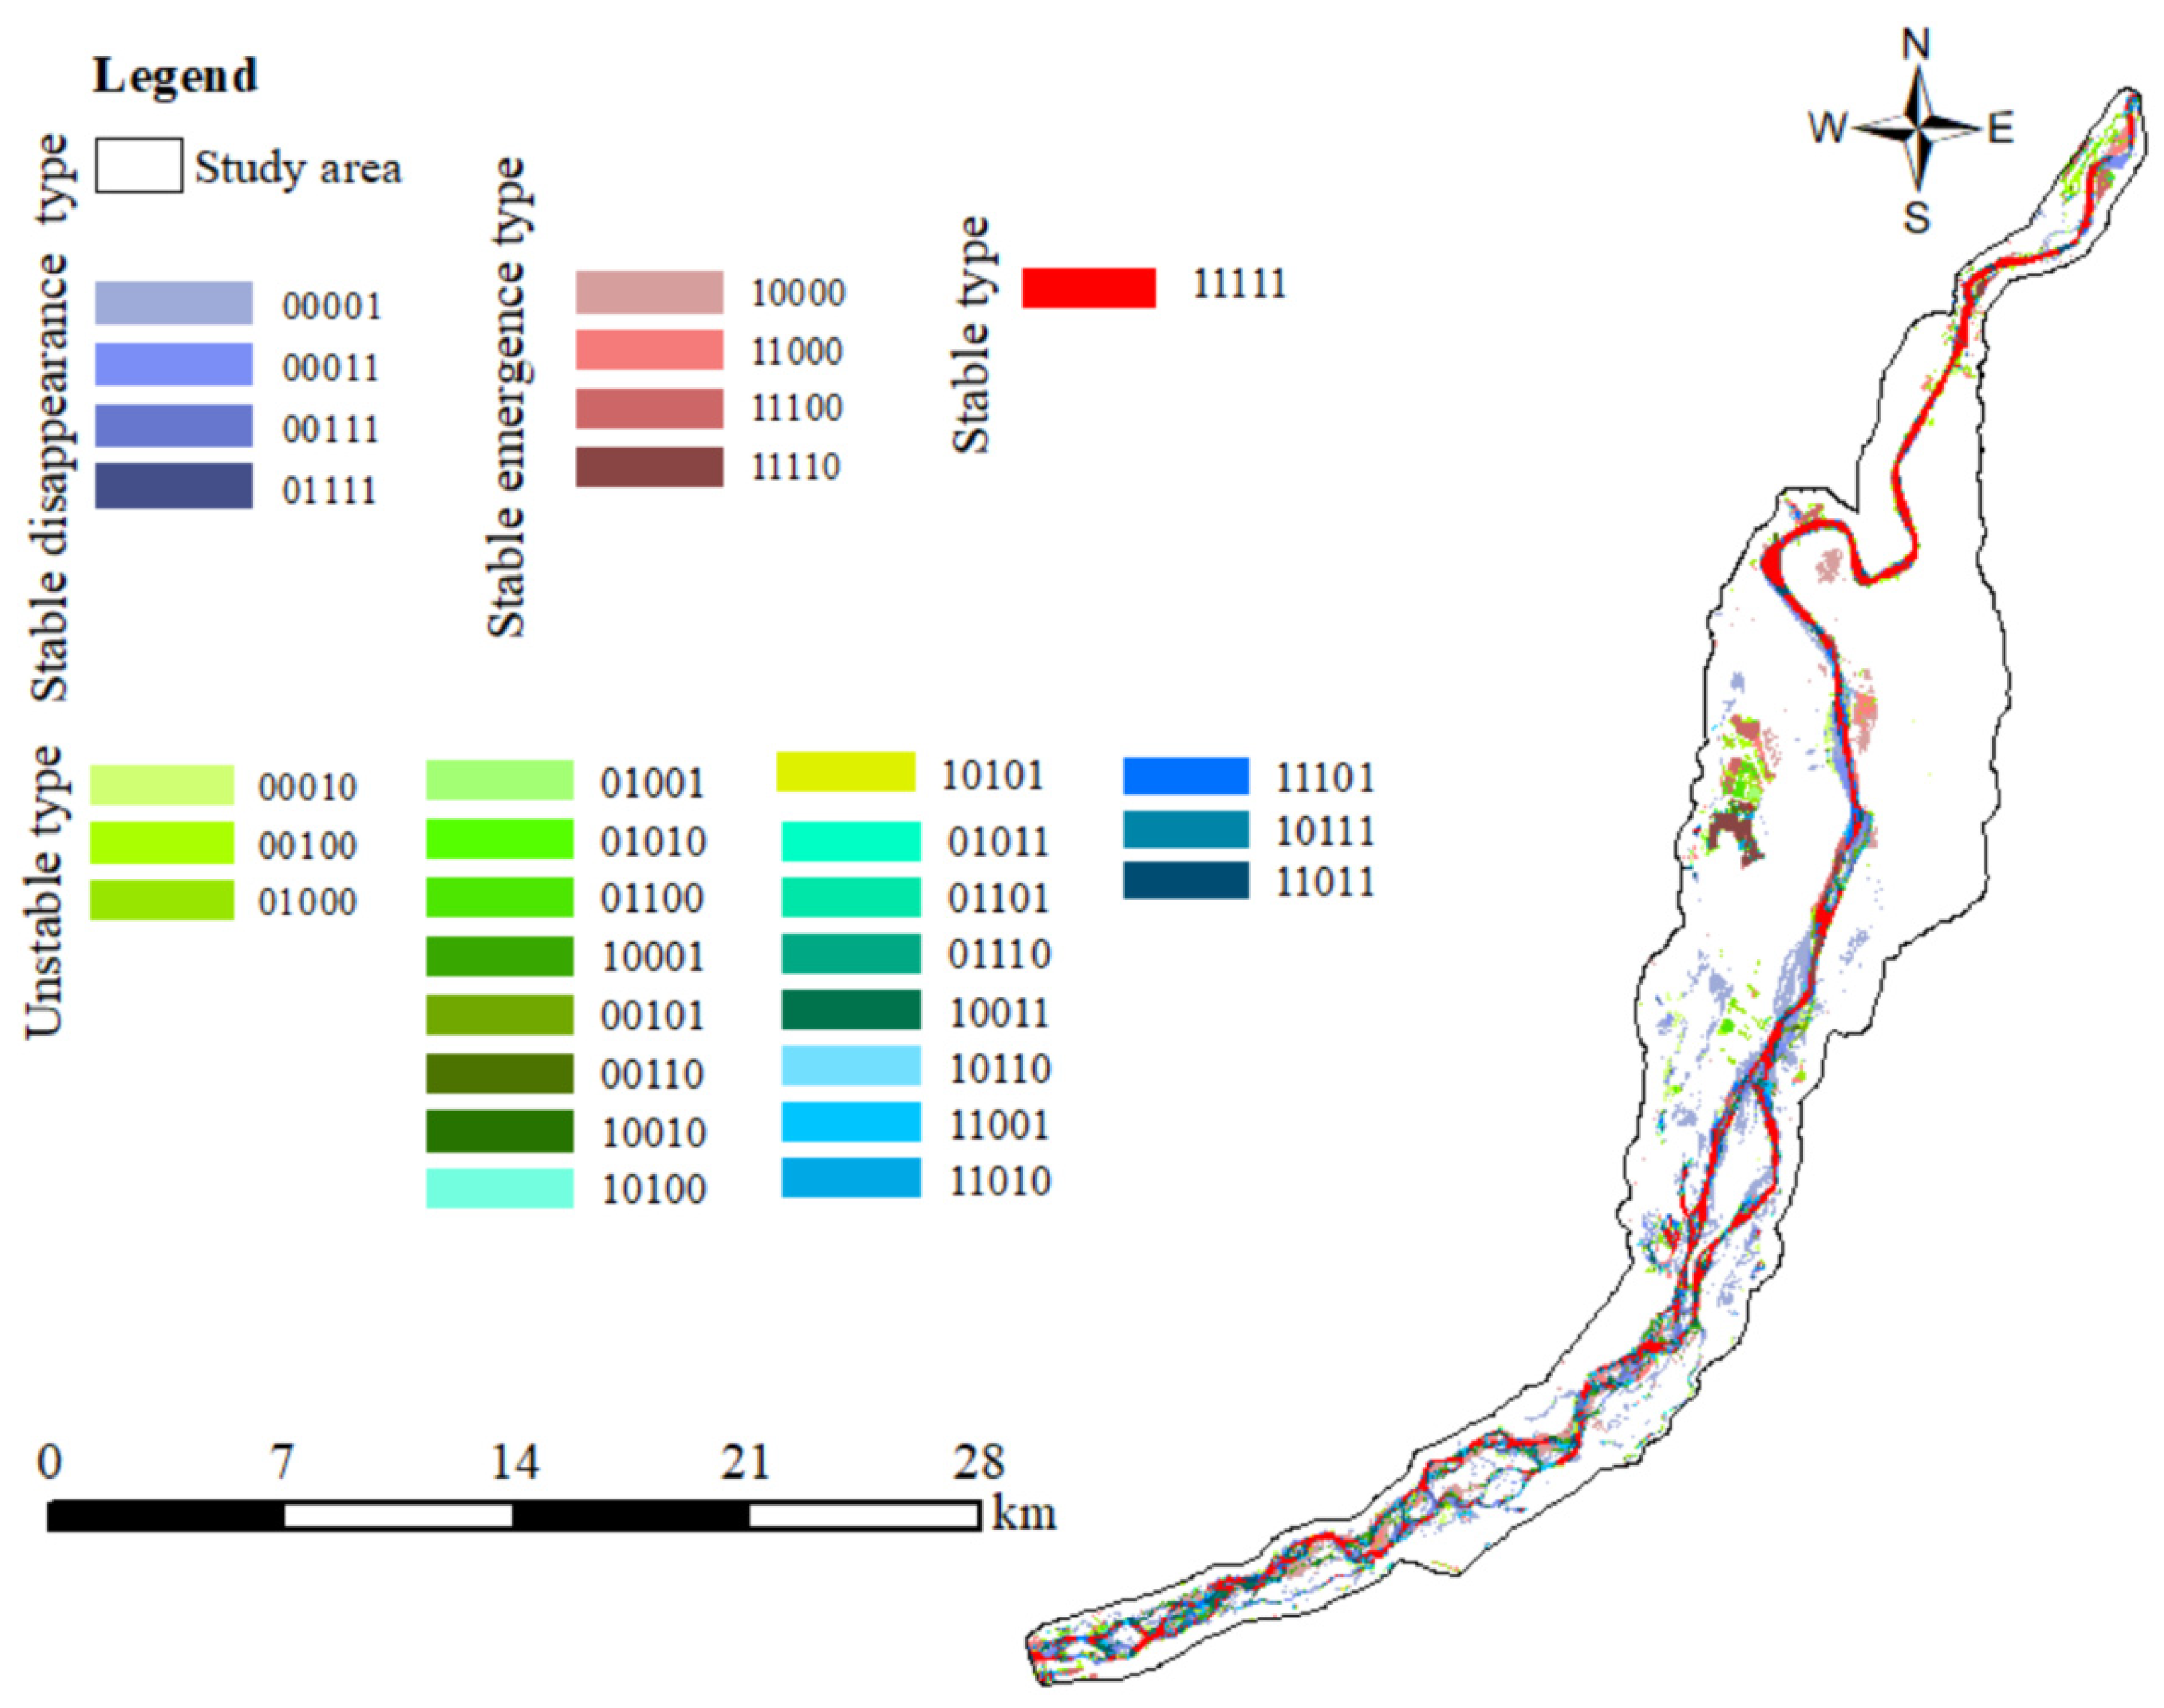
The transfer of water in and out has led to changes in different land use areas within wetlands. The water agglomeration areas in different interannual areas were roughly distributed in the southwest-northeast direction, and the wetland areas in the southwest shrank. High-frequency waters are wrapped in low-frequency waters; in addition to the main trunk of the river, the early water area was mostly distributed on the edge of the beach and reed wetland, and, in recent years, the water area has mostly supplemented the missing part of the river trunk.
(3)
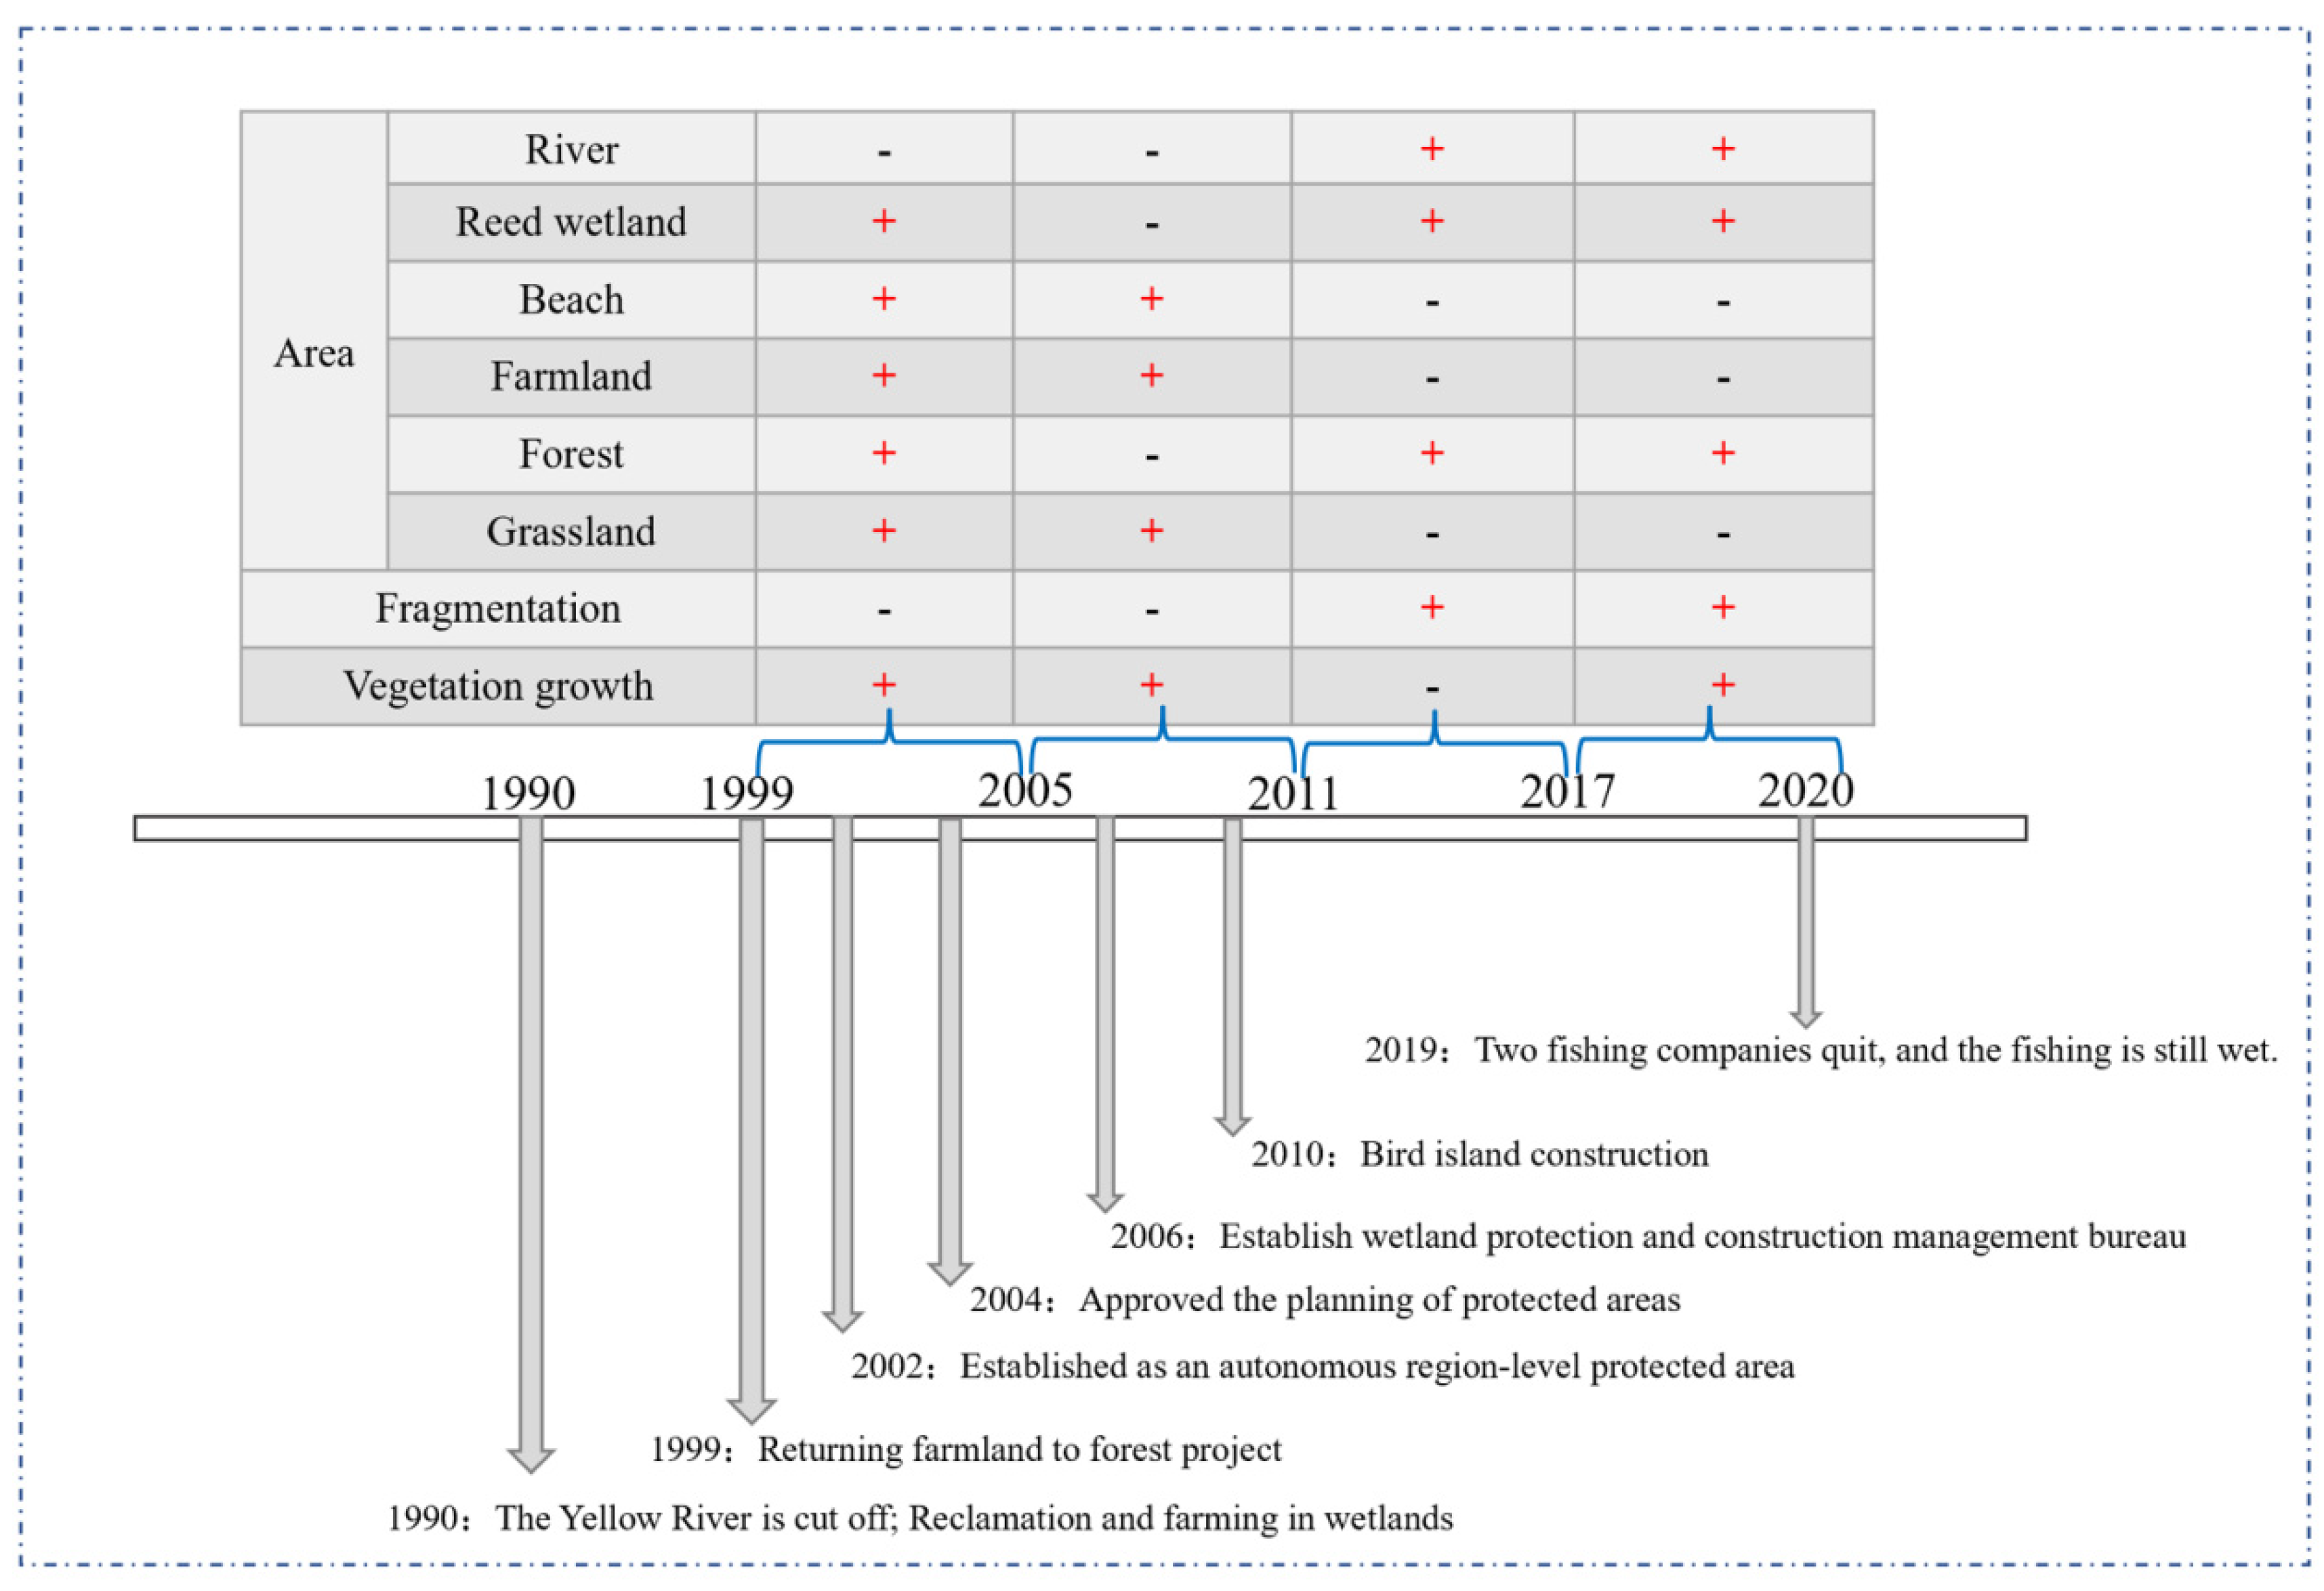
Overall, the evolution of the landscape pattern of the research area in 1999–2020 can be roughly divided into two stages: a recovery period and disturbance period. The period from 1999 to 2011 was the wetland recovery period, where the degree of landscape fragmentation decreased, the shape tended to be simplified and the dominant species obviously developed. The period from 2011 to 2020 was the wetland disturbance period. As a kind of tourism place, wetlands undergoing various planning and renovation may face the destructive effect of human activities to some extent, with an increased fragmentation and increased complexity of the patch shape. Meanwhile, with the implementation of various protection measures, the internal dominant species will recover and develop. In terms of patch types, there was little difference in connectivity between different land use types. Water and grassland are the most fragmented areas.
(4)
The driving force of different land use area changes in the wetland in the Qingtongxia reservoir area is mainly flow, and the driving force of landscape pattern evolution in the wetland is closely related to population and regional GDP in addition to the influence of flow.
(5)
In this study, a method of habitat quality assessment based on habitat area, landscape fragmentation and vegetation growth was proposed, and the results show that fragmentation was the main cause of habitat quality decline. The bird diversity of wetlands in the Qingtongxia reservoir area can be maintained by the reasonable planning of different land use proportions, taking corresponding measures to reduce landscape fragmentation and control flow.

Author Contributions

All authors contributed to the study conception, design and final manuscript edits. Q.L. was responsible for data analysis and manuscript writing. T.J. and Q.P. conceived and designed the research and provided many suggestions for manuscript revision. J.Y. and Q.Z. were responsible for data review and supervision. J.L. and D.Z. also provided much feedback on the manuscript. All authors have read and agreed to the published version of the manuscript.

Funding

This work was supported by the National Key R&D Program of China (2022YFC3205000), Key R&D Program of the China Huaneng Group Co., Ltd (HNKJ20-H26).

Institutional Review Board Statement

This study does not require ethical approval, so this statement is excluded.

Informed Consent Statement

This study does not involve humans, so this statement is excluded.

Data Availability Statement

The datasets generated during and/or analyzed in the current study are available from the corresponding author upon reasonable request.

Conflicts of Interest

The authors declare that they have no known competing financial interests or personal relationships that could have appeared to influence the work reported in this paper.

References

  1. Jin, H.; Huang, C.; Lang, M.W.; Yeo, I.-Y.; Stehman, S.V. Monitoring of wetland inundation dynamics in the Delmarva Peninsula using Landsat time-series imagery from 1985 to 2011. Remote Sens. Environ. 2017, 190, 26–41. [Google Scholar] [CrossRef]
  2. Gabrielsen, C.G.; Murphy, M.A.; Evans, J.S. Using a multiscale, probabilistic approach to identify spatial-temporal wetland gradients. Remote Sens. Environ. 2016, 184, 522–538. [Google Scholar] [CrossRef]
  3. Jain, S.K.; Sarkar, A.; Garg, V. Impact of declining trend of flow on Harike wetland, India. Water Resour. Manag. 2008, 22, 409–421. [Google Scholar] [CrossRef]
  4. Orimoloye, I.R.; Kalumba, A.M.; Mazinyo, S.P.; Nel, W. Geospatial analysis of wetland dynamics: Wetland depletion and biodiversity conservation of Isimangaliso Wetland, South Africa. J. King Saud Univ. Sci. 2020, 32, 90–96. [Google Scholar] [CrossRef]
  5. Khatun, R.; Talukdar, S.; Pal, S.; Kundu, S. Measuring dam induced alteration in water richness and eco-hydrological deficit in flood plain wetland. J. Environ. Manag. 2021, 285, 112157. [Google Scholar] [CrossRef]
  6. Wu, H.; Dai, J.; Sun, S.; Du, C.; Long, Y.; Chen, H.; Yu, G.; Ye, S.; Chen, J. Responses of habitat suitability for migratory birds to increased water level during middle of dry season in the two largest freshwater lake wetlands of China. Ecol. Indic. 2021, 121, 107065. [Google Scholar] [CrossRef]
  7. Yang, L.; Wang, L.; Yu, D.; Yao, R.; Li, C.A.; He, Q.; Wang, S.; Wang, L. Four decades of wetland changes in Dongting Lake using Landsat observations during 1978–2018. J. Hydrol. 2020, 587, 124954. [Google Scholar] [CrossRef]
  8. Krina, A.; Xystrakis, F.; Karantininis, K.; Koutsias, N. Monitoring and Projecting Land Use/Land Cover Changes of Eleven Large Deltaic Areas in Greece from 1945 Onwards. Remote Sens. 2020, 12, 1241. [Google Scholar] [CrossRef]
  9. Yang, X.; Liu, S.; Jia, C.; Liu, Y.; Yu, C. Vulnerability assessment and management planning for the ecological environment in urban wetlands. J. Environ. Manag. 2021, 298, 113540. [Google Scholar] [CrossRef]
  10. Qu, Y.; Zheng, Y.; Gong, P.; Shi, J.; Li, L.; Wang, S.; Luo, C.; Zhang, H.; Xu, L. Estimation of wetland biodiversity based on the hydrological patterns and connectivity and its potential application in change detection and monitoring: A case study of the Sanjiang Plain, China. Sci. Total Environ. 2022, 805, 150291. [Google Scholar] [CrossRef]
  11. Ma, Z.J.; Cai, Y.T.; Li, B.; Chen, J.K. Managing Wetland Habitats for Waterbirds: An International Perspective. Wetlands 2010, 30, 15–27. [Google Scholar] [CrossRef]
  12. Alonso, A.; Muñoz-Carpena, R.; Kaplan, D. Coupling high-resolution field monitoring and MODIS for reconstructing wetland historical hydroperiod at a high temporal frequency. Remote Sens. Environ. 2020, 247, 111807. [Google Scholar] [CrossRef]
  13. McLaughlin, D.L.; Diamond, J.S.; Quintero, C.; Heffernan, J.; Cohen, M.J. Wetland Connectivity Thresholds and Flow Dynamics From Stage Measurements. Water Resour. Res. 2019, 55, 6018–6032. [Google Scholar] [CrossRef]
  14. Han, X.; Chen, X.; Feng, L. Four decades of winter wetland changes in Poyang Lake based on Landsat observations between 1973 and 2013. Remote Sens. Environ. 2015, 156, 426–437. [Google Scholar] [CrossRef]
  15. Zhang, J.; Qu, M.; Wang, C.; Zhao, J.; Cao, Y. Quantifying landscape pattern and ecosystem service value changes: A case study at the county level in the Chinese Loess Plateau. Glob. Ecol. Conserv. 2020, 23, e01110. [Google Scholar] [CrossRef]
  16. Wu, H.-B.; Zheng, B.-H. Wetland area identification and waterbird protection management in consideration of lake topography and water level change. Glob. Ecol. Conserv. 2020, 23, e01056. [Google Scholar] [CrossRef]
  17. Hao, R.; Yu, D.; Liu, Y.; Liu, Y.; Qiao, J.; Wang, X.; Du, J. Impacts of changes in climate and landscape pattern on ecosystem services. Sci Total Environ. 2017, 579, 718–728. [Google Scholar] [CrossRef]
  18. Yohannes, H.; Soromessa, T.; Argaw, M.; Dewan, A. Impact of landscape pattern changes on hydrological ecosystem services in the Beressa watershed of the Blue Nile Basin in Ethiopia. Sci. Total Environ. 2021, 793, 148559. [Google Scholar] [CrossRef]
  19. Zhou, Y.; Yue, D.; Guo, J.; Chen, G.; Wang, D. Spatial correlations between landscape patterns and net primary productivity: A case study of the Shule River Basin, China. Ecol. Indic. 2021, 130, 108067. [Google Scholar] [CrossRef]
  20. Dronova, I.; Gong, P.; Wang, L. Object-based analysis and change detection of major wetland cover types and their classification uncertainty during the low water period at Poyang Lake, China. Remote Sens. Environ. 2011, 115, 3220–3236. [Google Scholar] [CrossRef]
  21. Zhang, X.; Wang, G.; Xue, B.; Zhang, M.; Tan, Z. Dynamic landscapes and the driving forces in the Yellow River Delta wetland region in the past four decades. Sci. Total Environ. 2021, 787, 147644. [Google Scholar] [CrossRef] [PubMed]
  22. Miller, R.L.; Fujii, R. Plant community, primary productivity, and environmental conditions following wetland re-establishment in the Sacramento-San Joaquin Delta, California. Wetl. Ecol. Manag. 2009, 18, 1–16. [Google Scholar] [CrossRef]
  23. Zhao, S.; Fang, J. Impact of impoldering and lake restoration on land-cover changes in Dongting Lake area, Central Yangtze. Ambio 2004, 33, 311–315. [Google Scholar] [CrossRef]
  24. Huang, S.; Dahal, D.; Young, C.; Chander, G.; Liu, S. Integration of Palmer Drought Severity Index and remote sensing data to simulate wetland water surface from 1910 to 2009 in Cottonwood Lake area, North Dakota. Remote Sens. Environ. 2011, 115, 3377–3389. [Google Scholar] [CrossRef]
  25. Wang, S.; Zhang, L.; Zhang, H.; Han, X.; Zhang, L. Spatial–Temporal Wetland Landcover Changes of Poyang Lake Derived from Landsat and HJ-1A/B Data in the Dry Season from 1973–2019. Remote Sens. 2020, 12, 1595. [Google Scholar] [CrossRef]
  26. Zhu, C.; Zhang, X.; Huang, Q. Four Decades of Estuarine Wetland Changes in the Yellow River Delta Based on Landsat Observations Between 1973 and 2013. Water 2018, 10, 1595. [Google Scholar] [CrossRef]
  27. Zhang, D.Z.; Ma, Z.F.; Zhao, H.X.; Yang, G.J. Study on bird diversity in Qingtongxia reservoir wetland nature reserve in Ningxia. Wetl. Sci. 2019, 17, 399–408. [Google Scholar] [CrossRef]
  28. Wang, G. Exploration on Unified Registration of Natural Resources in Qingtongxia Reservoir Wetland Nature Reserve. West. Resour. 2020, 98, 121–122+125. [Google Scholar] [CrossRef]
  29. Zhang, H.J.; Liu, P.P.; Hu, D.F.; Sui, J.L. Study on the number and habitat of black storks in autumn and winter in Shidu Nature Reserve, Beijing. Wetl. Sci. 2010, 8, 273–278. [Google Scholar] [CrossRef]
  30. Fu, Z.B.; Liu, Z.; Xie, Z.P. Population distribution and protection countermeasures of black stork in Heihe Wetland National Nature Reserve in Zhangye, Gansu Province. J. Hexi Univ. 2021, 37, 8–13. [Google Scholar] [CrossRef]
  31. Zeng, Y.B.; Peng, B.Y.; Liu, P.; Zhong, L.Q.; Li, Y.F.; Xie, X.Y.; Xie, C.H.; Ding, H. Population dynamics and behavior of wintering black stork in West Dongting Lake. J. Wildl. 2021, 42, 783–789. [Google Scholar]
  32. China Zoological Committee of China Academy of Sciences. Fauna of China, Bird Class; Science Press: Beijing, China, 1997; Volume I. [Google Scholar]
  33. Zhao, Z.X.; Yan, D.H.; Weng, B.S.; Zhang, B. Suitability Evaluation of Great Bustard’s Overwintering Habitat in Baiyangdian Valley. J. Appl. Ecol. 2011, 22, 1907–1913. [Google Scholar]
  34. Li, C.; Zhou, J.Y.; Gong, M.X.; Tian, X.H.; Meng, D.R.; Liu, C.G.; Dang, Y.; Liu, G. Distribution of Oriental subspecies of Great Bustard in China. J. Ecol. 2021, 40, 1793–1801. [Google Scholar]
  35. Wang, M.Y.; Xu, F.; Yang, W.K.; Blank, D.; Zhu, X.S. Research Status of Great Bustard Ecological Biology. J. Ecol. 2015, 34, 1435–1440. [Google Scholar]
  36. Zhang, X.T. Overwintering situation and protection countermeasures of great bustard in the Yellow River Delta. Shandong For. Sci. Technol. 2010, 40, 20–22. [Google Scholar]
  37. Cheng, T.S.; Zhao, H.R.; He, B.; Wang, B.X.; Guan, Y.W. Investigation on the current situation and distribution area of wintering great bustard population in the Yellow River wetland of Shaanxi Province. Shelter. Sci. Technol. 2017, 163, 89–90. [Google Scholar]
  38. Wang, Q.S. Crane Order, Silurus Order, Gull Order. In Fauna of China. Birds.; Science Press: Beijing, China, 2006; Volume 5. [Google Scholar]
  39. Lu, Q.B.; Wang, W.B.; Chen, Y.X.; Xu, W.N.; Yang, S.Z. Research progress of endangered bird merganser. J. Ecol. 2021, 40, 2620–2634. [Google Scholar]
  40. Li, Z.J.; Kang, Z.J.; He, C.R.; Yang, C.C.; Yu, G.Q.; Zhang, Z.Q. Current situation and protection countermeasures of Chinese merganser population in Shimen County, Hunan Province. Wetl. Sci. 2020, 18, 257–265. [Google Scholar]
  41. Zheng, Z.X. Fauna of China: Ornithopoda. Volume II: Animalia; Science Press: Beijing, China, 1979. [Google Scholar]
  42. Tian, J.L.; Huang, H.J.; Zhang, M.M.; Liang, Y.X. Population and distribution of white-tailed sea eagles in China. For. Sci. Technol. 2018, 43, 57–59. [Google Scholar]
  43. Liang, J.; Zhang, M.M.; Li, L.Y.; Wang, X.Q.; Teng, L.W. Brief report on the number and distribution of wintering population of white-tailed sea eagle in Helan Mountain. Sichuan Anim. 2013, 32, 780–782. [Google Scholar]
  44. Collingham, Y.C.; Huntley, B. Impacts of habitat fragmentation and patch size upon migration rates. Ecol. Appl. 2000, 10, 131–144. [Google Scholar] [CrossRef]
  45. Teckentrup, L.; Kramer-Schadt, S.; Jeltsch, F. The risk of ignoring fear: Underestimating the effects of habitat loss and fragmentation on biodiversity. Landsc. Ecol. 2019, 34, 2851–2868. [Google Scholar] [CrossRef]
  46. Newman, B.J.; Ladd, P.; Brundrett, M.; Dixon, K.W. Effects of habitat fragmentation on plant reproductive success and population viability at the landscape and habitat scale. Biol. Conserv. 2013, 159, 16–23. [Google Scholar] [CrossRef]
  47. Lafortezza, R.; Coomes, D.A.; Kapos, V.; Ewers, R.M. Assessing the impacts of fragmentation on plant communities in New Zealand: Scaling from survey plots to landscapes. Glob. Ecol. Biogeogr. 2010, 19, 741–754. [Google Scholar] [CrossRef]
  48. Synes, N.W.; Ponchon, A.; Palmer, S.C.F.; Osborne, P.E.; Bocedi, G.; Travis, J.M.J.; Watts, K. Prioritising conservation actions for biodiversity: Lessening the impact from habitat fragmentation and climate change. Biol. Conserv. 2020, 252, 108819. [Google Scholar] [CrossRef]
  49. Wu, X.; Dong, W.; Lin, X.; Liang, Y.; Meng, Y.; Xie, W. Evolution of wetland in Honghe National Nature Reserve from the view of hydrogeology. Sci. Total Environ. 2017, 609, 1370–1380. [Google Scholar] [CrossRef]
  50. Wang, C.; Ma, L.; Zhang, Y.; Chen, N.; Wang, W. Spatiotemporal dynamics of wetlands and their driving factors based on PLS-SEM: A case study in Wuhan. Sci. Total Environ. 2022, 806, 151310. [Google Scholar] [CrossRef]
  51. Salimi, S.; Almuktar, S.; Scholz, M. Impact of climate change on wetland ecosystems: A critical review of experimental wetlands. Solid State Electron. Lett. 2021, 286, 112160. [Google Scholar] [CrossRef]
  52. Morin, J.; Leclerc, M. From pristine to present state: Hydrology evolution of Lake Saint-Francois, St. Lawrence River. Can. J. Civ. Eng. 1998, 25, 864–879. [Google Scholar] [CrossRef]
  53. Yanxia, H.; Jinliang, H.; Yun, D.; Pengpeng, H.; Wei, H. Monitoring Spatial and Temporal Dynamics of Flood Regimes and Their Relation to Wetland Landscape Patterns in Dongting Lake from MODIS Time-Series Imagery. Remote Sens. 2015, 7, 7494–7520. [Google Scholar]
  54. Mu, S.; Li, B.; Yao, J.; Yang, G.; Wan, R.; Xu, X. Monitoring the spatio-temporal dynamics of the wetland vegetation in Poyang Lake by Landsat and MODIS observations. Sci. Total Environ. 2020, 725, 138096. [Google Scholar] [CrossRef]
Figure 1. Location map of the study area.
Land 12 00930 g001
Figure 2. Spatial distribution map of land use from 1999 to 2020.
Land 12 00930 g002
Figure 3. Accumulation map of wetland area in different periods from 1999 to 2020 (the color of the line is consistent with the type of land use, the left side of the line connects the original land use and the right side connects the direction of land use transfer).
Land 12 00930 g003
Figure 4. Shifting directions between different wetland types in the Qingtongxia wetland from 1999 to 2020.
Land 12 00930 g004
Figure 5. Spatial and temporal map of water distribution.
Land 12 00930 g005
Figure 6. Renderings of water classification.
Land 12 00930 g006
Figure 7. Spatial distribution map of NDVI in reed wetlands from 1999 to 2020.
Land 12 00930 g007
Figure 8. Bird habitat score map of reed wetlands, 1999–2020.
Land 12 00930 g008
Figure 9. Changes in landscape indices of different wetland types from 1999 to 2020.
Land 12 00930 g009
Figure 10. Changes in the wetland landscape index from 1999 to 2020.
Land 12 00930 g010
Figure 11. Correlation analysis of different wetland types and influencing factors (* means p < 0.5, ** means p < 0.01, *** means p < 0.001).
Land 12 00930 g011
Figure 12. Correlation analysis between wetland landscape pattern and influencing factors (* means p < 0.5, ** means p < 0.01, *** means p < 0.001).
Land 12 00930 g012
Figure 13. Time distribution plot of change patterns (note: red “+” indicates an increase in interannual variables, black “-” indicates a decrease in interannual variables).
Land 12 00930 g013
Table 1. Basic statistics on natural and economic data.
YearMonthMonth Mean Temperature (°C)Daily Mean Temperature (°C)Accumulated Temperature during the Growing Period (°C)Mean Accumulated Temperature during the Growing Period (°C)Month Mean Precipitation (mm)Daily Mean Precipitation (mm)Accumulated Precipitation during the Growing Period (mm)Average Cumulative Precipitation during the Growing Period (mm)Month Mean Flow (m3/s)Daily Mean Flow (m3/s)Average Flow during the Growth Period (m3/s)Maximum Flow During the Growth Period (m3/s)Minimum Flow during the Growth Period (m3/s)PopulationRegional GDP (CNY 10,000)
1999724.125.52233162.101150.8755.51600408.516000.9238,134 */
2000725.922.3182614.51.90280.2231.6114424.4108089.2245,021/
2001823.124310417.51.80780.4386.9656309.7116018.3243,847 */
2002823.124.7320517.80.701881268.3193376.7111051.8246,703 */
20031010.412.4376417.50.601510.71027.3802385.4153031.2248,900277,037
2004821.320.3296117.5201100.7392.7328387.895548250,300325,644
2005822.826.72991180.40220.1616.2667485.71100114251,349375,246
2006725.327.7205416.22.10380.3712.7301670.31220248256,158464,616
200772426.1204115.70.101140.9767.4889593.31390165262,182579,804
2008917.119.1363718.62.101140.6743.5775585.21050125267,456630,282
2009821.626.1306318.32.73630.4472.2250581.4130090273,678743,940
20101011.413.3385217.70.601630.7727.5776774.61290204276,381790,304
2011725.327.1228916.20.60470.3442.13165861250235270,927848,335
2012916.820.8385718.61.402291.1157714201503.33070208266,4971,060,425
20131011.718.14138190.201060.51086.4955866.31540270269,1961,215,045
20141012.412.3424417.90.402010.81109.81200775.81880137274,9831,330,201
201582322.6318118.1101020.6418.21655931100165283,4441,353,013
2016824.428.2295918.32.701430.9386.8486474.394472289,6731,293,100
2017726.630219316.51.30850.6532.1535528100089.6292,9761,343,056
2018916.114389919.50.701670.82734.316401548.62800385295,5751,503,914
2019723.925.7192815.70.60102.30.82523.5023301108.92480434297,4131,587,700
2020725.523.9245817.41.3074.10.52022.9019401201.22180453297,9541,264,699
Note: 1999–2012 images are Landsat 7 images; 2013–2020 images are Landsat 8 images; fit missing data are based on linear regression on existing population data, which are marked with * in the upper right corner.
Table 2. Statistics of habitat and foraging preferences of rare birds.
Rare BirdsHabitatFeeding HabitsReferences
Ciconia nigraShrubland wetlands, floodplains, shallow swamps near reservoirs, water areas, beachesFish, snails, insects, frogs[29,30,31,32]
Otis tardaPlains, low hilly areas, farmland, meadows, sparse reed fieldsVegetative food, invertebrate[33,34,35,36,37,38]
Mergus squamatusLakes, streams, ponds, river beaches, meadowsThe main diet is fish, in addition to moths and beetles of the stone silkworm family.[39,40,41]
Haliaeetus albicillaVast swampy areas and islands along the coast, estuaries and riversFish, birds, rodents[42,43]
Table 3. Land use transfer matrix from 1999 to 2020.
19992020
WatersReed WetlandBeachFarmlandForestGrassland
Waters54.81%19.08%13.32%9.86%2.22%0.71%
Reed wetland6.88%92.27%0.10% 0.75%
Beach26.60%2.61%63.13%5.40%2.23%0.02%
Farmland3.94% 0.02%96.04%
Forest12.88% 0.40% 86.72%
Grassland1.53%3.71%0.02% 94.74%
Table 4. Bird habitat rating table in reed wetlands from 1999 to 2020.
YearArea ScoreFragmentation ScoreVegetation Growth ScoreComprehensive Score
19999.575.548.0923.20
200510.0010.009.1229.12
20119.416.139.7125.25
20179.592.849.4121.84
20209.903.3310.0023.23
Table 5. Bird habitat rating table in waters from 1999 to 2020.
YearArea ScoreFragmentation ScoreVegetation Growth ScoreComprehensive Score
1999103.21013.21
20057.327.43014.75
20116.4110016.41
20177.794.87012.66
20208.764.5013.26
Table 6. Bird habitat rating table in beaches from 1999 to 2020.
YearArea ScoreFragmentation ScoreVegetation Growth ScoreComprehensive Score
19996.744.436.6417.81
20057.629.331026.95
2011109.729.1328.85
20178.23109.4127.64
20206.797.539.3923.7
Disclaimer/Publisher’s Note: The statements, opinions and data contained in all publications are solely those of the individual author(s) and contributor(s) and not of MDPI and/or the editor(s). MDPI and/or the editor(s) disclaim responsibility for any injury to people or property resulting from any ideas, methods, instructions or products referred to in the content.

