Next Article in Journal
Analysis of the Evolution Characteristics and Impact Factors of Green Production Efficiency of Grain in China
Next Article in Special Issue
Measuring Access to Services of General Interest as a Diagnostic Tool to Identify Well-Being Disparities between Rural Areas in Europe
Previous Article in Journal
Spatiotemporal Changes and Driving Force Analysis of Land Sensitivity to Desertification in Xinjiang Based on GEE
Previous Article in Special Issue
Rural Entrepreneurship Development in Southwest China: A Spatiotemporal Analysis
 
 
Correction published on 7 July 2023, see Land 2023, 12(7), 1363.
Article

Diagnosis of Rural Development Processes Based on the Stock of Social Capital and Social Networks: Approach from E-I Index

*
Author to whom correspondence should be addressed.
Geography Department, Research Institute of Local Development, Universitat de Valencia, 46025 Valencia, Spain
Land 2023, 12(4), 850; https://doi.org/10.3390/land12040850
Submission received: 28 February 2023 / Revised: 5 April 2023 / Accepted: 6 April 2023 / Published: 8 April 2023 / Corrected: 7 July 2023

Abstract

:
Europe’s rural areas have suffered a continuous loss of human and economic capital from the beginning of the 20th century to the present day. In an attempt to alleviate the effects of this dynamic, the European Union has implemented the LEADER rural development programme since the 1990s (Liaisons Entre Actions de Développement de L’Economie Rurale). Among the many objectives of this policy, the social articulation of its populations stood out as a way of strengthening development processes. This article aims to provide a methodological approach to analyse and quantify the stock of social capital (SC) present in the social networks of rural areas after more than thirty years of European rural policy. Based on 160 interviews with stakeholders linked to rural development processes in rural areas of Spain and England from institutional, economic, social and technical sectors. The methodological approach of Social Network Analysis (SNA) has been used, and within this, the study of SNA indicators and the analysis of the E-I index have been integrated in order to analyse the stock of internal (bonding) and external (bridging) SC. The conclusions of this study clarify the role of stakeholders and their contribution to the stock of SC. The studied rural areas present a balance in internal and external relations, which shows a high stock of SC and an encouraging scenario for the development processes and, thus, for the success of the LEADER programme. Nevertheless, the participation of the actors in the LEADER programme in Spain still shows a worrying project class.

1. Introduction

Social capital (SC) has had a growing presence in different disciplines to try to explain and understand the evolution of educational, health, urban, etc., processes in different territories and societies [1,2,3,4,5]. One of these growing areas of study is in rural areas and their link to local development processes, where several authors consider SC as a fundamental element in understanding these processes [6,7,8,9,10,11] in both positive and negative terms [12,13,14].
Europe’s rural areas have experienced and are still experiencing a demographic process characterised by depopulation from the end of the Second World War to almost the present day [15]. This process must be understood in the context of Europe as a whole, and Spain is one more part of this context. As a consequence of this situation of population imbalance, a series of problems have been unleashed in rural areas from both a social-demographic and economic point of view [15,16].
To combat social, economic and territorial problems, it is necessary to understand the role that European and national institutions have played in tackling, halting and changing demographic trends in these areas. The European Union (EU) has been applying the LEADER (Liaisons Entre Actions de Développement de L’Economie Rurale) working methodology for more than 30 years, first as a Community Initiative and then as part of Rural Development programmes based on three parts: strategy, territory and partnership with a bottom-up approach [17,18]. However, in none of the LEADER legislative documents is the SC directly mentioned. It is understood that this is a fundamental element for achieving the development objectives and that many researchers have established it as such [6,8,19,20,21].
The study of SC and its relationship with development processes in European rural areas has been widely studied, but from different perspectives and methodologies. This is because it is a multifaceted concept that needs to be analysed from different perspectives [22,23]. Rural development processes respond to the combination of different structures, individual or group actors, public or private, and, in turn, with different interests. Hence, the relationship between SC and rural development is clear, but it is necessary to analyse it after more than 30 years of LEADER experience in European territories, with mixed results in its application from both positive and negative points of view [24] and in a European context of uncertainty and a certain pessimism about LEADER [25]. This is why, in view of the programme’s extensive experience and more than three decades of application, this paper poses the following research question: Is there a social articulation and a balanced stock of SC between internal and external and, therefore, a positive evolution of rural development processes in LEADER areas? The main contribution of this article is an assessment of the stock of SC and thus to check whether European rural development processes are evolving correctly as expected according to theoretical contributions or whether, on the contrary, there is a need for improvement actions in the process. For this purpose, we propose a double analysis through the methodology of Social Network Analysis (SNA) based on primary data collected from stakeholders in rural LEADER areas in Spain and England. To this aim, we introduce a comparative analysis of the rural contexts of Northern and Southern Europe from the point of view of social articulation and the stock of SC from an aspect that has been little studied [21,26,27]. All of this will make it possible to disaggregate both internal and external SC by studying the substructures present in the networks of actors and, therefore, in the territory. In this way, it characterises the state of rural development processes and identifies positive and negative actions through social relations.
To provide an answer to this, Section 2 is devoted to the main theoretical contributions explaining the role and relationship between rural areas, rural development processes and their link to the concepts of SC and social networks. This is followed by Section 3, which presents the selection and characterisation of the study areas, the sample and data collection and the methodology used. Section 4 and Section 5 are devoted to the presentation and discussion of the results obtained in the four case studies. Finally, Section 6 contains the conclusion, where the main contribution of the research is presented, as well as future lines of research to further deepen the knowledge of SC and social networks in European rural development processes.

2. Theoretical Background

Europe is a culturally, economically, socially and territorially rich and diverse continent. Most of Europe’s territory is classified as rural [28] and is home to almost half of Europe’s population, but with large differences between countries, especially if we differentiate between Western and Eastern Europe. All the areas present problems derived from the outflow of the population, such as ageing, low-income levels, feminisation, dependency, etc. [15,28].
To alleviate this situation, in the 1980s, the concept of rural development emerged, which has two main dimensions. On the one hand, there is an economical approach, which has been analysed extensively and which has attracted the most attention in rural areas and in different research studies. On the other hand, there is the social dimension, which has been insufficiently studied and is where concepts such as SC, social networks, social innovation, etc., are included. Based on this dual concept, the EU has endeavoured to reduce the socio-economic problems that rural territories have presented and are still present today through the LEADER methodology from 1991 to the present day, first as a Community Initiative and since 2007 as a Rural Development Programme. The aim of this has been to achieve integrated, endogenous and innovative rural development [29,30] through two strands, one economic and the other social [31].
Linked to this social aspect of LEADER is the concept of SC, which, although not explicitly mentioned in the documents, is believed by many authors to be one of the central elements that facilitate the achievement of the objectives of development policy [11,32,33].
SC has been a concept studied by different authors and disciplines; as it is a multifaceted concept, it is easier to provide an example of it than to define it [34]. However, there is a scientific recognition that tries to link SC with participation in networks, which is called the structuralist conception [35,36,37,38]. It is therefore essential to understand and analyse relational structures in order to measure SC [20,22], which can contribute positively or negatively, as it can be used for common or societal benefit or, on the contrary, for personal gain or the development of clientelistic networks, the latter being analysed in relation to some periods of the programme [21]. Within social networks, it is essential to understand three concepts: leadership, prestige and trust. Firstly, social networks are not created in a balanced way in the network [39]. Therefore, the search for effective leadership in rural areas is fundamental to improving the management of problems, although it is a complicated task [39,40]. Leadership is defined as a person who can influence, motivate and inspire [41]. Prestige, understood as seriousness, experience, resources, position, etc. Therefore, the position that the actors occupy in the network is determined by the relationships they have and their accessibility [42]. Finally, trust is understood as a bet on the future actions of others [43] or an attitude or moral judgement, which arises and is derived from social interactions [44].
SC can be understood as a requirement and/or as an outcome, which is not contradictory [45]. LEADER has fostered the SC from institutions or structures, such as Local Action Groups (LAGs), through participation and relationship building [18]. However, within this dark side of the SC, LEADER has been understood by a few as a tool at the service of elites, lobbies or clientelism [18], and even participation in the LAGs has generated a project class that is not very numerous [13], where access to and control of certain information is understood as power and, consequently, certain social groups are marginalised by not being able to access this information [46]. In order to understand the relationship between the concepts of SC and rural development, these have been studied and linked to the concepts of embeddedness and autonomy or the micro and macro levels [20,47]. Researchers such as Lewis [48], Woolcock [47] or Esparcia [20] argue that SC is best developed at the individual level, although it is a multilevel concept involving interactions at different levels, i.e., it is best measured and quantified at the individual level, but the benefits can be at the collective or community level [48]. Within SC, internal and external cohesion stand out; the former is characterised by SC Bonding, which is linked to social cohesion and internal relations. The second relates to external relations and is bridging and linking SC [49,50]. There is a direct relationship between the evolution and success of rural development processes and the increased stock of internal and external SC. Numerous authors have explained that in order for SC to contribute positively to development processes, it must exist in a balance between SC, as these are not independent of each other, but feedback on each other, are stimuli and are the basis for development processes [20]. Figure 1 identifies the different scenarios that communities or areas can present in relation to cohesion and development related to internal and external SC stocks.
Esparcia [20] argues that in the early stages of development processes, internal cohesion (SC Bonding) is necessary, but that this must evolve and integrate a greater number of external relationships (SC Bridging and Linking) as development processes advance and consolidate. Furthermore, an excess of SC Bonding can have consequences and encourage the consolidation of clientelistic, sectarian or personal networks. Putnam [51] emphasises the idea that SC bonding is positive for getting by but that SC bridging is crucial for getting ahead. For this reason, the balance between high levels of SC bonding and bridging ensures that communities and development processes are articulated and integrated, which guarantees the sustainability and consolidation of the processes. These can be seen in scenario 4 in Figure 1. For this reason, it is important to study and analyse the current stock of rural areas to find out whether development processes are evolving in a sustainable and favourable way.
Finally, after more than 30 years of implementation of the LEADER programme in European rural areas, it has had a very positive impact in terms of participation, endogenous development, democracy, and decentralisation [18,52]. However, there have also been negative aspects of the programme, such as participation, which has been more formal than real [53], the increase in bureaucratisation, the scarcity of funds or less attention from regional governments, together with the aforementioned tool of power and clientelistic networks, which has meant that the LEADER methodology is beginning to be perceived as rigid and poorly adapted to the requirements and needs of rural areas [14].

3. Materials and Methods

3.1. Selection and Characterisation of Study Areas

The first criterion for the selection of the study areas was the fact that they were disadvantaged rural areas, and this is what highlights their consideration, continued over time, as areas for the application of territorial development strategies (LEADER approach) from 1996 to the 2014–2020 period. Four study areas have been worked on, three in Andalusia and one in England. Andalusia is the second largest Autonomous Community (A.C.) in terms of rural area in Spain, with a total area of 87,599 km2, i.e., more than 79% of Andalusia’s surface area is rural and therefore accounts for 17% of the rural area of the whole country [54]. It is also the A.C. with the highest number of farms and family farms, accounting for a quarter of the national total. However, it is in this community where the Gross Domestic Product (GDP) per capita is the lowest (€18,906) [54].
Since the implementation of the European and Spanish rural development programmes, Andalusia has been one of the areas which have benefited most from these aids, as it has been the A.C. which has delimited the most areas and, therefore, with the greatest number of LAGs. In Andalusia, three study areas have been selected with common elements, in that they are disadvantaged rural areas, where rural development policy has been very present since the 1980s through associations, and later with the LEADER and PRODER programmes (Spanish LEADER implemented in rural areas not covered by LEADER itself), which have been maintained to the present day. Based on this framework, work has been carried out in three areas with different economic characteristics (Figure 2). The first study area is the LAG Serranía Suroeste Sevilla (SSOS) (Province of Seville), a rural area with a large territorial division between the countryside and the mountains, where the agricultural sector is predominant, mainly olive trees, and, to a lesser extent, the industrial sector. The second area of analysis is the LAG of Guadix (Province of Granada), where the service sector is predominant and, within this, the tourism sector. Finally, the area of analysis that makes up the LAG of Levante Almeriense (Province of Almeria), where the service sector is predominant, especially tourism. Therefore, we have studied areas that share a set of structural characteristics but which are different from each other from a social and economic point of view.
The study presented here provides an adequate overview of the situation and changes in the three Spanish areas. However, it is also important to have a comparative perspective with other areas in which, under different socio-economic and institutional contexts, development processes with a territorial approach are also taking place. For this reason, the idea was to look for an area in a geographical and institutional environment that contrasts sharply with the three previous areas, hence the focus on England.
The following criteria were considered for the selection of the English study area:
  • Disadvantaged rural areas and, therefore, also beneficiaries of the LEADER programme.
  • Secondly, the number of LEADER programmes managed was analysed. In the Spanish case, the selected rural areas had a total of four programmes; therefore, it was considered that the English rural area should have participated in at least three phases of European programming in the territorial approach.
  • Thirdly, the selected rural area should not be very different from those previously worked in Andalusia in terms of surface area and population.
As a result of the application of these criteria, it was decided to select the Plain Action LEADER rural area, as it had had several LEADER programming periods (since LEADER+), an area quite similar in size, slightly larger in population and with economic characteristics comparable to the Spanish areas. The Plain Actiun area is in the county of Wiltshire, which is made up of a total of 20 community areas comprising a total of 260 parishes (Figure 2).
Based on the latest period (2014–2020), the four study areas have small differences in size (Table 1). The Plain Action area has the smallest surface area, with 1000 km2, followed by the SSOS area with 1581 km2, the Levante Almeriense with 1842.5 km2 and, finally, Guadix with more than 2000 km2. This extension is unevenly distributed in the size of the municipalities that make up the area. For example, the English area has 58 small parishes, as does the Guadix area, with 32. In contrast, the Levante Almeriense area is made up of a total of 13 municipalities, while SSOS is only made up of 8 large municipalities (Table 1). If we analyse the population and density of each of the areas, we find large differences. The English area is the most densely populated of the four areas, with a population density of 118 inhab./Km2. It is followed in terms of population by the Levante Almeriense area with more than 118,000 inhabitants and a population density of 64 inhab./Km2. In third place, SSOS has a population of 97,000 inhabitants and a density of 61 inhab./Km2. Finally, the least populated area of the four is Guadix, with a population of just over 44,446 inhabitants, which, together with the large size of its territory (the largest of all the study areas), means that its population density is 23 inhab./Km2. (Table 1).

3.2. Sample and Data Collection

In the research, actors linked to territorial development processes have been selected regardless of their link to development programmes. Therefore, the actors present in the sample may or may not be linked to LEADER, but in any case, the criterion that defines the population under study is not this link but to develop of their activity (economic, social, institutional or technical) in the framework or in the perspective of territorial development.
From this population, the selection of the sample was based on a basic sampling criterion, the “relevant actors” (equivalent to the term stakeholders) [26,39,55,56,57]. There are three criteria that allow us jointly to define who the relevant actors are, (i) people who are or have been involved in the socio-economic development processes in the territory (from the economic, institutional, social or technical sphere), (ii) has to be recognised as such, either by the key informants or by part of the sample that makes up this set of relevant actors, (iii) the activity of the actor in question must transcend municipal boundaries.
To define the sample of relevant actors, meetings were held with key informants closely linked to territorial development processes. In all areas, the reference person was the manager of the LAG. As a result, four samples of actors were obtained, diverse from a territorial and activity typology point of view, for which each actor in question was considered relevant. For privacy reasons and in compliance with the Data Protection Act, the identity of the actors interviewed cannot be revealed, which is why we work with identifier codes. Each of the resulting samples is the result of the vision of a set of key actors. The reliability of the selection rests on their vision. However, biases may occur because their view may be partial or not as complete as assumed a priori. For this reason, it is necessary to improve reliability and reduce the margin of error, for which a methodological correction has been introduced, consisting of not considering these samples as closed but open. Thus, the actors interviewed have been asked about all those actors they consider relevant, and not only those in the initial sample (which means combining what, in principle, would be a sociocentric approach in the SNA with an egocentric approach, as will be seen later). In this way, all those actors cited, who were not present in the initial sample, and who reach a certain frequency (around 5% of citations) are also considered relevant and are also subject to interview.
In data collection, we have worked with interviews and surveys since we can describe and interpret aspects of reality that are not directly observable, as well as events that have already occurred previously [58]. The survey has a mainly quantitative character and is intended to collect relational information, i.e., the social network of the actors in question. In it, the actors not only assess the presence or absence of relationships with other actors but also, through different scales and for each relationship, they assess aspects such as the intensity or frequency of such relationships.
In our research, we have not established a fixed sample size, given that the population (“relevant” actors) in each territory can be very variable. However, as can be seen in Table 2, the minimum sample size has always been above 80% of the total number of actors identified as such (it should be remembered that one of the criteria for inclusion is that they should be more or less directly linked to the territorial approach to development). Overall, the total number of actors identified as relevant is 186. From this population, the final sample stands at 84% in the four study areas (160 interviewees) (Table 2).

3.3. Social Network Analysis and E-I Index

To test the stock of SC from stakeholders’ social networks, we intend to apply the methodological approach of Social Network Analysis (SNA), which is characterised by its high analytical potential in detecting the structural properties, position and role of actors in social networks. SNA is a formal method used to measure social networks through a set of instruments and techniques to study the social behaviours of individuals through the specific relationships between individuals, groups, associations, etc. [59,60,61]. This is based on qualitative rather than quantitative data [62]. Actors that are part of a social network tend to be generally organised in a formal/informal or individual/collective way. The groups or collectives can be of a wide typology, such as the place of origin of the actors (municipality), the typology of the actor, the concentration of levels of prestige, etc. One of the doubts that arise in the analysis of social networks is to know how these groups relate to each other. This aspect is basic in territorial development strategies, as one of the basic elements in these is the integration between activities and groups, as well as the articulation between the actors of the different territories (included in the LEADER area/region). In social networks, such relationships are usually established based on a series of key actors who, for different reasons, have connections with actors from different collectives. They are both privileged and strategic actors in development. The research presented here is divided into two main methodological sections, which cannot be understood separately, but rather in an integrated and interrelated way. On the one hand, once all the information from all the interviews and the absence or presence of relationships between the different stakeholders had been collected, we worked because of a square matrix (sociocentric approach) with binary information. From this data, a set of SNA indicators has been calculated using the SNA UCINET software to determine the status of the different networks. The selected indicators fall into four groups. Firstly, indicators of network properties where density has been calculated. Secondly, network cohesion indicators, where distance has been calculated. Thirdly, centrality indicators, where the degree of entry and exit, the proximity of entry and exit, intermediation, the centrality of flows and geodesic distance have been calculated. Fourthly, the indicator of reciprocity/bidirectionality of relations has been calculated (Table 3).
Based on the different results, especially the degree of entry and exit, the aim is to quantify the stock of SC present in the social networks in the rural areas under study. The analysis of these indicators is related to the study of the macro level, especially the study of density and reciprocity [39]. Furthermore, these analyses are necessary as a preliminary step to the study of the E-I index (within the ARS methodological approach) for the calculation of bonding and bridging SC, which is related to the micro level [39]. This index is based on the analysis of external (E) and internal (I) relationships of a set of previously defined substructures. By substructure, Esparcia [64] understands a grouping that must respond to clear aspects differentiated according to a series of attributes such as, for example, the gender of the actors, the territory and even the degree of prestige or other attributive characteristics. Therefore, a total of eight substructures have been analysed in this index, such as:
  • Stakeholder typology: Linked to the stakeholder’s main activity, i.e., institutional, economic, social or technical.
  • Age and gender: The literature links more traditional and less open behaviours to men and older age groups. However, women and younger age groups are linked to more innovative and open-minded behaviours. In terms of age, it has been decided to work for this study with four age groups: ≤35 years, 35–45 years, 46–60 years and >60 years. The first age group includes young people between 18 and 35 years old, although the presence of young people is very low in all areas.
  • Level of education: The actors’ level of education has been grouped into three groups: primary, secondary and higher education.
  • Prestige: Also understood as expertise, resources, position, etc., can be present in a specific organisation and in a particular group or individual. Networks and the position of actors in them are not equally accessible to all members of the community, as participation and interest are different for each [42,65]. Prestige has been synthesised into four groups: Very Low–Low, Low–Medium, Medium–High and High–Very High. The division made to obtain each of the four main levels of prestige (Degree In of the SNA) was based on the mean and standard deviation. Firstly, the arithmetic mean divided the sample in two. Secondly, the standard deviation was calculated for the sample. Thirdly, from the division in two of the samples, we proceeded to the addition or subtraction of a standard deviation; this allowed us to subdivide two each of the two initial groups and, therefore, to obtain four groups of prestige according to their result.
  • Trust: Understood as affinity, a closer and stronger relationship between actors. The levels have been grouped in the same way as for prestige: Very Low–Low, Low–Medium, Medium–High and High–Very High.
  • Link with the LEADER programme: The implementation of the programme through the LAGs has tried to promote and develop local cooperation and a link with the different structures of the programme as well as with the programme itself. This sub-structure, therefore, distinguishes between stakeholders linked and not linked to the LEADER programme.
  • Counties or traditional subareas: The area where LEADER has been applied has a supra-municipal scope. To a large extent, this vision, greater than that of the comarca, is promoted by the EC through sufficient critical mass, as well as historical, cultural and social background, etc., which has led to a minimum of two comarcas being integrated into the areas of application of the rural development programme. This has led to LEADER areas being characterised by a certain artificiality. Despite this, according to the tendency of the theoretical–conceptual approaches that can be read, it would be expected that in the LEADER areas, there is a high degree of relational openness between the different substructures that make up the LEADER area. For this substructure, the LEADER area of each zone has been used as a basis, but several sub-areas have been identified. It has therefore been decided to define a delimitation for the study of the openness of the relationships according to one, two or three county areas or territorial substructures. This is because it is of interest to know what the result of the relationships is within and outside each of the areas, i.e., whether internal relationships predominate within each sub-area.
This index is based on the analysis of external (E) and internal (I) relations of previously defined substructures. The result obtained varies between −1 and 1. The negative result is obtained when most (or all) of the relations of the substructures are internal; that is, they would approximate the maximum expression of homophily. However, when the result is positive, it means that most of the present relationships are external. This index does not differentiate between the direction of the relations, that is, if they are unidirectional or bidirectional, but rather on the presence between each pair of nodes. This is not a problem, however, as the bidirectionality of relationships will already have been analysed in depth with the reciprocity indicator. From the results extracted from the E-I index, it was decided to work with a total of four indicators:
  • Observed E-I index: This was measured through a mathematical formula in which the difference between external and internal relations with respect to the total of possible connections was calculated.
  • Expected E-I index: The concept of chance entered this index if the distribution of relationships of each actor in each of the substructures was produced by chance without specific preferences for each of the substructures defined and studied.
  • The study and comparison of these indexes for each of the substructures were very interesting since we analyzed to what extent the observed value adjusted (or moved away) from a random distribution.
  • Proportion of external relations: This indicator reflected another result of the E-I index and gave us a clear and simple idea of the degree of global openness of each of the substructures in each social network of each area. The data was extracted from the mean of external relations calculated for the E-I index.
  • E-I index for each of the selected substructures: These results, which again oscillated between −1 and 1, showed to what extent there was a predominating tendency towards homophily or openness in each one of the delimitations. The same results could have been obtained for each one of the actors of the social network, but in this case, it was decided to work in groups since an important set of SNA indicators.
Apart from these indicators extracted in the E-I index, it was decided to complement these results with two statistical calculations that are based on the p-value (p < 0.05) and the Kolmogorov–Smirnov test.
  • p-value is a measure of statistical significance or authenticity (the smallest possible level that can be chosen) and is defined as the probability of obtaining a noticeable result in that substructure. It permits the acceptance of the starting hypothesis or null hypothesis. The results of this index are directly related to the size and number of groups or subgroups, in our case, relationships or actors within each of them. This value can indicate that there are no significant statistical differences between the observed and expected values so that the differences (in these cases) can be blamed on chance. Although a statistically significant result could be achieved in some analysis of substructures, in this case, it would be necessary to reduce the number of substructures to study. If the p-value result is greater than the significance, it indicates that the probability of being wrong in the case of rejecting the null hypothesis will be greater, so the initial or null hypothesis is accepted and is identified with the symbol H0. If, on the other hand, the baseline hypothesis is rejected, the alternative hypothesis is accepted and is identified by the symbol H1. The fact that the values obtained in the hypothesis test are negative only indicates that the expected values do not differ significantly from the observed values (although they do offer a series of trends and ideas that will be discussed) but does not mean the rejection or in-validity of the theoretical and conceptual relevance of the observed E-I index.
  • Kolmogorov–Smirnov Test is a non-parametric test with which the goodness of fit is determined. In other words, this test measures the degree of agreement between the distribution of the dataset (the sample) and a specific theoretical distribution. The objective of this test is to determine if the data studied comes from a population that has a determined theoretical distribution. It is a matter of answering a question, do the observations of the sample come from some hypothetical distribution? This test has a set of advantages for which it has been selected. For example, it is more powerful than chi-squared, it does not require the grouping of data, and the statistics derived from the test are independent of the expected frequency distribution, meaning that the results only depend on the size of the sample. If the observed frequency distribution is consistent with the theoretical distribution, it has been indicated as H0 (the data follow a normal distribution). If, on the other hand, it is not consistent with respect to the theoretical distribution, H1 has been set (the distribution of the data is not normal).
The E-I index and its delimitation in sub-structures allow differentiating a set of internal and external relationships. If the relationships are similar or different, it is possible to know the degree of openness within each social substructure, which is of great importance and interest to identify the state of the social networks in that rural area and, in short, to identify the different types of SC present in the territory. Within the processes of building SC in rural areas, it is of great interest to know and analyse the set of internal and external relationships present in the social network, i.e., from this differentiated relational base, two major typologies of SC can be clearly identified, SC bonding (internal relationships) and SC bridging (external relationships).

4. Results

In this section we will approach the state of the social networks of the different study areas through two approaches within the SNA methodology. Firstly, we will carry out a general characterisation of the social networks of the 4 study areas based on a set of indicators previously explained in Section 3.2. Secondly, based on the analysis carried out previously, we will proceed to study the stock of Bonding and Brindging SC through the E-I index, but deepening the individualised analysis of each substructure.

4.1. Indicators of SNA: Comparative Analysis

The approximation of the state of the social networks of the four study areas has been carried out through the calculation of ARS indicators, where the centrality typology stands out. The results show significant differences in relation to the social networks between stakeholders and, indirectly, give us an idea of SC.
In Table 4, we can observe the individualised results for each area according to the selected indicators. Within these, it is important to note how the density of relationships in each network is different, but the SSOS and Plain Action areas stand out positively, as they have denser and, therefore, more cohesive networks. Another important indicator is prestige within the network, which is more present and distributed in the Plain Action network and, to a lesser extent, in the Spanish areas. Reciprocity is interesting to analyse, as it is an indicator that provides us with data on the bidirectional recognition of relationships. The SSOS and Plain Action areas stand out for their high levels of reciprocity between stakeholder relationships.
In Table 5, based on the ARS indicators in Table 3, we have identified whether these values are high, medium and low, according to the intervals marked in the methodological section. Three scenarios can be distinguished according to the ARS. Firstly, the Plain Action area shows very positive indicators due to the high density of the network, prestige, proximity and reciprocity, which indicates a cohesive network with great interconnection between stakeholders. Secondly, the areas of SSOS and Guadix, respectively, show very similar scenarios with high cohesion, medium prestige and high reciprocity. A third scenario, the Levante Almeriense, with a social network that presents negative results and indicates a lack of cohesion, low closeness between stakeholders and little reciprocity, which indicates a lack of recognition between them and a problem of cohesion and social relations in the region.

4.2. Relationships and Stock of Social Capital: E-I Index

Within the network of the social network and the stakeholders that make it up, a set of substructures can be identified and analysed to identify roles or functions, among others, delimited by a set of attributes. Within the analysis, an attempt has been made to contrast the relationship patterns of these substructures present in the network but differentiate between the set of internal and external relationships. In this way, the degree of openness within each selected substructure and, in short, the stock of SC. As has been analysed on a theoretical basis, within the processes of building SC in rural areas, it is of great interest to be able to know and analyse the set of internal and external relations present in the social network.
In this section, through two differentiated analyses, the different presence of the typology of SC present in each of the study areas will be studied and identified since, depending on the level within each typology, the areas can clearly advance in the development processes or, on the contrary, find themselves at a standstill. To have a more detailed study and analysis of each of the structures that have been analysed, each of the eight substructures will be studied individually.

4.2.1. E-I Index: Stakeholders Typology Substructure

One of the first substructures analysed is based on the typology of each of the stakeholders that make up the networks, for which, as in the rest of the analyses that have been carried out, they have been grouped into four groups: institutional, economic, social and technical. This attributive characteristic is very important and is very present both in development processes and in the day-to-day life of rural populations. On the one hand, in development processes and programmes, coordination and cooperation between the different actors present in rural territories have been encouraged, and a special effort has been devoted to it. On the other hand, in rural areas, the typology of each actor is very present and influences the type of relations they maintain with the rest of the stakeholders and rural population.
The results of the E-I index are shown in Table 6; in the areas of SSOS and Guadix, the expected value is higher than the observed value, very close to 0.5. The Levante Almeriense shows positive data with respect to articulation, while the Plain Action area obtains a negative result with a clear lack of relational interaction between actors. If we analyse Table 6, the statistical significance test for the three Spanish areas, the result is positive since H0 is accepted, i.e., the p-value result is higher than the significance, therefore, it cannot be said that the results have statistical significance. On the other hand, in the case of Plain Action, the result is the inverse (H1), the p-value is lower than the significance of the contrast, so H0 is rejected, and the result obtained in the English area is statistically significant. The same results are found in the Kolmogorov–Smirnov test.
A first idea to bear in mind is that medium-high and high degrees of openness are observed in some groups, although the trends vary according to the areas of study. The overall trend for institutional actors is very positive, with an average E-I of 0.61. Regarding economic actors, the first idea offered by this group is obtained through the overall average value observed, which indicates that this is the substructure with the lowest openness value of all the groups (E-I = 0.36). After the institutional actors, the social actors are the group with the highest average observed openness index (E-I = 0.60). Finally, technicians, together with economic stakeholders, have the lowest overall average index of openness (E-I = 0.368), although there are major differences between the four areas of study which mean that these groups, in some cases, behave in a very open or homophilic manner.

4.2.2. E-I Index: Gender and Age Substructure

If attention is paid to the E-I index by age groups (Table 7), it is largely influenced by the greater or lesser presence of young people, hence the greater or lesser degrees of openness. In general, the results obtained in the E-I index are related to the sample of actors by age in the study areas, especially burdened by the lack of young people as stakeholders.
Young people are the most open age group because of the smaller number of people and because they interact with larger groups. In the SSOS area, they reach a value of 1, while in the English area, it is 0.72, reflecting very high openness data. The other group that also has a high E-I index, showing openness in their relationships, are older actors (>60 years old). As with young people, the limited number of people within this group would be a conditioning factor for most of their relationships to be with other actors outside their age group. In between, although in some areas they are the most open group, is the 36–45 age group. Regarding the calculation of statistical significance, in the case of the three Spanish areas, the p-value is lower than the significance, so it can be said that there is statistical significance. On the other hand, in the case of Plain Action, given that the p-value is greater than the significance, the null hypothesis is accepted, and we cannot say that there is statistical significance. A similar scenario is present in the goodness-of-fit test. In the three Spanish areas, the observed frequency distribution is not consistent with the theoretical distribution (not a normal distribution); while in the case of Plain Action, the result indicates a distribution of observed frequencies consistent with the theoretical distribution (normal distribution).
With respect to gender, the presence of women in the social networks of relevant actors is quantitatively lower than that of men. If we observe the measure of statistical significance (p-value) (Table 8) in the case of the three Spanish areas, the initial hypothesis has been rejected, and the null hypothesis is accepted, so there is statistical significance. However, the observed frequency distribution of the three areas is not consistent with the theoretical distribution, so it is not a normal distribution. In the case of the British area, the presence of women in the social network is greater than that of men, although, in the statistical significance analysis, the null hypothesis has been accepted since the p-value is greater than the significance (no statistical significance). While in the Kolmogorov test, the frequency distribution observed is normal, as it is like the theoretical distribution. With respect to the general results of the degrees observed for the social networks (men and women), in all cases, the results are negative. The truth is that in the case of the Spanish areas, these results are strongly conditioned by the excessive prominence of men over women, which explains the very negative results of this index. While in the Plain Action area, the overall observed degree is almost 0, which indicates a balance between internal and external relations between the two groups, also thanks to the balance in the sample.

4.2.3. E-I Index: Level of Education Substructure

Another of the attributes that the literature highlights as important in development processes is educational attainment. It is worth remembering that this element stems from human capital and has been a fundamental element in the development of any society. This fact emphasises, in the four study areas, the high presence of actors with higher education in the network, although in Levante Almeriense, this education is less marked.
If we study the results obtained in the E-I index according to the levels of study, in the case of the value of openness observed, we find small differences in the case of the Spanish areas and more marked differences with the Plain Action area (Table 9). In the case of the three Spanish areas, they move between values close to zero (a certain balance between internal and external relations within each group) or very low openness. In the case of the English area, the observed and expected results do not vary excessively either, but there is a clear tendency towards homophily (−0.767). In this last case, it should be remembered that the sample of actors in each group is the most dispersed of all, as there are no actors with primary education, very few with secondary education and almost 90% with higher education. This is a case where the sample again influences the results of the E-I index.
These results highlight the fact that education remains an element of social discrimination in any area and in a disadvantaged rural area. The overall mean observed for the four study areas shows a clear trend towards homophily (−0.141), although largely marked by the very negative Plain Action result. The area with the greatest social permeability is the area of Almeria, which coincides with a more diverse sample in the formation of its actors, although this interaction between actors cannot be considered sufficient.
This trend is also clear when looking at the percentage of external relations, although in none of the four areas does it account for more than 65% of the total number of existing relations. There are contrasts. The area with the fewest external relationships is Plain Action, with only 12% of the relationships, which indicates very few external relationships between the different actors with different levels of education. In the case of the Spanish areas, these percentages are much higher. In the case of Guadix, it does not reach 50%, but it is close, which is almost a tie between the two relationships. The areas where external relations are higher than internal relations are SSOS and L. Almeriense, with 52% and 63%, respectively. If we also analyse the statistical significance through the p-value in each of the study areas (Table 9), in three areas, including SSOS, Guadix and Plain Action, the p-value is lower than the significance, so H0 has been rejected, and the alternative hypothesis has been accepted.
A closer look at the E-I index in each of the substructures shows that in all the areas of study, the group of actors with university studies are the least permeable and the least open-minded. In three of the four areas, they obtain negative results, although the result for these actors in the Plain Action area is truly worrying, with −0.876. In the areas, primary and secondary studies are the most open-minded and, therefore, with the highest number of external relations, Whereas higher education has the most internal set of relationships and, therefore, scores on the E-I index between 0 and −1.

4.2.4. E-I Index: Prestige Substructure

Throughout much of the ARS analysis, the importance of the degree of entry has been highlighted, which can be linked to the prestige of the actors in the network. It is, therefore, a highly salient indicator, as the sample of stakeholders can be easily identified with what could be considered elites in the rural development processes in each of the study areas.
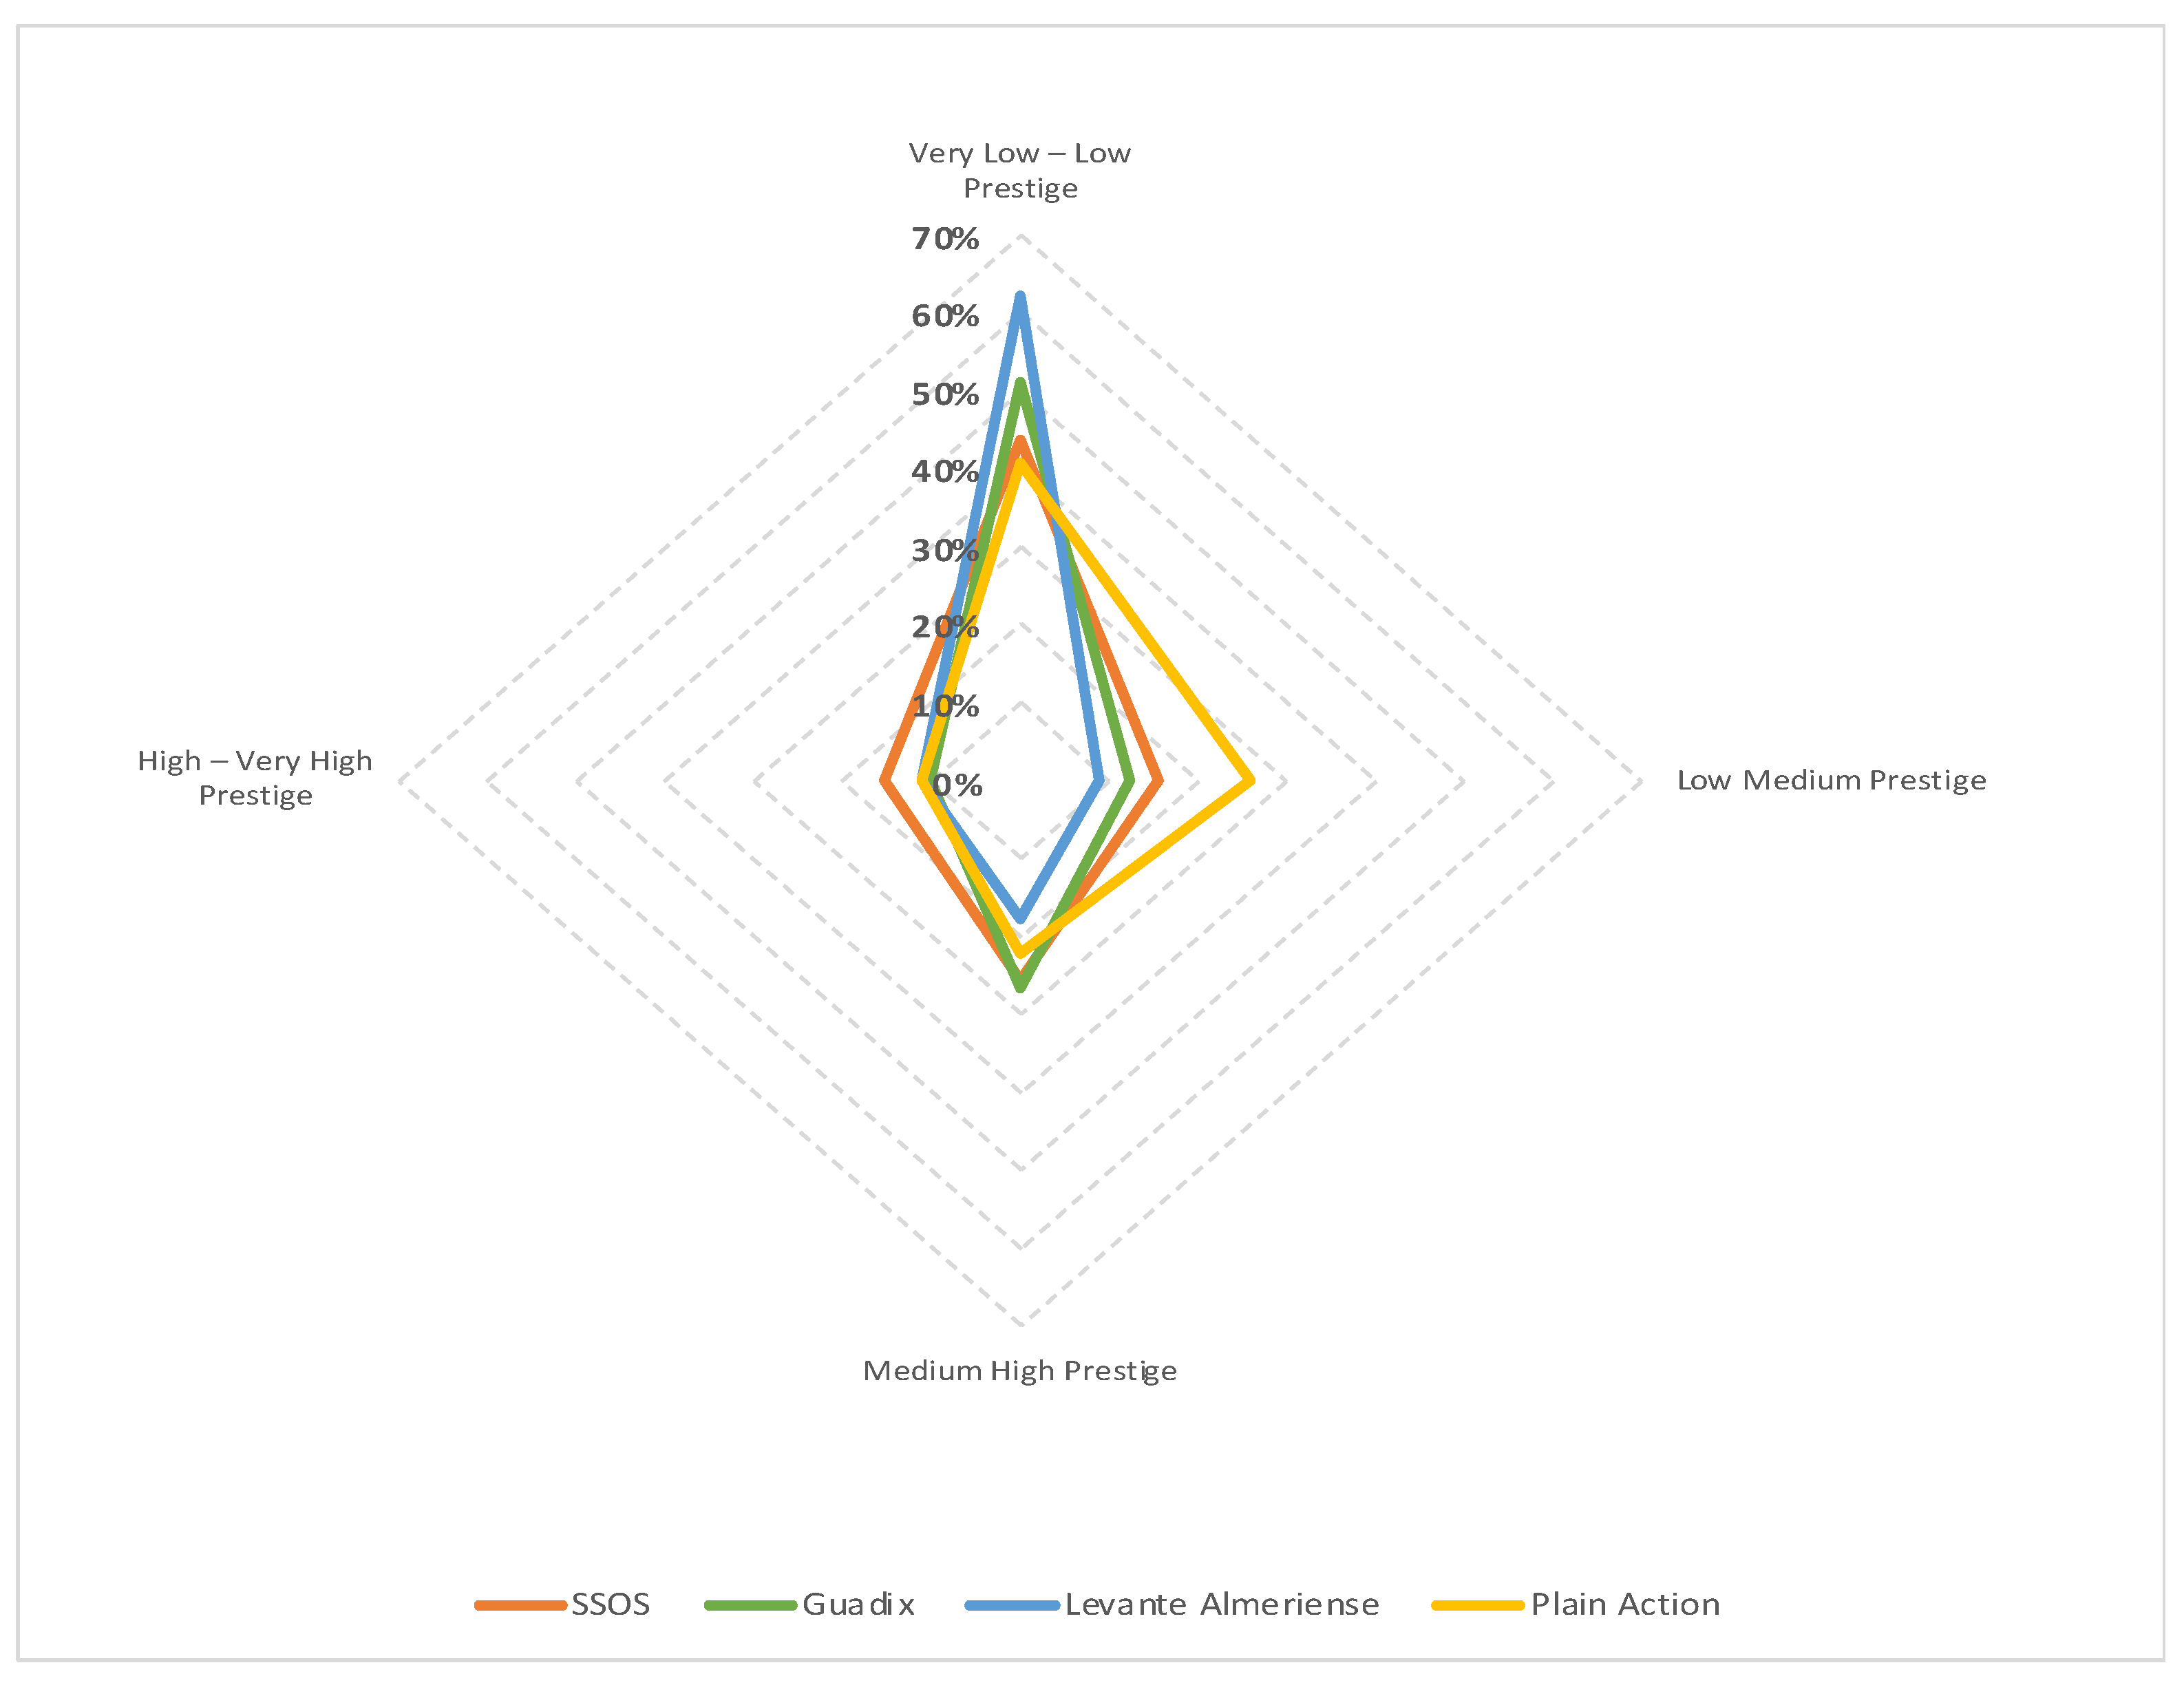
It is, therefore, important to know the distribution of actors in each of the study areas according to the previously defined levels of prestige (Figure 3). Approximately all four study areas have a sample that behaves (with some exceptions) in a similar way. If we focus on the study of the low average level of prestige in the different areas, it is true that, on average, this is one of the subgroups with the lowest percentage of actors (16%), except for Plain Action, which accounts for almost 30% of the actors. However, if we add to this the percentage of actors in the sample who already said they had a Very low–low prestige, in some cases, we already have more than two-thirds of the sample, especially in the case of Almeria (71%) and the English area (67%). This is a rather negative result since most of the actors obtain levels of prestige between very low, low and medium-low. If we look more closely at the two substructures where the levels of prestige are highest (medium-high and High–very high), we can see that the first of these is where the second highest percentage of actors in the samples is concentrated (except in Plain Action, where it is Medium Low). The areas with the highest percentage of actors concentrated in the medium-high level of prestige are Guadix and SSOS, with 27% and 26%, respectively, followed by Plain Action (22%) and L. Almeriense (18%). As for the last substructure (the most important of all), which brings together the high/very high levels of prestige, it can be observed that it is the one with the lowest percentage of actors in all areas (especially in L. Almeriense). If we add the two substructures where prestige is higher, we can see that the areas with the highest number of actors are SSOS (40%) and Guadix (37%) and, at a certain distance, Plain Action (33%) and Levante Almeriense (29%).
If we look at Table 10, which shows the index observed for the degree of entry (prestige) for the four areas, the result is positive in all of them, although with nuances. The most open-minded result is that of the Almeria and British areas, with 0.333 and 0.301, respectively, followed by Guadix (0.273) and SSOS (0.225). In three of the areas, the observed index is lower than expected (SSOS, Guadix and Plain Action), while in the case of Levante Almeriense, the observed result is higher than expected (Table 10). Regarding the external connections, all the areas have very similar results above 60%, especially the areas of Almeria and English, with values of external relations above 65%. Regarding the result of statistical significance offered by the p-value, it must be explained that in two study areas (Guadix and Levante Almeriense), the null hypothesis (H0) has been rejected, and the alternative hypothesis (H1) has been accepted since the result of p-value has been lower than that of significance, i.e., there is statistical significance in these two study areas. While in the case of SSOS and Plain Action, the null hypothesis has been accepted, so it cannot be assured that there is statistical significance.
Before delving into the degree of openness and homophily of each of the prestige sub-structures, several nuances must be made before inter-predicting them, as this is an attribute that only has input and not output relationships, so the results must be interpreted with great caution. This is even though the E-I index calculation does not take into consideration the direction of the relationships between actors. This means that a maximum degree of openness or homophily does not mean the same as before. A maximum degree of openness (1) would indicate that this collective does not receive any relations from within the substructure itself, i.e., there would be no internal recognition (null). Whereas a maximum degree of homophily (−1) would indicate that all relations would be internal, i.e., there would be no recognition by the other actors in the other substructures. This last scenario presents great difficulties for the social substructure since we would be dealing with an isolated group and a lack of relational permeability between other collectives or subgroups.
Table 10 shows the degree of openness of each of the substructures according to prestige and the index observed for each of the study areas, which is why each of the substructures will be analysed in detail. The lowest level of prestige is the least open of all, while the highest levels of prestige show more positive levels of the E-I index.

4.2.5. E-I Index: Trust Substructure

If the previous degree of entry was linked to the prestige present in the social network of actors, the current section is related to the degree of entry but to the degree of trust between the actors in the societal network. The concept of trust is understood as those closer relationships between actors, where there is a higher degree of trust and, consequently, they are less numerous than prestige relationships, as we have seen throughout this chapter. These closer and more “exclusive” relationships between actors are of great importance, as they are much more stable channels between them and, therefore, where information is transferred in a more agile, direct and secure way. As was done for the previous indicator of the degree of entry (prestige), it has been decided to maintain the same classification of the substructures in these four groups/intervals (calculating the mean and standard deviation for each of them). The matrix from which this indicator is based is less numerous in terms of both the number of actors and relationships, which is logical, as the relationships are much closer, closer and not as assiduous as the previous ones.
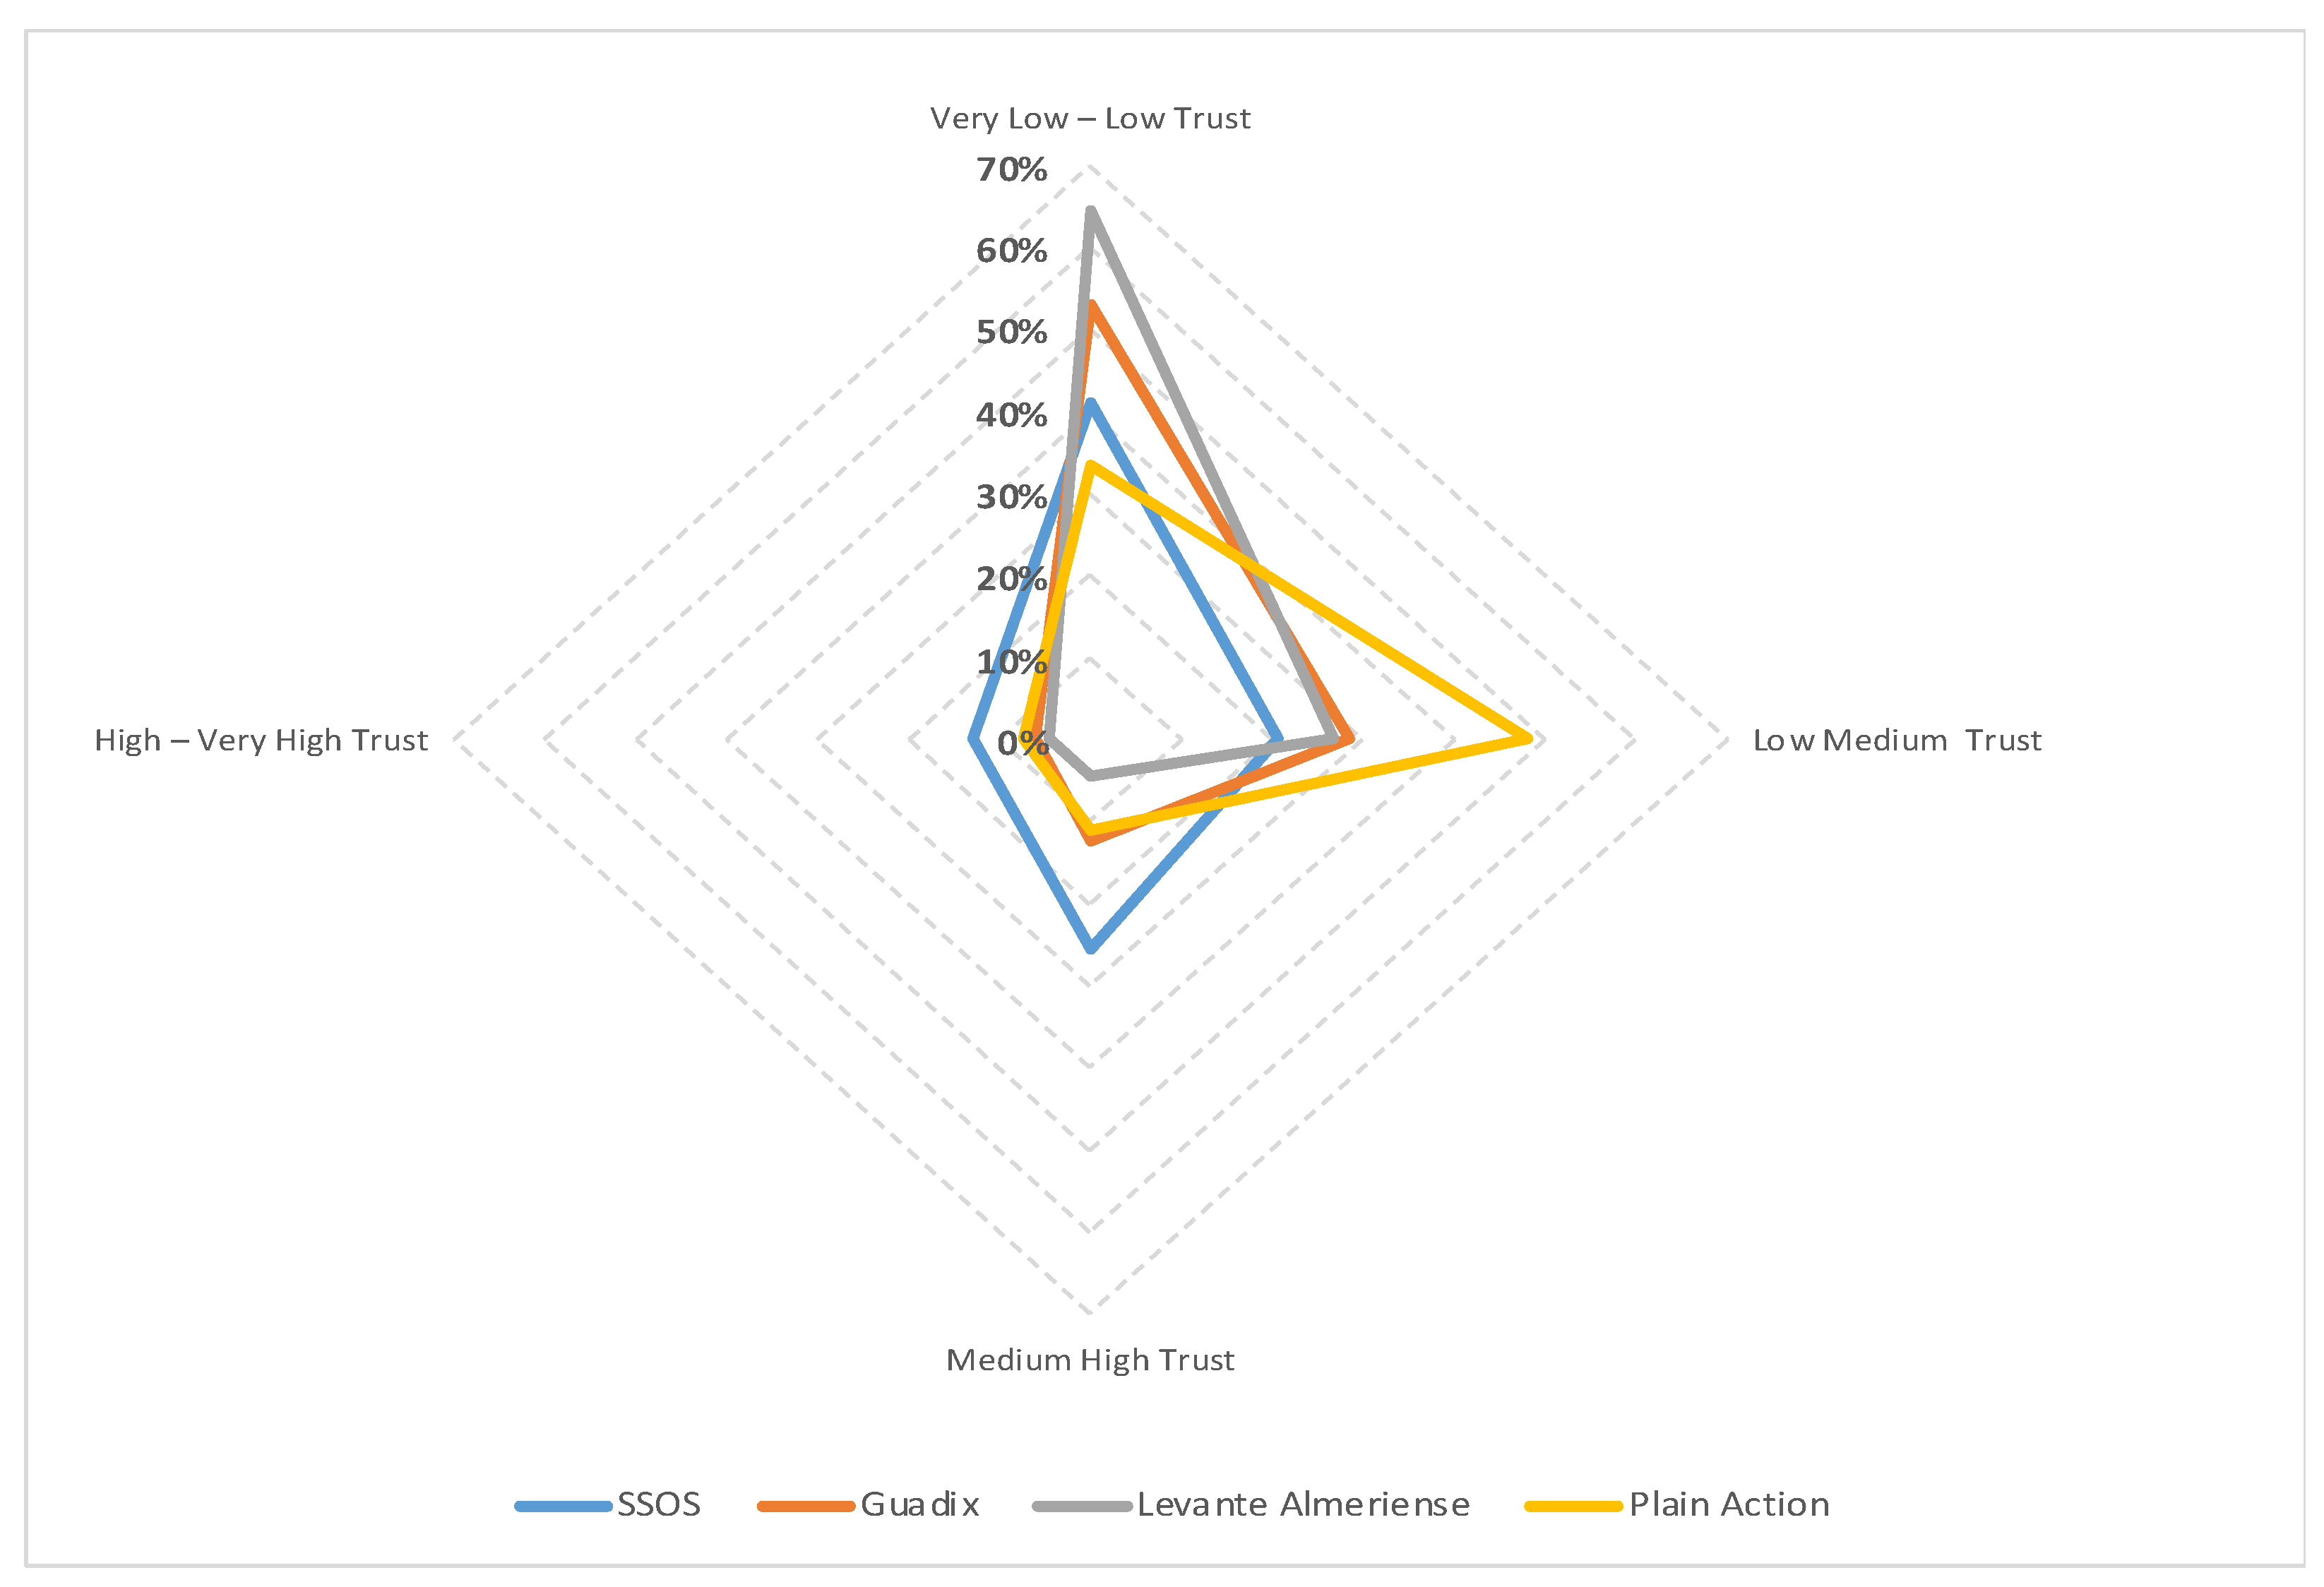
Figure 4 shows the distribution of the trust relationships of all the networks in the study areas. It can be seen how the High–Very High trust relationships are the least numerous in all the study areas, although the SSOS area stands out positively, both in the concentration of High–Very High and Medium High relationships, which is very positive. The concentration of confidence in the Plain Action area also stands out, which is mostly medium–low. The areas of Guadix and Levante Almeriense are the ones with the highest levels of very low–low confidence and the ones with the lowest overall network confidence level, above 80%.
If we look at Table 11, which shows the observed and expected index for the degree of entry (strong ties) for the four areas, in all of them, the result is positive, so all of them show a tendency towards openness, although not all of them with the same intensity. The most open-minded area is Plain Action (0.424), followed by Guadix (0.353), SSOS (0.179) and Levante Almeriense, with a result very close to 0, which indicates a very balanced relationship between internal and external (0.027). In Guadix and Plain Action, the observed index is higher than expected (0.100 above approximately in each case), while in SSOS and Levante Almeriense, the observed result is below what was expected, especially noteworthy in the case of SSOS, which varies by 0.300. As far as external relations are concerned, in all areas, they exceed 50%, so it can be said that external relations between the different substructures predominate. With respect to the result of statistical significance offered by the p-value, it must be explained that in three study areas (Guadix, Levante Almeriense and Plain Action), the null hypothesis (H0) was rejected, and the alternative hypothesis (H1) was accepted, since the result of the p-value was lower than that of significance, i.e., there is statistical significance in these two study areas. While in the case of SSOS, the null hypothesis was accepted, so it cannot be said that there is statistical significance.
The openness index of each of the substructures will be analysed in relation to the strong ties in each of the study areas, although the same considerations that were explained in the previous section for prestige must be considered. In the four areas, the lowest trust relationships are the least open and most internal, while the highest relationships are those with the greatest number of external relationships.

4.2.6. E-I Index: Link to LEADER Programme Substructure

Based on the classification made in the previous sections on prestige and trust, we have proceeded to analyse the behaviour of the sample of actors according to their link to the LEADER programme for all the study areas. 
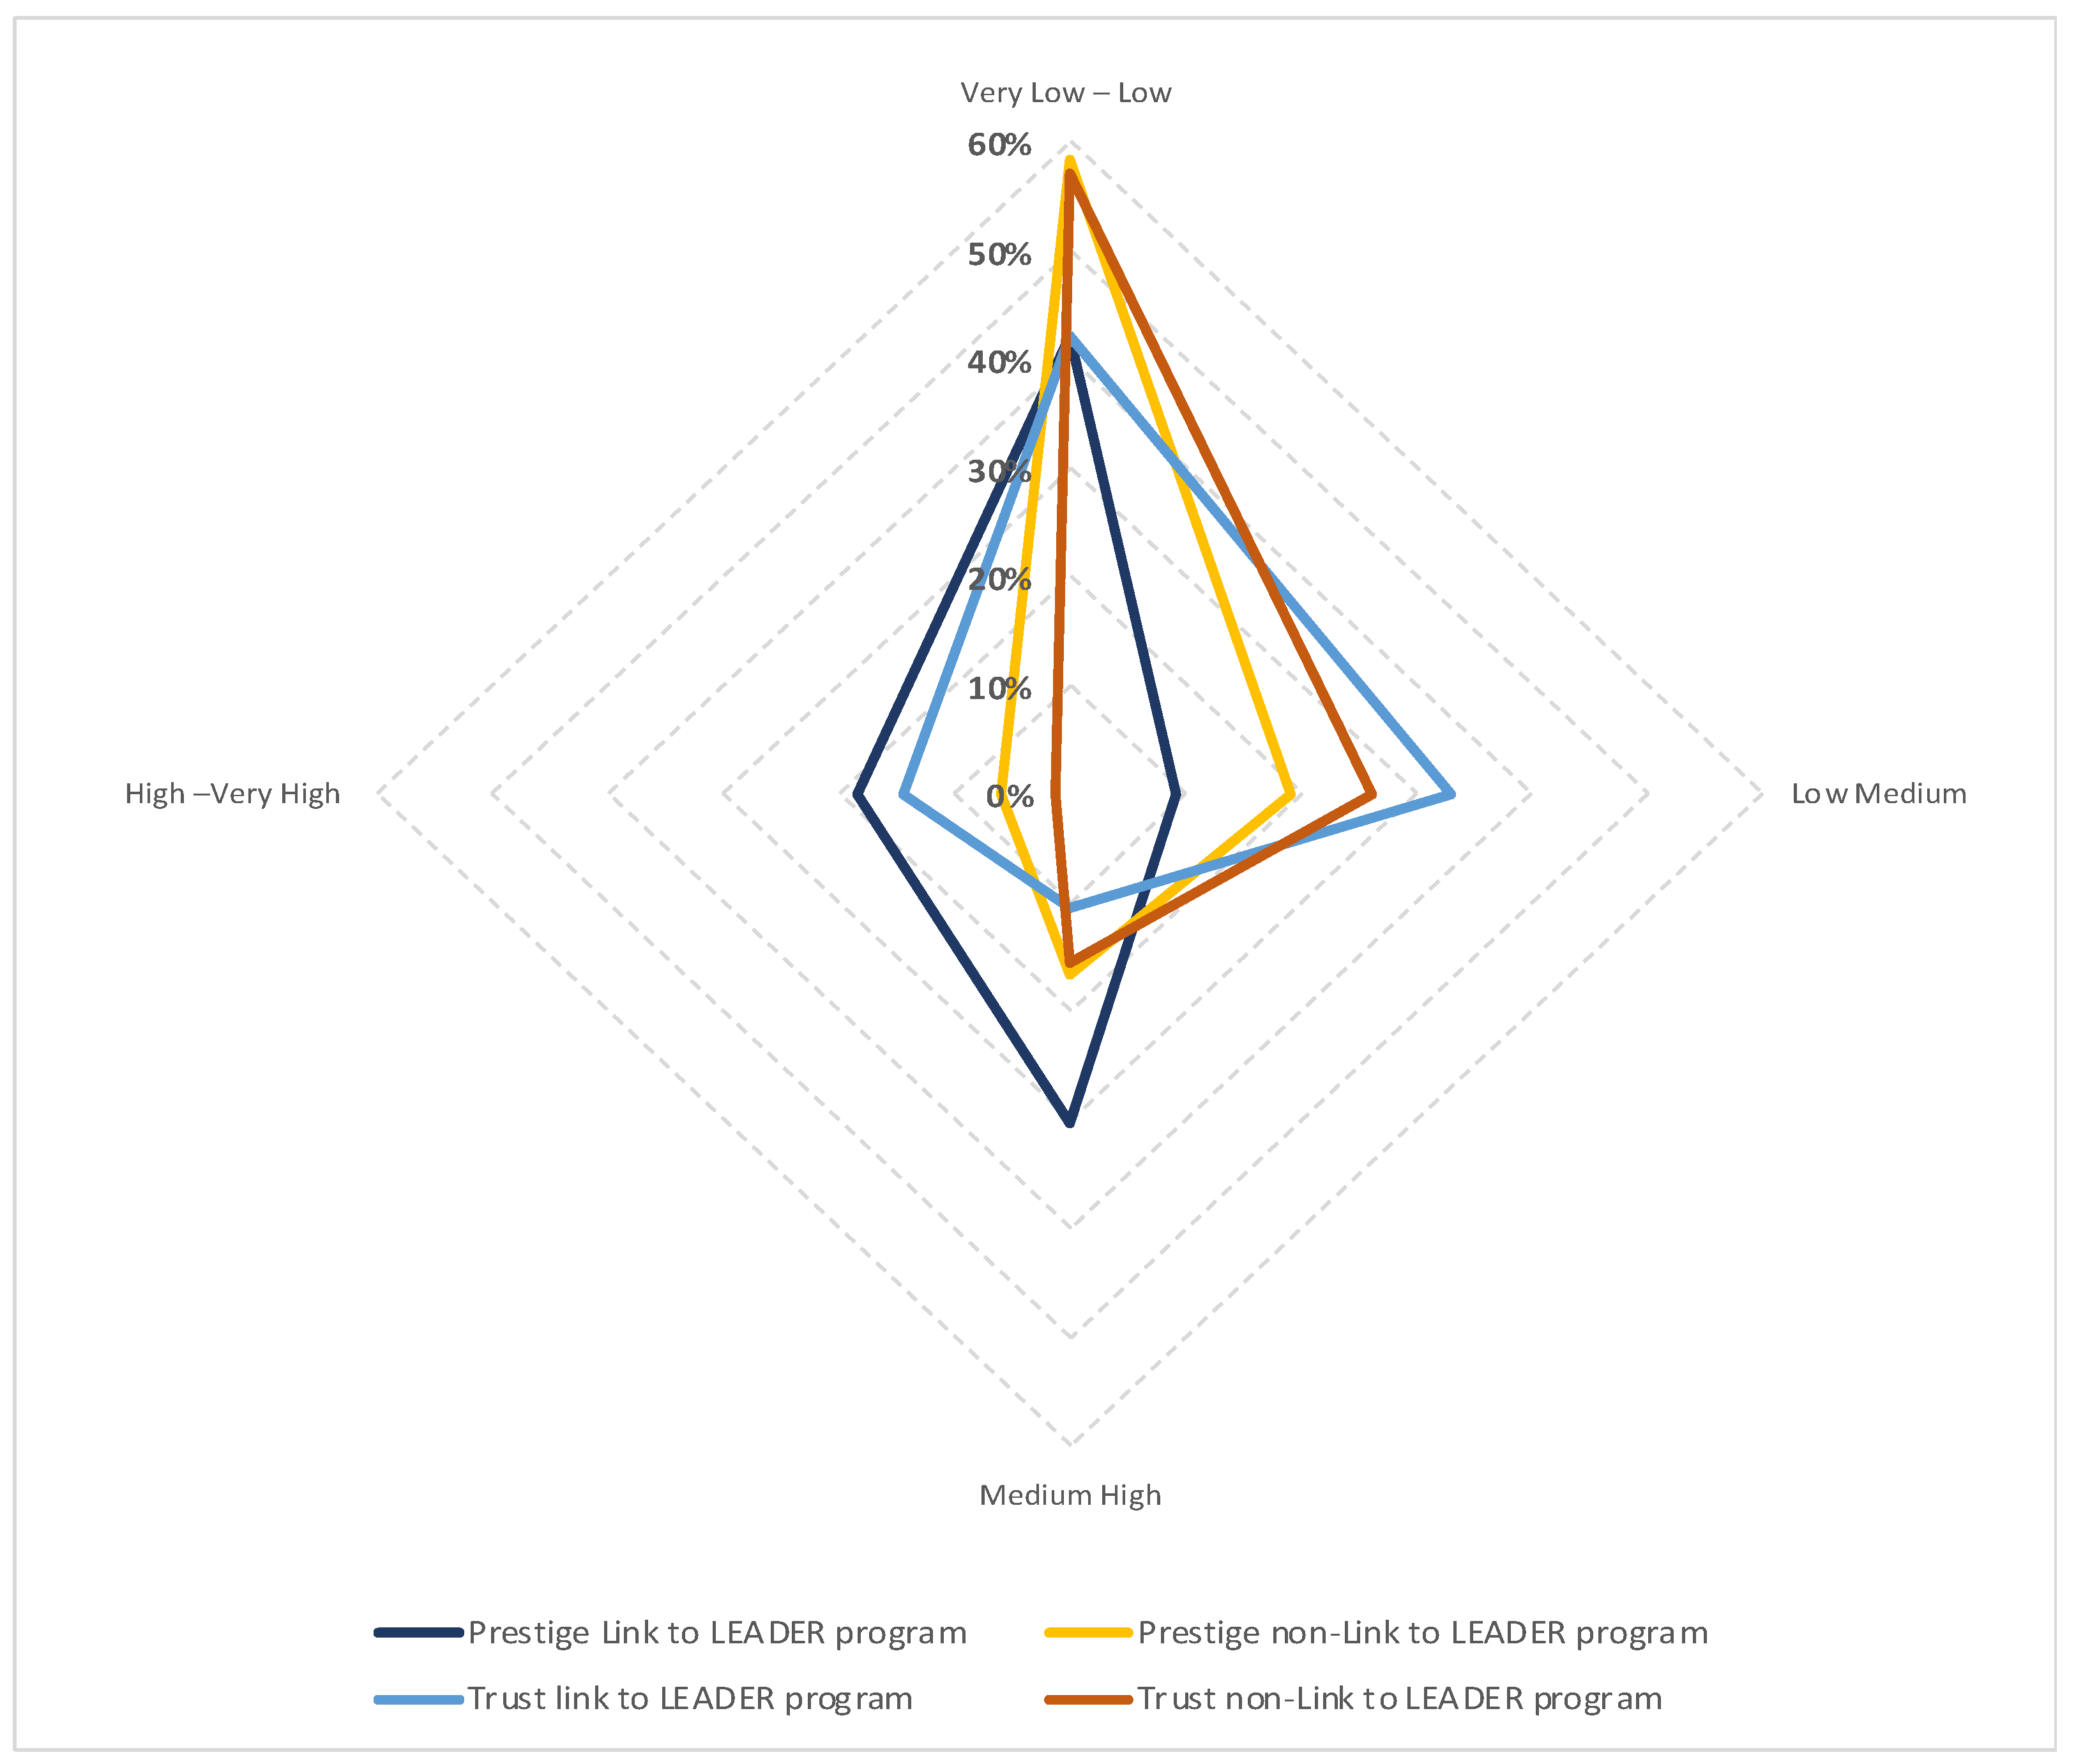
Figure 4 shows the distribution of the relationships of trust and prestige, differentiating between those actors who are and those who are not linked to the LEADER programme.
Figure 5 shows the concentration of the attributes of prestige and strong ties (according to their intensity) between actors linked and not linked to the LEADER programme, the sum being 100% in each case. In terms of prestige relationships, different behaviours can be observed between the two groups of actors. On the one hand, actors linked to LEADER concentrate a smaller number of prestige relationships of lower intensity (null-low and medium-low), accounting for 51% of the total relationships. On the other hand, actors not linked to LEADER have a higher proportion of prestige relationships in these two intervals, reaching 77% of the total number of relationships. In the most intense prestige relationships (Medium-High and High–Very High), it can be seen how the actors with a link to LEADER concentrate a higher percentage of relationships in these two intensities (49% compared to 23% for actors not linked to LEADER). This is clearer in the relations with a higher prestige (High–Very high) where the difference is very large between the two groups. These results show that LEADER actors have not only higher levels of prestige than non-LEADER actors but also higher levels of prestige.
Regarding the relationships of trust between actors linked to LEADER or not, both groups present a scenario that varies considerably from that presented in the analysis of the relationships of prestige, especially in the group of actors linked to LEADER. Regarding trust with a lower intensity (Null–Low and medium–low), in the case of actors linked to LEADER, they concentrate a percentage of relationships that reaches three-quarters of the total trust network (75%). This represents a considerable change in trend if we compare it with the results that were concentrated for these same values in relation to prestige. In the case of actors not linked to LEADER, it can be observed that the percentage of these lower values of trust also increases to 85%. In both cases, the percentages of both trust and prestige relationships are grouped in the Null-low interval, with practically identical results in the two analyses. If we analyse the most intense confidence intervals (Medium–high and High–Very high), we can see how the actors linked to LEADER concentrate a higher percentage of relations in these intervals, 25% compared to 16% of those not linked to the programme; although there is a greater difference in the distribution of the percentage, as those linked to LEADER concentrate 14% in the highest intensity compared to 1% of those not linked to the programme.
To complete the study of the behaviour and positions of the actors in relation to the LEADER programme, a final study was carried out in relation to the degree of openness in each of the selected substructures through the E-I index. If we look at Table 12, three of the four study areas show negative results, i.e., there is an endogamic and homophilic tendency. This trend is more marked in the Plain Action and Levante Almeriense areas (−0.096 and −0.083) and to a lesser extent in the Guadix area (0.010), as it presents a trend very close to 0, which can be understood as a balance between the input and output relationships. SSOS is the only area that shows an opening behaviour (0.048), although it is very small, and it could almost be said that there is a certain balance in the relationships. If we look at the percentage of external relations in each of the groups (Table 12), the stagnant situation of SSOS and Guadix is very clear, i.e., external and internal relations represent 50% each. Whereas in the case of L. Almeriense and Plain Action, they show a higher percentage of internal versus external relations (52% versus 48%). Regarding the result of statistical significance offered by the p-value, it must be explained that in the four study areas, the null hypothesis (H0) has been rejected, and the alternative hypothesis (H1) has been accepted, i.e., the risk of being wrong is very high; therefore, there is statistical significance in the four study areas.
After analysing the different aspects related to the degree of openness, external relations, significance, etc., the index of openness of each of the substructures has been analysed in relation to the linkage of the actors to the LEADER programme in each of the study areas. Two main trends can be observed. On the one hand, the one presented by the three Spanish areas (but each with a marked intensity). In each of the Spanish areas, the substructure of actors linked to LEADER has a negative value, which shows that they have an endogamous and/or homophilic tendency. This tendency in the three study areas cannot be so clearly linked to a lack of population in the sample, since, despite not being a majority in the areas of Guadix and SOOS (and yes, in Levante Almeriense), the samples of the two substructures were similar and did not have a minimum population as has occurred in other attributes in the calculation of the E-I index. Moreover, in these same areas, the substructure of actors not linked to the LEADER programme presents a totally opposite scenario, with a tendency towards openness (although in some areas more marked than in others).

4.2.7. E-I Index: Counties or Traditional Subareas Substructure

For the analysis of social articulation and cohesion in the territory, other factors must be considered, such as the delimitation of LEADER areas. The areas where LEADER has been applied have a supra-municipal scope, which means that they are rarely restricted to a particular district. It has therefore been decided to define a delimitation for the study of the openness of relations according to one, two or three county areas or territorial substructures.
This delimitation in our four study areas has not always been so easy or marked (Table 13). In the case of SSOS, the delimited areas do not correspond to the idea of a region but to the perception gathered during the fieldwork, where the actors spoke of a clear differentiation between municipalities in the countryside and in the mountains; furthermore, the actors have been delimited outside the LEADER area. This is also the case in the Levante Almeriense area, where it has been decided to delimit the area according to whether they are within the rural or fishing LAG, plus Almería. In the case of Plain Action, there is no traditional delimitation of counties, so it has been considered relevant to delimit the actors according to their situation inside and outside the LEADER area (2014–2020). However, the only area where a delimitation by traditional comarcas has been made is in Guadix.
In many cases, the demographic, economic and territorial contexts have a great influence on the greater concentration of actors in some areas than in others. The average index observed for each of the areas is negative, so we are faced with endogamous and homophilic tendencies but with nuances depending on the area (Table 13). The area with the most endogamous result is Guadix, with almost −1, which is very negative and does not indicate a tendency towards internal relations between the predominant area. It is followed by SSOS with more than −0.6, which indicates a medium-high result in internal and endogamic relations, also an area where the sample was quite uncompensated among the three substructures. In contrast, the Levante Almeriense and Plain Action areas present openness scores very close to 0, which indicates very similar relationships between external and internal relationships in the study areas (in both areas, the scores are negative), although it is more balanced in the case of Plain Action. In none of the four areas does the percentage of external relations exceed 50%, although there are large differences. Regarding the result of statistical significance provided by the p-value, it should be explained that in the four study areas, the null hypothesis (H0) has been rejected, and the alternative hypothesis (H1) has been accepted, i.e., there is statistical significance in the four study areas. As for the goodness-of-fit test using the Kolmogorov–Smirnov test, in the four areas, the frequency distribution is not consistent with the theoretical distribution, so it cannot be considered a normal distribution.

5. Discussion

Several insights can be drawn from the extracted results that contribute to the existing debate on the role that the LEADER rural development programme has had in creating social cohesion and strengthening relationships in rural areas. In the next section, the stock of SC is analysed based on the social relations in each study area and the different substructures to find out the amount of internal and external re-relationships and, thus, the stock of Bonding and Bridging SC.

5.1. Netwoks and SNA Indicators in the Rural Areas

The analysis of the networks of the four rural study areas shows similarities and differences between them, although they explain to a large extent the status they occupy in the rural development processes. The densities of social networks in the study areas show large differences. As Hanneman and Mark [66] explain, it is practically impossible to obtain a perfect density. The low-density values of Levante Almeriense denote a lack of communication and cohesion among them, which may be due to disinterest, lack of communication channels, mistrust, etc. One of the reasons that may explain these results is that networks are better articulated in smaller territories, as is the case of SSOS and Plain Action, as explained by Esparcia and Escribano [67]. It is also necessary to add that it will depend on the location of the stakeholders in the territory: if they are close, the cohesion and density of their relationships will increase, as is the case in Guadix.
To estimate the efficiency of the network organisation, the prestige has been analysed, which is at medium levels in the Spanish areas and high in the British area. These results are not very positive for the Spanish areas, which have more than 30 years of experience in the application of LEADER, and it is possible to speak of a certain stagnation in the development process. However, in the British area with less experience in LEADER its values are positive, and it stands out for the high concentration of prestige among the actors, although, as the literature stresses, not all actors concentrate the same levels of prestige, which is agglutinated in a small number of actors [64]. Finally, reciprocity is another relevant indicator within networks, but in rural areas, the relationships that tend to predominate are unidirectional and, therefore asymmetrical, which implies low values for this indicator. This is true in two of the four study areas, but in SSOS and Plain Action, the bi-directionality results are high and positive. This is because stakeholders form a very cohesive and central network, which has facilitated recognition and self-recognition and is an essential part of rural development processes.

5.2. Stock of Social Capital and Social Networks: An Updated Diagnosis through E-I Index

Within the processes of building SC in rural areas, it is of great interest to know and analyse the set of internal and external relationships present in the social network, i.e., from this differentiated relational base, two major typologies of SC can be clearly identified, CS bonding (internal relationships) and CS bridging (external relationships).
The study areas have a long development process, so it would be expected that the stock and typology of SCl have varied over time. At the beginning, there must have been an important level of internal relations, which in turn are necessary for the development processes to evolve and mature. Thus, internal relationships give way to an opening of external relationships [20]. Therefore, it is to be expected that the study areas will have a balance in the networks between internal and external and thus contribute to the evolution and consolidation of development processes.
With regard to the presence and stock of predominant SC according to the substructures of the E-I index, in general for the study areas as a whole (Table 14), it can be observed that, in the substructures of sex, level of studies, link with the LEADER programme and counties or sub-areas, internal relations predominate and, therefore, the presence of a stock of Bonding SC is in the majority. On the other hand, in the substructures of actor typology, age, prestige and trust, external relations predominate and, therefore, there is a bridging type of SC. However, it can be observed that internal and external relationships are very balanced in the networks, ranging from 48.3% to 51.7%.
If we go deeper into this analysis of the different rural areas (Table 15), we can see that, although there are differences in some substructures, such as the level of study or the link to LEADER; in the rest, they show similar behaviour, although with different percentages of external or internal relations, as we have seen in the previous section. The four areas have very balanced stocks of Bonding and Bridging SC.
These results show balanced areas in both internal and external relations, which is positive from the point of view of sustainability durability and viability of development processes (20, 37). Firstly, it has been possible to verify both with the ARS indicators and with the E-I index that these are areas with high social cohesion (Bonding SC) and, furthermore, with high social bonding and integration, and this is possible thanks to the external relations within each substructure or study area [49]. Another positive aspect of this study is that in all areas there is a balance between internal and external SC, which is essential for successful development processes [51,52,68,69,70,71]. If we were to situate the four areas in the different scenarios identified by Esparcia [20] in terms of the state of the community based on the stock of SC (Figure 1), we would be looking at a scenario that would be between 2b and 4, i.e., we have areas where the local community is cohesive, empowered and with leadership and with external openness and articulation with other communities and collectives. Regarding the collectives, it is worth remembering that in all the areas, external relations predominated in the E-I index.
Classical factors do not fully explain the different levels of development of the areas, which is why it has been necessary to study social relations and the stock of SC in rural areas to verify and explain the success or failure of development processes [44,70]. The results linked to the stock of SC bonding and bridging show that the development processes in the four study areas are in a phase of consolidation and sustainability. In other words, after more than 30 years of implementation of the LEADER programme, the rural areas show mature development processes both at the level of networks and stakeholder relations. Therefore, the internal balance between different SC is very positive [20,51,68,69,70,71,72]. Hence, it can be argued that the social perspective within the LEADER programme, i.e., the promotion and production of SC and social networks, is a key element of the LEADER programme [22] and has been fundamental to understanding the development processes analysed here. Therefore, they explain how grassroots development processes in these rural areas have been improved and can be considered a success [6,7,8,9,10,11,12,23,44,45,52,73].
The LEADER programme and the linking of actors to it, whether through aid or different structures (such as the LAGs), has clearly helped in the evolution and current results, which can be considered a success of the European rural development programmes, as they have contributed to improving the relational cohesion of both actors and territories. However, in the analysis of the substructure of linkage to the LEADER programme, within the Spanish areas, the actors linked to the programme have shown a predominance of internal and homophilic relationships. This confirms that Spanish rural areas and, above all, the actors still tend to use this programme as an instrument of power vis-à-vis other actors [21] or as an instrument of defence against more powerful actors in the area. Moreover, these results underline what Dargan and Shucksmith [13] call the “project class”, which is still present in Spanish areas. This class, not very numerous in social networks, concentrates high levels of prestige, information, knowledge and control and is first-hand informed about LEADER [12,73,74]; other actors instead are not linked to LEADER and consequently are more excluded [46]. However, this is not the case in the UK area, where LEADER actors tend to be open-minded and to have relationships with people who are not involved in LEADER, which is very positive and in line with the philosophy of the programme itself.
The existence of several people who are not part of LEADER contributes to the marginalisation of certain groups [11,12,13,19]. As we have seen, the people linked to the programme tend to homophilia and, therefore, the information does not flow and is used as a tool of power and pressure. This fact also has a direct influence on the cohesion and social articulation of the territories. As has been seen in the E-I index study, the comarcas or sub-areas in which the LEADER area disaggregates, have a larger number of relevant actors, are more cohesive, but with endogamic relationships. This idea coincides with those of researchers who recognise that in those areas where political elites or lobbies act, there is a greater rural investment, while where there is an absence of SC, there is a lack of fund-raising [14,18]. It is therefore important to have a socially and territorially equitable division of the stock of SC, to avoid a disconnection and dislocation of rural territories. Therefore, the next LEADER programme periods should focus more on the quality of participation and SC [75].
It is also necessary for LEADER itself to adapt to the requirements and needs of rural territories [12,76,77] since the progressive bureaucratisation, the scarcity of funds and amounts, the loss of its role as a driving force, delays in aid and the lack of attention on the part of some regional governments [20,26,78,79], can mean that the gains that have been made through the creation and evolution of the stock of SC and social networks can be reversed, destroyed and set back the development process in rural areas [80,81].

6. Conclusions

The study and analysis of social relations and, therefore, of the stock of SC in rural areas require greater attention both from the academic world and from the political sphere and the different institutions at different levels. This article has addressed the study of the stock of SC (internal and external) in different rural areas where the LEADER programme has been applied almost since its inception. For this purpose, the stock of SC has been studied by means of SNA with both indicators and the E-I index. The contribution of this research derives from the empirical analysis of four rural areas in Spain and England, with similar rural contexts but with different realities if framed within the European territorial approach. The results highlight a clear and close approach to rural development processes through the actors involved in these processes and, therefore, in social networks. The research reveals how the areas present a balance between the levels of internal and external SC, which is very positive and shows how the development processes are consolidated and tend towards sustainability in space and time.
This is why, in terms of public policies and, more specifically, the LEADER programme, this research demonstrates the efficiency of this rural development programme through its philosophy, structure and, above all, through the role that technical staff have played in these areas for more than 30 years. This long journey has allowed the participation of many actors; although they are not the most numerous within the networks, they do have the highest level of prestige and trust, as well as external relations, which is positive. Despite the success in the presence of internal and external SC in all the study areas and, therefore, the good state of the development processes, it is necessary to point out how the actors linked to LEADER in the Spanish areas present endogamous and homophilic behaviour. This aspect is not beneficial, and it would be necessary to change and tend towards openness, as is the case in the British area. This would avoid situations where endogamic networks tend to concentrate information and use it as a tool for control and power, causing large and serious differences between actors in rural areas.
The study shows the need to continue supporting rural areas, the different groups, actors, etc., as a fundamental scenario for the correct evolution of rural development. Finally, it is necessary to highlight the role of the LAGs and their technicians in these processes, where their function as promoters and managers are fundamental for the correct development of LEADER, the initiatives and rural development itself. Furthermore, these areas need to continue strengthening internal cohesion and external relations both with other territories or sub-structures and in their hierarchical relations with the administrations (i.e., Linking SC). In the next steps of the research, it should also be studied and compared to determine whether these relational links with administrations are equally necessary for successful development processes in European rural areas.

Author Contributions

J.J.S.: data curation, forma analysis, resource, validation, visualization, writing and review. J.E.: conceptualization, funding, acquisition, investigation, methodology and supervision. All authors have read and agreed to the published version of the manuscript.

Funding

This research was funded by the Ministry of Economy and Competitiveness, under the research projects “Social Capital and Territorial Development. Crisis, Resilience and Leadership in the new Rural Dynamics in Spain” (2013–2015) [Grant Number CSO2012-32792], “Personal Networks and Rural Territories: Spatial-Temporal Dynamics, Innovations and Social Support” (2016–2018) [Grant Number CSO2015-68215-R], and the National Research Agency, Ministry of Science and Innovation, under the project “Depopulation in Spain: from Demographic to Territorial Challenge” (2021–2025) [Grant Number PID2020-11455RB-100].

Data Availability Statement

The data presented in this study are available on request from the corresponding author. The data are not publicly available due to interviewees’ privacy and ethical restrictions.

Conflicts of Interest

The authors declare no conflict of interest.

References

  1. Woolcock, M.; Narayan, D. Social capital: Implication for Debvelopment Theory, Research and Policy. World Bank Res. Obs. 2000, 15, 225–249. [Google Scholar] [CrossRef]
  2. Fukuyama, F. Social Capital, civil society and development. Third World Q. 2001, 22, 7–20. [Google Scholar] [CrossRef]
  3. Lozares, C.; Sala, M. Capital social, cohesión social y uso de la lengua. Redes 2010, 20, 204–231. [Google Scholar] [CrossRef]
  4. Lubbers, M.; Molina, J.L.; Brandes, U.; Ávila, J.; Mccarty, C. Longitudinal analysis of personal networks. The case of Argentinean migrants in Spain. Soc. Netw. 2010, 32, 91–104. [Google Scholar] [CrossRef]
  5. Podda, A. Meccanismi di costruzione e valutazione del capitale sociale attraverso la Social Network Analysis. Il ruolo dei Gruppi di Azione Locale (GAL). Sociol. Del Lav. 2016, 143, 127–146. [Google Scholar] [CrossRef]
  6. Ray, C. Editorial. The EU LEADER programme. Rural development laboratory. Sociol. Rural. 2000, 40, 163–171. [Google Scholar] [CrossRef]
  7. Ray, C. Neo-endogenous rural development in the EU. In The Handbook of Rural Studies, 1st ed.; Cloke, P., Marsden, T., Mooney, P., Eds.; SAGE: London, UK, 2009; pp. 278–291. [Google Scholar]
  8. Shucksmith, M. Endogenous development, social capital and social inclusion. Perspectives from LEADER in the UK. Sociol. Rural. 2000, 40, 208–218. [Google Scholar] [CrossRef]
  9. Shucksmith, M. Disintegrated Rural Development? Neo-endogenous Rural Development, Planning and Place-Shaping in Diffused Power Contexts. Sociol. Rural. 2010, 50, 1–14. [Google Scholar] [CrossRef]
  10. Shucksmith, M. Re-imagining the rural. From rural idyll to Good Countryside. J. Rural Stud. 2018, 59, 163–172. [Google Scholar] [CrossRef]
  11. Nardone, G.; Sisto, R.; Lopolito, A. Social capital in the LEADER Initiative. A methodological approach. J. Rural Stud. 2010, 26, 63–72. [Google Scholar] [CrossRef]
  12. Navarro, D.; Cejudo, E.; Cañete, J.A. Análisis a largo plazo de las actuaciones en desarrollo rural neoendógeno. Continuidad de las empresas creadas con la ayuda de LEADER y PRODER en tres comarcas andaluzas en la década de 1990. AGER 2018, 25, 189–219. [Google Scholar]
  13. Dargan, L.; Shucksmith, M. LEADER and innovation. Sociol. Rural. 2008, 48, 274–291. [Google Scholar] [CrossRef]
  14. Cárdenas Alonso, G.; Nieto Masot, A. Mapping the optimal rural areas to invest in throught the LEADER approach: Case study-Extremadura (SW Spain). Land 2022, 11, 1191. [Google Scholar] [CrossRef]
  15. Collante, F.; Pinilla, V. La verdadera historia de la despoblación de la España rural y cómo puede ayudarnos a mejorar nuestras políticas. AEHE 2020, 1, 1–25. [Google Scholar]
  16. Serrano, J.; Pitarch Garrido, M.D. Recent demographic trends in Spanish rural areas: Poverty and inequality with gender perspective (1999–2020). In Sustainable Development Goals in Europe, 1st ed.; De Lazaro, M.L., De Miguel, R., Eds.; Springer: Cham, Switerland, 2023; Volume 1, pp. 91–114. [Google Scholar]
  17. Esparcia, J.; Abbasi, F. Territorial governance and rural development: Challenge or reality? In Neoendogenous Development in European Rural Areas, 1st ed.; Cejudo, E., Navarro, F., Eds.; Springer: Cham, Switzerland, 2020; pp. 33–60. [Google Scholar]
  18. Cejudo-García, E.; Navarro-Valverde, F.; Cañete-Pérez, J.A. Who Decides and Who Invests? The Role of the Public, Private and Third Sectors in Rural Development according to Geographical Contexts: The LEADER Approach in Andalusia, 2007–2015. Sustainability 2022, 14, 3853. [Google Scholar] [CrossRef]
  19. Shortall, S.; Warner, M.E. Social inclusion or market competitiveness? A comparison of rural development policies in the European Union and the United States. Soc. Policy Adm. 2010, 44, 575–597. [Google Scholar] [CrossRef]
  20. Esparcia, J.; Escribano, J.; Serrano, J. Una aproximación al enfoque del capital social y a su contribución al estudio de los procesos de desarrollo local. J. Reg. Res. 2016, 34, 49–71. [Google Scholar]
  21. Esparcia, J.; Escribano, J.; Serrano, J. From development to power relations and territorial governance: Increasing the leadership role of LEADER Local Action Groups in Spain. J. Rural Stud. 2015, 42, 29–42. [Google Scholar] [CrossRef]
  22. Teilmann, K. Measuring social capital accumulation in rural development. J. Rural Stud. 2012, 28, 458–465. [Google Scholar] [CrossRef]
  23. Pisani, E.; Christoforou, A. Evaluation of Social Capital in LEADER: What’s In and What’s On. In Social Capital and Local Development. From Theory to Empirics; Pisani, E., Franceschetti, G., Secco, L., Christoforu, A., Eds.; Springer: Cham, Switzerland, 2017; pp. 109–134. [Google Scholar]
  24. Cejudo, E.; Cañete, J.A.; Navarro, F.A.; Ruiz, N. Empleo rural y LEADER: Actores, territorios y beneficiarios en Andalucía (2007–2015). BAGE 2022, 92, 1–49. [Google Scholar] [CrossRef]
  25. Serrano, A.; Hernández, M.L.; Barthe, L. La gobernanza multinivel como elemento clave dentro del programa LEADER para el Desarrollo territorial y el empoderamiento de los actores locales: Los casos de Aragón y Midi-Pyrénées. Cuad. Geográficos 2022, 60, 192–211. [Google Scholar] [CrossRef]
  26. Vercher, N. The Role of Actors in Social Innovation in Rural Areas. Land 2022, 11, 710. [Google Scholar] [CrossRef]
  27. Galluzzo, N. The relationship between agritourism and social capital in Italian regions. J. Rural Stud. 2022, 94, 218–226. [Google Scholar] [CrossRef]
  28. Olar, A.; Jitea, M.I. Counterbalancing the Development Territorial Disparities in the Implementation of the Community-Led Local Development EU Approach in Romania. Land 2021, 10, 970. [Google Scholar] [CrossRef]
  29. Shucksmith, M. Future Directions in Rural Development, 1st ed.; Carnegie: Dunfermline, UK, 2012; p. 30. [Google Scholar]
  30. Calatrava, J. Origin and evolution of rural development concept and policies: From rural communities to territories. In V Encontro Rural Report, Proceedings of the XV Congreso de Historia Agraria de la SEHA, Lisboa, Portugal, 27–30 January 2016; Serråo, J.V., Freire, D., Fernández, L., Santos, R., Eds.; University Institute of Lisbon: Lisboa, Portugal, 2016. [Google Scholar]
  31. Esparcia, J.; Noguera, J.; Pitarch, M.D. LEADER en España. Doc. D’anàlisi Geográfica 2000, 37, 95–113. [Google Scholar]
  32. Bosworth, G.; Rizzo, F.; Marquardt, D.; Strijker, D.; Haartsen, T.; Aagaard Thuesen, A. Identifying social innovations in European local rural development initiatives. Innov. Eur. J. Soc. Sci. Res. 2016, 29, 442–461. [Google Scholar] [CrossRef]
  33. Pisani, E.; Christoforou, L.; Franceschetti, G. Introduction: Motivation, Aim and Contributions. In Social Capital and Local Development. From Theory to Empirics; Pisani, E., Franceschetti, G., Secco, L., Christoforu, A., Eds.; Springer: Legnaro, Italy, 2017; pp. 135–174. [Google Scholar]
  34. Serageldin, I.; Grootaert, C. Defining social capital. An integrating view. In Evaluation and Development. The Institutional Dimension; Picciotto, R., Wiesner, E., Wolfensohn, J.D., Eds.; Routledge: London, UK, 1998; pp. 40–58. [Google Scholar]
  35. Bourdieu, P. The Forms of Capital. In Handbook of Theory and Research for the Sociology of Education; Richards, J.G., Ed.; Greenwood Press: New York, NY, USA, 1986; pp. 241–258. [Google Scholar]
  36. Coleman, J. Foundations of Social Theory; Harvard University Press: Cambridge/London, UK, 1990; pp. 540–566. [Google Scholar]
  37. Woolcock, M. Managing risk, shocks, and opportunity in developing economies. The role of social capital. World Bank 2000, 1, 20–22. [Google Scholar]
  38. Lin, N. Social Capital. A Theory of Social Structure and Action; Cambridge University Press: New York, NY, USA, 2001. [Google Scholar]
  39. Moghfeli, Z.; Ghorbani, M.; Reza, M.; Amin, M.; Azadi, H.; Scheffran, J. Social capital and farmers’ leadership in Iranian rural communities: Application of social network analysis. J. Environ. Plan. Manag. 2022, 66, 977–1001. [Google Scholar] [CrossRef]
  40. Preston, J.P.; Barnes, K.E. Successful Leadership in Rural Schools: Cultivating Collaboration. Rural Educ. 2017, 38, 6–15. [Google Scholar] [CrossRef]
  41. Naderi, A.; Nasrolahi Vosta, L.; Ebrahimi, A.; Jalilvand, M.R. The contributions of social entrepreneurship and transformational leadership to performance: Insights from rural tourism in Iran. Int. J. Sociol. Soc. Policy 2019, 39, 719–737. [Google Scholar] [CrossRef]
  42. Shortall, S. Are rural development programmes socially inclusive? Social inclusion, civic engagement, participation, and social capital. Exploring the differences. J. Rural Stud. 2008, 24, 450–457. [Google Scholar] [CrossRef]
  43. Coleman, J. Systems of trust. A rough theoretical framework. Angew. Soz. 1982, 10, 277–299. [Google Scholar]
  44. Buciega, A. El capital social como recurso de desarrollo. In Gestión y Promoción del Desarrollo Local; Noguera, J., Pitarch, M.D., Esparcia, J., Eds.; Publicacions de la Universitat de València: Valencia, Spain, 2009; pp. 67–96. [Google Scholar]
  45. Marquardt, D.; Möllers, J.; Buchenrieder, G. Social networks and rural development. LEADER in Romania. Sociol. Rural. 2012, 52, 398–431. [Google Scholar] [CrossRef]
  46. Canela, L.; Rosell Foxà, J.; Francès Tudel, G. Factores determinantes de la participacion de la mujer como promotoras de proyectos Leader+. Rev. Española Estud. Agrosoc. Y Pesq. 2010, 226, 177–206. [Google Scholar]
  47. Woolcock, M. Social capital and economic development. Toward a theoretical synthesis and policy framework. Theory Soc. 1998, 27, 151–208. [Google Scholar] [CrossRef]
  48. Lewis, J.M. Connecting and Cooperating: Social Capital and Public Policy; UNSW Press: Sydney, Australia, 2010; p. 232. [Google Scholar]
  49. Lozares, C.; López Roldán, P.; Verd, J.M.; Martí, J.; Molina, J.L. Cohesión, Vinculación e Integración sociales en el marco del Capital Social. REDES. Rev. Hisp. Para Análisis Redes Soc. 2011, 20, 1–28. [Google Scholar] [CrossRef]
  50. Lozares, C.; Verd, J.M. De la Homofilia a la Cohesión social y viceversa. Redes. Rev. Hisp. Para Análisis Redes Soc. 2011, 20, 29–50. [Google Scholar] [CrossRef]
  51. Putnam, R. Bowling Alone. The Collapse and Revival of American Community; Simon and Schuster: New York, NY, USA, 2000; p. 544. [Google Scholar]
  52. Pisani, E. Evaluation of social capital in LEADER: From theory to practice. In Social Capital and Local Development. From Theory to Empirics; Pisani, E., Franceschetti, G., Secco, L., Christoforu, A., Eds.; Springer: Cham, Switzerland, 2017; pp. 135–174. [Google Scholar]
  53. Navarro, F.; Woods, M.; Cejudo, E. The LEADER Initiative has been a victim of its own success. The decline of the bottom-up approach in Rural Development Programmes. The cases of Wales and Andalusia. Sociol. Rural. 2016, 56, 270–288. [Google Scholar] [CrossRef]
  54. Instituto Nacional de Estadística (INE). Available online: https://www.ine.es (accessed on 28 February 2023).
  55. Bodin, O.; Crona, B.I. The Role of Social Networks in Natural Resource Governance: What Relational Patterns Make a Difference? Glob. Environ. Chang. 2009, 19, 366–374. [Google Scholar] [CrossRef]
  56. Cadger, K.; Quaicoo, A.K.; Dawoe, E.; Isaac, M.E. Development Interventions and Agriculture Adaptation: A Social Network Analysis of Farmer Knowledge Transfer in Ghana. Agriculture 2016, 6, 32. [Google Scholar] [CrossRef]
  57. Ghorbani, M.; Azadi, H. A Social-Relational Approach for Analyzing Trust and Collaboration Networks as Preconditions for Rangeland Co-Management. Rangel. Ecol. Manag. 2021, 75, 170–184. [Google Scholar] [CrossRef]
  58. Longhurst, R. Semi-Structured Interviews and Focus Groups. In Key Methods in Geography; Clifford, N., Cope, M., Gillespie, T., French, S., Eds.; Sage Publications: London, UK, 2003; pp. 143–156. [Google Scholar]
  59. Molina, J.L. El Análisis de Redes Sociales; Edicions Bellaterra: Barcelona, Spain, 2001; p. 126. [Google Scholar]
  60. Sanz, L. Análisis de redes sociales. o cómo representar las estructuras sociales subyacentes. Apunt. Cienc. Y Tecnol. 2003, 7, 21–29. [Google Scholar]
  61. Marqués, P.; Muñoz, M.; Capítulo, I. Análisis de redes sociales. definición y conceptos básicos. In Conectados por Redes Sociales Introducción al Análisis de Redes Sociales y Casos de Estudio; Del Fresno, M., Marqués, P., Paunero, D., Eds.; Editorial UOC: Barcelona. Spain, 2014; pp. 21–55. [Google Scholar]
  62. Velázquez, A.; Aguilar, N. Manual introductorio al análisis de redes sociales. Medidas Cent. 2005, 1, 45. [Google Scholar]
  63. Serrano, J.J. Desarrollo Rural y Capital Social: Aproximaciones Desde el Análisis de Redes Sociales. Una Visión Comparada de Casos de Estudio en Andalucía e Inglaterra. Ph.D. Thesis, Universitat de València, Valencia, Spain, 2018. Available online: https://roderic.uv.es/handle/10550/67623 (accessed on 28 February 2023).
  64. Esparcia, J. Capital social y desarrollo territorial: Redes sociales y liderazgos en las nuevas dinámicas rurales en España. Ph.D. Thesis, Universitat Autònoma de Barcelona, Barcelona, Spain, 2017. Available online: https://www.tdx.cat/handle/10803/457367#page=1 (accessed on 28 February 2023).
  65. Lee, J.; Árnason, A.; Nightingale, A.; Shucksmith, M. Networking. social capital and identities in European rural development. Sociol. Rural. 2005, 45, 269–283. [Google Scholar] [CrossRef]
  66. Hanneman, R.; Mark, R. Introduction to Social Network Methods; University of California: Riverside, CA, USA, 2005; p. 343. [Google Scholar]
  67. Esparcia, J.; Escribano, J. Capital social relacional en áreas rurales. un análisis a partir del análisis de redes sociales. In De la Geografía Rural al Desarrollo Local. Homenaje a Antonio Maya Frades; Cortizo, J., Redondo, M.y., Sánchez, M.J., Eds.; Universidad de León, Servicios de Publicaciones: León, Spain, 2014; pp. 215–230. [Google Scholar]
  68. Granovetter, M. Economic action and social structure. The problem of embeddedness. Am. J. Sociol. 1985, 91, 481–510. [Google Scholar] [CrossRef]
  69. Camarero, L.; Cruz, F.; González, M.; Del Pino, J.A.; Oliva, J.; Sampedro, R. La Población Rural de España. De los Desequilibrios a la Sostenibilidad Social; Fundacdión La Caixa: Barcelon, Spain, 2009; p. 190. [Google Scholar]
  70. Buciega, A.; Esparcia, J. Desarrollo, Territorio y Capital Social. Un análisis a partir de las dinámicas relacionales en el desarrollo rural. REDES 2013, 4, 81–113. [Google Scholar] [CrossRef]
  71. Blanco, E. El Desarrollo Rural y el Capital Social en el Cantón de La Cruz, Guanacaste, Costa Rica. Ph.D. Thesis, Universitat Autònoma de Barcelona, Barcelona, Spain, 2014. Available online: https://www.tdx.cat/handle/10803/134666#page=1 (accessed on 28 February 2023).
  72. Garrido, F.; Moyano, E. Capital social y desarrollo en zonas rurales. Un análisis de los programas Leader II y Proder en Andalucía. Rev. Int. Sociol. 2002, 33, 67–96. [Google Scholar]
  73. Pisani, E.; Franceschetti, G. Evaluation of social capital promotion in rural development programmes. A methodological approach. In Proceedings of the 122nd Seminar, Ancona, Italy, 17–18 February 2011. [Google Scholar]
  74. Cañete Pérez, J.A.; Labianca, M.; Cejudo García, E.; De Rubertis, S.; Valverde Navarro, F.A.; Belliggiano, A. ¿La práctica del desarrollo rural genera desequilibrio territorial? El caso de LEADER en el sur de Europa: Andalucía (España) y Puglia (Italia). 2007–2013. In Proceedings of the Naturaleza, Territorio y Ciudad en un Mundo Global XXV Congreso de la Asociación de Geógrafos Españoles, Madrid, Spain, 25–27 October 2017. [Google Scholar]
  75. Hoffmann, R.; Hoffmann, N. The Leader Programme as an impulse for new projects in rural areas. Quaest. Geogr. 2018, 37, 141–150. [Google Scholar] [CrossRef]
  76. Nieto, A.y.; Cárdenas, G. El método LEADER como política de desarrollo rural en Extremadura en los últimos 20 años (1991–2013). BAGE 2015, 69, 139–162. [Google Scholar]
  77. Menconi, M.E.; Abbate, R.; Ceccarelli, G.; Grassi, A.; Grohmann, D. Rural Slow Routes as Connectors of Local Communities for the Promotion of Place Identity. Sustainability 2023, 15, 3344. [Google Scholar] [CrossRef]
  78. Dax, T.; Strahl, W.; Kirwan, J.; Maye, D. The Leader Programme 2007–2013: Enabling or Disabling Social Innovation and Neo-Endogenous Development? Insights from Austria and Ireland. Eur. Urban Reg. Stud. 2016, 23, 56–68. [Google Scholar] [CrossRef]
  79. Esparcia, J.; Escribano, J.; Buciega, A. A perspective of LEADER Method in Spain based on the Analysis of Local Action Groups. In Evaluating the LEADER Approach to Rural Development. Grass-Roots Experiences of the Leader Programme; Granberg, L., Andersson, K., Kovách, J., Eds.; Routledge: Abingdon-on-Thames, UK, 2015; pp. 33–51. [Google Scholar]
  80. Huang, J.-C.; Wang, J.; Nong, Q.; Xu, J.-F. Using a Modified DANP-mV Model to Explore the Improvement Strategy for Sustainable Development of Rural Tourism. Sustainability 2023, 15, 2371. [Google Scholar] [CrossRef]
  81. Wu, Z.-J.; Wu, D.-F.; Zhu, M.-J.; Ma, P.-F.; Li, Z.-C.; Liang, Y.-X. Regional Differences in the Quality of Rural Development in Guangdong Province and Influencing Factors. Sustainability 2023, 15, 1855. [Google Scholar] [CrossRef]
Disclaimer/Publisher’s Note: The statements. opinions and data contained in all publications are solely those of the individual author(s) and contributor(s) and not of MDPI and/or the editor(s). MDPI and/or the editor(s) disclaim responsibility for any injury to people or property resulting from any ideas. methods. instructions or products referred to in the content.
Figure 1. Situations arising from the combination of different stocks of social capital and scenarios for development processes. Source: [20] (p. 61).
Land 12 00850 g001
Figure 2. Location map of the four study areas.
Land 12 00850 g002
Figure 3. Weight of the different social substructures derived from prestige (Degree In) by area of study.
Land 12 00850 g003
Figure 4. Weight of the different social substructures derived from Trust (Degree In) by area of study.
Land 12 00850 g004
Figure 5. Weight of the different social substructures derived from prestige and trust for all areas.
Land 12 00850 g005
Table 1. Comparative between Spanish and England study areas.
SSOSGuadixL. AlmeriensePlain Action
Area (km2)1.5812.039, 61.842, 51.066
Population (inhab) *97.05944.446118.492125.656
Density (Inhab./Km2)612464118
Number of municipalities or parishes8321358
Year of application of LEADER programme1996199619961996
* Population data in Spanish rural areas refer to 2022, while in English areas, it is 2011.
Table 2. Total of interviews between study areas.
SSOSGuadixL. AlmeriensePlain Action
Stakeholders 136514321
% stakeholders interviewed97%92%95%100%
New stakeholders 2 reas han sido: del 22 de Marzo al 13 de Abril de 2015 en la comarca de SSOS. de los nuevos actoresmuestra inicial137127
% new stakeholders interviewed31%29%33%86%
Stakeholders’ population 349585528
Sample of stakeholders interviewed 439494527
% interviewed sample 80%94%82%96%
1 Sample defined from meetings with the management team and other key informants. 2 Stakeholders considered by at least three interviewees who were not present in the initial sample. 3 Total of actors detected in the field research that meet the indicated inclusion criteria. 4 Result of the sum of stakeholders interviewed from the initial sample and from the new ones.
Table 3. Attributional and relational criteria through the E-I index according to studies level substructure in the study areas. Source: [63] (p. 95).
TypologyIndicatorsDefinitionMeasuringValues
LowMediumHigh
Network propertyDensityIndicates the number of existing relationships over the possible ones; that is, it is related to the nearnessPercentage<7%7–18% >18%
CentralityDegree (In)Indicates the number of direct links that an actor receives from another one. It’s linked with prestige.Percentage<28%28–61%>61%
Closeness (In)It is the ability of a node to reach all the actors in the network. A high proximity indicates a high proximity to central or powerful actors in the networkNumber of axes in the network<1414–37>37
BetweennessIndicates the frequency at which a node appears within the shortest or geodesic section that connects two others (it shows the intermediaries or bridge people)Percentage<12%12–20%>20%
Flow
Betweenness
It shows the position of intermediation that each actor occupies in all the types of acts or communications that he/she maintains with other actors but presupposes that all the paths are used, not only the geodesicsPercentage<7%7–13%>13%
ReciprocityIt refers to the number of relationships that are symmetric between two actorsPercentage<20%20–26%>26%
Table 4. Attributional and relational criteria through the E-I index according to studies level substructure in the study areas.
TypologyIndicatorsSSOSGuadixL. AlmeriensePlain Action
Network propertyDensity19.4%14.4%7.0%26.6%
CentralityDegree (In)58.5%59.7%48.3%72.2%
Closeness (In)45.222.48.453.4
Betweenness12.1%19.3%27.7%12.4%
Flow Betweenness7.4%22.4%18.7%8.6%
Reciprocity26.4%23.3%15.8%28.1%
Table 5. Attributional and relational criteria through the E-I index according to studies level substructure in the study areas.
TypologyIndicatorsSSOSGuadixL. AlmeriensePlain Action
Network propertyDensityHighMediumLowHigh
CentralityDegree (In)MediumMediumMediumHigh
Closeness (In)HighMediumLowHigh
BetweennessMedium MediumHighMedium
Flow BetweennessMediumHighHighMedium
ReciprocityHighMediumLowHigh
Table 6. Attributional and relational criteria through the E-I index according to the stakeholders’ typology substructure in the study areas.
SSOSGuadixL. AlmeriensePlain Action
E-I Index (Observed)0.4540.4550.4330.178
E-I Index (Expected)0.5200.5020.4000.128
p-value (p ≤ 0.05)H0H0H0H1
% External Connections73%73%72%59%
E-I Index Institutional0.6840.4930.380.900
E-I Index Economics0.2980.2880.2940.564
E-I Index Socials0.4430.5640.5240.857
E-I Index Technicians0.4630.5260.714−0.231
Kolmogorov–Smirnov TestH0H0H0H1
Table 7. Attributional and relational criteria through the E-I index according to age substructure in the study areas.
SSOSGuadixL. AlmeriensePlain Action
E-I Index (Observed)0.0840.2870.0500.479
E-I Index (Expected)0.2280.1770.1070.464
p-value (p ≤ 0.05)H1H1H1H0
% External Connections54%64%53%74%
E-I Index <35 years old1--0.721
E-I Index 36–45 years old0.5850.4170.7500.833
E-I Index 46–60 years old−0.2320.064−0.2730.261
E-I Index >60 years old0.7140.7890.5560.463
Kolmogorov–Smirnov TestH1H1H1H0
Table 8. Attributional and relational criteria through the E-I index according to gender substructure in the study areas.
SSOSGuadixL. AlmeriensePlain Action
E-I Index (Observed)−0.304−0.091−0.567−0.041
E-I Index (Expected)−0.395−0.337−0.3450.026
p-value (p ≤ 0.05)H1H1H1H0
% External Connections35%46%22%48%
E-I Index Men−0.560−0.364−0.7520.186
E-I Index Women0.6360.5920.733−0.195
Kolmogorov–Smirnov TestH1H1H1H0
Table 9. Attributional and relational criteria through the E-I index according to the level of education substructure in the study areas.
SSOSGuadixL. AlmeriensePlain Action
E-I Index (Observed)0.031−0.0760.250−0.767
E-I Index (Expected)0.009−0.0480.313−0.715
p-value (p ≤ 0.05)H1H1H0H1
% External Connections52%46%63%12%
E-I Index Primary education0.82210.158-
E-I Index Secondary education0.6300.5820.7071
E-I Index Higher education−0.302−0.3890.154−0.876
Kolmogorov–Smirnov TestH1H1H0H1
Table 10. Attributional and relational criteria through the E-I index according to Prestige (Degree In) substructure in the study areas.
SSOSGuadixL. AlmeriensePlain Action
E-I Index (Observed)0.2250.2730.3330.301
E-I Index (Expected)0.4300.3150.1470.464
p-value (p ≤ 0.05)H0H1H1H0
% External Connections61%64%67%65%
E-I Index Very Low–Low Prestige−0.053−0.036−0.1060.015
E-I Index Low Medium Prestige0.6070.6630.7210.446
E-I Index Medium High Prestige0.5400.4810.8860.582
E-I Index High–Very High Prestige0.3850.7240.7950.600
Kolmogorov–Smirnov TestH0H1H1H0
Table 11. Degree of openness through E-I Index in the level of Trust (Degree In) substructure.
SSOSGuadixL. AlmeriensePlain Action
E-I Index (Observed)0.1790.3530.0270.424
E-I Index (Expected)0.4520.2620.0420.328
p-value (p ≤ 0.05)H0H1H1H1
% External Connections59%68%51%72%
E-I Index Very Loy–Low Trust−0.1150.118−0.1560.700
E-I Index Low-Medium Trust0.4670.51000.189
E-I Index Medium-High Trust0.4550.60010.636
E-I Index High–Very High Trust0.714111
Kolmogorov–Smirnov TestH0H1H1H1
Table 12. Degree of openness through E-I Index in Link to LEADER program substructure.
SSOSGuadixL. AlmeriensePlain Action
E-I Index (Observed)0.048−0.004−0.083−0.096
E-I Index (Expected)−0.0070.010−0.038−0.031
p-value (p ≤ 0.05)H1H1H1H1
% External Connections50%50%48%48%
E-I Index Link to LEADER−0.052−0.224−0.2990.179
E-I Index Non-Link to LEADER0.1720.3910.325−0.267
Kolmogorov–Smirnov TestH1H1H1H1
Table 13. Degree of openness through E-I Index in Link to Counties substructure.
SSOSGuadixL. AlmeriensePlain Action
E-I Index (Observed)−0.639−0.935−0.167−0.123
E-I Index (Expected)−0.452−0.9180.1130.003
p-value (p ≤ 0.05)H1H1H1H1
% External Connections18%3%42%44%
E-I Index County 1 (a)−0.797−0.967−0.4130.067
E-I Index County 2 (a)0.47410.302−0.256
E-I Index County 3 (a)1-1-
Kolmogorov–Smirnov TestH1H1H1H1
Identification of the counties or subareas1: Campiña1: Guadix1: Rural1: Inside of LEADER area
2: Sierra2: Los Montes2: Fishing2: Outside of LEADER area
3: Utrera---3: Almería---
Table 14. Predominant stock of social capital in general based on the average of the E-I index and substructures.
Internal Social Capital
(Bonding)
External Social Capital (Bridging)
Stakeholders’ typology X
Age X
SexX
Level studiesX
Prestige X
Trust X
Link to LEADERX
Counties or SubareasX
Average relationships48.3%51.7%
Table 15. Predominant stock of social capital in the four study areas from the E-I index and substructures.
Internal Social Capital (Bonding)External Social Capital (Bridging)
Study areas *SGL.AP.ASGL.AP.A
Stakeholders’ typology XXXX
Age XXXX
SexXXXX
Level studies X XX X
Prestige XXXX
Trust XXXX
Link to LEADER XXXX
Counties or SubareasXXXX
Average relationships49.7%48.2%47.7%47.2%50.3%51.8%52.3%52.8%
* S: Serranía Suroeste Sevillana; G: Guadix; L.A: Levante Almeriense; P.A: Plain Action.
Disclaimer/Publisher’s Note: The statements, opinions and data contained in all publications are solely those of the individual author(s) and contributor(s) and not of MDPI and/or the editor(s). MDPI and/or the editor(s) disclaim responsibility for any injury to people or property resulting from any ideas, methods, instructions or products referred to in the content.

