
Shantytown Redevelopment and Housing Prices: Empirical Evidence from Chinese Cities
Development Economics Group, Wageningen University & Research, 6706 KN Wageningen, The Netherlands
Land 2023, 12(4), 823; https://doi.org/10.3390/land12040823
Submission received: 6 February 2023
/
Revised: 3 March 2023
/
Accepted: 20 March 2023
/
Published: 4 April 2023
(This article belongs to the Special Issue Urban and Rural Land Development and Redevelopment in the Process of Urbanization)
Abstract
:China has been undergoing urban regeneration and reconstruction over the past few decades. To improve the housing conditions of the poor and better achieve the goal of new urbanization, the Chinese government launched top-down shantytown redevelopment nationwide in 2008. Little is known about the economic effectiveness of shantytown redevelopment. Based on city-level data from 2014–2018, this study examined the impact of shantytown redevelopment on housing prices by using the fixed effects regression analysis and instrumental variables (IV) methods. The results show that shantytown redevelopment significantly increases the housing prices at the city level, and each 10% increase in the size of redeveloped shantytowns is associated with an average increase of 1.4% in housing prices. There is regional heterogeneity, with shantytown redevelopment in the central and western regions having a greater effect on housing prices. The rising home prices imposed by shantytown redevelopment negatively decrease housing affordability for those households not included in the redevelopment projects; thus, a more inclusive urban redevelopment policy should be considered.
1. Introduction
China has been undergoing urban regeneration and reconstruction over the past few decades. Shantytowns, defined as declining neighborhoods in old industrial areas, coal and mining areas, or urban residential areas, are the main targets for large-scale state-led urban redevelopment policy [1]. Unlike urban villages in metropolitan areas which usually have a status of rural collective property rights and provide migrant workers the bulk of informal settlements, shantytowns are state-owned, originally inhabited by a dense cluster of low-income local households, characterized by dilapidated houses from work units, insufficient public facilities, and hidden dangers of building safety [2,3,4]. In order to improve the housing conditions of poor households and better achieve the goal of new urbanization, the Chinese government launched top-down shantytown redevelopment nationwide in 2008. In 2014, the General Office of the State Council issued the “Notice on Further Strengthening the Redevelopment of Shantytowns”, proposing to further promote the transformation of urban shantytowns in which about 100 million people live. The transformation of shantytowns is not only a major livelihood project to improve the living conditions of the poor but also a means of reshaping the urban landscape, which is conducive to improving the urban spatial structure, land use efficiency, and the sustainable development of urbanization [5].
Shantytown redevelopment involves the removal of dilapidated houses and the resettlement of native residents, playing a vital role in stimulating strong housing investment and demanding growth. On the one hand, the native shantytown residents are given either cash-based or in-kind compensation for their resettlement. Those who acquire cash-based compensation can use it to purchase new residential housing from the private housing market, whereas those who acquire in-kind compensation are generally relocated to better quality housing offered by the government and real estate developers [6]. On the other hand, redeveloped shantytowns are more likely to attract more middle-class residents to these areas because of the improved living environment [7,8]. It seems plausible that the spatial dynamics of urban housing prices is not only determined by macroeconomic fundamentals and institutional policies but also environmental factors. People are willing to pay more for a quality living environment with a set of amenities [9]. Therefore, shantytown redevelopment may play a role in determining China’s urban housing prices.
Previous studies have examined the effect of urban redevelopment programs on housing prices, but most have focused on developed countries and regions, including the redevelopment of brownfield sites, old industry areas, shopping malls, and public housing [10,11,12,13]. A few studies have also examined the impact of urban village redevelopment on housing prices in China at the micro level [14,15], but little is known about the effect of shantytown redevelopment. This paper aims to fill this research gap by investigating the impact of China’s shantytown redevelopment on housing prices at the city level.
In this paper, we first employ a fixed effects regression model to examine the relationship between shantytown redevelopment and housing prices using the data from 2014–2018. Considering that the fixed effects regression model may generate endogeneity problems due to omitted variables or reverse causality, the causal effect is further examined by using the instrumental variables (IV) method. After controlling for fundamental factors that may affect housing prices, the results show that shantytown redevelopment has a positive effect on housing prices. The estimation of the IV regression model shows that for every 10% increase in the number of redeveloped shantytowns, the housing prices increase by 1.4% on average. There is regional heterogeneity with shantytown redevelopment in the central and western regions having a greater effect on housing prices. This paper contributes to the literature by providing new evidence for the effects of urban redevelopment in developing countries.
2. Literature Review
Housing is not only a place to live but also a prerequisite to access jobs, education, health, and social connections [16,17]. However, many countries around the world have witnessed constant challenges in housing affordability for decades. Both the public and policymakers are concerned about the societal consequences of widespread housing unaffordability [18]. As household income does not grow as fast as housing prices, low-income households are struggling to live a decent life, leading to more poverty and wealth inequality issues [19]. The soaring cost of housing not only increases the risk of poor health outcomes but also results in the younger generation being unable to buy their own homes, leading them to postpone building a new family and decreasing their willingness to have children. Insofar as these outcomes are detrimental to sustainable development goals [20], it is crucial to find a solution to housing unaffordability by understanding the formation of housing prices as well as their dynamics and driving factors.
Found in the broad literature are attempts to explain the soaring housing prices from different perspectives. On the supply side of the housing market, it has been found that land use regulation, construction costs, and the expansion of public and non-profit housing sectors are the main driving forces for the rising housing prices. Land use regulations are among the most common urban policies in cities all over the world, including zoning, lot size regulation, urban growth boundary control, floor area ratio regulation, etc. [21]. These policy controls imposed by governments as well as localities restrict the growth of new housing construction, making housing more expensive across metropolitan areas [22]. In some European countries, a recent change in the European Union’s energy policy has sharply increased the cost of energy use, which is not only reflected in the household energy consumption but also in the prices of building materials and construction work [23]. Moreover, in response to the expanded provision of public and non-profit housing, the private housing market is crowded out along with the rising housing prices [24].
On the demand side, hedonic pricing theory [25] claims that housing prices reflect both housing attributes and amenities within a particular geographic location. Amenities capitalized into housing prices include those associated with household well-being such as access to jobs, quality of schools, restaurants, and environmental goods or “bads” [18]. As such, Glaeser et al. (2001) proposed the profound consumer city theory which suggests that as the income level of urban residents increases, people tend to choose places with a higher level of environmental quality and liveability. They empirically tested the consumer city theory using urban data from the United States [26]. Other fundamental factors such as income, interest rates, and migration are also the main drivers of housing prices. Based on 62 metropolitan areas in the US from 1979–1995, Capozza et al. (2002) found that real income levels and population growth explicitly explained the movement in housing prices [27]. Favara and Imbs (2015) demonstrated that lower interest rates and increased money supply stimulate housing demand in areas where housing supply is inelastic, leading to higher house prices [28]. Mussa et al. (2017) revealed that immigration inflow into a particular area drives up the housing prices in that area as well as in its neighboring areas [29].
Urban redevelopment is an approach of land reuse to rectify the urban decay problem in cities caused by subsequent socioeconomic changes. It involves the clearance of slums and blighted buildings and infrastructure, creating opportunities for high-quality housing and new businesses [30]. On the one hand, urban redevelopment revitalizes inner cities, spurs economic development, and lowers crime rates. On the other hand, it typically leads to gentrification. As a result, low-income residents tend to be displaced by newcomers with higher income and higher social class in gentrified neighborhoods where property prices rise [31]. There is growth in the literature investigating the role of urban redevelopment in housing prices. Woo and Lee (2016) examined the impact of brownfield redevelopment on neighboring housing prices in Ohio by using the time-series difference-in-differences model, demonstrating the significantly positive impacts on nearby housing prices [10]. Schwartz et al. (2006) examined the spillover effects of public housing redevelopment on housing prices in New York by using the difference-in-differences model, finding that the spillovers are positive and increase with project size [11]. Similar positive effects on housing prices are imposed by old industrial sites [12], urban villages [14,15], abandoned religious buildings [9], etc.
Shantytown redevelopment is a large-scale government-led urban redevelopment program in China. In the process of shantytown redevelopment, the native residents in shantytowns are displaced through either cash-based resettlement compensation or in-kind compensation [32]. Those who receive cash-based compensation generally buy new houses to relocate their families, which increases the demand in the housing market. In line with other forms of urban redevelopment across countries, shantytown redevelopment attracts new businesses and higher social-class newcomers by building up good quality housing and environmental goods [33]. Hence, it seems possible that shantytown redevelopment is positively associated with urban housing prices. Since previous studies have provided little evidence in this regard, this paper attempts to fill this gap.
3. The Background of Shantytown Redevelopment in China
China’s shantytown redevelopment can roughly be divided into three phases. In the first phase, shantytown redevelopment was initiated in Liaoning province, which is one of the most important regions rich in raw materials, and home to leading industries such as mining, metallurgy, petrochemical, and machinery. Shantytowns have been formed as a result of resource depletion and economic transition in these resource-based areas [32]. Shantytowns are mainly inhabited by the former labor workers of resource-based industries and their families who had been facing unemployment and deteriorating living conditions in the context of economic transition. In 2005, the Liaoning provincial government initiated large-scale shantytown redevelopment, aiming to improve the living conditions of low-income residents in these declining neighborhoods.
The second phase of shantytown redevelopment started in 2008 when China was hit by the great recession and global financial crisis, suffering a huge drop in exports. To partially offset the economic loss in exports and to promote economic growth, China launched an economic stimulus plan, investing RMB 4 trillion in a stimulus package of 10 items, one of which was shantytown redevelopment. In 2008, the State Council issued The Opinions on Solving the Housing Issues of Low-Income Urban Families, proposing that urban authorities should promote the redevelopment of concentrated shantytowns in accordance with local conditions. This marked the formal launch of shantytown redevelopment nationwide. By 2012, a total of 12.6 million old residential dwelling units in shantytown areas had been redeveloped, involving RMB 150 billion investment in total [34].
The third phase of shantytown redevelopment started in 2013, when the China State Council pointed out that it was necessary to promote people-oriented new urbanization, further increase the redevelopment of shantytowns, and plan to redevelop another 10 million housing units in various types of shantytowns from 2013 to 2017. The National New Urbanization Plan (2014–2020) divided shantytowns into four categories: urban shantytowns, state-owned industrial and mining shantytowns, state-owned forest-area shantytowns, and shantytowns in state-owned reclamation areas1. In practice, the State Council is responsible for formulating the national annual plan for shantytown redevelopment, with each province formulating provincial and municipal shantytown redevelopment plans and the municipalities organizing and implementing shantytown redevelopment projects.
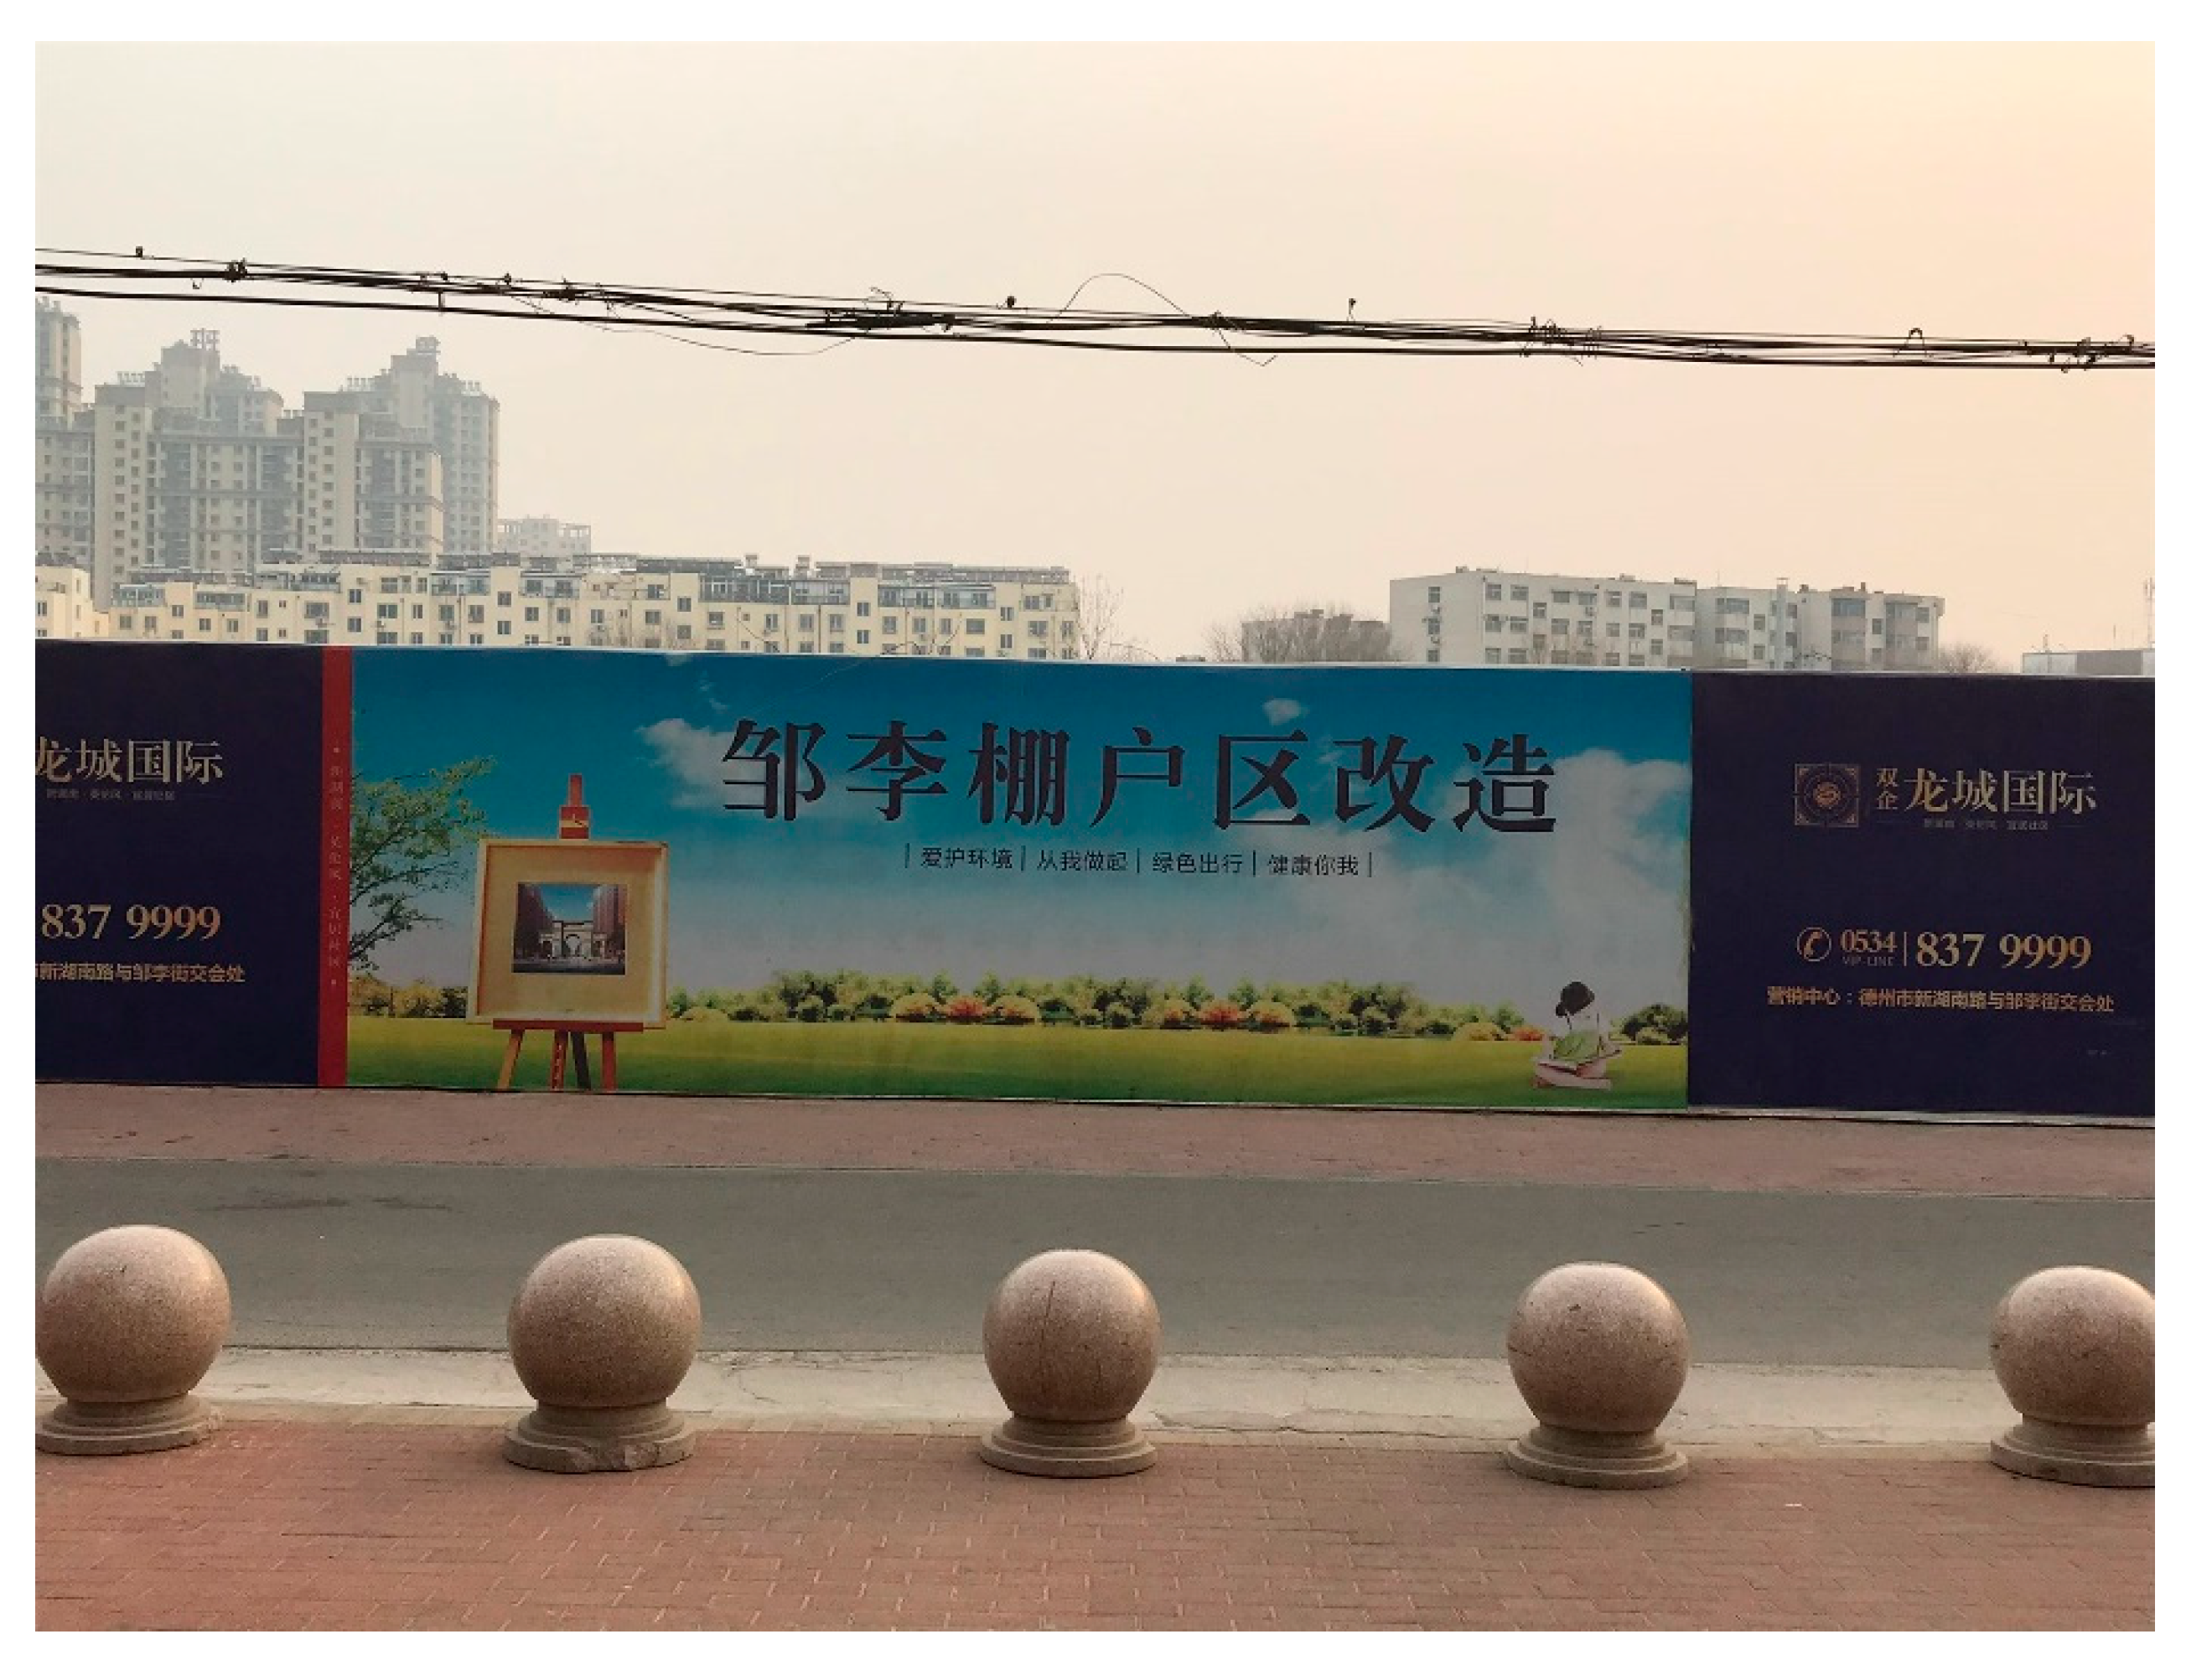
In the process of shantytown redevelopment, the native residents are displaced to better quality houses through either cash-based resettlement compensation or in-kind compensation. Old residential buildings are replaced by new houses and well-designed public spaces, which attract newcomers and new businesses to revitalize the local economy. Figure 1 shows an example of a shantytown redevelopment project in Dezhou city, Shandong province, in 20192.
4. Data and Method
4.1. Data
In this paper, the impact of shantytown redevelopment on housing prices is assessed using an unbalanced panel dataset of data obtained from several different sources. First, the housing price data at the city level are obtained from the Wind database, spanning from 2014 to 2018. The housing price data are rectified using the year 2013 as a base. Wind Information Co., Ltd., headquartered in Shanghai, is a leading provider of financial information services in China, and the Wind database is widely used by banks, insurance companies, securities companies, authoritative media, and researchers. Second, the data on the size of redeveloped shantytowns are manually collected from the 2015–2019 municipal government work report documents. The government work reports are released at the beginning of each year, in which the last year’s government work is reviewed and next year’s work plan is announced. Third, data on land prices are obtained from the website https://www.landchina.com/ which was accessed on the 19 February 2019. This website records the transaction details of each land parcel sold nationwide. Land prices at the city level are calculated by assembling and averaging all transacted land parcels within a city. Fourth, the data on the distance to the large ports are obtained from Baidu map API, and the geographical location of each city is captured by the programming software Python. This variable represents the economic geography characteristics that may influence labor productivity and housing prices; Hongkong, Shanghai, and Tianjin are three main large ports in China [35]. Fifth, other data such as GDP per capita and interest rates are also obtained from the Wind database.
4.2. Model
The basic empirical strategy is to set up a fixed effects regression model to examine the impact of shantytown redevelopment on housing prices, controlling for other driving factors. This is expressed in Equation (1):
where subscripts i and t denote city and year, respectively. ln(P) is the natural logarithm of the real housing price in city i and year t, ln(renewal) denotes the natural logarithm of the size of redeveloped shantytowns in city i and year t, and X is the city-level control variables that may affect housing prices, including city characteristics such as whether it is a provincial capital or one of the 70 largest cities, the shortest distance to the three major ports, and the natural logarithm of real GDP per capita, the natural logarithm of real land price, and medium- and long-term loan interest rates [36,37]. To identify intergroup differences and common time trends, province-fixed effects (θj) and time-fixed effects (πt) are controlled in the model. α and εit are intercept terms and errors, respectively, and β1 and γ are vectors of parameters to be estimated. Table 1 depicts the definition and measurement of the main variables.
Table 2 summarizes the descriptive statistics of the dataset. With 2013 as a base year, the average real housing price at the city level is 4903 RMB/m2 (it ranges from 2104 RMB/m2 to 34,158 RMB/m2). On average, 19,900 housing units have been redeveloped in the shantytown areas in each city per year. The average real GDP per capita (the base year is 2013) is 48,100 RMB, and the average land price is RMB 5.8 million per ha. Between 2014 and 2018, the average medium- and long-term loan interest rate (3–5 years) is 4.99%. About 27% of the cities are provincial capitals or in the list of 70 largest cities in China, and the shortest distance from each city to the three major ports of Hong Kong, Shanghai, and Tianjin is 850 km on average.
4.3. Endogeneity
Equation (1) examines the impact of shantytown redevelopment on housing prices at the city level, but an inverse causality between shantytown redevelopment and housing prices may occur as cities with higher house prices probably provide the local government with more incentive to advance shantytown redevelopment. In addition, the omitted variable in the model may also affect the size of shantytown redevelopment as well as the housing prices. Hence, the key explanatory variable seems endogenous.
To address this concern, this paper follows Eriksen and Rosenthal (2010) [38] and constructs an instrumental variable for the endogenous variable, which is the planned size of shantytown redevelopment at the provincial level at the beginning of the year multiplied by the share of each city’s population in the province at the end of the previous year. This happens at province level because the provincial government is responsible for formulating the province’s shantytown redevelopment plan, and it then allocates these tasks according to the socioeconomic status and financial capacity of each city, which is exogenous with regard to the housing price level of each city.
The two-stage least squares (2SLS) strategy is further employed to estimate the impact of shantytown redevelopment on housing prices. For the first stage:
For the second stage:
In the first stage, Equation (2) is used to predict the size of redeveloped shantytowns for each city, and the variable ln(allocation) in Equation (2) denotes the instrument variable, i.e., the planned size of shantytown redevelopment at the provincial level at the beginning of the year multiplied by the share of each city’s population in the province at the end of the previous year. In the second stage, the predicted value is used as the core explanatory variable, and the coefficient is the causal effect of shantytown redevelopment on housing prices.
5. Results
First, the impact of shantytown redevelopment on housing prices is estimated in Equation (1). Table 3 presents the estimated results of OLS regression.
Column (1) reports the impact of shantytown redevelopment on housing prices, controlling only for year fixed effects and city fixed effects. The estimated coefficient is 0.0162, which is significant at the 10% level, indicating that shantytown redevelopment has a significantly positive effect on housing prices. Since the sample used in this paper is unbalanced panel data, controlling for city-level fixed effects may lead to estimation bias. Therefore, columns (2)–(4) display the results after controlling for province fixed effects instead of city fixed effects.
Compared with column (1), column (2) in Table 3 controls for the province fixed effects instead of the city fixed effects, and the estimated coefficient of shantytown redevelopment is larger and more significant. Column (3) controls for socioeconomic factors such as the natural logarithm of real GDP per capita, the natural logarithm of real land price, and interest rates. The coefficient of shantytown redevelopment is 0.0252 and significant at the 5% level. In addition, cities with higher GDP per capita and land prices also have higher housing price levels. Specifically, for every 10% increase in real GDP per capita, the city’s housing price level increases by an average of 2.84 percentage points, and for every 10% increase in real land prices, the housing price increases by an average of 1.35 percentage points. Interest rates are negatively associated with housing prices; for every 1 percentage point decrease in interest rates, housing prices will rise by 9.56 percentage points. These findings are consistent with the evidence proved in the prior literature [28,39].
Column (4) in Table 3 further controls for urban characteristics, such as whether the city is a provincial capital or one of the 70 largest cities in China, and the shortest distance to the three large ports. The results show that the coefficient of shantytown redevelopment remains positive but is no longer significant. The coefficients of GDP per capita, land prices, and interest rates are slightly lower than those in column (3), but the signs are unchanged. The level of housing prices is on average 17.3% higher in provincial capitals or larger cities than their counterparts. The coefficient of distance to large ports is −0.101 and significant at the 10% level, indicating that the longer the distance to large ports, the lower their house price levels. This finding is consistent with the finding from Lu et al. (2014) [35].
To address the endogeneity caused by possible reverse causality and omitted variables between shantytown redevelopment and housing prices, the impact of shantytown redevelopment on housing prices is further analysed by using a two-stage least squares estimation in Equations (2) and (3). Table 4 reports the estimation results of the first- and second-stage regressions. First, the validity of the instrumental variable is tested, and the values of the Cragg–Donald Wald F-statistic are 87.04, 65.67, and 49.18, all of which are greater than the empirical value of 10, indicating that there is no weak instrumental variable problem, and that the instrumental variable is valid.
The first part of Table 4 reports the results of the first-stage regression, and the second part reports the estimation results of the second-stage regression. In column (1), after controlling for year fixed effects and province fixed effects, the first-stage regression results show that the coefficient of the instrumental variable is 0.576 and significant at the 1% level; the second-stage regression results show that the effect of shanty redevelopment on housing prices remains significantly positive, and the coefficient value is significantly higher than the coefficient in column (2), Table 3. Column (2) is in line with column (3) in Table 3, the coefficient of shantytown redevelopment is 0.215 and is significant at the 1% level. Column (3) is in line with column (4) of Table 3, and the estimation results indicate that after controlling for socioeconomic and urban characteristics, shantytown redevelopment has a significantly positive impact on housing prices, with an average increase of 1.4 percentage points in urban housing prices for every 10% increase in the size of redeveloped shantytowns. The difference is mainly due to the fact that potentially omitted variables tend to result in underestimating the positive effect of shantytown redevelopment on housing prices. For example, urban characteristic factors such as temperature and topography of a city may affect both shantytown redevelopment and housing prices [40,41], which in turn makes the estimator biased.
Given the inequalities in the regional levels of economic development, natural endowment, and urban governance in China, there may be regional differences in the economic effects of shantytown redevelopment. In addition, the government policy on shantytown redevelopment seems to favor the middle and western regions3. To this end, a dummy variable is constructed based on the regional distribution of cities, taking the value of 1 if the city is located in the eastern region and 0 otherwise. Then, the interaction between the variable of the size of redeveloped shantytowns and the region dummy variable is added into the Equation (3). If the coefficient of this interactive term is significant, it indicates that the regional heterogeneity of shantytown redevelopment does exist. Table 5 reports the estimation results of the regional heterogenous effect. The columns in Table 5 are in line with those of Table 4, and the results in all three columns show that the coefficients of the interaction term are significantly negative, suggesting that shantytown redevelopment has a higher impact on housing prices in the middle and western regions than in the eastern region. A possible explanation is that the national support policies are more favorable to the central and western regions, and the local governments in the central and western regions pay more attention to shantytown redevelopment, which in turn has a stronger economic effect.
6. Discussion and Conclusions
Over the past 40 years, China has experienced rapid urbanization and subsequent socioeconomic changes, which have caused a series of urban challenges such as urban decline, urban poverty, and spatial exclusion. Since its inception in 2005, the shantytown redevelopment program has become one of the largest humanitarian projects and the most remarkable policy intervention in China’s urban built environment. By 2020, around 100 million people had benefited from it. During the transformation of shantytowns, dilapidated buildings are demolished while new housing units are built, and the urban built environment is restructured [1]. This creates strong housing investment and demand.
To date, little is known about the association between shantytown redevelopment and housing prices. Based on the prefectural city level data from 2014–2018, this paper employs a fixed effects regression model and instrumental variables (IV) methods to identify the impact of shantytown redevelopment on housing prices. The results show that shantytown redevelopment in China is an important driver of the escalating housing prices. To address the reverse causal effect between shantytown redevelopment and housing prices, and the endogeneity problem caused by potential omitted variables in this paper, the planned size of shantytown redevelopment at the provincial level is multiplied by the population share of each city in the province as the instrumental variable. Two-stage least squares estimation was then employed to analyse the casual effect of shantytown redevelopment on housing prices. The results show that each 10% increase in the size of redeveloped shantytowns will lead to an increase of 1.4% in urban housing prices. This effect is significantly larger in the middle and western regions of China.
To address the mechanism behind the impact of shantytown redevelopment on housing prices, we need to clarify what policies the government introduced when stimulating shantytown redevelopment, and what changes in urban spatial structure and land use patterns occurred in the process of redevelopment, which intentionally or unintentionally contribute to the rise in housing prices. Due to data limitations, it is difficult to further empirically analyse the mechanism; instead, it can be explained from the perspective of stylized facts.
One reasonable explanation is that the financial support policy for shantytown redevelopment plays a crucial role in housing prices. In 2014, the General Office of the State Council issued document No. 36 Notice of the General Office of the State Council on Further Strengthening the Work of Shantytown Redevelopment, which stipulates the establishment of a professional financial department of China Development Bank, aiming to provide financial support for shantytown redevelopment and resettlement compensation. In 2015, the State Council highlighted cash-based compensation for resettling original residents in shantytown areas. Since then, the proportion of cash-based resettlement has exceeded that of in-kind resettlement, becoming the main way to resettle residents during the redevelopment. Table 6 presents the percentage of cash-based compensation for resettlement in several cities in 2017. Unlike the “one-for-one” compensation method of in-kind resettlement, cash-based resettlement involves the use of direct monetary compensation to resettle original residents. Upon receiving monetary compensation, they will enter the housing market to buy housing, which will increase the overall demand for housing; thus, raising housing prices.
Another explanation is that shantytown redevelopment is able to revitalize the inner city. Shantytowns feature a high concentration of low-income households, dilapidated housing, lack of infrastructure, and poor living environments [32,34]. After redevelopment, shantytowns are demolished and rebuilt with improved green areas, public transport, commercial services, and other municipal facilities, which significantly changes urban spatial structure and improves the quality of the living environment. Today, urban residents increasingly prefer and rely on the quality of their living environment, and people are more willing to pay higher housing costs for a better living environment [26]. By improving the urban environment and enhancing the quality of the city, redeveloped shantytowns are attractive to the middle- and high-income groups, stimulating their housing demand, which in turn raises housing prices.
The data on the size of redeveloped shantytowns were collected from each city’s government work reports, and because records of shantytown redevelopment were not always found for each city in work reports every year, these cities were omitted from the sample as they may have made the estimator biased. This is the data limitation encountered in this study. Another limitation of this study is that the impact of shantytown redevelopment on housing prices was examined at the city level, while the housing price divergence in the inner city was overlooked and needs to be further studied in the future.
The findings of this paper have important implications for the shantytown redevelopment policy. The large-scale shantytown redevelopment nationwide is considered as a remarkable humanitarian project. The primary policy goal is to improve the housing conditions of low-income residents living in shantytowns and reshape the urban built environment. However, this paper presents evidence that shantytown redevelopment is highly associated with housing price increases, especially in the middle and western regions of China. The rising housing prices are likely to cause new social and spatial inequalities and negatively affect the housing affordability for households not included in the shantytown redevelopment programs. Even though the Chinese central government had committed to completing large-scale shantytown redevelopment in 2020, a more inclusive urban regeneration policy needs to be reconsidered in the future.
Funding
This research was funded by Dutch Research Council (NWO), grant number 482.19.607. The APC was funded by Dutch Research Council (NWO), grant number 482.19.607.
Data Availability Statement
Data can be accessed from https://doi.org/10.17026/dans-z5y-ckez.
Acknowledgments
Special thanks to Anping Chen, Qichao Liu, Nico Heerink, the anonymous referees and the editor of this journal for their constructive comments and suggestions. Financial support from Dutch Research Council (NWO) is gratefully acknowledged.
Conflicts of Interest
The authors declare no conflict of interest.
| 1 | The full text of the National New Urbanization Plan (2014–2020): https://www.chinawaterrisk.org/research-reports/national-new-urbanization-plan-2014-2020/. |
| 2 | Dezhou is a prefecture-level city in the northwest of Shangdong province, China, which is the author’s hometown. |
| 3 | According to the 2017 annual report of China Development Bank, 66% of loans in terms of shantytown redevelopment are allocated to the west and middle regions. |
References
- He, S.; Zhang, M.; Wei, Z. The state project of crisis management: China’s Shantytown Redevelopment Schemes under state-led financialization. Environ. Plan. A Econ. Space 2020, 52, 632–653. [Google Scholar] [CrossRef]
- Liu, R.; Wong, T.-C. Urban village redevelopment in Beijing: The state-dominated formalization of informal housing. Cities 2018, 72, 160–172. [Google Scholar] [CrossRef]
- Gao, Y.; Shahab, S.; Ahmadpoor, N. Morphology of urban villages in China: A case study of dayuan village in Guangzhou. Urban Sci. 2020, 4, 1–23. [Google Scholar] [CrossRef]
- Hussain, T.; Abbas, J.; Wei, Z.; Shakeel, A.; Bi, X.; Zhu, G. Impact of urban village disamenity on neighboring residential properties: Empirical evidence from Nanjing through hedonic pricing model appraisal. J. Urban Plan. Dev. 2021, 147, 04020055. [Google Scholar] [CrossRef]
- Yuan, Y.; Song, W. Mechanism and Effect of Shantytown Reconstruction under Balanced and Full Development: A Case Study of Nanjing, China. Sustainability 2020, 12, 7979. [Google Scholar] [CrossRef]
- Eftimoski, M.; McLoughlin, K. Housing policy and Economic Growth in China. 2019, 1–24. Available online: https://www.rba.gov.au/publications/bulletin/2019/mar/housing-policy-and-economic-growth-in-china.html (accessed on 5 February 2023).
- Helms, A.C. Understanding gentrification: An empirical analysis of the determinants of urban housing renovation. J. Urban Econ. 2003, 54, 474–498. [Google Scholar] [CrossRef]
- Wu, F. State dominance in urban redevelopment: Beyond gentrification in urban China. Urban Aff. Rev. 2016, 52, 631–658. [Google Scholar] [CrossRef] [Green Version]
- Liu, C.; Liu, X. Adaptive Reuse of Religious Heritage and Its Impact on House Prices. J. Real Estate Financ. Econ. 2022, 64, 71–92. [Google Scholar] [CrossRef]
- Woo, A.; Lee, S. Illuminating the impacts of brownfield redevelopments on neighboring housing prices: Case of Cuyahoga County, Ohio in the US. Environ. Plan. A Econ. Space 2016, 48, 1107–1132. [Google Scholar] [CrossRef]
- Schwartz, A.E.; Ellen, I.G.; Voicu, I.; Schill, M.H. The external effects of place-based subsidized housing. Reg. Sci. Urban Econ. 2006, 36, 679–707. [Google Scholar] [CrossRef]
- van Duijn, M.; Rouwendal, J.; Boersema, R. Redevelopment of industrial heritage: Insights into external effects on house prices. Reg. Sci. Urban Econ. 2016, 57, 91–107. [Google Scholar] [CrossRef]
- Zhang, S.; van Duijn, M.; van der Vlist, A. The external effects of inner-city shopping centers: Evidence from the Netherlands. J. Reg. Sci. 2020, 60, 583–611. [Google Scholar] [CrossRef] [Green Version]
- Zhang, Y.; Zheng, S.; Song, Y.; Zhong, Y. The Spillover Effect of Urban Village Removal on Nearby Home Values in Beijing. Growth Change 2016, 47, 9–31. [Google Scholar] [CrossRef]
- Wu, W.; Wang, J. Gentrification effects of China’s urban village renewals. Urban Stud. 2017, 54, 214–229. [Google Scholar] [CrossRef]
- Glaeser, E.L.; Sacerdote, B. The social consequences of housing. J. Hous. Econ. 2000, 9, 1–23. [Google Scholar] [CrossRef] [Green Version]
- Shaw, M. Housing and public health. Annu. Rev. Public Health 2004, 25, 397–418. [Google Scholar] [CrossRef] [Green Version]
- Gabriel, S.; Painter, G. Why affordability matters. Reg. Sci. Urban Econ. 2020, 80, 103378. [Google Scholar] [CrossRef]
- Kalinowski, S. A multidimensional comparative analysis of poverty statuses in European Union countries. Int. J. Econ. Sci. 2022, 11, 146–160. [Google Scholar]
- Hromada, E.; Cermakova, K. Financial Unavailabili of Housing in He Czech Republic and Recommenda Ions for Is Solu IoN. Int. Ournal Econ. Sci. 2021, 10, 47–57. [Google Scholar]
- Ihlanfeldt, K.R. The effect of land use regulation on housing and land prices. J. Urban Econ. 2007, 61, 420–435. [Google Scholar] [CrossRef]
- Glaeser, E.L.; Gyourko, J.; Saks, R. Why is Manhattan so expensive? Regulation and the rise in housing prices. J. Law Econ. 2005, 48, 331–369. [Google Scholar] [CrossRef] [Green Version]
- Čermáková, K.; Hromada, E. Change in the Affordability of Owner-Occupied Housing in the Context of Rising Energy Prices. Energies 2022, 15, 1281. [Google Scholar] [CrossRef]
- Borgersen, T.-A. A Housing Market with Cournot Competition and a Third Housing Sector. Int. J. Econ. Sci. 2022, 11, 13–27. [Google Scholar] [CrossRef]
- Rosen, S. Hedonic prices and implicit markets: Product differentiation in pure competition. J. Political Econ. 1974, 82, 34–55. [Google Scholar] [CrossRef]
- Glaeser, E.L.; Kolko, J.; Saiz, A. Consumer city. J. Econ. Geogr. 2001, 1, 27–50. [Google Scholar] [CrossRef]
- Capozza, D.R.; Hendershott, P.H.; Mack, C.; Mayer, C.J. Determinants of Real House Price Dynamics; National Bureau of Economic Research Cambridge: Cambridge, MA, USA, 2002. [Google Scholar]
- Favara, G.; Imbs, J. Credit supply and the price of housing. Am. Econ. Rev. 2015, 105, 958–992. [Google Scholar] [CrossRef] [Green Version]
- Mussa, A.; Nwaogu, U.; Pozo, S. Immigration and housing: A spatial econometric analysis. J. Hous. Econ. 2017, 35, 13–25. [Google Scholar] [CrossRef]
- Zheng, H.W.; Shen, G.; Wang, H. A review of recent studies on sustainable urban renewal. Habitat Int. 2014, 41, 272–279. [Google Scholar] [CrossRef] [Green Version]
- Cole, H.V.; Mehdipanah, R.; Gullón, P.; Triguero-Mas, M. Breaking down and building up: Gentrification, its drivers, and urban health inequality. Curr. Environ. Health Rep. 2021, 8, 157–166. [Google Scholar] [CrossRef]
- Li, X.; Kleinhans, R.; van Ham, M. Shantytown redevelopment projects: State-led redevelopment of declining neighbourhoods under market transition in Shenyang, China. Cities 2018, 73, 106–116. [Google Scholar] [CrossRef] [Green Version]
- Liu, K. Demystifying China’s shantytown renovation program and its effect on real estate price. Chin. Econ. 2019, 52, 249–262. [Google Scholar] [CrossRef]
- Li, G. Renovation of Shantytowns and Construction of New Communities. In Urban Inequality and Segregation in Europe and China; Pryce, G., Wang, Y., Chen, Y., Shan, J., Wei, H., Eds.; Springer: Berlin/Heidelberg, Germany, 2021; pp. 121–152. [Google Scholar]
- Lu, M.; Ou, H.; Chen, B. Rationality or Bubble: An Empirical Study of Urbanization, Migration, and Housing Prices. J. World Econ. 2014, 37, 30–54. [Google Scholar]
- Han, L.; Lu, M. Supply-Demand Mismatch: Solving the Puzzle of China’s Housing Price Divergence. J. World Econ. 2018, 41, 126–149. [Google Scholar]
- Zhang, L.; Nian, Y.; Pi, J.; Zhou, Y. Land Policy, Land Supply Structure and Housing Prices. China J. Econ. 2017, 4, 91–118. [Google Scholar]
- Eriksen, M.D.; Rosenthal, S. Crowd out effects of place-based subsidized rental housing: New evidence from the LIHTC program. J. Public Econ. 2010, 94, 953–966. [Google Scholar] [CrossRef]
- Paciorek, A. Supply constraints and housing market dynamics. J. Urban Econ. 2013, 77, 11–26. [Google Scholar] [CrossRef] [Green Version]
- Saiz, A. The geographic determinants of housing supply. Q. J. Econ. 2010, 125, 1253–1296. [Google Scholar] [CrossRef] [Green Version]
- Liu, X.; Du, C.; Li, S. Natural Geographical Constraints, Land Use Regulations and China’s Housing Supply Elasticity. Econ. Res. J. 2019, 54, 99–115. [Google Scholar]
Figure 1.
Zouli shantytown redevelopment in Dezhou, Shangdong, 2019. Source: photographed by the author.
Figure 1.
Zouli shantytown redevelopment in Dezhou, Shangdong, 2019. Source: photographed by the author.


Table 1.
The definition and measurement of the main variables.
| Variable | Definition | Measurement |
|---|---|---|
| ln(P) | The natural logarithm of real housing prices | Total housing sales divided by the total floor size of sold houses, adjusted in each province by Consumer Price Index (CPI) using 2013 as a base year, then taking the natural logarithm of this. |
| ln(renewal) | The natural logarithm of the size of redeveloped shantytowns | The number of redeveloped housing units in shantytown area, then taking the natural logarithm of this. |
| ln(agdp) | The natural logarithm of real GDP per capita | Nominal GDP per capita divided by the GDP price deflator using 2013 as a base year. |
| ln(lp) | The natural logarithm of real land prices | Total land sales divided by the total size of sold land lots, adjusted in each province by Consumer Price Index (CPI) using 2013 as a base year, then taking the natural logarithm of this. |
| IR | The medium- and long-term (3–5 years) loan interest rate | The medium- and long-term (3–5 years) loan interest rate launched by the People’s Bank of China. |
| large | Whether the city is a provincial capital or one of the 70 largest cities in China | Dummy variable: yes = 1, no = 0. |
| dist | The distance to the nearest major port | The shortest distance to the three major ports: Hongkong, Shanghai, and Tianjin |
Table 2.
Descriptive statistics.
| Unit | Mean | SD | Min | Max | |
|---|---|---|---|---|---|
| Real housing prices | RMB/m2 | 4903 | 2923 | 2104 | 34,158 |
| The size of redeveloped shantytowns | Million housing units | 1.99 | 2.09 | 0.044 | 22.2 |
| Real GDP per/capita | RMB | 48,100 | 26,162 | 10,974 | 201,682 |
| Real land prices | 10 million RMB/ha | 0.58 | 0.82 | 0.014 | 12.502 |
| Interest rate | % | 4.99 | 0.48 | 4.75 | 6.33 |
| Capital or large city | - | 0.27 | 0.45 | 0 | 1 |
| Distance to the nearest major port | 1000 km | 0.85 | 0.52 | 0.065 | 3.665 |
| Observations | 553 |
Table 3.
Baseline estimation results.
| Dependent Variable: ln(P) | (1) | (2) | (3) | (4) |
|---|---|---|---|---|
| ln(renewal) | 0.0162 * | 0.0555 *** | 0.0252 ** | 0.0091 |
| (0.010) | (0.014) | (0.011) | (0.010) | |
| ln(agdp) | 0.284 *** | 0.232 *** | ||
| (0.022) | (0.022) | |||
| ln(lp) | 0.135 *** | 0.109 *** | ||
| (0.014) | (0.013) | |||
| IR | −0.0956 *** | −0.109 *** | ||
| (0.019) | (0.018) | |||
| large | 0.173 *** | |||
| (0.023) | ||||
| dist | −0.101 * | |||
| (0.059) | ||||
| constant | 8.316 *** | 8.297 *** | 6.059 *** | 6.705 *** |
| (0.012) | (0.031) | (0.259) | (0.256) | |
| Year fixed effects | Yes | Yes | Yes | Yes |
| Province fixed effects | No | Yes | Yes | Yes |
| City fixed effects | Yes | No | No | No |
| Observations | 553 | 553 | 535 | 535 |
| Adjusted R2 | 0.946 | 0.524 | 0.766 | 0.793 |
Note: * indicates that the coefficient estimates are significant at the 10% level, ** indicates that the coefficient estimates are significant at the 5% level, and *** indicates that the coefficient estimates are significant at the 1% level. Robust standard errors are reported in parentheses.
Table 4.
The 2SLS estimation results.
| (1) | (2) | (3) | |
|---|---|---|---|
| First-stage regression, dependent variable: ln(renewal) | |||
| ln(allocation) | 0.576 *** | 0.520 *** | 0.513 *** |
| (0.067) | (0.071) | (0.083) | |
| Second-stage regression, dependent variable: ln(P) | |||
| ln(renewal) | 0.236 *** | 0.215 *** | 0.140 *** |
| (0.050) | (0.047) | (0.044) | |
| ln(agdp) | 0.328 *** | 0.280 *** | |
| (0.031) | (0.031) | ||
| ln(lp) | 0.0712 *** | 0.0773 *** | |
| (0.027) | (0.024) | ||
| IR | −0.0808 *** | −0.0927 *** | |
| (0.029) | (0.025) | ||
| large | 0.118 *** | ||
| (0.030) | |||
| dist | −0.0598 | ||
| (0.089) | |||
| constant | 7.998 *** | 5.277 *** | 5.934 *** |
| (0.101) | (0.397) | (0.382) | |
| Year fixed effects | Yes | Yes | Yes |
| Province fixed effects | Yes | Yes | Yes |
| Observations | 405 | 396 | 396 |
| Adjusted R2 | 0.411 | 0.630 | 0.733 |
| Cragg–Donald Wald F-value | 87.04 | 65.67 | 49.18 |
Note: * indicates that the coefficient estimates are significant at the 10% level, ** indicates that the coefficient estimates are significant at the 5% level, and *** indicates that the coefficient estimates are significant at the 1% level. Robust standard errors are reported in parentheses.
Table 5.
Heterogenous effect: 2SLS estimation results.
| Dependent Variable: ln(P) | (1) | (2) | (3) |
|---|---|---|---|
| ln(renewal) | 0.292 *** | 0.254 *** | 0.173 *** |
| (0.055) | (0.053) | (0.046) | |
| ln(renewal) east | −0.374 ** | −0.239 * | −0.231 * |
| (0.168) | (0.127) | (0.125) | |
| Socioeconomic factors | No | Yes | Yes |
| City characteristic factors | No | No | Yes |
| Year fixed effects | Yes | Yes | Yes |
| Province fixed effects | Yes | Yes | Yes |
| Observations | 405 | 396 | 396 |
| Adjusted R2 | 0.371 | 0.595 | 0.706 |
| Cragg–Donald Wald F-value | 32.73 | 29.55 | 22.87 |
Table 6.
The percentage of cash-based compensation for resettlement in several cities in 2017.
| City | Dongying | Anyang | Ankang | Qitaihe | Qingyang | Suqian | Deyang | Chaoyang | Weinan |
|---|---|---|---|---|---|---|---|---|---|
| Percentage of cash-based compensation (%) | 49.6 | 50 | 74.5 | 82.5 | 89 | 91 | 95 | 100 | 100 |
Source: The municipal government work reports.
Disclaimer/Publisher’s Note: The statements, opinions and data contained in all publications are solely those of the individual author(s) and contributor(s) and not of MDPI and/or the editor(s). MDPI and/or the editor(s) disclaim responsibility for any injury to people or property resulting from any ideas, methods, instructions or products referred to in the content. |
© 2023 by the author. Licensee MDPI, Basel, Switzerland. This article is an open access article distributed under the terms and conditions of the Creative Commons Attribution (CC BY) license (https://creativecommons.org/licenses/by/4.0/).
Share and Cite
MDPI and ACS Style
Liu, C. Shantytown Redevelopment and Housing Prices: Empirical Evidence from Chinese Cities. Land 2023, 12, 823. https://doi.org/10.3390/land12040823
AMA Style
Liu C. Shantytown Redevelopment and Housing Prices: Empirical Evidence from Chinese Cities. Land. 2023; 12(4):823. https://doi.org/10.3390/land12040823
Chicago/Turabian StyleLiu, Caixia. 2023. "Shantytown Redevelopment and Housing Prices: Empirical Evidence from Chinese Cities" Land 12, no. 4: 823. https://doi.org/10.3390/land12040823
Note that from the first issue of 2016, this journal uses article numbers instead of page numbers. See further details here.