1. Introduction
According to the World Health Organization (WHO), 16% of the world’s population has a disability (as of December 2022). In particular, the number of people with disabilities living in cities has been increasing as a result of factors such as the growing number of urban residents, the increase in the number of older people with disabilities due to the population aging, the spread of chronic diseases through modern lifestyle habits, and the diversification of disability types due to improvements in the methods used for disability measurement [
1,
2]. For these reasons, many countries have emphasized institutional support for people with disabilities as part of their sustainable urban policy goals, and welfare models for people with disabilities have become a major topic in many academic research fields [
3].
South Korea recently experienced strong protests by a disability advocacy group (Solidarity Against Disability Discrimination: SADD) in 2022. The group occupied public transportation in Seoul to demand the right to mobility for people with disabilities living in Seoul and the elimination of discrimination against people with disabilities, which became a social issue [
4]. Due to this background, it has become more important in Korea to understand the thoughts and values of people with disabilities living in cities.
Therefore, this study focuses on Seoul, a representative city in Korea. Regarding people with disabilities living in Seoul, the following research questions were established: Are they happy in the city? What urban factors are necessary for their happiness? What urban factors affect the happiness of people with disabilities compared to people without disabilities? What is the structural relationship among the factors?
To address the research questions, the objectives of this study are as follows. First, this study aims to identify the demographic characteristics and the happiness levels of people with and without disabilities living in Seoul. Second, using data adopted from the Seoul Survey, official panel survey data of Seoul, this study extracts and identifies various urban factors that affect the happiness of people with disabilities. Under this objective, we set up a multidimensional structural model for the relationships of complex urban factors and identified determinants of the happiness of people with disabilities by using the structural equation model (SEM). Third, this study used partial least squares multi -group analysis, which represents differences and characteristics through a comparison between multiple groups among structural equation models. After setting the analysis group (disabled) and the contrasting group (non-disabled) according to PLS-MGA, the structure and characteristics of the urban factors that determine the happiness of people with disabilities were identified. In addition, by comparing the difference with the non-disabled group, we intend to provide policy implications for the people with disabilities at the city level.
A flow chart to help understand the study is as follows. First, in
Section 2, we review the concept, types, statistics, and current situation of people with disabilities living in Korea and in Seoul, which is the spatial scope of the study. Next, in
Section 3, we examine the academic trends of theoretical concepts of happiness and related research through a literature review. In
Section 4, we explain the materials, variables, and methodology used in the analysis, and we then confirm the characteristics of the data through an exploratory data analysis. We then construct the conceptual model of the research. The analysis of this study is conducted in
Section 5, where we evaluate the measurement model, measurement invariance, and structural model before analyzing the path modeling in PLS-MGA. Through the discussions in
Section 6, we summarize the analysis results, and the research is finalized in
Section 7.
2. Status of People with Disabilities in Korea and Seoul
In Korea, a person with a disability is defined under Article 2 (Definitions of Persons with Disabilities) of the “Act on Welfare of Persons with Disabilities” as “a person whose daily life or social activity is substantially hampered by physical or mental disability over a long period of time”. Here, physical disability refers to “a disability of principal external bodily functions and of internal organs, etc.”, and mental disability refers to “a disability caused by psychological development disorder or mental disease.”
Disabilities are classified into 15 types based on the previously mentioned physical and mental disabilities: physical-external disabilities, such as (1) physical disabilities, (2) brain lesions, (3) visual disturbance, (4) auditory disorder, (5) language disorder, and (6) facial nerve disorders; physical-internal disabilities, such as (7) kidney, (8) heart, (9) liver, (10) respiratory, (11) urinary, and (12) epilepsy; mental-developmental disabilities, such as (13) intellectual disability and (14) autism; and mental-psychiatric disabilities, such as (15) insanity [
5].
According to an announcement by the Ministry of Health and Welfare in Korea, the registered disabled population in 2021 was a total of 2,644,700 people, accounting for approximately 5.1% of the total population. Furthermore, the proportion of elderly disabled people aged 65 or older has been steadily increasing (from 38.0% in 2011 to 51.3% in 2021) [
6]. The number of registered disabled people in Seoul, the representative major city of Korea, is 392,123, which is a significant proportion (14%) of the total registered disabled population in Korea: the proportion of people with disabilities in Seoul’s resident population (9,736,027) is 4%. In addition, most disabled people reside in urban areas, with 42.3% of disabled people in Korea living in the metropolitan areas of Seoul, Incheon, and Gyeonggi [
7].
For these reasons, Korea has making efforts to create and provide a comfortable environment for people with disabilities at the city level: There are representative examples such as disabled parking areas, low-floor buses, and disabled taxis. In addition, economic, cultural, and social welfare and support policies related to the disabled have been promoted, such as free public transportation, discounts on utility bills and telecommunications, disability pensions and benefits, and the provision of medical and welfare facilities, education, and childcare services [
6].
However, people with disabilities in Korea still face difficulties in their daily lives in the city due to mobility limitations, difficulties in using public transportation, and a lack of convenience and medical facilities [
6]. In addition, they have expressed dissatisfaction with policies that do not fully understand the current status and needs of disabled people and have been conducting long-term protests [
4]. Therefore, this study aims to identify the basic characteristics and states of happiness of people with disabilities living in Seoul, Korea, and to determine what urban factors are necessary for them to be happy.
3. Literature Review
In Korea, the concept of happiness is defined as follows: according to the Standard Korean Language Dictionary, it is “a state of feeling sufficient satisfaction and joy in life”; according to Article 10 of the “Constitution of the Republic of Korea”, it is “the basic human dignity and value that every citizen possesses, and the inviolable basic human rights that individuals have”; according to OECD, it is “good mental state”; and academically, it is defined as a positive emotion or satisfaction from a micro perspective, and the degree to which an individual evaluates their own life favorably and positively from a macro perspective [
8].
In contrast to the personal and subjective definition of happiness, attempts to measure human happiness have been based on a set of indicators. The World Happiness Index, developed by the United Nations (UN) Sustainable Development Solutions Network, ranks countries by happiness based on six comprehensive and potentially disparate indices [
9]: GDP per capita, social support, healthy life expectancy, freedom to make life choices, generosity, and perceptions of corruption. At the city level, happiness is measured on a Likert scale, using surveys of citizens [
10,
11,
12]. Since measuring the happiness of citizens serves as a major means for evaluating policy and governance, large cities such as Seattle, Seoul, and California monitor their citizens’ happiness levels on an annual basis [
13].
Recently, as the UN’s “New Urban Agenda” has identified “Sustainable Urban Development” and “Cities for All” as core values for cities [
14], considering people with disabilities in cities has become a major value [
15]. This is because despite the fact that urban environments, infrastructure, public facilities, and services should be accessible to all members of a city’s population, people with disabilities are often excluded or face problems relating to a lack of accessibility in the context of urban planning and development [
16,
17].
To address this issue, cities are providing support in physical ways, such as the application of universal design [
18], and through means of software, adjusting the direction of policies by measuring the life satisfaction, happiness, and depression of people with disabilities [
19,
20]. This shows that to ensure their qualitative growth, cities must deeply consider the psychological wellbeing of people with disabilities and those without disabilities [
21].
Regarding previous studies on disability and happiness, research in the field of disability studies has focused on measuring happiness among people with disabilities, comparing happiness levels by type and severity of disability, and studying the happiness of parents or caregivers of children with disabilities [
22,
23,
24,
25,
26,
27,
28]. One common conclusion that has been mentioned in disability research is that the happiness level of people with disabilities is lower than that of non-disabled people [
20,
29], meaning that non-disabled people are happier than people with disabilities because happiness is closely related to health. In the field of urban studies, research has primarily focused on comparing the happiness levels of people with disabilities who live in urban and rural areas [
30,
31] or identifying actors that hinder the happiness of people with disabilities in terms of accessibility to the urban physical environment [
20].
The results of the literature review show that there has been a relative lack of research in disability studies on identifying the factors that determine the happiness of people with disabilities because most research has focused on measurement or comparisons of happiness levels. Meanwhile, in urban studies, despite the fact that happiness is a multidimensional emotional system [
32,
33], determinants of the happiness of people with disabilities have been identified using only cross-sectional analyses, such as a multilevel analysis or regression [
34]. However, the results of the cross-sectional analyses cannot reveal which factors precede happiness, and they cannot capture the processes of higher-level emotional recognition that occur among the multivariate determinants of happiness. It was only recently that studies on happiness in urban populations attempted to identify the various factors that lead to happiness by using multidimensional approaches [
35]. Furthermore, even studies that compare the happiness of people with and without disabilities and use multidimensional approaches to analyze structural relationships are not enough.
In this context, the present study aims to use scholarly and statistical approaches to investigate the perceptions and values of people with disabilities living in a city. In particular, we explore the happiness of people with disabilities living in Seoul, a representative city of South Korea and a member of the UN Convention, and determine whether the happiness levels of people with disabilities are lower than those of people without disabilities, as has been suggested by previous studies. Additionally, this study seeks to identify, through multidimensional structural relationships, the following: what urban characteristics do people with disabilities need to live happily in a city, and what is the relationship between the urban factors they desire?
4. Materials and Methodology
4.1. Materials and Variables for Analysis
This study utilized data from the 2021 Seoul Survey as the materials for analysis. The Seoul Survey is a panel survey of the Seoul Metropolitan Government and an urban policy indicator survey. It has been conducted annually since 2015 for the purpose of analyzing urban change and evaluating policy performance, making it an excellent source of information on citizens’ perceptions and values [
36]. In this study, analyses were performed using a total of 16,225 samples after excluding invalid samples from the initial sample of 20,000 from the 2021 Seoul Survey data. The sample of 20,000 people who responded to the survey accounts for 2% of the population of Seoul (9,736,027 people) in 2021; it was obtained through probabilistic sampling across the entire city. Samples of people with and without disabilities were subsequently extracted from the initial sample. The survey questions in the Seoul Survey included a question on whether the respondent has a disability. Therefore, the sample in the group with disabilities in this study comprised respondents who indicated that they have a disability. The term “disability” refers to people who have been diagnosed with a disability by a disability diagnosis agency, according to the types and grades of disability based on the criteria for people with disabilities in Korea. Thus, the sample extracted of people with disabilities was 199 (1.2%), while the comparison group consisted of 16,026 people without disabilities (98.8%).
The variables for the analysis were selected based on the Seoul Survey data and relevant previous studies [
20,
30,
31,
34,
37]. The dependent variables were the happiness indices in five areas (health, finances, relationships, family life, and social life), and the independent variables were factors related to urban characteristics, such as residential, economic, culture and leisure, transport, urban safety, social capital, and urban living environment (
Table 1).
4.2. Exploratory Data Analysis
An exploratory data analysis was been conducted to identify the sample characteristics of people with and without disabilities. Through the exploratory data analysis, the demographic characteristics and differences in happiness levels between the groups of people with and without disabilities were examined, and the normality of the dependent variable was conducted to ensure that the data were suitable for analysis. R programming was used for exploratory data analysis.
First, we confirmed the sociodemographic characteristics of each group (
Table 2). The representative characteristics of the disabled group were mainly those living with three family members (27.0%), residing in the northeastern region (31.9%), being mostly in their forties (28.1%), and working in white-collar occupations (51.8%). In contrast, the characteristics of the non-disabled group were those living with two family members (28.1%), residing in the northeastern region (34.2%), having a majority of elderly individuals aged in their sixties and above (34.2%), and working in white-collar occupations (48.7%).
After comparing happiness levels by group (
Table 3), among the five areas (health, finance, relationships, family life, and social life) of happiness, it was found that the happiness level of the disabled group appeared in the order of family life, relationships, social life, health, and financial status. Meanwhile, the happiness level of the non-disabled group was ranked in the order of health, family life, relationships, social life, and financial status. As shown in
Table 3, the happiness level of non-disabled individuals was higher than that of disabled individuals in all five areas, confirming that the results were consistent with previous studies [
20,
29]. Furthermore, non-disabled individuals showed the highest level of happiness related to health, while disabled individuals showed the highest level of happiness stemming from their family life.
The Kolmogorov–Smirnov test was then used to determine the normality and stationarity of the dependent variables. The test results showed that the significance levels of all five happiness factors for the input, analysis, and contrasting groups were less than 0.05 (
Table 4). Putting together the results of
Table 4 and the skewness (<3.0) and kurtosis (<7.0) values in
Table 3, the results indicate that the data were not normally distributed.
4.3. Methodology and Models
The methodology used by this study to achieve its objectives was the partial least squares multi-group analysis (PLS-MGA). The PLS-MGA is a multigroup analysis technique based on PLS-SEM (partial least squares structure equation modeling), which was proposed by Keil [
38] and Chin [
39,
40]. PLS-SEM is a second-generation multivariate analysis method that has been widely used in recent years [
41], and principal component-based PLS-SEM has been widely used in path analysis because it has advantages such as its efficient parameter estimation, high statistical power, and non-rigidity with respect to sample size and residual distribution over first-generation, covariance-based structural equation modeling (CB-SEM) [
34].
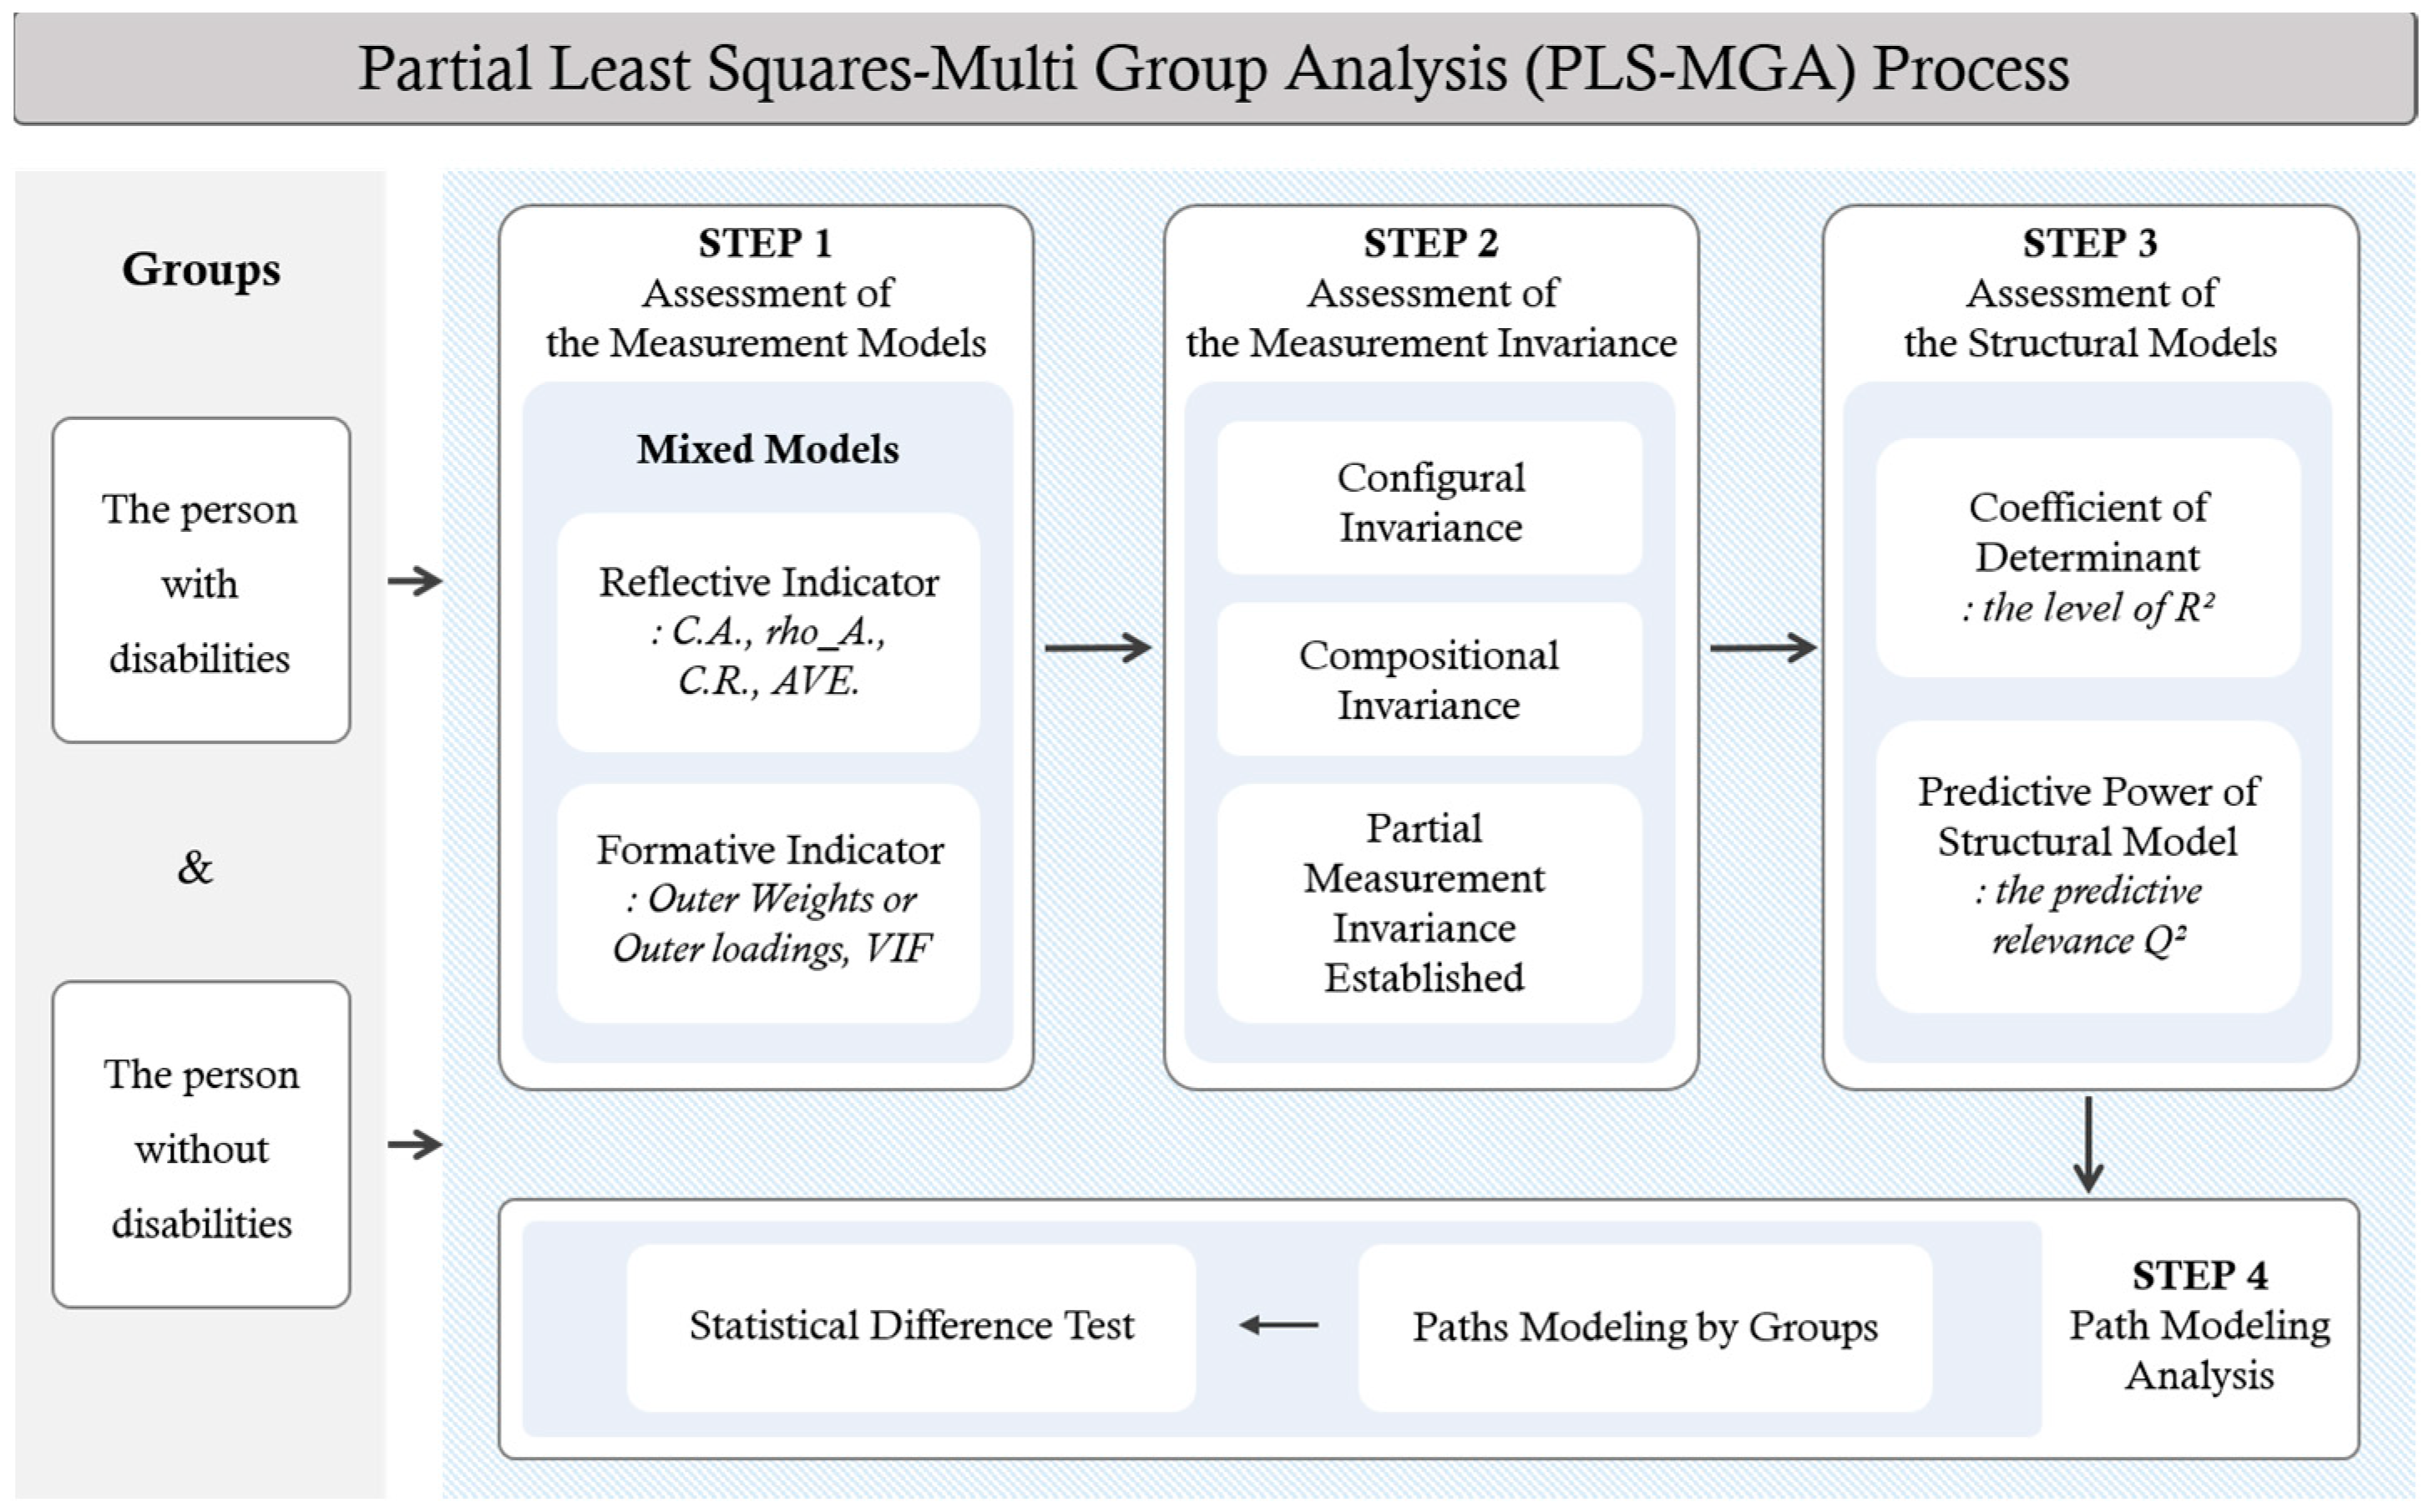
The results of the exploratory data analysis confirmed that the PLS path analysis was suitable because the distribution of the Seoul Survey data used in the analysis was non-normal. In addition, since this study set people without disabilities as a control group for people with disabilities and aimed to compare the two groups, the PLS-MGA was selected among PLS path analysis methods as the analysis method for the study. The PLS-MGA tests the nonparametric significance of differences in the results between groups based on the results of bootstrapping in the PLS path model. The PLS-MGA has the advantage of being able to analyze groups with a small sample size because the analysis is performed by classifying the data by group after entering the entire sample, unlike the commonly used method with which the researcher classifies n groups and then analyzes each of the n models. The formula [
40] and analysis process of the PLS-MGA (
Figure 1) are as follows.
Afterwards, based on the previous studies [
42,
43,
44,
45,
46,
47,
48,
49], the structural relationship between the urban factors affecting the level of happiness was confirmed. The path that directly affects the level of happiness was established, and an indirect path was then established based on the following preceding studies: (a) Yu et al. [
43], who found that personal-level factors (private, residential, economic, culture and leisure, and transport) influence happiness through mediating factors such as social capital and urban safety; (b) Francescato et al. [
44], Braubach [
45], and Ahn [
46], who found that personal-level factors influence life satisfaction, and life satisfaction influences human cognitive states such as quality of life and happiness; (c) Park [
47], who found that social capital is more closely related to urban living environment satisfaction than personal-level factors and that living environment satisfaction depends on the level of social capital; (d) Vieno et al. [
48], who found that social capital in cities influences perceptions of safety, and that the higher the social capital, the higher the perceptions of safety; and (e) Yamada et al. [
49], who found that perceptions of safety influence the living environment satisfaction of citizens.
Based on the literature mentioned above, the conceptual research model (structural model) for this study was constructed as follows (
Figure 2).
When constructing the structural models, we preferentially set up latent variables (constructs) and measured variables (indicators). Furthermore, by setting up social capital, urban living environment satisfaction, and seriousness of safety as independent variables (latent variables) and parameters (exogenous latent variables), we constructed structural models with complex and multidimensional paths. By employing the structural models, this study aimed to determine whether the urban factors affecting happiness are unidimensional or multidimensional and if they are multidimensional, what process is used for people with and without disabilities, respectively, to feel happy. In addition, by verifying the following research hypotheses established by previous studies [
42,
43,
44,
45,
46,
47,
48,
49], we intended to identify differences between groups.
Hypothesis 1. There are differences in urban factors affecting happiness by groups.
Hypothesis 2. There are statistical differences in the structural models by groups.
Hypothesis 3. There are different paths of the structural model by groups.
5. Results
5.1. Assessment of Measurement Models
A key consideration in PLS pathway modeling is how to set up a measurement model. There are three types of measurement models: the formative model, reflective model, and mixed model. Depending on which indicators are used, the research model is different. There are two types of measurement indicators, such as formative indicators, which have low correlations between measured variables, and reflective indicators, which have high correlations between measured variables. Survey items that have been constructed as concepts and factors through validation are often used as reflective indicators because they are highly correlated. In this study, however, most latent variables were independent, with low correlations between the measured variables because the urban factors suitable for the study were selected from the Seoul Survey data and reorganized by urban characteristics. Therefore, the measurement model of this study is a mixed model with complexed reflective and formative indicators. As the measures of latent variables, such as happiness level and severity of urban safety, which were taken from the Seoul Survey, were set as reflective indicators, the measurement indicators of other latent variables created by the researcher were established as formative indicators.
The assessment of the mixed model was performed by integrating the formative and reflective models. The purpose of assessing a PLS path model is to check whether the measured variables properly reflect the latent variables. Therefore, latent variables consisting of formative indicators are measured using a variance inflation factor (VIF) and an outer weight or outer loading assessment methods for formative models. Conversely, latent variables consisting of reflective indicators are assessed using Cronbach’s alpha, rho_A, composite reliability (CR), and average variance extracted (AVE) assessment methods for reflective models [
40,
50].
First, according to the validation results of the model with reflective indicators, the Cronbach’s alpha (C.A.), rho_A, composite reliability (C.R.), and average variance extracted (AVE.) of the measured variables of health, financial status, relationship, family life, and social life for happiness as the latent variable were higher than 0.7, establishing their validity. In contrast, for the latent variable of urban safety, validity was established only after deleting the measured variables of natural disaster, infectious disease, economic crisis, unemployment, and accident. Therefore, internet crime, group conflict, corruption, personal information, and violent crime were chosen finally as the measured variables of urban safety.
The next step was the validation of a model with formative indicators. The VIFs of all latent factors for private, culture and leisure, residential, transport, economic, urban living environment, and social capital were lower than the threshold value of 5.0. In addition, the use of outer weights demonstrated that aside from private attributes, the measured variables corresponded to the initially established latent factors, providing evidence for the validity of the measurement model. For private attributes, validity was established when education and occupation were removed from the variables; therefore, the final model included marital status, pet ownership, and status of religion.
Table 5 shows the measured variables for latent variables used in the analyses.
5.2. Assessment of Measurement Invariance
The PLS-MGA requires an assessment of measurement invariance after the measurement model is assessed. Measurement invariance is a characteristic of PLS-MGA for multi-group analysis to ensure multiple measurement models produce the same results when tested under different observation conditions [
40]. The measurement invariance of composite models (MICOM) is assessed by checking the following three elements sequentially: (1) configural invariance, (2) compositional invariance, and (3) partial measurement invariance established [
50]. Therefore, this study tested the MICOM for the different groups (disabled and non-disabled) of the study before conducting the MGA. The results indicated the measurement invariance of the disabled and non-disabled models in all three steps, as shown in
Table 6.
5.3. Assessment of Structural Model
After establishing the measurement model and measurement invariance, we carried out an assessment of the structural model using R
2, which indicates the prediction accuracy of the model, and Q
2, which indicates the prediction fit. An R² value of 0.02–0.12 means that the model has a low prediction accuracy; 0.13–0.25 indicates moderate accuracy, and 0.26 or higher indicates a high accuracy [
34,
51]. The results of the analysis showed that the accuracy of the disabled model and the non-disabled model increased in the paths closer to the dependent variable (happiness level), and all three models showed a high accuracy of approximately 0.4.
A Q
2 value greater than the threshold of 0 means that the model’s predictive fitness is established [
34]. The results of the analysis showed that the disabled model and non-disabled model both had values higher than 0, establishing their predictive adequacy (
Table 7).
5.4. Path Analysis Results in PLS-MGA
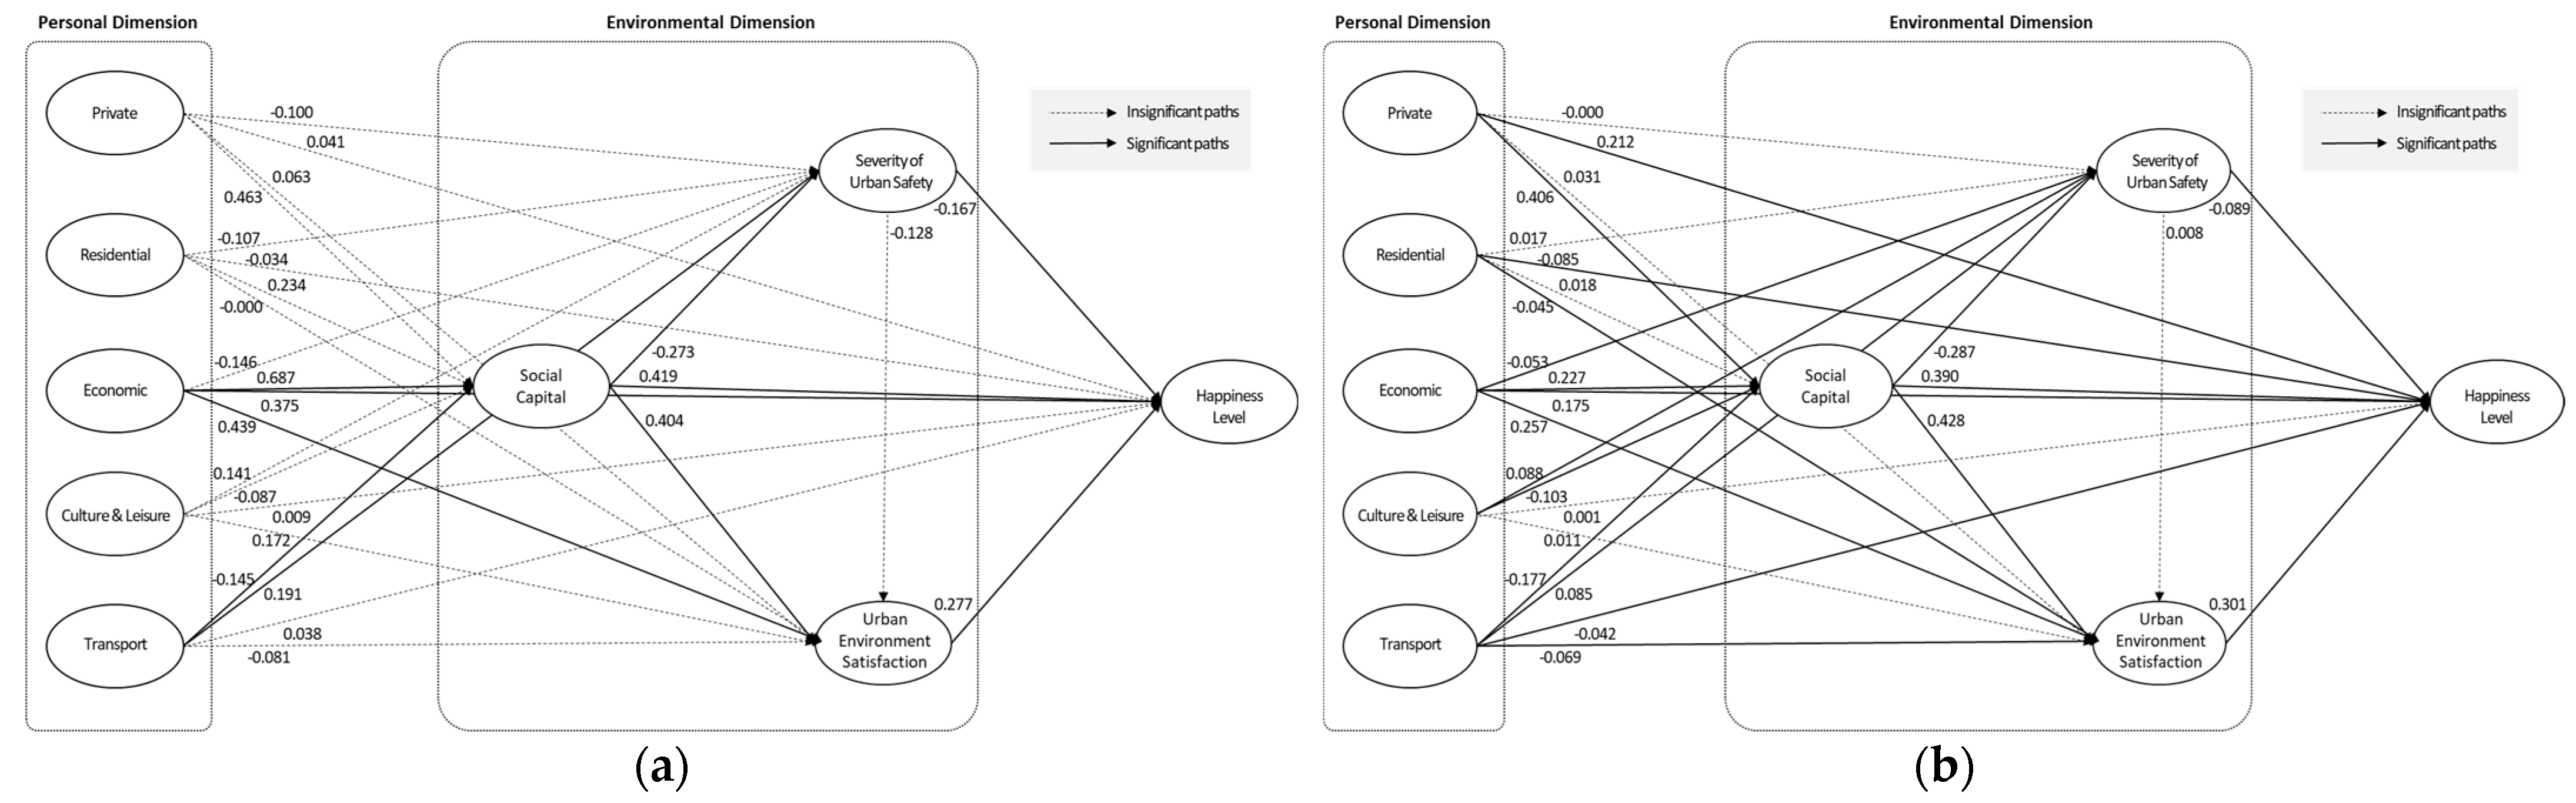
A path analysis in the PLS-MGA was conducted to identify the structural relationship between the urban factors affecting the happiness levels of the analysis model (disabled group) and the contrasting model (non-disabled group).
Figure 3 shows the final structural models that determined the happiness levels of people with and without disabilities, respectively, through a path analysis.
First, according to the results on direct paths to happiness, the happiness levels of people without disabilities were significantly affected by all direct paths except for culture and leisure. Only economic characteristics, social capital, severity of urban safety, and living environment satisfaction significantly affected the happiness levels of people with disabilities. Economic characteristics, social capital, and living environment satisfaction had a positive effect on their happiness, while the severity of urban safety had a negative effect. In other words, for people with disabilities, the factors of pet ownership, religion, marriage, leisure (online or offline), and transport time did not significantly affect happiness directly, while not having debt, high income, high social capital, low severity of urban safety (i.e., high safety), and high living environment satisfaction had a direct impact on happiness. For people without disabilities, similar to those with disabilities, economic characteristics (+), social capital (+), severity of urban safety (−), and living environment satisfaction (+) influenced their happiness, and unlike for people with disabilities, private attributes (+) such as pet ownership, religion, and marriage, transport attributes (−), and residential attributes (−) such as household members and period of residence (−) directly affected their happiness.
In terms of the indirect paths affecting the happiness of people with disabilities, there were fewer significant relationships than those of people without disabilities. In the indirect paths for the disabled group, only the economic, transport, and social capital factors had a significant effect on the levels of happiness, while in the indirect paths of the non-disabled group, all the remaining factors (economic, transport, social capital, private, culture and leisure, and residential) were significant except for the severity of urban safety. First, economic attributes, which had a direct effect on the happiness of people with disabilities, had an indirect effect on happiness through social capital. In addition, social capital also had an indirect effect on happiness through the severity of urban safety and living environment satisfaction, with both direct and indirect effects on happiness. In contrast, there was no direct effect of transport attributes on happiness; however, it affected happiness indirectly through the severity of urban safety. These results suggest that for people with disabilities, as transport time increases, so does the severity of urban safety concerns, and transport negatively affects happiness through the severity of urban safety.
The above results demonstrate that the urban factors and structural relationships that affected the happiness of the disabled and non-disabled groups differed. Furthermore, as a result of confirming the difference between the disabled and non-disabled groups through a statistical test, the differences in the private and economic areas were significant, and the differences in the areas of culture and leisure and social capital were not significant. In addition, significant differences between groups were derived in some areas such as transportation, the severity of urban safety, and residential. Therefore, a statistical difference was confirmed in the path of the structural model between the disabled and the non-disabled groups (
Table 8).
6. Discussion
The implications of the results of the PLS-MGA are as follows. First, in the path model for people without disabilities, most urban factors had a direct or indirect impact on happiness; however, the path model for people with disabilities had fewer significant relationships in all direct and indirect paths than for people without disabilities. These results suggest that urban factors have a greater impact on the happiness of people without disabilities than that of people with disabilities.
Second, in the non-disabled group, all factors of personal dimensions except culture and leisure had a direct effect on happiness, and environmental dimensions such as social capital, urban safety severity, and factors of urban environmental dimensions such as social capital, severity of urban safety, and living environment satisfaction also had a direct effect on happiness. However, for the disabled group, while all factors in urban environmental dimensions such as social capital, severity of urban safety, and living environment satisfaction had a direct impact on happiness, only economic factors in personal dimensions had a direct effect on happiness levels. Additionally, for the indirect paths of people without disabilities, all factors of personal dimensions affected the happiness level, while only economic and transport factors indirectly affected the happiness of people with disabilities. Indirect paths in urban environmental dimensions showed that for both groups, except for the severity of urban safety, only social capital affected happiness levels.
From the results of the comparison between the disabled and non-disabled groups (see
Figure 3), we have identified that the happiness level of people without disabilities has a significant impact on both the personal dimension and the environmental dimension, but the happiness level of people with disabilities has a more significant impact on factors in the environmental dimension than those in the personal dimension. These results suggest that for people with disabilities living in cities, urban or social-level issues are more important in determining happiness levels than personal-level issues [
52].
Third, there were factors that did not directly affect happiness but indirectly affected happiness through mediators: transport factors in the disabled group and culture and leisure in the non-disabled group. For people with disabilities, the increase in transport time did not directly affect happiness, but it decreased happiness levels through the mediation of the severity of urban safety. Therefore, the recent struggle for the mobility rights of people with disabilities in Seoul can be understood as a desperate demand for safe living in the city that goes beyond the demand for the passage rights of people with disabilities.
On the other hand, in the case of people without disabilities, the number of culture and leisure activities, whether online or offline, did not directly affect their happiness but indirectly affected their happiness through various mediators: (a) a mediating pathways only through social capital, (b) mediating pathways through social capital and living environment satisfaction, (c) mediating pathways through social capital and the severity of urban safety, and (d) mediating a pathway only by the severity of urban safety. The results of the direct and indirect pathways allowed this study to confirm that the influence factors of happiness, such as transportation and culture and leisure, shape multidimensional rather than unidimensional structural relationships. These results suggest that the urban factors that determine the level of human happiness have a complex multidimensional structure rather than a single form.
Fourth, the PLS-MGA confirmed that the difference between the analysis model (disabled group) and the comparison model (non-disabled group) was statistically significant and that the two groups differed in their paths of structural models. The structural models of people with and without disabilities (
Figure 3), respectively, showed that the structural model of people without disabilities was more complex and multidimensional than that of people with disabilities. In addition, while the structural model of people without disabilities had a mix of direct and indirect paths, the structural model of people with disabilities had relationships in which happiness levels were reached through multidimensional, rather than unidimensional, pathways. These findings suggest that urban factors such as economic, transport, social capital, and urban safety are important factors for people with disabilities.
Finally, the hypotheses tested by synthesizing the analysis results are as follows: there was a difference in the urban factor, which is a determinant of happiness, for each group (Hypothesis 1); statistical differences between groups were significant (Hypothesis 2); and the paths of the structural models were also different (Hypothesis 3). Therefore, all three hypotheses have been accepted.
7. Conclusions
The purpose of this study was to compare the happiness levels of people with and without disabilities, living in Seoul, using the Seoul Survey data and to identify a structural model and the urban factors that affect the happiness of people with disabilities. This study performed an analysis using the PLS-MGA method by setting the disabled group as the analysis model and the non-disabled group as the contrasting model. This study aimed to identify differences between the groups (disabled and non-disabled) through the following hypotheses: are there differences by group in the urban factors affecting happiness; are there statistical differences in the structural models by group; and are there different paths of the structural model by group.
In the course of analyzing the data to fulfill our research objectives, we found results that were consistent with the literature. First, similar to Bellia [
20], the happiness level of the disabled group was lower than that of the non-disabled group, and as demonstrated by previous studies, such as Nunez-Barriopedro et al. [
35], Ura et al. [
53], and Lomas et al. [
33], the determinants of happiness were multidimensional, and the urban factors affecting happiness showed complex and multifaceted influence relationships. In particular, the relationship between the happiness levels of people with disabilities and urban factors was better explained by the indirect path than by the direct path, which supports previous studies and confirms the academic implications of this study.
Next, we identified the following policy implications based on our analyses: First, most of the urban factors that determine happiness, such as private, residential, economic, culture and leisure, transport, social capital, severity of urban safety, and living environment satisfaction, have been more important determinants of happiness for people without disabilities than for people with disabilities. We have identified that for people without disabilities, most urban factors have a significant impact on their levels of happiness, whereas for people with disabilities, only a few factors have a significant impact on their happiness. Similarly, while the happiness of people without disabilities had a direct or indirect effect on all factors in the personal dimension, people with disabilities had significant economic attributes only in the personal dimension for indirect pathways and only transport attributes in the personal dimension for indirect pathways. The results suggest that Seoul Metropolitan Government’s current urban services are more focused on people without disabilities than on people with disabilities and that it should henceforth implement more disability-friendly urban policies to realize the UN’s Urban Agenda: “cities for all” and “sustainable cities.”
Second, urban factors that affect the happiness of people with disabilities living in Seoul include economic characteristics in the personal dimension and social capital, the severity of urban safety, and living environment satisfaction in the urban environmental dimension. These results suggest that they are key factors to consider in making policies for people with disabilities. In other words, to ensure the happiness of people with disabilities living in cities, the following policy efforts are required: (1) economic support, (2) the development of network for social capital, (3) safety measures against crime and conflict in cities for people with disabilities, and (4) the improvement of the living environment, such as residential, transportation, medical, and welfare facilities. It is noteworthy that the study found that environmental factors such as social capital, urban safety, and urban living environment are more important for policies related to people with disabilities than personal characteristics.
Third, using PLS-MGA, this study empirically verified that the paths between happiness levels and urban factors differ between people with and without disabilities and that there are statistical differences in their structural models. In addition, we identified that the urban factors affecting the two groups are also different. Therefore, we suggest that the Seoul Metropolitan Government should apply welfare policies for people with and without disabilities living in Seoul differently, and in particular, customized policies for people with disabilities should be implemented after identifying their needs.
This study utilized the Seoul Survey data officially produced by the Seoul Metropolitan Government to identify the happiness levels of people with disabilities living in Seoul, the urban factors that determine the happiness of people with disabilities, and the structural relationships between urban factors and happiness levels. This study makes significant academic and policy contributions as it identifies the happiness levels and perceptions of people with disabilities living in the city at a time when the number of people with disabilities is consistently increasing. In addition, it is noteworthy that a multidimensional analysis was conducted using PLS-MGA rather than a simple regression analysis to identify impact relationships between urban factors and happiness levels. It is of particular significance that the study built structural models by combining cross-sectional influences identified through regression analysis and generated final path models for people with and without disabilities.
The generalizability of the study findings is limited due to the nature of the Seoul Survey, the data from which were from samples. However, the data can be considered reliable as representative panel data of the Seoul Metropolitan Government. The key urban factors considered in this study were private, residential, economic, culture and leisure, transport, social capital, the severity of urban safety, and living environment satisfaction. However, they cannot be considered representative of all urban characteristics. Additionally, there is a limitation in representing the multidimensional nature of happiness using an 11-point Likert scale. Therefore, the authors hope that follow-up studies will address the limitations of this study.


