
Walk Score, Environmental Quality and Walking in a Campus Setting
Abstract
:1. Introduction
2. Literature Review
2.1. Measuring Walkability
2.2. Campus Walkability Studies
3. Materials and Methods
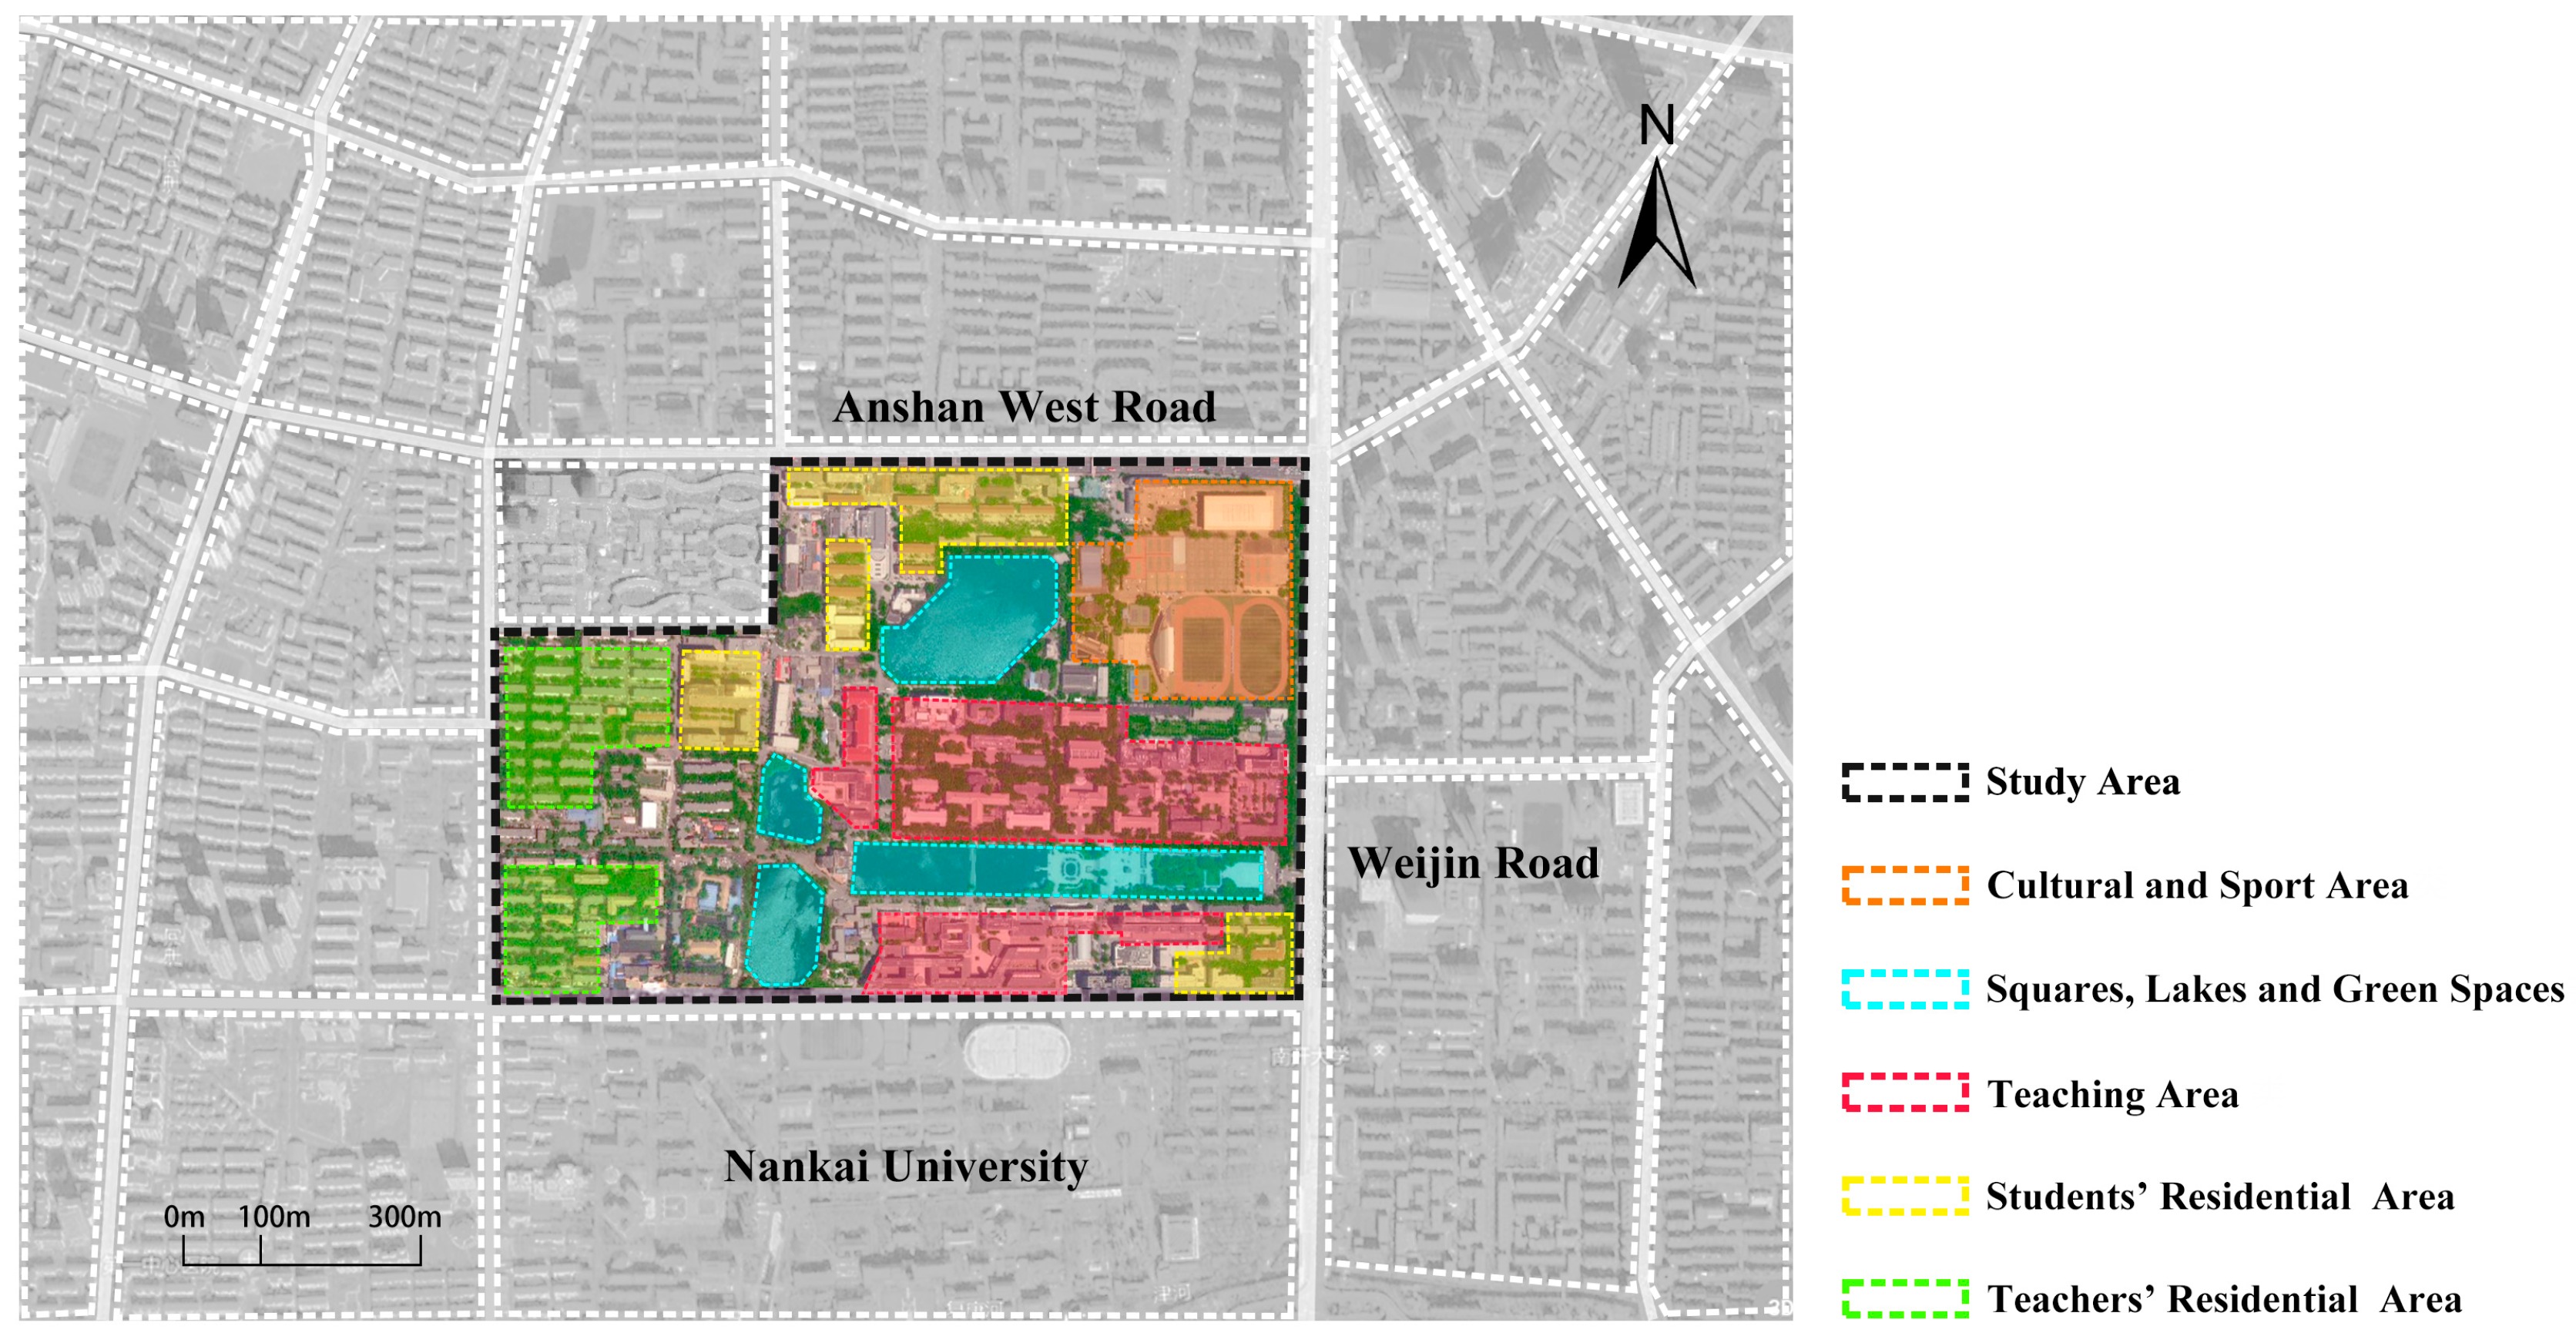
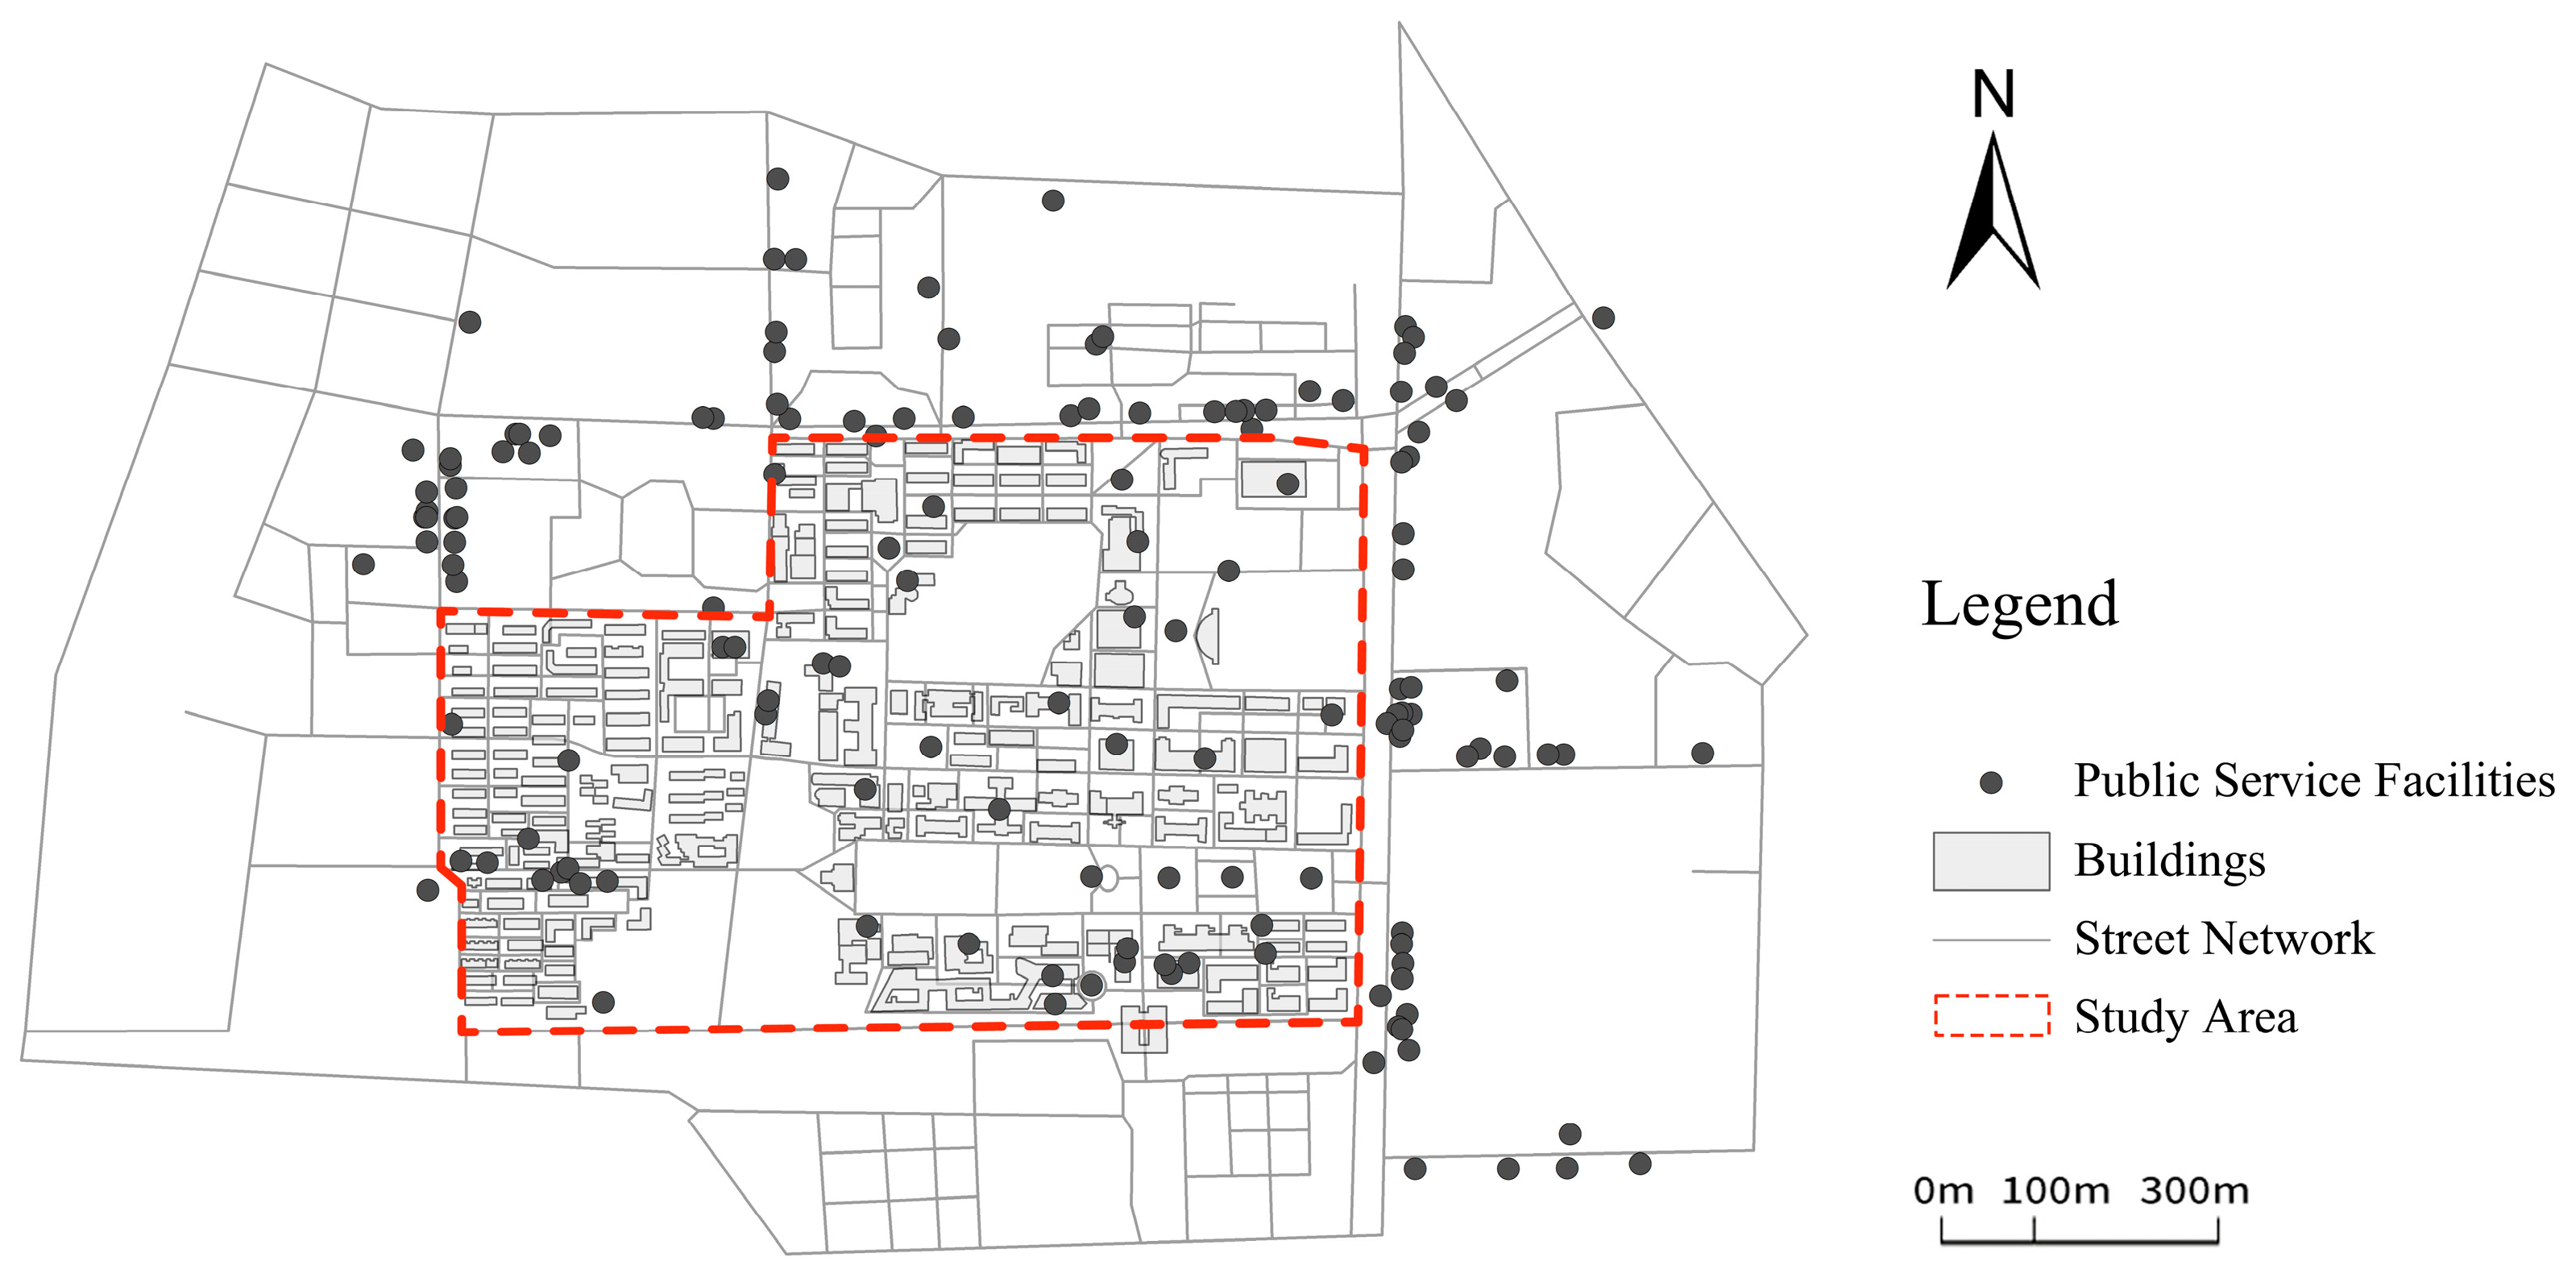
3.1. Study Setting
3.2. Study Design
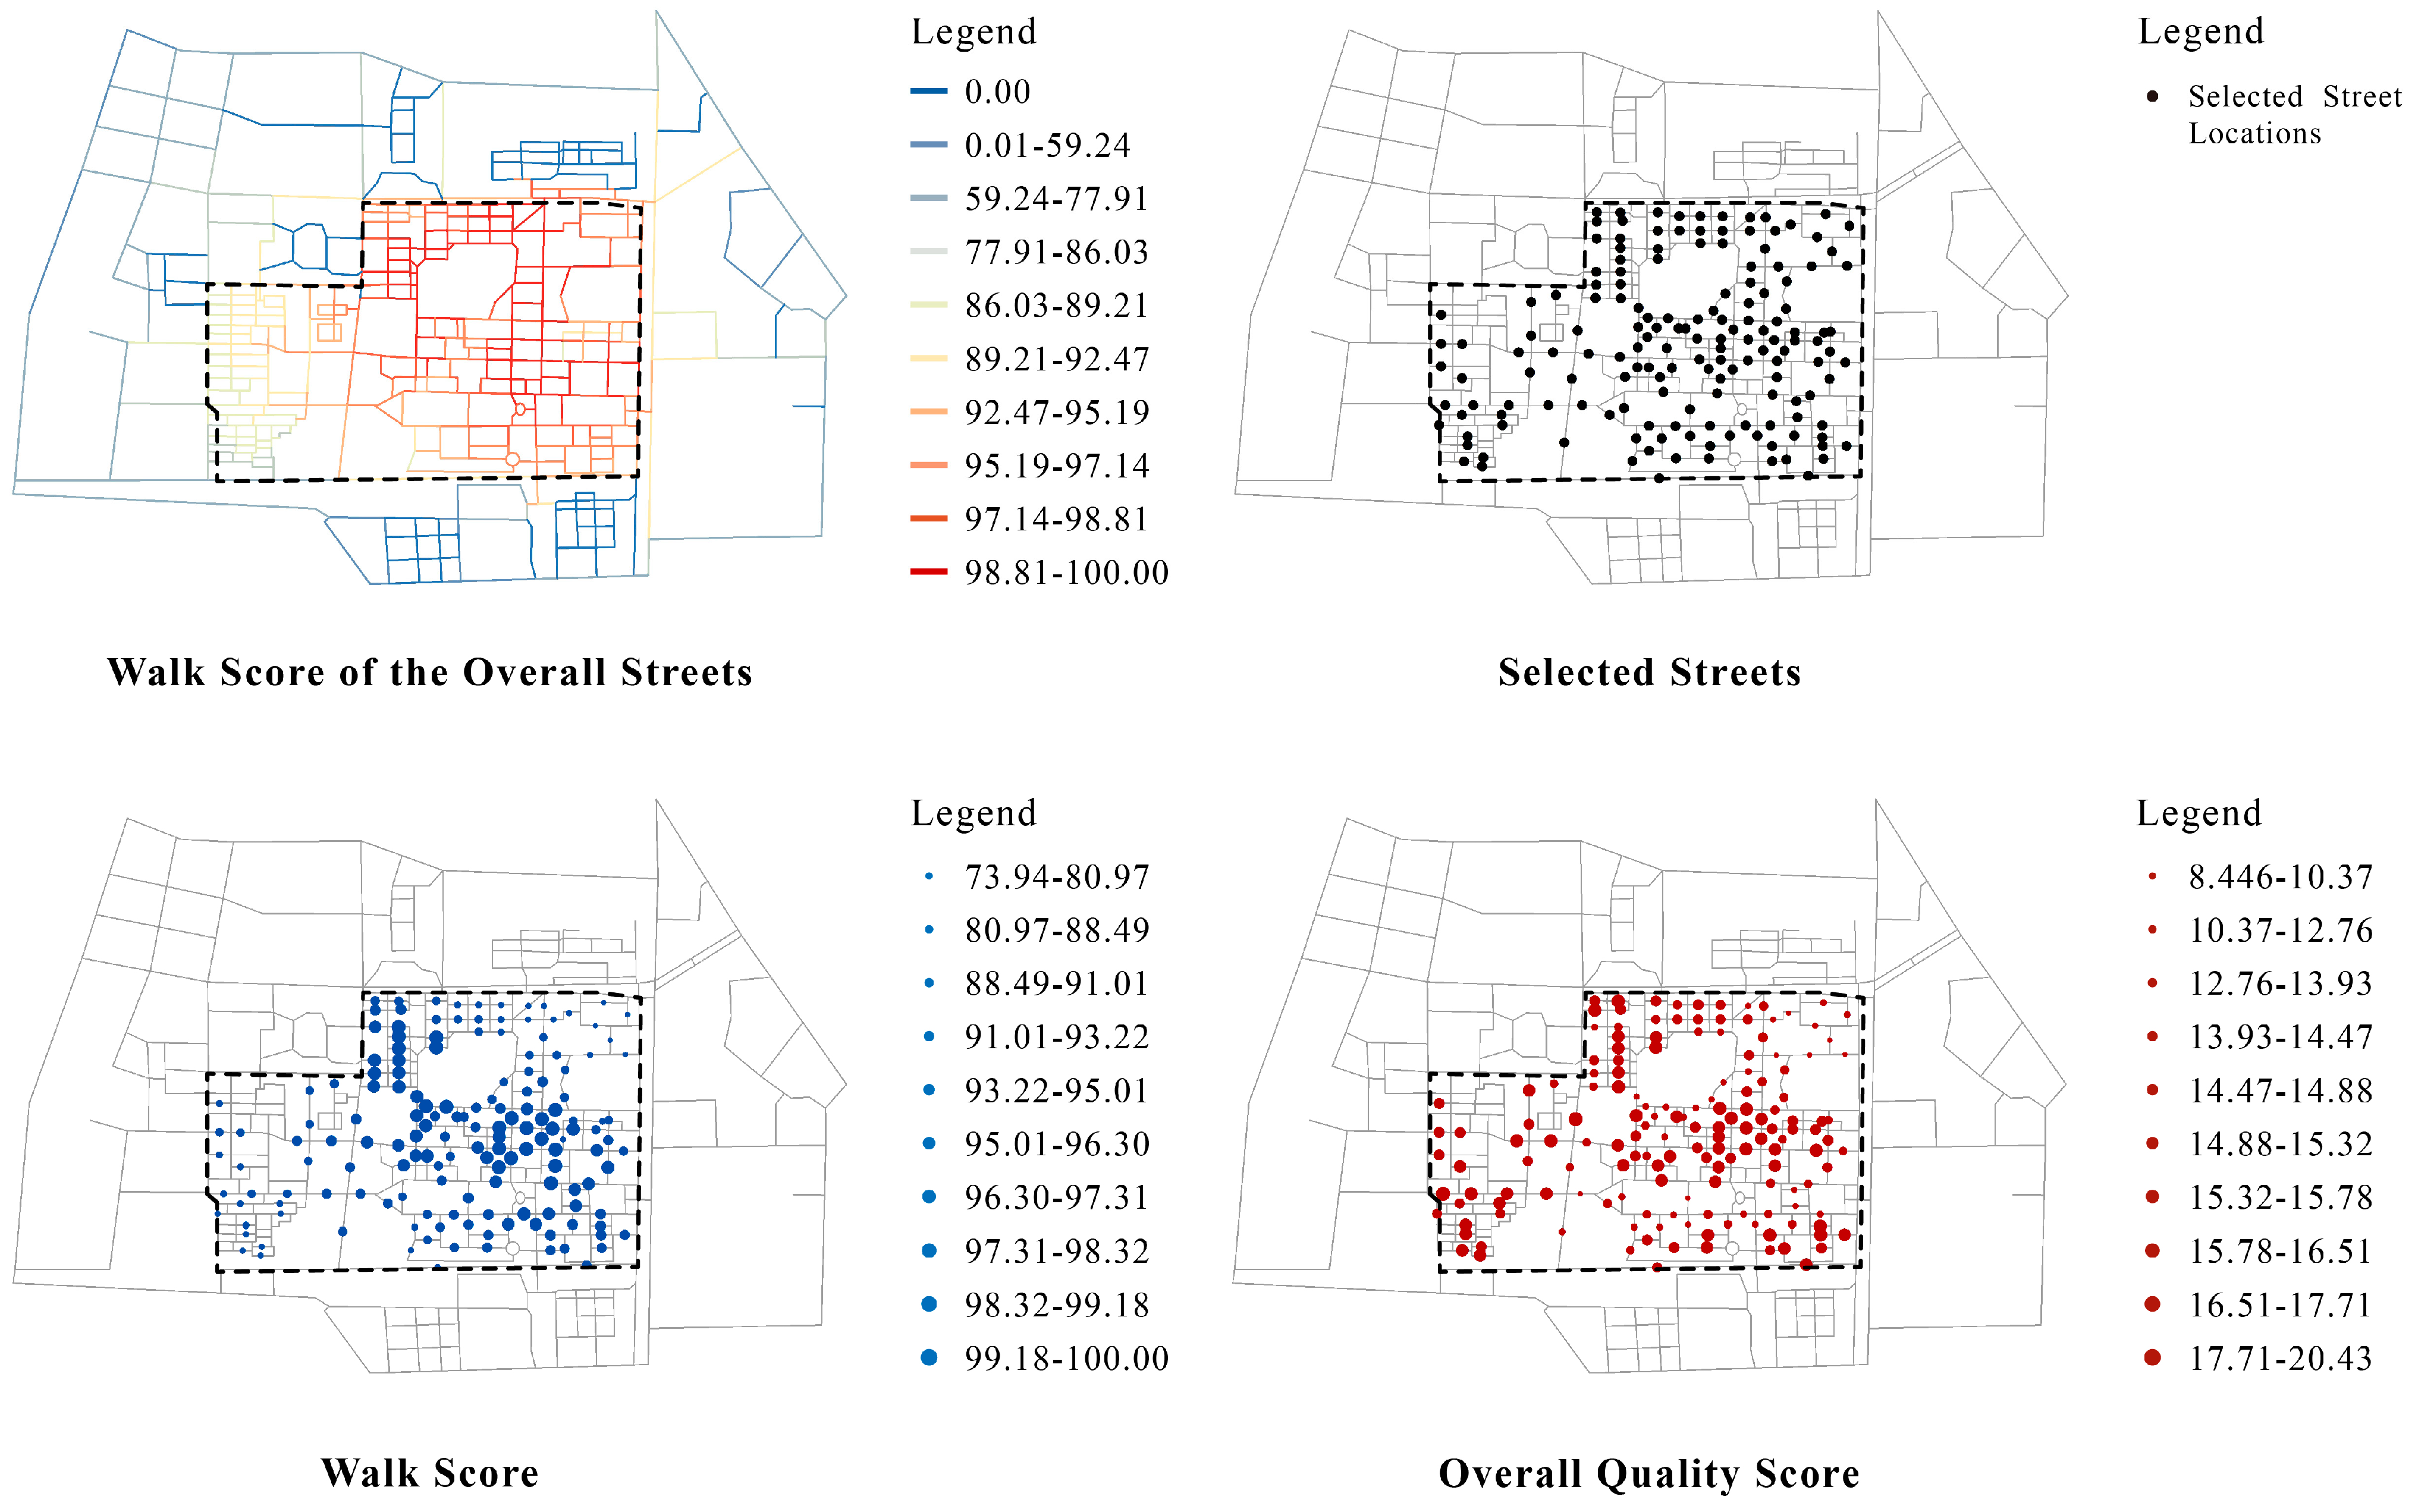
3.2.1. Walk Score
- Canteen and restaurant;
- Public teaching building;
- Retail store;
- Gym;
- Library;
- Square and green space;
- Bus station;
- Outdoor stadium;
- Coffee shop;
- Student activity center;
- Bank and post office;
- Administrative building;
- Barbershop.
3.2.2. Urban Design Quality
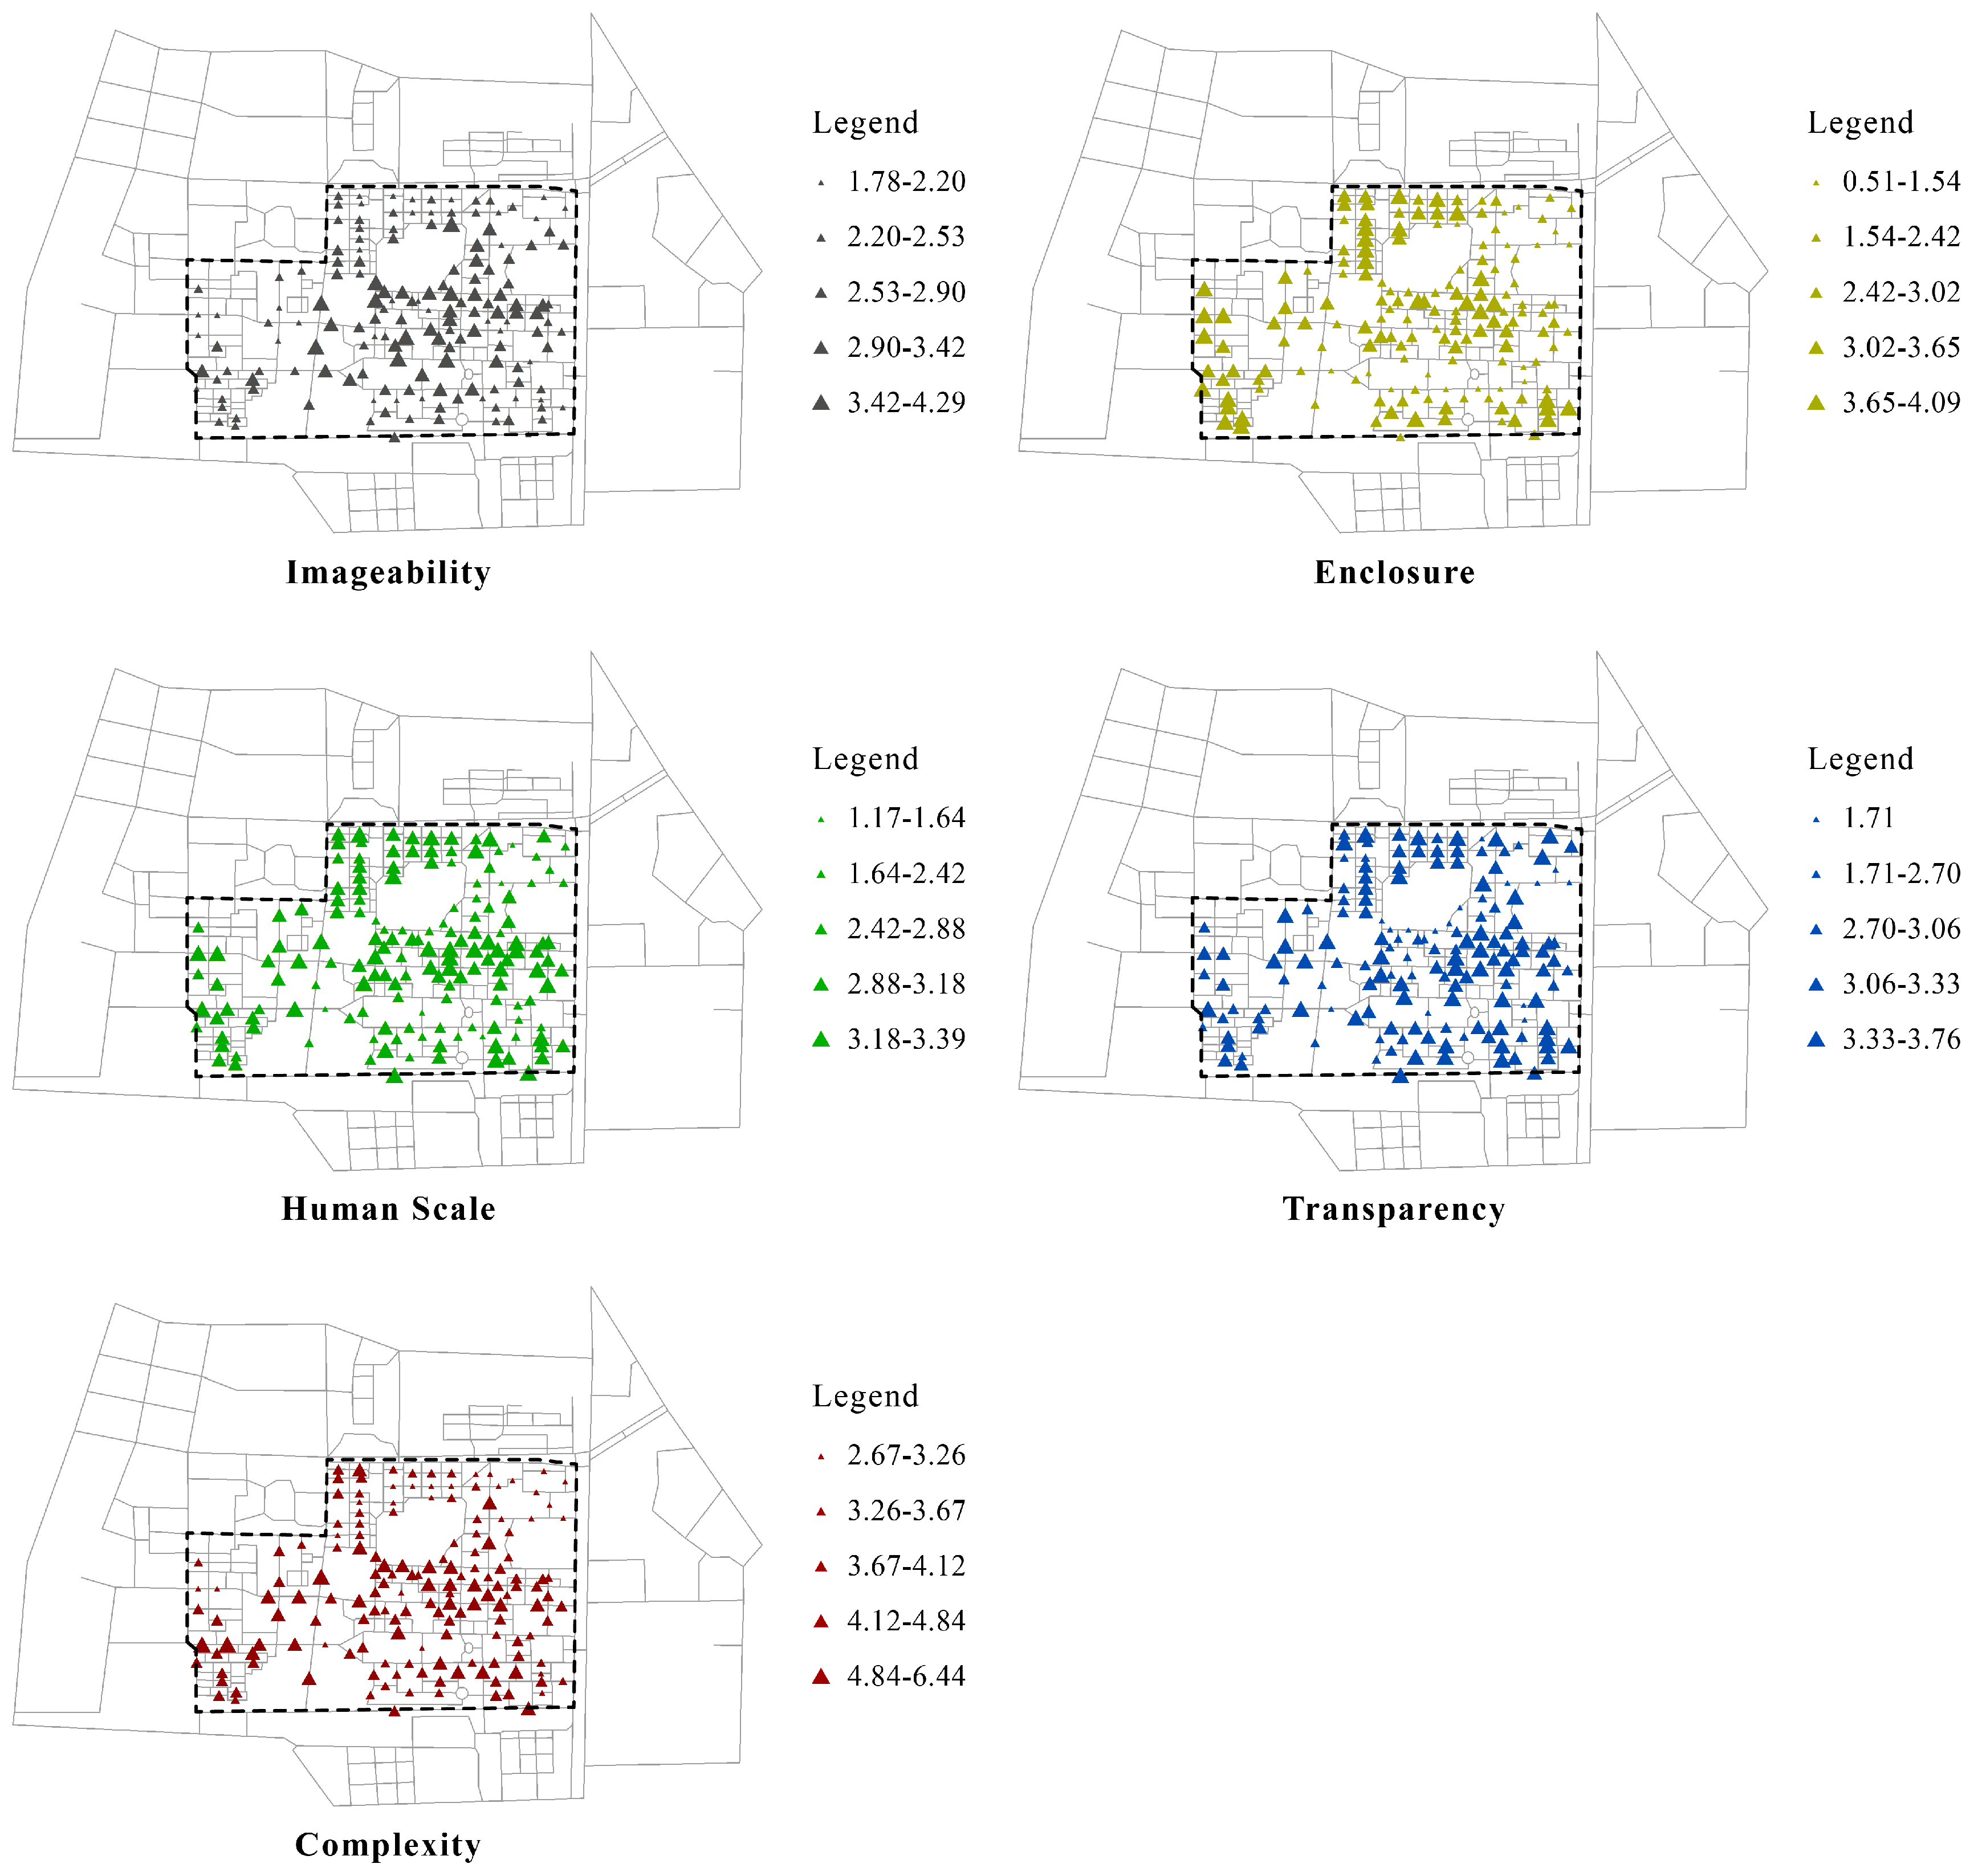
- Imageability refers to what makes a place distinct, recognizable, and memorable. A high imageability street can capture attention, evoke feelings, and create a lasting impression.
- Enclosure refers to the degree to which buildings, walls, trees, and other vertical elements visually define streets and other public spaces.
- Human scale refers to the size, texture, and articulation of physical elements that match the size and proportions of humans and, equally important, correspond to the speed at which humans walk.
- Transparency refers to the degree to which people can see or perceive what lies beyond the edge of a street or other public space and, more specifically, the degree to which people can see or perceive human activity beyond the edge of a street or other public space.
- Complexity refers to the visual richness of a place and depends on the variety of the physical environment.
3.2.3. Pedestrian Activity
3.2.4. Statistical Analysis
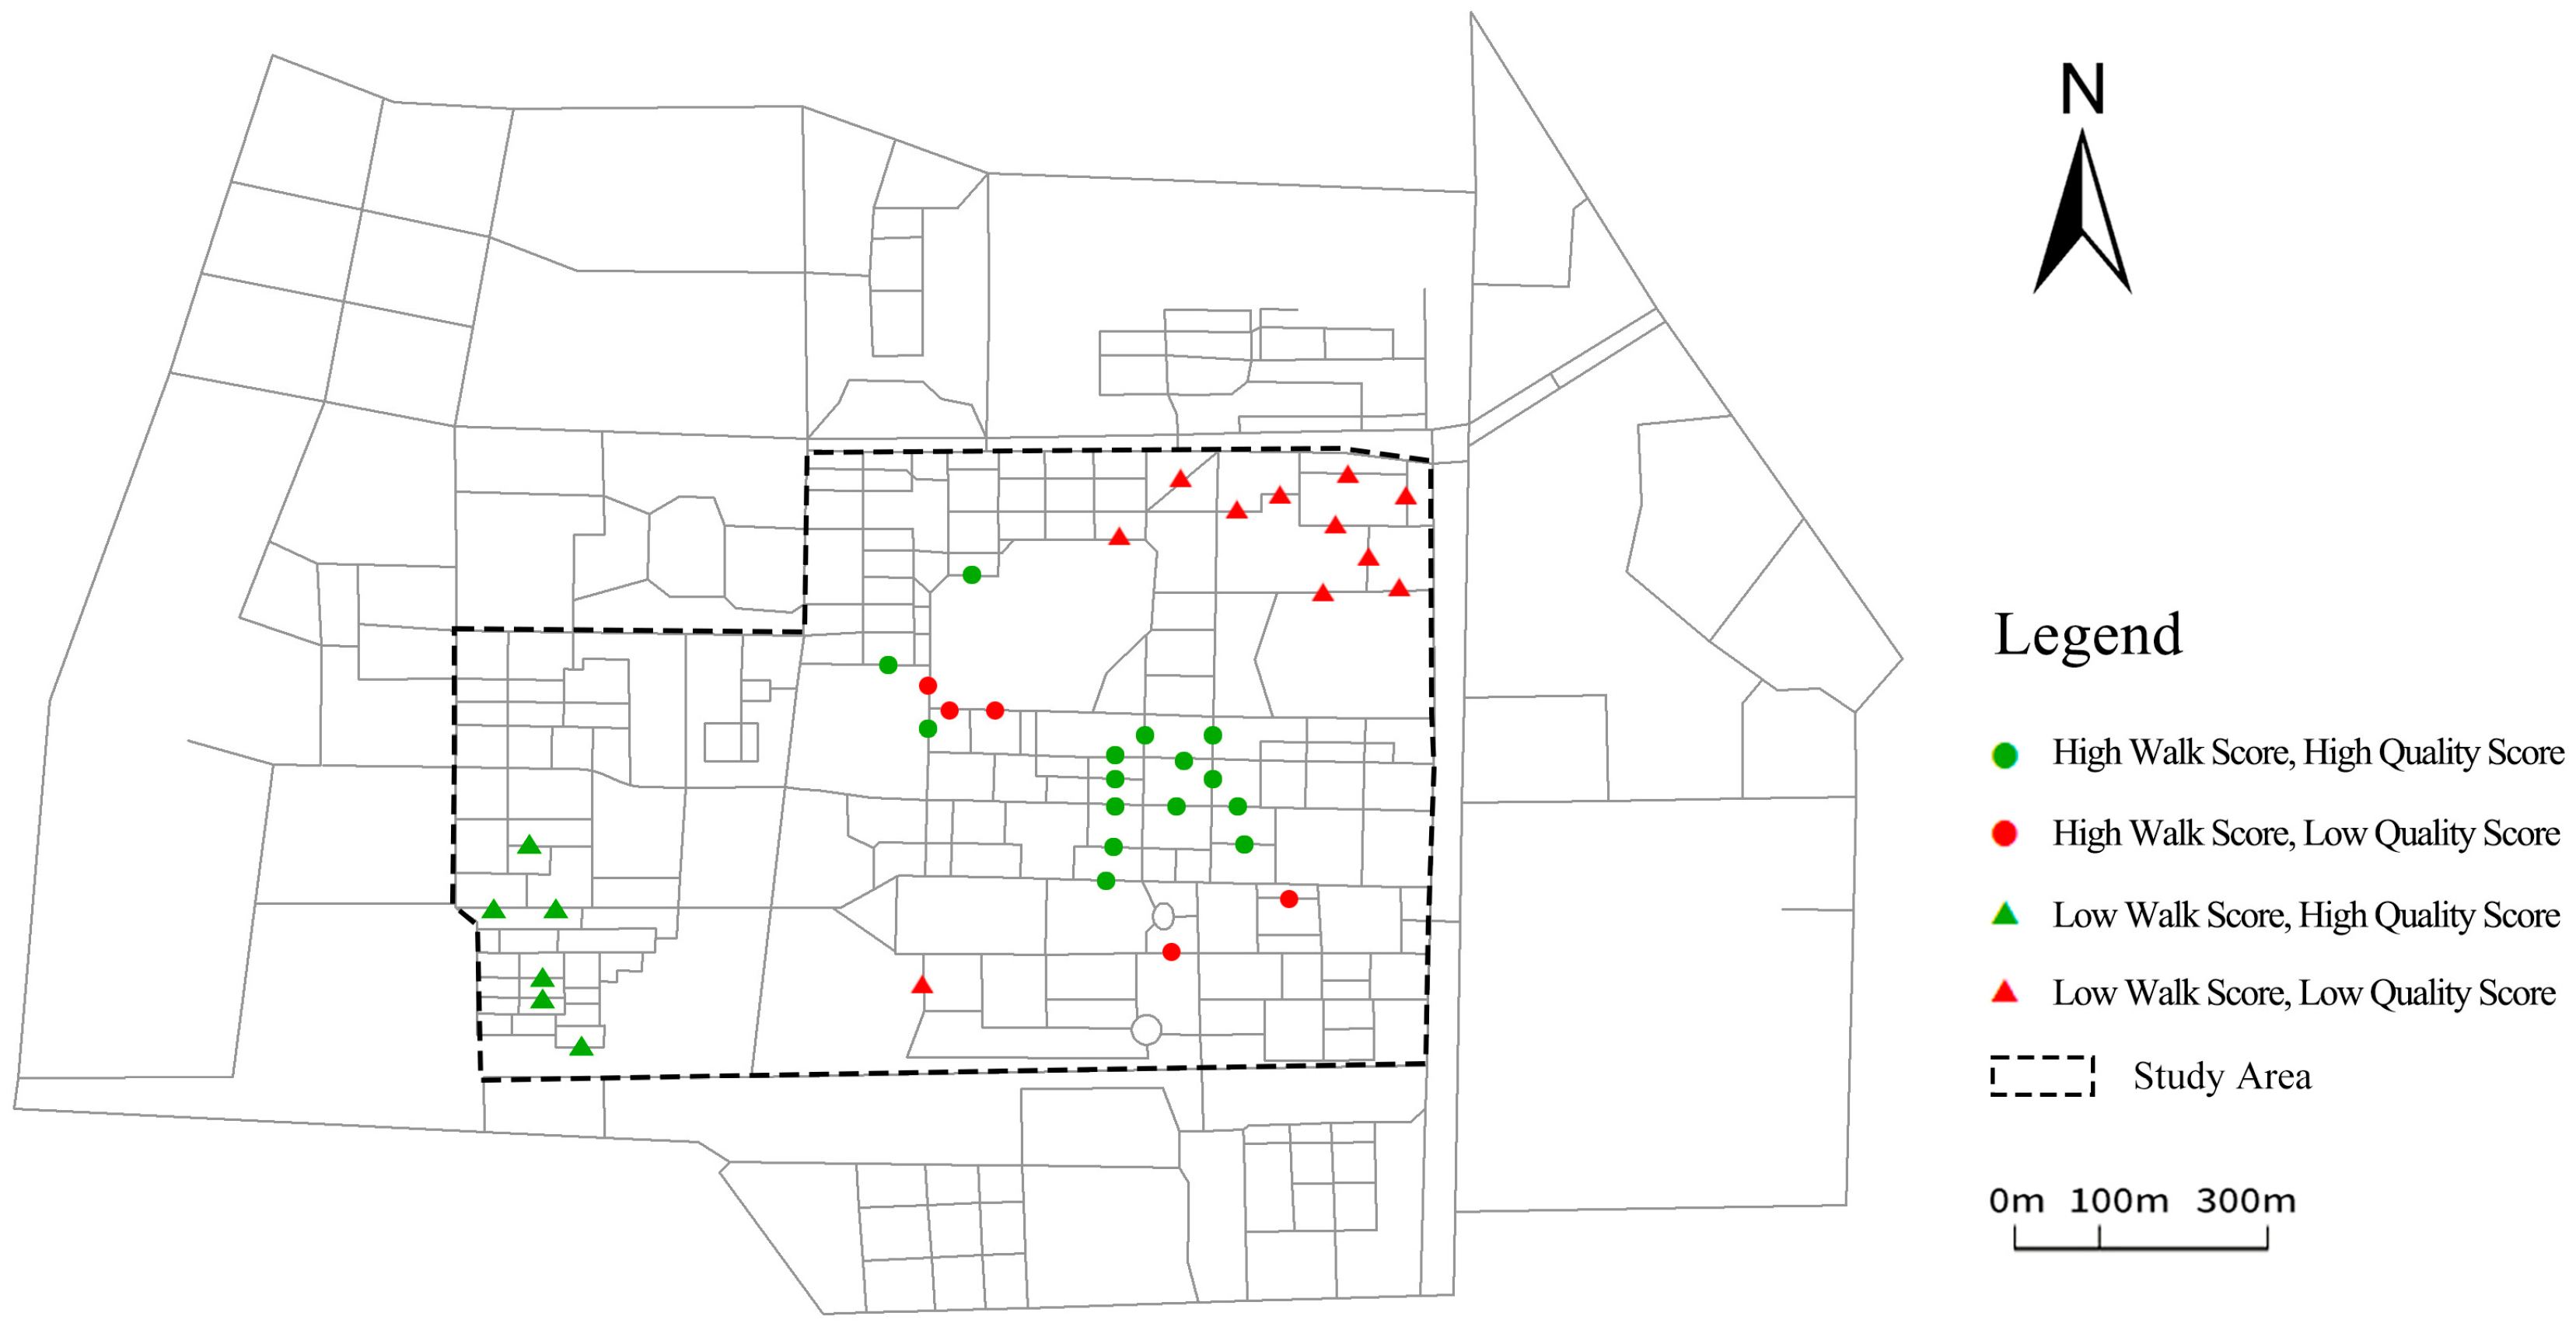
4. Results
4.1. Evaluating Walk Score
4.2. Evaluating the Environmental Quality
4.3. Correlation and Regression Analysis
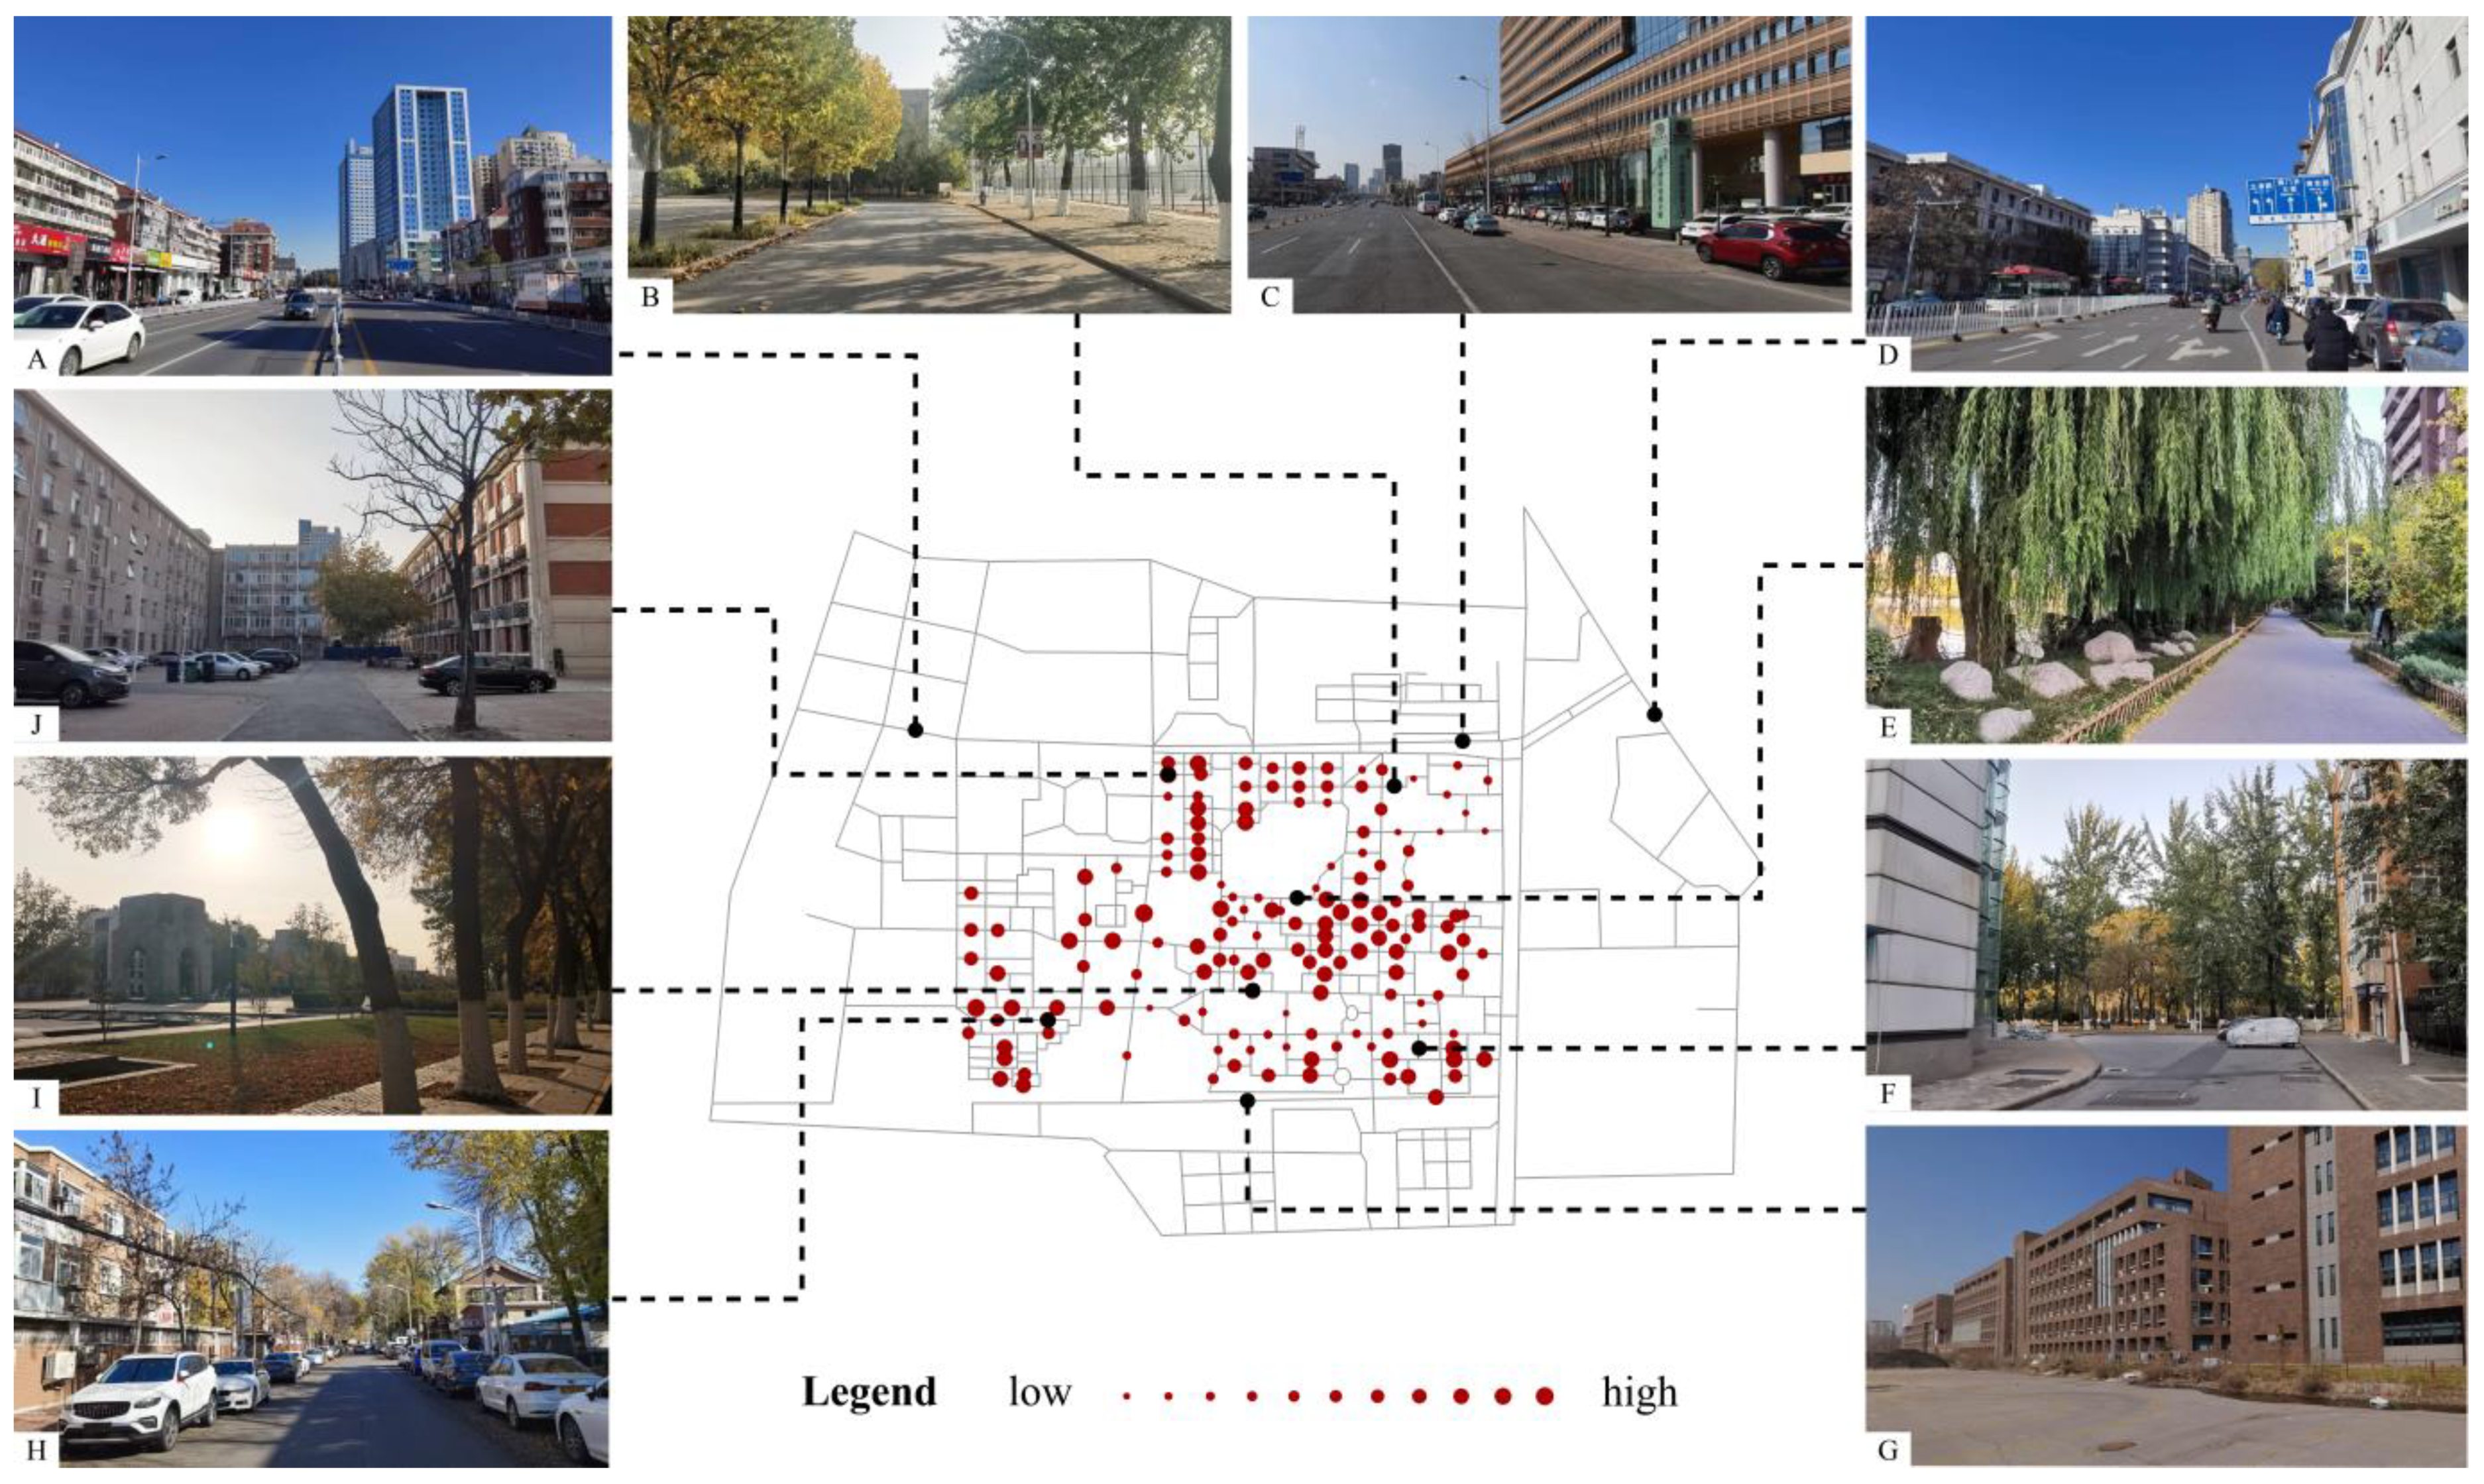
5. Discussion
6. Conclusions
- (1)
- Improve the balanced distribution of campus public service facilities based on the multi-center layout pattern and locate the high-demand commercial facilities, such as canteens and retail stores in different functional cluster centers and adjacent to student apartments, to meet students’ demand for the diversity of service facilities and improve the quality of students’ on-campus living.
- (2)
- Formulate a compact and high accessibility layout and distribute the smallest facilities in the appropriate location based on the supply and demand matching to serve the largest number of students and reduce the waste of resources, and improve diversified facility services to enhance the facility service efficiency and maximize service benefits.
- (3)
- Pay attention to the various distribution of public transportation and commercial facilities around the campus surrounding regions, and the edge areas and gates of the campus should be close to streets with high facility diversity to facilitate students to walk to meet daily off-campus travel needs and improve students’ living convenience and life satisfaction.
- (1)
- Improve the quality of the green space, public square, and water landscape, and increase the number of street furniture and other street items;
- (2)
- Increase the application of diversified building materials and different building colors in the residential areas to promote the street environment’s vitality;
- (3)
- Improve street transparency, focus on the renovation of the non-actively used historic buildings, and increase the application of transparent materials in transforming old buildings, which can promote the visual connection between indoor and outdoor spaces and induce a variety of walking activities.
Author Contributions
Funding
Informed Consent Statement
Data Availability Statement
Conflicts of Interest
References
- Litman, T. Economic value of walkability. World Transp. Policy Pract. 2004, 10, 5–14. [Google Scholar]
- Lee, S.; Talen, E. Measuring walkability: A note on auditing methods. J. Urban Des. 2014, 19, 368–388. [Google Scholar] [CrossRef]
- Yang, H.; He, D.; Lu, Y.; Ren, C.; Huang, X. Disentangling residential self-selection from the influence of built environment characteristics on adiposity outcomes among undergraduate students in China. Cities 2021, 113, 103165. [Google Scholar] [CrossRef]
- Global Health Observatory Data Repository. 2017. Available online: http://apps.who.int/gho/data/view.main.BMIPLUS2C10-19v?lang=en (accessed on 29 September 2017).
- King, S.B.; Kaczynski, A.T.; Knight Wilt, J.; Stowe, E.W. Walkability 101: A multi-method assessment of the walkability at a university campus. Sage Open 2020, 10, 2158244020917954. [Google Scholar] [CrossRef]
- Prial, A.; Zhu, X.; Bol, L.; Williams, M.R. The impact of moderate physical activity and student interaction on retention at a community college. J. Am. Coll. Health 2021, 71, 154–161. [Google Scholar] [CrossRef] [PubMed]
- Hajrasouliha, A. Connecting the Dots: Campus Form, Student Perceptions, and Academic Performance. Focus 2019, 15, 12. [Google Scholar]
- Forsyth, A. What is a walkable place? The walkability debate in urban design. Urban Des. Int. 2015, 20, 274–292. [Google Scholar] [CrossRef] [Green Version]
- Leslie, E.; Coffee, N.; Frank, L.; Owen, N.; Bauman, A.; Hugo, G. Walkability of local communities: Using geographic information systems to objectively assess relevant environmental attributes. Health Place 2007, 13, 111–122. [Google Scholar] [CrossRef]
- Townshend, T.G. Walkable Neighborhoods: Principles, Measures, and Health Impacts. Wellbeing: A Complete Reference Guide; Wiley: Hoboken, NJ, USA, 2014; Volume 2, pp. 1–30. [Google Scholar]
- Southworth, M. Designing the walkable city. J. Urban Plan Dev. 2005, 131, 246–257. [Google Scholar] [CrossRef]
- Cervero, R.; Kockelman, K. Travel demand and the 3Ds: Density, diversity, and design. Transp. Res. D Tr. E 1997, 2, 199–219. [Google Scholar] [CrossRef]
- Ewing, R.; Cervero, R. Travel and the built environment: A meta-analysis. J. Am. Plann. Assoc. 2010, 76, 265–294. [Google Scholar] [CrossRef]
- Walk Score. Walk Score Methodology. 2011. Available online: https://www.walkscore.com/methodology.shtml (accessed on 7 June 2011).
- Hall, M.C.; Ram, Y. Walk score® and its potential contribution to the study of active transport and walkability: A critical and systematic review. Transp. Res. Part D 2018, 61, 310–324. [Google Scholar] [CrossRef]
- Kang, C.D. The S+ 5Ds: Spatial access to pedestrian environments and walking in Seoul, Korea. Cities 2018, 77, 130–141. [Google Scholar] [CrossRef]
- Lee, C.; Moudon, A.V. The 3Ds+ R: Quantifying land use and urban form correlates of walking. Transp. Res. Part D 2006, 11, 204–215. [Google Scholar] [CrossRef]
- Ewing, R.; Clemente, O. Measuring Urban Design: Metrics for Livable Places; Island Press: Washington, DC, USA, 2013. [Google Scholar]
- Manaugh, K.; Ahmed, E.-G. Validating walkability indices: How do different households respond to the walkability of their neighborhood? Transp. Res. Part D 2011, 16, 309–315. [Google Scholar] [CrossRef]
- Carr, L.J.; Dunsiger, S.I.; Marcus, B.H. Validation of Walk Score for estimating access to walkable amenities. Brit. J. Sport Med. 2011, 45, 1144–1148. [Google Scholar] [CrossRef] [Green Version]
- Duncan, D.T.; Aldstadt, J.; Whalen, J.; Melly, S.J. Validation of Walk Scores and Transit Scores for estimating neighborhood walkability and transit availability: A small-area analysis. GeoJournal 2013, 78, 407–416. [Google Scholar] [CrossRef]
- Kim, Y.J.; Woo, A. What’s the score? Walkable environments and subsidized households. Sustainability 2016, 8, 396. [Google Scholar] [CrossRef] [Green Version]
- Pivo, G.; Fisher, J.D. The walkability premium in commercial real estate investments. Real Estate Econ. 2011, 39, 185–219. [Google Scholar] [CrossRef]
- Towne, S.D.; Won, J.; Lee, S.; Ory, M.G.; Forjuoh, S.N.; Wang, S.; Lee, C. Using Walk Score™ and neighborhood perceptions to assess walking among middle-aged and older adults. J. Commun. Health 2016, 41, 977–988. [Google Scholar] [CrossRef]
- Tuckel, P.; Milczarski, W. Walk ScoreTM, perceived neighborhood walkability, and walking in the US. Am. J. Health Behav. 2015, 39, 242–256. [Google Scholar] [CrossRef]
- Aghaabbasi, M.; Moeinaddini, M.; Shah, M.Z.; Asadi-Shekari, Z.; Kermani, M.A. Evaluating the capability of walkability audit tools for assessing sidewalks. Sustain. Cities Soc. 2018, 37, 475–484. [Google Scholar] [CrossRef]
- Ewing, R.; Handy, S. Measuring the unmeasurable: Urban design qualities related to walkability. J. Urban Des. 2009, 14, 65–84. [Google Scholar] [CrossRef]
- Purciel, M.L.; Neckerman, K.M.; Lovasi, G.S.; Quinn, J.W.; Weiss, C.; Ewing, R.; Rundle, A. Creating and Validating GIS Measures of Urban Design for Health Research. J. Env. Psychol. 2009, 29, 457–466. [Google Scholar] [CrossRef] [PubMed] [Green Version]
- Hooi, E.; Pojani, D. Urban design quality and walkability: An audit of suburban high streets in an Australian city. J. Urban Des. 2020, 25, 155–179. [Google Scholar] [CrossRef]
- Bereitschaft, B. Equity in Microscale Urban Design and Walkability: A Photographic Survey of Six Pittsburgh Streetscapes. Sustainability 2017, 9, 1233. [Google Scholar] [CrossRef] [Green Version]
- Park, K.; Ewing, R.; Sabouri, S.; Larsen, J. Street life and the built environment in an auto-oriented US region. Cities 2019, 88, 243–251. [Google Scholar] [CrossRef]
- Ameli, S.H.; Hamidi, D.; Garfinkel-Castro, A.; Ewing, R. Do better urban design qualities lead to more walking in Salt Lake City, Utah? J. Urban Des. 2015, 20, 393–410. [Google Scholar] [CrossRef]
- Maxwell, J.A. Designing for ‘Life between Buildings’: Modeling the Relationship between Streetscape Qualities and Pedestrian Activity in Glasgow, Scotland. Ph.D. Thesis, University of Strathclyde, Glasgow, UK, 2016. [Google Scholar]
- Alhajaj, N.; Daghistani, F. Hybrid method for measuring the accessibility and safety of students’ walking routes in car-dominated campuses. Urban Des. Int. 2021, 26, 53–66. [Google Scholar] [CrossRef]
- Kellstedt, D.K.; Spengler, J.O.; Maddock, J.E. Comparing Perceived and Objective Measures of Bikeability on a University Campus: A Case Study. Sage Open 2021, 11, 21582440211018685. [Google Scholar] [CrossRef]
- Booker, R.; Novik, M.; Galloway, R.; Holmes, M.E. Relationship between physical activity intensities and drunkorexia severity among first-year college students. J. Am. Coll. Health 2021, 69, 689–692. [Google Scholar] [CrossRef] [PubMed]
- McDonald-Yale, E.; Birchall, S.J. The built environment in a winter climate: Improving university campus design for student wellbeing. Landsc. Res. 2021, 46, 638–652. [Google Scholar] [CrossRef]
- Bopp, M.; Wilson, O.W.; Elliott, L.D.; Holland, K.E.; Duffey, M. The Role of The Physical and Social Environment for Physical Activity for College Students During the COVID-19 Pandemic. Build. Healthy Acad. Communities J. 2021, 5, 13–30. [Google Scholar] [CrossRef]
- Teuber, M.; Sudeck, G. Why do students walk or cycle for transportation? Perceived study environment and psychological determinants as predictors of active transportation by university students. Int. J. Env. Res. Pub. Health 2021, 18, 1390. [Google Scholar] [CrossRef] [PubMed]
- Zhang, Z.; Fisher, T.; Feng, G. Assessing the Rationality and Walkability of Campus Layouts. Sustainability 2020, 12, 10116. [Google Scholar] [CrossRef]
- Yintao, L. Walkability Evaluation Based on People’s Use of Facilities by Walking. Urban Plan. Forum 2013, 5, 113–118. [Google Scholar]
- Huang, J.; Hu, G.; Li, M. The Allocative Suitability of Community Facilities from the Perspective of the Elderly—Based on Walk Score Method. Urban Plan. Forum 2017, 6, 45–53. [Google Scholar]
- Yingbin, L. The Walkability Measurement and the Validation Study of the Taoyuan District in Shenzhen. Master’s Thesis, Harbin Institute of Technology, Harbin, China, 2013. [Google Scholar]
- Khattak, A.; Wang, X.; Son, S.; Agnello, P. University student travel in Virginia: Is it different from the general population. Transp. Res. Rec. 2011, 2255, 137–145. [Google Scholar] [CrossRef]
- Hamidi, S.; Moazzeni, S. Examining the relationship between urban design qualities and walking behavior: Empirical evidence from Dallas, TX. Sustainability 2019, 11, 2720. [Google Scholar] [CrossRef] [Green Version]
- Yin, L. Street level urban design qualities for walkability: Combining 2D and 3D GIS measures. Comput. Env. Urban 2017, 64, 288–296. [Google Scholar] [CrossRef]
- Pearce, D. Painting the Picture: The Validity of Walk Score in Addressing Subjective Urban Design Qualities in the Built Environment; University of Oregon: Eugene, OR, USA, 2015. [Google Scholar]
- Peachey, A.A.; Baller, S.L. Perceived Built Environment Characteristics of On-Campus and Off-Campus Neighborhoods Associated with Physical Activity of College Students. J. Am. Coll. Health 2015, 63, 337–342. [Google Scholar] [CrossRef]
- Ewing, R.; Hajrasouliha, A.; Neckerman, K.M.; Purciel-Hill, M.; Greene, W. Streetscape features related to pedestrian activity. J. Plan. Educ. Res. 2016, 36, 5–15. [Google Scholar] [CrossRef] [Green Version]
- Kang, C.D. Measuring the effects of street network configurations on walking in Seoul, Korea. Cities 2017, 71, 30–40. [Google Scholar] [CrossRef]
- Im, H.N.; Choi, C.G. Measuring pedestrian volume by land use mix: Presenting a new entropy-based index by weighting walking generation units. Env. Plan B Urban 2020, 47, 1219–1236. [Google Scholar] [CrossRef]
- Weng, M.; Ding, N.; Li, J.; Jin, X.; Xiao, H.; He, Z.; Su, S. The 15-minute walkable neighborhoods: Measurement, social inequalities and implications for building healthy communities in urban China. J. Public Transp. 2019, 13, 259–273. [Google Scholar] [CrossRef]
- Wu, H.; Wang, L.; Zhang, Z.; Gao, J. Analysis and optimization of 15-minute community life circle based on supply and demand matching: A case study of Shanghai. PLoS ONE 2021, 16, e0256904. [Google Scholar] [CrossRef] [PubMed]


| Gender | Data (% of Sample) |
|---|---|
| Male | 50.9 |
| Female | 49.1 |
| Grade | |
| Undergraduate | 60 |
| Graduate | 21.3 |
| PhD candidate | 18.7 |
| The Type of Facilities | Using Frequency | Weight of Facilities | Comfortable Time (min) | Tolerance Time (min) | Resistance Time (min) |
|---|---|---|---|---|---|
| Canteen and Restaurant | 21 | 47.54 | 6 | 17 | 24 |
| Public Teaching Building | 5.06 | 47.54 | 6 | 17 | 24 |
| Retail Store | 4.31 | 11.46 | 6 | 17 | 24 |
| Gym | 2.08 | 9.76 | 8 | 17 | 24 |
| Library | 2.03 | 4.71 | 7 | 18 | 24 |
| Square and Green Space | 2 | 4.6 | 7 | 18 | 24 |
| Bus Stop | 1.81 | 4.53 | 6 | 17 | 24 |
| Outdoor Stadium | 1.4 | 4.1 | 8 | 17 | 24 |
| Coffee Shop | 1.32 | 3.17 | 7 | 18 | 24 |
| Student Activity Center | 1.07 | 2.98 | 6 | 17 | 24 |
| Bank and Post Office | 0.98 | 2.42 | 7 | 18 | 24 |
| Administrative Building | 0.86 | 2.22 | 6 | 17 | 24 |
| Barber Shop | 0.25 | 1.95 | 7 | 18 | 24 |
| Sum | 44.17 | 100 |
| Urban Design Quality | Significant Physical Features | Coefficient | p-Value |
|---|---|---|---|
| Imageability | People (#)—your side | 0.0239 | <0.001 |
| Proportion of historic buildings—both sides | 0.97 | <0.001 | |
| Courtyards/plazas/parks (#)—both sides | 0.414 | <0.001 | |
| Outdoor dining (yes/no)—your side | 0.644 | <0.001 | |
| Buildings with non-rectangular shapes (#)—both sides | 0.0795 | 0.036 | |
| Noise level (rating)—both sides | −0.183 | 0.045 | |
| Major landscape features (#)—both sides | 0.722 | 0.049 | |
| Buildings with identifiers (#)—both sides | 0.111 | 0.083 | |
| Enclosure | Proportion street wall—same side—your side | 0.716 | <0.001 |
| Proportion street wall—opposite side—opposite side | 0.94 | 0.002 | |
| Proportion sky across—opposite side | −2.193 | 0.021 | |
| Long sight lines (#)—both sides | −0.308 | 0.035 | |
| Proportion sky ahead—your side | −1.418 | 0.055 | |
| Human Scale | Long sight lines (#)—both sides | −0.744 | <0.001 |
| All street furniture and other street items (#)—your side | 0.0364 | <0.001 | |
| Proportion first floor with windows—your side | 1.099 | <0.001 | |
| Building height—same side—your side | −0.00304 | 0.033 | |
| Small planters (#)—your side | 0.0496 | 0.047 | |
| Transparency | Proportion of first floor with windows—your side | 1.219 | 0.002 |
| Proportion of active uses—your side | 0.533 | 0.004 | |
| Proportion of street wall—same side—your side | 0.666 | 0.011 | |
| Complexity | People (#)—your side | 0.0268 | <0.001 |
| Buildings (#)—both sides | 0.051 | 0.008 | |
| Dominant building colors (#)—both sides | 0.177 | 0.031 | |
| Accent colors (#)—both sides | 0.108 | 0.043 | |
| Outdoor dining (yes/no)—your side | 0.367 | 0.045 | |
| Public art (#)—both sides | 0.272 | 0.066 |
| Urban Design Qualities and Individual Items | Mean | Median | SD |
|---|---|---|---|
| Imageability | 2.62 | 2.55 | 0.49 |
| Number of courtyards, and parks (both sides) | 0.47 | 0 | 0.61 |
| Number of major landscape features (both sides) | 0.19 | 0 | 0.43 |
| Proportion of historic frontage (both sides) | 0.15 | 0 | 0.31 |
| Number of buildings with identifiers (both sides) | 0.84 | 0 | 1.57 |
| Number of buildings with non-rectangular shapes (both sides) | 0.3 | 0 | 0.62 |
| Outdoor dining (observer side) | 0.01 | 0 | 0.11 |
| Number of walking pedestrians (observer side) | 5.7 | 4 | 5.43 |
| Noise level (both sides) | 2.93 | 3 | 1.09 |
| Enclosure | 2.68 | 2.68 | 0.89 |
| Number of long sight lines (both sides) | 0.34 | 0 | 0.55 |
| Proportion street wall (observer side) | 0.71 | 0.8 | 0.33 |
| Proportion street wall (opposite side) | 0.46 | 0.5 | 0.4 |
| Proportion sky (ahead) | 0.23 | 0.2 | 0.09 |
| Proportion sky (along the street) | 0.18 | 0.1 | 0.13 |
| Human Scale | 2.84 | 3.02 | 0.5 |
| Number of long sight lines (both sides) | 0.34 | 0 | 0.55 |
| Proportion windows at street level (observer side) | 0.4 | 0.4 | 0.2 |
| Average buildings height (observer side) | 14.35 | 15 | 7.92 |
| Number of small planters (observer side) | 0.28 | 0 | 1.07 |
| Number of pieces street furniture and other street items (observer side) | 2.55 | 2 | 2.47 |
| Transparency | 3.03 | 3.20 | 0.54 |
| Proportion windows at street level (observer side) | 0.4 | 0.4 | 0.2 |
| Proportion street wall (observer side) | 0.7 | 0.8 | 0.33 |
| Proportion street wall (opposite side) | 0.69 | 1 | 0.39 |
| Complexity | 3.78 | 3.75 | 0.57 |
| Number of buildings (both sides) | 2.48 | 2 | 1.71 |
| Number of basic building colors (both sides) | 2.66 | 2 | 1.55 |
| Number of accent building colors (both sides) | 1.42 | 1 | 1.26 |
| Number of pieces of public art (both sides) | 0.33 | 0 | 0.78 |
| Outdoor dining (observer side) | 0.01 | 0 | 0.11 |
| Number of walking pedestrians (observer side) | 5.71 | 4 | 5.43 |
| Overall Quality | 14.95 | 15.02 | 0.58 |
| Imageability | Enclosure | Human Scale | Transparency | Complexity | |
|---|---|---|---|---|---|
| Imageability | 1 | ||||
| Enclosure | 0.149 | 1 | |||
| Human Scale | −0.577 ** | 0.087 * | 1 | ||
| Transparency | −0.336 * | 0.37 * | 0.691 ** | 1 | |
| Complexity | −0.892 ** | 0.087 | 0.625 ** | 0.361 * | 1 |
| Overall Quality | Imageability | Enclosure | Human Scale | Transparency | Complexity |
|---|---|---|---|---|---|
| 0.209 * | 0.254 ** | 0.052 | 0.092 * | 0.014 | 0.286 ** |
| Variable | Model 1 | Model 2 | Model 3 | ||||||
|---|---|---|---|---|---|---|---|---|---|
| Coefficient | Std. Error | Sig. | Coefficient | Std. Error | Sig. | Coefficient | Std. Error | Sig. | |
| Intercept | −4.297 | 1.204 | <0.001 | −6.378 | 1.098 | <0.001 | −5.304 | 1.001 | <0.001 |
| Walk Score | 0.076 *** | 0.013 | <0.001 | 0.090 *** | 0.109 | <0.001 | 0.057 *** | 0.011 | <0.001 |
| Environmental Quality | |||||||||
| Overall Quality | 0.074 * | 0.031 | 0.018 | ||||||
| Imageability | −0.198 | 1.141 | 0.121 | ||||||
| Enclosure | −0.276 *** | 6.733 | <0.001 | ||||||
| Human Scale | −0.151 | 1.365 | 0.130 | ||||||
| Transparency | 0.361 *** | 0.206 | <0.001 | ||||||
| Complexity | 0.224 | 0.107 | 0.362 | ||||||
| Streetscape Features | |||||||||
| Noise level | 0.325 *** | 0.048 | <0.001 | ||||||
| Street furniture | 0.021 *** | 0.019 | <0.001 | ||||||
| Number of buildings | 0.130 ** | 0.043 | 0.003 | ||||||
| Number of basic building colors | −0.100 ** | 0.035 | 0.002 | ||||||
| Spatial filtering eigenvector | |||||||||
| Fitted (ME) (1) | 2.207 | 0.575 | <0.001 | −1.984 | 0.603 | 0.001 | −0.316 | 0.541 | 0.560 |
| Fitted (ME) (2) | −1.215 | 0.612 | 0.049 | 2.527 | 0.566 | <0.001 | 0.016 | 0.505 | 0.945 |
| Fitted (ME) (3) | 1.669 | 0.559 | 0.003 | ||||||
| N | 157 | 157 | 157 | ||||||
| AIC | 795.52 | 794.75 | 793.63 | ||||||
Disclaimer/Publisher’s Note: The statements, opinions and data contained in all publications are solely those of the individual author(s) and contributor(s) and not of MDPI and/or the editor(s). MDPI and/or the editor(s) disclaim responsibility for any injury to people or property resulting from any ideas, methods, instructions or products referred to in the content. |
© 2023 by the authors. Licensee MDPI, Basel, Switzerland. This article is an open access article distributed under the terms and conditions of the Creative Commons Attribution (CC BY) license (https://creativecommons.org/licenses/by/4.0/).
Share and Cite
Zhang, Z.; Fisher, T.; Wang, H. Walk Score, Environmental Quality and Walking in a Campus Setting. Land 2023, 12, 732. https://doi.org/10.3390/land12040732
Zhang Z, Fisher T, Wang H. Walk Score, Environmental Quality and Walking in a Campus Setting. Land. 2023; 12(4):732. https://doi.org/10.3390/land12040732
Chicago/Turabian StyleZhang, Zhehao, Thomas Fisher, and Haiming Wang. 2023. "Walk Score, Environmental Quality and Walking in a Campus Setting" Land 12, no. 4: 732. https://doi.org/10.3390/land12040732