1. Introduction
Forest ecosystems, as natural formations, are vulnerable to a range of natural and anthropogenic threats, which have significant impacts on ecosystem health and are often directly related to their degradation [
1,
2,
3,
4]. Wildfires are one of the threats that bring devastating results at environmental, economic and social levels [
5,
6]. Although it is a natural phenomenon that occurs extensively in all Mediterranean forest ecosystems, the frequency and magnitude of its occurrence in recent decades highlight the magnitude of the problem. According to the European Commission’s 2020 technical report on wildfires [
7], climate change is directly related to the increase in incidents, both at the level of fire initiation and in the indirect change in vegetation and fuel characteristics. The EU Strategy for Adaptation to Climate Change recognized the severity of the problem and promotes a series of measures in different sectors and activities, including reforestation initiatives, vegetation management, community engagement and awareness, early warning systems [
7]. Thus, climate change with prolonged periods of drought, combined with an increase in average temperatures, especially during the summer months, has resulted in more frequent, but also more severe, fires. If all of this is combined with the abandonment of the Greek countryside, the increase in urbanization in recent decades and the lack of management of forest ecosystems, along with a consequent increase in fuel use, it is concluded that the impacts of wildfires are even more devastating [
8,
9,
10].
The Mediterranean landscape, with its special characteristics, the varied topography, the mountain ranges and the abundance of flora and habitats, has been significantly affected by fires [
11]. Fire, as an integral part of the Mediterranean landscape, is therefore a factor that has shaped and influenced the terrestrial ecosystems of the Mediterranean, especially the Mediterranean vegetation zone and, to a lesser extent, the Mediterranean vegetation zone (vegetation zones as defined by the Braun–Blanquet classification system) [
12]. These areas are dominated by species such as evergreen shrubs and trees, low shrubs and toadstools, herbaceous plants and geophytes that mainly flower in spring and autumn. In Greece, for example, there are mainly pure forests of
coniferous conifers,
pine halepensis (
Pinus halepensis) and
Pinus brutia, while, to a lesser extent, there are stands
of Pinus pinea,
Cupressus sempervirens, etc. Similarly, evergreen broad-leaved shrubs are spreading in the southern and island regions, but also widely throughout the country, creating forests and woodlands with species such as holly (
Quercus coccifera),
schisin (
Pistacia lentiscus),
heather (
Erica arborea), etc. These areas and forest species are primarily subject to the largest number of wildfires occurring annually in the country during the fire season, from May to October. These ecosystems and their species, in order to cope, have developed mechanisms of adaptation to fires (such as resprouting or epicormic regeneration, thick bark, serotiny, fire-adapted seeds, etc.) and are therefore considered to be fire-loving or fire-resistant species [
13]. However, even these fire-adapted ecosystems, when affected by repeated fires or subjected to particularly severe destructive effects, are often unable to cope. As a result, they are at immediate risk from soil erosion and landslides, but also in the long term from loss of forest vegetation and the possibility of desertification [
14].
The change in climatic conditions and the occurrence of increasingly frequent recurrent fires in the same areas of thermophilic Mediterranean species, as well as in areas of higher altitudes with cold-tolerant conifers, have resulted in these ecosystems being irreversibly affected. In these cases, restoring ecological balance is particularly difficult and requires immediate restoration measures, including protection of soil capital, erosion control, flood control and artificial regeneration (reforestation) [
15,
16,
17,
18].
A government authority is not in a position to carry out reforestation in the entire affected area mainly because of the high economic costs of reforestation works. However, it must know which areas will be selected for intervention and which are most at risk after the fire has passed. For this reason, it is particularly important to assess and investigate the most suitable locations for implementing restoration measures. Moreover, according to a Greek ministerial decision, it is foreseen that, within 15 days from the outbreak of a fire, the competent services should be able to propose the areas and their parts that need immediate restoration/reforestation. The ability to select suitable restoration sites in a timely manner is important both for the competent authorities and for planning and decision making by the Greek Government.
The advances in modern technologies and, in particular, of Geoinformation have played a key role in decision-making systems and on the solution of complex problems. The development of specialized and easy-to-use software, the increase in the power and capabilities of computer systems have brought significant changes in spatial analysis and in the field of wildfires compared to earlier analog methods of analysis and processing. The advantages of these new Geoinformation technologies include the possibility of easy recording and observation; the use of open data; the possibility of monitoring ecological and socioeconomic parameters; and the evaluation, design and management of a decision-making system [
19,
20,
21,
22,
23].
The use of geographic information systems (GISs) as part of Geoinformation technologies is of great significance in the planning and analysis of complex spatial problems [
24]. These are used to transform geographic data, process them, analyze and visualize results [
25,
26,
27]. In particular, through GIS it is possible to achieve the identification of areas which carry a combination of features, the application of multicriteria parameter analysis to solve complex phenomena, statistical data processing and the creation of decision making models [
28].
At the same time, remote sensing (RS) provides a wealth of high-resolution satellite data available in recent years, and technological advances in science offer the possibility of timely, remote and highly accurate spatial information, as well as a wide range of possibilities [
29,
30,
31]. They can contribute to parameter mapping and change detection, as well as assessment and indicator generation [
32,
33,
34,
35].
The assessment of areas affected by catastrophic wildfires and the selection of areas in need of immediate restoration is a complex and multifactorial process [
17]. Through the science of Geoinformation and its advantages, the analysis of the factors and criteria related to the phenomenon becomes more accessible. While Geoinformation provides valuable insights, it is crucial to recognize the inherent limitations, especially in cases where ecosystems are exposed to novel climatic conditions. This approach enhances our understanding and helps us draw informed conclusions, acknowledging the potential impact of imperfect ecological knowledge [
36]. The development of an easy-to-use tool for the direct, targeted and low-cost assessment of areas requiring further post-fire rehabilitation is possible through modern technologies. The combination of geospatial and RS data to investigate potential reforestation sites can provide useful and meaningful results [
37,
38]. These results, with the help of modern internet technologies and web-based GIS (WebGIS), can be easily available and accessible to the general public. In recent years, there has been a rapid advancement of the internet which has followed the general development of the IT sector. This development has not been lacking in the field of GIS, where WebGIS services have been developed for the processing, analysis and dissemination of geographic information. These capabilities were based on a series of services and standards such as WMSs (Web Map Services) and WFSs (Web Feature Services) based on the specifications of the OGC (Open Geospatial Consortium). These services allow for easy and fast sharing of geographic data with the public at large, as well as the possibility of editing by remote users [
39,
40].
GIS and RS together have been used extensively in recent years to exploit and analyze spatial information, to disseminate results in map form in an understandable way and to facilitate decision making (e.g., [
17,
29]). They have been exploited in a multitude of studies and are widely applied in the environmental field, particularly in wildfires and post-fire succession and restoration [
17,
41,
42,
43].
Already in the previous decades, GIS had started to be used in relevant studies and played an important role in data analysis and processing. In San Bernandino National Forest, California, a fire prediction system developed, taking into account available geographic data and making use of GIS to calculate relevant indicators and the probability of occurrence [
44]. Epp and Lanonville [
45] developed an intelligent fire management system for Northwestern Canada, using GIS and remote sensing data. They included procedures for fire risk prediction, fire progression and response planning. Later, in another study, Ruiz-Gallardo et al. [
46] generated a priority map of intervention after a forest fire in the Southeastern Iberian Peninsula, taking into account fire severity, slope and exposure. They propose a semi-automatic method to identify the areas that are most at risk of erosion, using GIS technology and related remote sensing indicators.
In the contemporary literature, for example, Schulz and Schroder [
47] used GIS to evaluate areas with Mediterranean climate characteristics in Central Chile which are facing deforestation and need immediate implementation of restoration programs. Their study applied the spatial multicriteria analysis to identify sites for reforestation that meet multipurpose forestry, using land cover data. The use of such new tools of geoinformatics, combined with data that can be quickly and easily assessed from satellite data, has been applied in several works aimed at evaluating areas for restoration; for example, [
35,
48,
49] studied the rates of new vegetation emergence after a fire in a maritime pine forest in Northwestern Spain, using high-resolution satellite data (WorldView-2). Fernández-Manso et al. [
25] used radar and LIDAR datasets, combined with optical and thermal data, to map the destruction and regrowth of Mediterranean pine forests after wildfires. The synergy between the two sciences thus offers a wealth of advantages and opportunities, particularly in the field of wildfires and restoration. In these fields, the study areas cover large areas, the natural environment is dynamic and constantly changing, and, as a result, data collection and field measurements are time-consuming and costly [
18]. Therefore, the combination of modern information technologies can provide easy, economical and accurate results to identify and evaluate ecological restoration sites in post-fire landscapes [
50].
The aim of this paper is to use geoinformatics technologies to create an easy-to-use model which provides the possibility to evaluate and identify the most suitable sites for restoration after a wildfire. For the purposes of this work, the boundary of the catastrophic fire of 2016 in the area of Prinos, Thasos Island, was chosen as the study area. The selection was made by taking into account all available data and the physical and geographic characteristics of the area. It was also taken into account that this forest ecosystem has been repeatedly affected by wildfire events and is a representative Mediterranean thermophilous coniferous forest.
2. Materials and Methods
2.1. Study Area in General
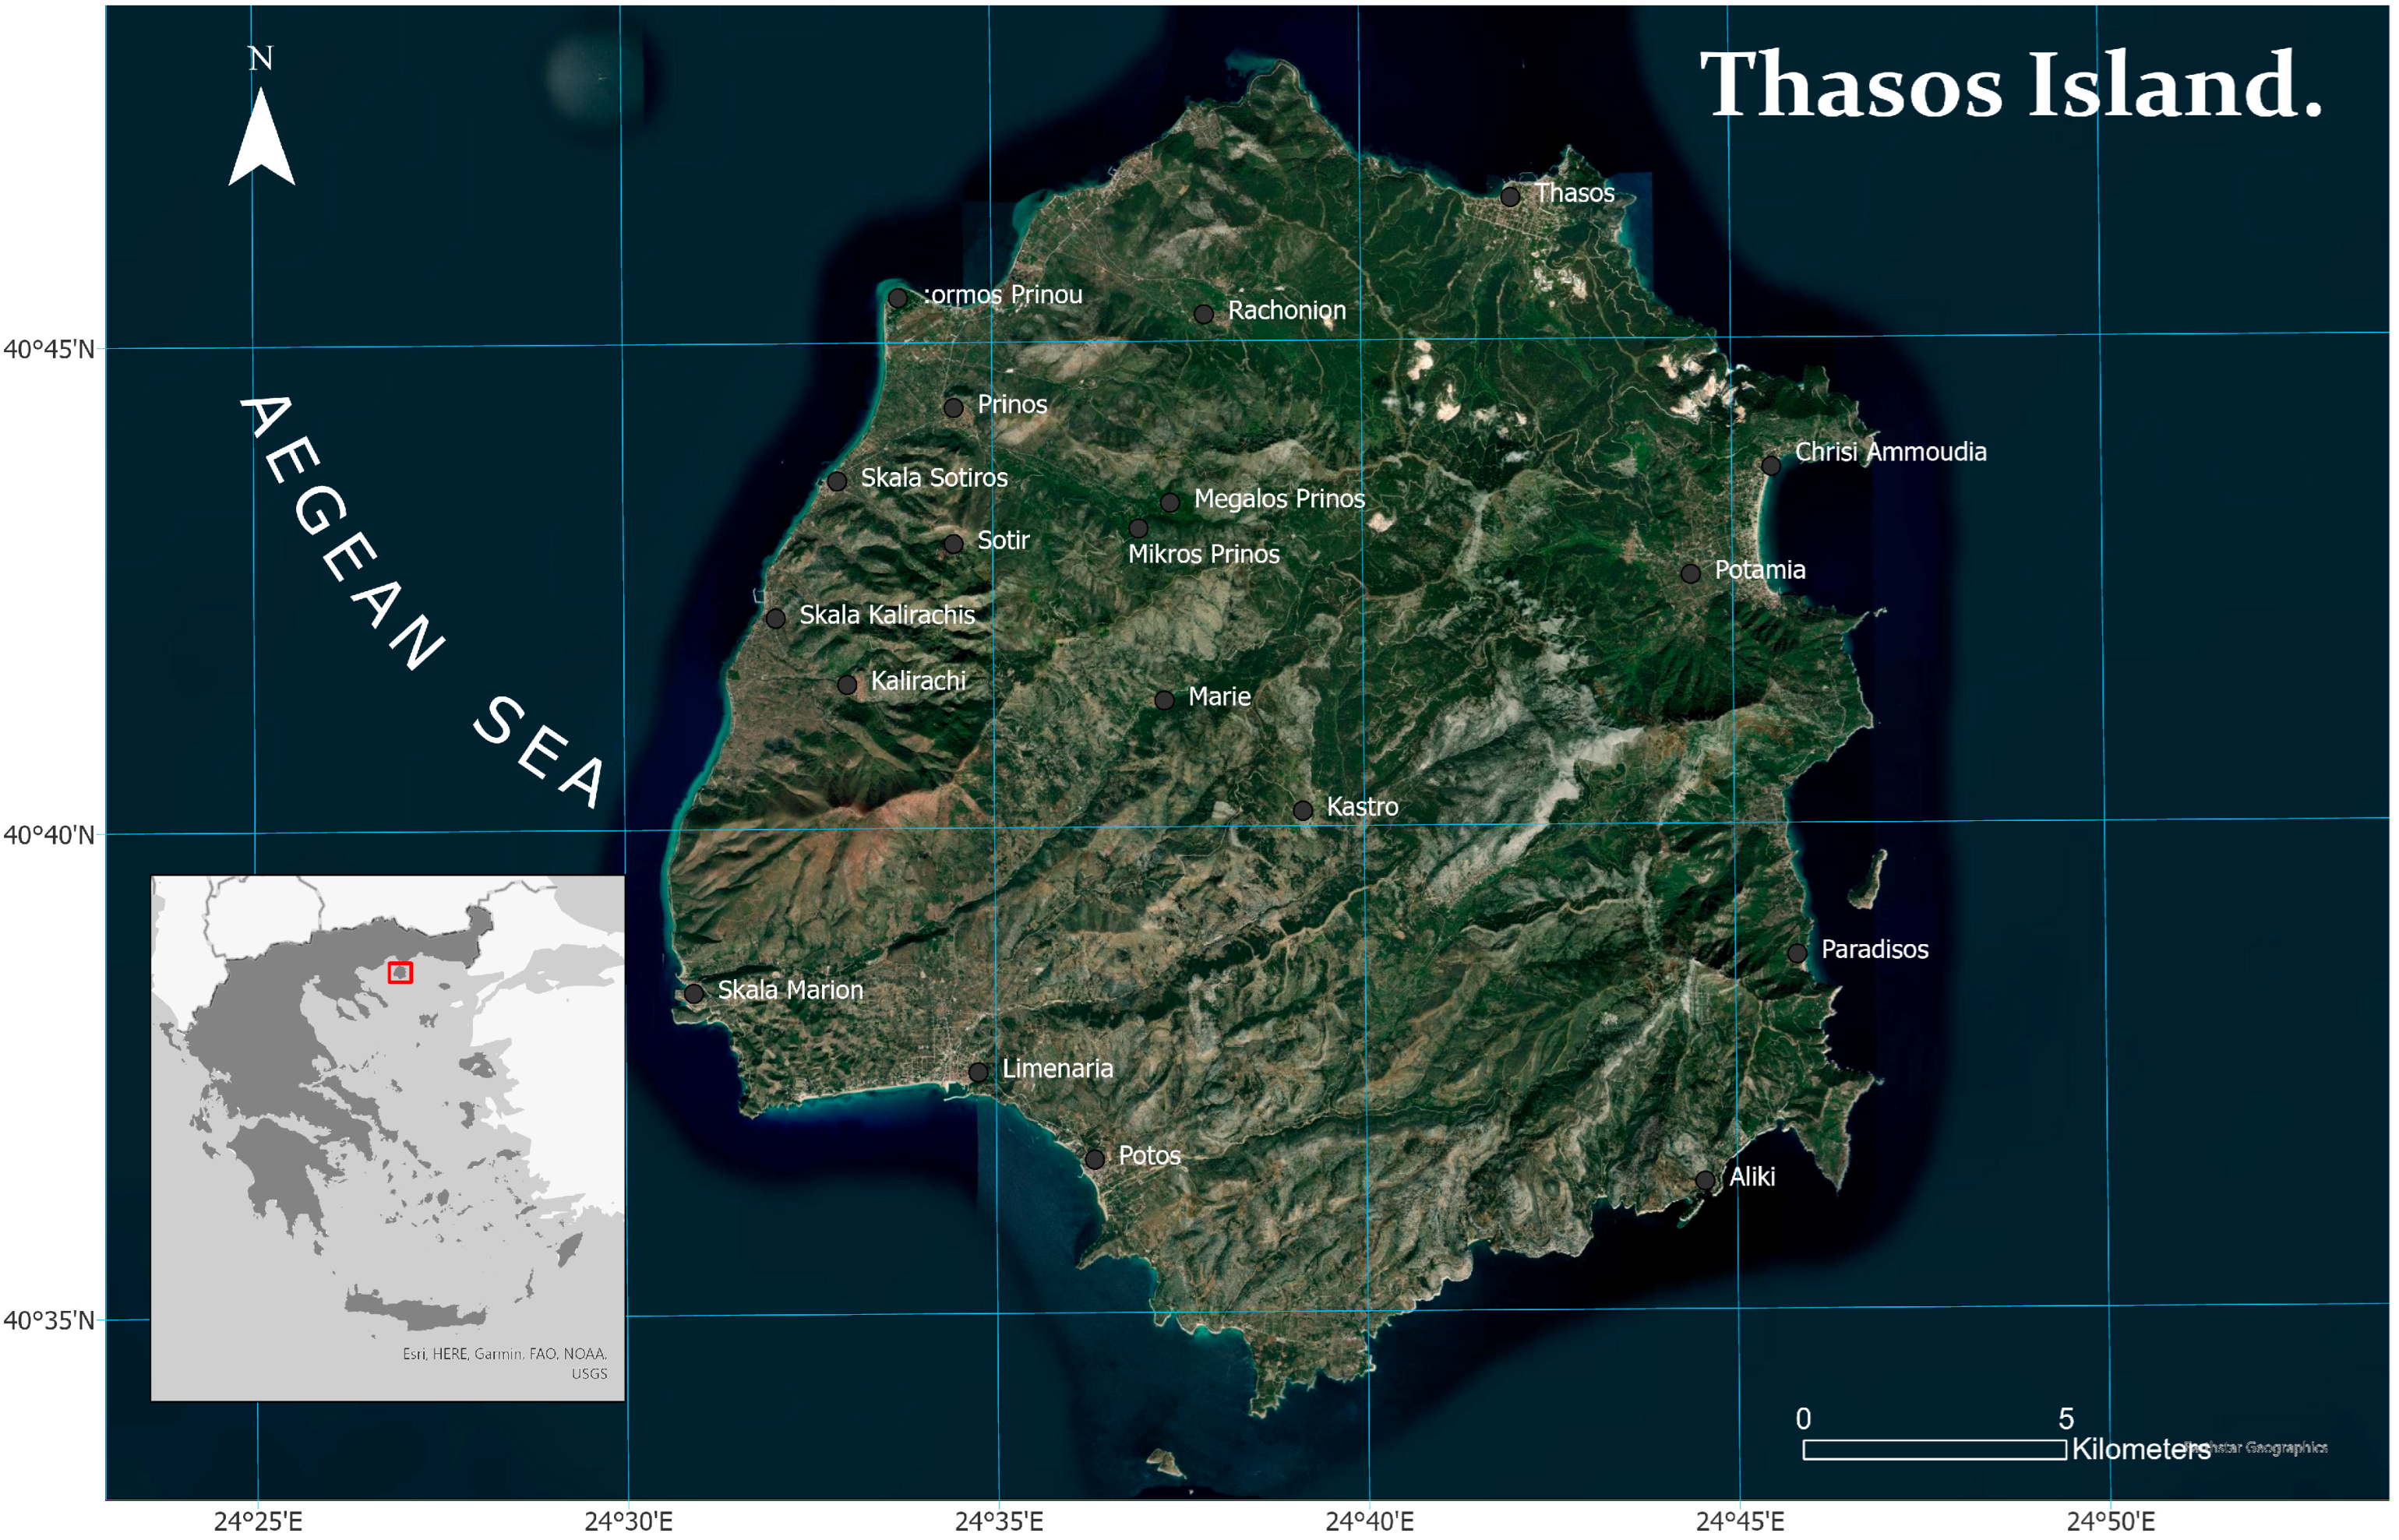
The island of Thasos (
Figure 1) is located in the North Aegean Sea and is considered the northernmost island of Greece (40°41′34″ latitude and 24°39′1.95″ longitude). The coastline of Thasos is about 115 km, and the island’s area is 378.8 km
2. Administratively, it belongs to the Region of Eastern Macedonia and Thrace and the Regional Unit of Thasos, according to the Kallikratis program (the Kallikratis program is a reform of the administrative divisions of Greece). It is about 24 km away from Kavala, but it is also connected by sea transport to the town of Keramoti. The capital of the island is Limenas, and the other main settlements are Limenaria, Prinos, Theologos and Kallirachi. Thasos is a mountainous island with an intense relief, presenting extensive ridges and several trenches. The highest peak is the Ipsario Peak at 1203 m in altitude.
The island of Thasos is chronically affected by forest fires. Ιn the Region of Eastern Macedonia and Thrace, the three worst fires for the period 1983–2006 were recorded in the prefecture of Kavala. A large percentage of the areas of Thasos has been affected at least twice by catastrophic fires. Also, about half of the island’s surface area was burnt between 1984 and 2000. Specifically, in 1984, 1985, 1989 and 2000, major catastrophic fires occurred in the western and southern part of the island which incinerated almost the half of the total area of the island. Forest fires broke out again in the western part of the island in 2004, 2008 and 2013. One of the worst years for the island of Thasos was 2016, as 68,870 ha was burnt again in three areas of the southern and western parts of the island. In particular, on 10 September 2016, four fire fronts occurred in different parts of the island which developed into the major fires of 2016. The outbreaks were caused by an abundance of lightning recorded in the area, without the presence of rain. This rare phenomenon of “dry thunderstorms” affected Eastern Macedonia and Thrace but mainly occurred on the island of Thasos. The increased dryness of the fuel, due to the absence of rainfall in the previous period, allowed the fire fronts to burn for three consecutive days and cause great damage to the natural environment and infrastructure.
2.1.1. Vegetation
Thasos Island features Pinus brutia forests, alongside stands of
black pine (
Pinus nigra) at higher altitudes and some hybrid spruce (
Abies borissi-regis) in cooler spots. The island also hosts evergreen broadleaves like holly (
Quercus coccifera),
arbutus unedo,
Quercus ilex and
Pistacia lentiscus. The understory mainly consists of heather (
Erica arborea), vital for beekeeping, and there are occasional appearances of broad-leaved species like the plane tree (
Platanus orientalis),
chestnut (
Castanea sativa),
poplar (
Populus tremula) and willow (
Salix sp.) Thasos is rich in flora, including endemic and rare species. Thasia is found only in this region. The Mediterranean vegetation zone (
Quercetalia pubescentis) is found at altitudes between 300 and 800 m and includes the predominant species of the island, rough pine [
13]).
2.1.2. Climate–Meteorology
This study used the data from a meteorological station in Thasos, the National Observatory of Athens in Prinos, which was recently put into operation and has meteorological data only after 2020. This station is located next to the study area. The yearly average temperature is 15.3 °C. The highest average monthly temperature is 26.1 °C and was observed in July, while the minimum is 5.6 °C and was observed in January. Similarly, the average minimum monthly minimum temperature of 1.8 °C is observed in January, and the average maximum of 30.2 °C is observed in August. The annual rainfall is 466.2 mm. A higher amount of rainfall occurs in the winter months, and it decreases significantly in the summer months. The highest average rainfall is observed in December, i.e., 78.4 mm.
2.1.3. Geology
Thasos belong to the Rhodope crystal-rich complex of metamorphic rocks. It is dominated by crystalline schistose and exfoliated rocks of the Pre-Paleozoic period and formations of the Mesozoic century, as well as metamorphic limestones. The younger layers of Neogene, Tertiary and Quaternary deposits are found in places. According to the geological map, the center of the island, especially in the more mountainous parts, is dominated by compact semi-metamorphic limestones of amphibolite and gneiss. At lower altitudes around the island, crystalline limestone and marble are found at lower altitudes. To a lesser extent, mainly in the coastal zone, newer layers of sediment, sandy loams and sandstones are restricted to the coastal zone. The dominance of crystalline schistose and metamorphic rocks, especially in mountainous areas, may impact vegetation types and fuel availability, potentially influencing fire behavior. Additionally, the presence of sedimentary formations, such as sandy loams and sandstones in the coastal zone, might contribute to different fire dynamics compared to the compact semi-metamorphic limestones found in the mountainous center of the island.
2.2. Study Datasets
The evaluation of the burnt area of Prinos, as to the optimal restoration sites, will be based on a series of characteristics and elements of the area that need to be analyzed and combined with each other. The data, in this particular case, arise after the review and thorough research of the international literature and are divided into two distinct categories: ecological and economic criteria. The ecological criteria refer to the parameters that favor or hinder the growth of vegetation, based on the climatic and physical–geographical characteristics of the area. The economic criteria refer to the factors that increase or reduce the cost of afforestation, depending on the location where it is carried out. The next table (
Table 1) presents the data used for the proposed methodology.
2.3. The Proposed Methodology
The aim of the study is to develop a model for the evaluation of optimal rehabilitation sites based on a set of criteria that will be used in combination. The solution to this which is proposed herein is based on variables such as vegetation, soil, burnt area, digital elevation model (DEM), settlements and road network. The existence of a multitude of criteria that must be combined with each other to evaluate a situation and draw the final conclusions necessitates the use of the multicriteria decision analysis (MCDA). This method incorporates quantitative indicators to determine the importance of each criterion and proceed to the synthesis of the individual criteria [
28,
51,
52,
53]. Since the phenomenon under consideration and the variables of the model have spatial characteristics, the model of the weighted multicriteria analysis with cartographic superposition was adopted [
54].
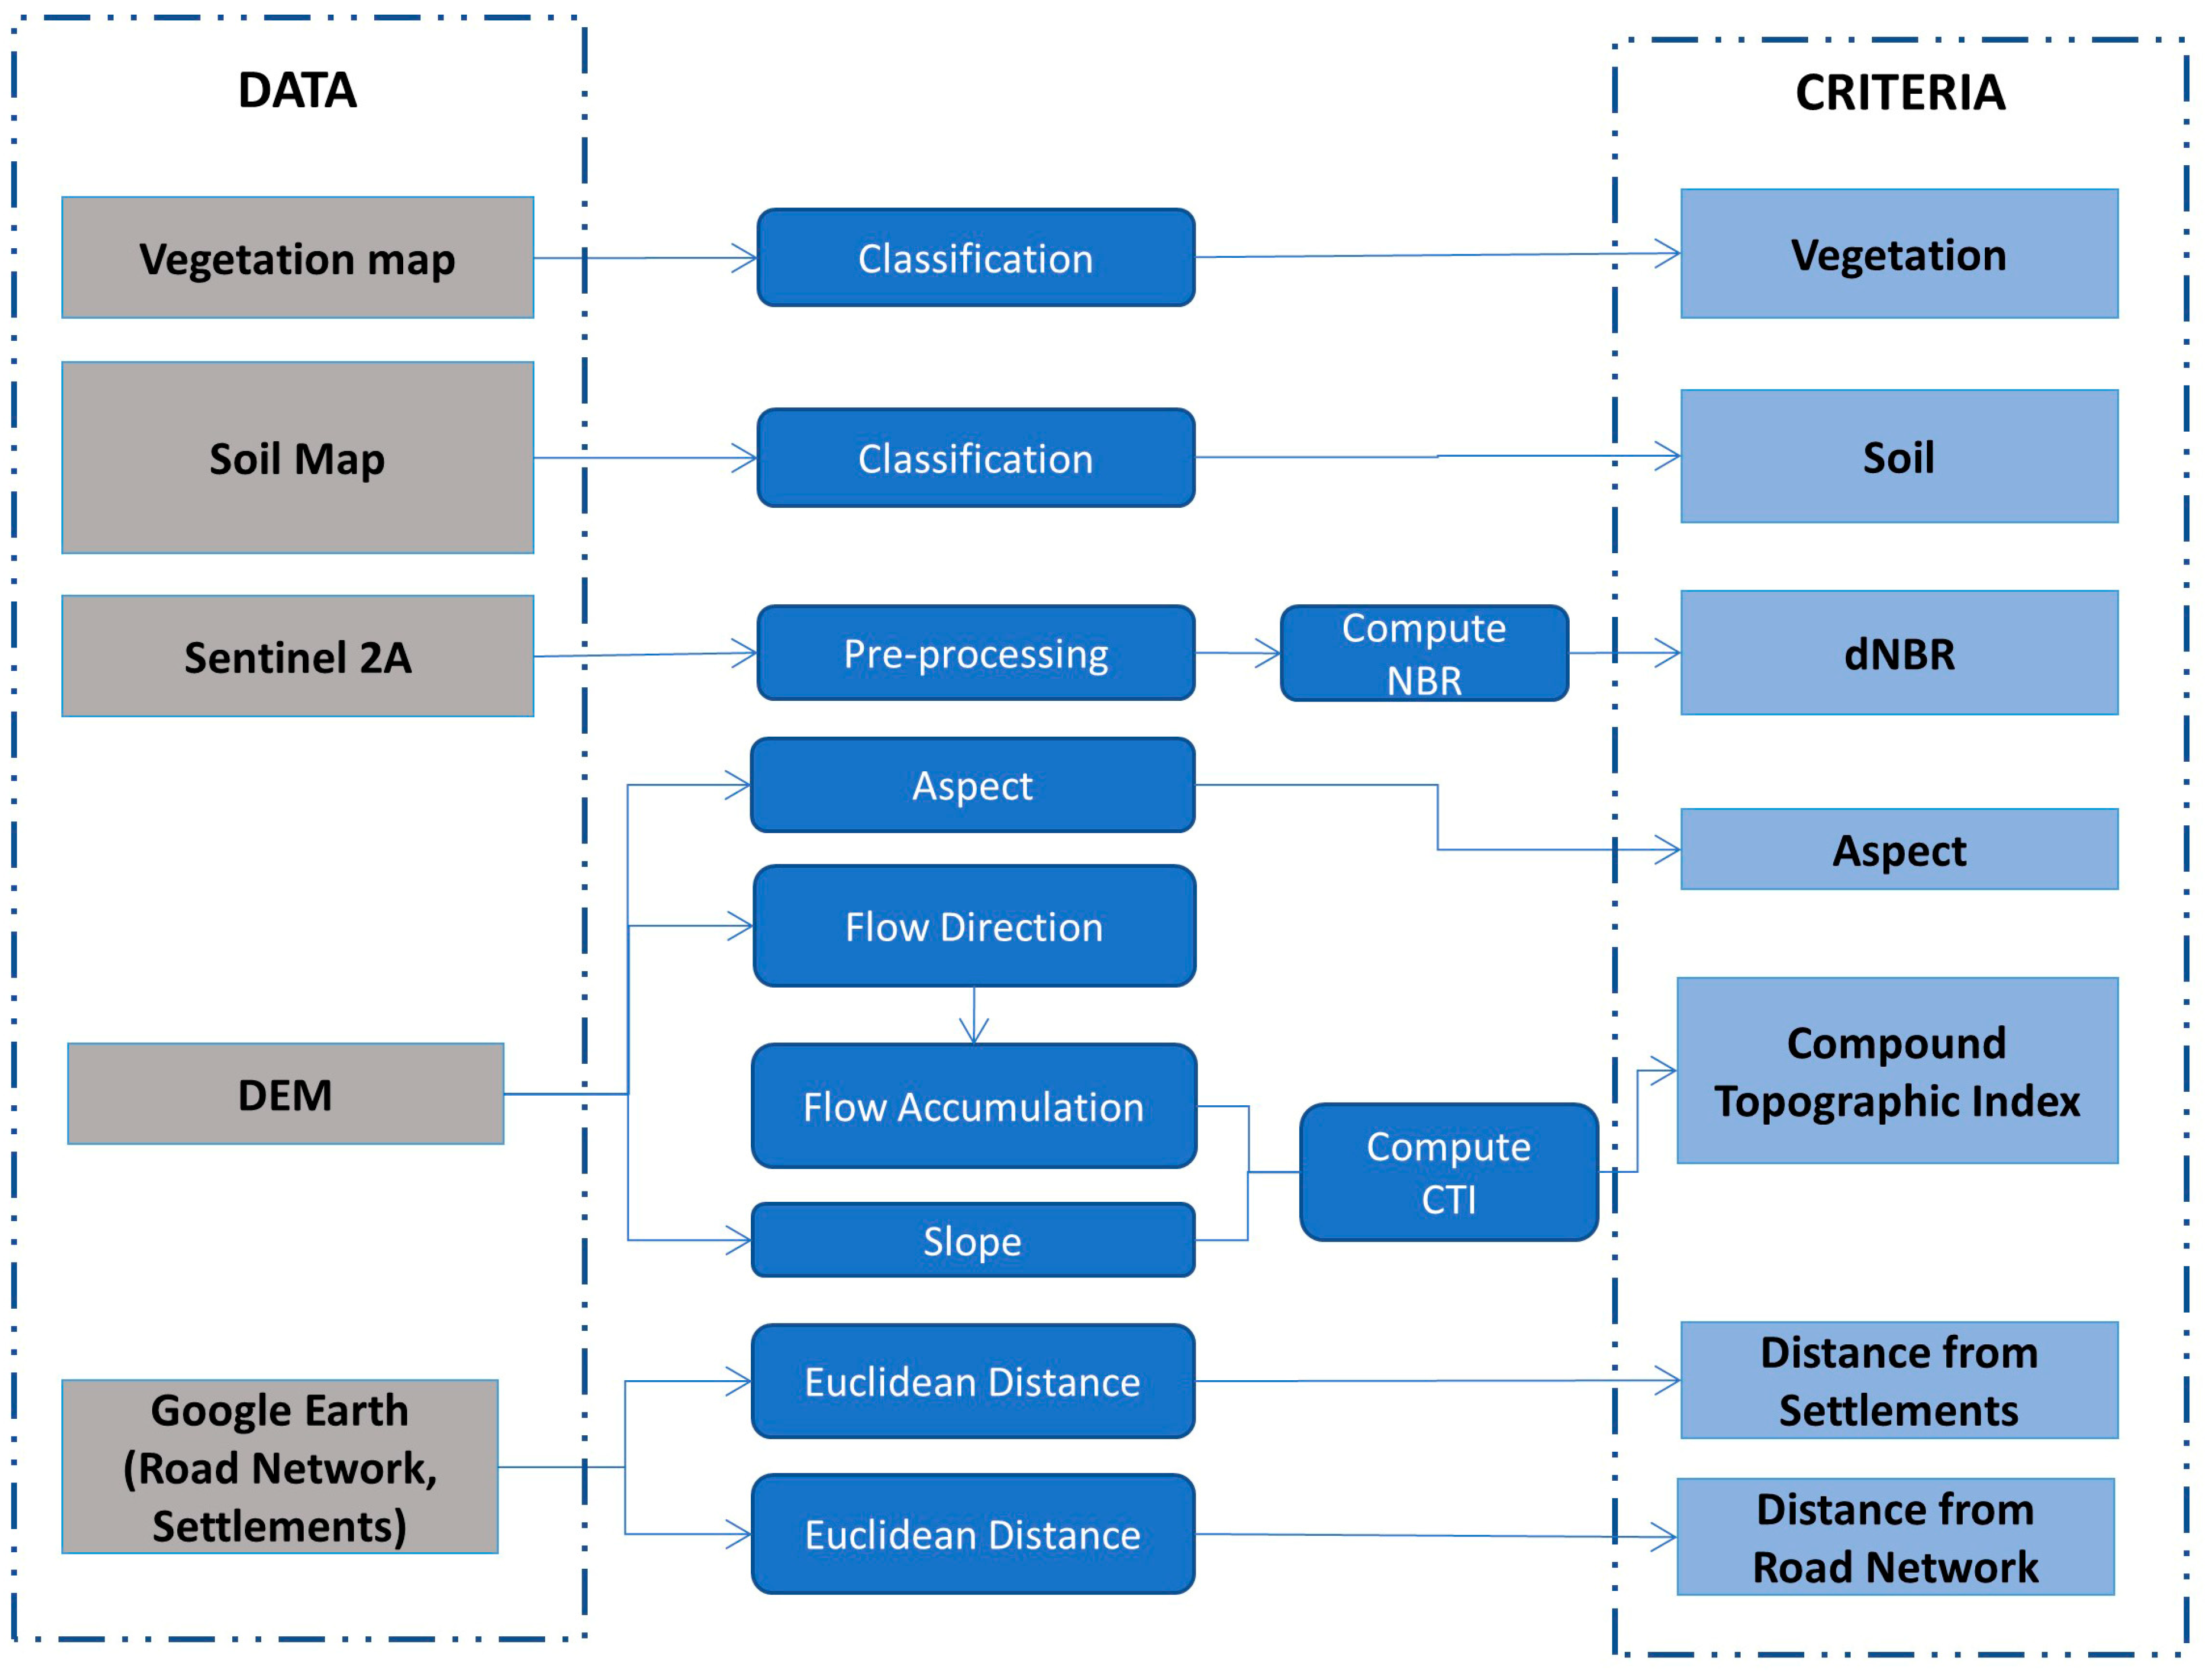
The analysis that follows in the next section, in the first phase, presents the actions required to develop the 7 variables from all available data. The ArcGIS Pro 3.0 and SNAP 8.0 software packages were used for the tasks and data processing needs. The following figure (
Figure 2) shows, in diagram form, the workflow and procedures followed to create the individual criteria from the primary data.
The repetition of criteria and variables in this study arises from a deliberate alignment between the chosen spatial parameters and the fundamental components of our evaluation model. These factors were meticulously selected due to their intrinsic importance in post-fire landscape assessment. The term “scenarios” encapsulates the various conditions or situations resulting from the interplay of these variables, forming the core of our work. Each scenario represents a unique combination of spatial parameters, facilitating a comprehensive evaluation of optimal rehabilitation sites. In response to the reviewer’s valuable feedback, we provide an enhanced explanation in the manuscript, elucidating the critical role of these variables in shaping different scenarios and their significance in achieving the study’s objectives.
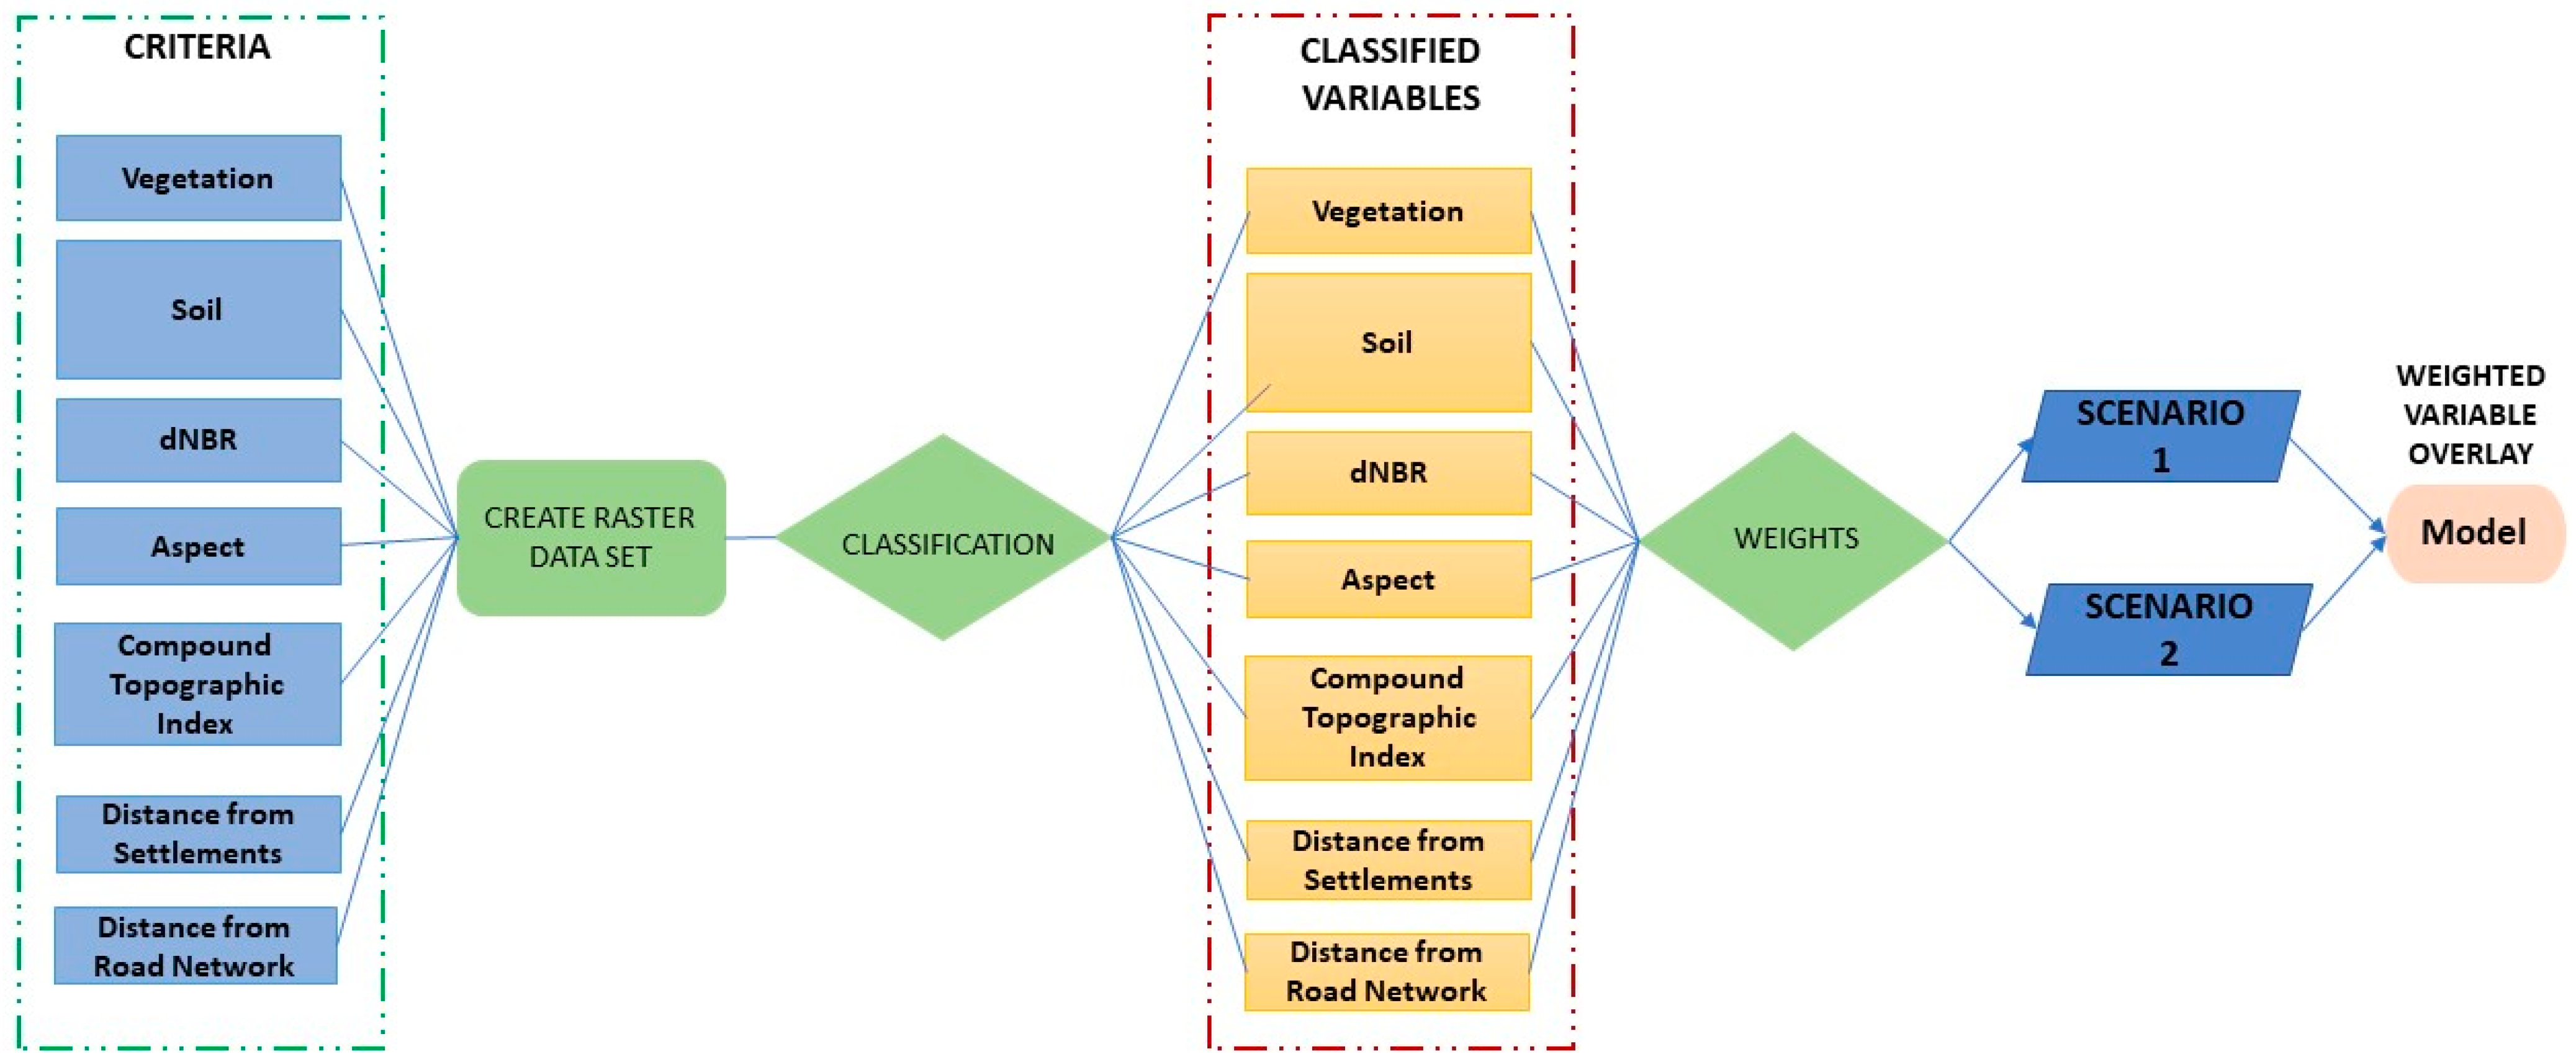
In the next phase, after the configuration of the individual variables, all the necessary actions are applied to allow for the synthesis of each individual criterion. In the following (
Figure 3), the workflow diagram of the weighted multicriteria analysis for the development of the sites’ rehabilitation evaluation model is presented.
The final variables used are as follows:
The state and composition of vegetation both play a pivotal role in the recovery process of ecosystems following a wildfire event. GIS technology allows for the detailed mapping and analysis of vegetation types, their density and their health. By considering these factors, restoration planners can make informed decisions about the suitability of a site for restoration efforts. Assessing the pre-fire and post-fire vegetation can help identify areas where native species have been severely impacted or invasive species have taken hold, guiding the prioritization of restoration efforts. Additionally, vegetation data can help determine the ecological significance of a site, its potential for natural regeneration or the need for active intervention like reseeding or planting.
- ii.
Soil
Wildfires can significantly impact soil properties, including the nutrient levels, composition and stability. GIS technology facilitates the analysis of soil characteristics, helping to assess the extent of damage caused by the fire and identify areas that may require restoration interventions. Understanding soil conditions is essential for determining the suitability of a site for ecological restoration, as it influences the success of plant establishment and overall ecosystem recovery. Soil data can inform decisions about the choice of plant species, erosion control measures and the need for soil amendments.
Table 2 presents the different rock types and soil depths identified at the study area’s boundary. They are classified into four classes of suitability, based on their ability to accommodate new seedlings and provide the appropriate supplies for their growth. Gneisses are clearly superior soils to limestone for vegetation establishment [
55].
- iii.
Differenced Normalized Burn Ratio (dNBR)
The calculation of the NBR requires the use of satellite data. It is based on the wavelengths of the electromagnetic spectrum of the near infrared (
NIR) and shortwave infrared (
SWIR), according to the following equation [
56,
57].
The analysis and calculation of the severity index was based on images from the Sentinel 2 satellite. Specifically, images of the Sentinel 2A and Level 1C logger were selected as recorded in the table below. The images of this level were atmospherically corrected, and the values of reflected electromagnetic radiation recorded are affected by the atmosphere. These images (1st image ID: S2A_MSIL1C_20160819T091032_N0204_R050_T34TGL_20160819T091026119-8-2016, 2nd image ID: S2A_MSIL1C_20160918T090622_N0204_R050_T35TKF_20160918T090923/18-9-2016) are close to the 10 September event and also show little to no cloud cover in the region of interest, while their spatial resolution is 10–60 m.
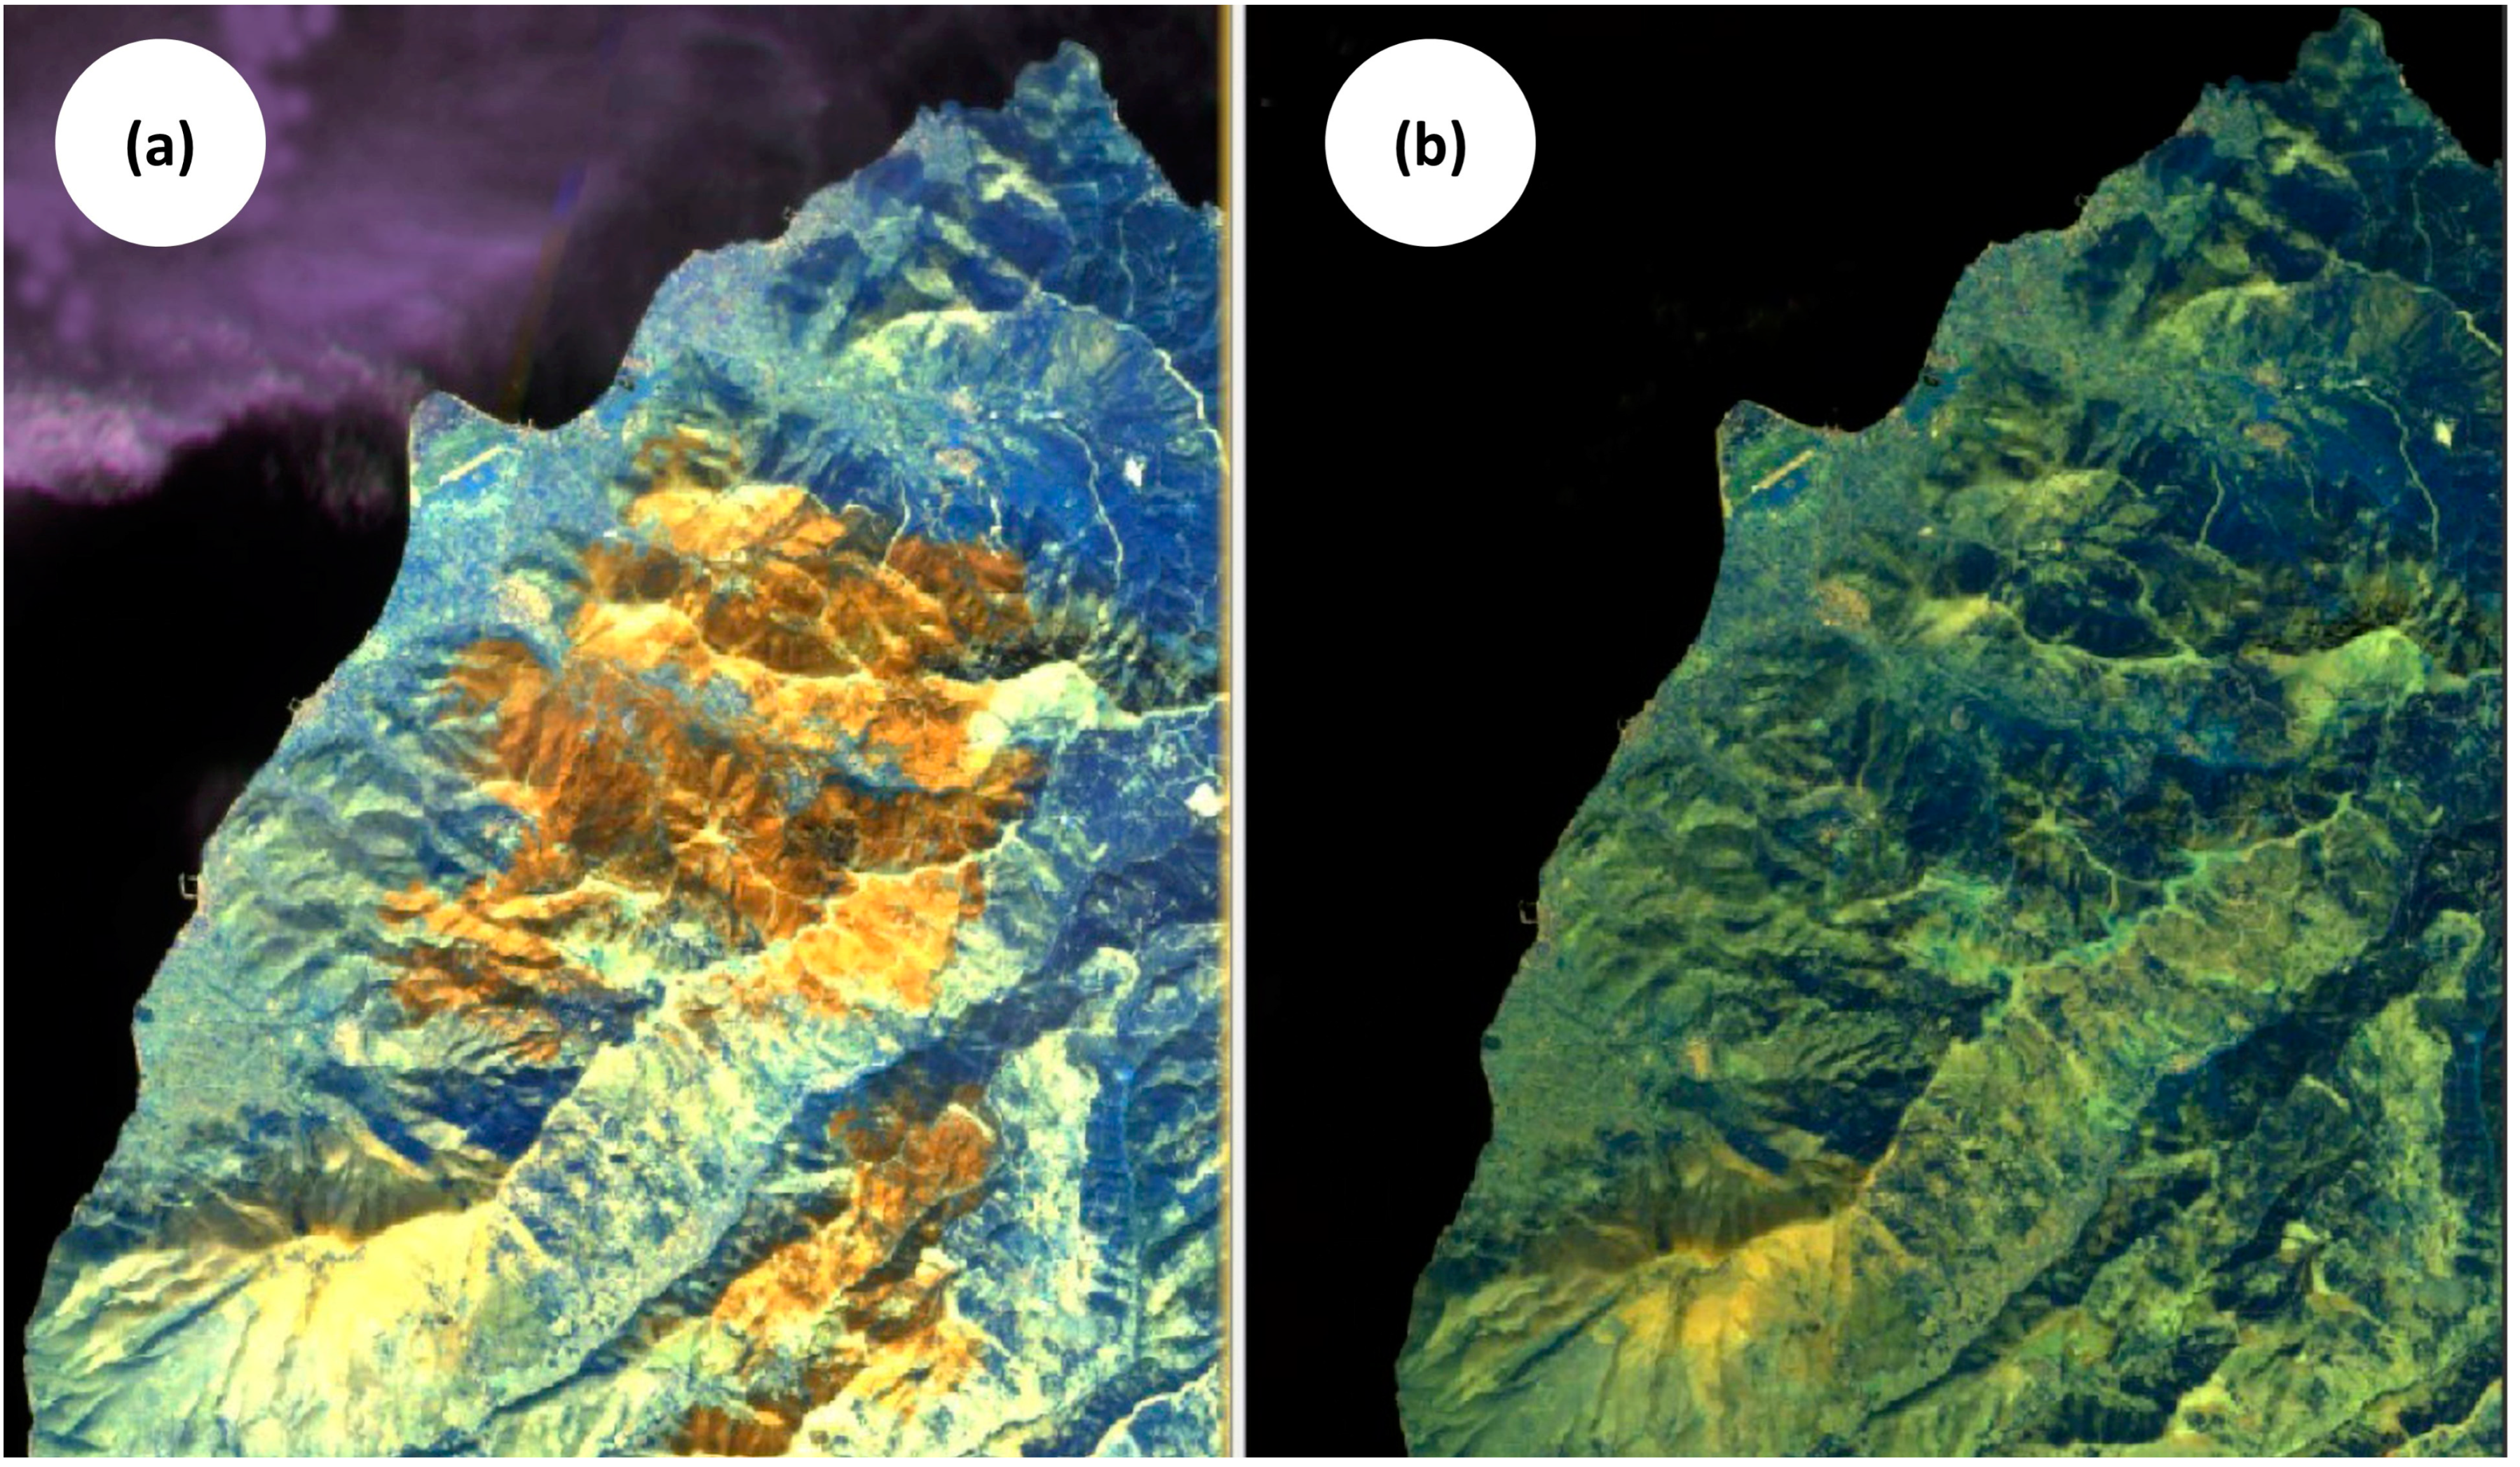
The figure (
Figure 4) below shows the situation in the northwestern part of Thasos after the devastating fire (
Figure 4a), and the situation before the fire on 19 August (
Figure 4b). The determination of the difference in the severity index between the two pre-fire and post-fire images had to be developed as a different channel so that it would include the information for the whole area.
This geometric process was performed by combining the two images into one, taking into account and combining the values of each image cell. The image taken on 19 August was designated as the main image, and the one taken on 18 September as the subordinate. In the new product created, the function is as follows:
- iv.
Aspect
Aspect is a fundamental geospatial parameter that plays a crucial role in assessing and identifying ecological restoration sites in post-fire landscapes within the context GIS. Aspect refers to the compass direction that a slope or landform faces, influencing the amount of sunlight and moisture an area receives and ultimately impacting the distribution of vegetation and ecological conditions. In a geospatial approach to identifying and evaluating restoration sites, aspect data are instrumental for assessing the suitability of potential sites for restoration efforts. It helps in understanding how solar exposure and moisture patterns vary across the landscape, which, in turn, aids in selecting sites that can support the regeneration of vegetation and the restoration of ecological balance in areas affected by wildfires. In this study, aspect was derived from the DEM in a mosaic form, with a resolution of 10 m.
- v.
Compound Topographic Index (CTI)
The Compound Topographic Index (
CTI) is an indicator which is related to the accumulation of surface water runoff and the slope of the soil. It is calculated according to the following equation proposed by Beven and Kirkby [
58].
The index is defined as the natural logarithm of As times the tangent of β, where As is the runoff accumulation based on the scale of analysis, and β is the slope of the terrain in radians. The calculation of the CTI index was based on the digital elevation model (DEM) of the study area. Runoff accumulation, a variable required to determine the CTI index, is derived from the level of runoff direction. Any point on the ground that has an elevation less than its neighbors is given the value of the sum of the cells contributing to runoff up to that point. The sum of the overlying cells depends on the direction of runoff movement, with the result that the highest values are observed in the stream beds and estuaries.
The denominator of the
CTI index equation includes the soil slope criterion, which was calculated based on the DEM. The slope plane generated was converted from degrees to radians, where each cell was assigned a slope value based on the following equation:
- vi.
Distance from Settlements
The distance from settlements is a critical parameter in a geospatial approach to identifying and evaluating ecological restoration sites in post-fire landscapes. As wildfires can pose significant threats to human settlements, it is essential to consider the proximity of restoration sites to inhabited areas. GIS technology enables the analysis of this distance, helping to ensure the safety of both local communities and restoration crews. It also plays a pivotal role in the strategic planning of restoration efforts, as selecting sites far removed from settlements reduces the risk of potential conflicts, resource competition and interference with ongoing recovery efforts.
- vii.
Distance from Road Network.
The road network is a crucial parameter in a geospatial approach to identifying and evaluating ecological restoration sites in post-fire landscapes. Roads can have a significant impact on the environment, affecting wildlife habitat, soil erosion and water quality. In this context, GIS technology is invaluable for assessing the accessibility of potential restoration sites in relation to the existing road network. Analyzing the road infrastructure allows restoration planners to make informed decisions regarding site selection. The presence of nearby roads can facilitate logistical aspects of restoration efforts, such as the transportation of equipment and personnel. However, it is essential to strike a balance, as excessive road proximity may result in increased human disturbances and associated negative ecological impacts.
Each variable will be introduced into the model as a different thematic level after the necessary processing. The analysis is based on converting the criteria into a mosaic format so that each point in the space is given a separate value based on its characteristics. This is followed by classifying the individual criteria and their synthesis based on different weighting factors obtained through the Analytical Hierarchy Process [
59]. Two different scenarios are applied, assigning each one more weight to the ecological or economic criteria. The spatial resolution to be used is 10 m so that there is extensive detail for the study area to allow for detailed planning by managers during the decision-making process.
After reclassifying the criteria, the subsequent crucial step in the analytical process involved the homogenization of variables to establish a consistent scale spanning from 1 to 5. This harmonization was undertaken with the primary objective of creating a standardized platform for evaluating and comparing all the variables within the study. The process served to eliminate any disparities stemming from varying measurement units or scales employed for different criteria. This standardization not only facilitated direct and equitable comparisons between the variables but also simplified the overall analysis, rendering it more comprehensible and user-friendly for interpretation and decision making. The uniform scale ensured that each variable held an equal footing in the evaluation process, contributing to a more balanced and objective assessment. Furthermore, this standardized 1–5 scale offered an efficient means of conveying the results and recommendations to stakeholders, project team members or decision makers, enhancing the clarity and effectiveness of communication within the context of the project.
The final stage of the methodological approach was the synthesis of the homogenized variables from the previous procedure based on specific weighting factors. For this reason, two scenarios of weighted variable composition were chosen to be applied.
Scenario 1 prioritizes ecological constraints and favors the importance of optimal vegetation growth conditions.
Scenario 2 gives greater weight to the economic and social benefits of restoration, favoring the criteria of distance from settlements and roads.
The determination of the weighting coefficients was based on the Analytical Hierarchy Process, as described by Saaty [
59]. According to the method, the variables are compared pairwise in an aggregate comparison matrix. The comparison was made on a scale of 1 to 9. The higher the preference for one criterion over another, the higher the score tends toward 9, while the lowest criterion in the comparison pair automatically receives a score below one (e.g., 1/9 = 0.11).
3. Results and Discussion
3.1. The Parameters Used
3.1.1. Vegetation
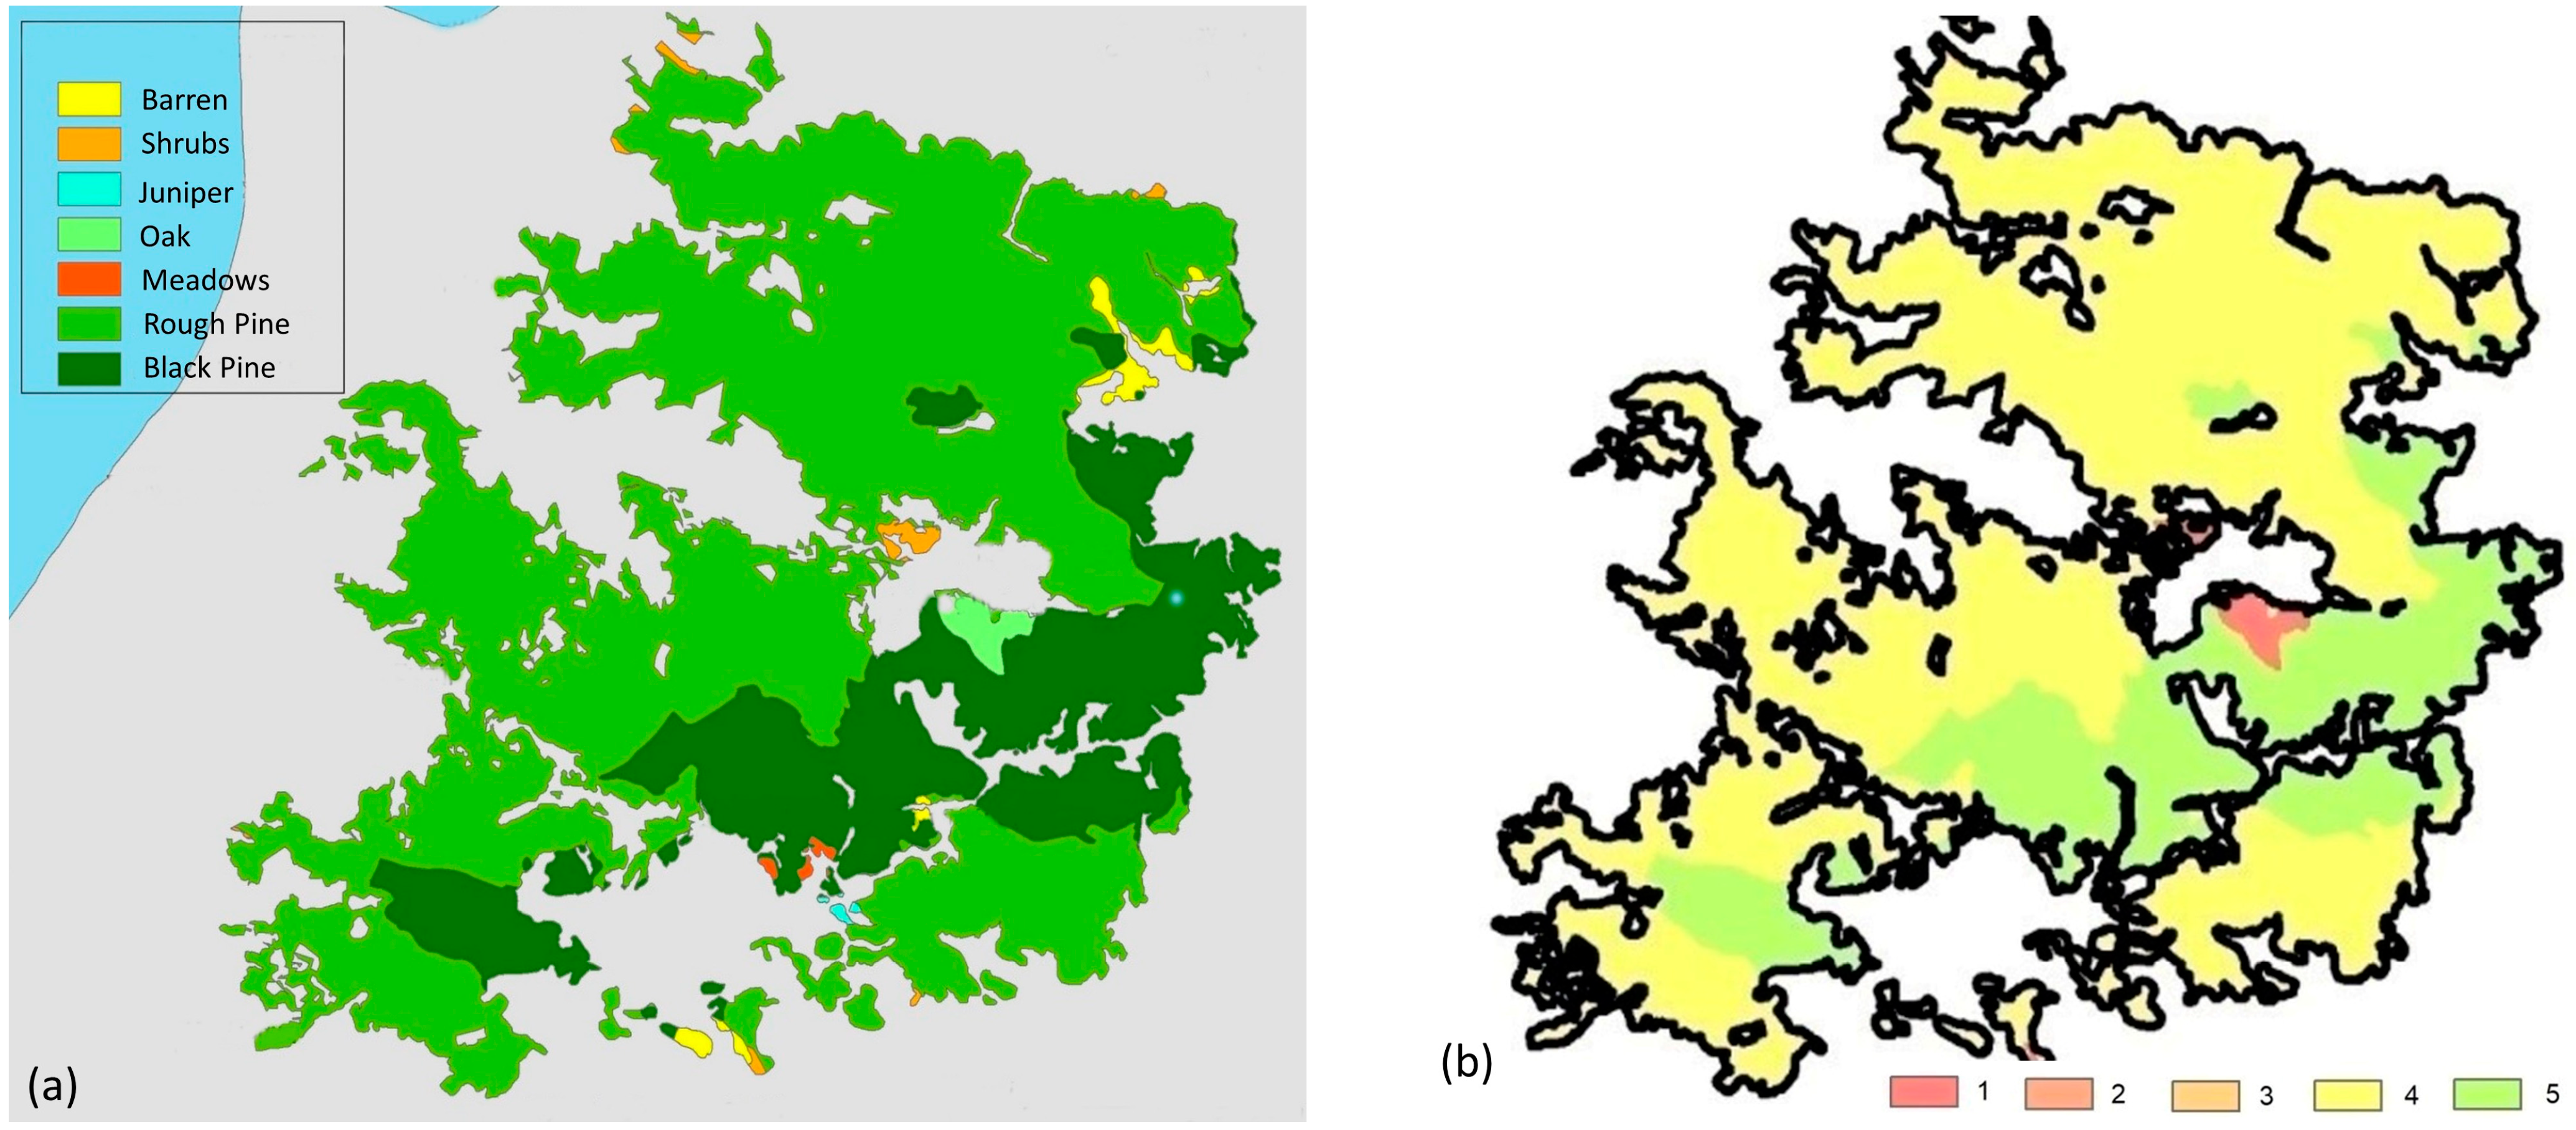
The vegetation variable was converted to a raster layer, as described by the workflow (
Figure 3). The vegetation in the wider area before the catastrophic fires includes herbaceous, bushy and wooded areas. Most of the affected area was covered by black pine. The remaining areas were occupied by bushy species, such as juniper, oak and holly. Barren land and grassland belong to the same herbaceous vegetation category. The areas that are suitable for afforestation include mainly open areas of low vegetation and burnt areas of coniferous species where there is a high probability that they will not regenerate naturally. Shrub and rocky areas should be avoided for afforestation. Moreover, black pine, as a cold-hardy conifer, should be given priority in restoration work over rough pine [
1,
2]. The next figure presents the initial vegetation map (
Figure 5a) and the reclassified one (
Figure 5b), which is one of the parameters of the methodology used.
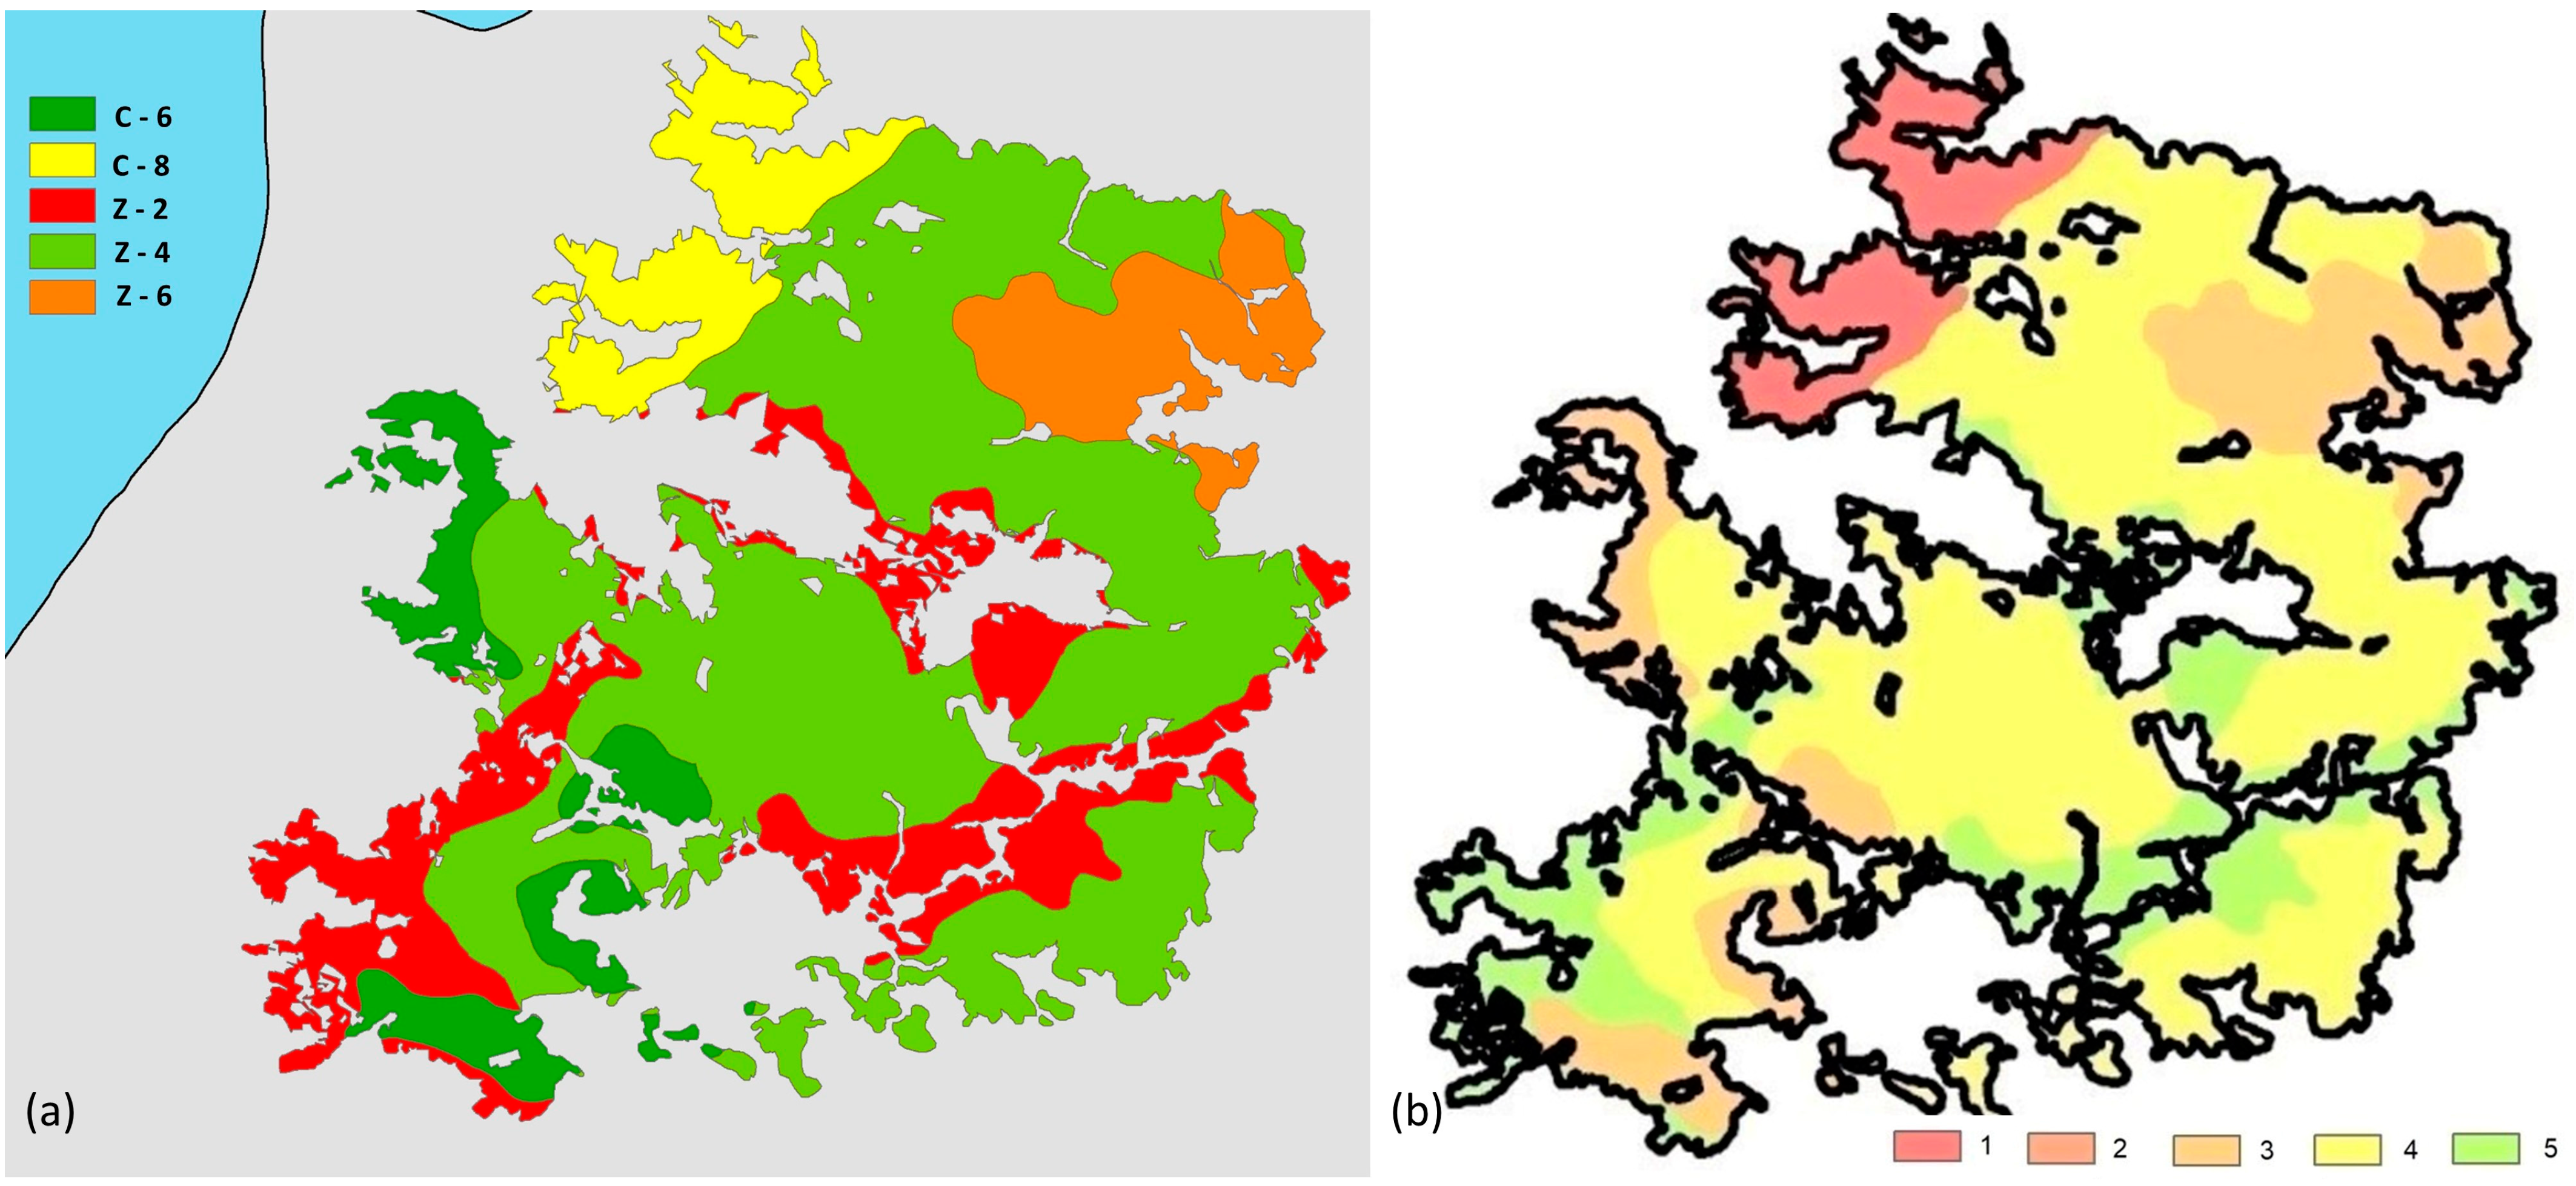
3.1.2. Soil
The soil characteristics map records the bedrock and soil depth, characteristics that relate to the potential for vegetation growth and the quality of a site. The codes used to describe the type of parent material and soil depth have values from 1 to 9, where 1–3 is deep, 4–6 is deep to shallow, and 7–9 is shallow to rocky soil [
60]. The soil classification is presented within the figure that follows (
Figure 6).
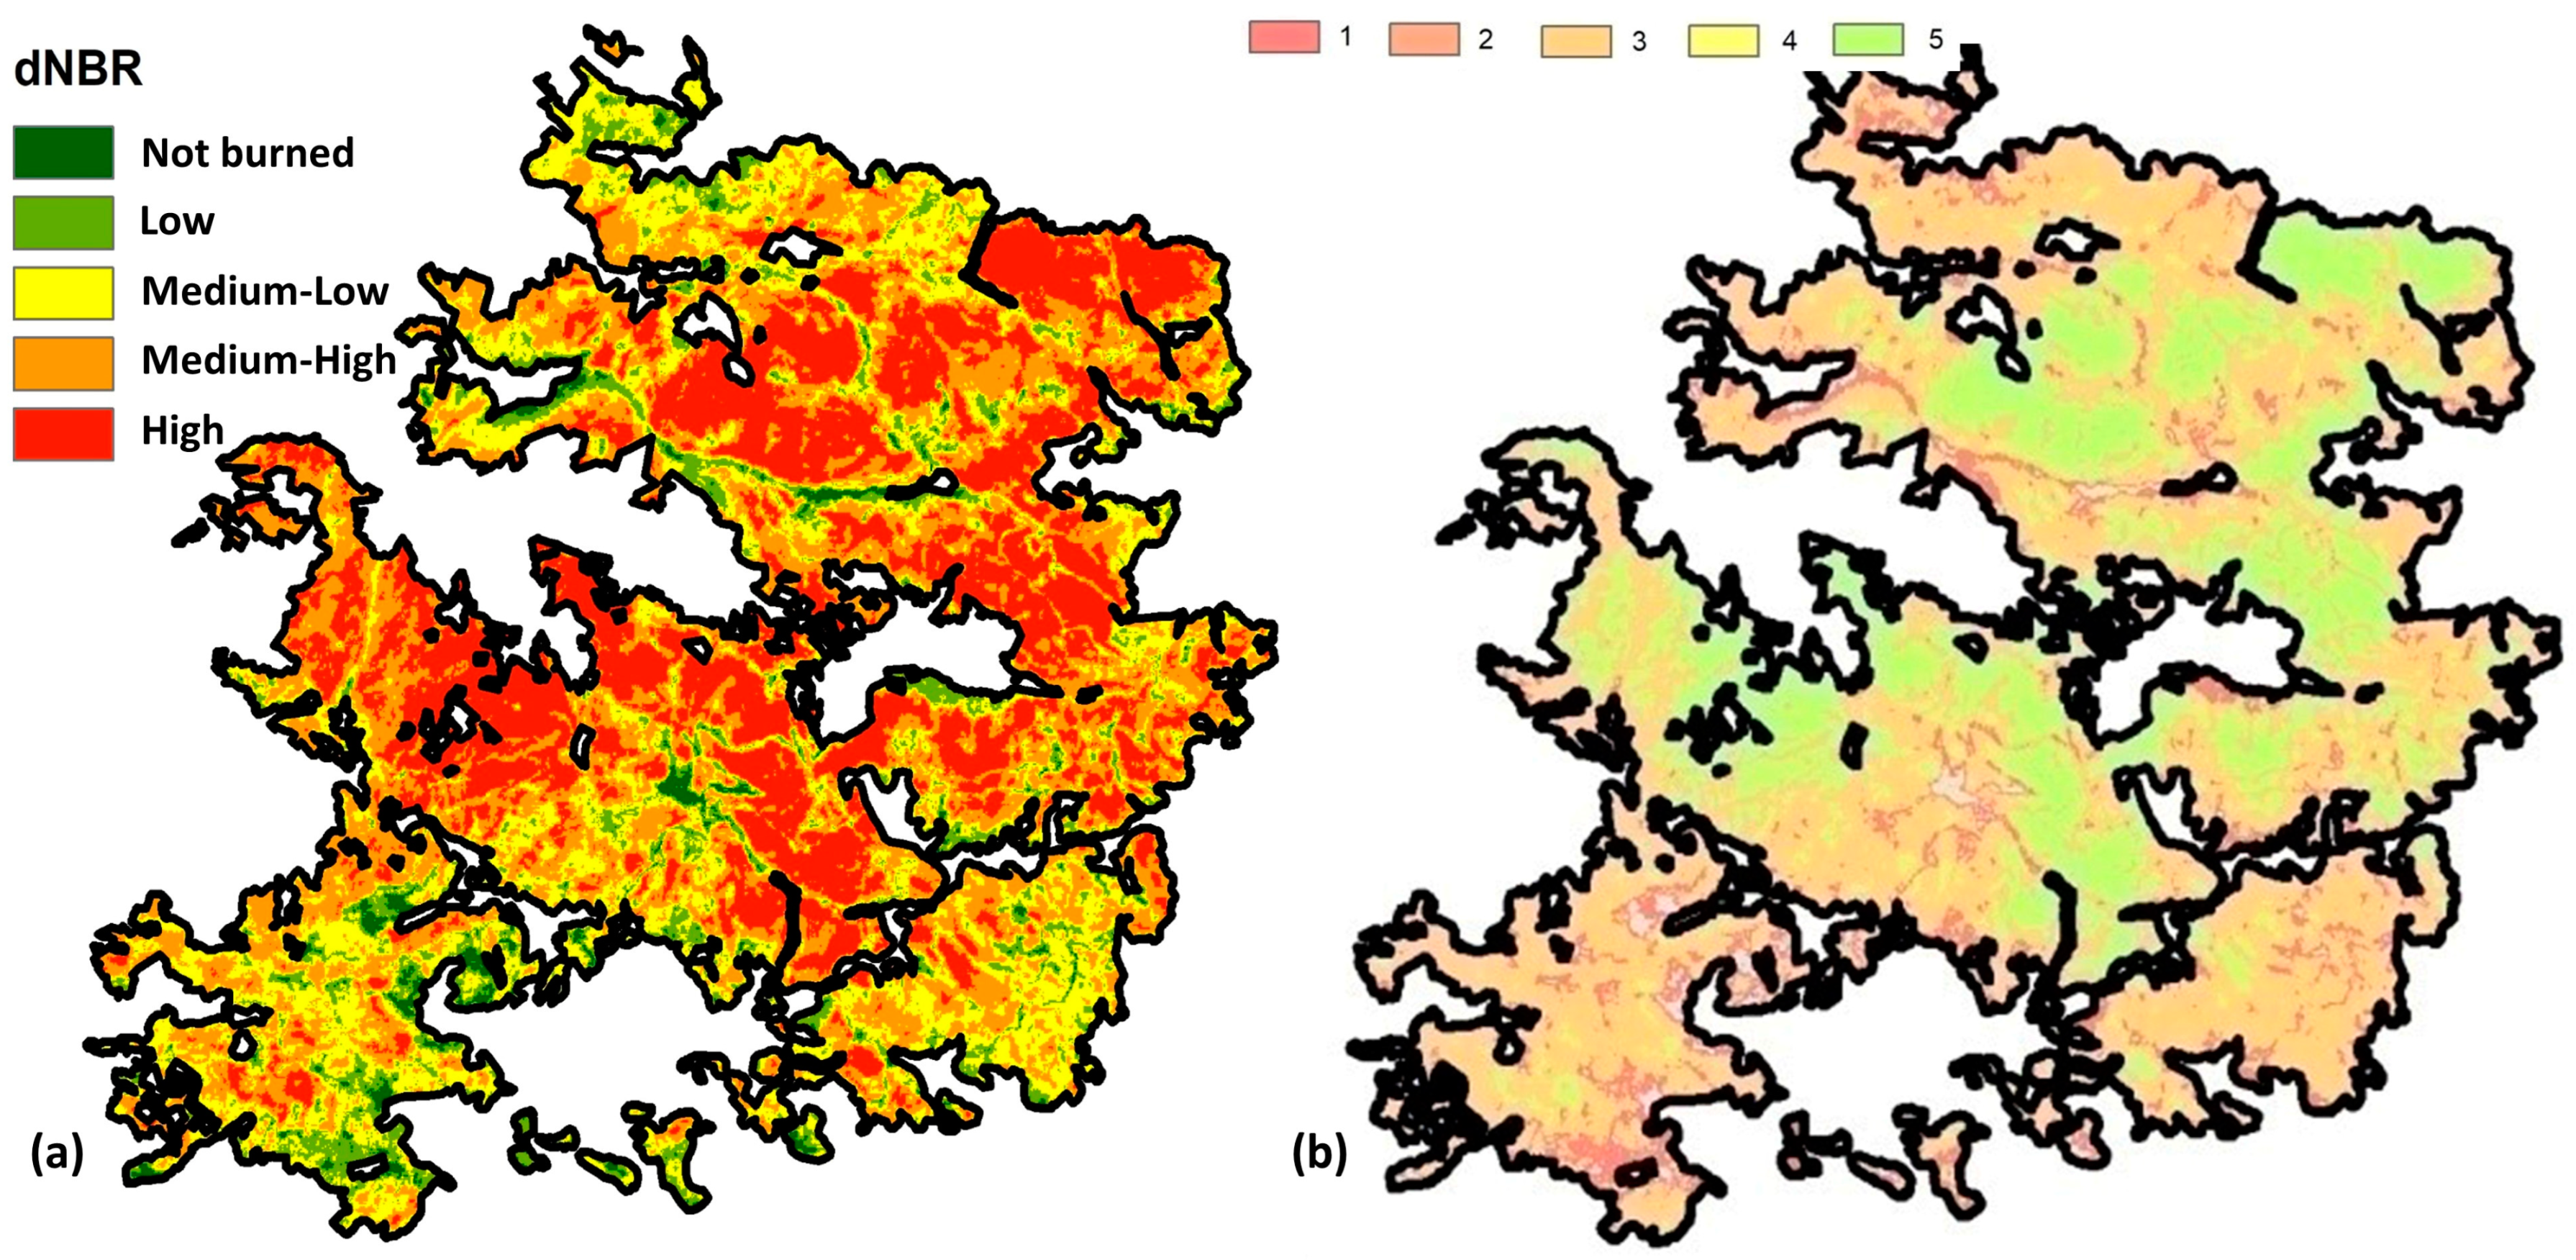
3.1.3. dNBR
The applications of dNBR formula (2) produce, as a result, a new image with a spatial resolution of 10 m that includes the NBRprefire, NBRpostfire and dNBR channels. The final dNBR map and its reclassification are presented in the following figure (
Figure 7).
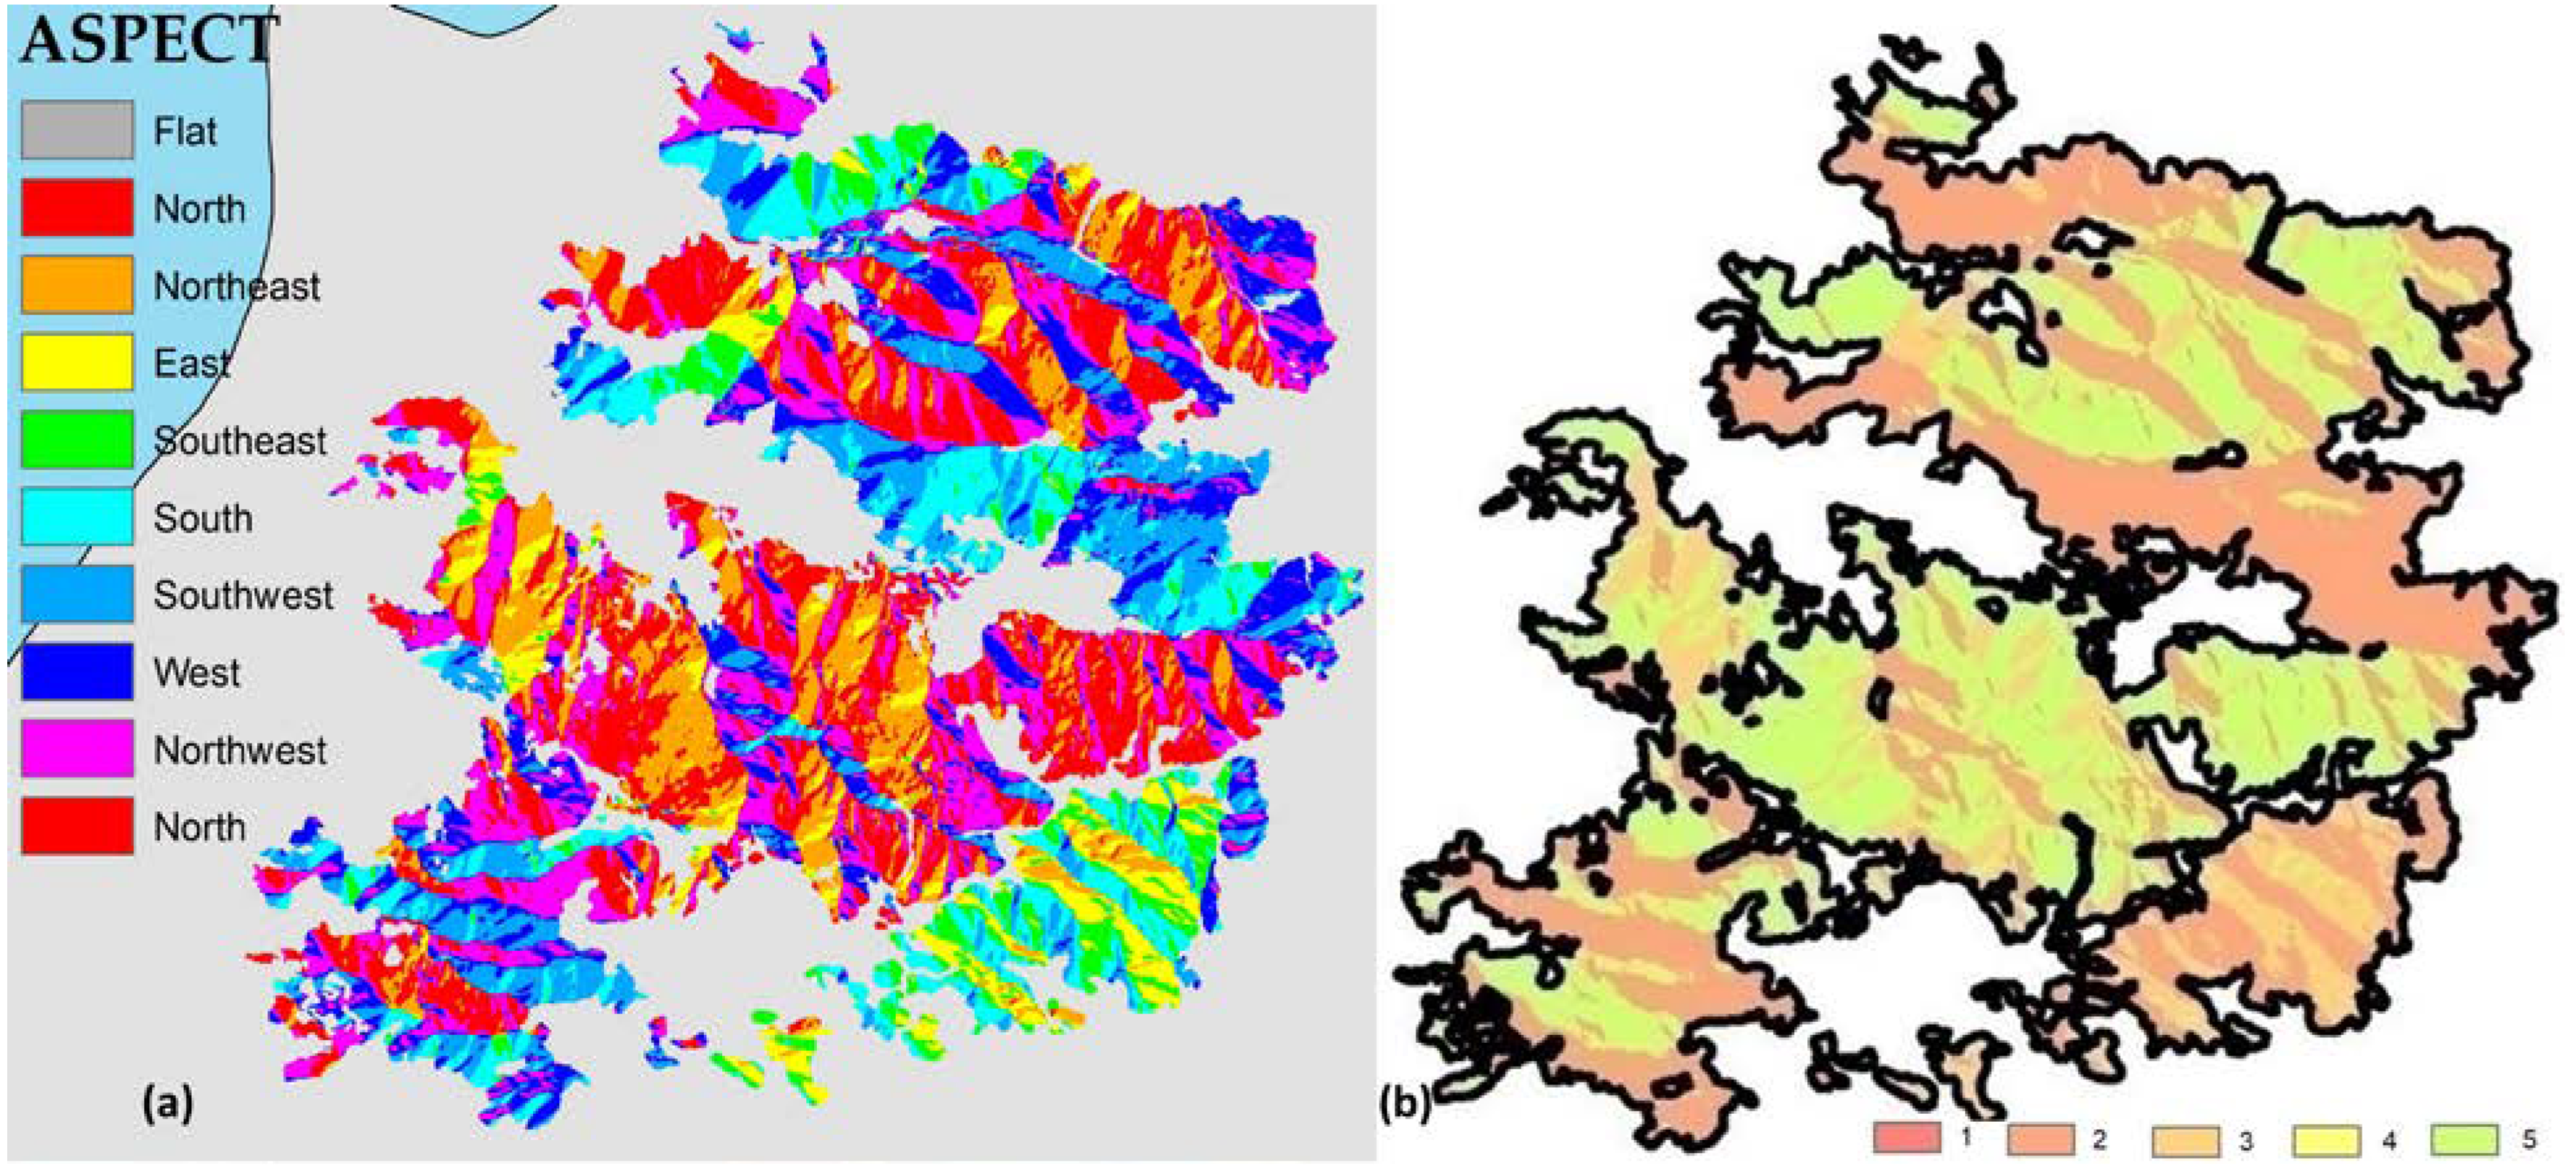
3.1.4. Aspect
The creation of the aspect layer was based on the DEM of the study area. The next figure presents the calculation of the aspect (
Figure 8a) for the study area and its reclassification (
Figure 8b).
Aspect data are valuable for selecting appropriate planting sites during ecological restoration. These data allow practitioners to match plant species with the prevailing microclimate conditions, increasing the chances of successful revegetation.
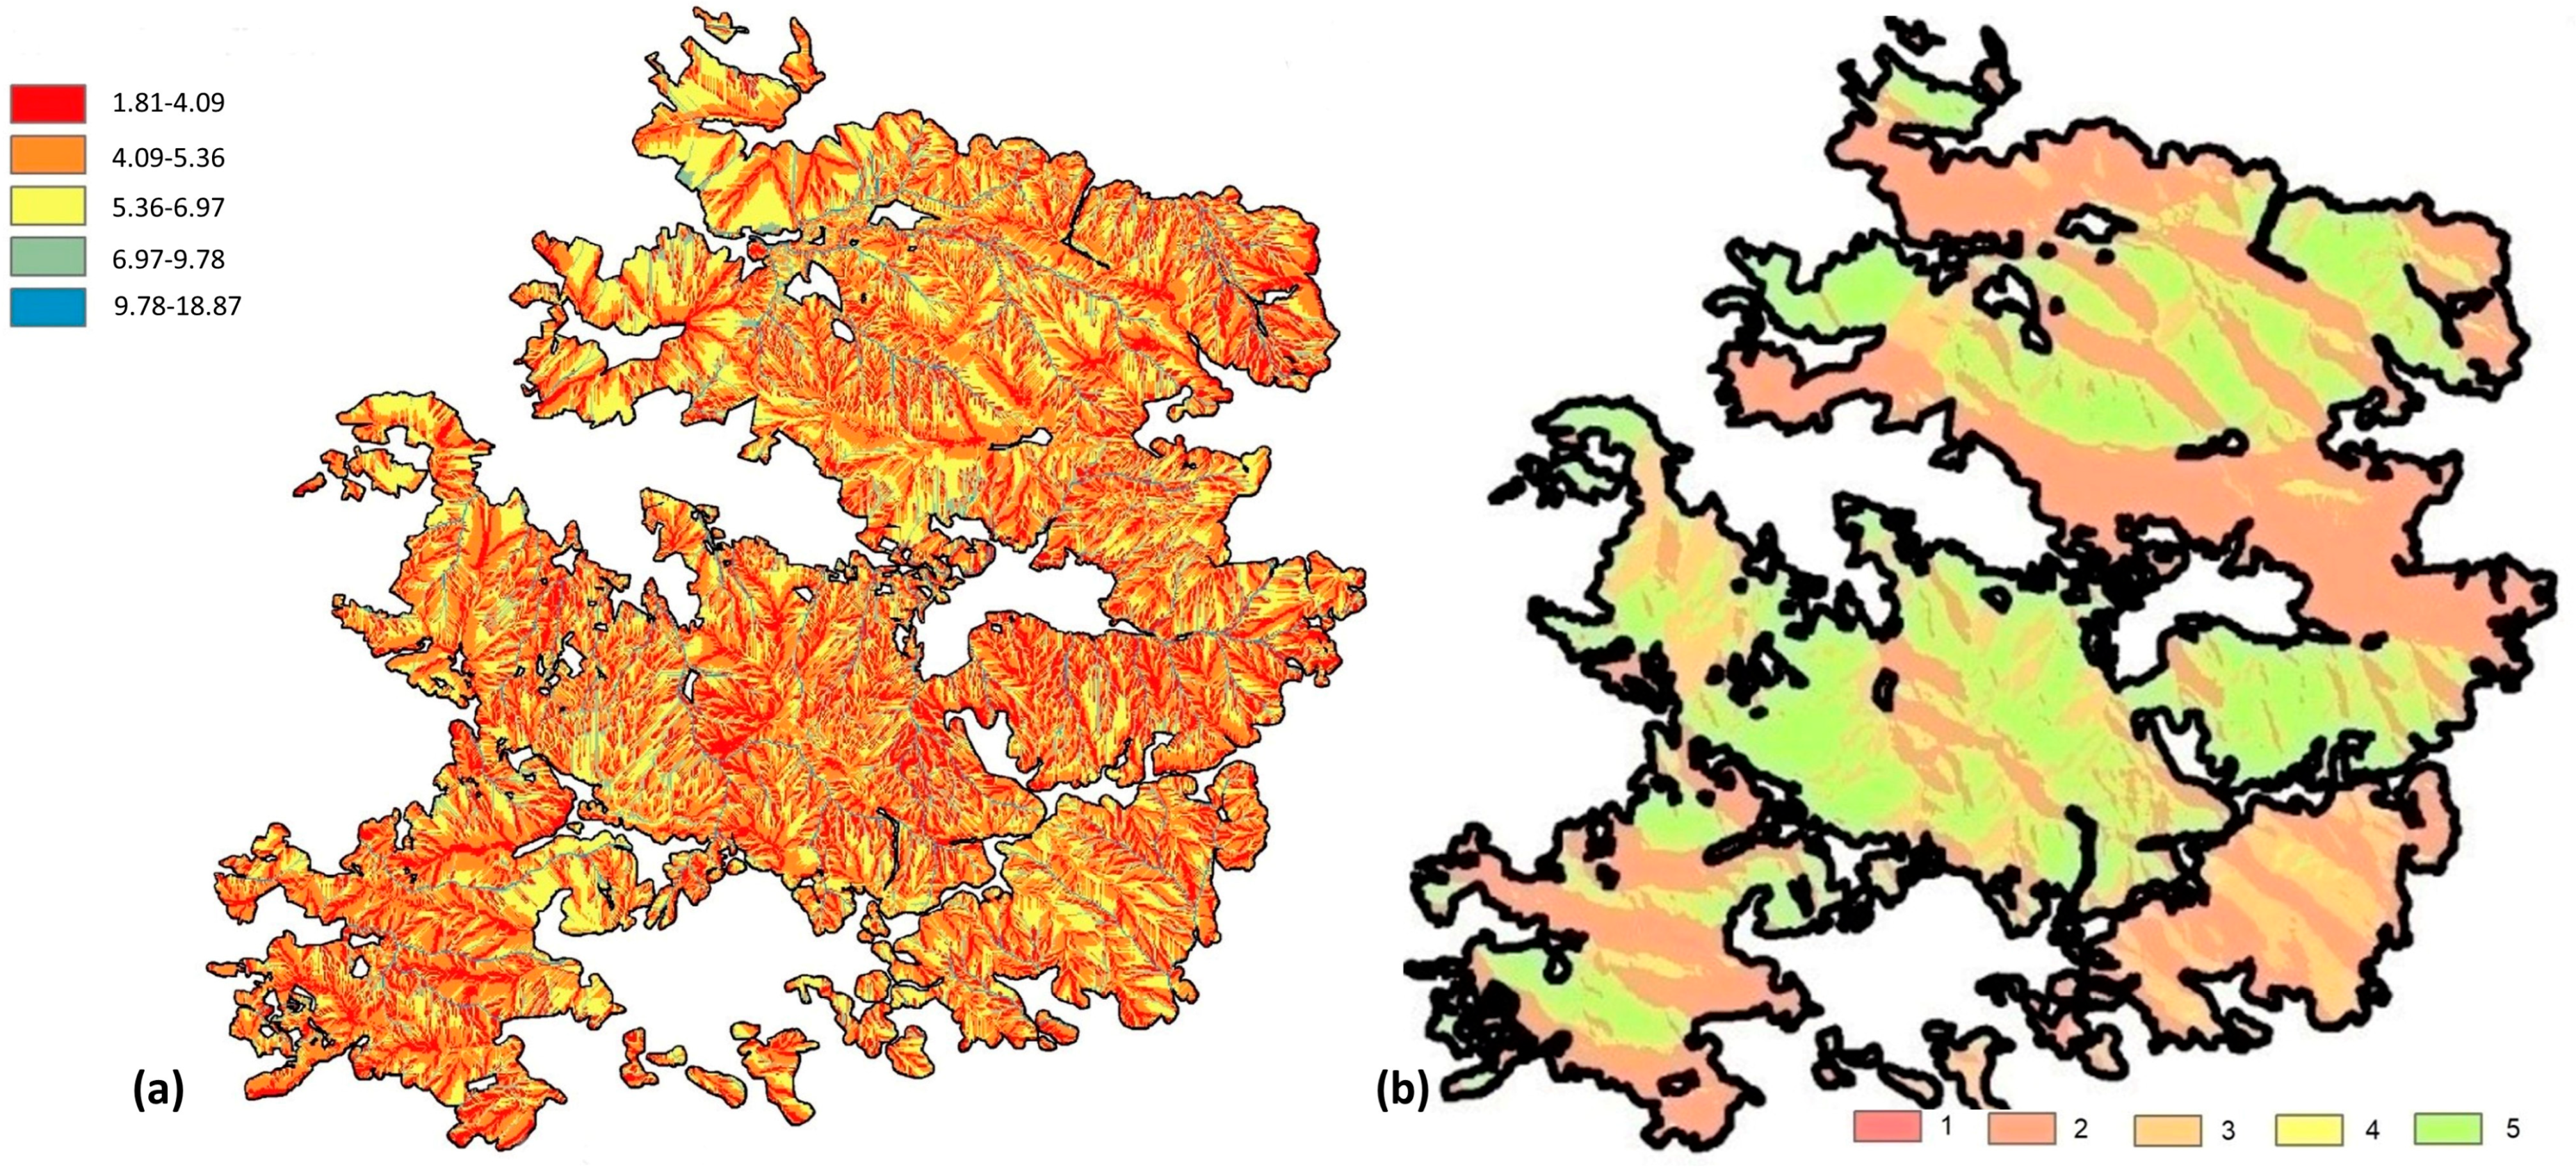
3.1.5. Compound Topographic Index (CTI)
The following figure presents the CTI calculation (
Figure 9a) for the study area and its reclassification (
Figure 9b). The parameter of runoff accumulation, As, which is used in the numerator of the CTI index, was related to the size of the analysis applied. The index values ranged from 1.81 to 18.87, with a mean of 5.09 and a standard deviation of 1.585. Higher values identify, to a greater extent, the drainage network, while lower values are associated with steep slopes, peaks and low water concentration.
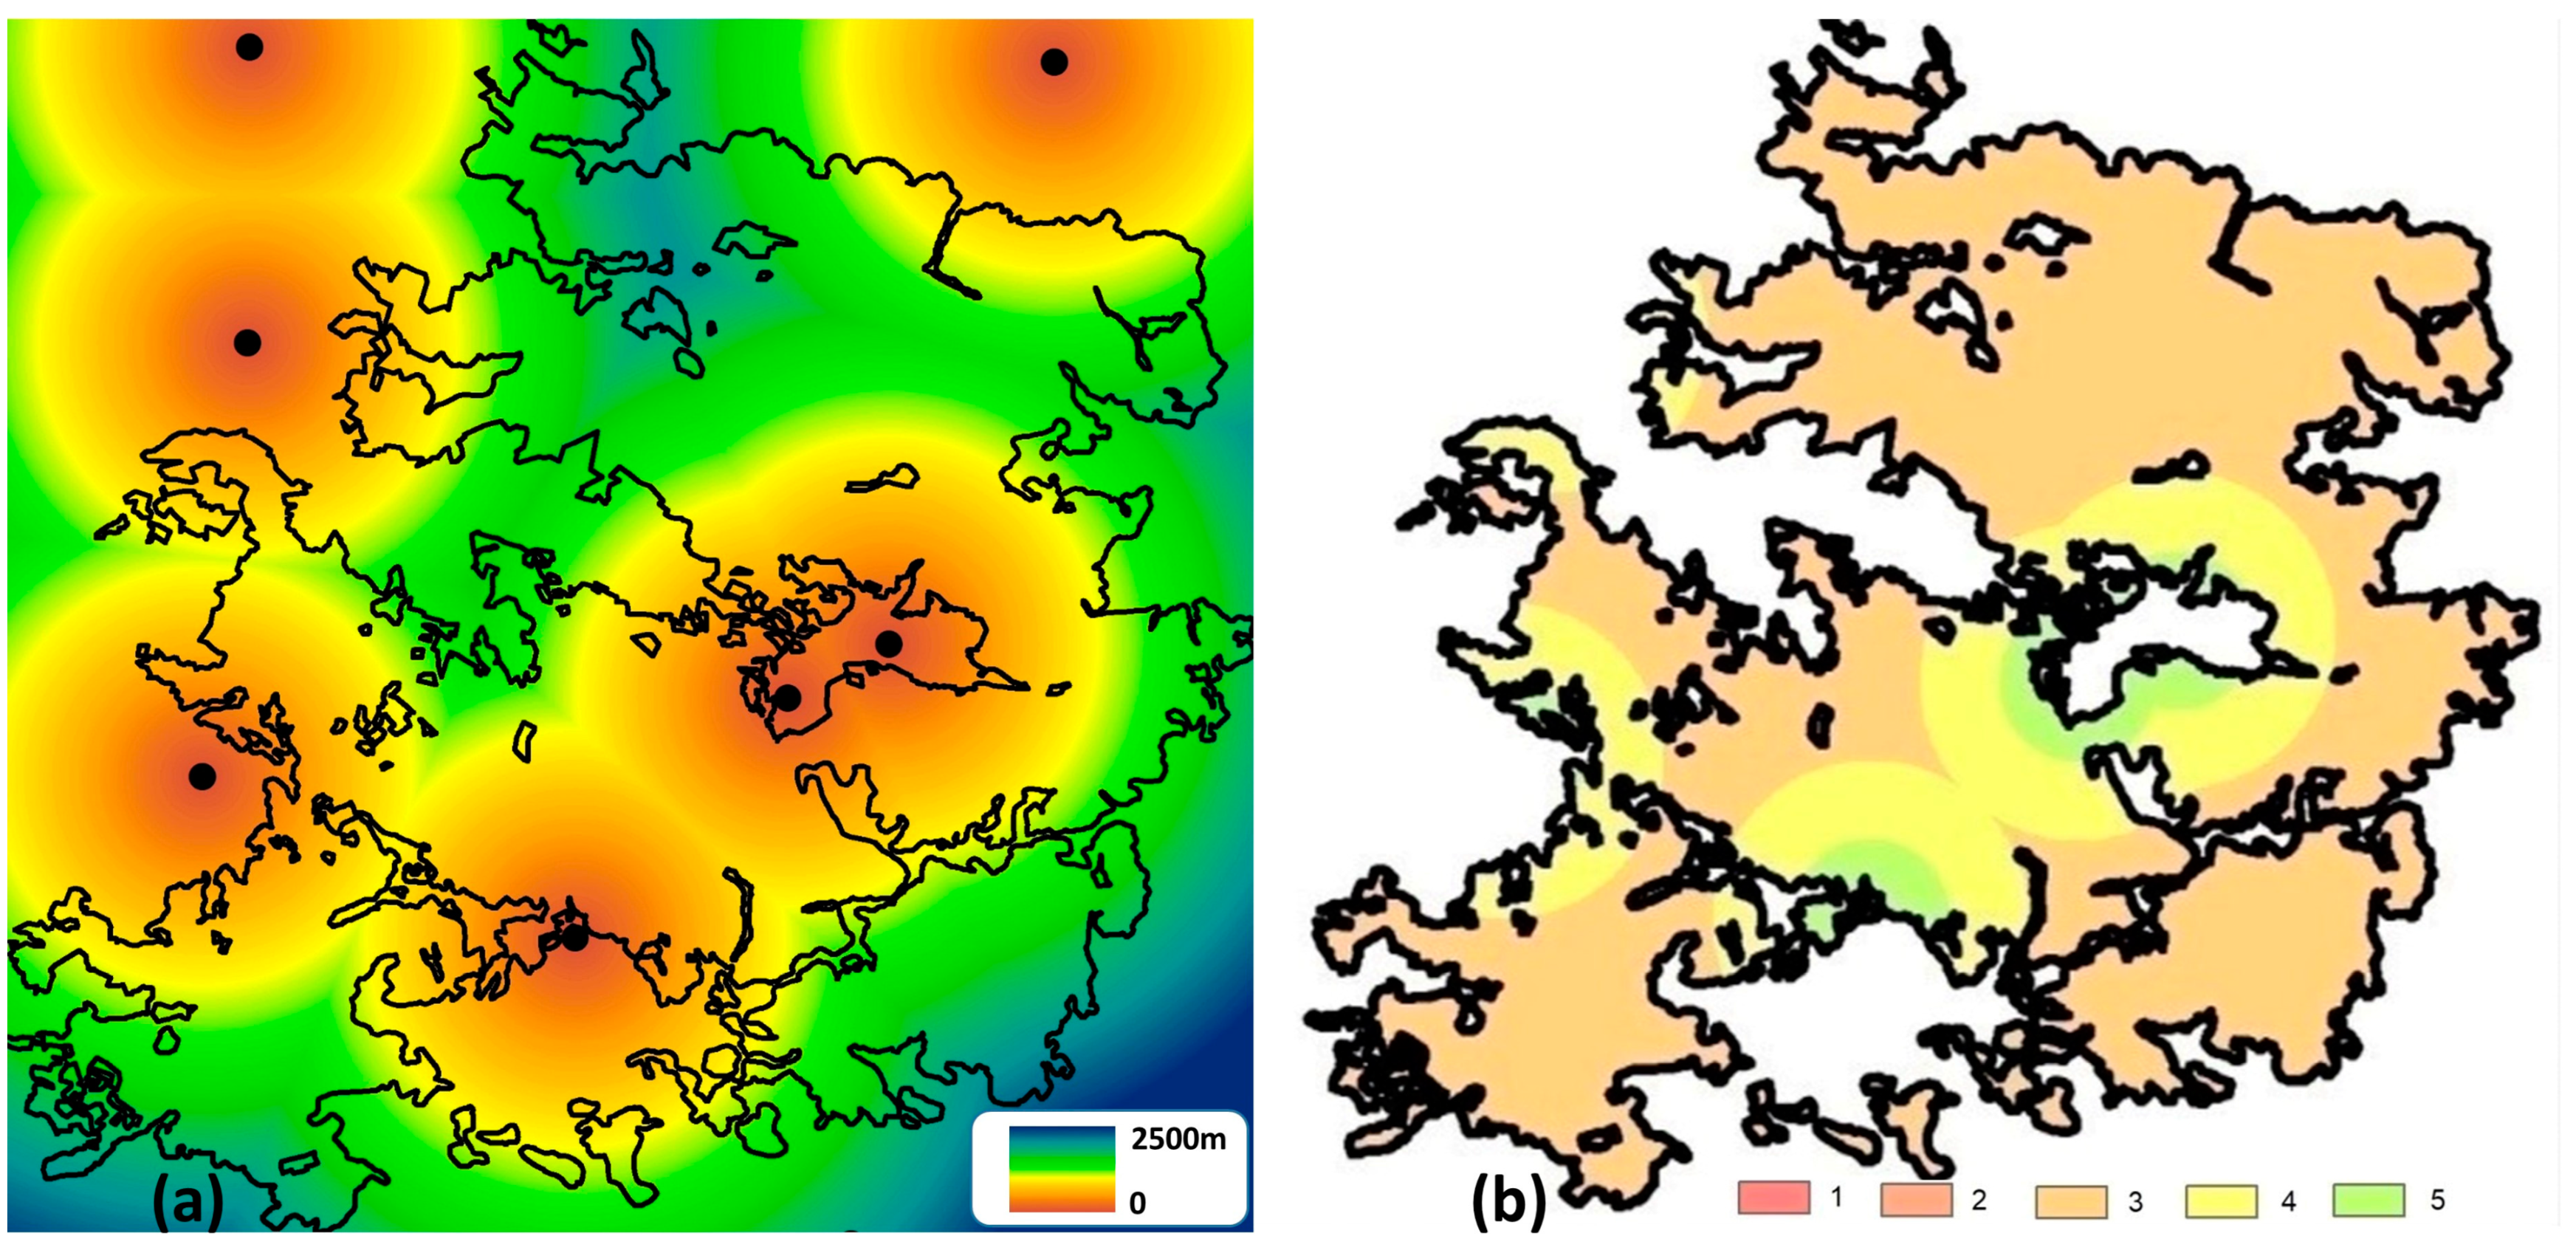
3.1.6. Distance from Settlements
This criterion is related to both economic and aesthetic and protective purposes. Both the establishment and restoration of vegetation around settlement boundaries enhance the landscape and provide relief to the local community. However, they also performs other roles, such as protecting soil from erosion and potential landslides and improving local climatic conditions [
61,
62]. For the calculation of the distance from the nearest settlement, a maximum distance of 4 km was set as a parameter so that there is overlap between the points and to cover the entire study area. The figure that follows shows the distance from the settlement map (
Figure 10a) and its reclassification (
Figure 10b).
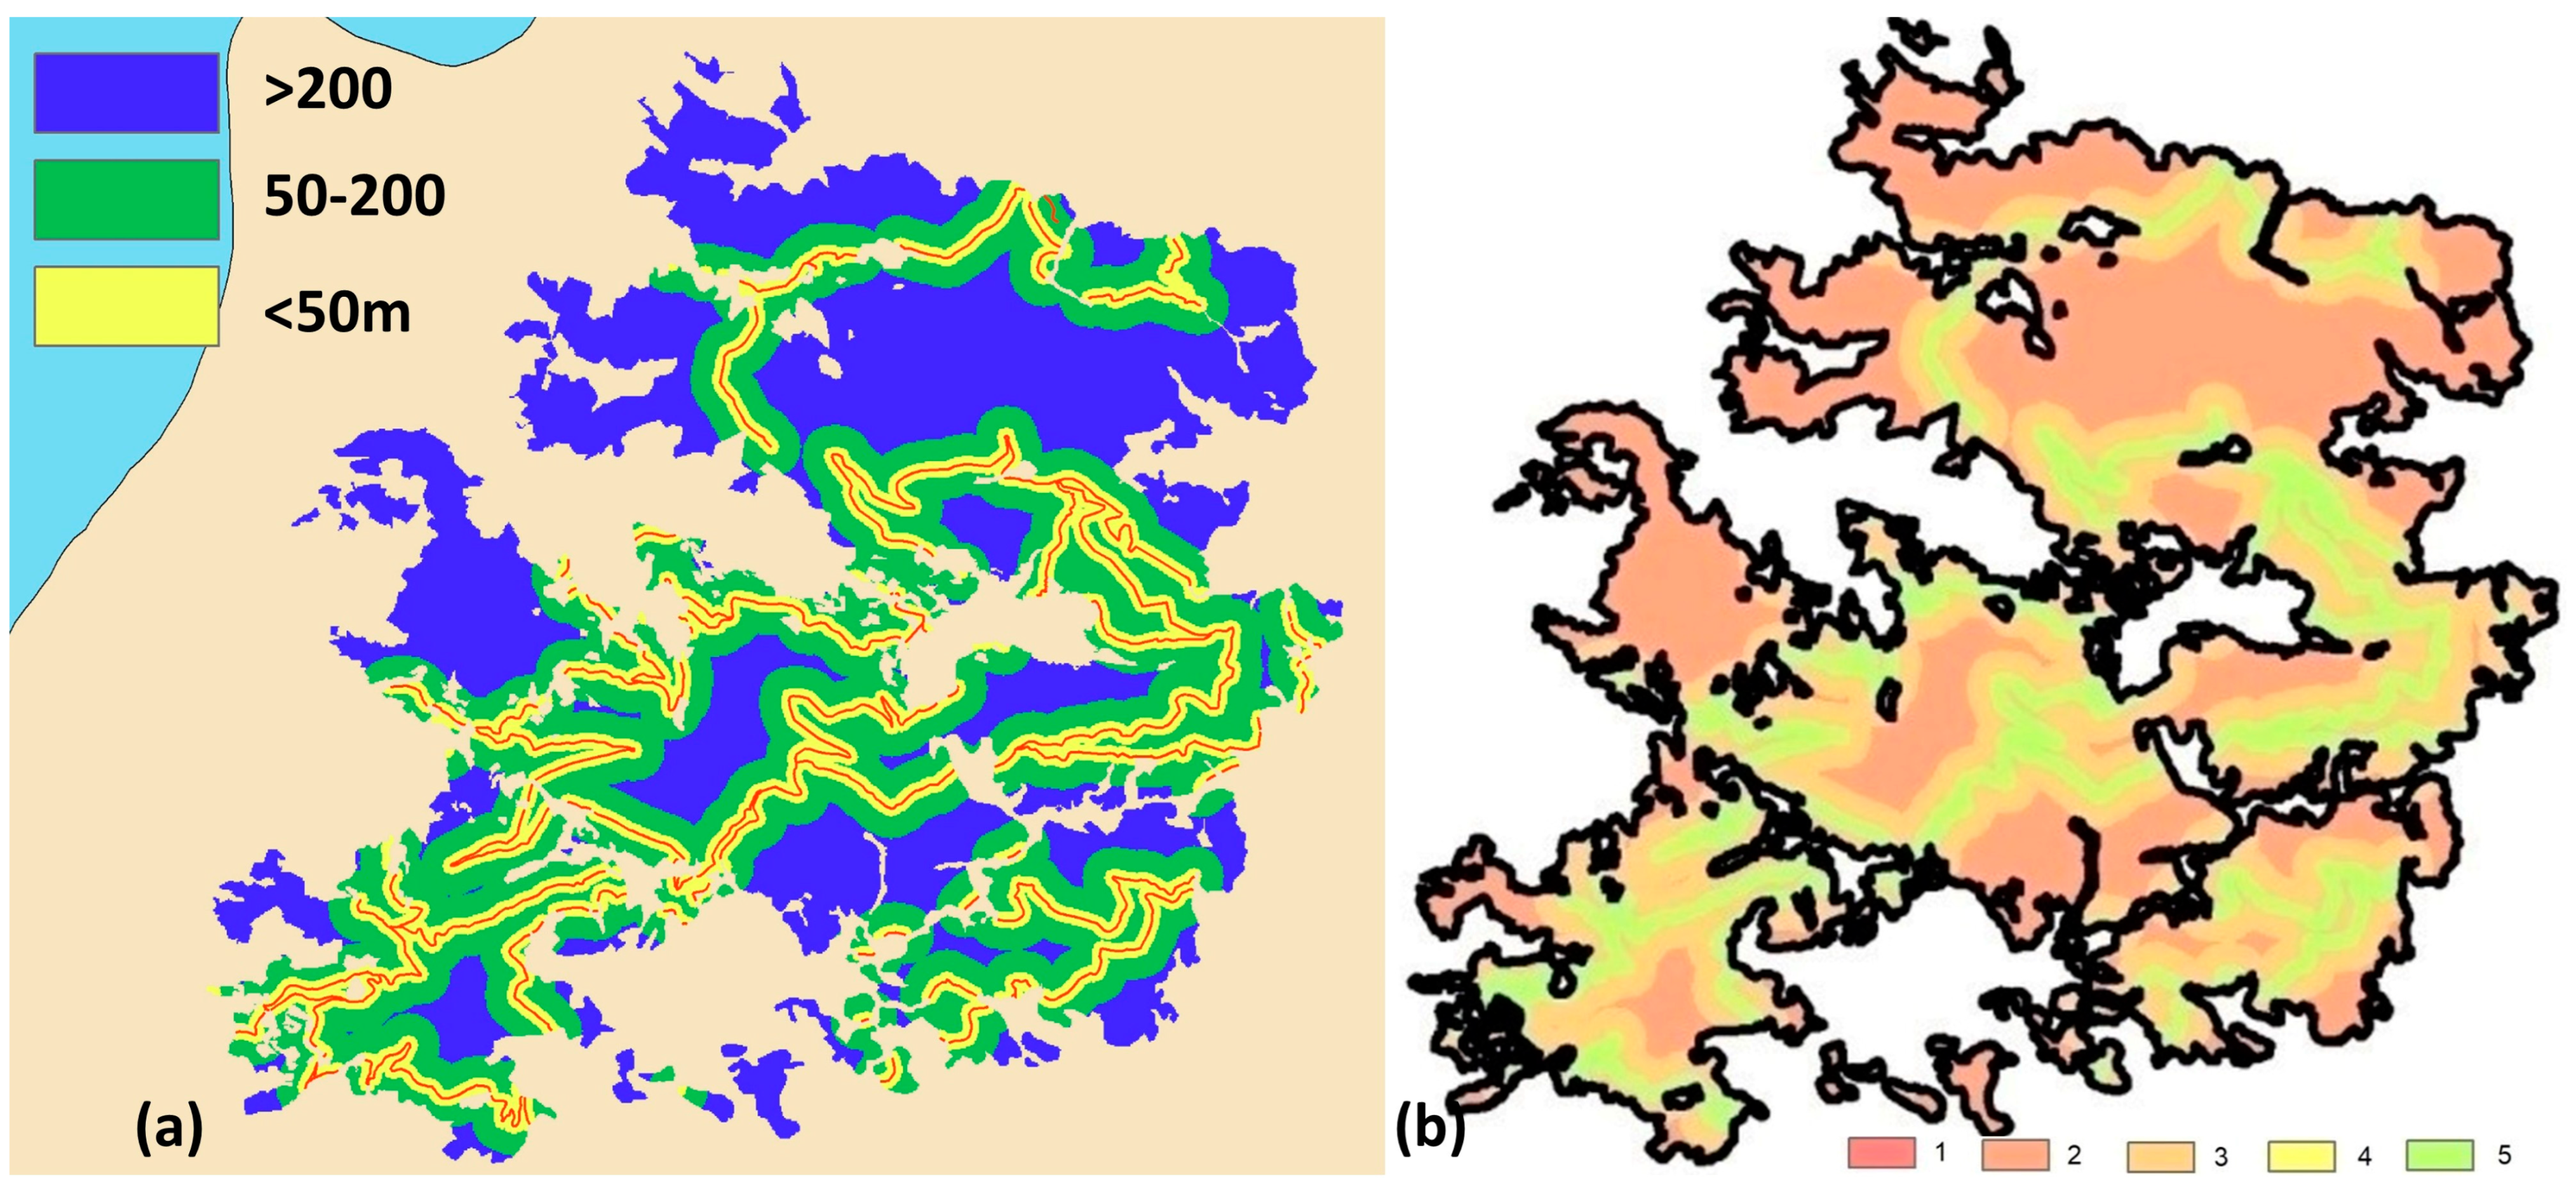
3.1.7. Distance from the Road Network
The areas that are close to the road network, at a short distance from the deck, are more favorable locations for reforestation activities, as they significantly reduce the cost of the individual works. The transport of materials, staff labor and the necessary equipment increases as we move further away from the existing road network. An example is the watering of young seedlings, where the necessary hoses and infrastructure increase dramatically as we move away from a road [
1]. For the variable of distance from the road network, three suitability zones of 50, 200 and more than 200 m applied. This classification of the distance from the Road Network (
Figure 11a), together with its reclassification (
Figure 11b), is shown in the next figure. The red lines in
Figure 11a represent the initial Road Network.
3.2. Criteria Synthesis Results
After reclassifying criteria, the analytical process included homogenizing variables to a 1–5 scale. This standardized approach eliminated disparities, enabling equitable comparisons and facilitating clear communication of results and recommendations to stakeholders. The next table (
Table 3) presents this homogenization of the variables.
The variables under consideration encompass a diverse range of both quantitative and qualitative attributes, each possessing distinct characteristics that cannot be readily aggregated due to their inherent disparities (such as the juxtaposition of quantitative measures like distance in meters and qualitative assessments related to vegetation by species). To address this challenge and enable a more cohesive and meaningful analysis, a crucial methodology was employed: the reclassification of each variable onto an ordinal scale spanning from 1 to 5. Within this scale, a value of 1 signifies a condition of very low suitability for reforestation, whereas a value of 5 denotes a state of very high suitability for reforestation. This systematic reclassification process not only harmonized the diverse variables into a common framework but also allowed for a nuanced and standardized assessment of their individual contributions to the overall analysis. By ascribing these values, we not only achieved a clear and consistent means of evaluating each variable’s suitability for reforestation independently but also paved the way for more robust and integrated decision-making processes in the context of environmental restoration and land management initiatives.
This ordinal reclassification approach has proven instrumental in distilling the complex array of attributes associated with each variable into a simplified yet informative format. It acknowledges that variables encompass multifaceted dimensions, and by assigning them values on a 1 to 5 scale, we can capture their inherent nuances and relative importance. This structured methodology not only streamlines the assessment process but also lends itself to more effective comparisons and prioritization of variables within the broader context of reforestation and ecological restoration efforts. Furthermore, it fosters a deeper understanding of the intricacies of each variable’s role in influencing suitability for reforestation, facilitating more informed and data-driven decision making. In essence, the ordinal reclassification of variables into this 1-to-5 scale serves as a pivotal step toward achieving a holistic and well-informed approach to land management and environmental restoration, ensuring that the unique characteristics of each variable are appropriately considered and integrated into the overarching analysis.
3.3. Weighted Overlay of the Classified Variables
The final step in this study involved combining homogenized variables, using specific weighting factors. Two scenarios were implemented: Scenario 1 prioritizes ecological constraints, focusing on optimal vegetation growth conditions, while Scenario 2 emphasizes economic and social benefits, favoring criteria like the distance from settlements and roads. Weighting coefficients were determined through the Analytical Hierarchy Process [
59], where pairwise comparisons on a scale of 1 to 9 informed the significance of each criterion. This approach ensures a balanced assessment, considering both ecological and socioeconomic factors for identifying optimal ecological restoration sites.
The scoring of the criteria was repeated three times for each scenario, each time applying small differences between the variables. The weighting coefficients were then calculated, and the final model results were obtained for each scenario. The test showed that the small changes applied to the values of the variables did not bring about significant changes in the results of the scenarios. The two tables that follow (
Table 4 and
Table 5) are presenting the comparison matrices for the above two scenarios.
The final scoring values and the hierarchy between the variables in the two tables above were considered reasonable, since the CR consistency ratio was less than 0.10 for both scenarios [
63]. Specifically, in Scenario 1, the consistency ratio was CR = 0.06, and in Scenario 2, it was CR = 0.03. Based on the averages of the comparison tables, the weighting coefficients of each variable were obtained, as presented in the following table (
Table 6). The sum of the weighting coefficients for each scenario is summed to unity, so that the results are on the same classification scale and allow for a comparison between them.
The weights derived from the Analytic Hierarchy Process (AHP), pioneered by Saaty, constitute a pivotal component of informed decision-making processes across diverse domains. AHP offers a systematic and structured methodology for evaluating and prioritizing alternatives or criteria within a hierarchical framework. These weights are of paramount importance as they provide a quantitative representation of the relative significance or influence of different elements within the decision-making hierarchy. The AHP process commences with the construction of a hierarchical model, comprising a goal, criteria, sub-criteria and potential alternatives. Stakeholders or experts are then tasked with the crucial step of making pairwise comparisons between elements at each level of the hierarchy. These comparisons serve as the foundation for computing priority vectors, which assign numerical values to the relative importance of each element. The significance of these weights is multifaceted. The final weights are presented in the next table (
Table 6).
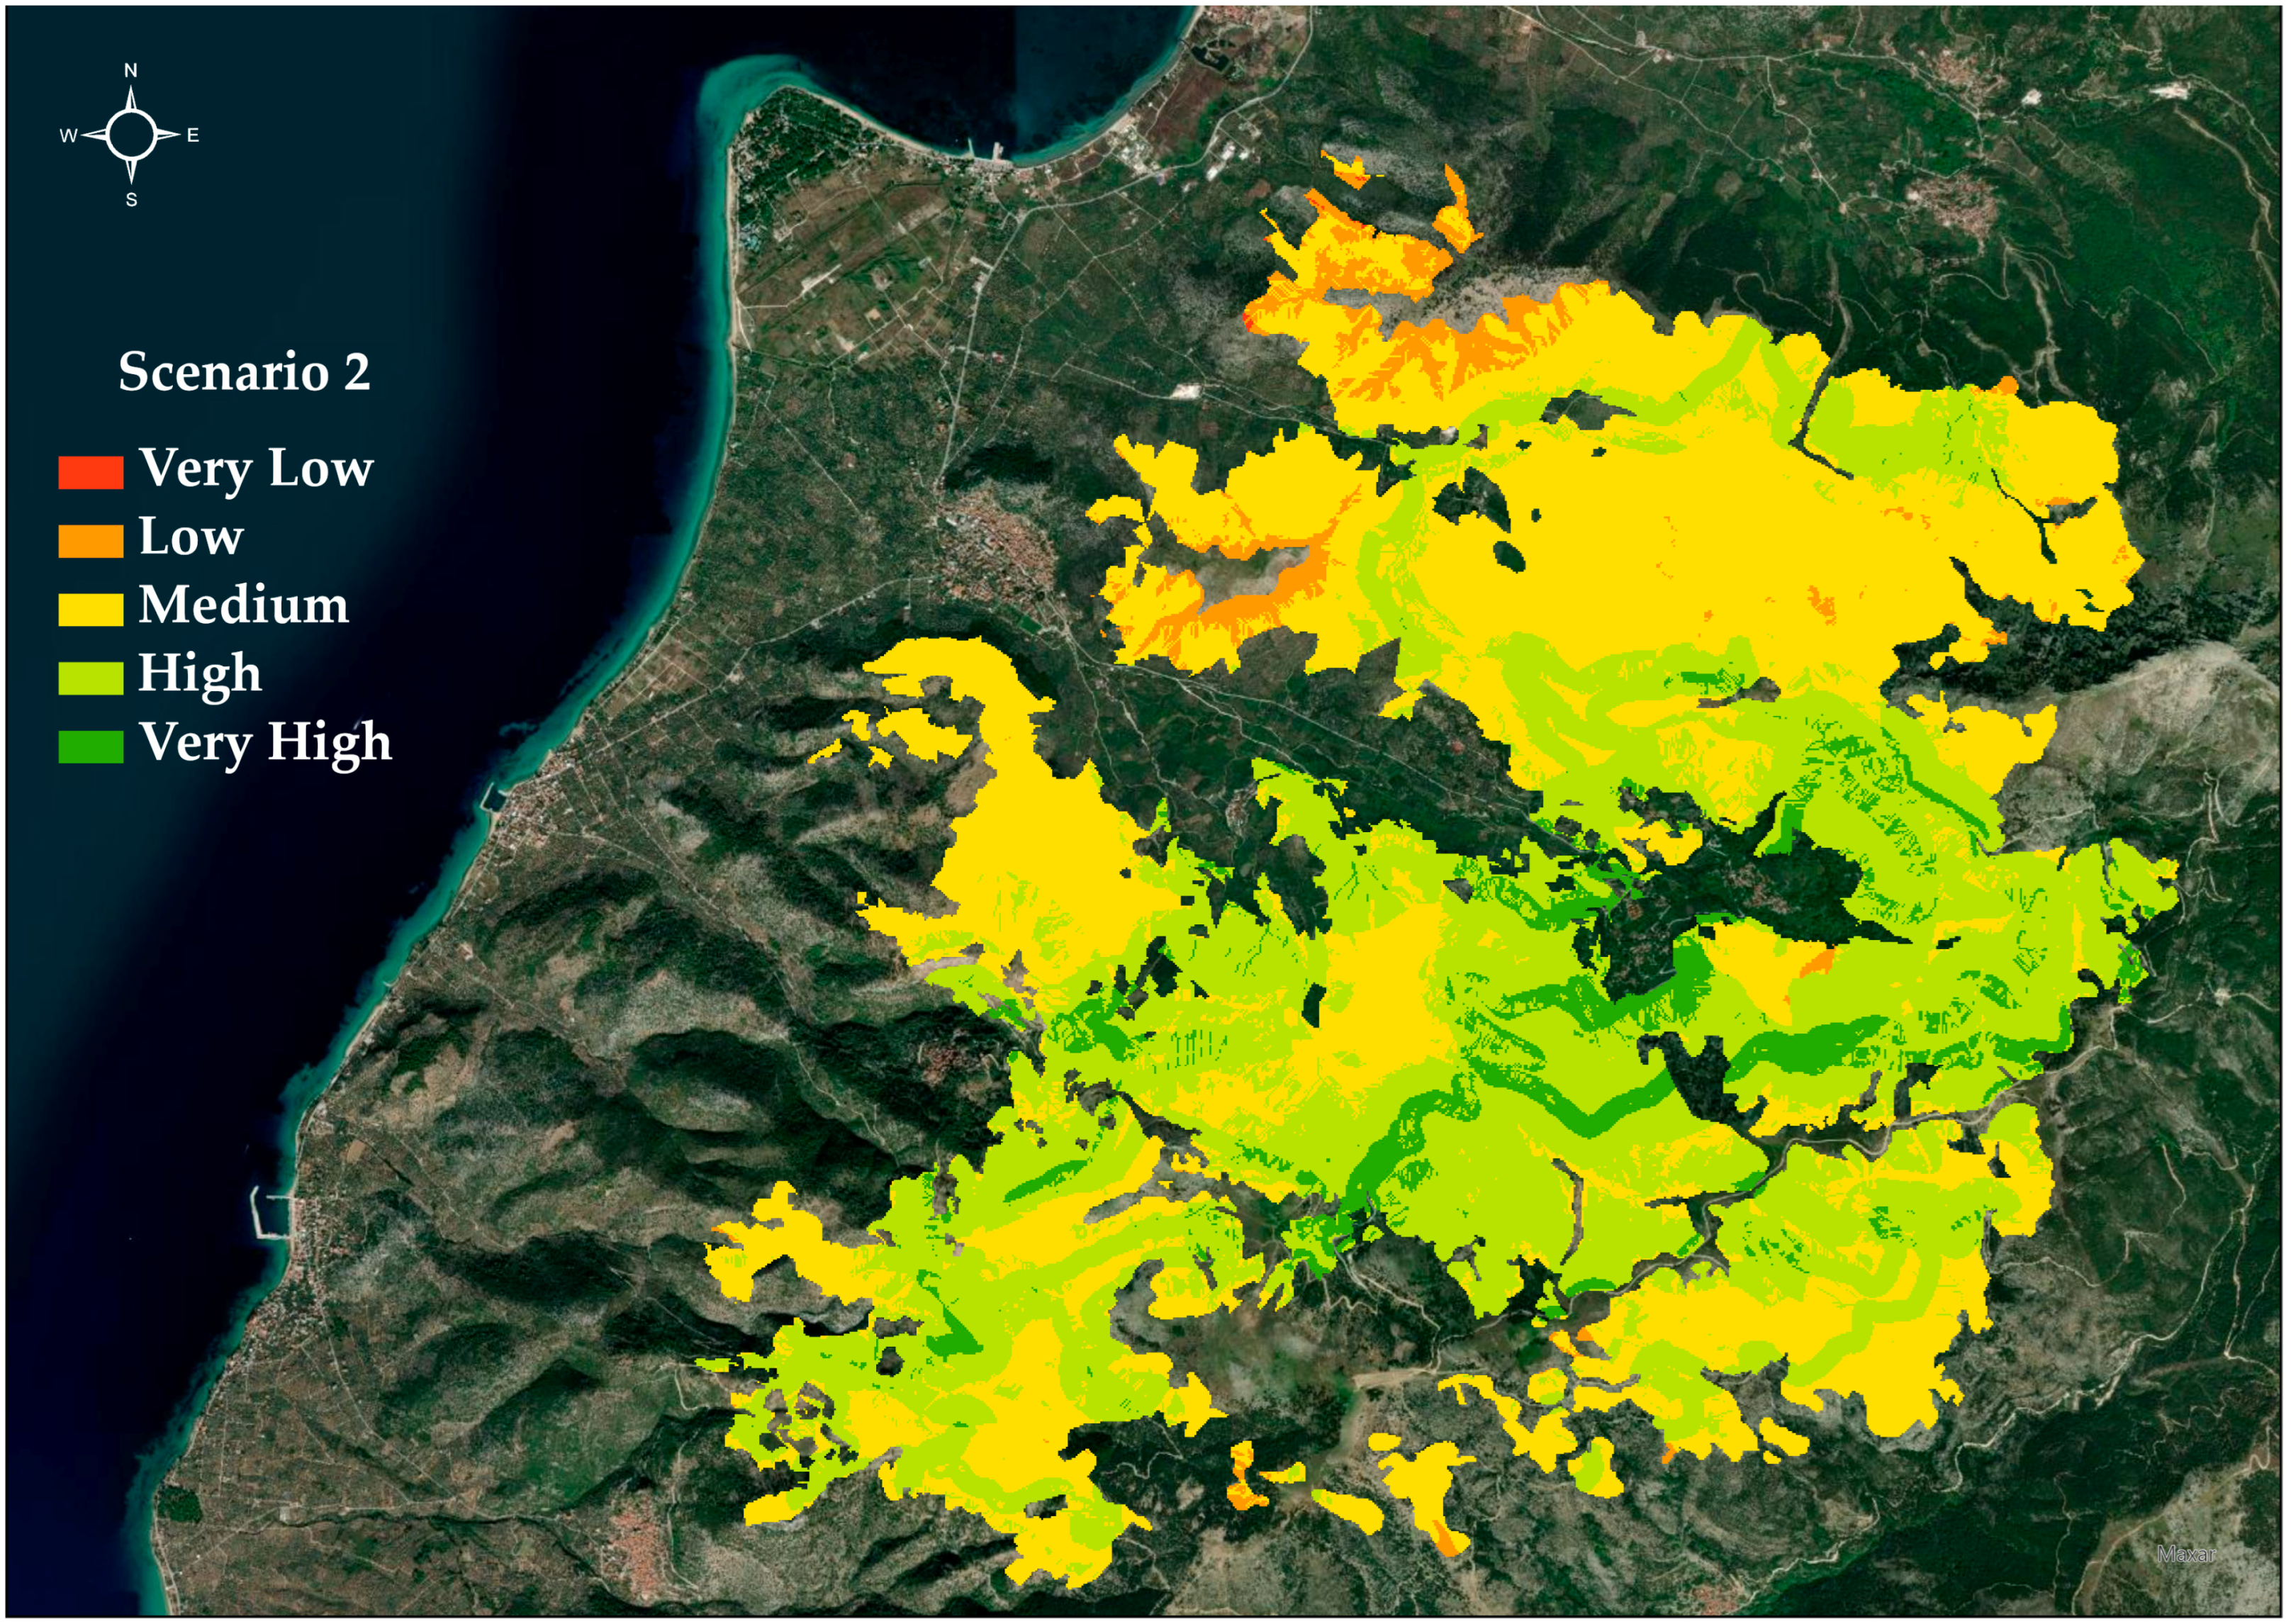
In Scenario 2, the variable weights reflect a deliberate emphasis on economic and social factors, particularly favoring criteria related to distance from the road network. The seemingly less smooth distribution of values in this scenario is a result of the intentional higher influence assigned to the distance from the Road Network criterion. This emphasis is in line with the scenario’s prioritization of economic and social benefits, where road accessibility is a key consideration. While this may result in variations in the weights compared to the smoother distribution in Scenario 1, it aligns with the model’s intended emphasis on specific criteria in different scenarios to capture diverse restoration considerations.
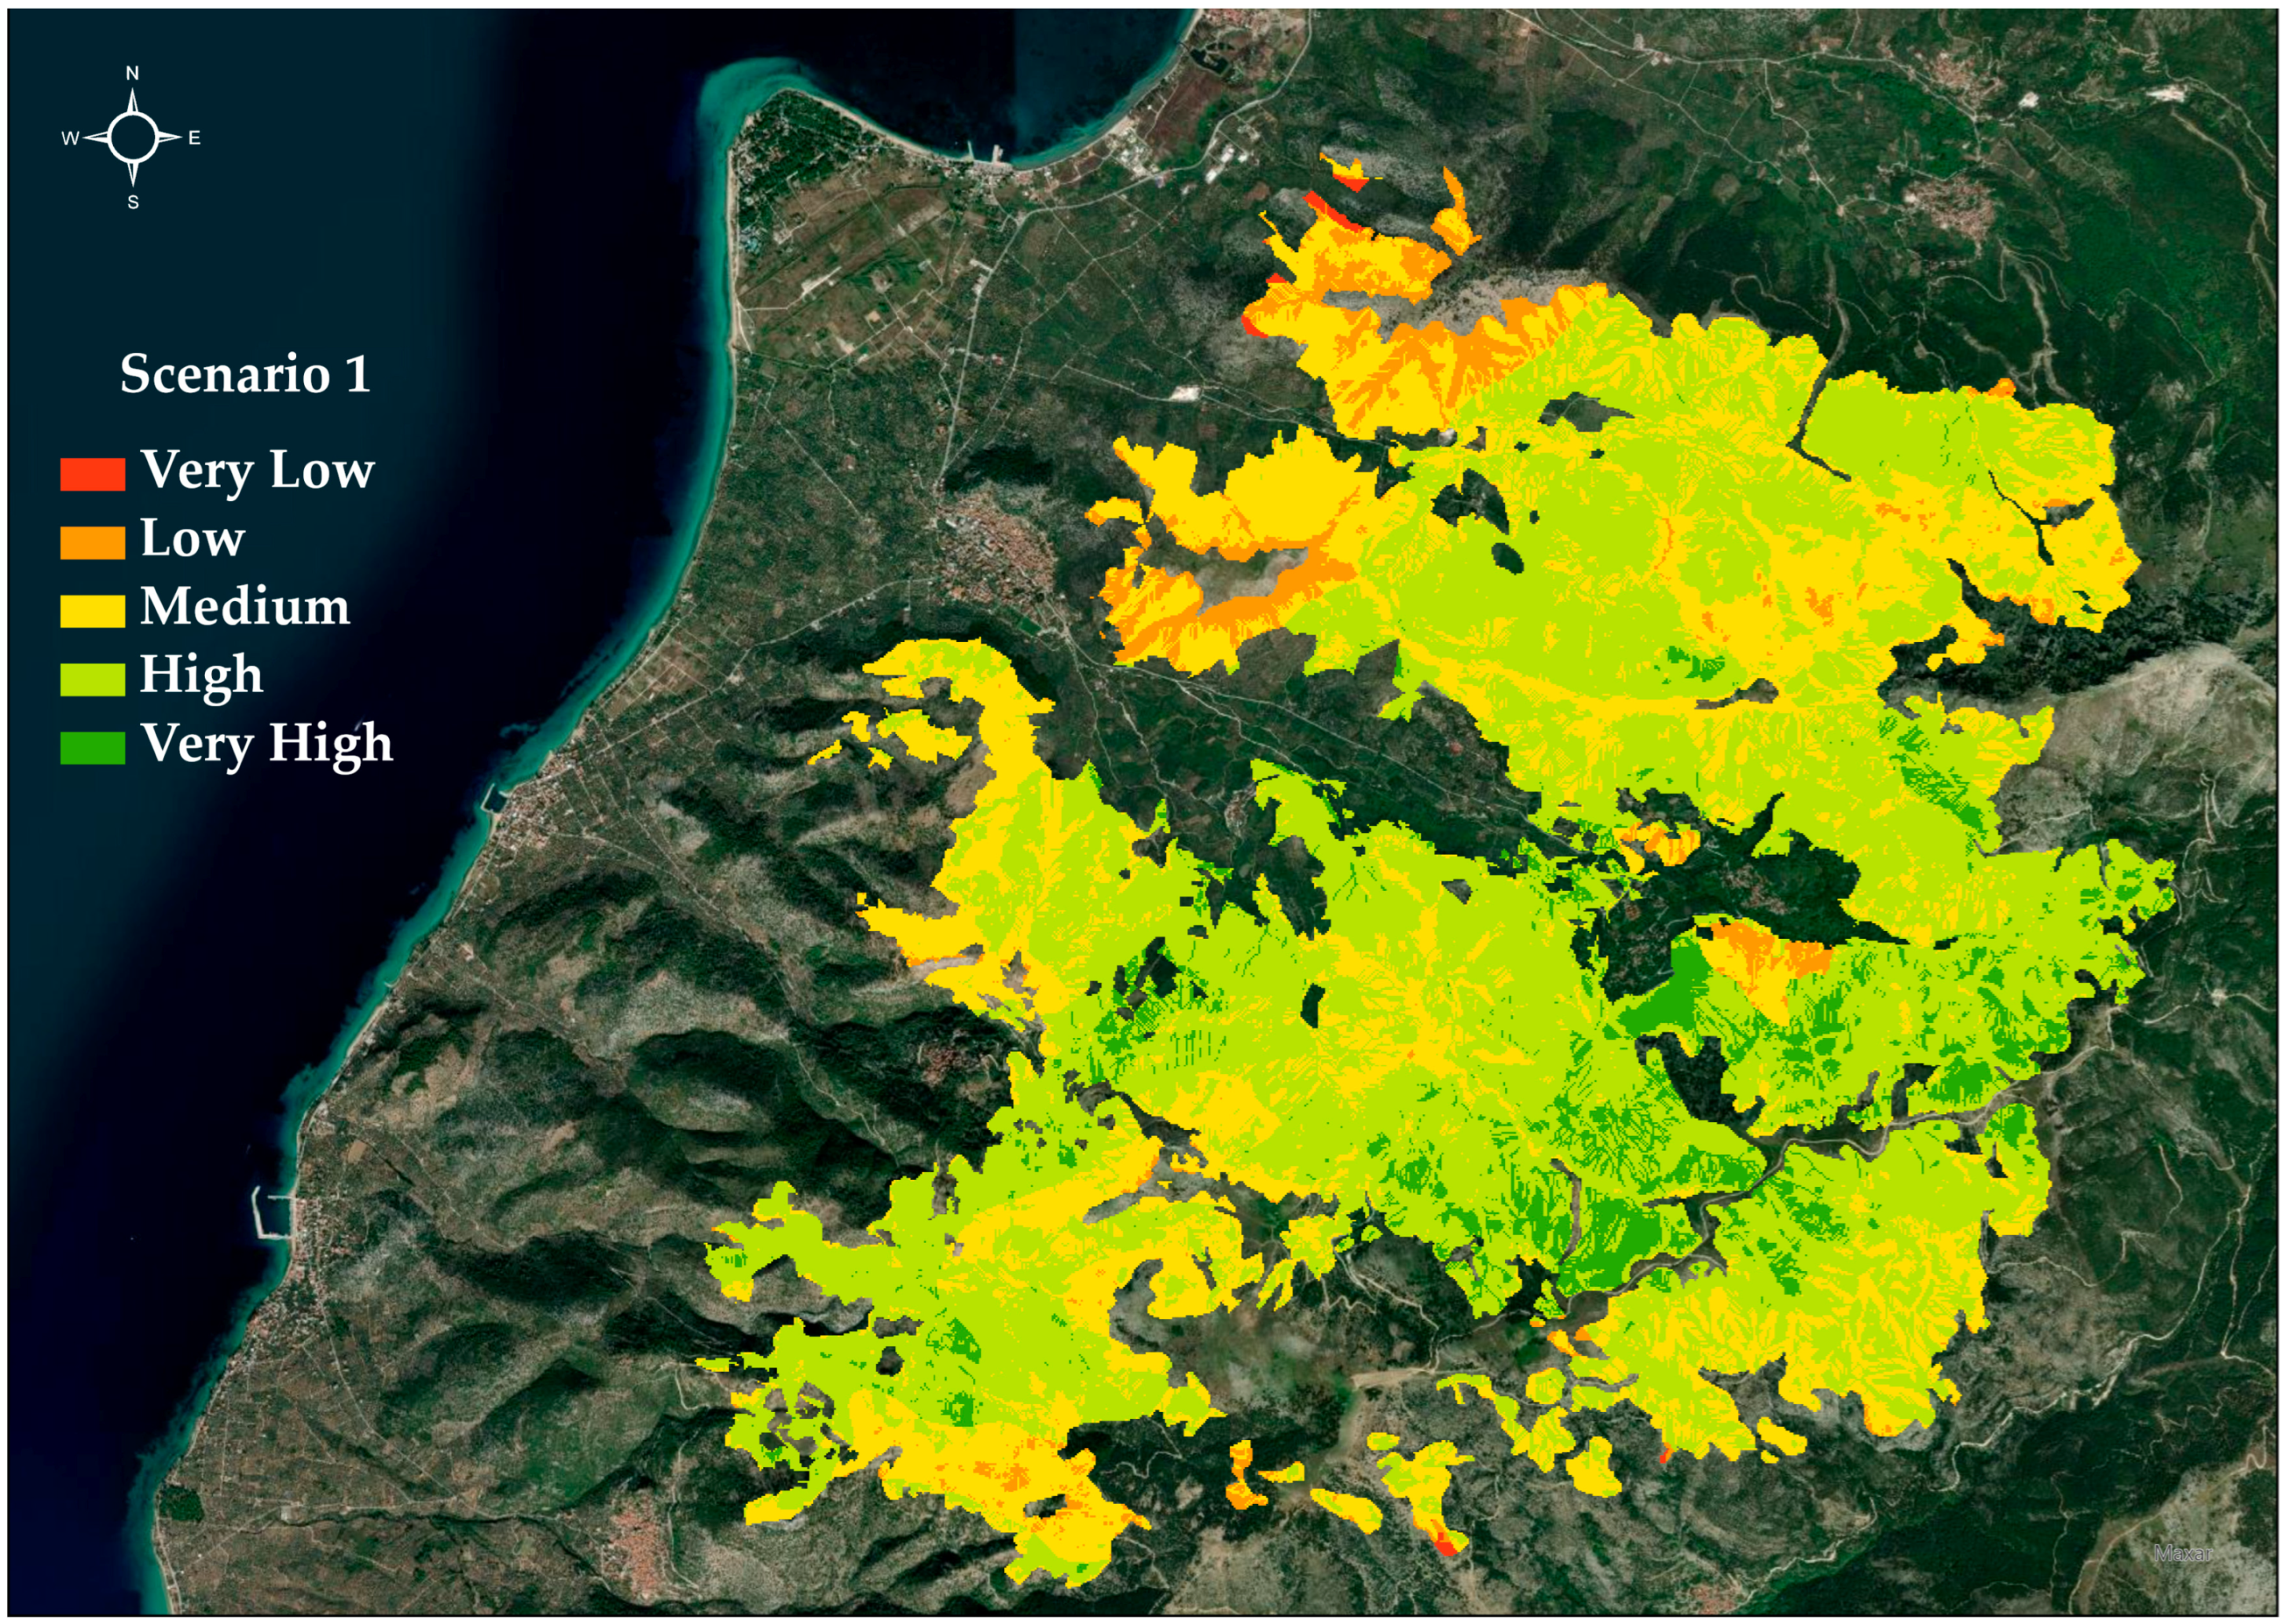
3.4. The Results for the Two Scenarios
As mentioned, Scenario 1 favors the ecological characteristics of the reforestation point, while Scenario 2 gives more weight to economic criteria. The final suitability zones of the results were classified and presented on the same regular classification scale used to categorize each of the model variables. As shown in the two maps (
Figure 12 and
Figure 13), areas with very high suitability for reforestation are depicted in dark green, and the sum of the weighted variables tends toward a value of 5. In these locations, according to the previous analysis of the criteria, the conditions for the establishment of new plants are considered to be particularly favorable. Furthermore, the severity of the fire and the type of vegetation at these sites indicate that these are areas where natural regeneration is unlikely to recover. In contrast, areas in red (
Figure 12 and
Figure 13) record areas where there is very little suitability for reforestation, where the corresponding sum of the individual weighted variables is close to unity. In these areas, the success of new plantings is considered ineffective, and it is considered that such sites should be avoided for reforestation activities.
A first approximation of the results shows a concentration of areas with very high suitability in the center of the burnt area near the settlement of Mikro Prinos for both scenarios. These areas range from approximately 400 to 800 m in elevation and have moderate slopes. Most of them are located in northern exposures and near a dense road network. It can be concluded that the proposed areas cover a large part of the requirements for successful reforestation interventions.
However, to make further comparisons between the cartographic results of the two scenarios and to draw conclusions, the area of each suitability zone was calculated.
Table 7 compares the values of the two scenarios.
The ability to assess and identify the most suitable sites for restoration immediately after a forest fire is very important for both the affected natural ecosystem and the local community. In this study, a model was developed to evaluate affected areas for suitability for reforestation based on a number of ecological and economic parameters. The final results obtained for the study area and the generated suitability maps show the usefulness of the model and its application in the decision-making process.
It should be emphasized that the evaluation model was based on a set of variables that were evaluated and selected according to a review of the international literature. The assessment of phenomena based on ecological parameters is a complex and sophisticated process. The selection of the variables used is related to the importance of the specific criteria in the restoration processes, and this was based on the hierarchy between them. According to the results of the two scenarios and the small deviations between them, it can be concluded that the hierarchy and classification of the variables were correct. Moreover, rerunning the model with slight variations in the scoring values of the criteria gave similar results.
It should be noted that the contribution of geographical information systems and remote sensing played a key role in the analysis and implementation of the evaluation model, providing a wealth of tools for data processing and preparation. The application of the methodology, the processing of the variables and the extraction of the final results in cartographic format relied on both the capabilities of GIS and remote sensing. The synergy of these two disciplines in this work allowed for the evaluation of the study area and the extraction of detailed and usable results. Otherwise, the absence of these tools would have required time-consuming and costly field work, as well as analogous processing methods that would have complicated and significantly delayed its completion.
It is worth noting that the methodology applied in this work was mainly based on the conversion and processing of mosaic files. The analysis applied to the set of variables was based on a 10 × 10 m tessellation size. The detail discernible in the cartographic results of the model proves that the choice of this scale was successful. The area manager can identify individual surfaces with great accuracy and plan his operations in detail. After all, reforestation operations are, in practice, carried out on individual areas that are much larger than 10% of the hectare. A resolution of 100 square meters per pixel is more than sufficient to identify suitable areas. One problem identified during processing with mosaic files has to do with the selection of tiles at the edges of the study area. The complex boundary of the fire resulted in several mosaics intersecting with the study area boundary line. These tesserae were taken into account in the subsequent analysis, even though a portion of them were outside the boundary line. The change in the total area of the study area was very small, as the 10 × 10 m scale applied was very detailed.
According to the results of the table, the largest changes between the two scenarios are seen in the medium and large scales, where the differences are 15.07 and 13.53 (%), respectively. On the other hand, in the very small and very large suitability categories, there are no major changes between the two scenarios. In other words, it is detected that, both at the level of percentages and the level of delimitation, the two categories are significantly similar. The detailed spatial analysis reveals nuanced patterns in the very small and very large suitability categories between Scenario 1 and Scenario 2. In the very small suitability category, where economic and social factors are more heavily weighted in Scenario 2, the spatial distribution appears to reflect an increased emphasis on areas with enhanced accessibility, potentially influenced by proximity to the road network. This shift aligns with the socioeconomic focus of Scenario 2. Conversely, in the very large suitability category, dominated by the ecological considerations of Scenario 1, the spatial distribution tends to exhibit a more extensive pattern, prioritizing areas with optimal ecological conditions for restoration. The observed variations in these categories emphasize the model’s sensitivity to the distinct emphases of each scenario and underscore the need for a comprehensive understanding of the trade-offs between ecological and socioeconomic priorities in the decision-making process for identifying optimal ecological restoration sites.
It can therefore be concluded that—at least on the basis of this study—both scenarios are equally effective for identifying areas that are not suitable for afforestation and those that are highly suitable for afforestation. However, more research is required before generalizing this finding, such as conducting the same experiment in other settings. More thorough testing of the results could be achieved by validating the model from actual restoration data. After checking all available data and contacting the competent authorities, it was found that no extensive reforestation program has been implemented for this area or the wider area of Thasos. Verification of the model with field data would therefore require its application to a burnt area for which a restoration program has been carried out, followed by longitudinal monitoring of the evolution and progress of reforestation. Such a task is very time-consuming and difficult to implement in the context of a thesis but could be the subject of a future research project.


