Article

Integrating System Spatial Archetypes and Archetypical Evolutionary Patterns of Human Settlements: Towards Place-Based Sustainable Development

1
College of Architecture and Urban Planning, Tongji University, Shanghai 200092, China
2
Faculty of Humanities and Arts, Macau University of Science and Technology, Macau 999078, China
*
Author to whom correspondence should be addressed.
Professor Liu has retired from Tongji University and is currently affiliated with Macau University of Science and Technology.
Land 2023, 12(12), 2164; https://doi.org/10.3390/land12122164 (registering DOI)
Submission received: 14 November 2023 / Revised: 11 December 2023 / Accepted: 12 December 2023 / Published: 14 December 2023
(This article belongs to the Topic Urban Land Use and Spatial Analysis)

Abstract

:
Effectively managing the diversity and complexity of human settlements is pivotal in tackling the sustainability challenges we face in the Anthropocene. Conceptualizing a city’s human settlement as a unified social–ecological system and investigating its system archetype and evolutionary pattern offer a promising approach to understanding sustainability challenges within specific spatio-temporal contexts. This study introduced a novel approach to assessing and characterizing human settlements using a spatio-temporal two-tier structure archetype analysis for human settlement systems. Applying inductive clustering to an integrated dataset, we identified five typical human settlement systems for 2019 and eight change patterns (2001–2019) in the Yangtze River Delta region. By linking inductively recognized human settlement systems into deductive categories of human-nature connectedness and associating inductive change patterns with deduced phases within the adaptive cycle, we defined five system spatial archetypes and three archetypical evolutionary patterns, revealing the typical interaction between them. This enabled us to understand sustainability challenges for each interaction, formulating seven tailored solutions to promote place-based development in human settlements. Generally, our approach showcases considerable potential in uncovering human settlement challenges, ultimately contributing to addressing these challenges at the local level within the broader context of global sustainability issues.

1. Introduction

Human settlements in the Anthropocene grapple with multifaceted global challenges, encompassing climate change, ecological destruction, and rising inequality [1,2,3]. The imperative of looking at the larger picture in human settlements is underscored by both the Sustainable Development Goals (SDGs) and the New Urban Agenda (NUA) [4,5]. Significant advances have been made in the classification [6], objectives [7], and various attributes of human settlements, including spatial differentiation characteristics [8], social and economic structure [9,10], and well-being [3]. Yet, it remains a major challenge to meaningfully organize the diversity and complexity of human settlement configurations and identify their potential development risks [11,12].
Understanding human settlements from the perspective of complex, social–ecological systems (SESs) is a promising pathway in this regard [13]. SESs are a type of complex adaptive system, characterized by strong connections and feedback within and between social and ecological components that determine their overall dynamics [14]. Previous research has applied the SES framework to evaluate the transformability of high-density urban settlements [15], the resilience of rural settlements [13,16], as well as the adaptability of settlement governance in resource-rich areas [17]. Sustainability assessments of settlement systems vary in methodologies, encompassing qualitative analysis and quantitative indicators. Qualitative research involves collecting data through observation, interviews, and existing documents, employing approaches like action situation analysis [18], contextual analysis [19], and content analysis [17]. On the quantitative front, research predominantly focuses on establishing an evaluation index system to assess the sustainability of settlement systems. This process utilizes remote sensing and statistical data, incorporating methodologies such as the analytic hierarchy process [20], geographical detector [13], and structural equation modeling [21]. However, while efficient for assessing complex real-world situations, these methodologies present challenges in formulating specific solutions for future development risks of local settlements.
In addressing this challenge, archetype analysis has emerged as a central tool in sustainability research, spanning topics including climate change [22], land systems [23], social–ecological systems [24], and institutional changes [25], serving as a basis for contextualized, tailored management and decision making [26]. Archetype analysis comprehends social–ecological dynamics by discerning recurring patterns in variables and changes that dictate SES’s sustainability [27]. SES archetypes denote a set of typical and recurring SESs, distinguished by their shared characteristics, trajectories of change, and underlying challenges [26]. For instance, Cumming et al. [28] introduced a conceptual framework to enhance the understanding of interactions between humans and ecosystems amidst global agricultural transitions and rapid urbanization. They conceptualized three SES archetypes from high to low human–nature connectedness—‘green-loop’ SESs, ‘transition’ SESs, and ‘red-loop’ SESs. These archetypes signify specific sustainability challenges and governance requirements. Moreover, multi-tier nested SES archetypes have proven advantageous in research by allowing intermediate abstractions that retain general patterns and local details, paving the way for a broader understanding of human–nature interactions [29]. Sietz et al. examined eight broad archetypes of vulnerability (e.g., extremely dry and resource-constrained areas, dry areas with better agropotential, better governance, higher income, and better nourished people) across all drylands of sub-Saharan Africa. They further identified six nested archetypes within the archetype of dry areas with better agropotential, primarily distinguishing system vulnerability based on erosion sensitivity, governance, and undernourishment [30]. Yang et al. mapped two-tier nested SES archetypes, covering five global SES archetypes (natural systems, ecological transition systems, agricultural systems, urban–rural transition systems, urban systems) with 11 regional SES sub-archetypes in the Beijing–Tianjin–Hebei urban agglomeration in China [31].
Current research primarily derives archetypes through inductive means (e.g., by identifying commonalities within case studies) or deductive methods (e.g., theoretically pinpointing key variables creating typological spaces) [32]. Inductive, data-driven approaches are vital for capturing complex real-world phenomena, enabling the generation of empirical scientific knowledge about diverse SES archetypes globally. However, inductive methods might yield challenging results to explain or articulate, hampering the formulation of specific development strategies [33]. Deductive methodologies identify SES archetypes by theoretically detecting critical variables that characterize human–nature interactions, offering a basis for evidence-based practice [32]. The key variables utilized in the literature include the level of land-use intensification and trade flows [34], the degree of connectedness between ecosystems and societies [28], and human population size, material and energy use, and technology [25]. However, the practical application of these deductive approaches may be constrained by their tendency to oversimplify real-world complexities, thereby limiting their utility in devising context-specific policy and governance tools [35].
Integrating both inductive and deductive archetype analyses would leverage their respective strengths to optimize diverse levels of abstraction, ensuring both general applicability and specific interpretative capacity. Nevertheless, this integration is still in its nascent stage. Recent studies, such as Pacheco-Romero et al. [33] and Yang et al. [31], have made progress in this area, examining the spatial aspects of deductive archetypes for SESs but lack a theoretical deduction of SES changes. Holling’s adaptive cycle theory offers a framework for analyzing how complex systems change and the dynamics of their sustainability [36]. This theory suggests that a dynamic system progresses through four phases —exploitation (ϒ), conservation (K), release (Ω), and reorganization (α)—driven by the interaction among potential, connectedness, and resilience [37]. System potential represents internally accumulated capital expressed in ecosystem structure, productivity, and human relationships. Connectedness refers to the degree of rigidity between internal controlling variables and processes of the system. Resilience is a measure of a system’s vulnerability to unexpected or unpredictable shocks. In the two front loop phases, r and K, capital accumulates, leading to predictability and stability increases as redundancies are gradually eliminated. Conversely, during the two back loop phases, Ω and α, there is potential for innovation and novelty to emerge from the resources that are released, however, with a certain degree of instability and unpredictability [38]. The adaptive cycle provides an excellent tool to examine the deductive archetypes of SES changes [19].
Existing research successfully analyses different configurations of human settlements individually; however, it remains challenging to understand the inherent complexity of human settlement development as a multifaceted and nonlinear process. Utilizing the archetype analysis method to scrutinize typical recurring patterns in spatial relationships and changes in human settlements from the perspective of social–ecological systems provides a promising pathway. However, the integration of deductive and inductive archetype analyses is still in its infancy, lacking a theoretical deduction of SES changes. Human settlement development fundamentally represents an adaptive evolution process in which each evolutionary phase presents distinct challenges for the future. Therefore, employing deductive assessment for both spatial patterns and temporal changes is crucial.
This study introduces a methodology for conducting spatio-temporal two-tier structure archetype analysis, combining spatial archetypes of human settlement systems with archetypal evolutionary patterns. We concentrate on exploring sustainable development pathways of human settlements in a place-based context, emphasizing understanding and addressing challenges at the local level within the broader context of global sustainability issues [39]. Our efforts are directed at advancing the comprehension of sustainable development for local human settlements in four ways: (1) treating the city’s human settlement as a social–ecological system that integrates urban, rural, and wilderness spaces; (2) linking inductively identified human settlement systems into deductive categories of human-nature connectedness; (3) associating inductively identified change patterns into deduced phases within the adaptive cycle; and (4) connecting system spatial archetypes with archetypal evolutionary patterns to unveil local sustainability challenges and distinct place-based development pathways for human settlements. As a case study, we selected the Yangtze River Delta (YRD) region, which is grappling with increasingly strained human–environment relations due to rapid urbanization and climate change [40]. The YRD holds significance in China’s development strategy and is recognized as one of the six major urban agglomerations worldwide [41]. In this study, we specifically addressed the following questions:
  • What are the system spatial archetypes and the archetypical evolutionary patterns of human settlements in the Yangtze River Delta?
  • What are the primary sustainability challenges faced by human settlements in this region, and how do we develop place-based solutions to address these challenges in pursuit of sustainability?

2. Materials and Methods

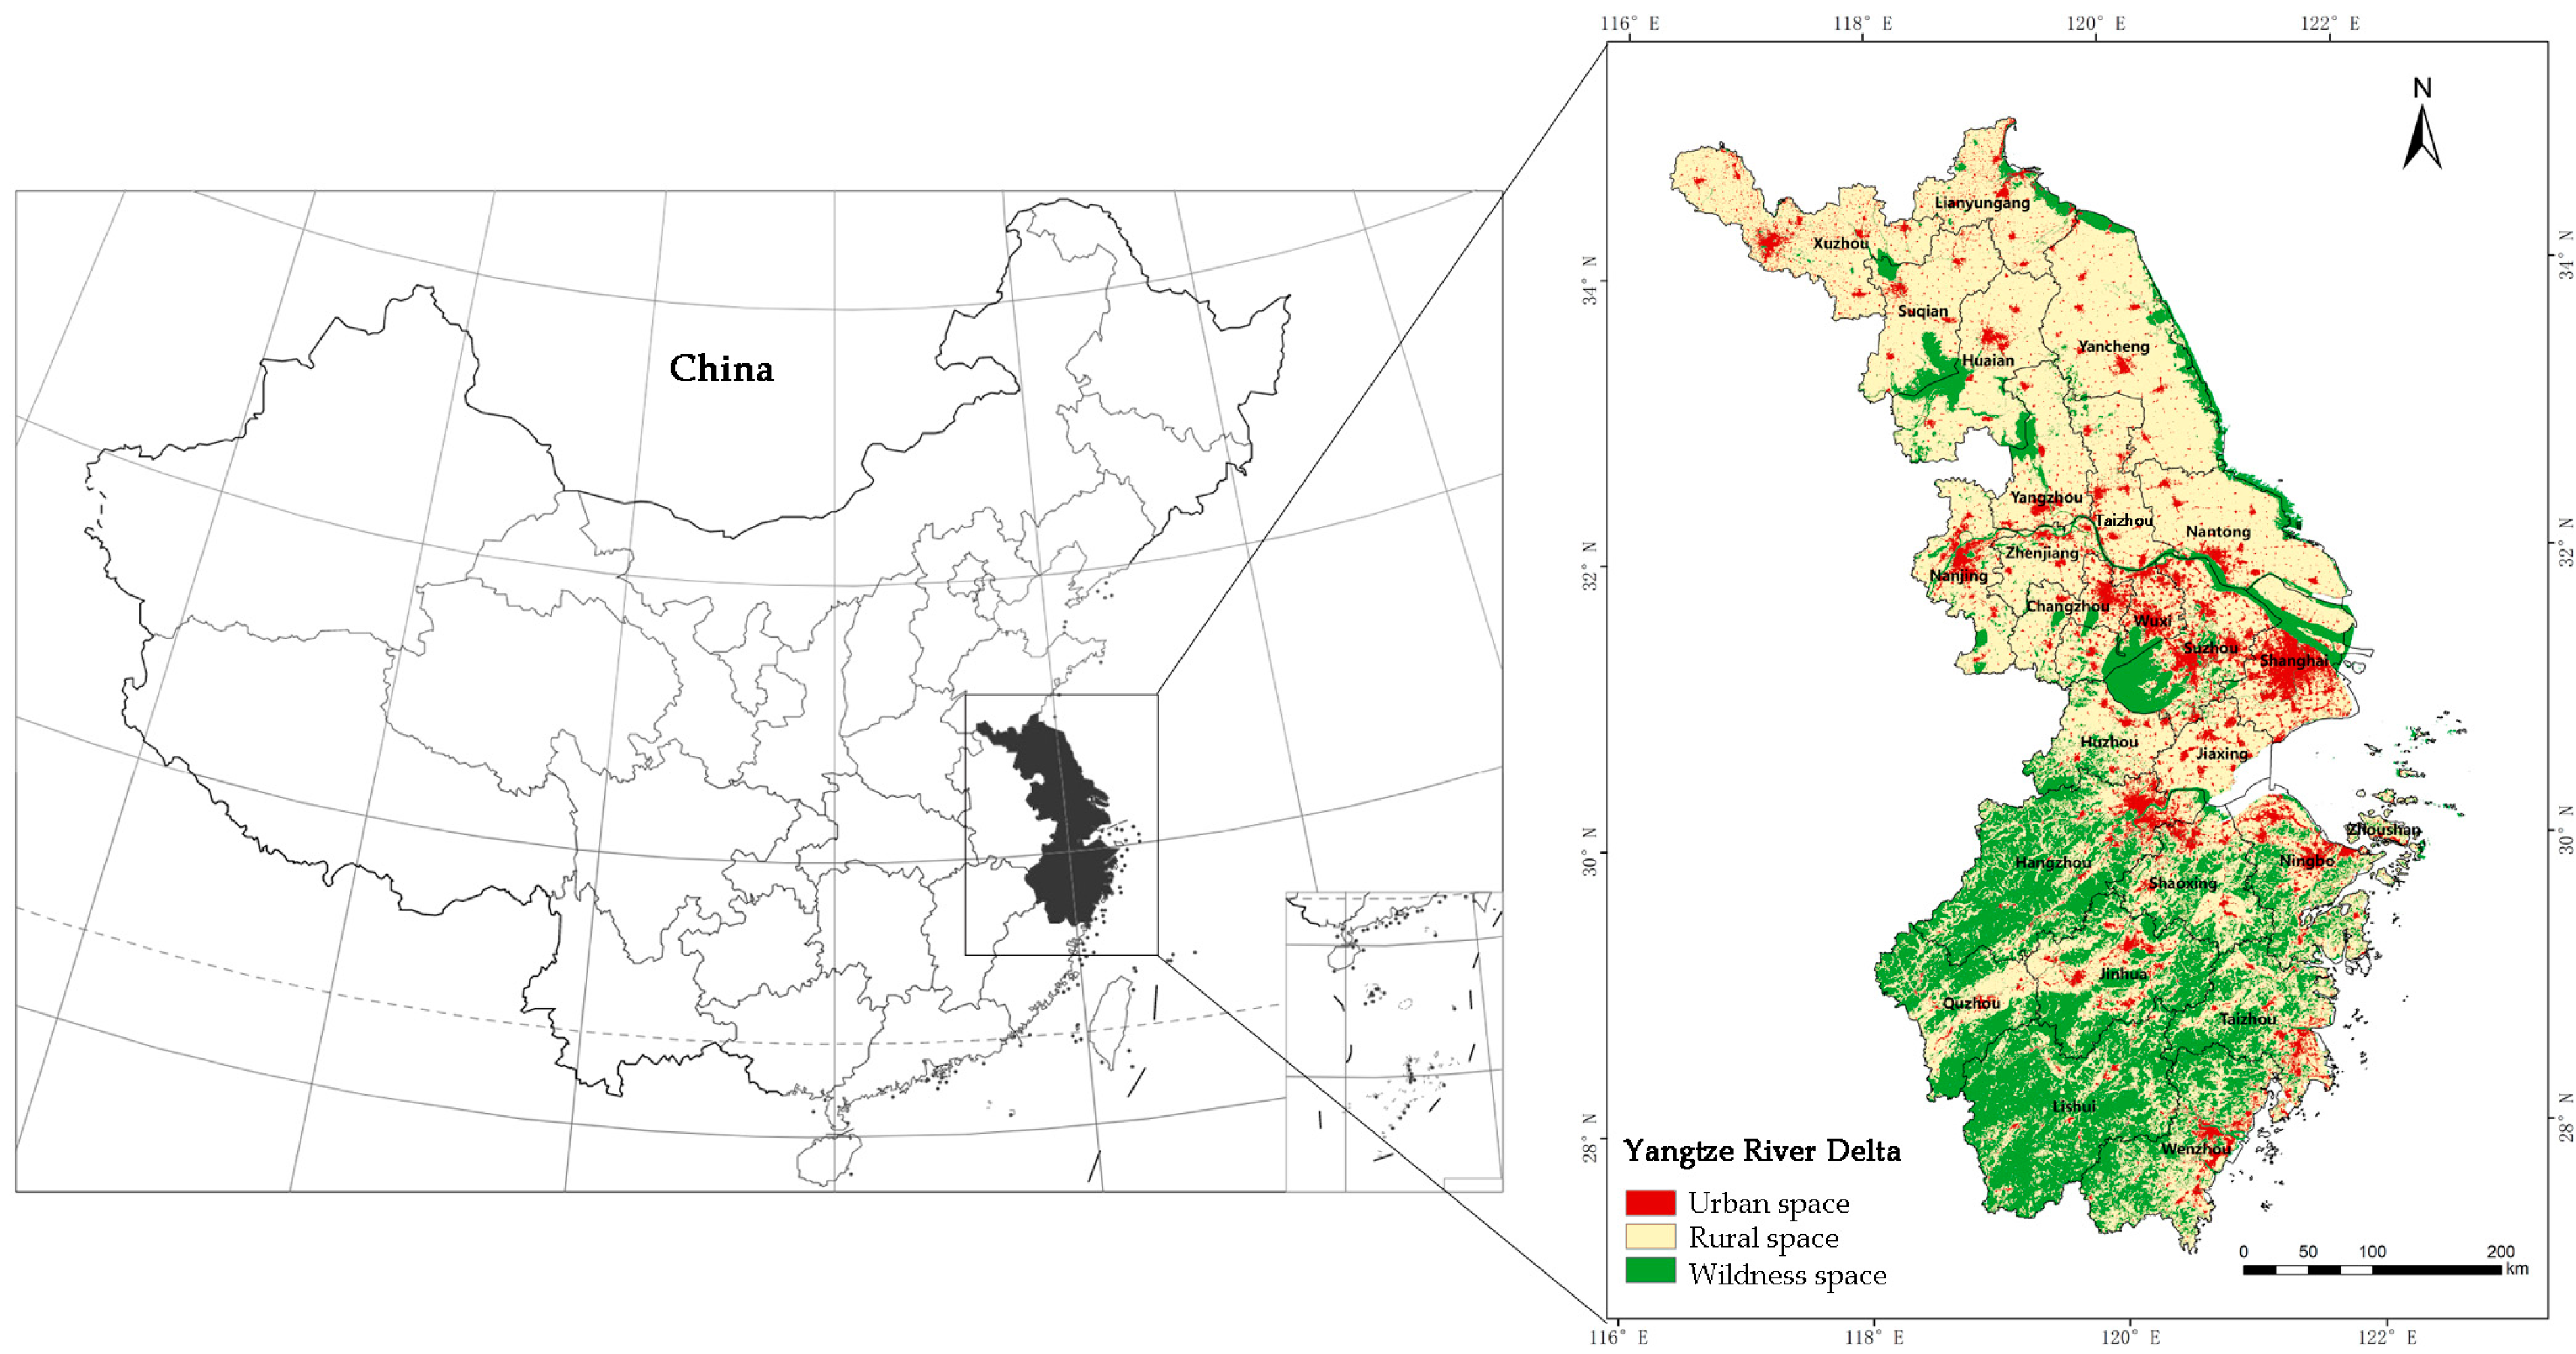
2.1. Study Area and City–Rural–Wilderness Spatial Classification

The Yangtze River Delta in eastern China comprises two provinces (Jiangsu and Zhejiang) and one megacity (Shanghai). The natural evolution characteristics of the delta make its ecosystem fragile, while its abundant resources attract human habitation. The study is based on the 2019 administrative divisions, comprising 25 research units (cities), covering an area of approximately 219,000 square kilometers (Figure 1).
The physical entity of human settlements on Earth is a continuum from nature to artificial, categorizable into three primary types: urban, rural, and wilderness [42]. Urban areas refer to the built-up regions within cities (including urban and town areas). Rural areas consist of settlement forms ranging from scattered villages to townships that provide production and service functions, characterized by extensive land use, low population density, and evident pastoral features [43]. Wilderness comprises large areas, retaining natural features with minimal human intervention and permanent human settlements [44]. Building on ESA’s existing land-use classification systems, urban, rural, and wilderness spatial classification is conducted based on these definitions (Table 1). According to this spatial classification, we identified and mapped the urban, rural, and wilderness spaces in the YRD region (Figure 1). According to the statistics, the urban, rural, and wilderness composition in the YRD region is approximately 1:6:5. This proportion is approximately 1:8:2 in Jiangsu Province, primarily oriented towards rural lands with dominant dry and paddy field parts. Zhejiang Province holds a ratio of roughly 1:5:14, with more expansive wilderness areas and generally better ecological resources. Meanwhile, in Shanghai, the composition ratio is approximately 4:7:3, highlighting the dominance of urban and rural lands.

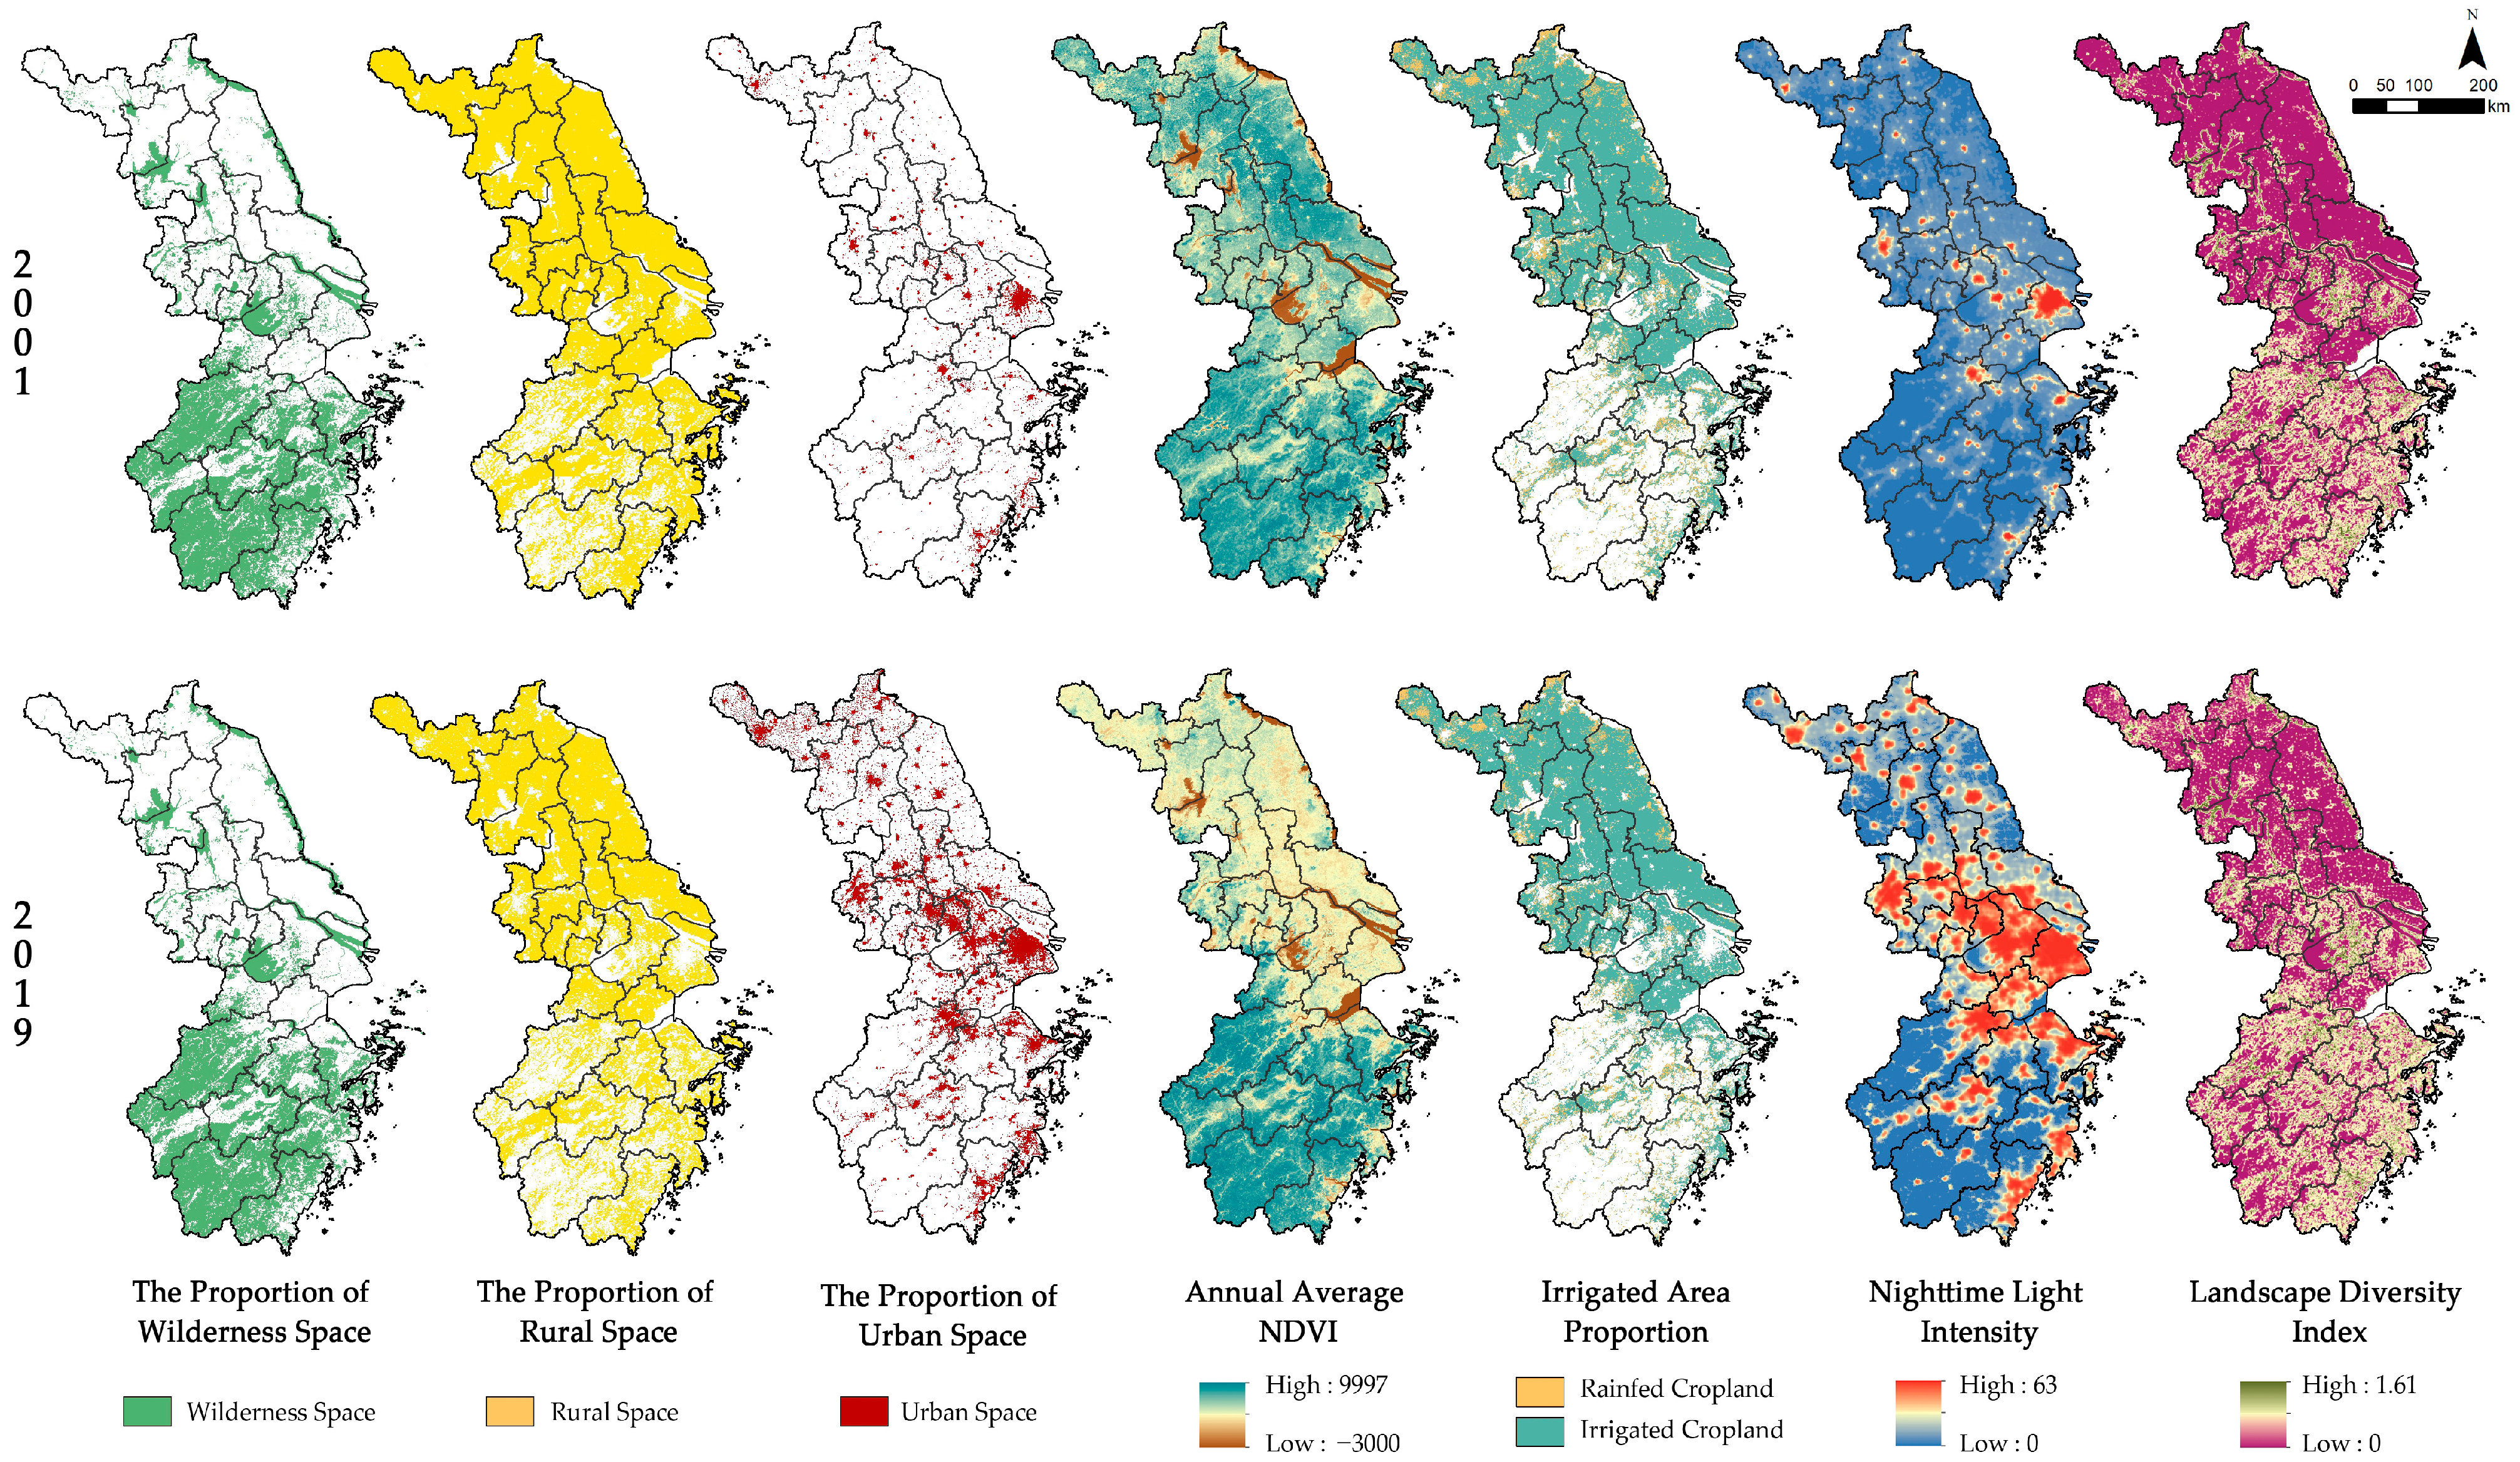
2.2. Indicator System for Mapping Human Settlement Archetypes

To characterize and map human settlement system archetypes, we developed a comprehensive indicators dataset, drawing inspiration from Ostrom’s socio-ecological system framework [45] and leveraging the variable selection approach used in SES assessment by Pacheco-Romero [46,47]. Ostrom’s framework provides a foundational perspective, portraying SESs as intricate hierarchies of subsystems and their interactions [45]. Building on this conceptual foundation, Pacheco-Romero compiled a reference list of 60 variables for characterizing SESs across the social system, ecological system, and their interactions [46]. Additionally, they used a data-driven approach to pinpoint 29 key indicators for mapping SES archetypes [47].
Given that a city’s human settlement is a typical complex socio-ecological system, we constructed a settlement system framework to include three principal components: a socio-economic subsystem, an ecological subsystem, and their interactions. Aligning with our research objectives, we refined our indicator selection based on the following criteria: (1) indicators should represent the spatial heterogeneity of local human settlements, encompassing human activity intensity and the proportions of urban, rural, and wilderness spaces; (2) indicators should capture the temporal evolution characteristics of settlement systems, including their potential, connectedness, and resilience; (3) data for selected indicators should be available for both 2001 and 2019 at the city level, allowing for consistency and comparability. Following these principles and referring to Pacheco-Romero’s variables [46,47], we selected 10 key variables and 16 indicators to construct the indicator system for mapping human settlement archetypes in the YRD urban agglomeration (Table 2).
In the socio-economic subsystem, three dimensions were incorporated: population dynamics, economic development, and governance [47]. First, changes in population size and structure represent the human capital of settlement systems, which is an essential part of the system’s potential, determining the range of possible future options [48]. We used population density and birth rate to represent the dimension of population dynamics. Second, the level of economic development significantly reflects the intensity of human activity in settlement systems. However, China’s unique urban–rural dual household registration system has led to disparities in the economic development levels of urban and rural residents [49]. Therefore, we selected the per capita disposable income of rural residents and urban residents’ unemployment rate to reflect this dimension [20]. Third, the governance dimension was utilized to illustrate the contributions of policies to the environment, a fundamental aspect of the resilience of settlement systems. In this context, we considered indicators such as energy consumption reduction rate per unit of GDP, municipal sewage treatment rate, and industrial solid waste utilization rate to assess the effectiveness of positive governance from energy, water, and waste infrastructure [50].
In the environmental subsystem, three dimensions were also included: climate, natural productivity, and natural coverage [47]. Climate change has consistently shaped the Yangtze River Delta and its socio-economic development [51]. We used indicators of average annual precipitation and average annual temperature to represent this dimension [47]. Additionally, natural productivity and natural coverage play a significant role in determining the ecosystem structure and function, which is essential for the resilience of settlement systems [52]. Indicators such as average annual NDVI and the proportion of wilderness space were employed to reflect these two dimensions [53].
Moreover, we parsed the interactions between the two subsystems into three distinct components: human actions on the environment, ecosystem service supply, and ecosystem service demand [47]. The urban area is a concentrated representation of human actions altering the environment [42]. Night light emissions observed through remote sensing provide a direct signature of human activity [54]. Therefore, the proportion of urban space and nighttime light intensity indicated the dimension of human actions on the environment. Landscape heterogeneity is closely linked to the supply of multiple ecosystem services [55]. Diverse landscape types could enhance the intensity of interactions between adjacent landscape units, reflecting the internal controllability of settlement systems [56]. Hence, the landscape diversity index was chosen as the indicator of ecosystem service supply. With a history of thousands of years of paddy rice cultivation [57], multi-functional agricultural landscapes and rural areas in the YRD region provide clear evidence of land use changes driven by demands for multiple ecosystem services at the local scale [58]. Here, the indicators of the proportion of rural space and irrigated area, reflecting the quantity and quality of cropland, were used to depict the local ecosystem service demand.

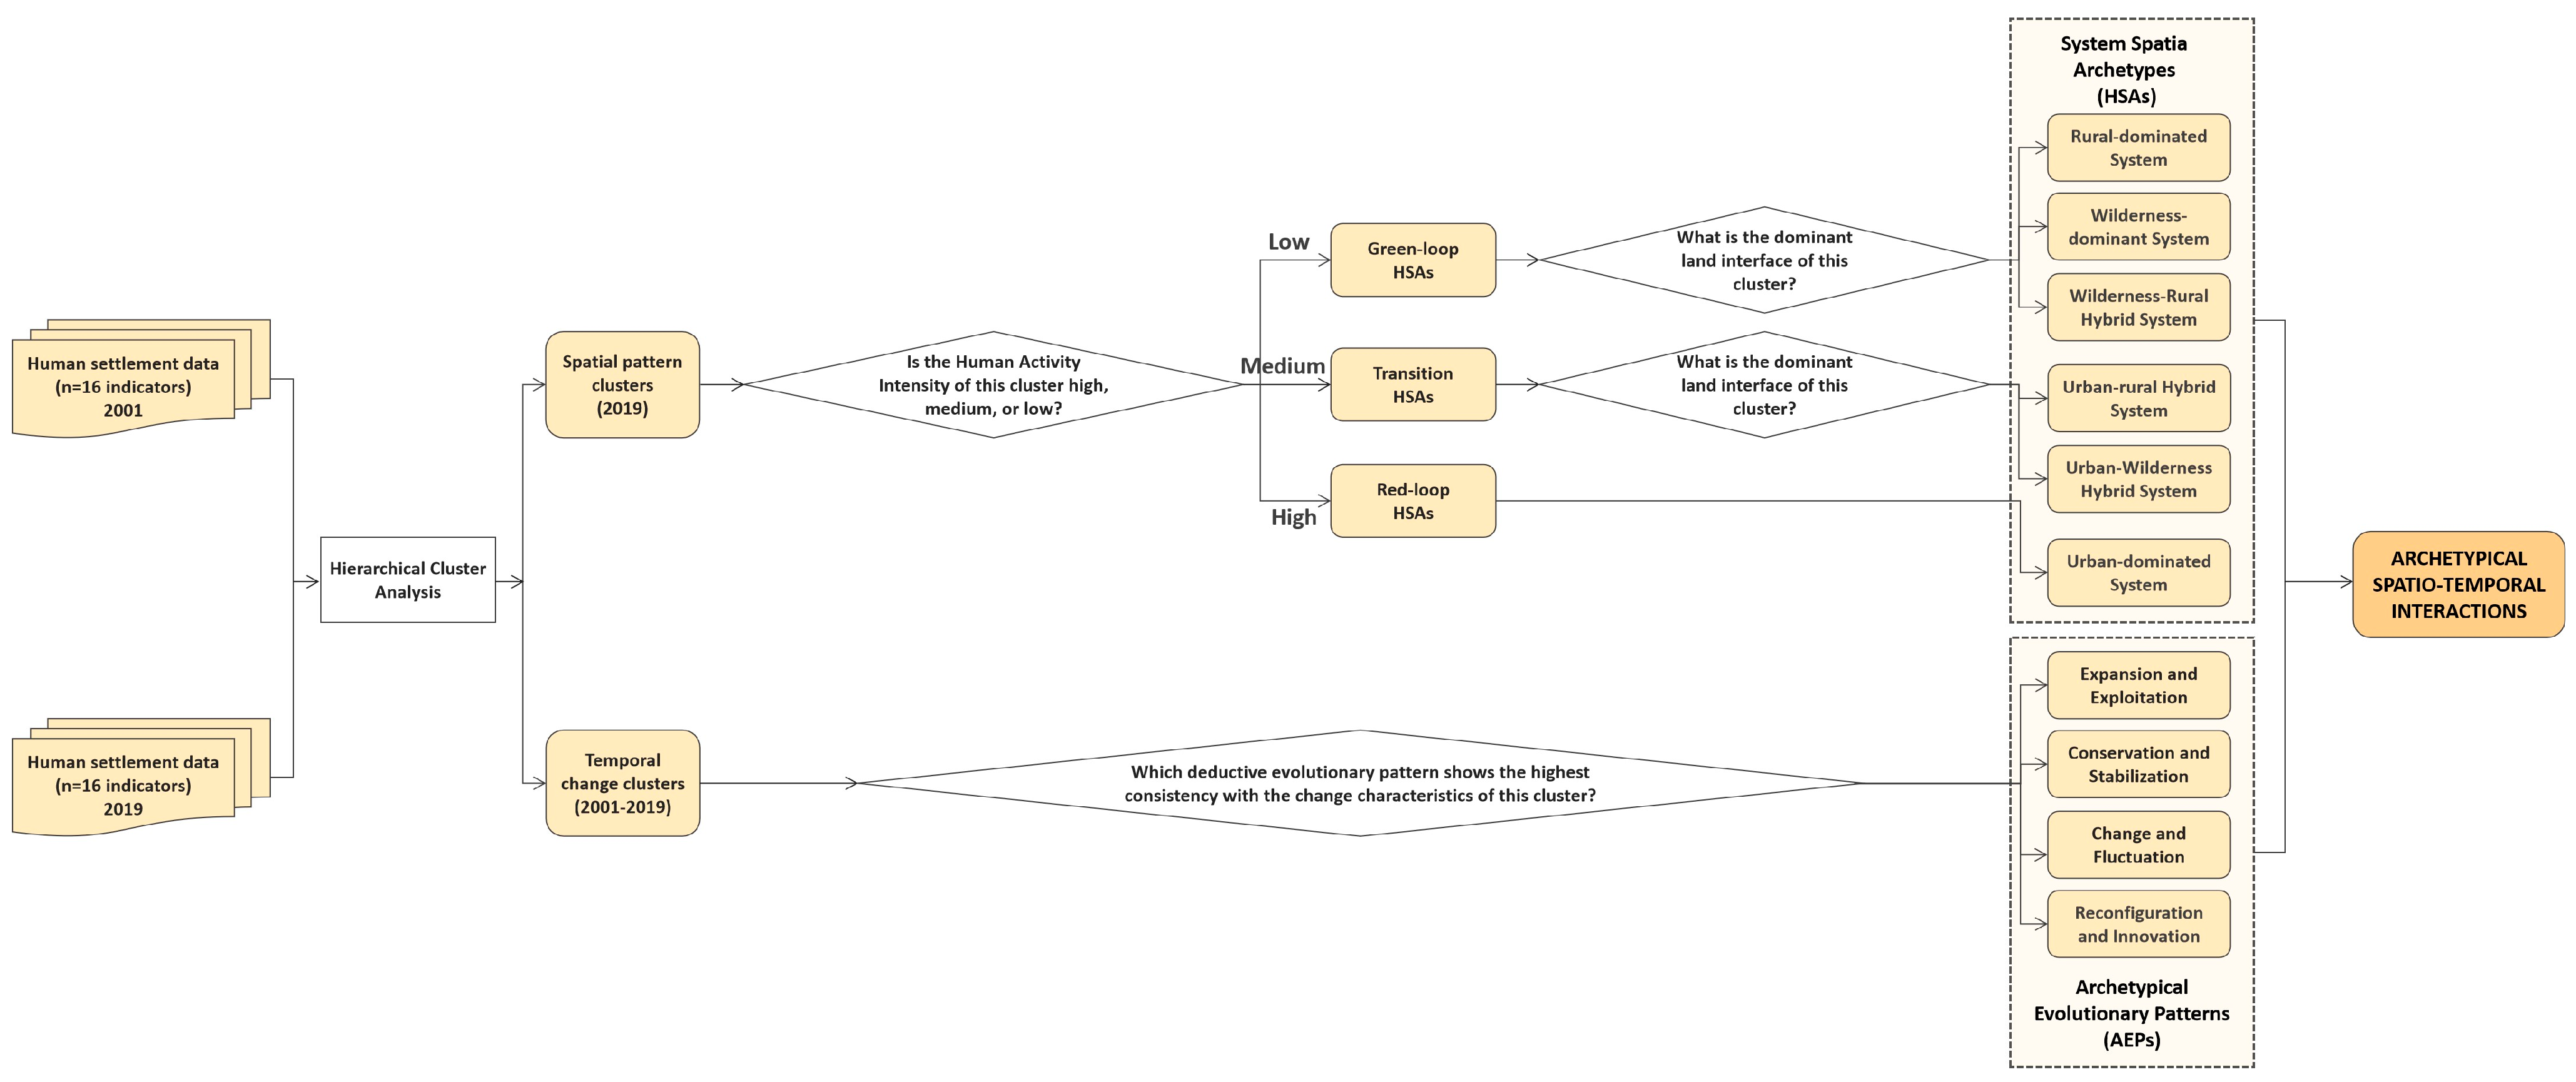
2.3. Identifying System Spatial Archetypes and Archetypical Evolutionary Patterns of Human Settlements

Increasingly, archetype analysis has been utilized as a methodological approach to uncover patterns in the factors and processes shaping complex adaptive systems across different locations and periods [27]. However, prevailing methods for identifying SES archetypes primarily concentrate on spatial dimensions, neglecting the dynamic evolutionary properties inherent in complex adaptive systems. Therefore, this study first examined spatial pattern clustering (2019) and temporal change clustering (2001–2019) of human settlements in the YRD region, then linked the spatial clusters with deductive categories of human–nature connectedness and associating temporal clusters with deduced phases within the adaptive cycle to identify the system spatial archetypes (HSAs) and archetypical evolutionary patterns (AEPs) of local human settlements. Furthermore, we examined the spatial coexistence of HSAs and AEPs to identify the archetypical human settlement spatio-temporal interactions in the YRD region (Figure 2 and Figure 3).

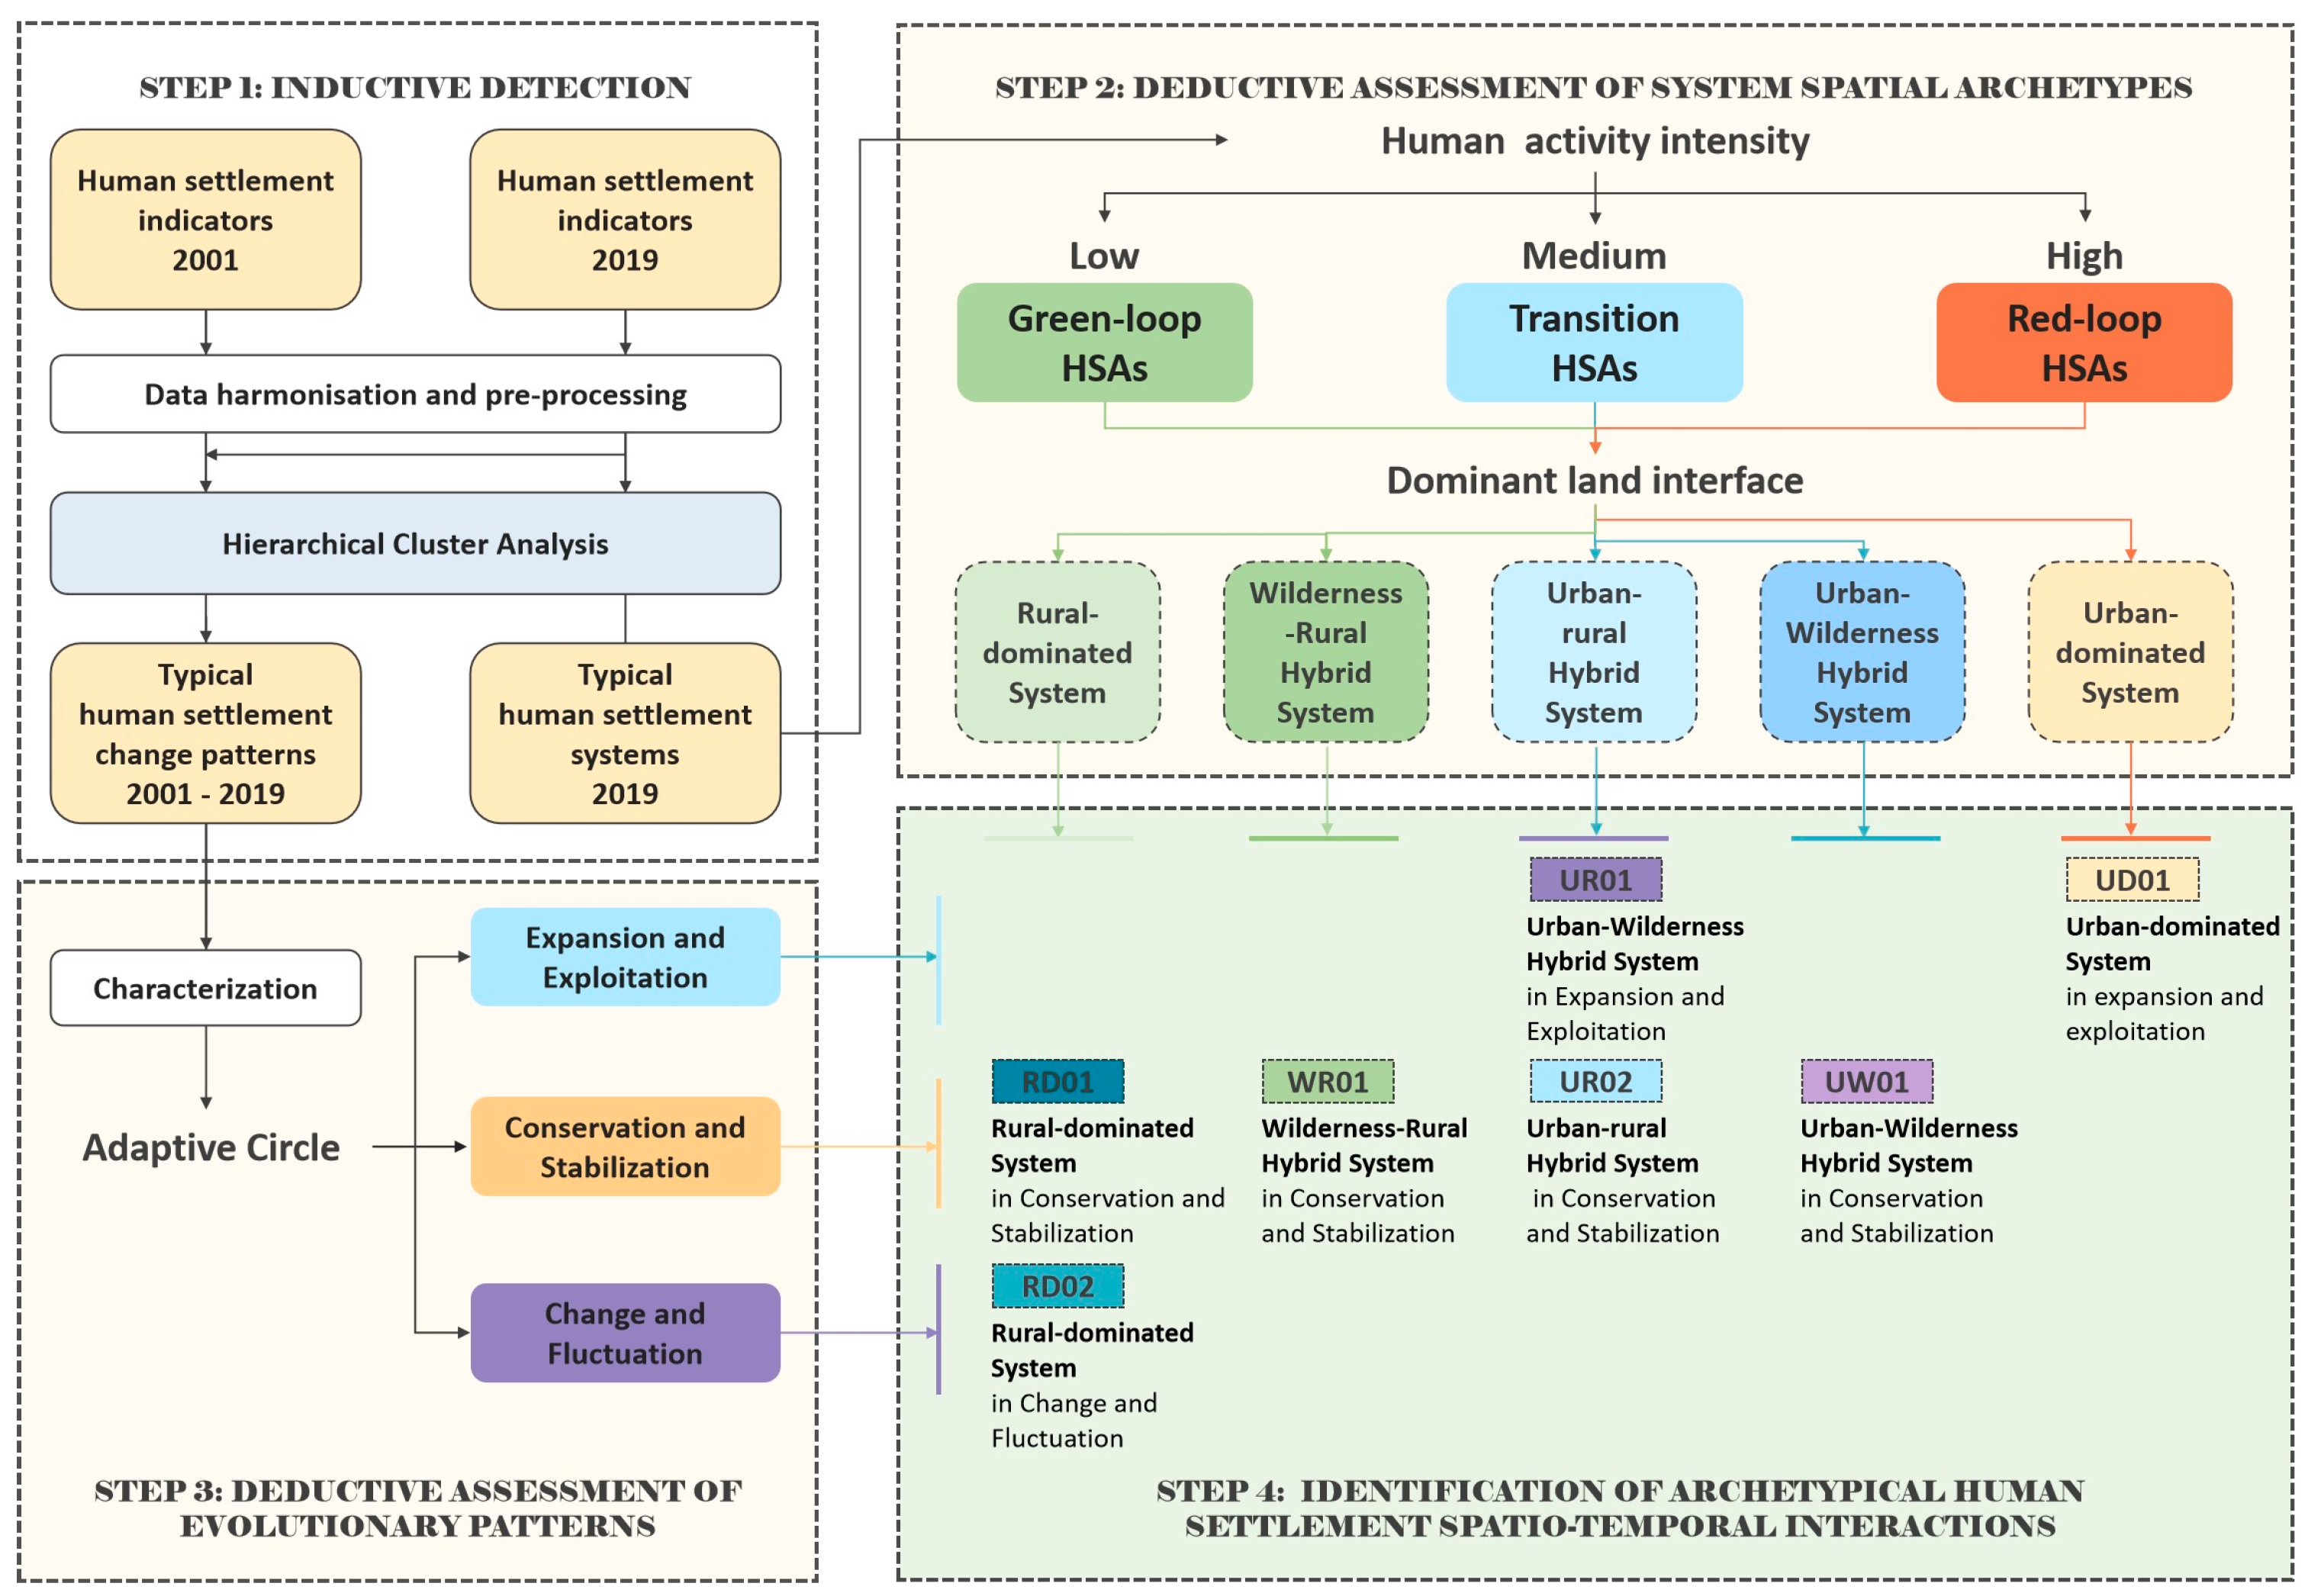
2.3.1. Step 1: Inductive Detection of Typical Human Settlement Systems and Their Changes

To classify the typical settlement systems in 2019 and the typical changes in human settlement from 2001 to 2019, we utilized SPSS software to perform hierarchical cluster analysis on the indicator data in 2019 and the difference in indicator data from 2001 to 2019 to achieve city cluster grouping. The dendrogram was used to assess the optimal number of clusters. When the 2019 indicator data were clustered into five classes, the distances between clusters rapidly increased, indicating low similarity between subsequent clusters. Therefore, five classes were selected as the number of clusters. The difference in indicator data from 2001 to 2019 clustered into nine classes, after which cluster distances increased rapidly, hence, we chose nine classes as the number of clusters. This yielded 5 spatial pattern clusters (2019) and 9 temporal change clusters (2001–2019) of human settlements and cluster memberships for each city.

2.3.2. Step 2: Deductive Assessment of System Spatial Archetypes

After identifying 5 spatial pattern clusters of human settlements (2019), we applied Cumming et al.’s approach [28] to assess and interpret these clusters, distinguishing three deductive types—’green-loop’, ‘transition’, and ‘red-loop’ SESs—based on the degree of human-nature connectedness from high to low. Green-loop SESs exhibit high direct dependence on local ecosystems with minimal external economic involvement. These systems demonstrate an immediate feedback loop between human well-being and environmental degradation. On the contrary, red-loop SESs witness nearly all individuals meeting their basic needs through markets supplied by distant ecosystems, resulting in a society primarily disconnected from its local environment. The transition from green-loop to red-loop dynamics is propelled by feedback between technological change, population growth, and ecosystem transformation. ‘Green-loop’ and ‘red-loop’ SESs present distinct sustainability challenges. The challenge in ‘green-loop’ systems is to avoid a ‘green trap,’ preventing persistent poverty and excessive local ecosystem degradation. Conversely, in red-loop systems, the challenge lies in averting overconsumption of distant ecosystems driven by increasing wealth and the disconnect between people and the environment, known as the ‘red trap’ [28,59].
The disparity in human–nature connectedness among local human settlements is mainly attributed to differences in human activity intensity [28]. Furthermore, this variation manifests in physical space through differing proportions of urban, rural, and wilderness spaces within human settlements [42]. Therefore, we linked inductively identified human settlement systems (2019) into deductive categories regarding human activity intensity and dominant land interface, leading to a two-tier nested structure of system spatial archetypes.
Specifically, the multi-criteria evaluation (MCE) approach [33] was employed to define human activity intensity (HAI). The formula for HAI is as follows:
HAI = Population Density + Rural Residents’ Per Capita Disposable Income + Nighttime Light Intensity − Urban Residents’ Unemployment Rate
Indicators were summed by the equal-weight method. Then, the HAI values for all cities in each cluster were averaged. Utilizing Jenk’s natural breaks classification method to categorize high, medium, and low degrees of HAI, we initially recognized three human settlement archetypes according to Cumming et al.’s SES conceptual model [28]: red-loop HSAs, transition HSAs, and green-loop HSAs.
To further assess our identified HSAs, we compared the proportions of urban, rural, and wildness spaces for all cities within each cluster with the overall area averages. If only one space proportion exceeded the average, the archetype would be characterized as a system dominated by that particular space. When two space proportions surpassed the average, the archetype would reflect a hybrid of these spaces. This approach subdivided the green-loop HSAs into rural-dominated, wilderness-dominant, and rural–wildness hybrid systems. Simultaneously, the transition HSAs were classified as urban–rural and urban–wildness hybrid systems, while the red-loop HSAs were described as urban-dominated systems. This method helped identify 6 potential HSAs.

2.3.3. Step 3: Deductive Assessment of Archetypical Evolutionary Patterns

To deductively assess the system’s evolutionary patterns, the adaptive cycle framework [60] serves as a diagnostic tool for distinguishing various evolution states of human settlement systems. Drawing on this theory and integrating it with the developmental features of human settlements, 4 deductive evolutionary pattern types were identified: expansion and exploitation, conservation and stabilization, change and fluctuation, and reconfiguration and innovation.
In the expansion and exploitation pattern, rapid construction and development of the human settlement occur, with an elevation in socioeconomic levels and densification of spatial structures, leading to a substantial increase in system potential and connectivity. However, environmental degradation and the solidification of social structures may concurrently result in reduced system resilience and the loss of vitality. As potential and connectivity reach higher levels, the system transitions into the conservation and stabilization pattern, characterized by minimal changes in human settlement. The internal connections within the local human territory become more rigid, contributing to reduced system resilience and increased susceptibility to disruptive factors. The system enters the change and fluctuation pattern when the disturbance intensity surpasses a threshold. In this phase, unpredictability and the risk of imbalance significantly rise, yet there is a potential for novelty to emerge from the released resources. Supposing the system adeptly copes with this stage, it proceeds into the reconfiguration and innovation pattern, where the system dynamically responds to external disturbances and internal changes, seeking to establish a new order.
A comprehensive examination was undertaken to evaluate the evolutionary status of each temporal change cluster of human settlements (2001–2019) by assessing the predominant factors influencing each collection. The values of each indicator for each cluster were averaged. Then, zero-mean normalization was used to facilitate a comparative analysis of the impact of each indicator on its respective cluster. This process enabled the characterization and labeling of typical human settlement changes (HSCHs). Subsequently, by analyzing the degree of conformity between HSCHs and deductive evolutionary patterns, a correspondence was established to identify the archetypical evolutionary patterns of human settlements (AEPs) in the Yangtze River Delta (YRD) region. This comparative analysis sought to establish a clear association between observed human settlement changes and theoretical deductive evolutionary patterns, providing insights into the archetypical evolutionary trajectories within the YRD region.

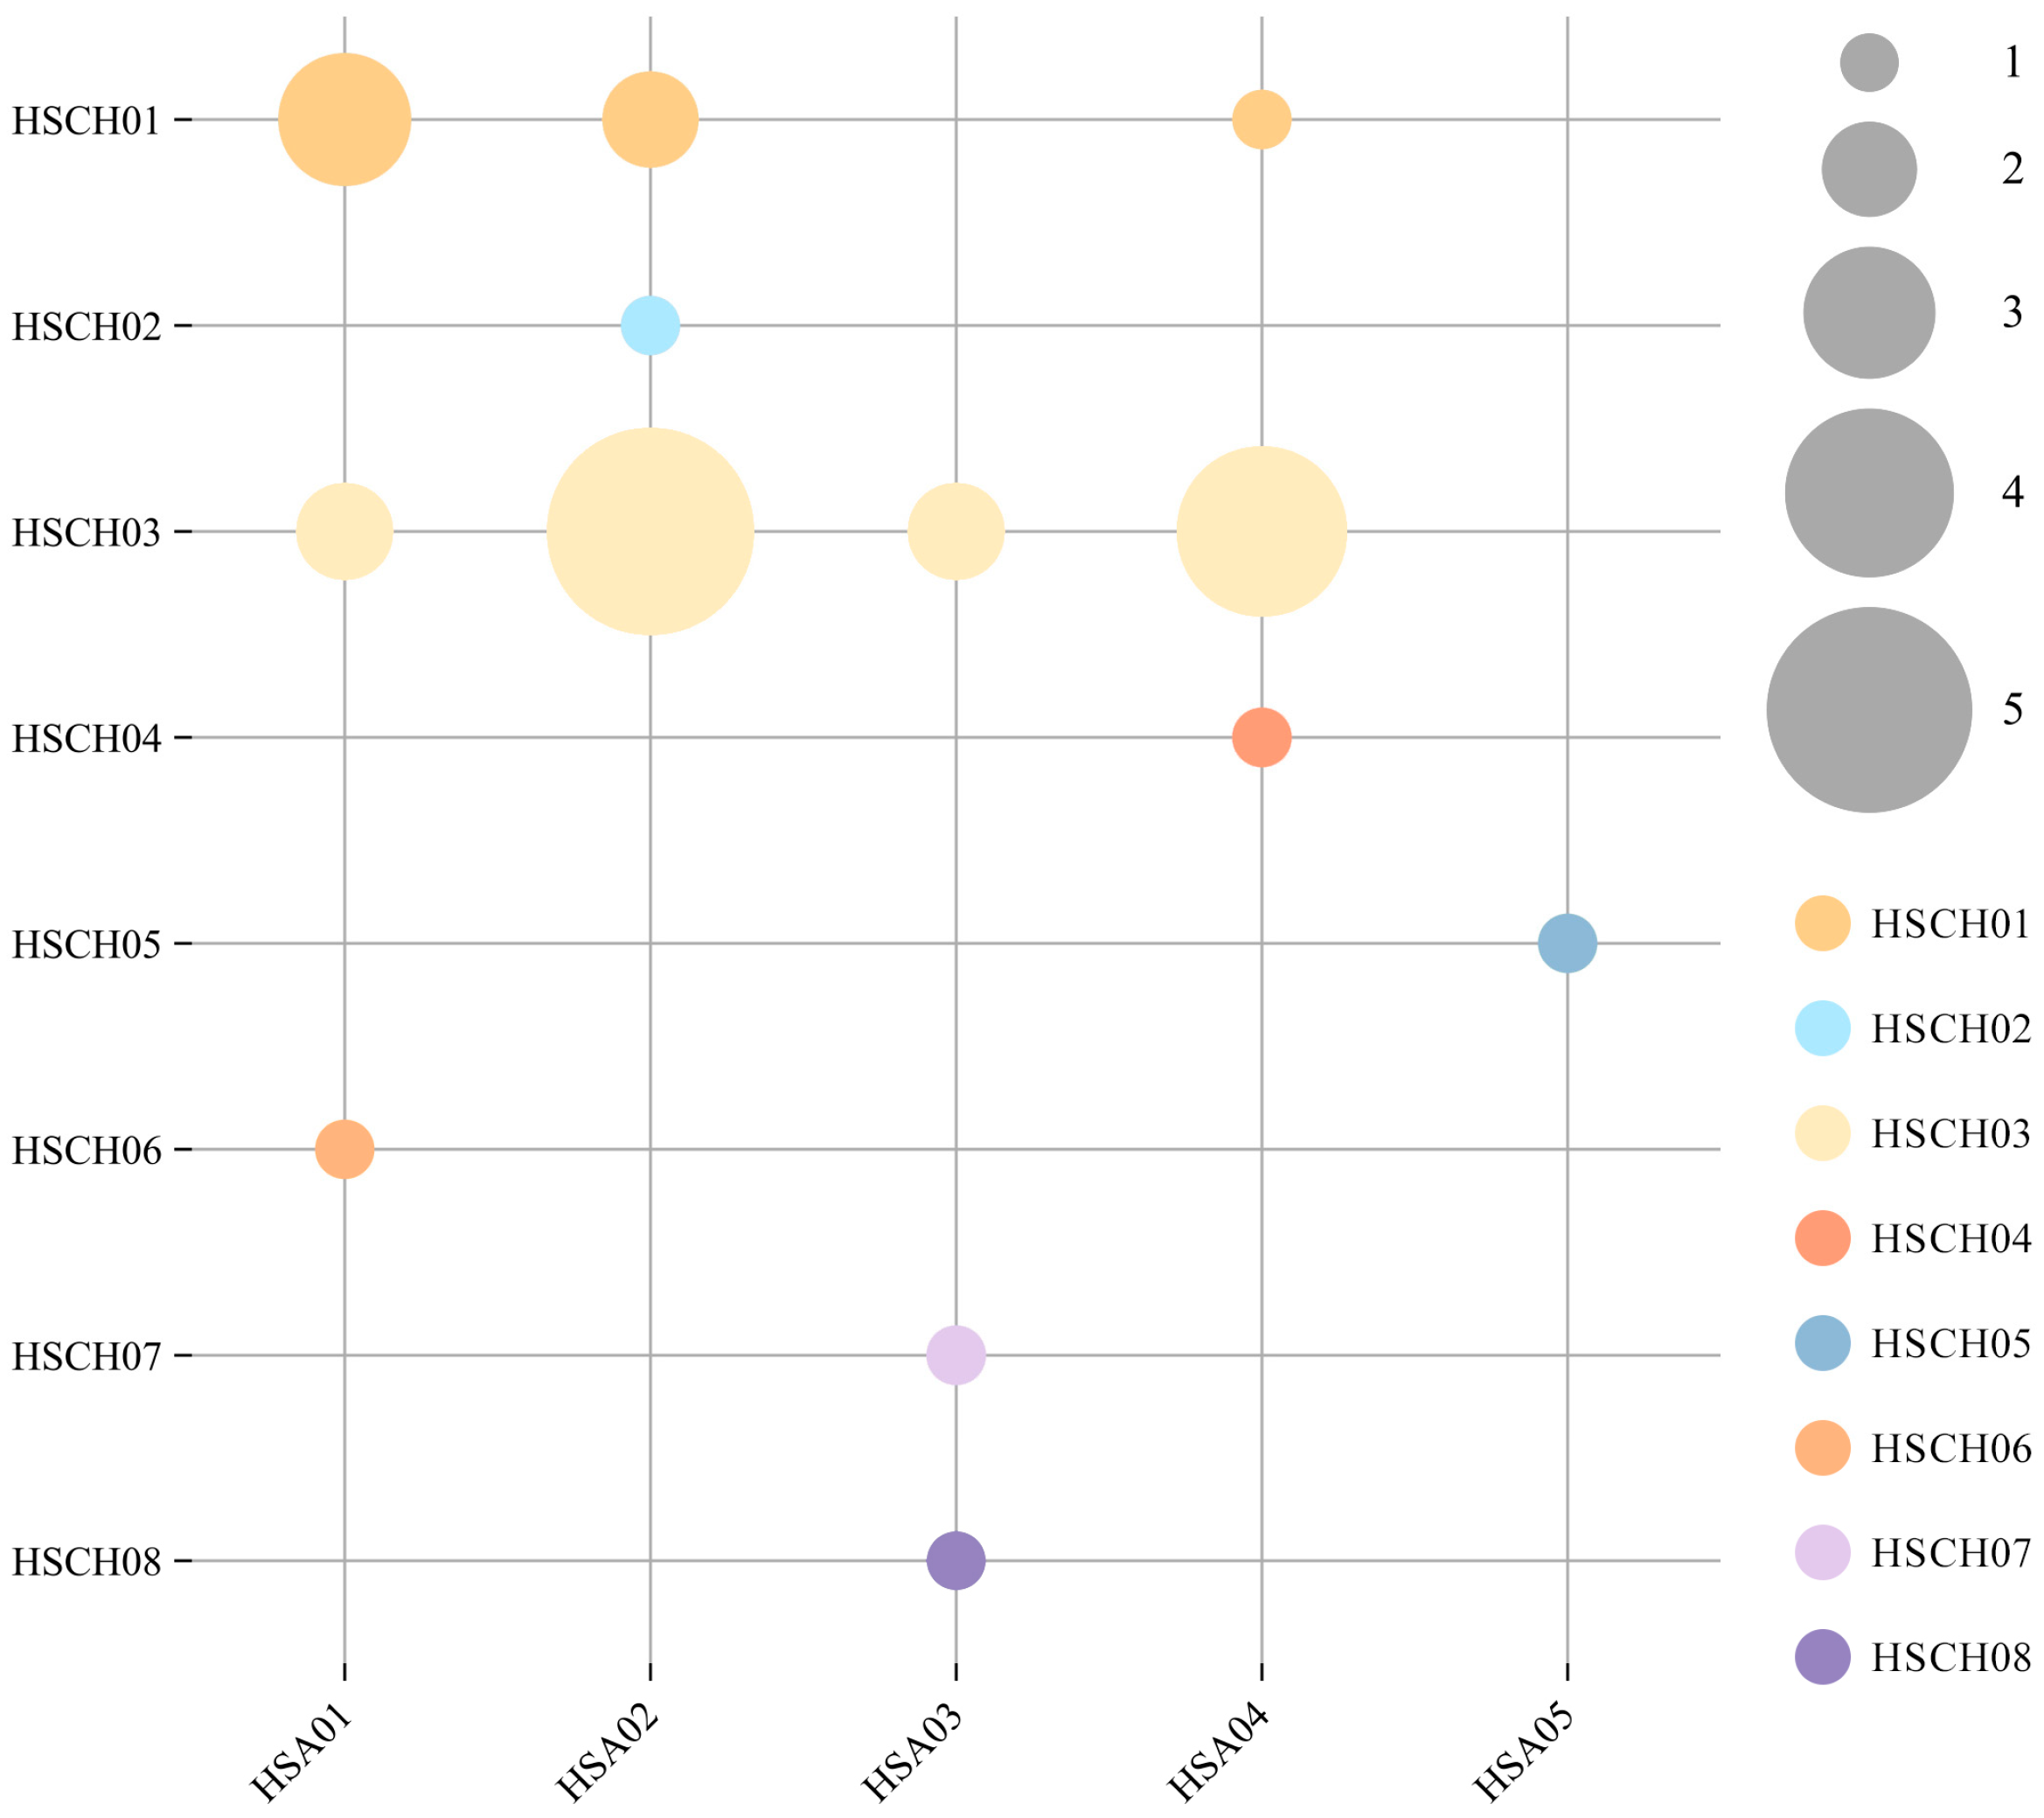
2.3.4. Step 4: Identification of Archetypical Human Settlement Spatio-Temporal Interactions

Examining the coinciding system spatial archetypes and archetypical evolutionary patterns of human settlements facilitated an analysis of their spatial coexistence and inherent correlations. This assessment aimed to understand how the archetypical evolutionary patterns observed from 2001 to 2019 contributed in establishing system spatial archetypes in 2019. This spatio-temporal relationship paved the way for a more in-depth exploration of potential sustainability challenges, drawing insights from the corresponding HSAs and AEPs. The findings and correlations derived from this analysis are expected to offer valuable suggestions and guidance for the future development of local human settlements.

2.4. Data Sources

The study utilized socio-economic datasets and remote sensing datasets. Socio-economic data were sourced from statistical data in the “China Urban Statistical Yearbook” and other regional statistical yearbooks, providing data for 2001 and 2019. In cases where data for 2001 and 2019 were unavailable, the most closely relevant available year’s data were used as a substitute. Remote sensing data were derived from global land cover data from the European Space Agency (ESA), average annual NDVI data from the National Tibetan Plateau Data Center of China (TPDC), and nighttime light intensity data from the Harvard Dataverse. The remote sensing data were processed in ArcGIS using extraction analysis tools based on administrative divisions to derive city-level data. Relevant landscape indices were computed using the Fragstats software based on land cover data. The absolute differences in all 16 indicators from 2001 to 2019 were calculated to quantify the changes in local human settlements. The data were processed using the range normalization method to address issues of differing data dimensions, enabling comparability of indicator changes.

3. Results

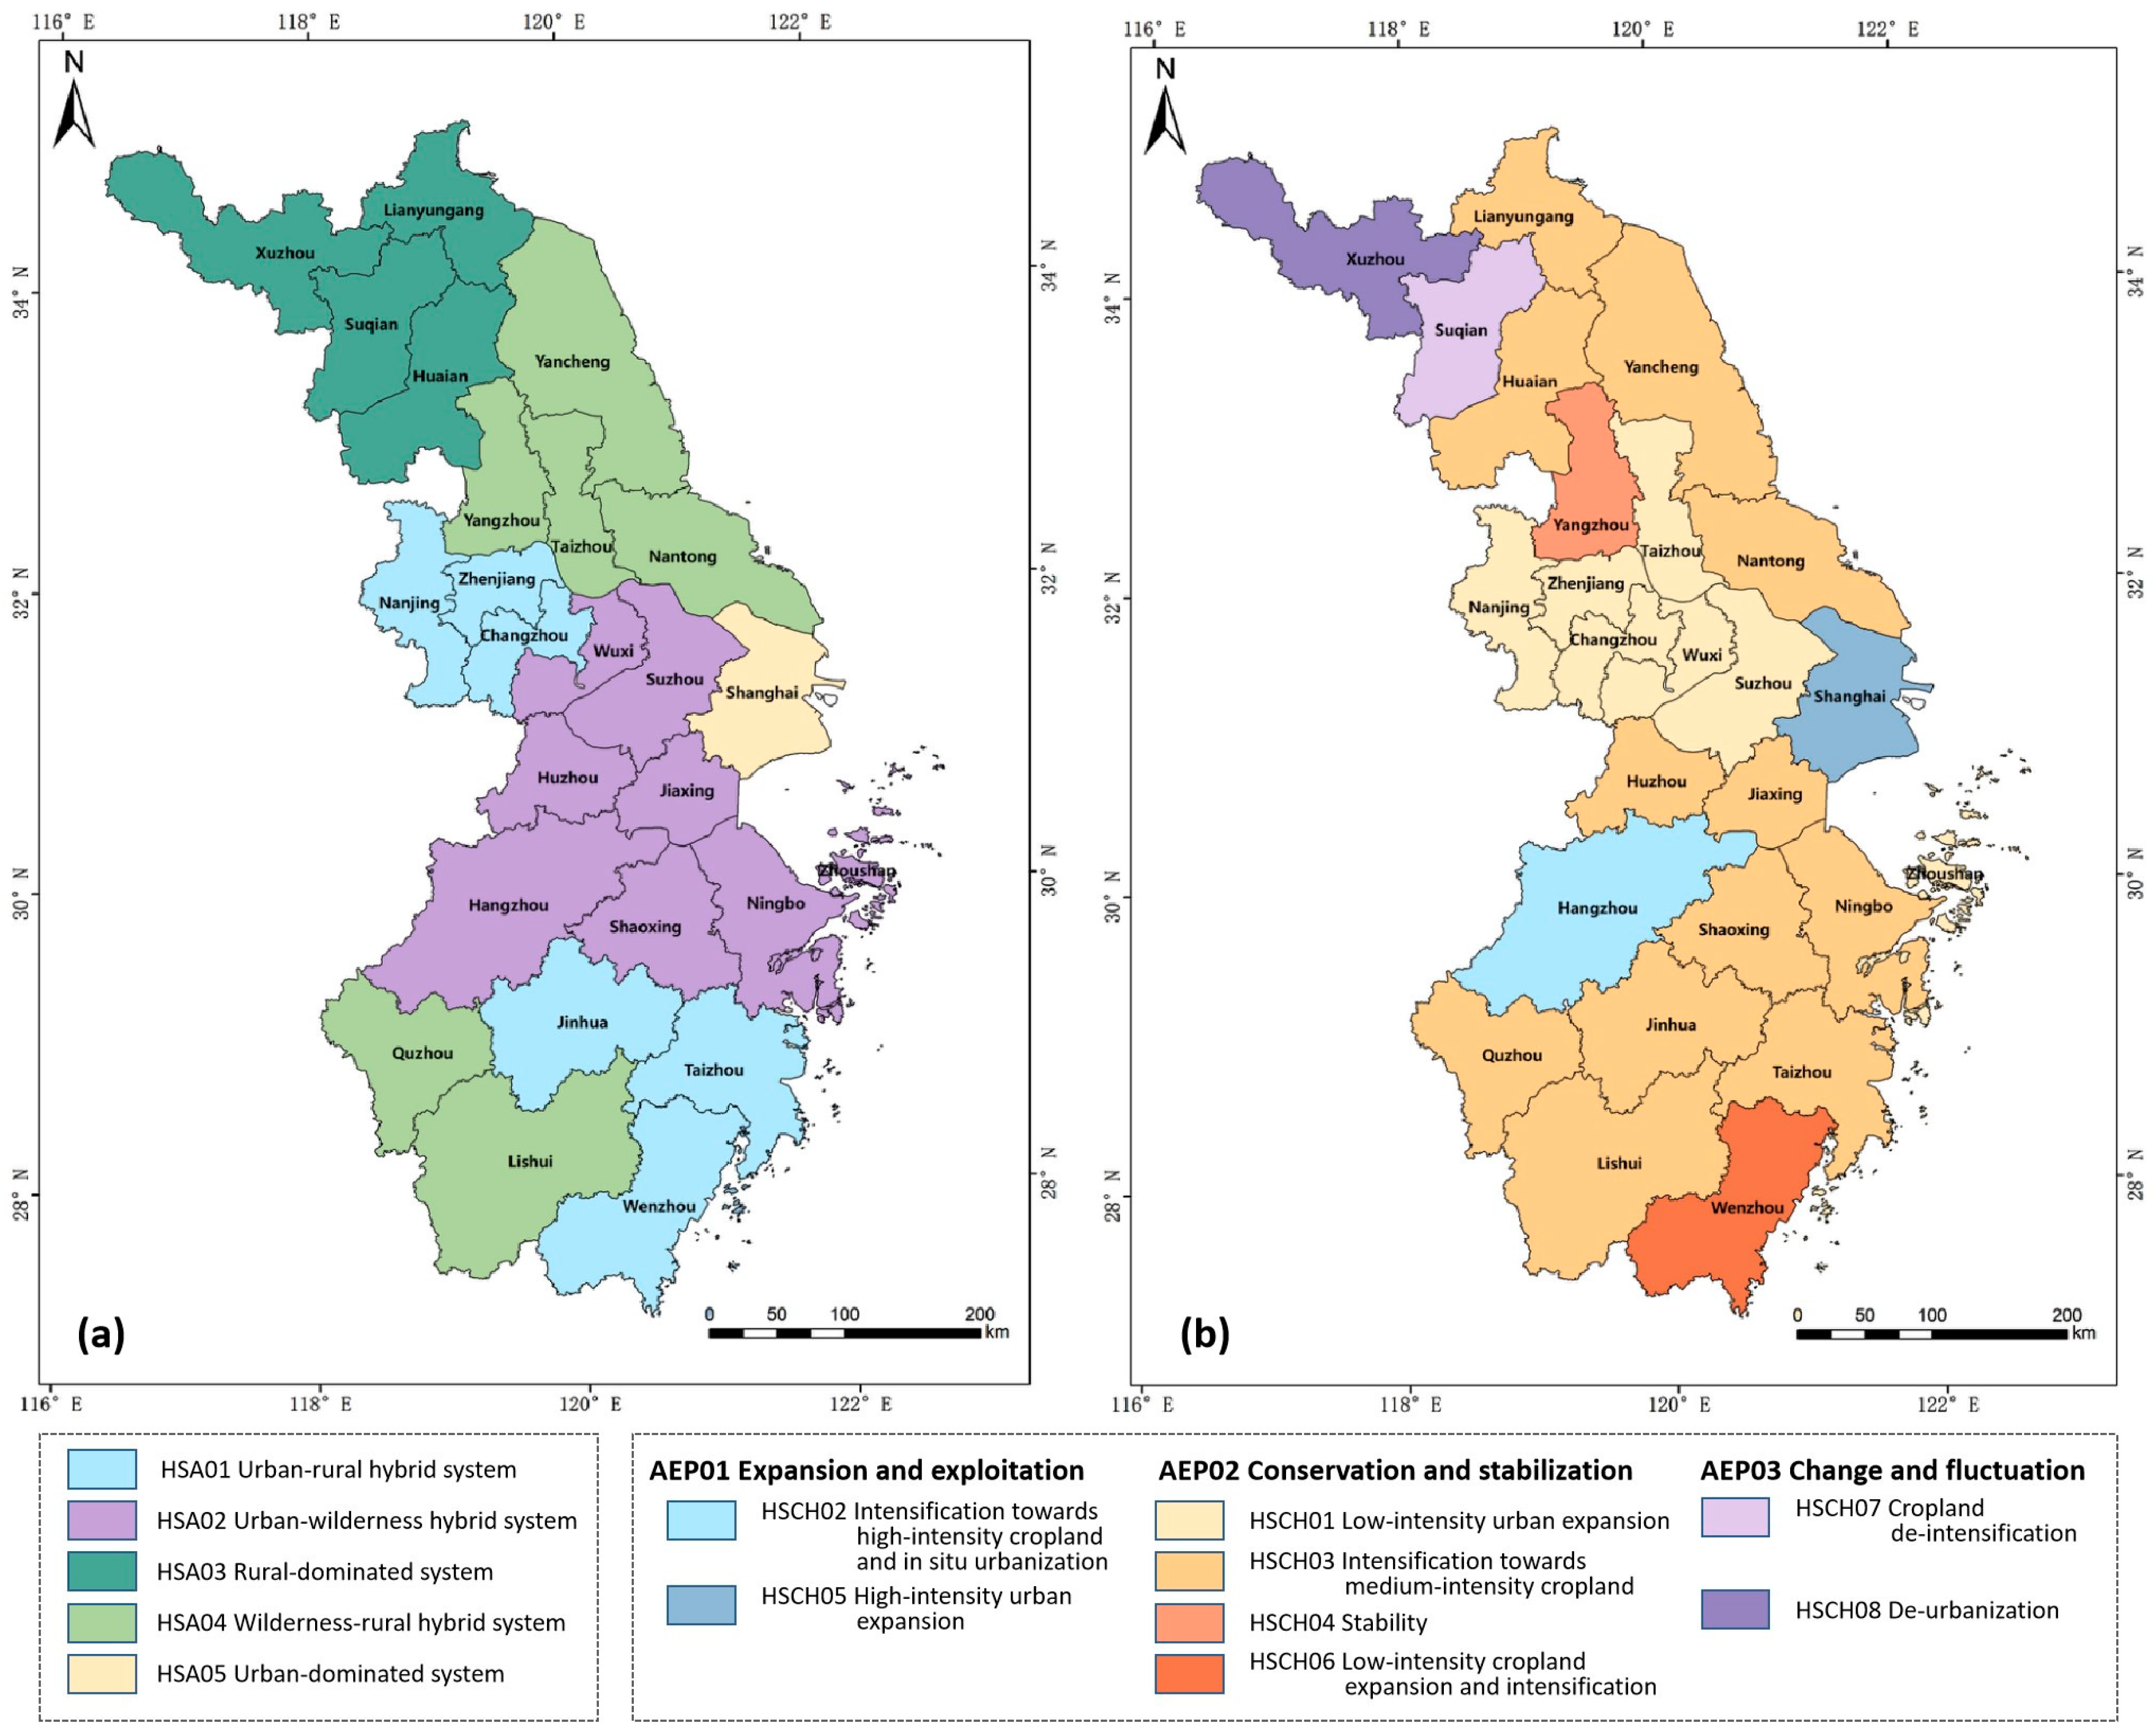
3.1. Detecting and Mapping System Spatial Archetypes of Human Settlements

This study examined system spatial archetypes of human settlements (HSAs), representing recurring patterns of human activity intensity and dominant land interface in the YRD region. Figure 4 shows spatial patterns of the seven indicators in the YRD region. By linking inductively identified human settlement systems into deductive categories of human–nature connectedness, we identified and mapped the spatial distribution of five HSAs (Figure 5a).
Regarding the human activity intensity, HSA01 and HSA02 exhibited population density, urban employment rates, and rural disposable income per capita trending towards the regional average. These HSAs also displayed higher-than-average population birth rates and nighttime light intensity. Therefore, these HSAs reflected a moderate level of human–nature connectedness and were classified as transition HSAs. Furthermore, concerning the dominant land interface, HSA01 showed higher rural and urban spatial proportions than the regional average, while HSA02 indicated higher wilderness and urban spatial proportions. Consequently, HSA01 was further classified as an urban–rural hybrid system and HSA02 as an urban–wilderness hybrid system. HSA03 and HSA04 demonstrated the lowest human activity intensity among all HSAs, representing green-loop HSAs. Specifically, HSA03 was characterized by low economic levels, low governance efficiency, high population birth rates, and a landscape predominantly covered by cropland, thus classified as a rural-dominated system. HSA04 featured the region’s lowest proportion of the artificial surface area, with low population density, low rural disposable income, and high wilderness and rural spatial proportions, holding the region’s highest net primary productivity and low landscape fragmentation. It was classified as a wilderness–rural hybrid system. HSA05 exhibited high population density, nighttime light intensity, and efficient governance, indicating the lowest human–nature connectedness and representing a red-loop HSA. Its wilderness and rural spatial proportions were lower than the regional average, particularly with significantly lower wilderness spatial proportions, leading to a high level of human influence and landscape fragmentation. Therefore, it was classified as an urban-dominated system.
Figure 5a illustrates that human settlement spatial archetypes in the YRD region exhibited distinctive spatial clustering characteristics. The urban–rural hybrid systems (HSA01) were mainly spread across the southwest of Jiangsu Province and the southeast of Zhejiang Province, displaying significantly higher land quality and a 35.3% irrigation area ratio. The urban–wilderness hybrid systems (HSA02) and urban-dominant systems (HSA05) were primarily concentrated in the core area of the YRD Urban Agglomeration. They benefited from strategic locations, convenient transportation, and profound terrain conditions that favor large-scale urban development. HSA02, mainly distributed in the Taihu Basin, Qiantang River Basin, and coastal areas, benefited from valuable wilderness provided by water bodies. The rural-dominated systems (HSA03) were concentrated in the northern region of Jiangsu, located in the plains, providing the most favorable conditions for agricultural production. The wilderness–rural hybrid systems (HSA04) were geographically divided into two clusters. Cities such as Yangzhou, Nantong, Taizhou, and Yancheng in the central part of Jiangsu, extending to the Yellow Sea, connected to the Yangtze River and the Gaoyou Lake and Beijing–Hangzhou Grand Canal, had rich water resources and a higher level of governmental ecological governance, ensuring the stability of their wilderness spaces. Cities like Quzhou and Lishui in the southwest of Zhejiang had a high proportion of mountainous and hilly terrain dominated by forested landscapes. The relatively remote geographical location and natural topography obstacles challenged modern development, restricting urban expansion.

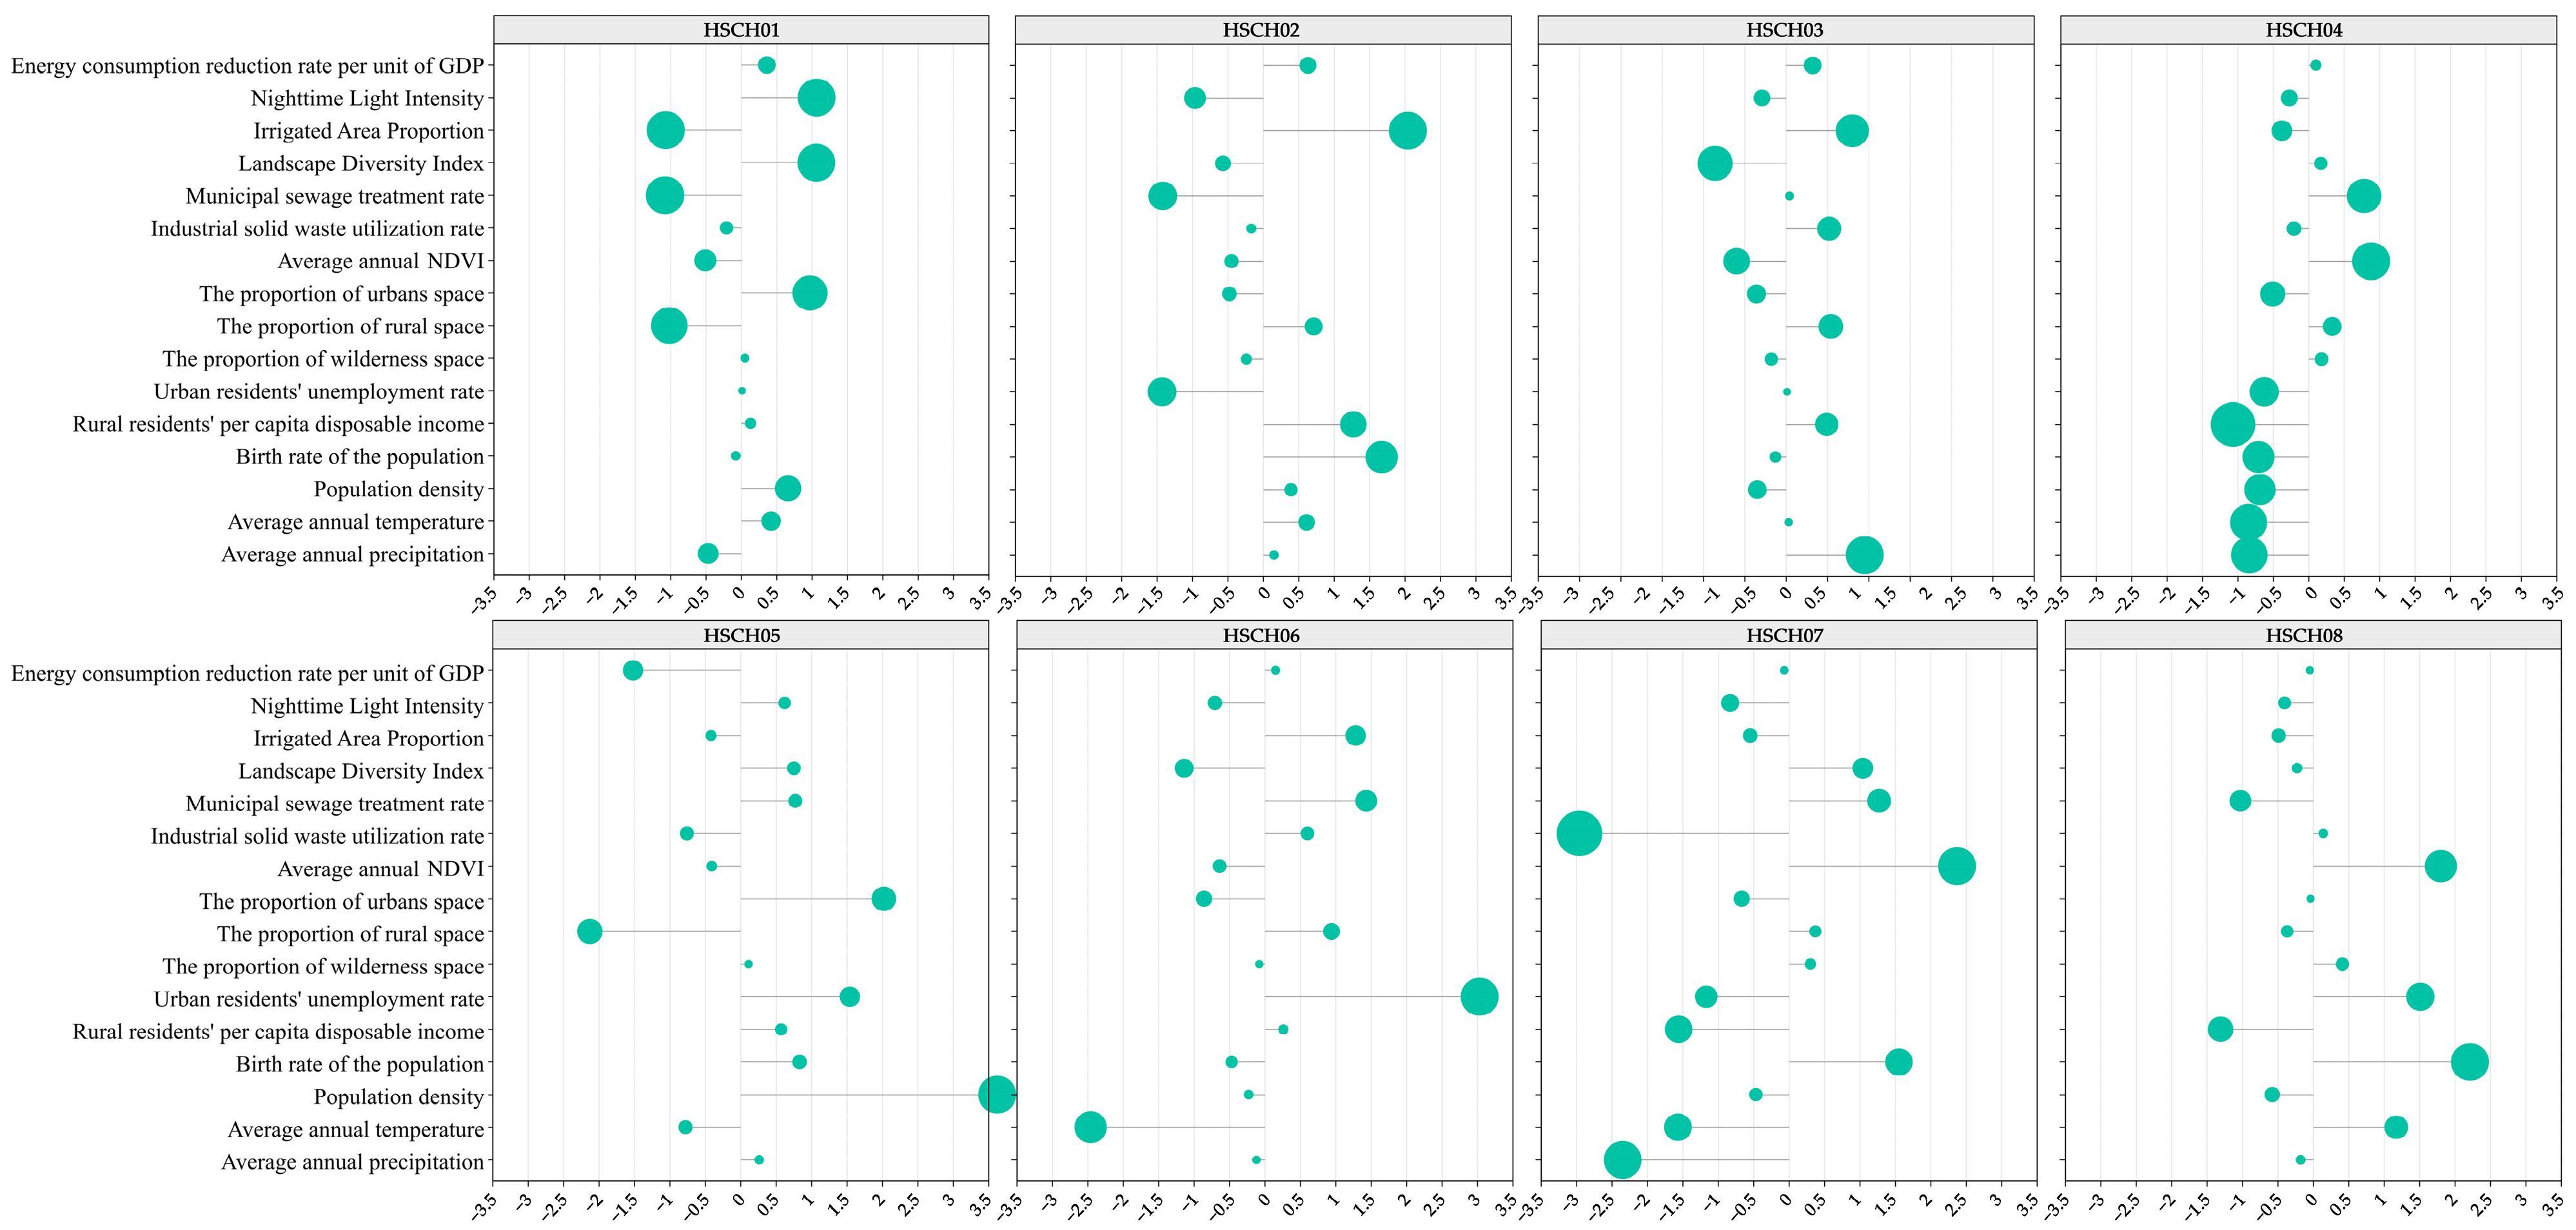
3.2. Detecting and Mapping Archetypical Evolutionary Patterns of Human Settlements

The assessment of human settlement changes from 2001 to 2019 in the YRD region revealed eight typical change patterns (HSCHs), as depicted in Figure 6 and Table 3. As illustrated in Figure 5b, intensification towards medium-intensity cropland (HSCH03) was widely prevalent in the study area, exhibiting the most extensive spatial distribution, covering 116,873 square kilometers of land and accounting for 54.7% of the YRD’s area. Subsequently, low-intensity urban expansion (HSCH01) spanned 33,883 square kilometers of land, occupying 15.9% of the YRD’s area.
Associating the eight distinctive human settlement changes and their correlated indicators with the adaptive cycle framework aids in identifying the archetypical evolutionary patterns (AEPs) in the YRD and dissecting the primary characteristics of each phase. We noted that intensification towards high-intensity cropland and in situ urbanization (HSCH02) exhibited a substantial surge in the irrigated area proportion, significant increases in birth rates and per capita disposable income among rural residents, and a noteworthy decline in urban unemployment rates. High-intensity urban expansion (HSCH05) showcased the most pronounced upswing in population density and urban spatial area. These changes represented the system’s potential for rapid growth, hence, they were categorized as expansion and exploitation. Low-intensity urban expansion (HSCH01), intensification towards medium-intensity cropland (HSCH03), stability (HSCH04), and low-intensity cropland expansion and intensification (HSCH06) display minor increased in per capita disposable income among rural residents, urban employment rates, and nighttime light intensity. At the same time, the proportions of urban, rural, and wilderness areas leaned towards stability. Thereby, they were classified as conservation and stabilization. Cropland de-intensification (HSCH07) demonstrated the most notable decrease in the utilization rate of industrial solid waste and average annual precipitation, with a marked increase in average annual NDVI. De-urbanization (HSCH08) indicated substantial decreases in population density, with growth rates in urban employment and rural residents’ per capita disposable income falling considerably below the urban agglomeration’s average. However, HSCH08’s birth rate had notably risen. These shifts depicted a mounting uncertainty about land use potential and local livelihood development. Thus, this transformation is categorized as change and fluctuation.

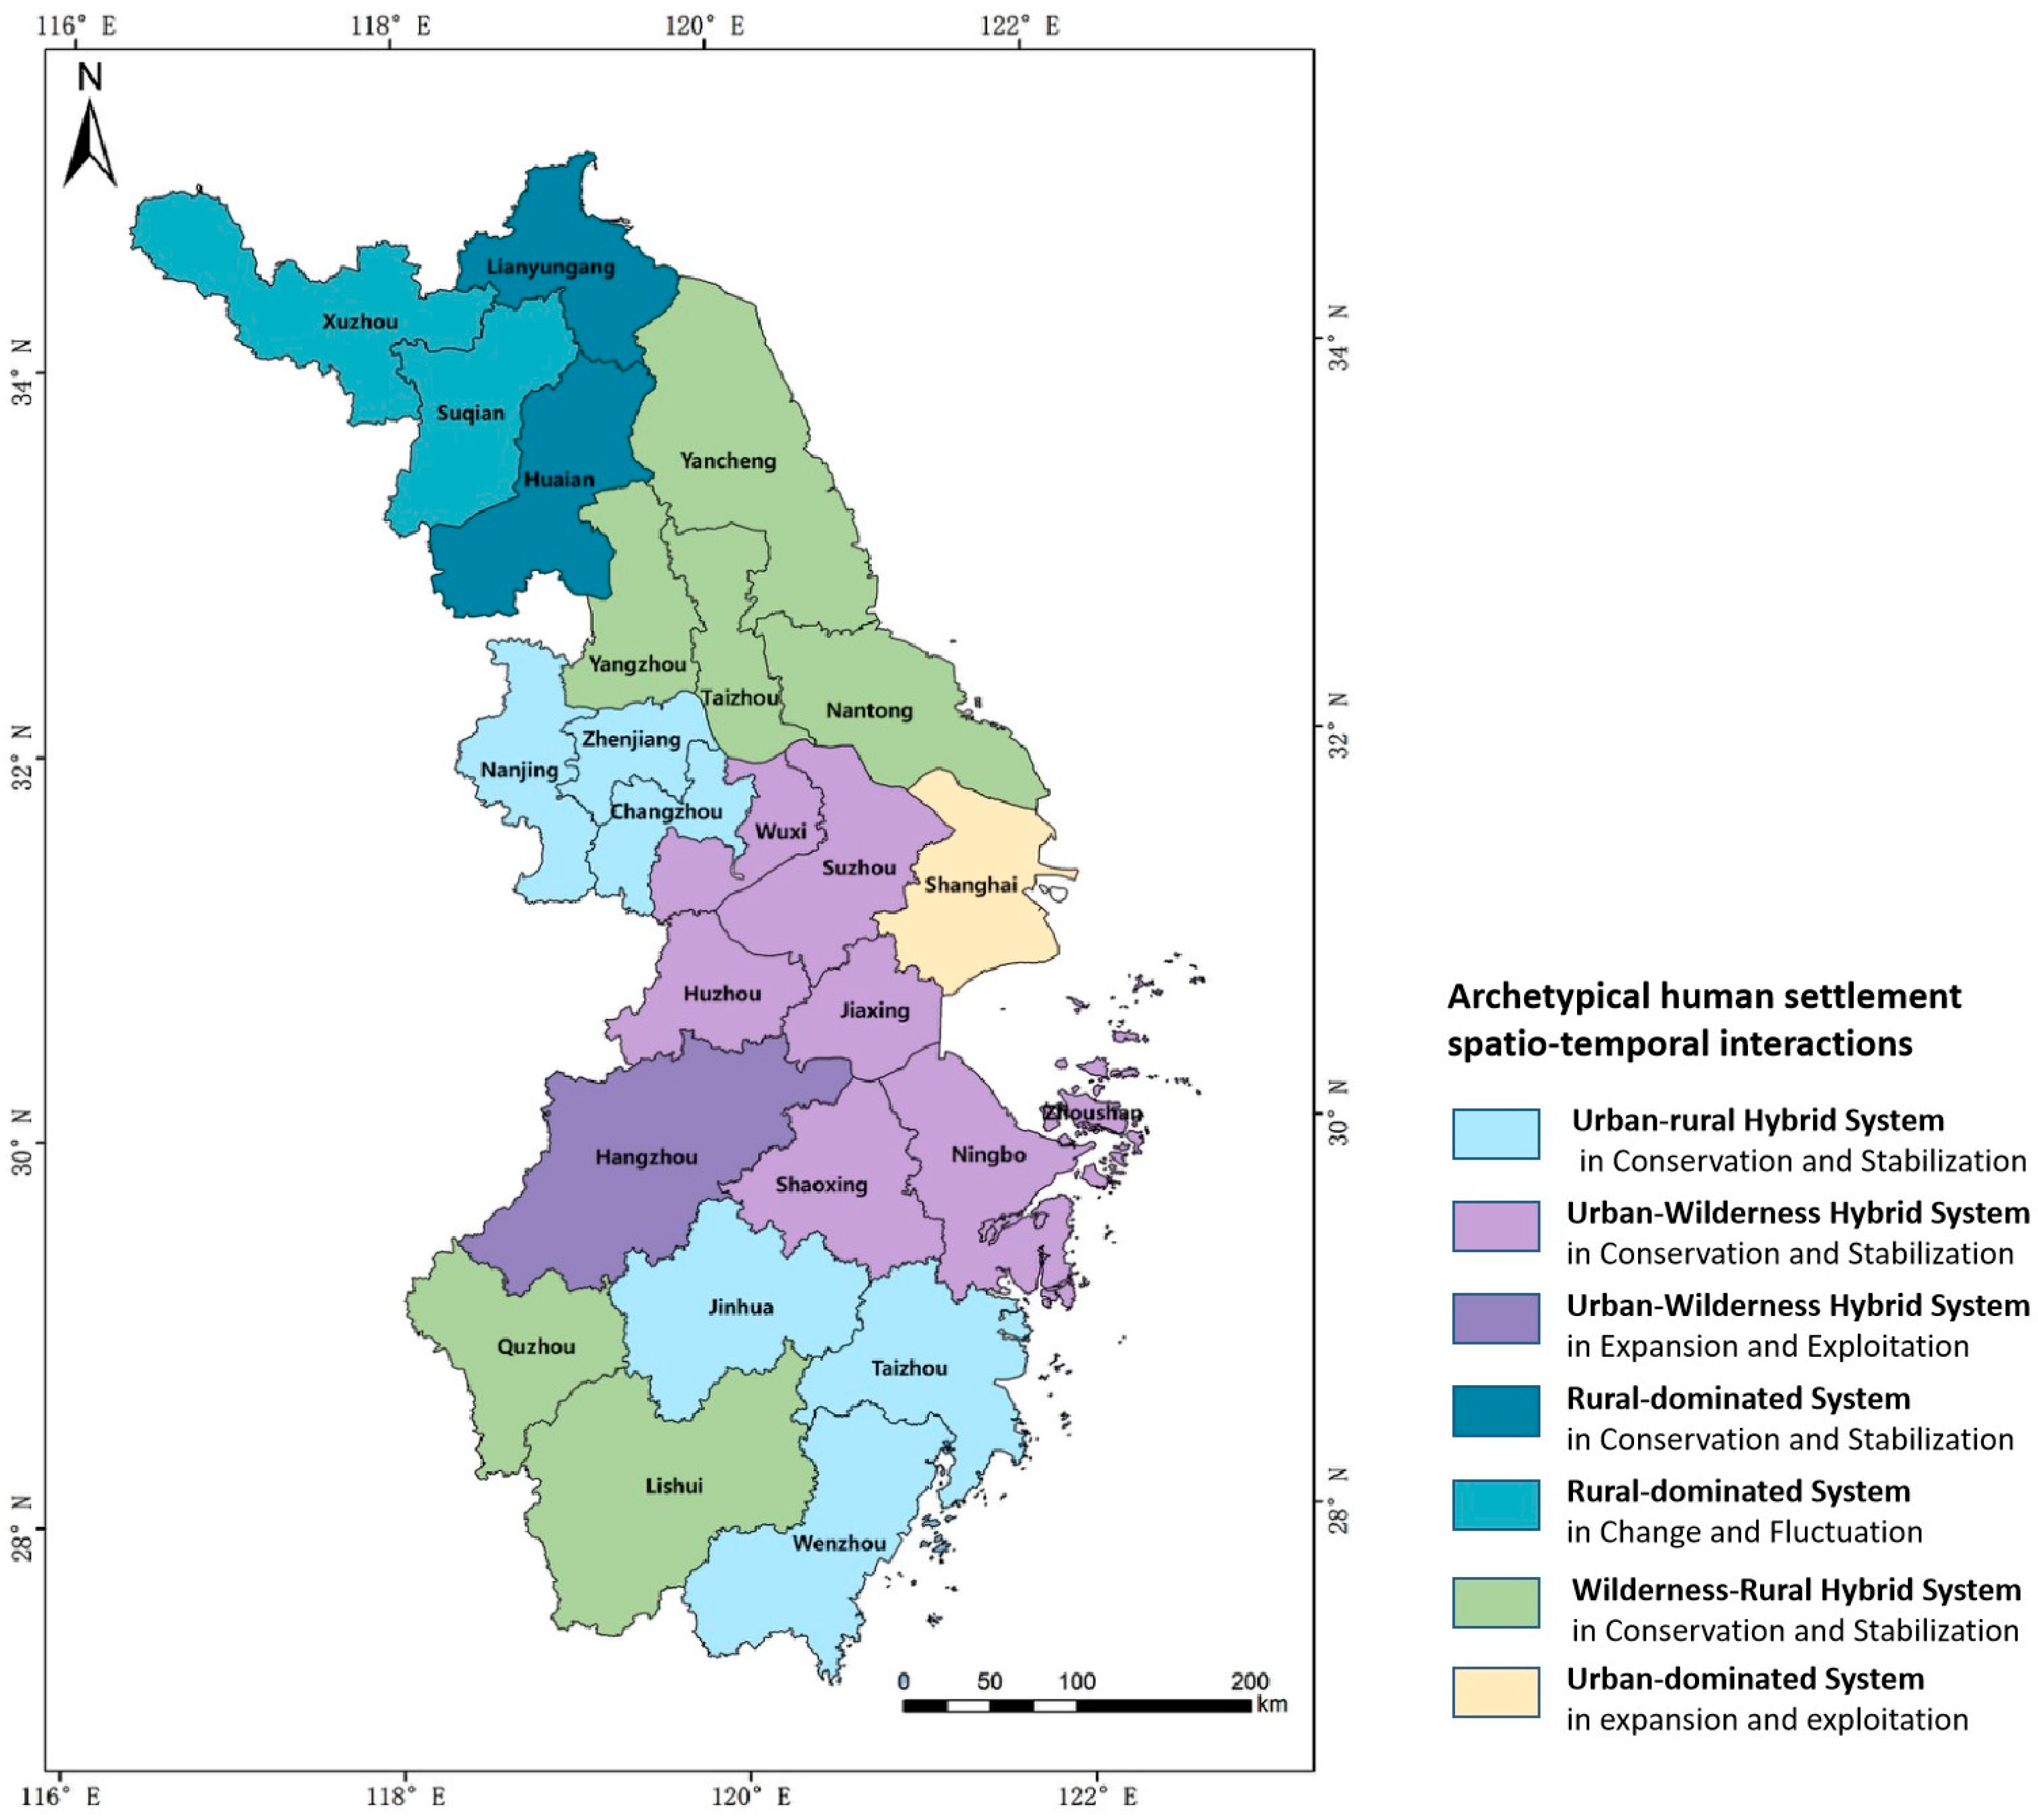
3.3. Archetypical Human Settlement Spatio-Temporal Interactions

Analyzing the spatial overlay between the human settlement spatial archetypes and the typical local human settlement changes aided in identifying typical associations between them (Figure 7). As depicted in Figure 8, intensification towards medium-intensity cropland (HSCH03) exhibited the most extensive archetype influence, affecting four out of five human settlement spatial archetypes.
The typical associations demonstrated that the urban–rural combined system (HSA01) was influenced by low-intensity urban expansion (HSCH01), intensification towards medium-intensity cropland (HSCH03), and low-intensity cropland expansion and intensification (HSCH06). Cities within this archetype were in an evolutionary mode of conservation and stabilization. The urban–wilderness combined system (HSA02) was primarily influenced by low-intensity urban expansion (HSCH01) and intensification towards medium-intensity cropland (HSCH03), maintaining a mode of conservation and stabilization. Only Hangzhou in HSA02 was affected by intensification towards high-intensity cropland and in situ urbanization (HSCH02), positioning it in the mode of expansion and exploitation. The rural-dominated system (HSA03) experienced varied influences in different regions, impacted by intensification towards medium-intensity cropland (HSCH03), cropland de-intensification (HSCH07), and de-urbanization (HSCH08). Thus, the cities in HSA03 were placed in the conservation and stabilization mode or the change and fluctuation mode. The regional human settlement stability was relatively low, indicating a significant imbalance in socio-economic development. The wilderness–rural hybrid system (HSA04) was affected by low-intensity urban expansion (HSCH01), intensification towards medium-intensity cropland (HSCH03), and stability (HSCH04). With weaker system intensity, it maintained stability, positioned in the conservation and stabilization mode. The urban-dominated system (HSA05), represented by Shanghai, was influenced by high-intensity urban expansion (HSCH05). Experiencing dramatic human settlement changes, it fell under the mode of expansion and exploitation.

4. Discussion

4.1. Validation of Human Settlement Archetypes and Archetypical Evolutionary Patterns Mapping

To explore the intricacies of human settlement development as adaptive systems evolve, we identified five system archetypes and three archetypical evolutionary patterns within the specific spatio-temporal context of the YRD region. To demonstrate the validity of our research outcomes, we conducted a comparative analysis with various research results for the Yangtze River Delta area, revealing consistent alignment with previous findings and policy responses.
Firstly, our archetypes’ distinct spatial clustering characteristics align closely with the spatial distribution pattern of the existing cities’ development level in the YRD urban agglomeration. For instance, Zhu et al. observed significant spatial agglomeration characteristics of green building development in the Yangtze River Delta that was concentrated in the southern part of Jiangsu Province and the northern part of Zhejiang Province, with Suzhou and Shanghai as the core [61]. This outcome corresponds to the distribution characteristics of the urban–wilderness hybrid system (HSA02) and the urban-dominant system (HSA05). Additionally, Ye et al. found that Hangzhou had strong economic ties with Shaoxing, Jiaxing, Huzhou, Ningbo, and Suzhou [62], aligning highly with cities identified in HSA02.
Secondly, the developmental trends of cities within the YRD urban agglomeration are consistent with the archetypical evolutionary patterns we identified. Huang et al. identified three distinct city clusters based on the sustainability performance of society, the environment, and the economy. The cluster comprising Shanghai, Suzhou, Wuxi, Changzhou, Nanjing, and Hangzhou achieved high society and economic sustainability but with low environmental sustainability. These cities were also identified in the front loop phases of the adaptive circle in our archetypical evolutionary patterns, characterized by capital accumulation but decreasing environmental resilience [63]. Furthermore, according to Fan et al.’s study, Hangzhou established Fuyang District in 2014, Lin’an District in 2017, and Qiantang New Area in 2019, aiming to address spatial constraints through rapid external expansion, which led to a sprawling form of semi-urbanization [64]. This finding aligns with our identification of Hangzhou as being in an expansion and exploitation pattern.

4.2. Describing Typical Sustainability Challenges Identify Place-Based Development Pathways

The evolution and development of human settlements occur within a dual spatial and temporal dimension. Factors stemming from the natural environment and human communities contribute spatially to forming distinct human settlements with local characteristics and shaping urban–rural–wilderness spatial layout [65]. Moreover, these regional disparities, continuous natural evolution, and human intervention drive human settlements’ ongoing evolution over time [19]. By examining the archetypical spatio-temporal interactions prevalent in the area, we gained insights into the major sustainability challenges in the YRD region, identifying seven place-based development pathways to enhance settlement systems’ sustainability.

4.2.1. Urban–Rural Hybrid System in Conservation and Stabilization: Adaptive Transition of Rural Localities

The urban–rural hybrid system (HSA01) is transitioning from the green-loop to the red-loop. Urban development and specialization foster technological progress, strengthening population growth and urbanization [28]. This transition has led to the geographic expansion of the supply demand range, lowering connectedness to the local ecosystem and reshaping rural landscapes. As a system in conservation and stabilization, HSA01 exhibits resilience decline, as seen through rural hollowing, reduced agricultural areas, loss of rural landscape characteristics, and shifts in social structures based on blood relationships [40,66]. To mitigate imbalances and preserve local cultural identity, an active and positive evolution respecting the needs of rural areas is essential [67].
In future development, these urban–rural hybrid systems need to combine rural local characteristics with modern industry demands, such as integrating modern tourist facilities into traditional rural styles and promoting traditional skills through modern platforms like social media. These actions will give traditional rural features new commercial value, fostering sustainable rural development while protecting their identity. In addition, caution is advised to avoid rural gentrification and prevent drastic restructuring of local symbols by external influences [68].

4.2.2. Urban–Wilderness Hybrid System in Conservation and Stabilization: Livelihood Transition of Natural Resource-Dependent Communities

The urban–wilderness hybrid system (HSA02) experiences a transition from the green-loop to the red-loop. In this process, relying on local ecosystems for resources can no longer meet the growing local demand. Many necessities previously fulfilled by these ecosystems are now sourced from external regions. Consequently, there is a decline in the proportion of individuals directly obtaining goods from ecosystems (such as farmers, fishers, and loggers), potentially reducing their status [28]. Communities reliant on natural resources face significant vulnerability [69]. The modernization development of HSA02 in conservation and stabilization has reached a relatively high level. With the advancement of high-tech industries, tourism services, and further application of modern agricultural technologies, urbanization is progressing steadily. The following developmental phase targets sustainable, high-quality growth supported by governmental policies to restrict excessive exploitation of natural resources [70]. The cities around Taihu Lake, such as Suzhou, Wuxi, Huzhou, and Jiaxing, and the coastal regions, such as Ningbo and Zhoushan, house numerous traditional fishing communities facing climate change and resource depletion crises.
The future development of the urban–wilderness hybrid system should focus on facilitating these communities’ transition to sustainable livelihoods. This involves enhancing residents’ awareness and understanding of climate change, natural resource management, and sustainable development. It also requires developing additional livelihood skills among residents and establishing long-term, adaptable plans for community transformation. Specifically, local residents’ active participation in the planning and executing of these strategies is crucial [71].

4.2.3. Urban–Wilderness Hybrid System in Expansion and Exploitation: Refined Ecological Control

Within the urban–wilderness hybrid system (HSA02), only Hangzhou experiences the influence of high-intensity land consolidation and the urbanization of its periphery (HSCH02), positioning it in an expansion and exploitation evolutionary phase. Drawing from the adaptive cycle theory, the exploitation phase tends to cause local ecological deterioration and degradation due to rapid development and construction, leading to a rapid decline in system resilience [60]. Hangzhou designated the Fuyang district in 2014, the Lin’an district in 2017, and the Qiantang New Area in 2019, employing a rapid outward expansion to address the scarcity of the development space. However, rapid expansion within a short period easily disrupts the local ecological stability due to uncoordinated planning and blind development practices. Consequently, this represents an opportune moment for implementing new ecological management strategies to bolster local resilience [72].
In future development, these urban–wilderness hybrid systems should emphasize establishing ecological red lines and hierarchical control over development intensity to mitigate the risk of human activities disturbing high-value ecological service spaces. Simultaneously, it is vital to avoid further segmentation and erosion of wilderness spaces caused by the construction of transportation infrastructure, maintaining a dynamic balance between urban, rural, and wilderness spaces.

4.2.4. Rural-Dominated System in Conservation and Stabilization: Environmental Pollution Control

The rural-dominated system resides in the green-loop mode. Human activities primarily involve crop cultivation and traditional rural industries, resulting in significant soil and water pollution due to the application of pesticides and fertilizers. In 2019, this system’s urban sewage treatment rate was lower than the regional average. The dominant level of traditional industries, primary heavy industrial structures, and raw material-based product structures result in a low industrial waste comprehensive utilization rate of 89.25%, significantly lower than the regional average of 95.46%. These issues create prominent environmental pollution concerns. The poverty and ecological degradation within this green loop might strengthen each other, leading to a ‘green trap’ [28].
Additionally, systems in the conservation and stabilization phase exhibit lower resilience and are susceptible to rapid changes and fluctuations. Therefore, these rural advantage systems must implement effective environmental pollution control measures to maintain local equilibrium between economic development and environmental protection. Following the full life-cycle environmental risk management concept is crucial, implementing environmental pollution investigations, classified governance, and overall environmental risk control. Coordinating the relationship between wilderness spaces and rural areas, enhancing wilderness space planning protection measures, and restoring degraded, damaged, or destroyed ecosystems is essential to sustain a ‘green-loop’ that avoids long-term ecosystem degradation.

4.2.5. Rural-Dominated System in Change and Fluctuation: Land Remediation and Industrial Transformation

The change and fluctuation pattern represents the most vulnerable phase, potentially leading to an irreversible loss of resilience [73]. Within this pattern, the rural-dominated system primarily focuses on grain supply, with a high proportion of arable land but low land quality, resulting in inefficient land resource utilization. The relationship between rural and urban spaces needs more effective support and driving forces. The economic output function of urban space needs to be improved, with secondary and tertiary industries lagging, making it challenging to coordinate and drive rural space development comprehensively. The average disposable income per rural resident in 2019 was only 18,997 yuan, significantly lower than the average level of 283,100.9 yuan in the YRD urban agglomeration. Simultaneously, the outflow of local populations is a significant issue, with many rural labor forces migrating to more economically developed surrounding areas like southern Jiangsu, leading to an average population density decrease of 34.6 individuals per square kilometer between 2001 and 2019. Urban spaces fail to absorb rural talent effectively. This phase represents an optimal intervention point for local governments or agencies to transition toward a more resilient and sustainable transformation [72].
For a better future, these systems should actively engage in rural space land remediation. Preserve and upgrade natural villages of relatively larger scale and distinctive regional features with some development potential, improve supporting infrastructure, and protect rural natural, cultural, and ecological elements. Gradually consolidate smaller-scale, poorly inhabited villages through village planning to promote the industrialization and scaling of agricultural production. Once these villages are merged, it is time to diversify income sources, such as e-commerce, high-quality tourism, and organic agricultural product chains, to transform rural villages into small towns [72].

4.2.6. Wilderness–Rural Hybrid System in Conservation and Stabilization: Fostering Innovative Industries for Green Development

The wilderness–rural hybrid system is in the green-loop mode, with a high demand for local ecosystems and a high level of human–environment connectedness [28]. HSA04 is in the conservation and stabilization evolutionary pattern. The high ecological service value of aquatic resources, forest resources, and a relatively high level of government ecological governance efficiency ensure the stability of the system’s wilderness spaces, providing a favorable living environment. However, highly connected and self-reinforcing systems are susceptible to resource monopolization and structural preservation due to long-term directed development, leading to a rigidity trap [74].
Therefore, the wilderness–rural hybrid system (HSA04) should focus on nurturing emerging industries that align with local supply–demand relationships to enhance the system’s flexibility in the future development. It could build cross-regional industrial clusters and tourism groups to drive regional economic development. Additionally, there should be a strong emphasis on sustainable development and rational utilization of superior natural resources. With the implementation of dual-evaluation in territorial space, further enhancing the protection and management of high ecological service value spaces is essential.

4.2.7. Urban-Dominated System in Expansion and Exploitation: Enhancing Landscape Patterns and Agricultural System Resilience

The urban-dominated system, exemplified by Shanghai, is in the red-loop, signifying a disconnection between its inhabitants and the local ecosystems. Its development relies on the surrounding regions for food supplies and ecological balance. Overconsumption within the red loop and failing to regulate ecological decline could result in a ‘red trap’ [28]. Since the 21st century, HSA05 has undergone intense urban expansion, leading to drastic environmental changes and positioning it in an expansion and exploitation evolutionary pattern. This system exhibits the highest population density and economic output, exerting the most substantial anthropogenic influence, with a population density of 3830 individuals per square kilometer and an artificial surface area reaching 30.9%. The high concentration of people has led to a singular habitat, reducing the resilience of its living environment.
The shortage of natural land makes this system extremely vulnerable to natural disasters such as extreme heat, air pollution, and urban flooding [75]. Thus, development and construction efforts should optimize the urban landscape by incorporating ecological patches and corridors to enhance its ecosystem regulation functions. This strategy aims to prevent the urban system from falling into the ‘red trap’ [76]. Simultaneously, the concentrated distribution and inadequate permeation of rural spaces have resulted in the region’s heavy reliance on Chongming and surrounding areas for food supply, posing challenges to food security. Given the uncertainties and risks of the post-pandemic era, Shanghai’s existing food supply system faces significant challenges.
Consequently, future development should emphasize land reclamation, enhance the quality of arable land, improve agricultural production conditions, and increase agricultural spaces within the city. This approach, combined with the ‘dual carbon’ goal, aims to drive the integration of agricultural activities within the city to address public concerns regarding environmental friendliness, social welfare, community development, and food security. This integration is crucial for promoting the sustainable development of the urban-dominated system.

5. Conclusions

This study developed a novel approach for assessing and characterizing human settlements by treating a city’s human settlement as an integrated social–ecological system, employing a spatio-temporal two-tier structure archetype analysis that combines system spatial archetypes with archetypal evolutionary patterns. The application of this approach to the Yangtze River Delta region in China yielded significant findings, including (1) the identification of five system spatial archetypes of human settlements displaying noticeable spatial clustering within the region, (2) the recognition of eight typical human settlement changes and three archetypical evolutionary patterns in the region; and (3) identification of seven archetypical human settlement spatio-temporal interactions prevalent in the study area. These findings provided invaluable insights into understanding the sustainability challenges of each typical interaction within its distinct spatio-temporal context. Moreover, the study proposed place-based development solutions to address local sustainability challenges in the Yangtze River Delta region, encompassing adaptive measures for rural localities, sustainable livelihood transitions, ecological control, pollution management, land remediation and industrial transformation, green development initiatives, and enhancements in landscape patterns and agricultural system resilience. This gives valuable insights into the human settlement development of the area grappling with rapid urbanization and climate change.
Specifically, our methodology allows for (1) the integration of inductive and deductive perspectives, ensuring both general applicability and specific interpretative capacity in archetype analysis; (2) the combination of typical spatial patterns and temporal changes of human settlements to deepen the understanding of human settlement development within specific spatial differentiation and temporal evolution contexts; (3) the linkage of inductive change patterns to existing deductive phases within the adaptive cycle to enhance insights into potential evolution risks of human settlements. Further, our approach supports the identification of local sustainability challenges, such as emerging social–ecological traps or potential shifts in evolution, to explore sustainable development pathways in a place-based context. Ultimately, it contributes to understanding and addressing human settlement challenges at the local level within the broader context of global sustainability issues.

Author Contributions

Conceptualization, W.G. and B.L.; methodology, W.G.; software, W.G.; validation, W.G.; formal analysis, W.G.; investigation, W.G.; resources, W.G.; data curation, W.G. and W.L.; writing—original draft preparation, W.G.; writing—review and editing, W.G.; visualization, W.G. and W.L.; supervision, B.L.; project administration, B.L.; funding acquisition, B.L. All authors have read and agreed to the published version of the manuscript.

Funding

This research was funded by the National Natural Science Foundation of China (Grant No. 52130804).

Data Availability Statement

Data are contained within the article.

Conflicts of Interest

The authors declare no conflict of interest.

Abbreviations

AcronymsMeaning
AEPHuman Settlement Archetypical Evolutionary Pattern
ESAEuropean Space Agency
HAIHuman Activity Intensity
HSAHuman Settlement System Spatial Archetype
HSCHTypical Human Settlement Changes
MCEMulti-Criteria Evaluation
NUANew Urban Agenda
SDGSustainable Development Goals
SESSocial-Ecological System
TPDCNational Tibetan Plateau Data Center of China
YRDYangtze River Delta

References

  1. Shen, L.; Shuai, C.; Jiao, L.; Tan, Y.; Song, X. Dynamic Sustainability Performance during Urbanization Process between BRICS Countries. Habitat Int. 2017, 60, 19–33. [Google Scholar] [CrossRef]
  2. Tang, L.; Ruth, M.; He, Q.; Mirzaee, S. Comprehensive Evaluation of Trends in Human Settlements Quality Changes and Spatial Differentiation Characteristics of 35 Chinese Major Cities. Habitat Int. 2017, 70, 81–90. [Google Scholar] [CrossRef]
  3. Shekhar, H.; Schmidt, A.J.; Wehling, H.-W. Exploring Wellbeing in Human Settlements—A Spatial Planning Perspective. Habitat Int. 2019, 87, 66–74. [Google Scholar] [CrossRef]
  4. United Nations—Sustainable Development Actions 2015. Available online: http://www.un.org/sustainabledevelopment/cities/ (accessed on 11 June 2023).
  5. New Urban Agenda. Available online: https://habitat3.org/documents-and-archive/new-urban-agenda/ (accessed on 11 June 2023).
  6. Reed, W.J. On the Rank-Size Distribution for Human Settlements. J. Reg. Sci. 2002, 42, 1–17. [Google Scholar] [CrossRef]
  7. Wang, Y.; Jin, C.; Lu, M.; Lu, Y. Assessing the Suitability of Regional Human Settlements Environment from a Different Preferences Perspective: A Case Study of Zhejiang Province, China. Habitat Int. 2017, 70, 1–12. [Google Scholar] [CrossRef]
  8. Muriuki, G.; Seabrook, L.; McAlpine, C.; Jacobson, C.; Price, B.; Baxter, G. Land Cover Change under Unplanned Human Settlements: A Study of the Chyulu Hills Squatters, Kenya. Landsc. Urban Plan. 2011, 99, 154–165. [Google Scholar] [CrossRef]
  9. Kim, H.; Woosnam, K.M.; Marcouiller, D.W.; Aleshinloye, K.D.; Choi, Y. Residential Mobility, Urban Preference, and Human Settlement: A South Korean Case Study. Habitat Int. 2015, 49, 497–507. [Google Scholar] [CrossRef]
  10. Ali, S.H.; Fallah, M.P.; McCarthy, J.M.; Keil, R.; Connolly, C. Mobilizing the Social Infrastructure of Informal Settlements in Infectious Disease Response—The Case of Ebola Virus Disease in West Africa. Landsc. Urban Plan. 2022, 217, 104256. [Google Scholar] [CrossRef]
  11. Qu, L.; Li, Y.; Feng, W. Spatial-Temporal Differentiation of Ecologically-Sustainable Land across Selected Settlements in China: An Urban-Rural Perspective. Ecol. Indic. 2020, 112, 105783. [Google Scholar] [CrossRef]
  12. An, N.; Yao, Q.; Shen, Q. A Review of Human Settlement Research on Climate Change Response under Carbon-Oriented: Literature Characteristics, Progress and Trends. Buildings 2022, 12, 1614. [Google Scholar] [CrossRef]
  13. Liu, R.; Zhang, L.; Tang, Y.; Jiang, Y. Understanding and Evaluating the Resilience of Rural Human Settlements with a Social-Ecological System Framework: The Case of Chongqing Municipality, China. Land Use Policy 2024, 136, 106966. [Google Scholar] [CrossRef]
  14. Biggs, R.; Preiser, R.; De Vos, A.; Schlüter, M.; Maciejewski, K.; Clements, H. The Routledge Handbook of Research Methods for Social-Ecological Systems, 1st ed.; Routledge: London, UK, 2021; ISBN 978-1-00-302133-9. [Google Scholar]
  15. Grove, J.M. Cities: Managing Densely Settled Social-Ecological Systems. In Principles of Ecosystem Stewardship: Resilience-Based Natural Resource Management in a Changing World; Folke, C., Kofinas, G.P., Chapin, F.S., Eds.; Springer: New York, NY, USA, 2009; pp. 281–294. ISBN 978-0-387-73033-2. [Google Scholar]
  16. Yin, J.; Wang, D.; Li, H. Spatial Optimization of Rural Settlements in Ecologically Fragile Regions: Insights from a Social-Ecological System. Habitat Int. 2023, 138, 102854. [Google Scholar] [CrossRef]
  17. Tyson, W. Using Social-Ecological Systems Theory to Evaluate Large-Scale Comanagement Efforts: A Case Study of the Inuvialuit Settlement Region. Ecol. Soc. 2017, 22, 5. [Google Scholar] [CrossRef]
  18. Herzog, L.; Tanguay, L.; Beisner, B.E.; Pahl-Wostl, C.; Audet, R.; Schlüter, M. Studying Human-Nature Relations in Aquatic Social-Ecological Systems Using the Social-Ecological Action Situations Framework: How to Move from Empirical Data to Conceptual Models. Ecol. Soc. 2022, 27, 7. [Google Scholar] [CrossRef]
  19. Antoni, C.; Huber-Sannwald, E.; Reyes Hernández, H.; van’t Hooft, A.; Schoon, M. Socio-Ecological Dynamics of a Tropical Agricultural Region: Historical Analysis of System Change and Opportunities. Land Use Policy 2019, 81, 346–359. [Google Scholar] [CrossRef]
  20. Ameen, R.F.M.; Mourshed, M. Urban Sustainability Assessment Framework Development: The Ranking and Weighting of Sustainability Indicators Using Analytic Hierarchy Process. Sustain. Cities Soc. 2019, 44, 356–366. [Google Scholar] [CrossRef]
  21. Kaur, H.; Garg, P. Urban Sustainability Assessment Tools: A Review. J. Clean. Prod. 2019, 210, 146–158. [Google Scholar] [CrossRef]
  22. Vidal Merino, M.; Sietz, D.; Jost, F.; Berger, U. Archetypes of Climate Vulnerability: A Mixed-Method Approach Applied in the Peruvian Andes. Clim. Dev. 2019, 11, 418–434. [Google Scholar] [CrossRef]
  23. Václavík, T.; Lautenbach, S.; Kuemmerle, T.; Seppelt, R. Mapping Global Land System Archetypes. Glob. Environ. Chang. 2013, 23, 1637–1647. [Google Scholar] [CrossRef]
  24. Rocha, J.; Malmborg, K.; Gordon, L.; Brauman, K.; DeClerck, F. Mapping Social-Ecological Systems Archetypes. Environ. Res. Lett. 2020, 15, 034017. [Google Scholar] [CrossRef]
  25. Fischer-Kowalski, M.; Krausmann, F.; Pallua, I. A Sociometabolic Reading of the Anthropocene: Modes of Subsistence, Population Size and Human Impact on Earth. Anthr. Rev. 2014, 1, 8–33. [Google Scholar] [CrossRef]
  26. Sietz, D.; Frey, U.; Roggero, M.; Gong, Y.; Magliocca, N.; Tan, R.; Janssen, P.; Václavík, T. Archetype Analysis in Sustainability Research: Methodological Portfolio and Analytical Frontiers. Ecol. Soc. 2019, 24, 34. [Google Scholar] [CrossRef]
  27. Oberlack, C.; Sietz, D.; Bonanomi, E.B.; de Bremond, A.; Dell’Angelo, J.; Eisenack, K.; Ellis, E.C.; Epstein, G.; Giger, M.; Heinimann, A.; et al. Archetype Analysis in Sustainability Research: Meanings, Motivations, and Evidence-Based Policy Making. Ecol. Soc. 2019, 24, 26. [Google Scholar] [CrossRef]
  28. Cumming, G.S.; Buerkert, A.; Hoffmann, E.M.; Schlecht, E.; von Cramon-Taubadel, S.; Tscharntke, T. Implications of Agricultural Transitions and Urbanization for Ecosystem Services. Nature 2014, 515, 50–57. [Google Scholar] [CrossRef] [PubMed]
  29. Goodwin, C.E.D.; Bütikofer, L.; Hatfield, J.H.; Evans, P.M.; Bullock, J.M.; Storkey, J.; Mead, A.; Richter, G.M.; Henrys, P.A.; Pywell, R.F.; et al. Multi-Tier Archetypes to Characterise British Landscapes, Farmland and Farming Practices. Environ. Res. Lett. 2022, 17, 095002. [Google Scholar] [CrossRef]
  30. Sietz, D.; Ordoñez, J.C.; Kok, M.T.J.; Janssen, P.; Hilderink, H.B.M.; Tittonell, P.; Dijk, H.V. Nested Archetypes of Vulnerability in African Drylands: Where Lies Potential for Sustainable Agricultural Intensification? Environ. Res. Lett. 2017, 12, 095006. [Google Scholar] [CrossRef]
  31. Yang, Y.; Bao, W.; de Sherbinin, A. Mapping Fine-Resolution Nested Social-Ecological System Archetypes to Reveal Archetypical Human-Environmental Interactions. Landsc. Urban Plan. 2023, 239, 104863. [Google Scholar] [CrossRef]
  32. Meyfroidt, P.; Roy Chowdhury, R.; de Bremond, A.; Ellis, E.C.; Erb, K.-H.; Filatova, T.; Garrett, R.D.; Grove, J.M.; Heinimann, A.; Kuemmerle, T.; et al. Middle-Range Theories of Land System Change. Glob. Environ. Chang. 2018, 53, 52–67. [Google Scholar] [CrossRef]
  33. Pacheco-Romero, M.; Kuemmerle, T.; Levers, C.; Alcaraz-Segura, D.; Cabello, J. Integrating Inductive and Deductive Analysis to Identify and Characterize Archetypical Social-Ecological Systems and Their Changes. Landsc. Urban Plan. 2021, 215, 104199. [Google Scholar] [CrossRef]
  34. Dorninger, C.; Abson, D.J.; Fischer, J.; Wehrden, H. von Assessing Sustainable Biophysical Human–Nature Connectedness at Regional Scales. Environ. Res. Lett. 2017, 12, 055001. [Google Scholar] [CrossRef]
  35. Fischer, J.; Abson, D.J.; Bergsten, A.; Collier, N.F.; Dorresteijn, I.; Hanspach, J.; Hylander, K.; Schultner, J.; Senbeta, F. Reframing the Food–Biodiversity Challenge. Trends Ecol. Evol. 2017, 32, 335–345. [Google Scholar] [CrossRef]
  36. Cremades, R.; Surminski, S.; Máñez Costa, M.; Hudson, P.; Shrivastava, P.; Gascoigne, J. Using the Adaptive Cycle in Climate-Risk Insurance to Design Resilient Futures. Nat. Clim Chang. 2018, 8, 4–7. [Google Scholar] [CrossRef]
  37. Holling, C.S. Understanding the Complexity of Economic, Ecological, and Social Systems. Ecosystems 2001, 4, 390–405. [Google Scholar] [CrossRef]
  38. Fath, B.D.; Dean, C.A.; Katzmair, H. Navigating the Adaptive Cycle: An Approach to Managing the Resilience of Social Systems. Ecol. Soc. 2015, 20, 24. [Google Scholar] [CrossRef]
  39. Wilbanks, T.J. Integrating Climate Change and Sustainable Development in a Place-Based Context. Clim. Policy 2003, 3, S147–S154. [Google Scholar] [CrossRef]
  40. Tan, S.; Hu, B.; Kuang, B.; Zhou, M. Regional Differences and Dynamic Evolution of Urban Land Green Use Efficiency within the Yangtze River Delta, China. Land Use Policy 2021, 106, 105449. [Google Scholar] [CrossRef]
  41. Gottmann, J. The Present Renewal of Mankind’s Habitat: An Overview of Present Trends of Urbanization around the World. Habitat Int. 1976, 1, 157–163. [Google Scholar] [CrossRef]
  42. Liu, B. The Trialism and Application of Human Settlement, Inhabitation and Travel Environment Studies: Applications in Water-Net Region; Springer Nature: Singapore, 2023; ISBN 978-981-19914-2-4. [Google Scholar]
  43. Wang, Y.; Liu, B. Chinese Rural Landscape and Rural Landscape Planning in China. Chin. Landsc. Archit. 2003, 19, 55–58. [Google Scholar]
  44. Dudley, N. Guidelines for Applying Protected Area Management Categories; IUCN: Gland, Switzerland, 2008; ISBN 978-2-8317-1086-0. [Google Scholar]
  45. Ostrom, E. A General Framework for Analyzing Sustainability of Social-Ecological Systems. Science 2009, 325, 419–422. [Google Scholar] [CrossRef]
  46. Pacheco-Romero, M.; Alcaraz-Segura, D.; Vallejos, M.; Cabello, J. An Expert-Based Reference List of Variables for Characterizing and Monitoring Social-Ecological Systems. Ecol. Soc. 2020, 25, 1. [Google Scholar] [CrossRef]
  47. Pacheco-Romero, M.; Vallejos, M.; Paruelo, J.M.; Alcaraz-Segura, D.; Torres-García, M.T.; Salinas-Bonillo, M.J.; Cabello, J. A Data-Driven Methodological Routine to Identify Key Indicators for Social-Ecological System Archetype Mapping. Environ. Res. Lett. 2022, 17, 045019. [Google Scholar] [CrossRef]
  48. Tenza, A.; Pérez, I.; Martínez-Fernández, J.; Giménez, A. Understanding the Decline and Resilience Loss of a Long-Lived Social-Ecological System: Insights from System Dynamics. Ecol. Soc. 2017, 22, 15. [Google Scholar] [CrossRef]
  49. Boffy-Ramirez, E.; Moon, S. The Role of China’s Household Registration System in the Urban-Rural Income Differential. China Econ. J. 2018, 11, 108–125. [Google Scholar] [CrossRef]
  50. Wang, X.; Guo, M.; Koppelaar, R.H.E.M.; van Dam, K.H.; Triantafyllidis, C.P.; Shah, N. A Nexus Approach for Sustainable Urban Energy-Water-Waste Systems Planning and Operation. Environ. Sci. Technol. 2018, 52, 3257–3266. [Google Scholar] [CrossRef] [PubMed]
  51. Gu, C.; Hu, L.; Zhang, X.; Wang, X.; Guo, J. Climate Change and Urbanization in the Yangtze River Delta. Habitat Int. 2011, 35, 544–552. [Google Scholar] [CrossRef]
  52. Turner, M.G. Landscape Ecology: The Effect of Pattern on Process. Annu. Rev. Ecol. Syst. 1989, 20, 171–197. [Google Scholar] [CrossRef]
  53. Noss, R.F. Indicators for Monitoring Biodiversity: A Hierarchical Approach. Conserv. Biol. 1990, 4, 355–364. [Google Scholar] [CrossRef]
  54. Levin, N.; Kyba, C.C.M.; Zhang, Q.; Sánchez de Miguel, A.; Román, M.O.; Li, X.; Portnov, B.A.; Molthan, A.L.; Jechow, A.; Miller, S.D.; et al. Remote Sensing of Night Lights: A Review and an Outlook for the Future. Remote Sens. Environ. 2020, 237, 111443. [Google Scholar] [CrossRef]
  55. Brandt, J. Multifunctional landscapes—Perspectives for the future. J. Environ. Sci. 2003, 15, 187–192. [Google Scholar]
  56. Crouzat, E.; Mouchet, M.; Turkelboom, F.; Byczek, C.; Meersmans, J.; Berger, F.; Verkerk, P.J.; Lavorel, S. Assessing Bundles of Ecosystem Services from Regional to Landscape Scale: Insights from the French Alps. J. Appl. Ecol. 2015, 52, 1145–1155. [Google Scholar] [CrossRef]
  57. Xie, E.; Zhao, Y.; Li, H.; Shi, X.; Lu, F.; Zhang, X.; Peng, Y. Spatio-Temporal Changes of Cropland Soil pH in a Rapidly Industrializing Region in the Yangtze River Delta of China, 1980–2015. Agric. Ecosyst. Environ. 2019, 272, 95–104. [Google Scholar] [CrossRef]
  58. He, S.; Su, Y.; Shahtahmassebi, A.R.; Huang, L.; Zhou, M.; Gan, M.; Deng, J.; Zhao, G.; Wang, K. Assessing and Mapping Cultural Ecosystem Services Supply, Demand and Flow of Farmlands in the Hangzhou Metropolitan Area, China. Sci. Total Environ. 2019, 692, 756–768. [Google Scholar] [CrossRef] [PubMed]
  59. Hamann, M.; Biggs, R.; Reyers, B. Mapping Social–Ecological Systems: Identifying ‘Green-Loop’ and ‘Red-Loop’ Dynamics Based on Characteristic Bundles of Ecosystem Service Use. Glob. Environ. Chang. 2015, 34, 218–226. [Google Scholar] [CrossRef]
  60. Folke, C. Resilience: The Emergence of a Perspective for Social–Ecological Systems Analyses. Glob. Environ. Chang. 2006, 16, 253–267. [Google Scholar] [CrossRef]
  61. Zhu, W.; Zhang, J.; Dai, J.; Wang, D.; Ma, C.; Xu, Y.; Chen, Y. Study on the Spatiotemporal Evolution Characteristics and Influencing Factors on Green Building Development of City Clusters in the Yangtze River Delta Region in China. Sustainability 2023, 15, 9457. [Google Scholar] [CrossRef]
  62. Ye, C.; Zhu, J.; Li, S.; Yang, S.; Chen, M. Assessment and Analysis of Regional Economic Collaborative Development within an Urban Agglomeration: Yangtze River Delta as a Case Study. Habitat Int. 2019, 83, 20–29. [Google Scholar] [CrossRef]
  63. Huang, Y.; Zhang, J.; Wu, J. Integrating Sustainability Assessment into Decoupling Analysis: A Focus on the Yangtze River Delta Urban Agglomerations. Sustainability 2020, 12, 7872. [Google Scholar] [CrossRef]
  64. Fan, J.; Chen, C.; Wang, C. Spatial-Temporal Pattern Changes and Formation Mechanisms of Peri-Urbanized Areas in Hangzhou. South. Archit. 2022, 9, 42–49. [Google Scholar]
  65. Tao, D.; Xu, J.; Wu, Q.; Gu, W.; Wei, Q.; Zhou, Y.; Richards, M.P.; Zhang, G. Human Diets, Crop Patterns, and Settlement Hierarchies in Third Millennium BC China: Bioarchaeological Perspectives in Zhengluo Region. J. Archaeol. Sci. 2022, 145, 105647. [Google Scholar] [CrossRef]
  66. Long, H.; Tu, S.; Ge, D.; Li, T.; Liu, Y. The Allocation and Management of Critical Resources in Rural China under Restructuring: Problems and Prospects. J. Rural Stud. 2016, 47, 392–412. [Google Scholar] [CrossRef]
  67. Wang, F.; Zhao, X.; Qiu, Y.; Dong, S.; Wang, S.; Xue, P. A Study on Native and Constructed Localities in the Modern Adaptation of Villages. Habitat Int. 2023, 138, 102849. [Google Scholar] [CrossRef]
  68. Du, Y. Holistic Gentrification and the Recreation of Rurality: The New Wave of Rural Gentrification in Chengdu, China. J. Rural Stud. 2022, 96, 237–245. [Google Scholar] [CrossRef]
  69. Flint, C.G.; Luloff, A.E. Natural Resource-Based Communities, Risk, and Disaster: An Intersection of Theories. Soc. Nat. Resour. 2005, 18, 399–412. [Google Scholar] [CrossRef]
  70. Ma, H.; Zhong, Y.; Ou, M.; Wang, W.; Feng, X. The Transformation of Fishermen’s Livelihoods in the Context of a Comprehensive Fishing Ban: A Case Study of Datang Village at the Poyang Lake Region, China. Land 2022, 11, 2262. [Google Scholar] [CrossRef]
  71. Murphy, D.J.; Yung, L.; Wyborn, C.; Williams, D.R. Rethinking Climate Change Adaptation and Place through a Situated Pathways Framework: A Case Study from the Big Hole Valley, USA. Landsc. Urban Plan. 2017, 167, 441–450. [Google Scholar] [CrossRef]
  72. Li, Y.; Kappas, M.; Li, Y. Exploring the coastal urban resilience and transformation of coupled human-environment systems. J. Clean. Prod. 2018, 195, 1505–1511. [Google Scholar] [CrossRef]
  73. Kuhmonen, I.; Kuhmonen, T. Transitions through the Dynamics of Adaptive Cycles: Evolution of the Finnish Agrifood System. Agric. Syst. 2023, 206, 103604. [Google Scholar] [CrossRef]
  74. Carpenter, S.R.; Brock, W.A. Adaptive Capacity and Traps. Ecol. Soc. 2008, 13, 40. [Google Scholar] [CrossRef]
  75. Liu, J.; Mooney, H.; Hull, V.; Davis, S.J.; Gaskell, J.; Hertel, T.; Lubchenco, J.; Seto, K.C.; Gleick, P.; Kremen, C.; et al. Systems Integration for Global Sustainability. Science 2015, 347, 1258832. [Google Scholar] [CrossRef]
  76. He, B.-J.; Zhao, D.-X.; Zhu, J.; Darko, A.; Gou, Z.-H. Promoting and Implementing Urban Sustainability in China: An Integration of Sustainable Initiatives at Different Urban Scales. Habitat Int. 2018, 82, 83–93. [Google Scholar] [CrossRef]
Figure 1. Location of Yangtze River Delta (YRD) and distribution of the YRD’s urban, rural, and wilderness spaces. (Self-drawn by the author).
Land 12 02164 g001
Figure 2. Analysis routine to identify system spatial archetypes (HSAs), archetypical evolutionary patterns (AEPs), and archetypical spatio-temporal interactions of human settlements. (Self-drawn by the author).
Land 12 02164 g002
Figure 3. Schematic overview of mapping system spatial archetypes and archetypical evolutionary patterns of human settlements. (Self-drawn by the author).
Land 12 02164 g003
Figure 4. Spatial patterns of human settlement indicators in the YRD region. (Self-drawn by the author).
Land 12 02164 g004
Figure 5. (a) Spatial patterns of human settlement archetypes for the year 2019 of the YRD region; (b) archetypical evolutionary patterns between 2001 and 2019 of the YRD region. (Self-drawn by the author).
Land 12 02164 g005
Figure 6. Indicators of regional typical human settlement change patterns. The length of the black solid line represents the disparity between a particular indicator level within this clustering and the regional average level of this indicator. The size of the circle indicates this indicator’s impact on this specific clustering. (Self-drawn by the author, drawing on the Web: https://www.chiplot.online/ (accessed on 20 September 2023)).
Land 12 02164 g006
Figure 7. Spatial patterns of archetypical human settlement spatio-temporal interactions. (Self-drawn by the author).
Land 12 02164 g007
Figure 8. Co-occurrence assessment map of human settlement system spatial archetypes (HSAs) and typical change patterns (HSCHs). The size of the circle represents how many settlement systems in this HSA are affected by this HSCH. (Self-drawn by the author).
Land 12 02164 g008
Table 1. Correspondence between urban, rural, and wildness spaces and existing land cover classification system.
Land Interface ClassificationExisting Land Cover Classification System of ESA
Urban spaceUrban
Rural spaceRainfed cropland, Irrigated cropland, Mosaic cropland (>50%)/natural vegetation (tree, shrub, herbaceous cover) (<50%), Mosaic natural vegetation (tree, shrub, herbaceous cover) (>50%)/cropland (<50%) Mosaic natural vegetation (tree, shrub, herbaceous cover) (>50%)/cropland (<50%)
Wildness spaceTree cover, broadleaved, evergreen, closed to open (>15%); Tree cover, broadleaved, deciduous, closed to open (>15%); Tree cover, needle leaved, evergreen, closed to open (>15%); Tree cover, needle leaved, deciduous, closed to open (>15%); Tree cover, mixed leaf type (broadleaved and needle leaved); Mosaic tree and shrub (>50%)/herbaceous cover (<50%); Mosaic herbaceous cover (>50%)/tree and shrub (<50%); Grassland; Shrubland; Sparse vegetation (tree, shrub, herbaceous cover); Bare areas; Water; Tree cover, flooded, saline water
Table 2. The indicator system for mapping human settlement archetypes.
SubsystemVariableIndicatorUnitData Source
Socioeconomic subsystemPopulation dynamicsPopulation densityPeople km−2CSYD
Birth rate of the populationCSYD
Economic developmentRural residents’ per capita disposable income¥ inhabitant−1
year−1
CSYD
Urban residents’ unemployment rate%CSYD
GovernanceEnergy consumption reduction rate per unit of GDP%CSYD
Industrial solid waste utilization rate%CSYD
Municipal sewage treatment rate%CSYD
Ecological subsystemClimateAverage annual precipitationmm year−1CSYD
Average annual temperature°CCSYD
Natural productivityAverage annual NDVIIndexTPDC 2
Natural coverageThe proportion of wilderness space%ESA 1
InteractionsHuman actions on the environmentThe proportion of urbans space%ESA 1
Nighttime Light Intensity%HARVARD Dataverse 3
Ecosystem service supplyLandscape diversity indexIndexFragstats Landscape Diversity Index
Ecosystem service demandThe proportion of rural space%ESA 1
Irrigated area proportion (percentage of paddy fields in total cultivated land)%ESA 1
1 http://www.esa-landcover-cci.org/ (accessed on 1 June 2023). 2 http://data.tpdc.ac.cn (accessed on 1 June 2023). 3 https://dataverse.harvard.edu/dataset.xhtml?persistentId=doi:10.7910/DVN/GIYGJU (accessed on 1 June 2023).
Table 3. Cluster descriptions for typical human settlement change patterns and their deduced archetypical evolutionary patterns.
ClusterChange PatternsDescriptionCitiesArchetypical Evolutionary Patterns
HSCH
01
Low-intensity urban expansionAbove average increase in the proportion of urbans space and nighttime light intensityChangzhou, Nanjing, Suzhou, Taizhou, Wuxi, ZhenjiangConservation and stabilization
HSCH
02
Intensification towards high-intensity cropland and in situ urbanizationHighest increase in irrigated area proportion; above average increase in birth rate and rural residents’ per capita disposable income; most significant decline in urban residents’ unemployment rateHangzhouExpansion and exploitation
HSCH
03
Intensification towards medium-intensity croplandAbove average increase in irrigated area proportion; highest increase in average annual precipitationHuzhou, Jiaxing, Jinhua, Lishui, Ningbo, Quzhou, Shaoxing, Taizhou, Huaian, Zhoushan, Lianyungang, Nantong, Yancheng, Conservation and stabilization
HSCH
04
StabilityNo substantial changes for any indicatorsYangzhouConservation and stabilization
HSCH
05
High-intensity urban expansionHighest increase in population density and population density and urban spatial areaShanghaiExpansion and exploitation
HSCH
06
Low-intensity cropland expansion and intensificationAbove average increase in irrigated area proportion and the proportion of rural space; highest increase in municipal sewage treatment rate and urban residents’ unemployment rateWenzhouConservation and stabilization
HSCH
07
Cropland de-intensificationMost significant decline in industrial solid waste utilization rate and average annual precipitation; highest increase in average annual NDVISuqianChange and fluctuation
HSCH
08
De-urbanizationHighly below average increase in rural residents’ per capita disposable income, population density, and urban residents’ employment; highest increase in birth rate; high increase in average annual NDVIXuzhouChange and fluctuation
Disclaimer/Publisher’s Note: The statements, opinions and data contained in all publications are solely those of the individual author(s) and contributor(s) and not of MDPI and/or the editor(s). MDPI and/or the editor(s) disclaim responsibility for any injury to people or property resulting from any ideas, methods, instructions or products referred to in the content.

