Article

The Role of Almond-Leaved Pear Pyrus spinosa Forssk. in Mediterranean Pasturelands Carbon Storage and Woodlands Restoration

Department of Agricultural, Food and Forest Sciences, University of Palermo, Viale delle Scienze, Ed.4, 90128 Palermo, Italy
*
Author to whom correspondence should be addressed.
Land 2023, 12(12), 2135; https://doi.org/10.3390/land12122135
Submission received: 18 October 2023 / Revised: 22 November 2023 / Accepted: 29 November 2023 / Published: 5 December 2023

Abstract

:
A large portion of the Mediterranean basin suffers from a lack of organic carbon in the soil and low woody cover percentages, resulting in a very high risk of desertification. In such conditions, knowing the effects on below and above ground carbon sequestration of pioneer woody species is of great importance, although barely assessed at the individual level. In this study, we first investigated whether almond-leaved pear (Pyrus spinosa) individuals influence soil organic carbon (SOC) concentration and stock in comparison with surrounding pasturelands inside a natural reserve in Sicily, Italy. Second, we evaluated inter individual variability on such storage, testing the effects of plant height, basal diameter, canopy cover and tree structure (single or multiple stems). Soils under pear presented, on average, a significantly higher SOC than pasturelands (3.86% and 3.16%, respectively) as well as a lower bulk density (1.09 and 1.28 g cm−3, respectively). Due to a lower soil compaction, SOC stocks (130.3 and 113.9 Mg ha−1, respectively) did not differ significantly. Below and aboveground biomass carbon accounted for a small fraction of carbon stock, while neither pear structure, age nor tree structure significantly influenced SOC concentration and SOC stock. Despite the need of further investigations, our results indicate that pear may represent an excellent tree species to improve carbon storage, both while triggering the restoration of Mediterranean woodlands or increasing biodiversity in pasturelands and agroforestry systems, that, indeed, can hold high SOC if well managed.

1. Introduction

The Mediterranean is the European biogeographical region with the lowest amount of soil organic carbon (SOC) and woody cover, and, consequently, presenting the highest risk of desertification and susceptibility to climate change [1,2,3]. SOC is a key element for soil fertility, water retention, as well as being strongly related to microbial biomass and activity [4]. Shrublands and forests, covering more than 25 million hectares in the Mediterranean region, are the potential woody vegetation cover for most Mediterranean areas, and are crucial for biodiversity conservation and ecosystem services provision [5,6]. In turn, agriculture is a dominant land cover shaping the Mediterranean since centuries, and, generally, agricultural practices are responsible for SOC depletion and woody cover loss, with agricultural fields presenting much lower SOC than abandoned fields, shrublands, forests and afforestation [7,8,9]. For instance, an overall SOC accumulation rate of +2.3% year−1 post-agricultural abandonment was found in a peninsular in Spain [8]. Along secondary succession processes in Mediterranean island ecosystems, soil carbon considerably increased from about 33 Mg ha−1 in vineyards to about 69 Mg ha−1 in old growth forests [7]. Pasturelands, including wood-pastures [10], account for a relevant proportion of agricultural land use, covering more than 70 million of ha in Europe [11]. Generally, pasturelands present higher SOC values than bare lands and crop fields, because of low soil management (e.g., no tillage) as well as high animal manure deposition [12,13]. However, pasturelands may induce soil compaction due to livestock trampling, influencing vegetation composition and the soil carbon pool by reducing organic matter turnover and permeability, although an increased bulk density may determine higher carbon stocks [2,14,15]. Pasturelands store lower SOC content than shrublands and forests, and even isolated woody individuals scattered through the pastureland may contribute to SOC accumulation [16,17,18]. Indeed, woody encroachment over pasturelands has been pointed out as a relevant carbon sink, therefore helping mitigating climate change and desertification while contributing to the achievement of international commitments such as the European Green Deal and the recently approved nature restoration law [13,19,20]. However, woody encroachment greatly reduces pasturelands carrying capacity and herbaceous plant diversity, representing a threat to historical pastureland economic activity, also pushing grazing over forest areas and increasing fire risk and reducing microbial activity [21,22]. In this sense, wooded pasturelands might be an alternative to increase carbon accumulation and overall biodiversity in pasturelands [17,23]. The combination of pasturelands and trees generates important landscapes in the Mediterranean (e.g., Dehesas in Spain and Montado in Portugal), with trees enhancing not only the food supply for the animals, but also increasing biodiversity and carbon stocks [10,24]. However, most of the actual knowledge comes from pasturelands with oaks, while the carbon sink potential of other native species, as well as the magnitude of inter and intra-individual variations, is still under investigation [16]. Fulfilling such gap is relevant both in the case of forest restoration and for the maintenance of high nature values agro-pastoral systems, particularly when considering species that provide different ecological services while being robust against desertification, fire and herbivory [25].
The almond-leaved pear (Pyrus spinosa Forssk., hereafter pear) seems to be a very good species for such purposes, although poorly studied and highly underused in practice. It is a small deciduous hardwood tree up to 5–6 m high, native to the European countries of the Mediterranean basin, from Spain to Turkey, but also occurring in Iran and Bulgaria [26]. It is a markedly heliophilous, xerophilous and thermophilus plant, indifferent to soil type, with wide ecological plasticity and phenotypic variability [26]. Additionally, this spiny species is resistant against herbivores, has interesting pharmaceutical properties, insect-pollinated flowers and edible fleshy-fruits consumed by many animals, including livestock. All these traits amount to great value for the ecological restoration of Mediterranean woodlands or for compose high nature value silvopastoral systems [26,27,28].
In this study, our objectives were (1) to assess the effect of pear on soil carbon storage, also taking into account the above and below-ground biomass, compared to nearby pasturelands and (2) to investigate the relationship between structural traits, age and tree structure, and SOC concentration and SOC stock. We hypothesized that (1) soils under pear have a higher carbon concentration than neighbour pasturelands, (2) older individuals have a higher carbon concentration and stocks than younger ones and (3) SOC is higher under multi-stemmed individuals than under single stem individuals, due to the exclusion of trampling by large herbivores.

2. Materials and Methods
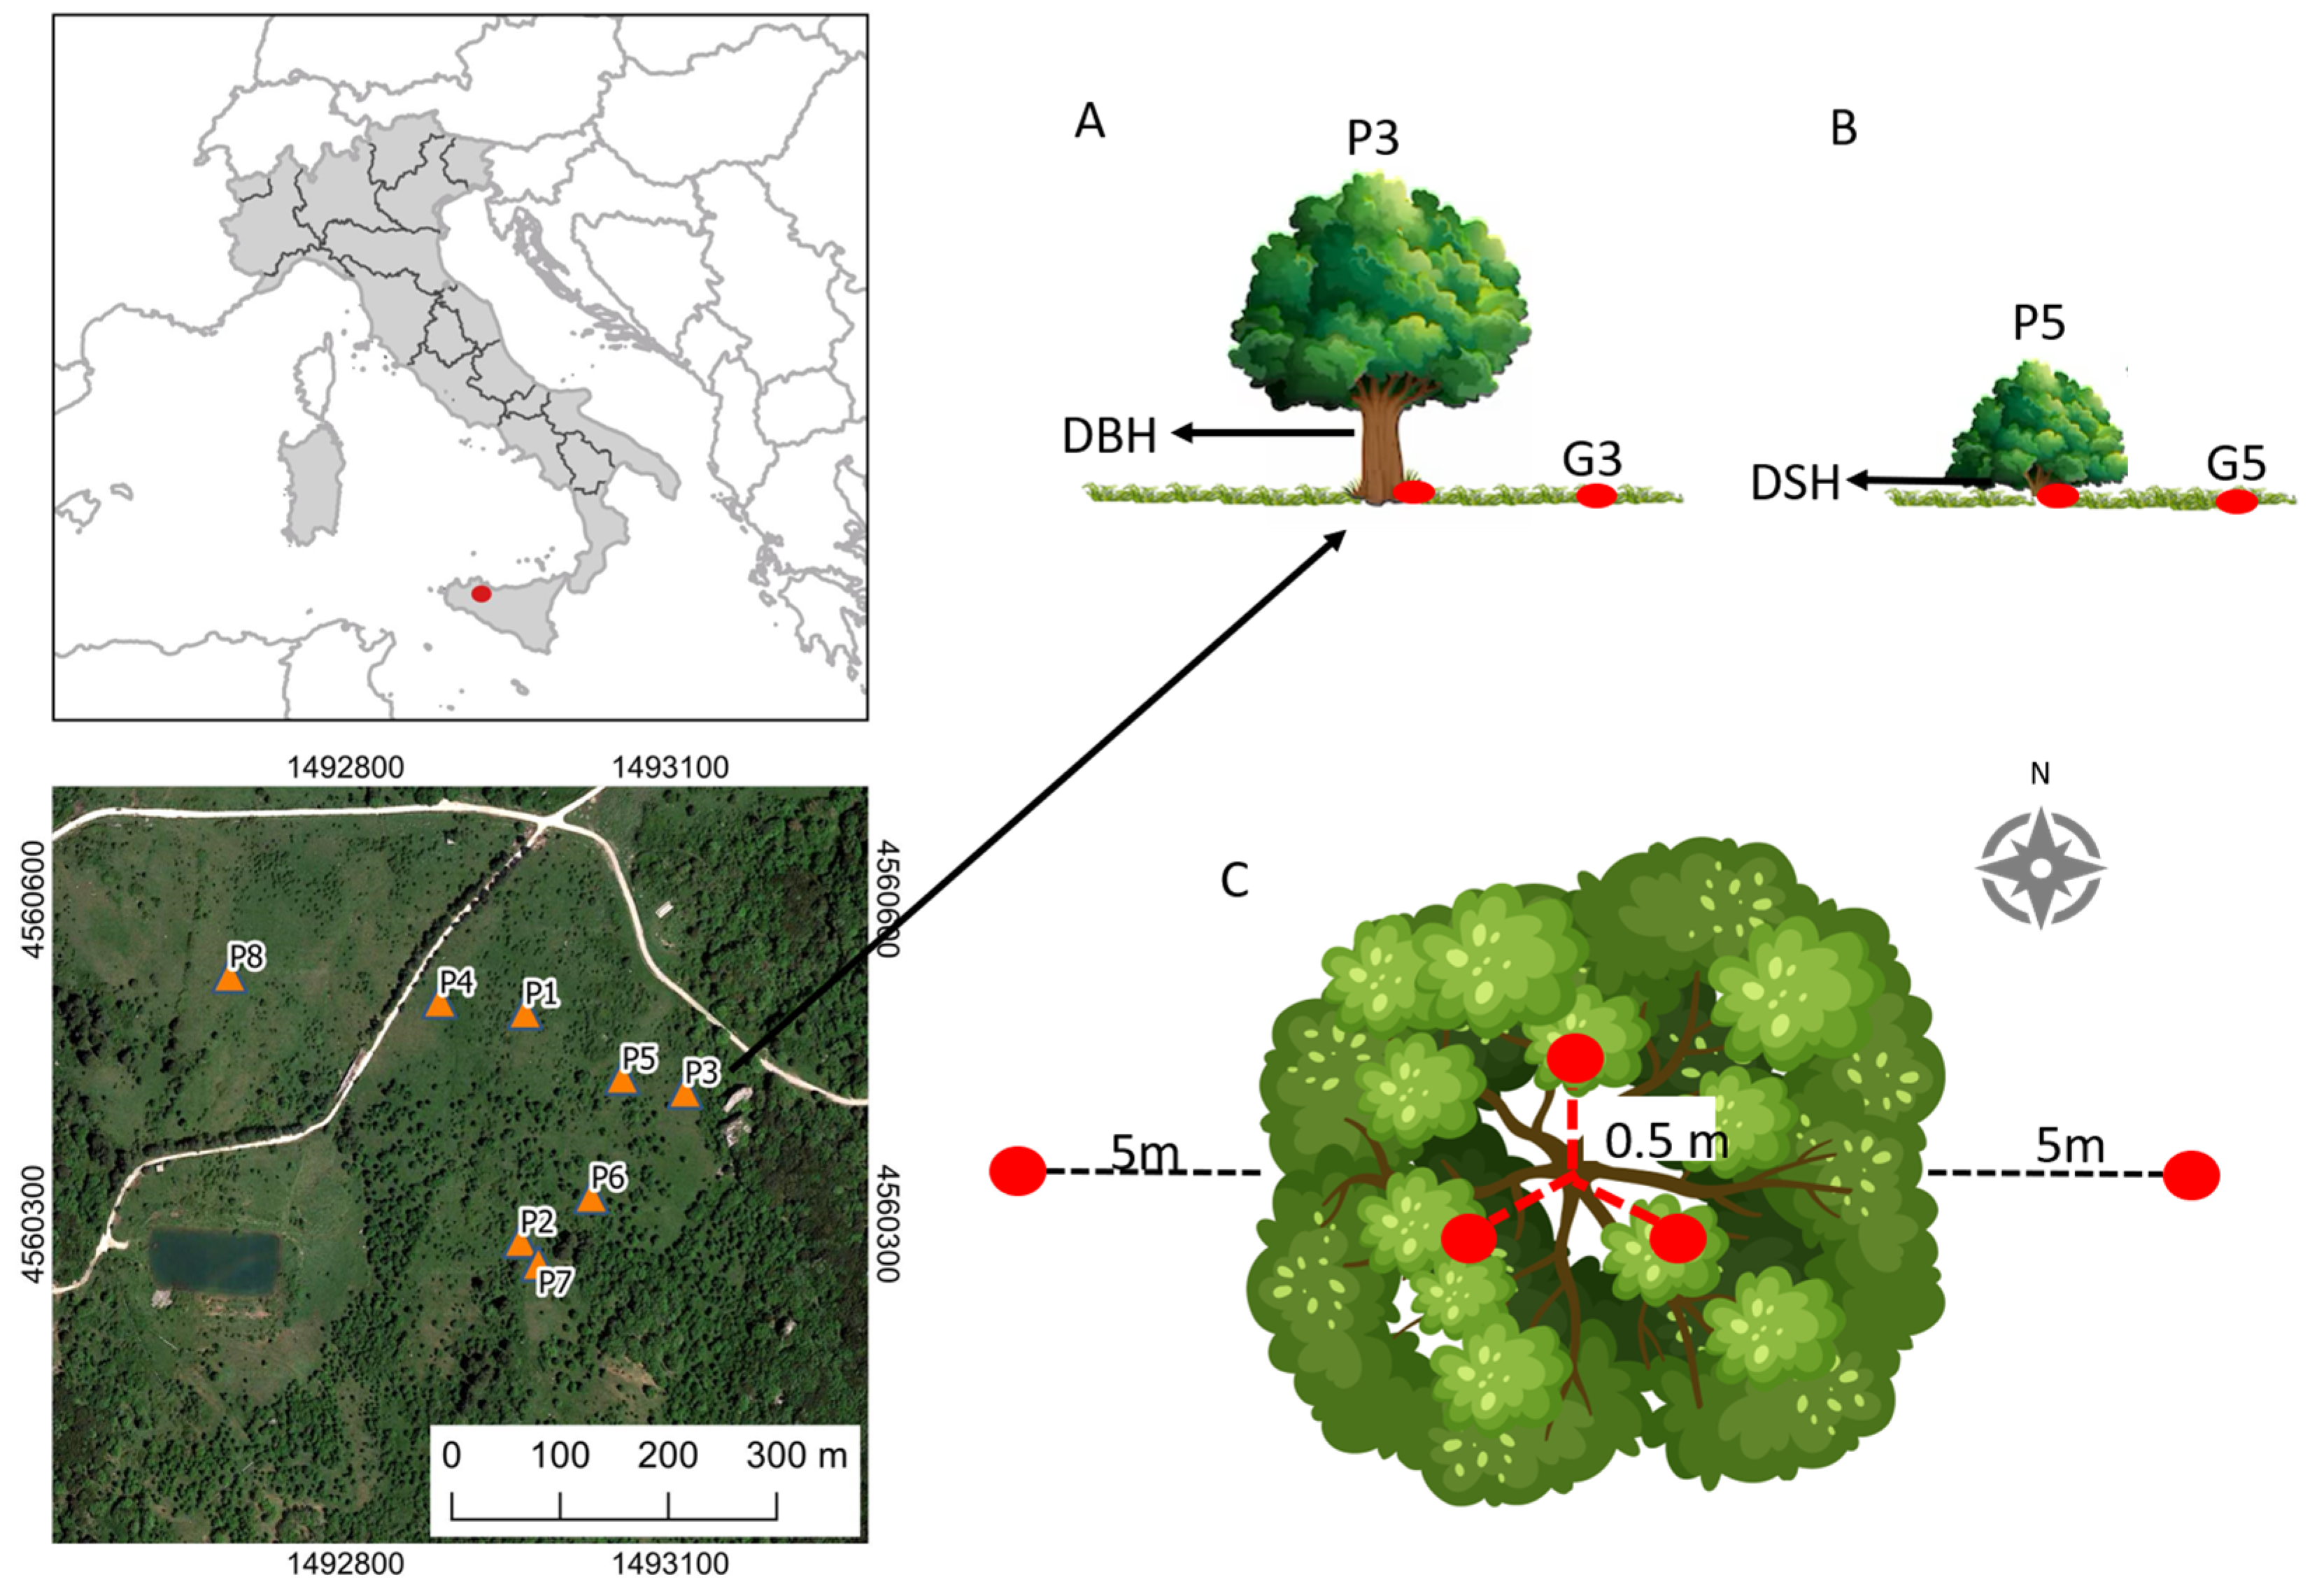
2.1. Study Area

The research was carried out at the Ficuzza Nature Reserve in northwestern Sicily [23]. Ficuzza is a large protected area, covering more than 7000 hectares, and hosting the last large forest remnants in western Sicily, mostly composed of evergreen and deciduous oaks such as Quercus ilex L. and Quercus pubescens Willd s.l. [29,30]. Field surveys were carried out at the Alpe Cucco site, characterized by extensive wooded pasturelands mixed with heterogeneous mantle vegetation dominated by shrub and tree species of the Rosaceae family, such as Pyrus spinosa, Crataegus monogyna Jacq., Rubus ulmifolius Schott, Rosa canina L., Prunus spinosa L. [23]. The herbaceous layer is characterized by mesophilous species, such as Cynosurus cristatus L. and Lolium perenne L., together with several other grasses and legumes of the genera Trifolium, Medicago and Phalaris [31]. The study area (mean altitude of 950 m a.s.l.) falls within the meso-mediterranean upper sub-humid bioclimatic belt, with an average rainfall of 850 mm, and mean annual temperatures of 14.3 °C, with an average of 9.4 °C in the coldest months (January and February) and an average of 23.5 °C in the hottest months (July and August) [32]. The soils are deep (100 cm), sub-alkaline, clay-dominated vertic haploxeralfs [33]. Extensive cattle raising has a long history as grazing permissions date back to at least the end of 1800 century, and is still present nowadays, whereas an active pastureland management program, including irrigation, ploughing, and seeding, was developed during 1960–1990 [34].

2.2. Experimental Design

We assessed the effect of pear individuals on SOC concentration considering a paired-site approach, commonly used to study the differences in SOC under different land uses or plant species in the same ecological conditions. In May 2021, we selected eight pear individuals, at least 30 m apart from each other and differing in age and tree structure (Figure 1). Pear age was determined by analysing aerial and satellite images, considering the year of 1992 as the last aerial image available after human management of the area (see [23] for details on vegetation mapping). We verified the individuals in the field that were clearly visible in the 1992 image (old, mean DBH = 32.2 cm) and selected two with one single stem (hereafter single), and two with multiple stems (i.e., multi-stemmed according to Gschwantner et al. [35]) (hereafter multi). We chose to compare these different tree structures because of their expected influence on herbaceous vegetation cover and herbivores passage and, in turn, on SOC. Then, we selected four individuals not visible in the 1992 image (young), and, again, selected two with a single stem and two with multiple stems (mean DBH = 14.5 cm).

2.3. Plant Traits and Aboveground Biomass

Pear individual structure was characterized by measuring the following parameters: plant height (m), diameter at breast height (DBH) for single stems or diameter at stump height (DSH) for multi-stemmed (both in cm), and crown projections along four cardinal directions (m) to calculate canopy cover. For multi-stemmed individuals, DBH was estimated from DSH through the equation developed by Boyce and Ocasio [36] for Pyrus calleryana Decne.:
DBH = −1.43476 + 0.9574 × DSH.
To estimate the aboveground woody biomass, we first estimated the wood volume of pear trees using the double-entry tree volume tables following the National Inventory of Forests and Carbon Sinks of Italy [37], based on DBH and plant height. Then, volume was converted into biomass using the Pyrus communis L. wood density (690 kg m−3), once no specific data was available for Pyrus spinosa [38]. Finally, the aboveground biomass per hectare (Mg ha−1) was calculated by multiplying the mean biomass of pear individuals (in single stems or multi-stemmed) by the mean pear density in the study area (64 individuals ha−1 [23]). Carbon concentration was assumed to be 50% of the biomass, according to the most commonly conversion factor adopted for tree species [39]. Belowground pear biomass was estimated by multiplying the aboveground biomass per 0.84, as an average value of shoot-root ratios reported by [40,41] for Mediterranean woody species.
Above and belowground biomass and C stock, as well as root-shoot ratio, of pastureland were estimated based on literature data. Due to a high heterogeneity of grassland species composition, we selected studies specifically reporting the dominant grass species occurring in our study site (Cynosurus cristatus [31]) and limited this to areas with similar environmental conditions [17,42,43,44]. Particularly, we considered cork oak wooded grasslands in Sardinia [17] and pasturelands with Cynosurus cristatus in Calabria [43]. For what concerns the root-shoot ratio, instead, we considered and averaged two works specifically reporting the values for Cynosurus cristatus [42,43]. Therefore, the aboveground biomass was found to be 2.59 ± 2.11 (Mean ± SD) Mg ha−1 and belowground was 1.04 ± 1.25 Mg ha−1, with the ratio of 0.45 for the conversion of biomass into carbon content [45].

2.4. Soil Sampling and Parameters

Our objectives were also to check micro-scale variabilities in SOC spatial distribution under each pear individual. First, we removed the litter and collected three soil samples (0–30 cm depth, n = 24) at a 50 cm distance from the trunk, using a standard position based on degrees (0°, 120°, 240°; Figure 1). Then, we collected two paired samples at the nearby pastureland (n = 16), one oriented to the east (90°) and one oriented to the west (270°), in order to standardize sunlight exposition, and at 5 m from the edge of the pear crown. The SOC (%) content was analysed using an elemental analyser (NA1500 Carlo Erba, Milan, Italy) and was converted to soil carbon stock (SOC stock, Mg ha−1) as follows:
SOC stock = SOC (%) × BD × SD × A/100
where SD is the soil depth (m), A is the area (ha) and BD is bulk density (g cm−3), which was measured using the tube core method [46,47], based on the ratio between the volume of the collected sample (5 × 15 cm cylinder) and the soil dry weight (g) of the sample. To compare the paired sites, that is the pear and its respective pastureland plots, we used the ratio between the average value of the samples under pear divided by the average value of the pastureland samples.

2.5. Statistical Analysis

To check for differences on the SOC (log transformed) and SOC stock between soils under pear and pastureland, we used a two-tailed t test after checking for normality (Shapiro–Wilk p > 0.05) and equality of variances (Levene test p > 0.05). To test the effects of plant structural variables (diameter, height, cover) and tree structure (single stem or multi-stemmed), we used multiple linear regressions, checking model fit after assessing normality on the residuals (Shapiro–Wilk p > 0.05). The continuous predictors (diameter, height, cover) were standardized by subtracting the mean and dividing by the standard deviation for each value. To compare the total SOC stock, we summed the SOC values plus the below and aboveground biomass carbon of each pear individual or pastureland estimates, using the average value of the soil sample replicates taken at each sampling site, and used a t test. All analyses were performed with R 4.1.2 [48].

3. Results

3.1. Pear vs. Pastureland

SOC content under pear individuals was, on average, 22% higher compared to pastureland, differing significantly (Table 1 and Table 2, Figure 2). SOC stock was also higher underneath pear than in pasturelands, with a net gain of 16.4 Mg ha−1, although no statistical difference was observed (Table 1). Such result was affected by the significantly higher soil BD under pasturelands than under pear individuals.
Considering a paired comparison (each pear individual and its nearby pastureland), SOC was, on average, 26% higher under pear (−29% to +137%), with an average ratio of 1.26 (0.7–2.37) (Figure 3). SOC stock was 17.7% higher under pear (−20.71% to +81.7%), with an average ratio of 1.18 (0.79–1.82). BD was lower under pear, with an average ratio of 0.9 (0.67–1.26). In two cases, soils under pear had more SOC but lower SOC stock than pasturelands, as result of lower BD. We found a high micro-scale variability in SOC and SOC stock, with an average standard deviation of 0.63 (range 0.14–0.89) in SOC and 14.6 (5.44–26.78) in SOC stock under pear individuals and 0.57 (0.08–1.18) in SOC and 15.75 (0.3–37.83) in SOC stock of grasslands (Table 2, Figure 2).
Below and aboveground biomass carbon accounted for, on average, 2.55% of the total C stock (soil + biomass) of pear (134.4 ± 47.3 Mg ha−1), and 1.59% of total C stock of pasturelands (115.6 ± 30.3 Mg ha−1), an increase not sufficient to make significant differences between pear and pastureland (p = 0.35).

3.2. Intra and Inter Pear Individual Variation

According to our expectations, SOC was higher in pear with a multi-stemmed tree structure (4.19 ± 1.54%) than in pear with a single stem (3.52 ± 0.79%). Old pears also presented higher SOC (4.12 ± 1.62%) than young individuals (3.58 ± 0.71%; Figure 2). However, the multiple regression indicated that none of the structural variables (height, diameter and canopy cover) neither tree structure, age or their interactions were good predictors of SOC and SOC stock (Table 3). Indeed, the highest values of SOC and SOC stock were found underneath one old and multi-stemmed pear individual. For BD, the multiple regression showed that tree structure was the only significant predictor, with single stem individuals presenting higher values than multi-stemmed (Table 3), a pattern observed for both young (t = 3.23, p = 0.012) and old individuals (t = 8.6, p < 0.001).

3.3. Comparison with Other Studies

From the values obtained from selected studies in the Mediterranean, SOC content of Ficuzza pastureland was, on average, 107% higher than the other sites, ranging from −18 to 327% (Table 4). SOC stock was, on average, 83% higher, ranging from 25 to 219% in both cases, showing the second highest value of each study. Specifically, SOC and SOC stock values were 51% and 74% higher than other meso-mediterranean pasturelands in Sicily and Sardinia.

4. Discussion

4.1. Pear Effect on Carbon Storage

According to our hypothesis, soils under pear presented 22% more SOC than nearby pasturelands. A similar percentage was found in a study in Sardinia with oaks, although the pastureland considered there had lower SOC than in our study site [53]. On the other side, Rolo et al. [16] found a rather equal SOC content under two native shrub species in comparison with pasturelands, while SOC under oak trees was significantly higher. Compared to other land uses such as croplands, oaks were able to increase up to 50% SOC [56,57], and we expected that pear presence in such carbon-poor systems would have also greatly enhanced SOC. Indeed, SOC stocks were 15.6% higher under pear than in pasturelands; despite this, we did not find significant differences. In general, pasturelands showed relatively high SOC stocks due to the higher bulk density, as a consequence of livestock trampling. Effectively, only in two cases, the BD ratio was positive (Figure 3).
Spatio-temporal variations of SOC are expected to occur along secondary succession, although such trends are usually observed under a macro-scale perspective [7,8]. Small-scale (i.e., 28 m) spatio-temporal dynamics in carbon concentration have been described in a Mediterranean perennial pastureland, with higher SOC concentrations and higher organic matter stability found under tree canopies [58]. This study also attributed the higher values to manure deposition by livestock. However, micro-scale variations in carbon storage dynamics are still poorly understood [57]. We found a high micro-scale variation in SOC even under the same individual and respective paired pastureland (Figure 2), reaching up to a two percent point difference between the soil samples. Interestingly, the highest variations were found under old and multi-stemmed individuals, where livestock direct influence is null. Hence, we expect that such micro-scale variations are the result of micro-topography configuration, with small depressions accumulating organic matter flushed away with the rain. On the contrary, under single trees, cattle were frequently observed, also eating the fruits [28], resulting in contrasting effects, with higher compaction and consequent reduced carbon turnover and litter leaching, but also manure deposition [58]. However, the lower SOC content indicates that the negative effects are prevailing. In any case, our results demonstrate the need to consider such micro-scale spatial variations while characterizing the soil properties of a site affected by grazing and different land uses. Pear is a fleshy-fruited and deciduous tree species, so its effect is expected to be even higher once we did not consider litter input, fruit fall and woody debris contribution, which are important sources of carbon and food for detritivore animals [13].

4.2. Influence of Age and Tree Structure

Contrary to our expectations, we did not find a clear relationship between pear diameter, height, canopy cover and SOC concentration and stock. This lack of relationship suggests that the cumulative temporal deposition of litter and woody debris, which is expected to be higher in larger and older individuals, was offset by tree structure influence. Effectively, single stem individuals showed significantly higher BD, which can be linked to the lower soil protection against environmental factors (e.g., rain) as well as against herbivores trampling. Soil compaction is known to negatively affect soil carbon turnovers and microbial activity, and to increase erosion processes and decrease organic matter stability, therefore affecting SOC concentration [14,59]. Pear biomass accounted for just a small fraction of total C stock in our study site (average 3.3 Mg C ha−1; Table 3), which can be expected due to the relatively small size of pear individuals and their low density. In turn, the average biomass C stock of Mediterranean pastures and/or grasslands ranges from 0.5–3.0 Mg C ha−1 [44,60], so the pear presence, even in such low densities, was able to double the biomass carbon stock. This result, by one side, reinforces the role of soils in the carbon storage for such woody pastoral systems. However, the low potential of biomass carbon storage in comparison with forests is evident, where plant biomass can account for more than 50% of total C stock [7]. Despite the increasing availability of biomass data for woody species in the Mediterranean basin, no specific information about Pyrus spinosa was found. The average pear aboveground C stock (3.3 Mg C ha−1) is slightly lower than the lower limit found in Mediterranean shrublands, including small trees and shrubs such as Myrtus communis L., Rhamnus alaternus L. and Pistacia lentiscus L., with a range from 3.5 Mg C ha−1 to 10 Mg C ha−1 [61,62]. In more complex and richer Mediterranean maquis communities, the aboveground C stock was found to increase from 15 Mg C ha−1 to 35 Mg C ha−1 following the progressive increase in Quercus ilex L. cover along a secondary succession in volcanic substrates [7].

4.3. Comparison with Literature Data on SOC in Mediterranean Pasturelands

The average values of SOC (3.15%) and SOC stock (113.9 Mg ha−1) found in the pastureland in our study were high in comparison with those found in other Mediterranean pasturelands, with an average SOC of 1.89% and SOC stock of 67.7 Mg ha−1 (Table 4). SOC also generally tends to increase at milder climates, and a gradient is expected to occur from thermo- to supra-Mediterranean bioclimates [18,51]. However, our results showed that the SOC content of Ficuzza pasturelands was higher than most meso-Mediterranean sites, and at the same levels of supra-Mediterranean sites, indicating that bioclimate alone is not always a good indicator of SOC and SOC stock trends [1]. In turn, the few studies that compared different areas with the same soil types found different SOC quantities, indicating that land use might be a relevant factor in such cases. Probably, the high values at Ficuzza are a result also of the low intensity use of the area, boosted by the presence of the natural reserve on which no agricultural activity (e.g., croplands or tillage) was conducted in the past decades. The extensive management of the area can also be inferred by BD values that, even in pastureland patches, were found to be lower than the average found in the literature (1.24 vs. 1.37 g cm−3). The SOC and SOC stock values were high even in comparison to Mediterranean shrublands or forests. For example, two forest sites in Tunisia had an average SOC stock of 147 and 102 Mg ha−1 [63]. SOC stock increased from ≈71 Mg ha−1 in vineyards to ≈163 Mg ha−1 in Mediterranean old-growth forests, while SOC, in the same land uses, increased from 1.1% to 2.3% in the 0–30 cm soil depth [7]. Soil physico-chemical parameters can vary in space and time, as well as the relationship between plants and soil nutrients may be contrasting [16,58]; therefore, a long-term analysis is necessary to keep track on those changes and evaluate the effective role of woody plants in soil properties and pastureland productivity. By performing this comparison, we also noticed a variation in sampling procedures (e.g., soil depth), indicating that a standardization of sampling protocols is required to allow better direct comparisons among different studies.

4.4. Management Implications

We found a strong positive effect of pear on SOC, increasing carbon storage capacity of pasturelands, while maintaining a heterogeneous vegetation structure with single and sparse pear trees, including small nuclei [24], thus ensuring pastureland carrying capacity [34]. Recent research has also found that pear is an important food source during late autumn and winter for domestic and wild mammals, which disperses its seeds and contributes to the colonization of new sites and consequent carbon storage [28]. Other than composing woody pasturelands, pear is a particularly suitable species for afforestation purposes in the Mediterranean, therefore contributing to the higher biomass carbon accumulation found in forest ecosystems. Effectively, pear was the most abundant tree in the pastureland in our study site and was found to play a prominent role in the increase in forest cover in the last 30 years [23]. For example, pear can be properly used in 13 out of 23 ecologically homogeneous areas identified in Sicily, from 400 to 1100 m a.s.l., falling within the thermo- and meso-Mediterranean bioclimatic belts [64]. Additionally, pear can be used as rootstocks for cultivated pears [65], and we also encourage the use of almond leaved pear in urban areas such as public parks in order to favour the re-establishment of lost ecological interactions with native fauna while increasing carbon accumulation [66]. Indeed, the Sicilian Region has included Pyrus spinosa among the species usable in forestry interventions funded by Regulation 2080/92 of the European Community, although it is very rare to see it in reforestations.

5. Conclusions

The results of our study provide novel insights into the effects of native tree species colonization on soil carbon dynamics in pasturelands and along secondary succession processes in Mediterranean ecosystems. As the abandonment of agricultural and marginal areas is expected to increase in the future, the carbon stored by woody plants could be greatly enhanced via secondary succession processes. Further research might look for other types of soil physico-chemical properties, nutrients, and microbiota, on which the deposition of flowers, fruits, leaves and woody debris and the access or not of the livestock might make a relevant difference in comparison to nearby pasturelands. Indeed, our results indicate that almond-leaved pear can represent an excellent species to improve soil conditions, protect against environmental stress factors, and increase SOC accumulation while triggering the restoration of woodlands in Mediterranean areas as well as composing high biodiversity wooded pasturelands and agroforestry systems.

Author Contributions

Conceptualization, R.S.B., E.B. and T.L.M.; methodology, R.S.B., E.B., A.N. and T.L.M.; formal analysis, R.S.B.; investigation, R.S.B., E.B. and A.N.; resources, A.N., L.G. and T.L.M.; data curation, R.S.B., E.B. and A.N.; visualization, R.S.B.; writing—original draft preparation, R.S.B. and E.B., writing—review and editing, R.S.B., E.B., L.G., A.N. and T.L.M.; project administration, T.L.M. and L.G.; funding acquisition, T.L.M. and L.G. All authors have read and agreed to the published version of the manuscript.

Funding

This research was funded by “Dipartimento Regionale dello Sviluppo Rurale e Territoriale della Regione Siciliana” and “Dipartimento Scienze Agrarie e Alimentari” of University of Palermo, POFESR2014-20_Sicilia—Regione Siciliana—PO FESR 2014–2020, Grant number PRJ-1104.

Data Availability Statement

The data presented in this study are available from the corresponding author upon request. The data are not publicly available due to further analysis.

Acknowledgments

We acknowledge Clara Perrone, Mark Massaad and Salvatore Rizzo for fieldwork help.

Conflicts of Interest

The authors declare no conflict of interest.

References

  1. de Brogniez, D.; Ballabio, C.; Stevens, A.; Jones, R.J.A.; Montanarella, L.; van Wesemael, B. A map of the topsoil organic carbon content of Europe generated by a generalized additive model. Eur. J. Soil Sci. 2015, 66, 121–134. [Google Scholar] [CrossRef]
  2. Ferreira, C.S.S.; Seifollahi-Aghmiuni, S.; Destouni, G.; Ghajarnia, N.; Kalantari, Z. Soil degradation in the European Mediterranean region: Processes, status and consequences. Sci. Total Environ. 2022, 805, 150106. [Google Scholar] [CrossRef] [PubMed]
  3. Salvati, L.; Kosmas, C.; Kairis, O.; Karavitis, C.; Acikalin, S.; Belgacem, A.; Solé-Benet, A.; Chaker, M.; Fassouli, V.; Gokceoglu, C.; et al. Unveiling soil degradation and desertification risk in the Mediterranean basin: A data mining analysis of the relationships between biophysical and socioeconomic factors in agro-forest landscapes. J. Environ. Plan. Manag. 2015, 58, 1789–1803. [Google Scholar] [CrossRef]
  4. Catania, V.; Bueno, R.S.; Alduina, R.; Grilli, E.; La Mantia, T.; Castaldi, S.; Quatrini, P. Soil microbial biomass and bacterial diversity in southern European regions vulnerable to desertification. Ecol. Indic. 2022, 145, 109725. [Google Scholar] [CrossRef]
  5. Morán-Ordóñez, A.; Ameztegui, A.; De Cáceres, M.; de-Miguel, S.; Lefèvre, F.; Brotons, L.; Coll, L. Future trade-offs and synergies among ecosystem services in Mediterranean forests under global change scenarios. Ecosyst. Serv. 2020, 45, 101174. [Google Scholar] [CrossRef]
  6. FAO; Plan Bleu. State of Mediterranean Forests 2018; Food and Agriculture Organization of the United Nations: Rome, Italy; Plan Bleu: Marseille, France, 2018. [Google Scholar]
  7. Badalamenti, E.; Battipaglia, G.; Gristina, L.; Novara, A.; Rühl, J.; Sala, G.; Sapienza, L.; Valentini, R.; La Mantia, T. Carbon stock increases up to old growth forest along a secondary succession in Mediterranean island ecosystems. PLoS ONE 2019, 14, e0220194. [Google Scholar] [CrossRef]
  8. Bell, S.M.; Terrer, C.; Barriocanal, C.; Jackson, R.B.; Rosell-Melé, A. Soil organic carbon accumulation rates on Mediterranean abandoned agricultural lands. Sci. Total Environ. 2021, 759, 143535. [Google Scholar] [CrossRef]
  9. Lasanta, T.; Sánchez-Navarrete, P.; Medrano-Moreno, L.M.; Khorchani, M.; Nadal-Romero, E. Soil quality and soil organic carbon storage in abandoned agricultural lands: Effects of revegetation processes in a Mediterranean mid-mountain area. Land Degrad. Dev. 2020, 31, 2830–2845. [Google Scholar] [CrossRef]
  10. Plieninger, T.; Hartel, T.; Martín-López, B.; Beaufoy, G.; Bergmeier, E.; Kirby, K.; Montero, M.J.; Moreno, G.; Oteros-Rozas, E.; Van Uytvanck, J. Wood-pastures of Europe: Geographic coverage, social–ecological values, conservation management, and policy implications. Biol. Conserv. 2015, 190, 70–79. [Google Scholar] [CrossRef]
  11. Eurostat. LUCAS—Land Use and Land Cover Survey. 2021. Available online: https://ec.europa.eu/eurostat/databrowser/view/LAN_LCV_OVW__custom_7683636/default/bar?lang=en (accessed on 3 September 2022).
  12. Sitters, J.; Wubs, E.R.J.; Bakker, E.S.; Crowther, T.W.; Adler, P.B.; Bagchi, S.; Bakker, J.D.; Biederman, L.; Borer, E.T.; Cleland, E.E.; et al. Nutrient availability controls the impact of mammalian herbivores on soil carbon and nitrogen pools in grasslands. Glob. Chang. Biol. 2020, 26, 2060–2071. [Google Scholar] [CrossRef]
  13. Pellis, G.; Chiti, T.; Rey, A.; Curiel Yuste, J.; Trotta, C.; Papale, D. The ecosystem carbon sink implications of mountain forest expansion into abandoned grazing land: The role of subsoil and climatic factors. Sci. Total Environ. 2019, 672, 106–120. [Google Scholar] [CrossRef] [PubMed]
  14. Pulido, M.; Schnabel, S.; Lavado Contador, J.F.; Lozano-Parra, J.; Gómez-Gutiérrez, Á.; Brevik, E.C.; Cerdà, A. Reduction of the frequency of herbaceous roots as an effect of soil compaction induced by heavy grazing in rangelands of SW Spain. CATENA 2017, 158, 381–389. [Google Scholar] [CrossRef]
  15. Shah, A.N.; Tanveer, M.; Shahzad, B.; Yang, G.; Fahad, S.; Ali, S.; Bukhari, M.A.; Tung, S.A.; Hafeez, A.; Souliyanonh, B. Soil compaction effects on soil health and cropproductivity: An overview. Environ. Sci. Pollut. Res. 2017, 24, 10056–10067. [Google Scholar] [CrossRef] [PubMed]
  16. Rolo, V.; López-Díaz, M.L.; Moreno, G. Shrubs affect soil nutrients availability with contrasting consequences for pasture understory and tree overstory production and nutrient status in Mediterranean grazed open woodlands. Nutr. Cycl. Agroecosystems 2012, 93, 89–102. [Google Scholar] [CrossRef]
  17. Seddaiu, G.; Bagella, S.; Pulina, A.; Cappai, C.; Salis, L.; Rossetti, I.; Lai, R.; Roggero, P.P. Mediterranean cork oak wooded grasslands: Synergies and trade-offs between plant diversity, pasture production and soil carbon. Agrof. Syst. 2018, 92, 893–908. [Google Scholar] [CrossRef]
  18. La Mantia, T.; Gristina, L.; Rivaldo, E.; Pasta, S.; Novara, A.; Rühl, J. The effects of post-pasture woody plant colonization on soil and aboveground litter carbon and nitrogen along a bioclimatic transect. Iforest Biogeosci. For. 2013, 6, 238–246. [Google Scholar] [CrossRef]
  19. European Commission. Nature Restoration Law—For People, Climate, and Planet; Publications Office of the European Union: Brussels, Belgium, 2023. [Google Scholar]
  20. Canadell, J.G.; Raupach, M.R. Managing forests for climate change mitigation. Science 2008, 320, 1456–1457. [Google Scholar] [CrossRef]
  21. Wieczorkowski, J.D.; Lehmann, C.E.R. Encroachment diminishes herbaceous plant diversity in grassy ecosystems worldwide. Glob. Chang. Biol. 2022, 28, 5532–5546. [Google Scholar] [CrossRef]
  22. Oggioni, S.D.; Ochoa-Hueso, R.; Peco, B. Livestock grazing abandonment reduces soil microbial activity and carbon storage in a Mediterranean Dehesa. Appl. Soil Ecol. 2020, 153, 103588. [Google Scholar] [CrossRef]
  23. Bueno, R.S.; García, D.; Galetti, M.; La Mantia, T. Past cover modulates the intense and spatially structured natural regeneration of woody vegetation in a pastureland. Plant Ecol. 2020, 221, 205–218. [Google Scholar] [CrossRef]
  24. Oksuz, D.P.; Aguiar, C.A.S.; Tápia, S.; Llop, E.; Lopes, P.; Serrano, A.R.M.; Leal, A.I.; Branquinho, C.; Correia, O.; Rainho, A.; et al. Increasing biodiversity in wood-pastures by protecting small shrubby patches. For. Ecol. Manag. 2020, 464, 118041. [Google Scholar] [CrossRef]
  25. Paracchini, M.L.; Petersen, J.E.; Hoogeveen, Y.; Bamps, C.; Burfield, I.; van Swaay, C. High Nature Value Farmland in Europe. An Estimate of the Distribution Patterns on the Basis of Land Cover and Biodiversity Data; EUR 23480 EN. JRC47063; OPOCE: Luxembourg, 2008. [Google Scholar]
  26. Vidaković, A.; Liber, Z.; Šatović, Z.; Idžojtić, M.; Volenec, I.; Zegnal, I.; Pintar, V.; Radunić, M.; Poljak, I. Phenotypic Diversity of Almond-Leaved Pear (Pyrus spinosa Forssk.) along Eastern Adriatic Coast. Forests 2021, 12, 1630. [Google Scholar] [CrossRef]
  27. Falcinelli, F.; Moraldi, M. Il pero mandorlino (Pyrus amygdaliformis Villars.). Sherwood For. Ed Alberi Oggi 2001, 68, 39–42. [Google Scholar]
  28. Bueno, R.S.; García, D.; Galetti, M.; La Mantia, T. Trophic and spatial complementarity on seed dispersal services by birds, wild mammals, and cattle in a Mediterranean woodland pasture. Glob. Ecol. Conserv. 2021, 31, e01880. [Google Scholar] [CrossRef]
  29. Badalamenti, E.; La Mantia, T.; La Mantia, G.; Cairone, A.; La Mela Veca, D. Living and Dead Aboveground Biomass in Mediterranean Forests: Evidence of Old-Growth Traits in a Quercus pubescens Willd. s.l. Stand. Forests 2017, 8, 187. [Google Scholar] [CrossRef]
  30. Badalamenti, E.; Pasta, S.; La Mantia, T.; La Mela Veca, D.S. Criteria to identify old-growth forests in the Mediterranean: A case study from Sicily based on literature review and some management proposals. Feddes Repert. 2018, 129, 25–37. [Google Scholar] [CrossRef]
  31. Gianguzzi, L.; La Mantia, A. Le serie di vegetazione della riserva “Bosco Ficuzza, Rocca Busambra, Bosco del Cappeliere e Gorgo del Drago” (Provincia di Palermo). Nat. Sic. 2004, 28, 265–326. [Google Scholar]
  32. Bazan, G.; Marino, P.; Guarino, R.; Domina, G.; Schicchi, R. Bioclimatology and Vegetation Series in Sicily: A Geostatistical Approach. Ann. Bot. Fenn. 2015, 52, 1–18. [Google Scholar] [CrossRef]
  33. Fierotti, G.; Dazzi, C.; Raimondi, S. Carta dei suoli della Sicilia (scala 1: 250.000). Regione Siciliana, Assessorato Territorio e Ambiente. Università degli studi di Palermo, Facoltà di Agraria. Istituto di Agronomia Generale, Cattedra di Pedologia. 1988. [Google Scholar]
  34. Bianchetto, E.; Buscemi, I.; Corona, P.; Giardina, G.; La Mantia, T.; Pasta, S. Fitting the Stocking Rate with Pastoral Resources to Manage and Preserve Mediterranean Forestlands: A Case Study. Sustainability 2015, 7, 7232–7244. [Google Scholar] [CrossRef]
  35. Gschwantner, T.; Schadauer, K.; Vidal, C.; Lanz, A.; Tomppo, E.; di Cosmo, L.; Robert, N.; Englert Duursma, D.; Lawrence, M. Common Tree Definitions for National Forest Inventories in Europe. Silva Fenn. 2009, 43, 303–321. [Google Scholar] [CrossRef]
  36. Boyce, R.L.; Ocasio, M. Pyrus calleryana allometric equations and stand structure in southwestern Ohio and northern Kentucky. Invasive Plant Sci. Manag. 2020, 13, 239–246. [Google Scholar] [CrossRef]
  37. Tabacchi, G.; Di Cosmo, L.; Gasparini, P.; Morelli, S. Stima del Volume e Della Fitomassa Delle Principali Specie Forestali Italiane. Equazioni di Previsione, Tavole del Volume e Tavole Della Fitomassa Arborea Epigea; Consiglio per la Ricerca e la sperimentazione in Agricoltura, Unità di Ricerca per il Monitoraggio e la Pianificazione Forestale: Trento, Italy, 2011. [Google Scholar]
  38. Meier, E. Identifying and Using Hundreds of Woods Worldwide. Wood Database. 2015. Available online: https://www.wood-database.com/wp-content/uploads/wood-book-sample.pdf (accessed on 7 December 2021).
  39. Pregitzer, K.S.; Euskirchen, E.S. Carbon cycling and storage in world forests: Biome patterns related to forest age. Glob. Chang. Biol. 2004, 10, 2052–2077. [Google Scholar] [CrossRef]
  40. Silva, J.S.; Rego, F.C.; Martins-Loução, M.A. Belowground traits of mediterranean woody plants in a Portuguese shrubland. Ecol. Mediterr. 2002, 28, 5–13. [Google Scholar] [CrossRef]
  41. Marziliano, P.A.; Lafortezza, R.; Medicamento, U.; Lorusso, L.; Giannico, V.; Colangelo, G.; Sanesi, G. Estimating belowground biomass and root/shoot ratio of Phillyrea latifolia L. in the Mediterranean forest landscapes. Ann. For. Sci. 2015, 72, 585–593. [Google Scholar] [CrossRef]
  42. Olff, H.; Van Andel, J.; Bakker, J.P. Biomass and Shoot/Root Allocation of Five Species from a Grassland Succession Series at Different Combinations of Light and Nutrient Supply. Funct. Ecol. 1990, 4, 193–200. [Google Scholar] [CrossRef]
  43. De Long, J.R.; Jackson, B.G.; Wilkinson, A.; Pritchard, W.J.; Oakley, S.; Mason, K.E.; Stephan, J.G.; Ostle, N.J.; Johnson, D.; Baggs, E.M.; et al. Relationships between plant traits, soil properties and carbon fluxes differ between monocultures and mixed communities in temperate grassland. J. Ecol. 2019, 107, 1704–1719. [Google Scholar] [CrossRef] [PubMed]
  44. Passalacqua, N.G.; Aiello, S.; Bernardo, L.; Gargano, D. Monitoring biomass in two heterogeneous mountain pasture communities by image based 3D point cloud derived predictors. Ecol. Indic. 2021, 121, 107126. [Google Scholar] [CrossRef]
  45. Ma, S.; He, F.; Tian, D.; Zou, D.; Yan, Z.; Yang, Y.; Zhou, T.; Huang, K.; Shen, H.; Fang, J. Variations and determinants of carbon content in plants: A global synthesis. Biogeosciences 2018, 15, 693–702. [Google Scholar] [CrossRef]
  46. Baruah, T.C.; Barthakur, H.P. A Textbook of Soil Analysis; Vikas Publishing House PVT LTD: New Delhi, India, 1997. [Google Scholar]
  47. Blake, G.R.; Hartge, K.H. Bulk Density. In Methods of Soil Analysis; Klute, A., Ed.; American Society of Agronomy, Soil Science Society of America: Madison, WI, USA, 1986; pp. 363–375. [Google Scholar] [CrossRef]
  48. R Core Team. R: A Language and Environment for Statistical Computing; Version 4.1.2; R Foundation for Statistical Computing: Vienna, Austria, 2021. [Google Scholar]
  49. Jendoubi, D.; Liniger, H.; Ifejika Speranza, C. Impacts of land use and topography on soil organic carbon in a Mediterranean landscape (north-western Tunisia). SOIL 2019, 5, 239–251. [Google Scholar] [CrossRef]
  50. Papini, R.; Valboa, G.; Favilli, F.; L’Abate, G. Influence of land use on organic carbon pool and chemical properties of Vertic Cambisols in central and southern Italy. Agric. Ecosyst. Environ. 2011, 140, 68–79. [Google Scholar] [CrossRef]
  51. Romanyà, J.; Rovira, P. An appraisal of soil organic C content in Mediterranean agricultural soils. Soil Use Manag. 2011, 27, 321–332. [Google Scholar] [CrossRef]
  52. Salis, M.; Sepe, L.; Francaviglia, R.; Fedrizzi, M.; Bazzoffi, P.; Claps, S.; Pitzalis, M.; Lilliu, M.; Ruda, P.; Sabia, E.; et al. Environmental effectiveness of GAEC cross-compliance Standard 4.1 (b, c) ‘Protection of permanent pasture land’ and economic evaluation of the competitiveness gap for farmers. Ital. J. Agron. 2015, 10, 714. [Google Scholar] [CrossRef]
  53. Seddaiu, G.; Porcu, G.; Ledda, L.; Roggero, P.P.; Agnelli, A.; Corti, G. Soil organic matter content and composition as influenced by soil management in a semi-arid Mediterranean agro-silvo-pastoral system. Agric. Ecosyst. Environ. 2013, 167, 1–11. [Google Scholar] [CrossRef]
  54. Pellis, G. Data for: Ecosystem carbon sink capacity of mountainous forests expansion over abandoned grazing land: The role of subsoil and climatic factors v1. Mendeley Data 2019. [Google Scholar] [CrossRef]
  55. Chiti, T.; Emanuele, B.; Guido, P.; Lucia, P.; Vincenza, C.M.; Riccardo, V. Soil organic carbon pool’s contribution to climate change mitigation on marginal land of a Mediterranean montane area in Italy. J. Environ. Manag. 2018, 218, 593–601. [Google Scholar] [CrossRef]
  56. Moreno, G.; Obrador, J.J.; García, A. Impact of evergreen oaks on soil fertility and crop production in intercropped dehesas. Agric. Ecosyst. Environ. 2007, 119, 270–280. [Google Scholar] [CrossRef]
  57. Rossetti, I.; Bagella, S.; Cappai, C.; Caria, M.C.; Lai, R.; Roggero, P.P.; Martins da Silva, P.; Sousa, J.P.; Querner, P.; Seddaiu, G. Isolated cork oak trees affect soil properties and biodiversity in a Mediterranean wooded grassland. Agric. Ecosyst. Environ. 2015, 202, 203–216. [Google Scholar] [CrossRef]
  58. Serrano, J.M.; Shahidian, S.; da Silva, J.M.; Carvalho, M. Monitoring of soil organic carbon over 10 years in a Mediterranean silvo-pastoral system: Potential evaluation for differential management. Precis. Agric. 2016, 17, 274–295. [Google Scholar] [CrossRef]
  59. Sharrow, S.H. Soil compaction by grazing livestock in silvopastures as evidenced by changes in soil physical properties. Agrof. Syst. 2007, 71, 215–223. [Google Scholar] [CrossRef]
  60. Golodets, C.; Kigel, J.; Sternberg, M. Recovery of plant species composition and ecosystem function after cessation of grazing in a Mediterranean grassland. Plant Soil 2010, 329, 365–378. [Google Scholar] [CrossRef]
  61. Navarro Cerrillo, R.; Oyonarte, P. Estimation of above-ground biomass in shrubland ecosystems of southern Spain. Investig. Agraria. Sist. Y Recur. For. 2006, 15, 197–207. [Google Scholar] [CrossRef]
  62. Corona, P.; Pasta, S.; Giardina, G.; La Mantia, T. Assessing the biomass of shrubs typical of Mediterranean pre-forest communities. Plant Biosyst. Int. J. Deal. All Asp. Plant Biol. 2012, 146, 252–257. [Google Scholar] [CrossRef]
  63. Zribi, L.; Mouillot, F.; Guibal, F.; Rejeb, S.; Rejeb, M.N.; Gharbi, F. Deep Soil Conditions Make Mediterranean Cork Oak Stem Growth Vulnerable to Autumnal Rainfall Decline in Tunisia. Forests 2016, 7, 245. [Google Scholar] [CrossRef]
  64. Maetzke, F.; Cullotta, S.; La Mantia, T.; La Mela Veca, D.; Pizzurro, G. Individuazione di aree ecologicamente omogenee e di un sistema di aree a priorità di intervento per l’ampliamento della superficie forestale in Sicilia. For. Riv. Selvic. Ecol. For. 2008, 5, 280–295. [Google Scholar] [CrossRef]
  65. Damigella, P.P.; Alberghina, O. Osservazioni preliminari su alcuni “perastri” (Pyrus sp.) della Sicilia centro-orientale. Tecinica Agric. 1969, Anno XXI, 486–503. [Google Scholar]
  66. La Mantia, T.; Bueno, R.S. Colonization of eurasian jay Garrulus glandarius and holm oaks Quercus ilex: The establishment of ecological interactions in urban areas. Avocetta 2016, 40, 85–87. [Google Scholar]
Figure 1. Location of the study site (Ficuzza Natural Reserve, Sicily) and the 8 pear individuals inside the Alpe Cucco pastureland (coordinates in UTM). P1 and P2 are old and multistemmed pear individuals, P3 and P4 are old and with single stem, P5 and P6 are young and multistemmed, P7 and P8 are young and with single stem. (A) Structural appearance of one single stem pear individual and position of the diameter measurement (DBH). P3 and G3 represent the pear with its respective paired grassland patch. (B) Example of one multi-stemmed individual with position of diameter measurement (DSH). (C) Canopy view of a pear individual with the spatial configuration of the paired sampling, with the 3 soil samples collected under the pear at 0.5 m away from the main stem and two samples collected at the pastureland at 5 m. Tree images: Freepik.com.
Land 12 02135 g001
Figure 2. Boxplots with the values of SOC concentration (%), SOC stock (Mg ha−1) and bulk density (g cm−3) of soils under pasturelands and pear individuals separated by tree structure (single stem or multi-stemmed) and age.
Land 12 02135 g002
Figure 3. Comparison between the ratio (pear/pastureland) of the average values of SOC, SOC stock and bulk density for each paired site. Paired sites represent pear individual P and respective pastureland G on Table 1. P1 and P2 are old and multistemmed, P3 and P4 are old and with single stem, P5 and P6 are young and multistemmed, P7 and P8 are young and with single stem.
Land 12 02135 g003
Table 1. Mean (±SD) of SOC content, SOC stock and bulk density found in the pastureland and under pear individuals and respective t test to check for differences between them.
PasturelandPeartp
SOC (%)3.16 ± 0.683.86 ± 1.212.180.035
SOC stock (Mg ha−1)113.9 ± 30.3130.3 ± 47.11.330.188
Bulk density (g cm−3)1.24 ± 0.211.09 ± 0.17−2.490.018
Table 2. Summary of the pastureland and pear structural variables, age, tree structure and average (±SD) values of bulk density, soil organic carbon (SOC) concentration, SOC stock, biomass C stock, total C stock, and concentration (%) of carbon biomass to total C stock.
Land UseIDAgeTree StructureDBH (cm)Canopy Cover (m2)Height (m)Bulk Density (g cm−3)SOC (%)SOC Stock (Mg ha−1)Biomass C Stock (Mg ha−1)Total C Stock (Mg ha−1)C Biomass/C Total (%)
PearP1oldmulti27.330.664.80.87 (±0.03)3.50 (±0.43)93.41 (±11.37)3.4296.833.53
P2oldmulti32.832.965.11.13 (±0.03)6.49 (±0.49)224.87 (±17.08)4.49229.361.96
P3oldsingle41.536.836.21.15 (±0.03)2.81 (±0.65)98.69 (±23.07)7.53106.217.09
P4oldsingle27.421.384.61.28 (±0.06)3.70 (±0.19)142.88 (±7.27)2.29145.161.58
P5youngmulti15.313.204.10.94 (±0.04)3.11 (±0.9)92.83 (±26.78)3.9996.824.12
P6youngmulti11.612.783.20.86 (±0.06)3.67 (±0.36)96.45 (±9.59)1.1297.581.15
P7youngsingle16.58.553.41.28 (±0.1)3.00 (±0.31)122.85 (±12.66)0.79123.640.64
P8youngsingle13.212.223.71.23 (±0.07)4.57 (±0.15)170.61 (±5.45)0.60171.210.35
PasturelandG1 1.25 (±0.06)3.24 (±0.08)117.67 (±3.01)1.75119.411.46
G2 1.54 (±0.04)2.74 (±0.81)128.24 (±37.83)1.75129.991.34
G3 0.92 (±0.02)4.02 (±1.18)124.02 (±7.88)1.75125.771.39
G4 1.11 (±0.01)2.95 (±0.29)78.64 (±7.83)1.7580.392.17
G5 1.1 (±0.03)2.66 (±0.94)70.89 (±25.06)1.7572.642.41
G6 1.29 (±0.03)2.68 (±0.73)107.08 (±28.96)1.75108.821.61
G7 1.3 (±0.01)3.39 (±0.23)131.59 (±9.04)1.75133.331.31
G8 1.44 (±0.03)3.60 (±0.29)153.20 (±6.39)1.75154.951.13
Table 3. Results of the multiple linear regression testing for the effects of structural traits and differences between age and tree structure of pear individuals in SOC, SOC stock and bulk density. In round brackets the reference variable.
SOCSOC StockBulk Density
EstimateSEtpEstimateSEtpEstimateSEtp
Intercept1.310.0621.67<0.0001130.3210.4412.48<0.00011.090.0252.47<0.0001
Diameter−0.430.29−1.460.162−28.7850.53−0.570.5760.120.101.200.247
Height0.050.180.300.7700.2930.960.010.993−0.050.06−0.790.437
Cover0.130.150.890.38411.0925.540.430.669−0.040.05−0.860.402
Age (young)−0.300.17−1.780.092−27.3229.43−0.930.3660.030.060.490.628
Tree structure (single)0.040.100.380.70911.2216.570.680.5070.110.033.240.004
Table 4. Summary of SOC concentration (in ascending order within bioclimate), SOC stock, soil type, soil depth and bulk density inside each of the three broad Mediterranean bioclimates (Thermo = Thermo-Mediterranean; Meso = Meso-Mediterranean; Supra = Supra-Mediterranean) and study regions of the Mediterranean pasturelands used as references values in this study.
SOC
(%)
SOC Stock
(Mg ha−1)
BioclimateSoil TypeSoil Depth (cm)Bulk Density (g cm−3)Region (Country)Reference
0.74-ThermoVertisols0–20-Wadi Beja (Tunisia)[49]
1.2270.0ThermoVertic Cambisols0–401.43Calabria (Italy)[50]
1.2935.7ThermoEndoleptic Regosols0–301.43Sicily (Italy)[18]
1.12-MesoDifferent types0–25-Spain[51]
1.1350.6MesoDystric Cambisols0–301.47La Rioja (Spain)[9]
1.99-Meso-0–30-Sardinia (Italy)[52]
2.0382.0MesoTypic Dystroxerept0–35-Sardinia (Italy)[53]
2.11-Meso-0–30-Calabria (Italy)[52]
2.2454.2MesoEndoleptic Regosols0–301.30Sicily (Italy)[18]
3.86130.3MesoVertic Haploxeralfs0–301.09Sicily (Italy)Our study (Pyrus)
3.16113.9MesoVertic Haploxeralfs0–301.24Sicily (Italy)Our study (Grassland)
3.1173.3SupraHaplic Luvisols0–301.27Sicily (Italy)[18]
2.7185.0SupraPhaeozems0–301.32Apenin (Italy)[54]
3.8991.0SupraCambisols0–301.34Apenin (Italy)[55]
Disclaimer/Publisher’s Note: The statements, opinions and data contained in all publications are solely those of the individual author(s) and contributor(s) and not of MDPI and/or the editor(s). MDPI and/or the editor(s) disclaim responsibility for any injury to people or property resulting from any ideas, methods, instructions or products referred to in the content.

