1. Introduction
As an urban element with multiple identities, street space is an essential part of the urban form and built environment, performing transport functions that connect elements of the urban environment and being the main medium for urban public activities [
1,
2]. Streets support people’s participation in various activities such as social interaction, daily living, recreation, commerce, and tourism [
3,
4,
5,
6]. With the increasing recognition of the importance of urban street space, the quality of urban street space has attracted the attention of scholars worldwide, and many studies have been conducted to assess the quality of street space [
7,
8]. Street space is shaped by the objects that define the sides of the street. These objects include buildings, trees, and other structures. The quality of the built form plays a dominant role, and the interface of buildings along the street is key [
9,
10]. The discussion of the character of the street space, therefore, focuses on the geometric features, variation, continuity, hierarchy, and other factors of the interfaces between buildings on both sides of the street, as well as the relationship between the interfaces. Quantifying the characteristics of the street space means translating these geometric relationships into data relationships without losing the geometric characteristics of the street space. In this way, it is possible to explore in depth the changes in the physical environment of the street, such as the wind environment and the visual perception of the street due to changes in the heights, widths, and complexity of the forms of the buildings, as well as the distances between the buildings on either side of the street.
Over the past few decades, a considerable number of studies have explored ways to quantify urban morphology from different perspectives and have developed a variety of morphological metrics to measure different characteristics of urban form. Fleischmann et al. have systematically summarised 361 measurable characteristics of urban form through a review of 72 representative quantitative studies [
11]. Specifically, these characteristics include different descriptions of street morphology, including metrics describing basic dimensions such as street length, width, and height [
12,
13,
14]; shape-related metrics such as height-to-width ratio, fractal dimension, and corridor effects [
15,
16,
17]; and street network-related metrics such as connectivity, integration, intelligibility, and node density [
18,
19,
20]. These studies show that there is a solid basis for quantitative research on the spatial morphology of streets. However, current measures of street morphology tend to focus on the overall characteristics of the street, such as overall size, shape, network structure, density, and complexity. The quantitative representation of the tangible form of streets, which is of greater interest to urban designers, i.e., the three-dimensional spatial interface morphological characteristics of streets and their detailed variations, remains relatively limited. As pointed out by Handy et al., current measures used for urban design are relatively crude and refined measures are needed for urban spatial analysis [
21].
Classic academic works have repeatedly demonstrated that the physical form of street space has a significant impact on the quality of the urban physical environment in many aspects [
22,
23,
24,
25]. The variability of the street spatial form affects the visual perception of the streetscape and street activities [
26]. In particular, the extent to which vertical elements (mainly buildings along the street) visually continue the street and the visual richness created by variations in building height and setback are key urban design qualities in terms of the physical character of the street and its imageability and transparency [
8,
27,
28]. In addition, the geometric characteristics of the street space have a key impact on natural light, solar radiation, airflow, and microclimate of the urban public spaces, which are crucial in high-density urban centres [
29,
30,
31,
32]. Particularly in recent years, the growing concern for the quality of the urban environment has triggered many studies on the relationship between the geometry of urban street spaces and the local wind environment. These studies explore the relationship between the morphological characteristics of streets and the wind environment, intending to provide a means to control the design of high-quality urban street spaces [
33]. The spatial characteristics of actual streets are complex and variable and directly influence the wind environment within the street. While understanding the wind environment at a specific location on the street may be of minor importance, understanding the quality of the wind environment within a street is of great interest to urban designers and residents who move through urban street spaces. One of the first tasks in exploring the relationship between the actual complex street spatial morphology and the local wind environment is to investigate how changes in street spatial morphology can be expressed quantitatively.
This paper attempts to explore a method to quantify the three-dimensional spatial morphological characteristics of complex urban streets. To quantitatively describe the spatial morphological characteristics of the whole street, we propose a set of morphological parameters, including average width, average aspect ratio, proportion of secondary interfaces, proportion of opening length, and proportion of intersection length. For the quantitative description of street morphological changes, we propose twelve morphological parameters characterising street changes based on opening and building effective points, including the number of opening effective points, length of opening, total opening length, the density of opening effective points, concentration of opening effective points, length difference of opening effective points, number of building effective points, aspect ratio, building height ratio, density of building effective points, concentration of building effective points, and AR difference of building effective points. The changing features of street form, including the number, size and location of street openings, as well as the changes in building heights and widths on both sides of the street, could be effectively captured, providing a more accurate and in-depth way to quantify the details and changing features of street morphology. In this study, the applicability and feasibility of the proposed quantitative method in real and complex urban streets are verified by quantitatively analysing street cases with different morphological characteristics in the central area of Nanjing, China, and by combining the local wind environment, an objective factor strongly influenced by the change of street spatial forms. The effects of different street morphological parameters on the local wind environment of the streets are analysed through comparison, and these results may provide some helpful guidance for urban design.
2. Research Base
To investigate the quantitative methods for urban street spatial configuration based on the local wind environment, the research base can be divided into two main parts. Firstly, the relevant literature on quantitative methods for urban street spatial morphology is reviewed, focusing on quantitative approaches capable of accurately describing the geometric characteristics of street interfaces. Secondly, attention is given to the literature discussing the relationship between the geometric characteristics of streets and the local wind environment, which would provide a theoretical basis for the validity of the quantitative approach.
2.1. Street Morphology Measurements in Literature
Quantitative analysis of street space is an essential method for describing street space and a prerequisite for further design and control of street space. Many previous researchers have experimented with different perspectives and methods of accurately representing or measuring the spatial characteristics of urban streets. In 1984, Hillier et al. proposed Space Syntax, which allows the quantitative study of the network characteristics of two-dimensional (2D) streets [
20,
34]. Based on computer technology and graph theory, Space Syntax emphasises the use of graphical visualisation to express the accessibility, connectivity, and spatial topology of streets. Space Syntax has been used as a typical method for quantitative analysis of the planar structure of streets and is still in use today [
35,
36]. Batty proposes a feasible computational scheme for measuring isovist fields based on Benedikt’s definition and basic geometric measures (distance, area, perimeter, compactness, and convexity) and applies it to the visual analysis of streets and other spaces [
37,
38]. Cooper proposes and applies an approach to calculating the fractal dimension (Dr) of street edges [
15]. Through a fractal analysis of urban street edges, he found that the Dr of street edges expresses several variables related to the morphological characteristics of the street, including the frequency of street gaps, the type of building structure and size, and the regularity of repetition. It is also suggested that the fractal dimension of the street edge is associated with a variety of building types and sizes. Ding and Tong used viewshed analysis, a built-in tool in the Geographic Information System (GIS) platform, to analyse and compare the visual data of the street space from the perspective of visual perception, effectively distinguishing the spatial patterns of different types of streets [
39].
The studies presented above focus on the two-dimensional morphological characteristics of street space. With the vertical expansion of cities, it has become increasingly important to quantify the three-dimensional spatial characteristics of streets. Purciel et al. used variables such as average building height and proportion of visible sky to measure the enclosure and human scale of streets [
40]. Harvey et al. took a geographical perspective and used GIS in combination with spatial street data to study streets in three U.S. cities, identifying street centrelines and edges based on three-dimensional data of buildings on both sides of the street and measuring 12 streetscape variables related to street and building geometry [
27]. To investigate three-dimensional street characteristics, some researchers have attempted to simulate the network characteristics of three-dimensional pedestrian streets by increasing the height of the street network [
41,
42]. In recent years, streetscape images have become an emerging data source for street space research due to their objective representation of the spatial morphological elements of streets, easy accessibility, and large coverage. For example, Li et al. used multispectral remote sensing imagery to identify green areas in Google Street View for a quantitative study of urban street greenery in New York [
43]. Similarly, Tang and Long measured the greenery, openness, and enclosure of street spaces by identifying trees, buildings, sky, roads, and other elements in Beijing streetscape images using the SegNet tool, a machine learning segmentation method [
44].
Previous studies have enriched the knowledge of the spatial characteristics of urban streets and provided a theoretical basis for the quantitative study of street morphology. However, scientific and accurate quantitative studies of street space still need to be further enriched. Street network studies focus mainly on the topology of streets and lack the description of building forms on both sides of the street, including their scale and shape. Network studies based on space syntax inherently ignore important geometric, spatial and experiential information in urban design [
45]. While GIS tools can measure the size and arrangement of buildings, it is difficult to finely analyse the micro levels of the spatial interface of streets and the complex three-dimensional geometric features. Methods based on streetscape images can identify and process the content and number of streetscape elements quickly and in large numbers, but it is difficult to quantify the geometric and morphological features of street space. Furthermore, previous studies on street space have mainly considered streets as urban spaces with functional attributes of transportation, focusing on aspects such as how streets can improve the accessibility of urban neighbourhoods and the ease of movement of people [
19,
46,
47]. Many quantitative studies have not paid attention to the characterisation of urban streets as places for citizens to engage in public activities and the spatial form of streets at a human scale [
48]. The urban planning and design field lacks an objective and accessible way to quantitatively describe the spatial form of urban streets.
2.2. Morphological Parameters for Generic and Actual Urban Geometries
This section focuses on reviewing the morphological parameters commonly used in urban ventilation studies, which can be divided into two main categories: studies using simplified models and studies using real urban models. Simplified models generally consist of standard building geometries that form idealised urban structures. They are commonly represented by 2D and 3D urban street canyons and 3D arrays of urban elements, all aligned or staggered [
49,
50]. Aspect ratio (AR) or height-to-width ratio (H/W) [
51,
52,
53], building height or height variation [
52,
54], and roof shape [
52] are the main morphological parameters in studies using 2D street canyons. For studies using 3D street canyons, morphological parameters such as street canyon orientation [
55,
56], lateral aspect ratio (the ratio of building length to street width) [
57], length-to-height ratio [
58,
59], building setbacks [
60,
61], street openings [
62,
63], and building permeability [
64] are typically used in addition to AR [
57,
58,
59], building height or height variation [
57,
65], and roof shape [
61]. Studies using 3D urban arrays have mainly focused on morphological parameters such as AR [
66], length-to-height ratio [
66], building height or height variation [
66], array layout type [
67,
68], planar area index λp (ratio of building footprint area to land area) [
67,
68], frontal area index λf [
69,
70], and orientation [
71].
Due to the large difference between the simplified model and the real urban space, ideal or simplified models cannot fully represent the morphological complexity of the real urban area. Therefore, it is essential to study the ventilation of the real urban area in detail. However, the number of studies using real urban models is relatively small [
50]. Shen et al. investigated the relationship between street morphology and street ventilation as well as pollutant dispersion by studying six real street cases in different countries and concluded that the morphological features such as street width and intersection type are closely related to street airflow patterns [
72]. Javanroodi et al. generated and evaluated 1600 city models to study the relationship between urban density, building form, urban pattern and ventilation potential, and found that building density and mean wind speed are positively correlated, and that building form and urban pattern also affect mean wind speed in cities [
73]. Tsichritzis and Nikolopoulou simulated more than twenty different urban areas in London under eight wind directions and found that facade area ratio is an important morphological parameter affecting mean wind speed and pedestrian comfort [
74]. Fabiana Trindade da Silva et al. found that aspect ratio alone is not sufficient to analyse street ventilation because openings affect the wind environment in the street, and that block type is also an important factor affecting the wind environment, by studying the relationship between neighbourhoods and wind environment for five types of neighbourhoods with different urban morphologies [
75]. Li et al. took Xinjiekou in Nanjing as a study area to investigate the correlation between subspace SVF and ventilation conditions using CFD simulations. It was found that the correlation was moderate and that SVF has limitations in reflecting the effects of all morphological characteristics on ventilation conditions [
76]. Palusci et al. studied the relationship between urban form parameters and urban ventilation in large compact areas of Rome and found that urban ventilation deteriorates significantly with increasing building density [
50]. He et al. applied several morphological parameters to several typical urban areas in Hong Kong and used linear regression analysis to correlate the morphological parameters with wind tunnel data, showing a positive correlation between pedestrian ventilation performance and urban permeability [
77].
Compared to morphological parameters describing buildings, urban blocks, neighbourhoods, urban density, and urban patterns, there are few studies investigating the relationship between the morphological parameters of actual urban streets and the local urban wind environment. The morphological parameters of actual complex streets are usually difficult to define, and many studies lack mature and effective quantitative tools to describe and explore the morphological characteristics of real complex streets, which makes it difficult to study the relationship between the morphological parameters of actual streets and the local wind environment. In actual urban streets, there are morphological variations in the street interface, including but not limited to variations in street width, variations in building height, and street openings, which are key factors affecting the local wind environment of urban streets. Therefore, this study starts by studying the variation of complex urban street interfaces and explores a complete, accurate and simple quantitative approach for urban streets to provide a new tool for related researchers to study the relationship between real complex street morphology characteristics and the local wind environment.
3. Cases and Methods
3.1. Study Area
Nanjing, the capital of Jiangsu Province in China, is a major hub city in the Yangtze River Delta region, making it a representative megacity of China. The Xinjiekou area, located in the geographical centre of Nanjing, has been the city centre since the implementation of the “Capital Plan” in 1929 [
78]. This urban development plan determined the street layout in the area, consisting of a grid system with avenues running east–west and north–south [
79] (
Figure 1). Due to its favourable road connections and abundant open space, the Xinjiekou area has gradually developed into the most densely built and functionally overlapping area in Nanjing, with a high population concentration and frequent outdoor public activities. The area presents a diverse urban environment with different building types, including large commercial complexes, offices, cultural buildings, and residential buildings. The area has a diverse street hierarchy consisting of urban arterials, secondary arterials, side streets and alleys, with various street layouts predominantly east–west and north–south. These elements combine to form a rich and complex urban street pattern, with a variety of street widths, spatial forms, and building layouts at street level. Due to the diverse, complex, and typical urban morphology, Xinjiekou has become a popular research area for urban morphology studies [
79,
80,
81]. Recently, our team has conducted extensive research in this area, resulting in the acquisition of rich information and experimental data on the spatial analysis and quantification of urban morphology and local wind environment [
76,
78,
82]. In this study, the Xinjiekou area was selected as the study area due to its substantial research base and the presence of street cases with different morphological characteristics. The aim is to determine the applicability and validity of the quantitative approach in different complicated street cases through verification tests conducted in this area.
This paper selected twenty streets with typical spatial morphological characteristics in the study area. Among these streets, eleven run in a north–south orientation, or approximately so, and nine run in an east–west orientation, or approximately so. From the perspective of urban planning and design, there are three typical types of streets in the city: urban arterials, secondary arterials, and side streets. To improve comparability and readability from an urban design perspective, we first classified these street cases into three categories according to the street hierarchy to facilitate the subsequent study and analysis. Class A streets are urban arterials that are very wide. Buildings on both sides of the street are dominated by public commercial buildings, with clear differences in building heights, and both low-rise and high-rise buildings are distributed. Class B streets are mainly secondary arterials of medium width, and the buildings on both sides of the street are mainly public buildings and residential buildings. Class C streets are mainly urban side streets and narrow lanes, and the buildings on both sides of the street are mainly low-rise residential buildings. To visually represent the morphological characteristics of these three types of urban streets, we have drawn a schematic diagram of the spatial interfaces of the twenty streets (
Figure 2) and provided streetscape images (
Figure 3). The dark grey in the schematic diagram indicates the primary interface of the street, i.e., the street boundary closest to the centre of the street and pedestrians. The light grey indicates the secondary interfaces of the street, which consist of the slightly set-back boundaries of the taller buildings, usually above the lower buildings. The combination of the 3D spatial schematic and the streetscape images confirms the richness and complexity of the morphological types of the selected street cases.
3.2. Methods
3.2.1. Quantification of Street Morphological Characteristics
The three-dimensional space of an urban street consists mainly of the pavement, the street interface formed by the combination of buildings along the street, and the streetscape they surround. The street morphology is defined not only by the width of the pavement but also to a large extent by the street interface, which is an important feature of the spatiality of the street [
83]. The street interface is a physical entity resulting from the interrelationship between streets and buildings, consisting of vertical building elements and gaps between buildings. The possible differences in building heights, changes in distances between buildings, and irregular distribution of street openings on both sides of the street make the spatial form of real urban streets extremely complex, and there is a lack of effective quantitative tools to realise efficient measurements of these street spatial morphological characteristics.
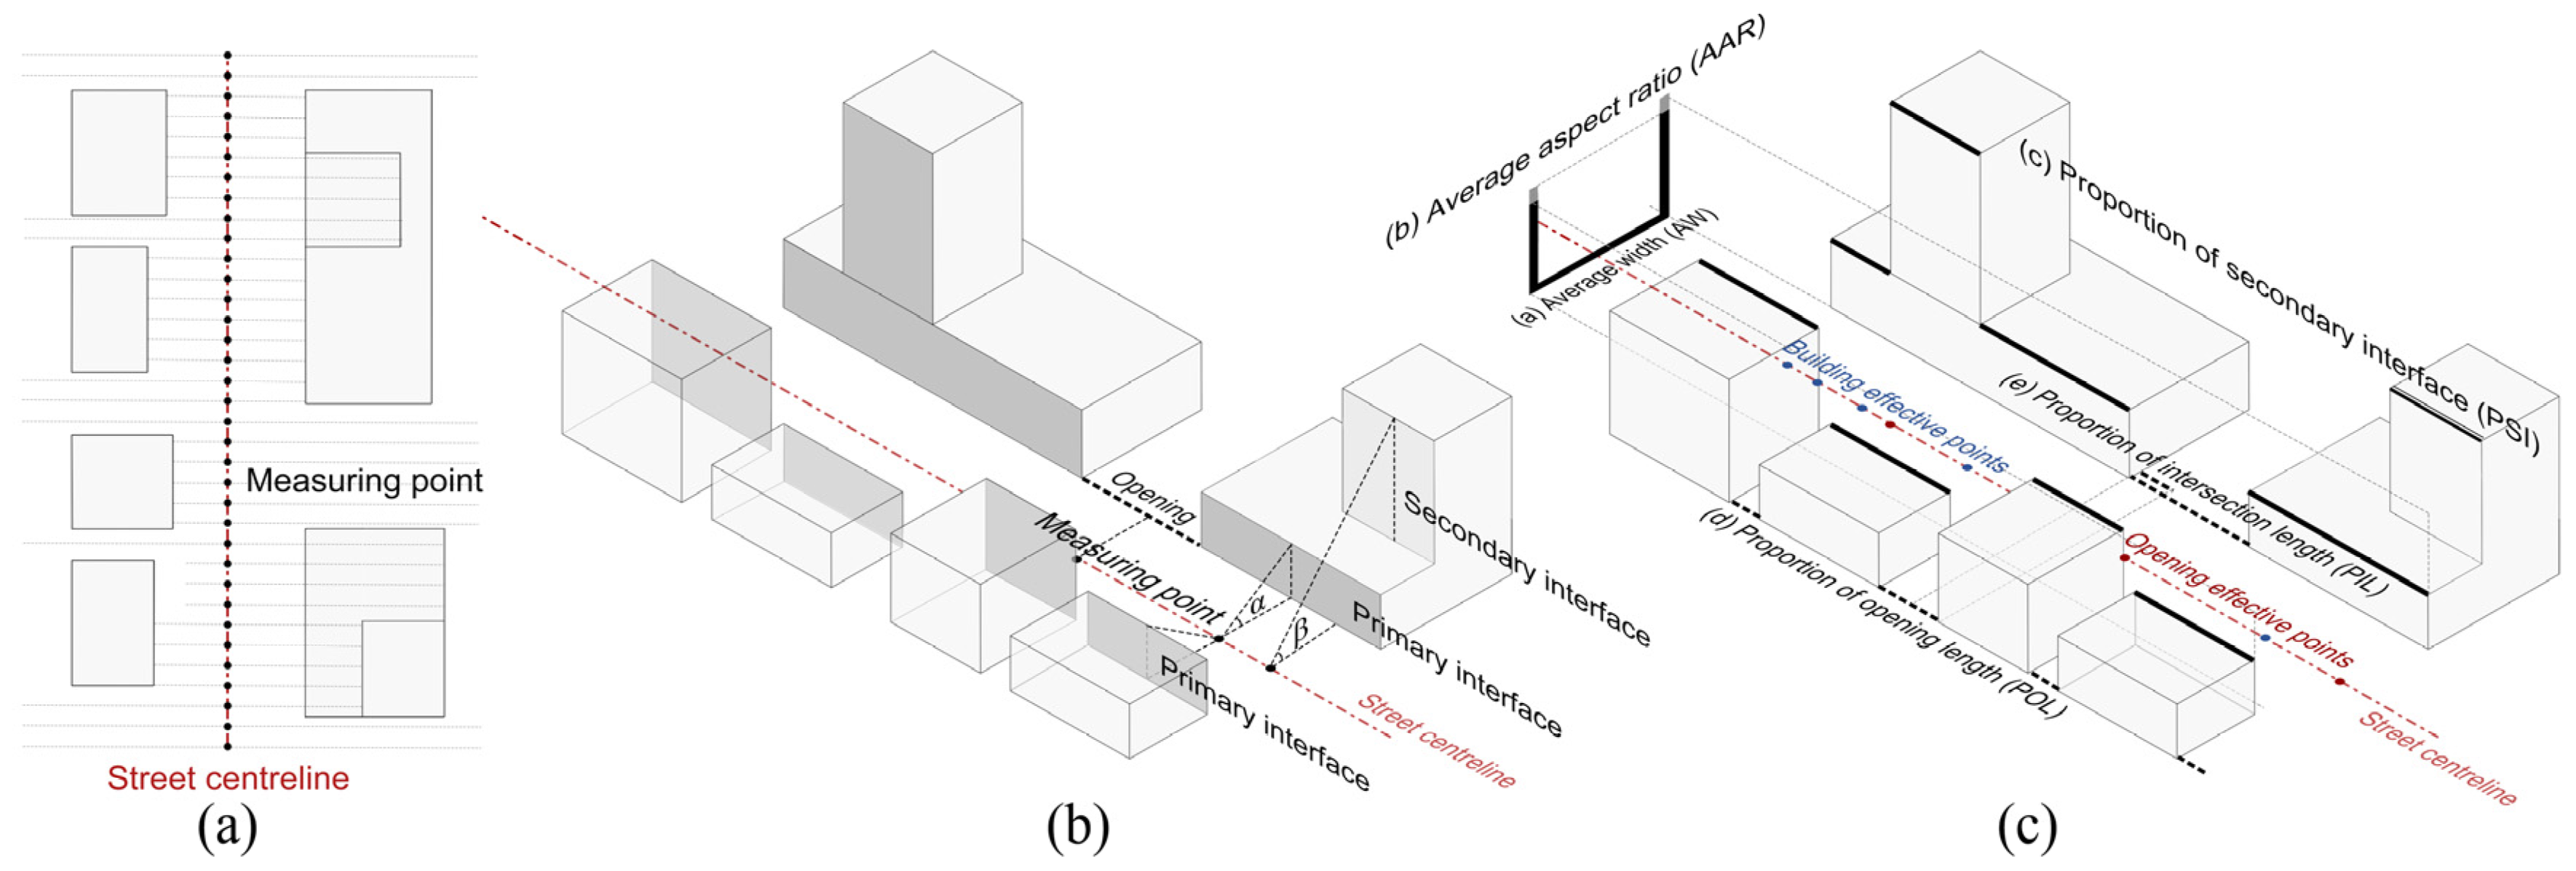
To overcome this challenge, this study develops a point-based method for measuring street morphological characteristics by combining the Grasshopper plug-in for the Rhino platform and the Python computer programming language (
Figure 4). By placing measuring points uniformly on the street centreline and sending rays from each measuring point to the left and right sides of the street, the method can obtain morphological data of the street interface integrated with the measuring point. The intersection of the rays with the physical boundaries of the street provides morphological data such as the length of the primary interface on both sides from the centre line of the street, the heights of the buildings on both sides, as well as the length of the secondary interfaces from the centre line of the street and the heights of the buildings. The rays could also identify the opening part of the street interface and measure the location, number, and length of the street openings. The measuring point interval can be set at 1 m to be fine enough to characterise the details of the street morphology [
72].
3.2.2. Street Morphological Parameters
Based on the basic street interface morphological data calculated from the measuring points, a set of street morphological parameters that can be used to describe the complex street morphology are proposed in this study and classified into the morphological parameters characterising the whole street and the street changes (
Table 1). The morphological parameters of the whole street are the basic quantitative descriptions of the street morphology, including average width (AW), average aspect ratio (AAR), proportion of secondary interfaces (PSI), proportion of opening length (POL), and proportion of intersection length (PIL). Among them, AW is the average distance between building interfaces on both sides of the street and is used to describe the width of the street in general. AAR is the ratio of the average height of the building interface on both sides of the street to the average width of the street. PSI measures the ratio of the total length of the secondary interfaces of a street to the street length and can be used to reflect the vertical setback of the street. Larger PSI values represent a higher percentage of secondary interfaces in the street. POL is defined as the ratio of the length of street openings to the street length and can describe the degree of openness of the street. Larger POL values express a greater percentage of street openings. Locations with openings on both sides of the street can be considered intersections. PIL is defined as the ratio of the total length of intersections to the street length. Larger PIL values indicate a greater percentage of street intersections, potentially allowing more airflow to pass through.
To better compare and analyse the detailed characteristics of street morphological changes, we propose morphological parameters characterising the street changes based on the street interface effective points (
Figure 4c). Considering that the morphological changes of the street interface mainly include the changes in street openings and buildings, we classify the street interface effective points into opening effective points (OEP) and building effective points (BEP). Whenever an opening exists on either side of a street, it is considered an opening. Each OEP is derived from the measuring point at the centre of each opening in the street interface. Based on the analysis of the morphological data measured at the OEP, we can calculate the number, length, and distribution of openings in the streets. The location of the openings is calculated from the distance between the opening effective point and the starting point of the street. For the BEP, it can be assumed that if the width or height of the building interface along the street changes beyond a certain threshold, the building interface at that location can be considered to have changed significantly. We take the measuring point at the centre of the building interface without significant change as the BEP. As a first attempt, we set the threshold to 1 m. By analysing the morphological data measured at the BEP, we can calculate the number and distribution of morphological changes at the building interfaces and morphological parameters such as aspect ratio and ratio of building heights on either side. The location of the BEP is calculated from the distance between each building effective point and the starting point of the street.
Furthermore, using the morphological change data measured by OEPs and BEPs, we can calculate the density, concentration and intensity of street openings and building morphological changes (
Table 1). The density of opening effective points (D_OEP) is the number of opening effective points (N_OEP) divided by the total street length and multiplied by 100, measuring the number of OEPs per 100 m unit length. The higher the D_OEP value, the higher the density of street openings. The concentration of opening effective points (C_OEP) is the coefficient of variation of the distance between OEPs, which can be used to compare the degree of the distribution of openings in different streets. The higher the value of C_OEP, the more concentrated the distribution of street openings. The length difference of opening effective points (LD_OEP) is the coefficient of variation of the length of openings (L_OEP), which can be used to quantify the intensity of the variation of the length of street openings. A higher LD_OEP value indicates greater variation in street opening length. Similarly, the density of building effective points (D_BEP) refers to the ratio of the number of building effective points (N_BEP) to the total street length, multiplied by 100, indicating the number of BEPs per 100 m length unit. The concentration of building effective points (C_BEP) refers to the coefficient of variation of the distance between building effective points. This metric can be used to compare the degree of concentration in the distribution of building form changes across different streets. The higher the value of C_BEP, the more concentrated the distribution of building form changes. AR difference of building effective points (ARD_BEP) is the coefficient of variation of AR at building effective points (AR_BEP), which can be used to quantify the intensity of variation in aspect ratio caused by the change in height or width of the street buildings. The larger the value of ARD_BEP, the more significant the difference in AR at the street building interface.
4. Data and Analysis on Street Morphological Parameters
4.1. Morphological Parameters of the Whole Street in the Xinjiekou Area
Using the proposed morphological quantitative method, we measured the street morphological parameters of the whole street of twenty street cases in the Xinjiekou area of Nanjing (
Table 2). The results show that the average widths of different types of streets vary considerably, while the AW values of streets of the same type are relatively similar. The AW values of class A streets are more than 50 m, the AW values of class B streets are between 25 and 35 m, and the AW values of class C streets are less than 25 m. In terms of the average aspect ratio, the AAR values for class A streets are low and relatively concentrated, ranging from 0.21 to 0.33. The AAR values for class B streets are higher, ranging from 0.62 to 0.84. There is a large variation in the AAR values for the different street cases within class C, with values ranging from 0.35 to 1.38. In terms of street secondary interfaces, as a high-density area in the city centre, all street cases in the Xinjiekou area have secondary interfaces, i.e., PSI values greater than 0. Among them, the PSI values of class A streets are slightly higher than those of class B and C streets, which may be because class A streets, as the main roads in the area, have more high-rise buildings on both sides. In terms of street openings, all street cases have openings, and the POL values are generally high, ranging from 0.13 to 0.5, with an average value of 0.32. The POL value for street C3 is even at 0.5. This means that almost half the length of the street consists of openings. The high POL values for most of the street cases reflect the fact that street openings play an important role in shaping the morphological characteristics of the street in the study area. Although the PIL has a lower value compared to the POL, with an average value of 0.18, it still has some influence on the morphological characteristics of the streets.
4.2. Morphological Parameters Characterising Street Changes Based on Effective Points in the Xinjiekou Area
Based on the opening and building effective points, we calculated twelve morphological parameters characterising the street changes of the street cases in the study area.
Table 3 shows the numerical results of the nine morphological parameters, N_OEP, TL_OEP, D_OEP, C_OEP, LD_OEP, N_BEP, D_BEP, C_BEP, and ARD_BEP. The other three parameters, L_OEP, AR_BEP, and BHR_BEP, have too much data because they are calculated for the corresponding position of each effective point in the street, so this part of the data is provided in the
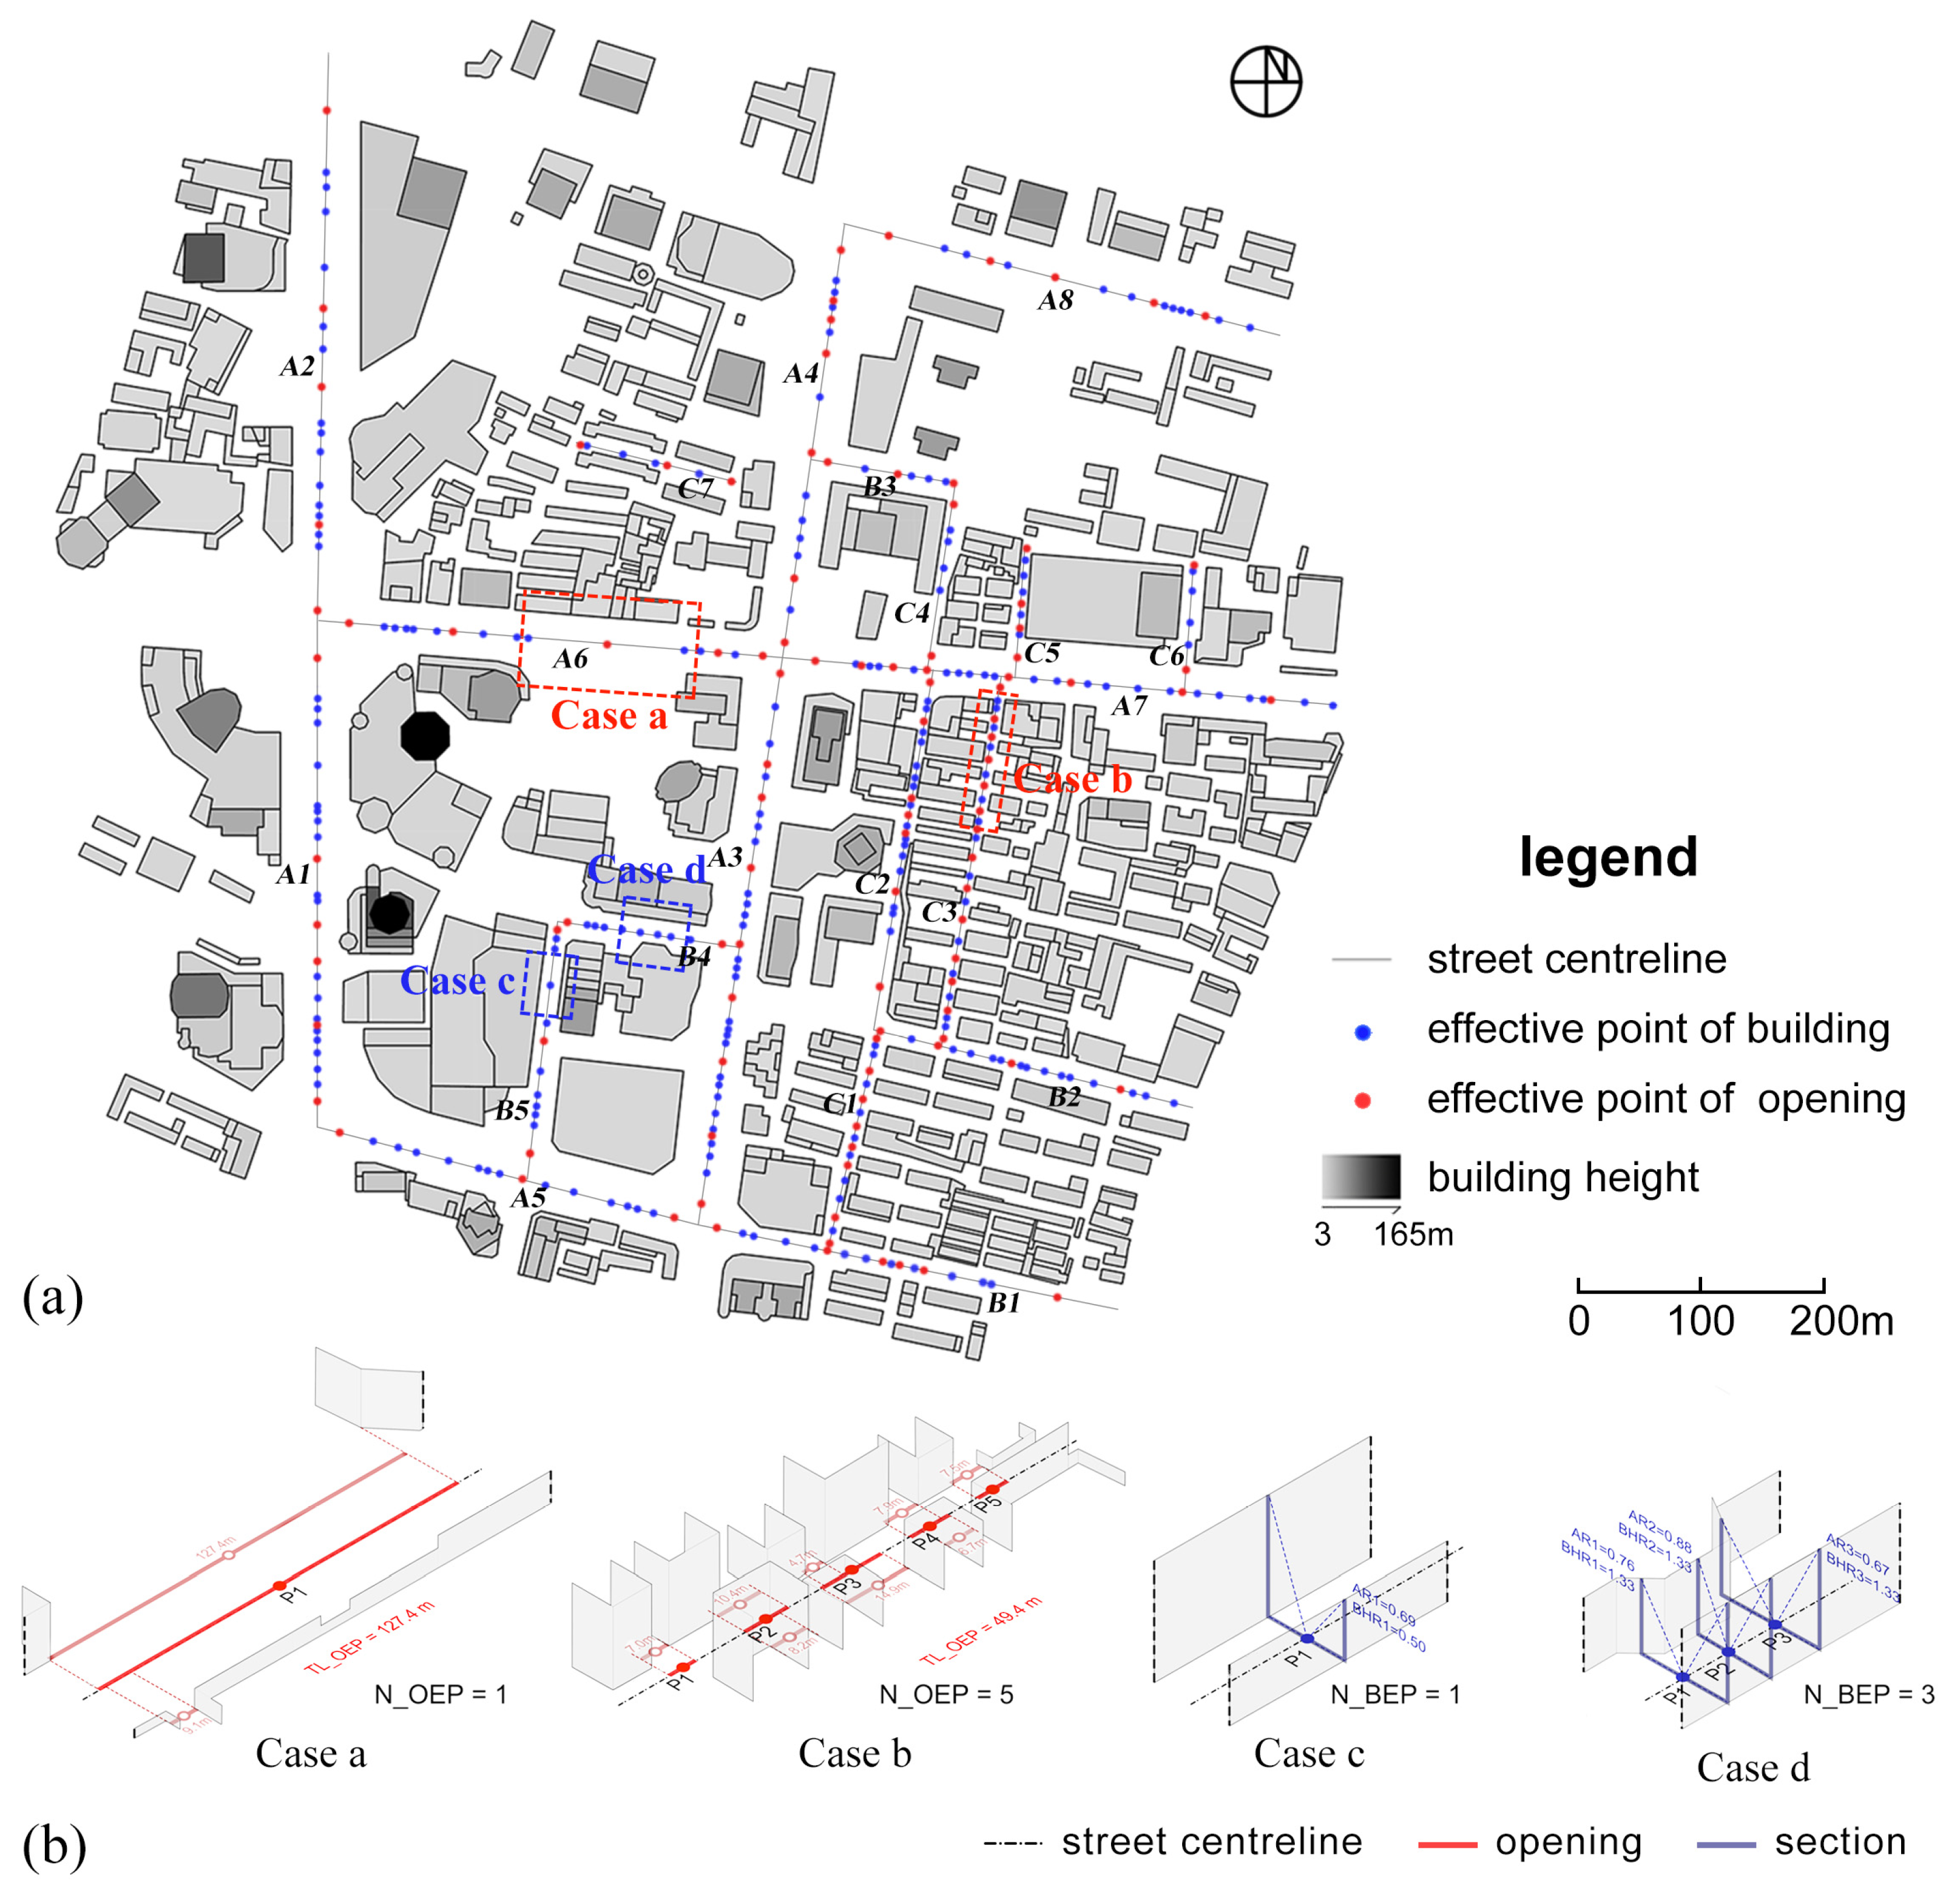
Supplementary Material: Tables S1 and S2. To visualise the distribution of these effective points, we mapped the locations and distribution of the effective points on the plan of the study area (
Figure 5a). The results clearly show that the number, density, and distribution of effective points vary from one street to another. Using four typical cases,
Figure 5b illustrates in detail the process of generating OEPs and BEPs, together with the basic data obtained from the effective points. Cases a and b illustrate two extreme examples of the morphological characteristics of street openings. Case a is taken from a section of street A6 with a N_OEP value of 1, meaning that there is only one street opening. On the other hand, case b is taken from a section of street C3, which has a much higher number of openings, with an N_OEP value of 5. The length of each opening is also different between the two cases. The L_OEP of case a is 127.4 m and those of case b are 7, 10.4, 14.9, 9.6, and 7.5 m, respectively. The OEP and the integrated morphological data can provide a detailed and comprehensive quantification of the street opening. Cases c and d show two extreme examples of morphological changes in the street building interface. Case c is taken from part of street B5 and its N_BEP is 1, indicating that the building interface of the street has not changed. Case d is taken from part of street B4, and its N_BEP is 3, which means that the building interface of the street section changes mainly three times. Besides the different number of changes in the building interface, the AR and BHR of the two cases are also different. The AR_BEP of case c is 0.69 and the BHR_BEP is 0.5. The AR_BEP of case d is 0.76, 0.88, and 0.67, respectively, and the BHR_BEP is 1.33. Thus, based on the BEP and its measured morphological parameters, we can quantify in detail the changes in width and height of the street building interface.
To compare the changing characteristics of street morphology in more detail, we analysed the street cases in the Xinjiekou area in terms of the density, concentration, and intensity of morphological change (
Figure 6).
The frequency of changes in street morphology can be quantified by the density of effective points (
Figure 6a). Streets with high effective point densities indicate frequent changes in street morphology, which may be due to dense street openings, such as street C1 and street C3, or frequent changes in the building interface, such as street B4. The density of street openings varies considerably between the twenty streets. Some streets have no openings, such as street B4 and street C6, which have a minimum D_OEP of 0. The maximum value of D_OEP is 4.41 (street C3), which means that there are 4.41 openings per 100 m. The average D_OEP of class C streets is 2.03, almost double that of class A and B streets. This suggests that narrower streets in the study area tend to have a higher density of street openings. The effective point density can be calculated by adding the D_OEP and D_BEP. It can be observed that the mean effective point density is higher for class C streets than for class A and B streets, suggesting that morphological changes tend to occur more frequently on narrower streets, mainly because these streets tend to have a higher density of openings.
The degree of concentration of the distribution of street morphological changes can be quantified by the concentration of effective points (
Figure 6b). A higher concentration indicates a more concentrated and uneven distribution of street morphological changes, while a low concentration indicates an even distribution of changes. Among all the street cases, the highest C_OEP value is for street A4 (0.65). The street plan confirms that street A4 has a large variation in distance from opening to opening, with three openings concentrated on the north side and two openings dispersed on the south side (
Figure 5a). The maximum C_BEP value is 1.20 (street A6). The street plan shows that the building interface changes for street A6 are concentrated at the east and west ends of the street, with three BEPs concentrated on the east side and eight BEPs concentrated on the west side. By calculating the sum of C_OPE and C_BEP to quantify the concentration of effective points, a more comprehensive description of the concentration of street morphology changes can be obtained. Streets A4 and A6 have the highest and second highest concentration of effective points, respectively, while streets C5, C6 and C7 have the lowest concentration of effective points. These results can be verified by comparing the value with the distribution of effective points on the plan (
Figure 5a), which further confirms the validity of this morphological parameter. The average concentration values for the effective points of class A, B and C streets are 1.00, 0.75 and 0.45, respectively, which indicates that the distribution of morphological changes of the streets in the study area tends to become more dispersed and homogeneous as the width of the street decreases.
The intensity of the differences in street morphological changes is divided into the degree of variation in the length of street openings and the degree of variation in the AR of street building interfaces, which can be compared by the numerical results of LD_OEP and ARD_BEP, respectively. The results show that the average LD_OEP value for class A streets (0.55) is significantly higher than the average LD_OEP value for class B or C streets. The highest LD_OEP value (1.13) is also found on a class A street (street A6), suggesting that wider streets tend to have larger openings and more variable opening lengths. For AR_BEP, the maximum value is 0.97 on street A8, while the minimum value is 0.16 on street B3. The 3D axonometric drawing of the street cases shows that the AR value of street A8 varies continuously along the street with a large difference, while the AR value of street B3 varies very little (
Figure 3). The difference in morphological variation is obtained by adding LD_OEP and ARD_BEP (
Figure 6c). The mean value of the difference in morphological variation was found to be 1.06 for class A streets, which is much higher than that for class B and C streets. The results suggest that the morphological changes in the more functionally mixed main streets in the Xinjiekou area are more pronounced, both in terms of changes in the length of street openings and the AR of the streets.
The comparison of the distribution map of street effective points with the value of street morphological parameters confirms that the opening and building effective points can, to a certain extent, accurately capture the subtle changes in street morphological characteristics. Furthermore, the complexity of spatial morphological changes in urban streets depends to a certain extent on the frequency, concentration, and intensity of changes in street morphological characteristics, which can be described by the density of street effective points, the concentration of distribution, and the difference in morphological variation, which helps to understand and quantitatively analyse the complex urban streets.
5. Application of Quantitative Approach to Explore the Relationship between Street Morphological Parameters and the Local Wind Environment
5.1. Wind Speed of Street Cases in Xinjiekou Area
Given that the local wind environment of a street is an objective factor that is strongly influenced by changes in the spatial form of the street, this study attempted to validate the applicability of the proposed quantitative approach in local wind environment-related studies by investigating the relationship between street morphological parameters and the local wind environment of the street in the study area. The experimental data for the local wind environment in the Xinjiekou area were obtained from the wind field at pedestrian level (height = 2 m) in the study area, simulated by computational fluid dynamics (CFD), as detailed in a previously published paper by our team [
76]. The CFD model set-up followed the main simulation requirements proposed by the guidelines of the Architectural Institute of Japan [
84] and the European Cooperation in Science and Technology action [
85]. The simulations were based on the Reynolds-Averaged Navier–Stokes (RANS) equations with a k-ε turbulence model [
86], using ANSYS-Fluent 2022 R1 software as the computational tool. In addition, to further validate the accuracy of the CFD results, an experimental wind tunnel study was carried out. Fifty measurement points were randomly selected in the study area and their CFD simulation results were compared with the wind tunnel test results (
Figure 7). The root mean square error (RMSE) of the wind speed ratio between the CFD simulation and the wind tunnel test was found to be 0.02, which is close to the RMSE value of 0.08∼0.24 found in similar validation studies [
87], indicating the credibility of the CFD results. Additional information on the wind tunnel test, CFD approach, model set-up and validation can be found in the
Supplementary Material (see Supplementary Material: Note S1).
As a preliminary exploration of the relationship between street morphological parameters and the local wind environment, this study focuses on the case where the wind direction is perpendicular to the street direction, which has been the focus of many previous studies, as it represents the worst wind field for pollutant dilution within the street canyon [
88]. Therefore, only the perpendicular wind direction is considered in this paper. Furthermore, all street cases in the study area exist in two perpendicular directions, including nine east–west streets (streets A5, A6, A7, A8, B1, B2, B3, B4 and C7) and eleven north–south streets (streets A1, A2, A3, A4, B5, C1, C2, C3, C4, C5 and C6). Combining these two reasons, the north flow direction is chosen to simulate the local wind flow for the east–west streets, and the east wind for the north–south streets (
Figure 8). This design ensured the acquisition of local wind environment simulation results for all street cases under perpendicular wind directions. In this study, the widely used wind speed is adopted as the evaluation index of the local wind environment. The wind speed along the centre line of the streets was extracted, and the average wind speed was calculated (
Appendix A).
5.2. Analysis of the Relationship between Street Morphological Parameters and Street Wind Speed Characteristics
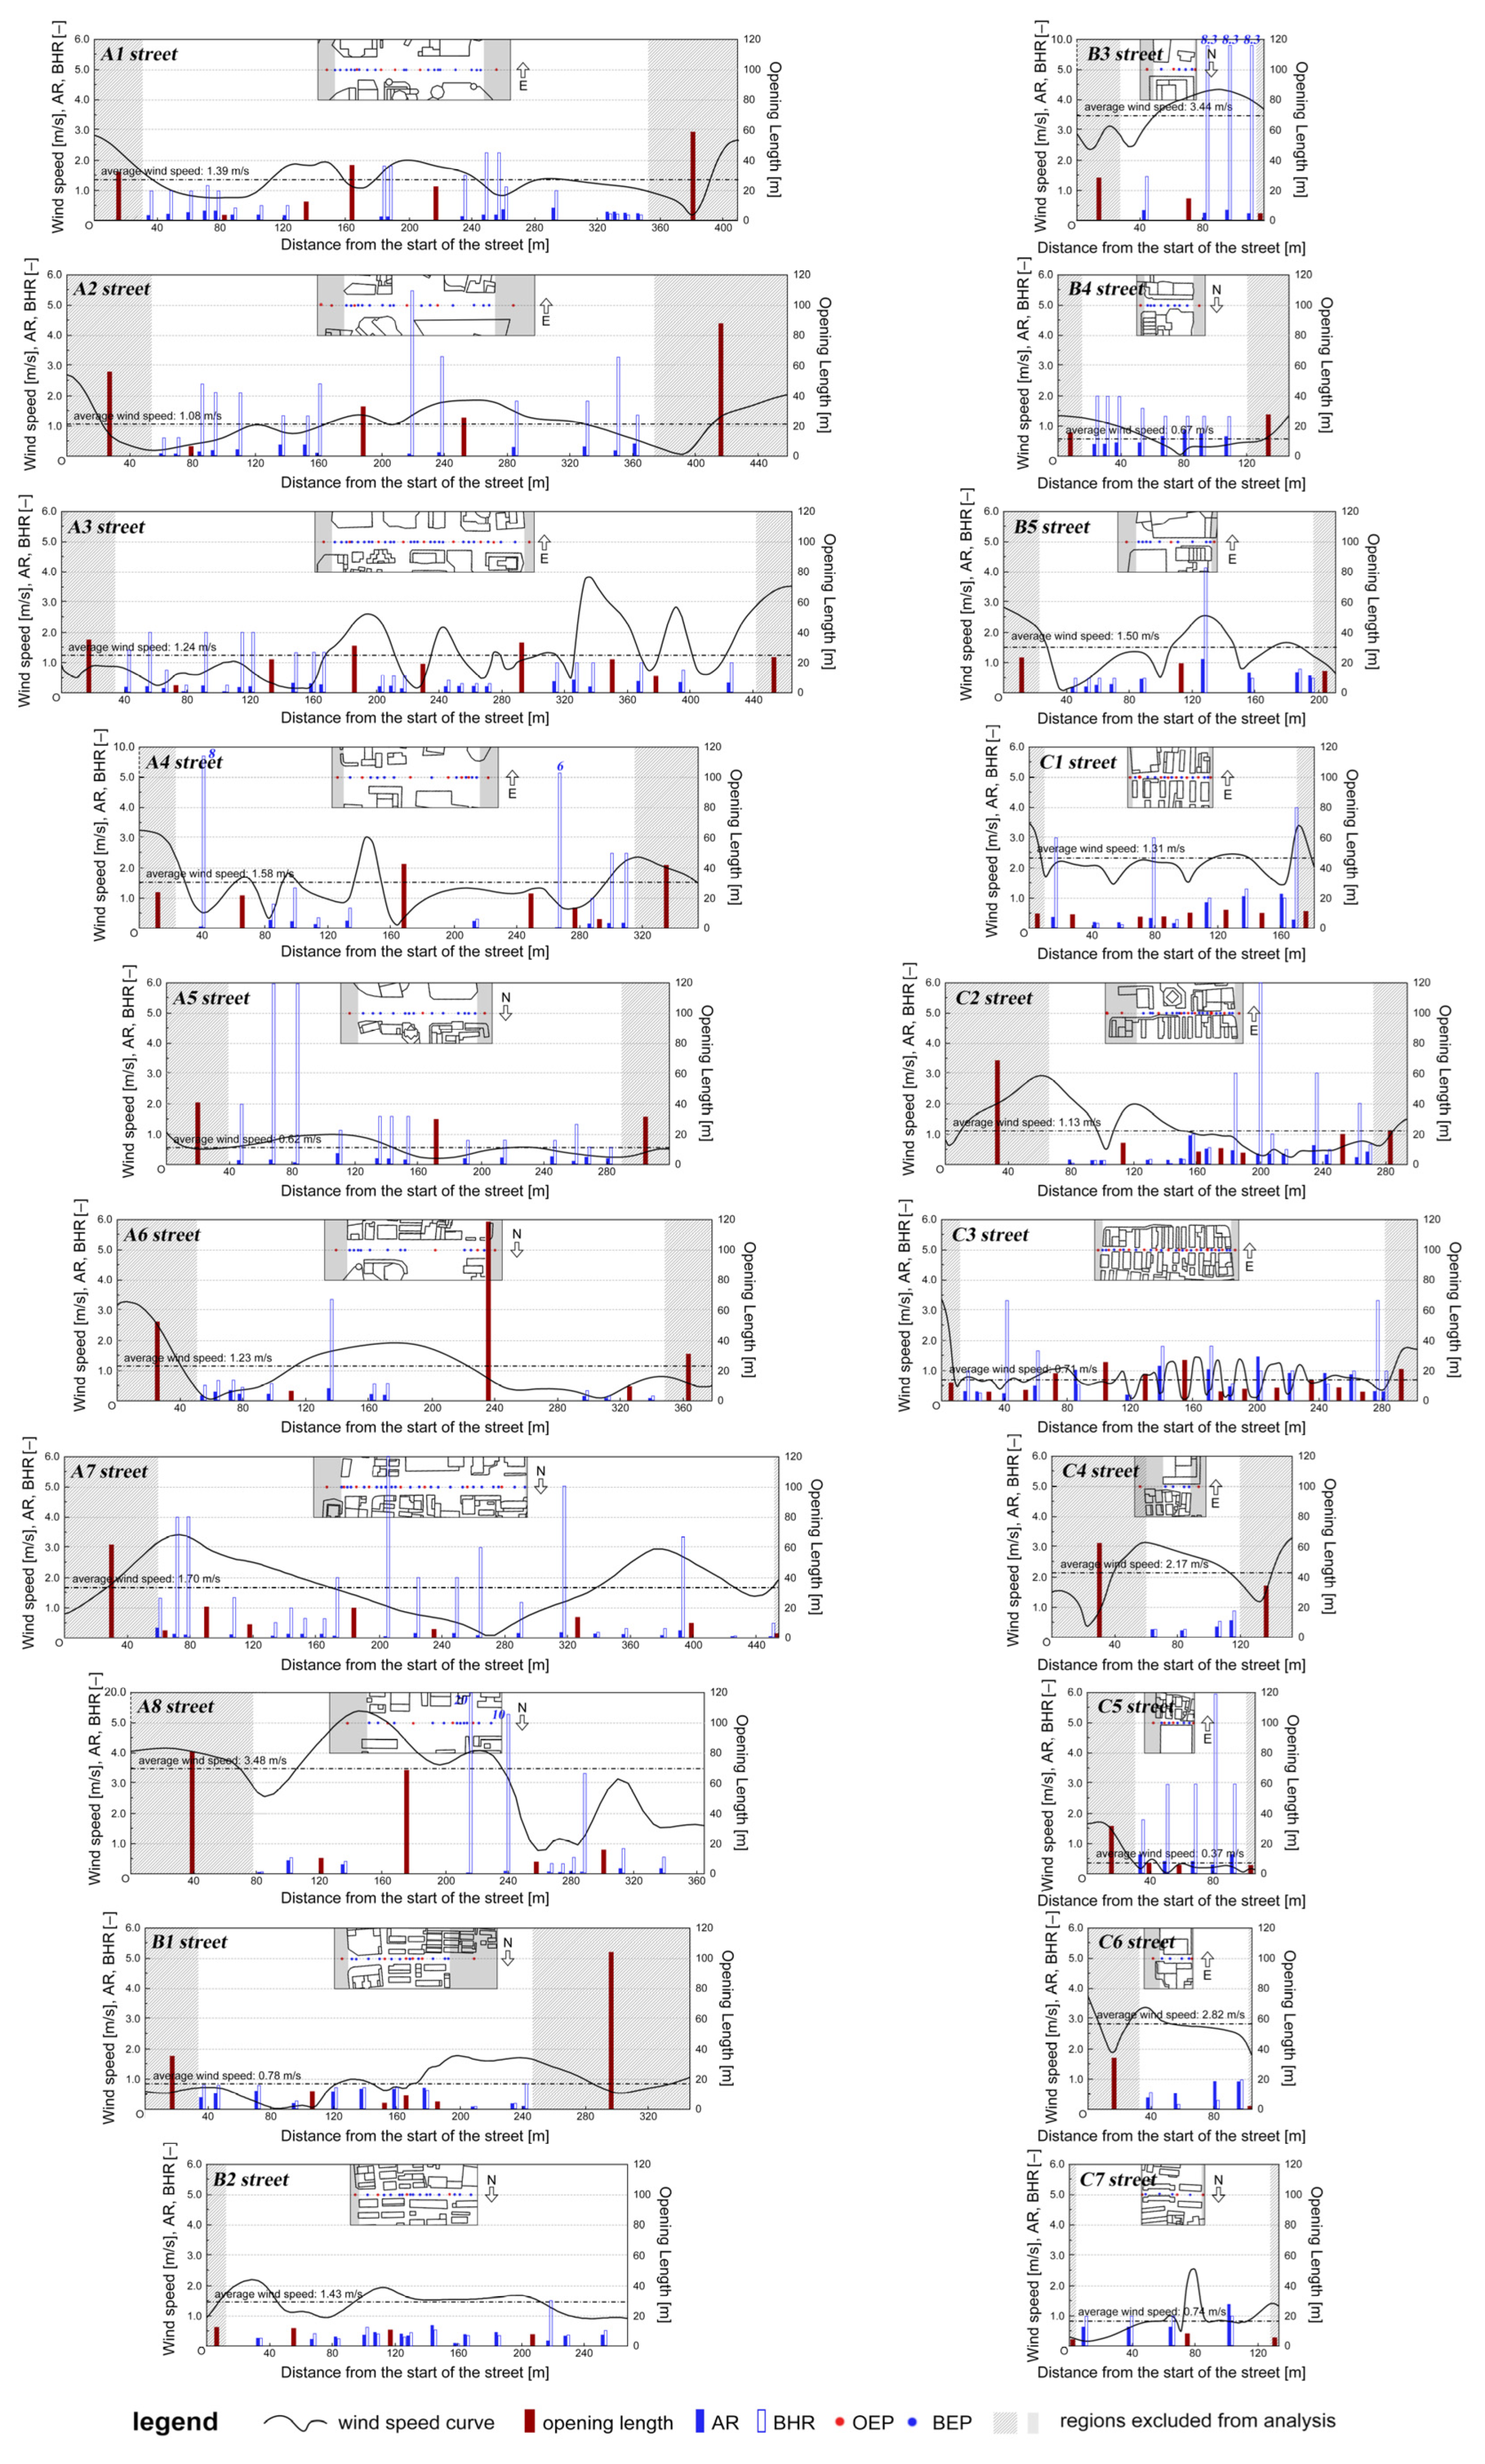
Initial attempts to compare the morphological parameters of the whole street (AW, AAR, PSI, POL, and PIL) with average street wind speed did not give satisfactory results, with all correlation coefficients being low. Average wind speed as an index for evaluating the overall characteristics of the street wind environment may not reflect well the changing characteristics of the local wind environment at different locations within the street, which are affected by changes in street morphology. To this end, we use the street wind speed curves to characterise the changes in the street wind environment (
Figure 8). The horizontal coordinates of the street wind speed curves are the distance from the start of the street, with the left and right ends being the start and end of the street, respectively. The vertical coordinate of the street wind speed curve represents the wind speed at the centreline of the street. Each fluctuation of the street wind speed curve reflects the change in wind speed at the corresponding location. To facilitate the analysis of the relationship between the street morphological changes and the fluctuating changes of the street wind speed, we graphically present both the numerical results of the morphological parameters characterising street changes based on effective points and the wind speed curves (
Figure 9). The distribution of the red bars represents the distribution of the OEPs of the streets, where the height of each bar represents the length of each street opening. The distribution of the blue bars represents the distribution of the BEPs of the streets, where the heights of the solid bars represent the AR values, and the heights of the hollow bars represent the BHR values. Combining the values of the bars helps to analyse the frequency, concentration, and intensity of spatial morphological changes from different perspectives of street openings and street building form. The graphs illustrate both numerical information on morphological parameters characterising street changes based on effective points and numerical information on wind speeds at different locations along the centre line of the street, which can be used as a basis for analysis.
To analyse the relationship between street morphological parameters characterising street changes and the fluctuation of the street wind speed curve, we start with the frequency and amplitude of the fluctuation of the curve to provide a simple description of the variation of the wind speed curve. The number of peaks and troughs in the wind speed curve can reflect the frequency of the fluctuations. The area enclosed between the wind speed curve and the average wind speed can reflect the magnitude of the fluctuations. The frequency and magnitude of fluctuations of the street wind speed curves were calculated for 20 street cases and compared with the number and length of street openings (
Appendix A).
Several studies have found through simulation that street openings can increase ventilation within a street canyon, and that wind speeds around the openings are higher when the wind direction is perpendicular to the direction of the street canyon, and therefore street openings appear to correlate with wind speeds at localised locations along the street. This prompted an initial investigation into the relationship between street openings and wind speed curves (
Appendix B). The study examined the correlation between the number of effective opening points (N_OEP) and the frequency of wind speed variations, as well as between the total opening length (TL_OEP) and the magnitude of wind speed fluctuations (
Table 4). The Spearman’s rank correlation coefficient between N_OEP and the frequency of wind speed fluctuations was calculated to be 0.808, which was significant at the
p < 0.001 level. The result shows that there is a strong positive correlation between N_OEP and the frequency of wind speed fluctuations. In contrast, TL_OEP was moderately positively correlated with the magnitude of wind speed fluctuations with a Spearman’s rank correlation coefficient of 0.487 (
p < 0.05). The findings indicate that there is a correlation between street openings and local wind speed variation in a real street environment, which is consistent with the results of previous studies based on the ideal street model. Specifically, the frequency of wind speed variations was found to be correlated with the number of street openings, while the length of street openings may be correlated with the magnitude of wind speed variations. The above analyses show that the layout and morphology of street openings are critical to the local wind environment in real urban environments.
Subsequently, we analysed the relationship between the morphological parameters of the street changes based on the building effective points and the changes in the street wind speed curves. Considering the above findings that there is a strong correlation between street openings and variation in local wind speed, the analyses here require the selection of streets with fewer street openings and shorter opening lengths to reduce the impact of street openings on the analysis results. However, most of the street cases in the Xinjiekou area have many openings and long opening lengths, which increases the difficulty of investigating the influence of morphological parameters based on building effective points on wind speed changes. Based on the above, some relatively suitable street cases were selected for analysis, such as streets B4, B5, and C7 (
Figure 9). It was found that changes in street width or building height were weakly correlated with changes in wind speed. Nevertheless, it is worth noting that some slight fluctuations in the wind speed curves can still be observed close to the location of the building effective point. This suggests that there may be a relationship between the location and density of the building effective points obtained by the proposed quantification method and the wind speed variations. These findings merit further investigation in subsequent studies.
6. Conclusions and Further Discussions
This study explores a new approach to quantifying the three-dimensional spatial geometric morphological characteristics of urban streets. By using the basic data of street morphology based on point measurements, this paper proposes a set of parameters to describe various morphological characteristics of streets. Through quantitative analysis of street cases with different spatial characteristics in the central area of Nanjing, the feasibility of this quantitative method and the street morphological parameters in describing real and complex street morphology are demonstrated. The validity of the comparison between the street morphological parameters and the local wind environment is assessed by analysing the relationship between the morphological parameters and the average street wind speeds and wind speed curves for different street cases in the study area.
The results show that the point-based street morphology quantification method proposed in this paper is effective. Firstly, a series of street morphological data can be obtained from the measuring points, such as the distance between the building boundaries on both sides of the street, the building heights, and the heights of the secondary interfaces. Based on these street morphological data, a set of street morphological parameters can be calculated, including average width (AW), average aspect ratio (AAR), proportion of secondary interfaces (PSI), proportion of opening length (POL), and proportion of intersection length (PIL). Secondly, the measuring point can accurately obtain detailed data on the location of street morphological changes, allowing effective characterisation of street morphological changes in detail. To describe the morphological changes at the street interface, we propose using street opening effective points and building effective points. The opening effective points can capture the morphological changing parameters, including number of opening effective points (N_OEP), length of opening (L _OEP), total opening length (TL_OEP), density of opening effective points (D_OEP), concentration of opening effective points (C_OEP), and length difference of opening effective points (LD_OEP). The building effective points can capture the morphological changing parameters, including number of building effective points (N_BEP), aspect ratio (AR_BEP), building height ratio (BHR_BEP), density of building effective points (D_BEP), concentration of building effective points (C_BEP), and AR difference of building effective points (ARD_BEP). Therefore, by downscaling the complex 3D street spatial morphology information to measured point data and analysing it based on the point data, this study achieves a more in-depth and accurate analysis of the changing geometric morphological characteristics of the street space.
The main innovation of this study is to propose, for the first time, a tool based on street opening and building effective points, focusing on two key aspects, street openings and variations in the height or setback of street buildings, to provide a set of operational parameters for the quantitative analysis of urban street morphological changes. These parameters cover several aspects of three-dimensional spatial morphological change in streets, including density, concentration, and intensity. For urban planners and designers, the proposed quantitative approach and parameters support a more comprehensive and efficient understanding and evaluation of morphological changes in urban streets. Specifically, the quantitative tool allows them to identify not only the richness of street morphological changes, but also the specific locations where changes are occurring and the intensity of the changes, such as the number of street openings, the variation in the length of the openings, and the concentration of changes in street building morphology. These changing characteristics of street morphology play an important role in the quality of urban street space but have rarely been mentioned in previous street quantification studies. The introduction of these parameters can help designers adjust the street spatial features according to different design requirements, including aspects such as the length and location of street openings and the arrangement of high-rise buildings. It is worth noting that the proposed quantification approach and parameters are not limited to the study area but have the potential for wide applicability. The quantification method can be applied to other areas where 3D building volumes and street centreline data are available.
Taking different types of streets in the Xinjiekou area of Nanjing as an example, this study compares and analyses the relationship between street morphological parameters and street wind speed and preliminarily verifies the practicality and validity of the proposed quantitative methods in studying the relationship between actual complex urban streets and local wind environments. The use of effective point-based street morphological parameters allows the changing morphological characteristics of complex streets in actual urban space to be quantitatively compared with their local street wind speed changing characteristics. In the case of perpendicular winds, street openings become an important morphological factor associated with the variation of street wind speed, and their number, length and distribution correlate with the local wind environment. Unlike street openings, no significant correlation was observed between changes in street width and building height and changes in wind speed curves. This is mainly due to the generally high number and length of openings on both sides of the case street interfaces, significantly interfering with local street wind speeds. Therefore, using the cases in this study area to verify the relationship between the morphological parameters characterising street changes based on building effective points and the variations in the wind speed curves is not very appropriate.
In the discussion, it should be fully recognised that real street spaces are extremely complicated, and a combination of factors influence the local wind environment. The main objective of this study is firstly to propose a quantitative method applicable to real and complex street morphology to promote more exploratory studies on the relationship between real street morphology and the urban physical environment, including the wind environment. Therefore, this paper only attempts to use wind speed as an index to evaluate the wind environment and is limited to the case of urban streets in Nanjing. The case study of streets in the centre of Nanjing highlights the crucial role of street openings in influencing the local wind environment. In contrast, the discussion on the relationship between the variation of street aspect ratio and the local wind environment needs to be further developed. As a basic method of describing street characteristics in architecture, the aspect ratio of street sections shows its ability to effectively describe changes in the spatial characteristics of streets in this case study. However, comparing the variation of street aspect ratios with the local wind environment of a street space with large openings, such as the street cases of the Xinjiekou area, is not a very appropriate way to validate this, and other more appropriate approaches need to be explored. In the street space with fewer openings and greater enclosure, the number and intensity of building form changes along the street and the concentration of the distribution of changes may be the key factors influencing the morphological characteristics and the local wind environment, which deserves further in-depth study.
Furthermore, as an exploratory study, this study has only initiated a preliminary investigation of the cases under perpendicular wind. For other wind directions, such as parallel or oblique winds at different angles, the relationship between the street morphological parameters and the local wind environment deserves further investigation. Considering that many studies focus on the local wind environment under the prevailing wind directions in specific study areas, it would be beneficial to extend the scope of the study to explore the changes in the local wind environment under different wind directions, thus contributing to providing targeted analyses for the prevailing wind directions in different urban areas. The proposed quantitative approach to street space morphology can be applied to other cities in future studies, and the introduction of more urban spatial quality evaluation indices can be considered to improve street space design and support the development and sustainability of urban street space quality.


