Article

Does Environmental Aid Make a Difference? Analyzing Its Impact in Developing Countries

by
Chris McCarthy
1,2,*,
Troy Sternberg
3,4 and
Lumbani Benedicto Banda
5
1
Zanvyl Krieger School of Arts and Sciences, Johns Hopkins University, Baltimore, MD 21218, USA
2
Department of Forestry, Bunda College of Agriculture Campus, Lilongwe University of Agriculture and Natural Resources (LUANAR), Lilongwe P.O. Box 219, Malawi
3
School of Geography, University of Oxford, Oxford OX2 6HY, UK
4
Centre for International Studies, ISCTE—University Institute Lisbon, Avenida das Forças Armadas, 1649-026 Lisbon, Portugal
5
Department of Environment and Natural Resources, Bunda College of Agriculture Campus, Lilongwe University of Agriculture and Natural Resources (LUANAR), Lilongwe P.O. Box 219, Malawi
*
Author to whom correspondence should be addressed.
Land 2023, 12(10), 1953; https://doi.org/10.3390/land12101953
Submission received: 1 October 2023 / Revised: 12 October 2023 / Accepted: 20 October 2023 / Published: 22 October 2023
(This article belongs to the Special Issue Feature Papers for 'Land Socio-Economic and Political Issues' Section)

Abstract

:
Amidst escalating global environmental challenges, does environmental aid drive tangible conservation outcomes in developing countries or does it merely perpetuate the rift between economic ambition and environmental responsibility? Using a comprehensive ten-year dataset from the OECD, World Bank, Climate Watch, and the Climate Change Laws of the World database, we analyze the relationship between environmental aid and environmental conservation outcomes in recipient countries. Our results indicate that although aid can influence policy development, there is a weak correlation with outcomes such as increased forest cover, expansion of protected areas, and reduced CO2 emissions. Moreover, the pronounced roles of GDP and population in shaping these outcomes underline the complex interplay of environmental challenges with economic growth and demographic shifts. This dynamic, coupled with the evident mismatch between environmental aid delivery and tangible conservation improvements, emphasizes the need to reconsider current aid distribution strategies. In light of current environmental challenges, this research offers valuable insights into the effectiveness of environmental aid in developing countries and suggests a way forward for more targeted and impactful conservation efforts.

1. Introduction

Environmental degradation, characterized by climate change, biodiversity loss, and ecosystem breakdown, has elevated the importance of effective conservation strategies, particularly in the realm of global politics [1,2,3]. Addressing these challenges requires an annual investment estimated up to USD 967 billion [4,5,6], a substantial sum that pales in comparison to the economic costs of ecosystem loss [7]. The fiscal commitment underscores the critical role of international aid for developing countries that lag in or lack adequate environmental protection measures for biodiversity conservation and climate change mitigation [8]. Despite the significant financial commitment required to address these environmental challenges, there has been limited scholarly attention devoted to understanding the effectiveness of financial assistance provided to developing nations for environmental conservation. The scarcity of research in this area highlights a critical gap in the literature and signals the need for rigorous analysis of aid effectiveness in the environmental domain. Global databases enable contemporary assessment of donor assistance to recipient nations (e.g., stats.oecd.org; data.worldbank.org), offering invaluable insights. This study evaluates the efficacy of international environmental aid in developing countries working to address conservation challenges.
Environmental health is deeply interwoven with socio-economic and political outcomes [9]. Healthy ecosystems provide essential services, such as clean air, water, food security, climate regulation, and recreational opportunities, which contribute significantly to human well-being and the global economy [10]. These environmental changes disproportionately affect developing countries, amplify socio-economic inequalities and impose additional burdens on poorer nations [11]. Moreover, many of these developing countries overlap with regions identified as biodiversity hotspots [12]. These biodiversity-rich areas require particular attention due to their unique ecosystems and number of species. They stand on the frontline of global environmental changes, emphasizing the urgency of prioritizing aid and conservation efforts to these regions.
In the context of global environmental challenges, environmental aid serves as a pivotal mechanism for developing countries striving to integrate conservation efforts with economic growth amid global environmental challenges [13,14]. The distribution of this environmental aid directly influences the success of global conservation efforts, specifically in areas such as environmental protection, exemplified by efforts to slow forest loss. The effectiveness and efficiency of foreign aid continue to be subjects of debate, particularly in terms of assessing the tangible outcomes achieved per dollar spent [15].
Developed countries, as the primary contributors to global environmental degradation through their industrial activities, are called upon to provide environmental aid to their less developed counterparts. This call stems from a recognized sense of shared global responsibility and equity [16]. This stance aligns with the “polluter pays” principle, endorsed by the international community, suggesting that developed nations bear a moral and ethical responsibility to support developing countries in their conservation efforts [17,18].
Such financial support from developed nations is designed to enable developing countries to put in place necessary environmental protection measures, bolster their resilience to environmental shocks, and facilitate the transition towards green and sustainable development pathways [5,14,19]. As such, international environmental aid is not merely a practical mechanism for resource transfer but also exemplifies global solidarity confronting shared environmental challenges [20]. However, given that environmental aid is a limited resource, documenting its efficiency becomes crucial.
Prior research, including studies that have scrutinized the complex relationship between aid and effectiveness, has shown the initial effectiveness and subsequent diminishing returns of development aid [21,22,23]. After a certain threshold, additional aid could indeed experience diminishing returns. This phenomenon could arise from a variety of reasons, such as saturation of resources, inefficiencies in utilization, or even bureaucratic delays. Therefore, directing this aid towards the most beneficial areas is an essential step to maximize its impact and effectively address the pressing environmental challenges we face [13,24]. Furthermore, the effectiveness of aid is not solely contingent upon the domain towards which it is directed but also depends on the methodology of its deployment [25,26]. Ensuring efficient aid utilization with clear objectives and transparent processes is crucial.
Considering the limited understanding of how effectively environmental aid supports conservation efforts, this study scrutinizes the global distribution of environmental aid and its effectiveness in fostering environmental conservation in developing countries. Specifically, we examine the impact of aid on the reduction in carbon dioxide emissions, often a significant part of environmental aid packages, the decrease in deforestation rates, the establishment of protected areas, and the enactment of environmental policies [27]. This study addresses two central research questions: (1) How is environmental aid distributed globally among developing countries? and (2) How does this aid impact key environmental indicators like carbon dioxide emissions, deforestation rates, protected areas, and environmental policies? Utilizing a ten-year dataset (2012–2021) from reputable sources, our analysis represents the best attempt with the current available data to shed light on the effectiveness of environmental aid. This study outlines general issues and challenges present in the field, serving as foundational work for more refined research in the future. It is our hope that this work sparks further discussion and examination into the effectiveness of environmental aid, with future studies perhaps engaging in detailed case studies to further explore and elucidate the dynamics at play.

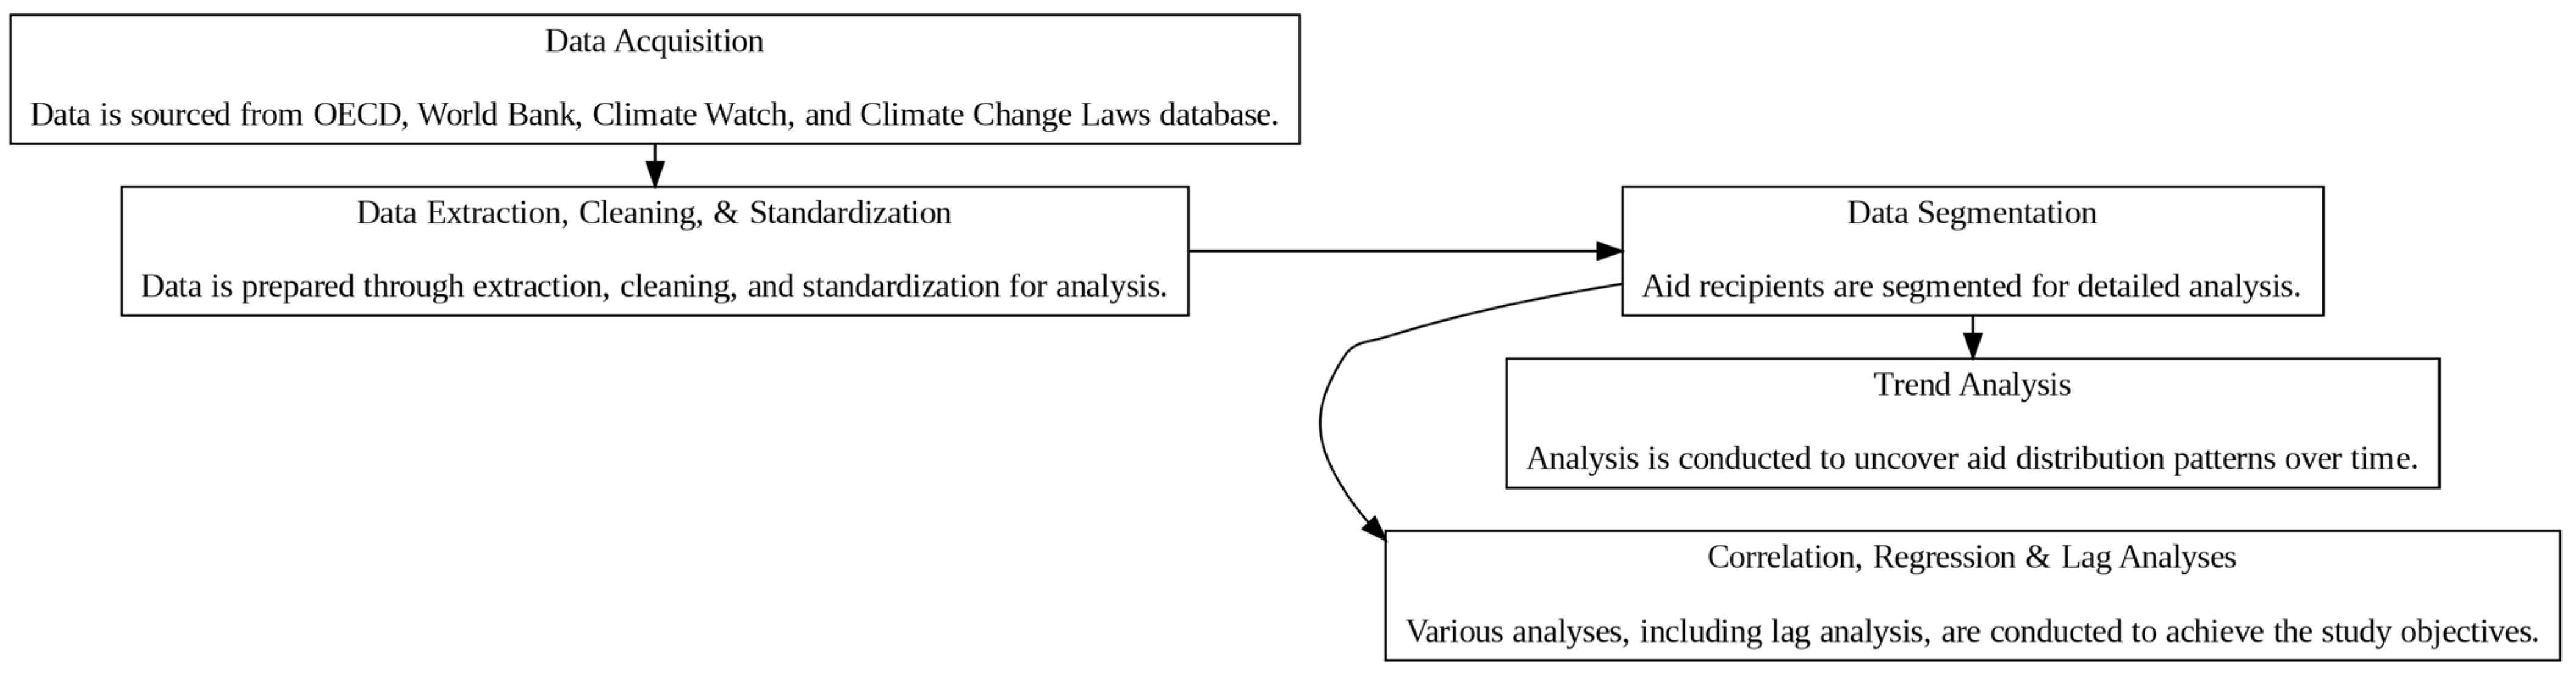
2. Materials and Methods

This study uses data sourced from the Organization for Economic Co-operation and Development (OECD) (https://stats.oecd.org (accessed on 29 September 2023)), the World Bank (https://data.worldbank.org (accessed on 29 September 2023)), Climate Watch (https://www.climatewatchdata.org (accessed on 29 September 2023)), and the Climate Change Laws of the World database (https://climate-laws.org (accessed on 29 September 2023)). These databases were chosen for their thorough coverage, high validity, and frequent usage in previous research. A systematic overview of our study methodology is presented in Figure 1.
We extracted information on environmental aid from the OECD’s Creditor Reporting System (CRS) 4.10: IV.1. General Environment Protection, total dataset for the period 2012–2021. The CRS dataset provides detailed information about donor countries, the specific amounts allocated, the types of assistance and environmental programs targeted, and the recipient developing countries. The dataset encompasses 150 recipient countries, defined as “developing” by the OECD based on various socio-economic factors including income per capita, lack of industrialization, and standards of living. The selected decade is of particular relevance as it signifies a crucial phase where environmental challenges, especially climate change, gained unprecedented global attention. Complementary data, including the key indicators CO2 emissions, forest cover, and protected area coverage were sourced from the World Bank’s World Development Indicators dataset [28]. CO2 emissions were quantified as metric tons per capita, as documented by Climate Watch. Deforestation rates were measured as the percentage change in forest area compared to the total land area. Lastly, protected areas were identified as regions designated for wildlife and habitat conservation. These indicators were chosen due to their recognized relevance in signaling overall environmental health and sustainability. Additionally, GDP and population data, crucial for serving as control variables in our regression analysis, were also derived from the World Bank. To understand the legislative context, we integrated data about environmental policy development from the Climate Change Laws of the World database. These various datasets were then cohesively merged, focusing on the developing country recipient, to offer a comprehensive view of environmental aid dynamics.
After data acquisition, we used Python for cleaning and standardization of the CRS dataset [29]. We used a Google Colab Jupyter Notebook, which provided a collaborative and interactive environment that facilitated the efficient handling and analysis of data. This platform was not only instrumental in cleaning and standardizing data but also in constructing the maps and visualizations utilized in this study. The maps were created within this notebook using appropriate Python libraries and tools that allowed for the dynamic representation of our data in a visual format, enhancing the interpretability and accessibility of our findings.
Within our dataset, we strategically segmented aid recipients into three distinct categories: all developing country recipients (n = 150), the top 10 developing country recipients based on aid received, and 10 additional developing countries identified as biodiversity hotspots. We specifically omitted funds aimed at bilateral regions to ensure accurate aid tracking to recipient countries. Biodiversity hotspots are globally recognized regions that are both extraordinarily rich in endemic species (with at least 1500 endemic plant species) and facing severe habitat loss (at least 70% of their original habitat lost) [12]. The countries identified as biodiversity hotspots in our dataset overlap with these critical areas, highlighting regions where aid could significantly influence conservation outcomes. The categorization of our dataset was essential for several reasons. Segmenting all developing country recipient allowed for a holistic view of environmental aid’s broad impacts. Focusing on the top 10 developing countries in terms of aid receipt provided insights into the effectiveness and utilization of large aid volumes. Lastly, emphasizing developing countries recognized as biodiversity hotspots draws attention to ecologically significant regions that, due to their inherent vulnerabilities, require urgent and effective aid interventions.
To assess shifts over time, a trend analysis was conducted on the environmental aid data. This methodology allowed us to uncover the nuances and trajectories of aid distribution over a set period. It was essential to undertake this analysis to discern potential patterns, detect anomalies, and identify consistent donors or beneficiaries, providing a comprehensive view of the environmental aid landscape.
Utilizing Pearson’s r correlation coefficient, we examined the relationship between environmental aid and progress on selected indicators, specifically environmental policy development. The coefficient, r, is determined by the formula:
r = i = 1 n x i x ¯ y i y ¯ i = 1 n x i x ¯ 2 i = 1 n y i y ¯ 2
Here, each data point ( x i , y i ) signifies observed values of environmental aid and policy development, respectively, for each country, with n denoting the number of observed countries. The variables x ¯ and y ¯ represent the mean values of environmental aid and policy development observed across all countries, respectively. By conducting this analysis across various segments of aid recipients, we can contextualize and compare the effectiveness of environmental aid in promoting policy development within diverse geopolitical settings.
To further refine our understanding, we examined the connections between environmental aid and our selected environmental variables. We employed multiple linear regression, characterized by the formula:
y = β 0 + β 1 × Aggregated _ Donations + β 2 × Average _ GDP + β 3 × Average _ Population + ϵ
The given formula predicts potential outcomes, such as policy development, CO2 emissions, forest cover or protected areas, based on inputs of environmental aid, GDP, and population. In this formula, the coefficients signify the effect of each variable, and there is also a constant term. The symbol ϵ represents unexplained variations in the model. Here, y represents the potential outcomes, which could be policy development, CO2 emissions, forest cover, or protected areas. These outcomes are modeled as being dependent on aid, GDP, and population. The coefficients β 0 , β 1 , β 2 , and β 3 represent the constant term and the effects of the respective variables on the outcomes. Meanwhile, ϵ accounts for variations in the outcomes that the model does not explain.
Recognizing the delayed impacts of aid, we incorporated a lag analysis spanning up to three years post-aid reception. This strategy assessed whether aid influenced immediate or gradual environmental changes:
Y t = β 0 + β 1 × Aggregated _ Donations t - l a g + β 2 × Average _ GDP t + β 3 × Average _ Population t + ϵ t
This lag analysis formula evaluates the influence of aid on the environmental variables either immediately or over a prolonged period, enriching our understanding of aid dynamics over time. In the equation, Y t represents the dependent variable at time t . The term β 0 serves as the y-intercept, while β 0 , β 1 , β 2 , and β 3 serve as coefficients for the independent variables. Aggregated _ Donations t - l a g represents total environmental aid donations with a specified time lag, while ϵ t is the error term at time t . This approach aids in understanding whether aid influences immediate or gradual environmental changes, providing deeper insights into aid dynamics over time.

3. Results

3.1. Mapping the Global Flow of Environmental Aid

From 2012 to 2021, donors provided a significant amount of environmental aid to developing countries, amounting to approximately USD 34.33 billion [29]. This assistance originated from diverse sources, including nations, international organizations, and NGOs. Our analysis reveals noteworthy patterns in the global distribution of these funds. A visual representation of this distribution can be seen in the accompanying map (Figure 2). The tables presented in this section provide a snapshot of the environmental aid distribution, with more comprehensive tables available as Supplementary Tables (Supplementary Tables S1 and S2).

3.1.1. Major Donors

A group of ten countries emerged as primary donors, with France providing the most financial aid. Other substantial contributors included Germany, the United States, Norway, the United Kingdom, Sweden, Denmark, Switzerland, and Canada. Several international organizations including the Global Environment Facility, the International Bank for Reconstruction and Development, EU Institutions, and the Inter-American Development Bank were prominent contributors. Foundations and NGOs also played a significant role in providing environmental aid. Notable among these were the Bezos Earth Fund, the Gordon and Betty Moore Foundation, the MAVA Foundation, the David & Lucile Packard Foundation, and the Arcus Foundation. The amount of environmental aid provided by the top six donor countries and top four multilateral institutions between 2012 and 2021, with their largest recipients, are shown in Table 1. To provide a comparative analysis, the top five foundation donors are also provided in the same table. For a comprehensive list of all donors and recipients referenced in this study, please refer to Supplementary Tables S1 and S2.

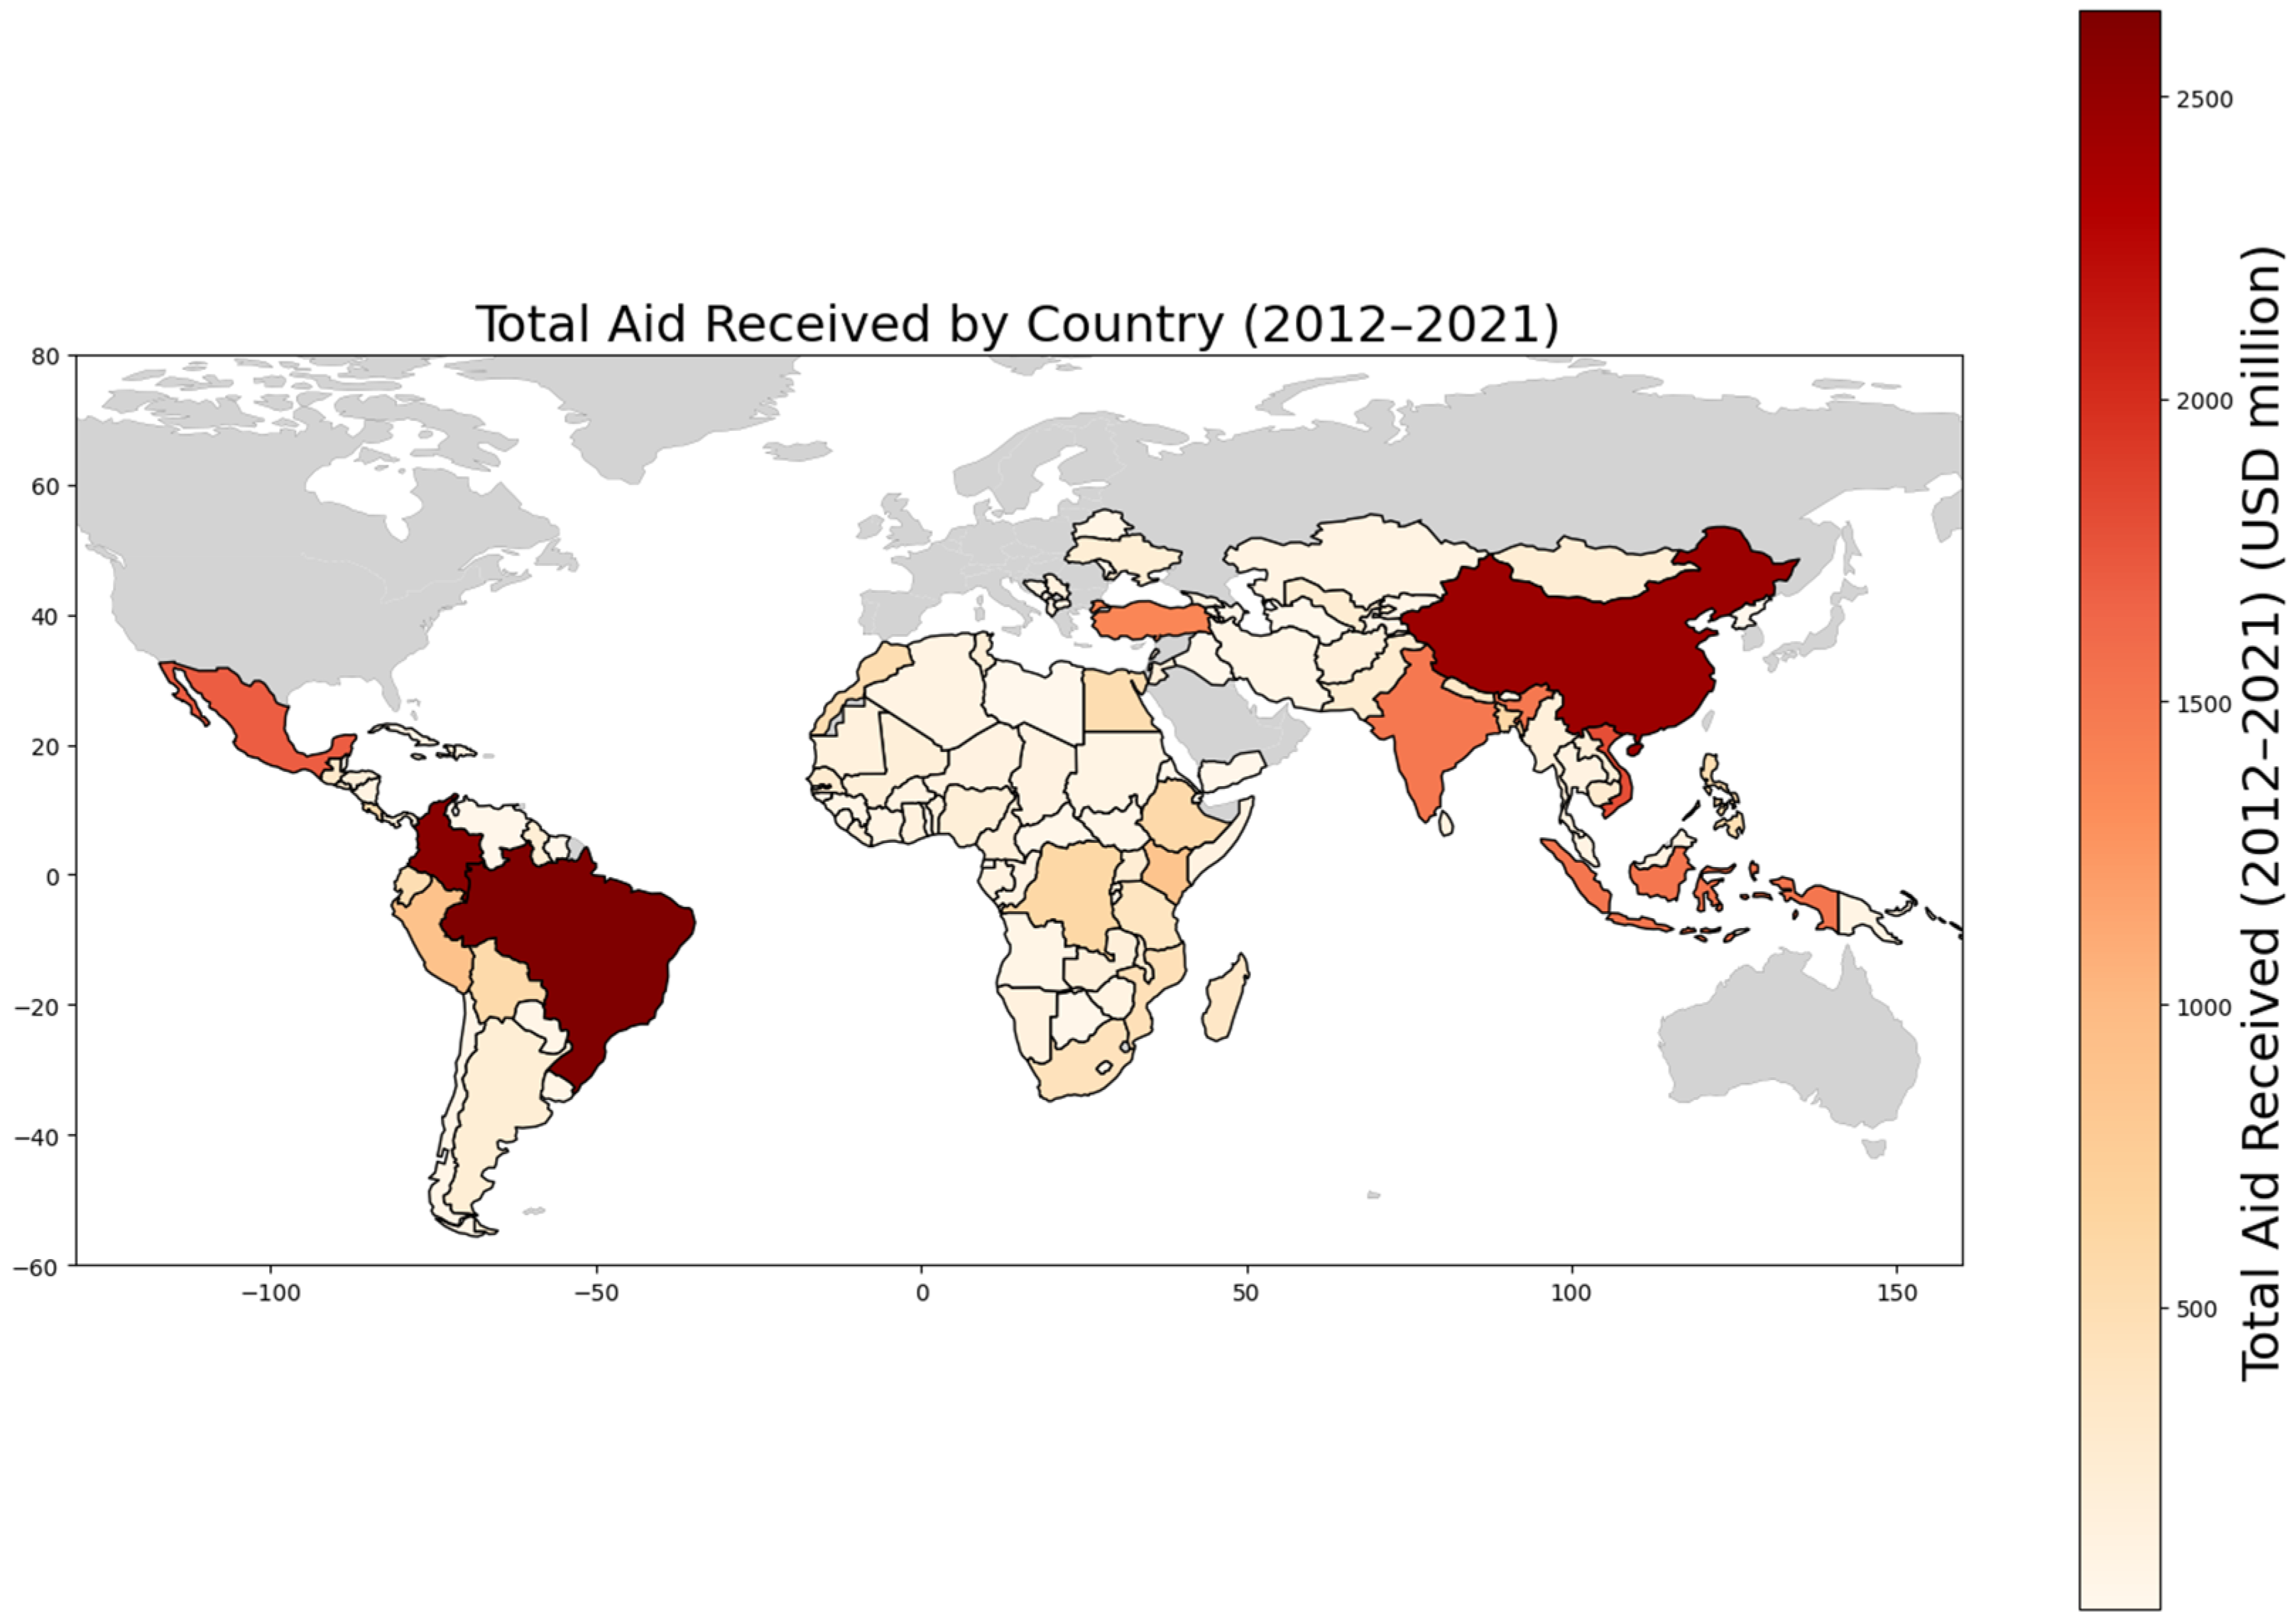
3.1.2. Key Recipient Countries and Regions

A considerable portion of environmental aid was directed towards countries and regions facing significant environmental challenges. The top recipients of this aid were Brazil, Colombia, and China, followed by Vietnam, Mexico, and Indonesia (Table 2). Biodiversity hotspots, such as the Democratic Republic of the Congo, Bolivia, and Ecuador, also received substantial aid. Detailed contributions to these countries from 2012 to 2021 are shown in Table 3.
Among regions, South America emerged as the top recipient of environmental aid, followed closely by the South of Sahara and Far East Asia. In contrast, regions like Oceania and the Middle East received relatively smaller allocations. A detailed regional breakdown of environmental aid over the past years, highlighting the main contributors for each region, is provided in Table 4.

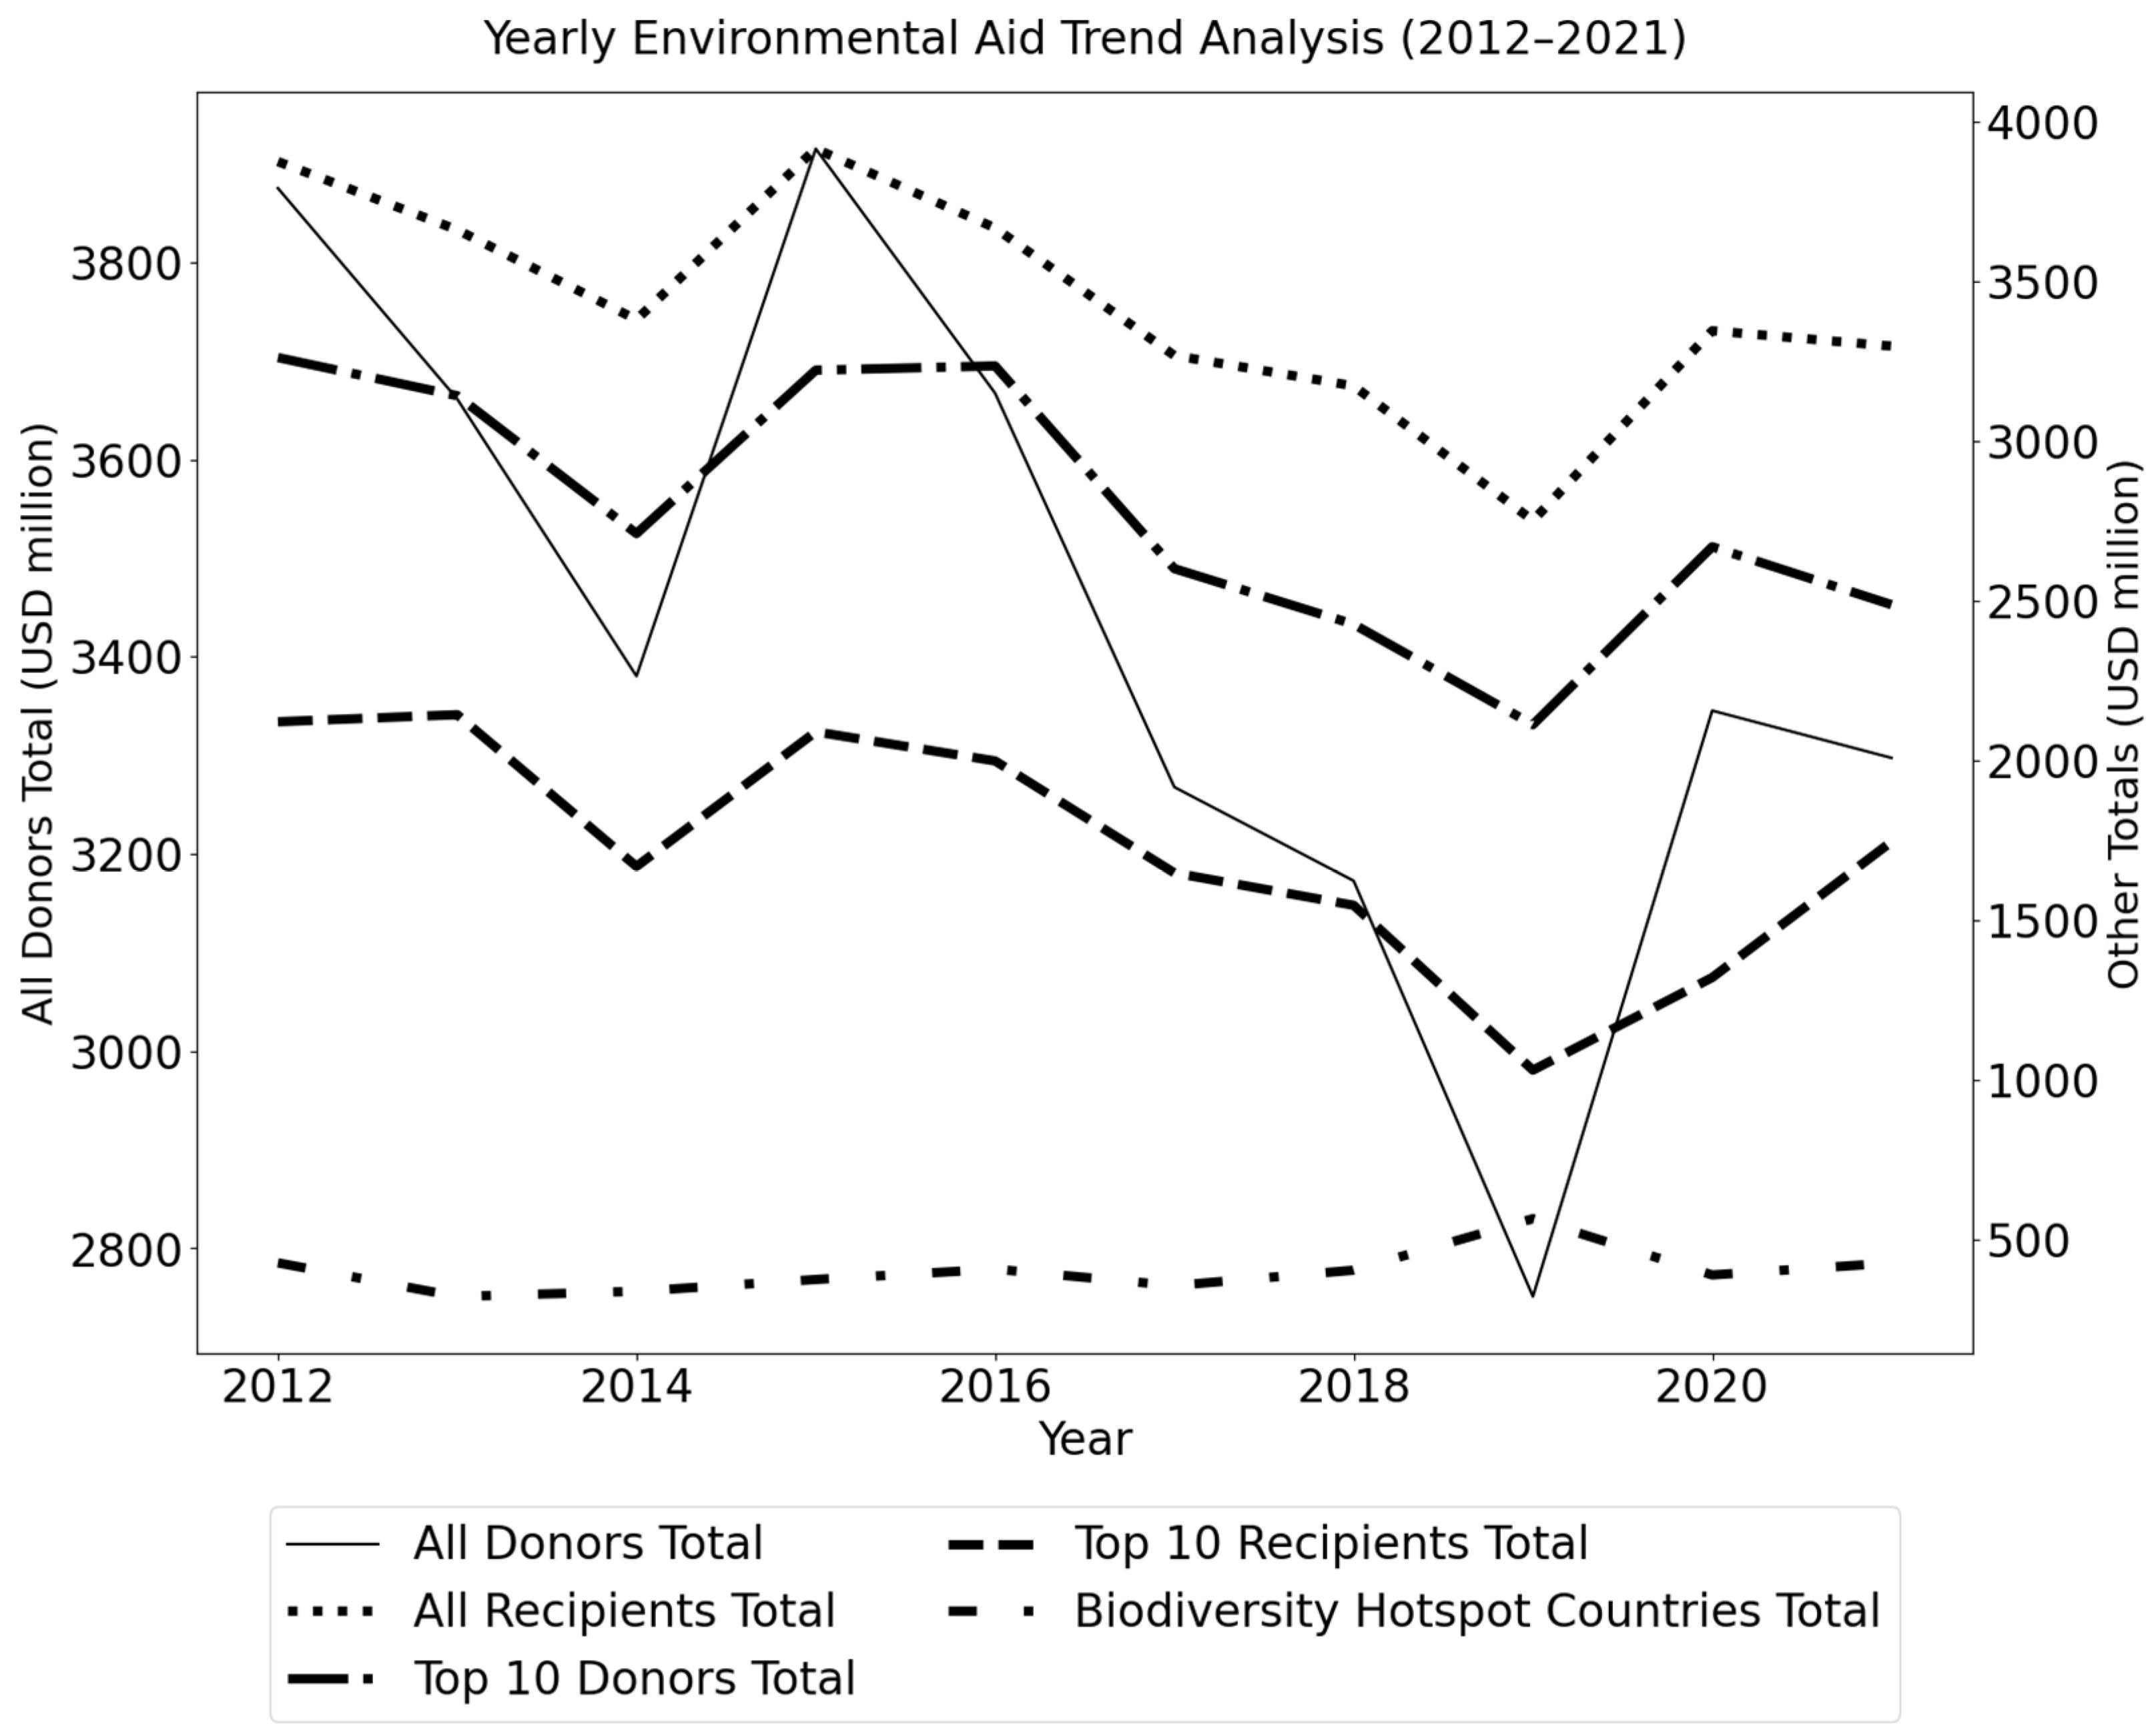
3.2. Decade-Long Fluctuations in Environmental Aid: Trends and Patterns

From 2012 to 2021, the environmental aid landscape experienced various shifts. The total environmental aid from all donors started at a benchmark of USD 3.87 billion in 2012, fluctuated throughout the decade, and concluded with a modest decrease of 14.73% in 2021 (USD 3.30 billion), as depicted in Figure 3. This trend sets the context for the contributions of top donors, some of which saw consistent growth while others peaked and then declined. In the latter part of the decade, new significant contributors emerged. As for the recipients, patterns varied, with some countries experiencing high aid inflows that diminished by 2021, and others maintaining consistent aid reception. Biodiversity hotspot countries also displayed diverse aid trends, emphasizing the ever-changing dynamics of environmental funding and highlighting the importance of adapting to these changes for effective aid management.

3.3. From Dollars to Difference: How Effective Is Environmental Aid?

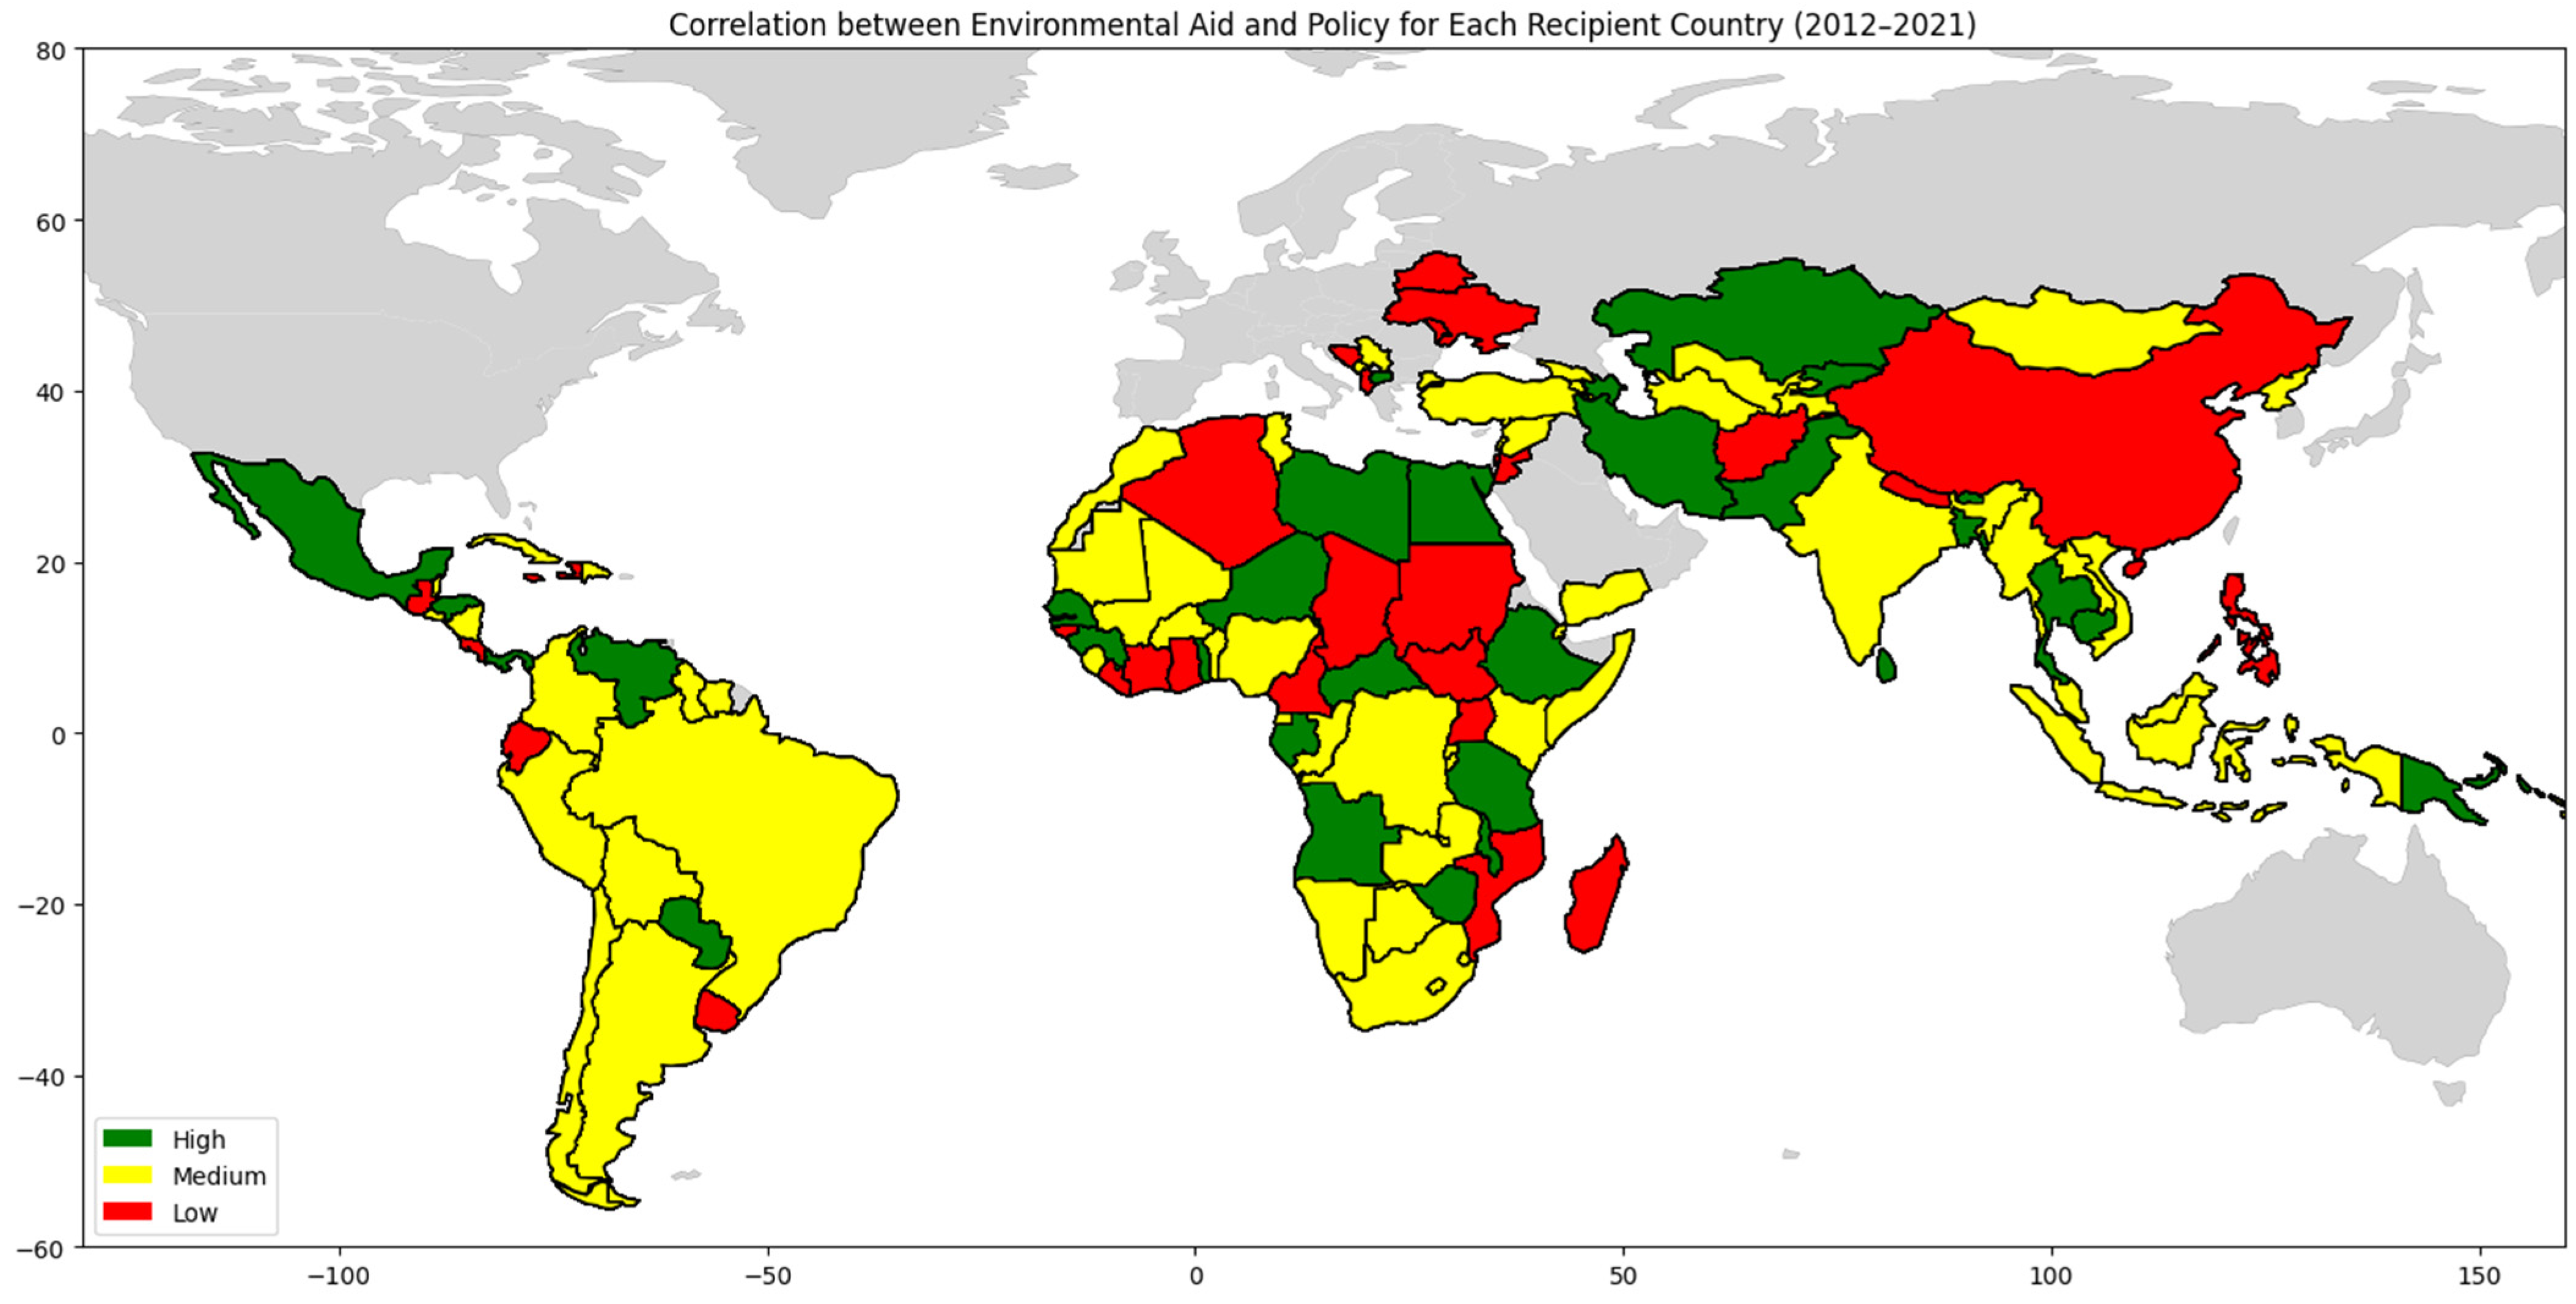
3.3.1. Correlation between Aid and Different Environmental Indicators

To understand the potential relationship between environmental aid and progress on environmental indicators, we conducted a correlation analysis stratified across three categories: a consolidated view of all recipient countries, the top 10 recipient countries, and 10 biodiversity hotspot countries. Table 5 presents the correlation coefficients for each environmental indicator.
The results for CO2 emissions show a positive correlation across all categories, indicating that increased aid does not result in decreased emissions. For forest cover, the correlations were marginal across all categories, suggesting that aid may not lead to significant conservation outcomes in terms of forest preservation. In the case of protected areas, the correlations also remained weak. However, the correlation with policy development was more pronounced across all datasets, especially in our biodiversity hotspot countries. This indicates that countries which receive more aid tend to increase their number of environmental policies, implying that environmental aid may play a significant role in shaping policy frameworks that could, over time, lead to improved environmental conservation.
The following map (Figure 4) depicts the correlation between environmental policy development and environmental aid allocations for developing countries from 2012 to 2021. For every country, the correlation is determined between policy values and environmental aid distributed over these years. Correlation values close to 1 signal a strong positive association where rising policy values correspond to increasing environmental aid, whereas values close to −1 indicate an inverse relationship. Those near 0 suggest minimal linear correlation. After establishing the correlation for each country, we categorized them into high, medium, or low based on their values: countries in the top 25% are labeled “high”, those between the 25th and 75th percentiles as “medium”, and those in the bottom 25% as “low”. The map offers insights into the alignment of policy shifts with environmental aid commitments across nations over the study period.

3.3.2. Gauging Aid Effectiveness with GDP and Population Controls

Building upon the results from our correlation analysis we proceeded with a regression analysis to better grasp the impact of environmental aid on distinct environmental metrics. Table 6 summarizes the results from multiple regression analyses examining the relationship between aggregated aid, average GDP, and average population on various environmental outcomes, including policy development, CO2 emissions, forest cover percentage, and protected area percentage. This approach allowed us to account for potential confounders like GDP and population, ensuring a clearer picture of the specific effects attributable to aid.
In the context of policy development, our regression model indicates that as environmental aid increases, there is a slight positive impact on policy outcomes. Meanwhile, the average GDP shows a minor positive effect, suggesting that as the GDP grows, it may have a marginal influence on environmental policies. Conversely, the population variable suggests that as the population rises it could slightly dampen policy development, although the effect is minuscule.
With CO2 emissions, we observed a small rise in environmental aid correlating with more CO2 emissions. Both GDP and population growth also meant more CO2 was produced. This aligns with our prior observations about the complexity surrounding CO2 emissions, suggesting that while environmental projects receive funding, broader economic or industrial dynamics might be contributing to CO2 surges.
Turning to protected areas, aggregated environmental aid indicated a modest positive influence, whereas both average GDP and population exerted slight negative pressures. These negative coefficients imply that as GDP and population increase, the extent of protected areas may slightly decline, highlighting a delicate balance and potential tension between economic development, population growth, and environmental conservation efforts in various regions.
For forest cover, our model identified only 5.83% of the variance (R-squared = 0.0583). The contributions of aid, GDP, and population on forest conservation was muted, inferring that other factors were more influential in this context. Figure 5 offers a visual representation of predicted forest cover percentages across countries, based on a regression analysis of environmental aid, GDP, and population from 2012 to 2020. Countries depicted in green are predicted to have high forest cover percentages, indicating that the combination of aid, economic status, and population in these nations is likely conducive to sustaining or expanding forest areas. The yellow countries represent medium predictions, suggesting these areas have a moderate balance of the assessed factors contributing to their forest cover percentages. Red areas, on the other hand, are predicted to have low forest cover percentages, signaling that environmental aid, GDP, and population size might have limited effectiveness in maintaining or enhancing forested regions in these countries. The map, therefore, provides a nuanced, visual understanding of the potential interplay between environmental aid, economic conditions, population size, and forest conservation outcomes in developing countries.
Our regression analyses spotlight that environmental aid can influence policy initiatives; however, its interplay with tangible environmental outcomes, notably CO2 emissions and forest cover, is complex. The pronounced roles of GDP and population in shaping these outcomes emphasize the multifaceted nature of environmental challenges, particularly when juxtaposed with economic growth and demographic shifts.

3.3.3. Lag Analysis on Environmental Indicators and Aid Contributions

In order to gain a deeper understanding of the temporal dynamics of environmental aid on various environmental indicators, we conducted a lag analysis, as indicated in Table 7. The objective was to identify the immediate impact of aid but also the delayed effects over time.
For the policy indicator, the initial effect of donations was highly significant at lag 0. This is consistent with our findings that average GDP and average population also show statistical significance at different time lags. Yet, as time progressed, this pronounced influence lessened. By the time a 3-year lag was observed, the effect of donations on the policy indicator was found to be non-significant, as indicated by the p-value. In the realm of CO2 emissions, the data told a somewhat similar story. The immediate aftermath of aid donations at lag 0 presented a coefficient of 2.356 . However, the associated p-value of 0.087 signaled a borderline significance. As shown in Table 7, GDP and population were also significant factors in later lags.
In contrast, forest cover and protected areas maintained relatively consistent intercepts throughout the timeframes analyzed, with the effects of donations being non-significant. Their influence was non-significant across the lags. However, a constant in this analysis was the profound influence of population dynamics, particularly in relation to CO2 emissions. Across all time lags examined, population metrics remained highly significant, as indicated by extremely low p-values, such as 5.42 × 10⁻²⁴ at lag 0. This underscores the influential role that population factors play in the statistical models.
In summary, this lag-driven analysis weaves a narrative of intertwined dependencies. It highlights the intricate balance between external aid, inherent economic progression, rapid population growth, and the consequential impacts on a spectrum of environmental indicators. The data ultimately crystallize the notion that while external interventions like aid have their moments of impact, intrinsic factors, especially demographic shifts, remain paramount in influencing environmental destinies.

4. Discussion

Our findings highlight that the impacts of environmental aid on developing countries are multifaceted and varied. The findings paint a picture of a complex terrain where the positive impacts of environmental aid are not always straightforward or assured, pointing towards a pressing need for not only increasing financial support but also refining strategic planning and execution in the aid deployment process.
Understanding the funding sources is crucial to address nuances in aid impact. To illustrate, France, Germany, and the United States collectively funnel approximately 36.71% of the total environmental aid, wielding significant influence over environmental priorities. This significant concentration of power among major donors introduces complexities that cannot be overlooked as financial assistance forges new pathways to tackle developmental challenges [30]. In this dynamic, while international organizations like the Global Environment Facility and the International Bank for Reconstruction and Development also play pivotal roles, the emergence of non-traditional donors, such as the Bezos Earth Fund, is a welcome trend. Their active involvement not only broadens the base of stakeholders invested in environmental protection but also symbolizes a diversifying and expanding commitment to environmental stewardship globally.
A closer look at the distribution of environmental aid reveals telling disparities. Countries like Brazil, Colombia, and China appear to be prioritized, possibly based on their significant environmental challenges or geopolitical influences. However, it is crucial to also consider nations that may not currently be high-priority recipients but play vital roles in global environmental conservation and sustainability. Countries such as the Democratic Republic of the Congo, Madagascar, and Peru harbor rich biodiversity and critically important ecosystems but receive less attention in terms of environmental aid allocation [3,31]. Despite their environmental significance, these countries appear to be underrepresented in aid distribution. Addressing these disparities and ensuring that environmental aid is also directed towards these crucial, yet underfunded regions, is essential for a balanced and effective global approach to environmental conservation and climate change mitigation [19,32]. Ensuring that aid distribution aligns more closely with environmental need, rather than purely geopolitical or economic considerations, is imperative for the long-term success and sustainability of global conservation efforts.
Encouragingly, our analysis reveals that after receiving environmental aid, there is a discernible positive shift in the development of environmental policies in developing countries, as shown in Figure 4. In specific countries like Cambodia and Malawi, there is a high correlation between environmental aid received and subsequent policy development, suggesting that aid significantly contributes to the evolution of policy in these countries. In South America, Brazil and Colombia, both recognized for their rich biodiversity, show a medium correlation, suggesting a moderate level of alignment between aid and policy development. In contrast, nations like China and Madagascar display a low correlation, indicating that the received aid might not be effectively translating into anticipated policy shifts, or perhaps, other dominant factors are steering policy development in these countries. This wide spectrum of correlation values across nations paints a picture of the complex and nuanced relationship between environmental aid and policy changes, underlining that the effectiveness of aid as a policy catalyst is not universal but varies significantly from country to country. The observed variations imply that while aid can indeed initiate policy development, the sustainability and effectiveness of these changes are not guaranteed and can be influenced by myriad factors, including the political landscape and shifting priorities within recipient countries. This nuanced understanding necessitates a more tailored approach to aid distribution, factoring in the unique socio-political and environmental contexts of each recipient nation to enhance the long-term impact and effectiveness of environmental aid.
Even with significant aid allocations, the positive impacts are not always sustained or consistent in various nations. The lack of observable improvements in forest cover, expansion of protected areas, or reduction in CO2 emissions highlights variability in outcomes despite substantial financial support. This variability suggests that internal factors, such as administrative inefficiencies and corruption, may impede progress. As visualized in Figure 5, the regression predictions demonstrate a varied relationship between environmental aid and increased forest cover across countries. Countries like Argentina and Brazil show a “high” prediction category, suggesting a stronger link between aid and forest cover improvement, while nations such as Bangladesh and China fall into the “low” prediction category, indicating a weaker or non-existent correlation. These discrepancies suggest that a myriad of local, national, and global factors influences forest cover, thus complicating the discernible effects of aid [33,34,35,36].
Within the framework of our analysis, we note that several R-squared values are low, indicating that the model accounts for a modest portion of the variance in the dependent variables. Given the array of factors influencing the outcomes, many of which are either non-quantifiable or excluded from the model, even low R-squared values are of significance. Although these values indicate limited predictive value, they underscore the complex interplay between environmental aid and conservation outcomes, serving as a preliminary yet crucial step in understanding these dynamics. Future studies with more refined data and methodologies may shed more light on these relationships and offer more robust predictive models.
An overarching theme in our findings is the role economic growth and population dynamics play, particularly concerning CO2 emissions. As the economy and population continue to grow, the challenges associated with managing and mitigating environmental impacts correspondingly magnify. While immediate impacts are tangible and often positive, the longevity of these effects is inconsistent and varies across indicators. Policymakers, donors, and stakeholders should consider these time-lagged influences, ensuring that aid not only sparks change but fortifies and sustains it.

Identifying Pathways for More Effective Environmental Aid

The complexity of environmental aid is evident from our data, but with a nuanced understanding, we can identify potential pathways for effective interventions. Our research highlights the changing impact of aid over time, suggesting that a fixed approach might not consistently produce the anticipated results [37,38,39]. An adaptive aid management system, where funds are disbursed following regular evaluations, would ensure resources are used more effectively. This could mean aligning disbursements with demonstrable real-world outcomes such as quantifiable increases in forest cover, reductions in pollution levels, improvements in local biodiversity, and even social indicators like community engagement in conservation efforts [21,40,41,42]. Linking aid disbursement to a performance dashboard with these diverse metrics would create a comprehensive framework for accountability and adaptability.
While environmental aid is essential, its effectiveness is not guaranteed due to inherent challenges within recipient countries, including weak management and monitoring, corruption, and lack of necessary infrastructure and resources. Issues like inadequate training and capacity among local personnel, misalignment between donors’ objectives and recipients’ actual needs, political instability, and economic volatility can also hinder aid utilization. Realizing the conservation potential of every dollar of aid demands a holistic understanding of environmental aid dynamics, coupled with a strategic, collaborative, and adaptive approach to overcome these challenges and contribute meaningfully to sustainable conservation initiatives [43,44].
It is imperative that aid does not just focus on financial support but also emphasizes empowering local communities with knowledge and tools [45]. Considering the intertwined challenges in environmental conservation, siloed approaches are less likely to succeed [46,47,48]. Collaborations that span policy, biodiversity, and education can enhance the overall positive outcomes.
Though this study provides valuable insights into the complexities of environmental aid efficacy, there are limitations. The scope of this study was framed by available data, which may not encompass all forms of environmental aid or all geographic locations. This constraint could result in some form of selection bias. Our research focused on quantifiable metrics of aid effectiveness, potentially overlooking qualitative factors such as community satisfaction or cultural relevance. Within this limitation, it is crucial to recognize that every country grapples with unique environmental challenges, necessitating solutions that are tailored to local conditions and nuances. Given this diversity, deploying a universal measure for evaluating the effectiveness of financial assistance across these diverse contexts becomes inherently challenging. Additionally, the lag analysis adopted in this study covers only three years. Because of the varied challenges each nation faces, and the time it takes for aid to effectively address these challenges, future studies would benefit from a longer analysis period and incorporation of localized environmental, economic, and social indicators to more accurately assess the impacts of environmental aid over time. Future research should engage in more granular, country-specific analyses or employ alternative classification methodologies that might better capture the nuanced relationships between environmental aid and its effectiveness, offering a more detailed understanding of aid dynamics in distinct national contexts.

5. Conclusions

The intricate relationship between environmental aid, its allocation, and its impact on developing countries underscores the complexity of addressing global environmental challenges. The findings presented in this article highlight the evolving nature of aid’s influence over time subtly questioning the true conservation impact of environmental aid provided. As our analysis unfolds, it is evident that while aid can indeed influence policy development, its tangible impact on conservation outcomes like increased forest cover, protected area expansion, and CO2 emissions reduction is not straightforward or significant. The observed weak correlations emphasize that the optimal allocation and effectiveness of environmental aid is a nuanced and multifaceted challenge. This involves striking a delicate balance between immediate conservation results and long-term sustainability while navigating through the complexities introduced by economic growth imperatives and demographic shifts in recipient countries.
This study illuminates the need for adaptive aid management strategies that are not only effective in resource utilization but are also aligned with achieving tangible, real-world conservation outcomes. It is imperative to craft strategies incorporating the necessity of targeted interventions, significant local community engagement, interdisciplinary collaboration, continuous monitoring, and transparent practices. This holistic approach can potentially maximize the benefits derived from environmental aid, enhancing its impact on both policy levels and practical, on-the-ground conservation efforts. As we move forward, developing and implementing evidence-based strategies that meld quantitative insights with a deep qualitative understanding of recipient regions’ unique socio-economic and environmental landscapes is crucial. This approach, rooted in principles of collaboration, sustainability, and holistic well-being, offers a promising pathway for not just distributing, but also effectively utilizing environmental aid to achieve lasting and meaningful conservation outcomes.

Supplementary Materials

The following supporting information can be downloaded at: https://www.mdpi.com/article/10.3390/land12101953/s1, Table S1: Overview of environmental aid provided by donor countries from 2012 to 2021: a breakdown of total amounts, top recipients, and their respective contributions (in USD million); Table S2: Overview of environmental aid received by developing countries from 2012 to 2021: a breakdown of total amounts, leading donors, and their respective contributions (in USD million).

Author Contributions

Conceptualization, C.M., T.S. and L.B.B.; methodology, C.M., T.S. and L.B.B.; software, C.M., T.S. and L.B.B.; validation, C.M., T.S. and L.B.B.; formal analysis, C.M., T.S. and L.B.B.; investigation, C.M., T.S. and L.B.B.; resources, C.M., T.S. and L.B.B.; data curation, C.M., T.S. and L.B.B.; writing—original draft preparation, C.M., T.S. and L.B.B.; writing—review and editing, C.M., T.S. and L.B.B.; visualization, C.M., T.S. and L.B.B.; supervision, C.M., T.S. and L.B.B.; project administration, C.M., T.S. and L.B.B. All authors have read and agreed to the published version of the manuscript.

Funding

This research received no external funding.

Data Availability Statement

The data presented in this study are available on request from the corresponding author. The data are not publicly available due to their derivation from various sources, each requiring appropriate citation and acknowledgment as per their respective distribution policies and usage rights.

Conflicts of Interest

The authors declare no conflict of interest.

References

  1. Rockström, J.; Steffen, W.; Noone, K.; Persson, Å.; Chapin, F.S.; Lambin, E.F.; Lenton, T.M.; Scheffer, M.; Folke, C.; Schellnhuber, H.J.; et al. A Safe Operating Space for Humanity. Nature 2009, 461, 472–475. [Google Scholar] [CrossRef] [PubMed]
  2. Díaz, S.; Settele, J.; Brondízio, E.S.; Ngo, H.T.; Agard, J.; Arneth, A.; Balvanera, P.; Brauman, K.A.; Butchart, S.H.M.; Chan, K.M.A.; et al. Pervasive Human-Driven Decline of Life on Earth Points to the Need for Transformative Change. Science 2019, 366, eaax3100. [Google Scholar] [CrossRef] [PubMed]
  3. Johnson, C.N.; Balmford, A.; Brook, B.W.; Buettel, J.C.; Galetti, M.; Guangchun, L.; Wilmshurst, J.M. Biodiversity Losses and Conservation Responses in the Anthropocene. Science 2017, 356, 270–275. [Google Scholar] [CrossRef] [PubMed]
  4. CBD. Estimation of Resources Needed for Implementing the Post-2020 Global Biodiversity Framework; CBD: Montreal, QC, Canada, 2020. [Google Scholar]
  5. Xu, H.; Cao, Y.; Yu, D.; Cao, M.; He, Y.; Gill, M.; Pereira, H.M. Ensuring Effective Implementation of the Post-2020 Global Biodiversity Targets. Nat. Ecol. Evol. 2021, 5, 411–418. [Google Scholar] [CrossRef]
  6. Dempsey, J.; Irvine-Broque, A.; Bigger, P.; Christiansen, J.; Muchhala, B.; Nelson, S.; Rojas-Marchini, F.; Shapiro-Garza, E.; Schuldt, A.; DiSilvestro, A. Biodiversity Targets Will Not Be Met without Debt and Tax Justice. Nat. Ecol. Evol. 2021, 6, 237–239. [Google Scholar] [CrossRef] [PubMed]
  7. McCarthy, D.P.; Donald, P.F.; Scharlemann, J.P.W.; Buchanan, G.M.; Balmford, A.; Green, J.M.H.; Bennun, L.A.; Burgess, N.D.; Fishpool, L.D.C.; Garnett, S.T.; et al. Financial Costs of Meeting Global Biodiversity Conservation Targets: Current Spending and Unmet Needs. Science 2012, 338, 946–949. [Google Scholar] [CrossRef]
  8. Field, C.B.; Barros, V.R. Climate Change 2014—Impacts, Adaptation and Vulnerability: Regional Aspects; Cambridge University Press: Cambridge, UK, 2014. [Google Scholar]
  9. Chan, K.M.A.; Balvanera, P.; Benessaiah, K.; Chapman, M.; Díaz, S.; Gómez-Baggethun, E.; Gould, R.; Hannahs, N.; Jax, K.; Klain, S.; et al. Why Protect Nature? Rethinking Values and the Environment. Proc. Natl. Acad. Sci. USA 2016, 113, 1462–1465. [Google Scholar] [CrossRef] [PubMed]
  10. Costanza, R.; De Groot, R.; Braat, L.; Kubiszewski, I.; Fioramonti, L.; Sutton, P.; Farber, S.; Grasso, M. Twenty Years of Ecosystem Services: How Far Have We Come and How Far Do We Still Need to Go? Ecosyst. Serv. 2017, 28, 1–16. [Google Scholar] [CrossRef]
  11. Field, C.B.; Barros, V.R. Intergovernmental Panel on Climate Change (Eds.). Climate Change 2014: Impacts, Adaptation, and Vulnerability: Working Group II Contribution to the Fifth Assessment Report of the Intergovernmental Panel on Climate Change; Cambridge University Press: New York, NY, USA, 2014; ISBN 978-1-107-64165-5. [Google Scholar]
  12. Mittermeier, R.A.; Turner, W.R.; Larsen, F.W.; Brooks, T.M.; Gascon, C. Global Biodiversity Conservation: The Critical Role of Hotspots. In Biodiversity Hotspots; Zachos, F.E., Habel, J.C., Eds.; Springer: Berlin/Heidelberg, Germany, 2011; pp. 3–22. ISBN 978-3-642-20991-8. [Google Scholar]
  13. Deutz, A.; Heal, G.M.; Niu, R.; Swanson, E.; Townshend, T.; Li, Z.; Delmar, A.; Meghji, A.; Sethi, S.A.; Tobin-de la Puente, J. Financing Nature: Closing the Global Biodiversity Financing Gap; The Paulson Institute: Chicago, IL, USA; The Nature Conservancy: Arlington County, VA, USA; The Cornell Atkinson Center for Sustainability: Ithaca, NY, USA, 2020. [Google Scholar]
  14. Sachs, J.D. The Age of Sustainable Development; Columbia University Press: New York, NY, USA, 2015; ISBN 978-0-231-17314-8. [Google Scholar]
  15. Tierney, M.J.; Nielson, D.L.; Hawkins, D.G.; Roberts, J.T.; Findley, M.G.; Powers, R.M.; Parks, B.; Wilson, S.E.; Hicks, R.L. More Dollars than Sense: Refining Our Knowledge of Development Finance Using AidData. World Dev. 2011, 39, 1891–1906. [Google Scholar] [CrossRef]
  16. Weikmans, R.; Roberts, J.T. The International Climate Finance Accounting Muddle: Is There Hope on the Horizon? Clim. Dev. 2019, 11, 97–111. [Google Scholar] [CrossRef]
  17. OECD. The Polluter Pays Principle: Definition, Analysis, Implementation; OECD: Paris, France, 2008; ISBN 978-92-64-11337-4. [Google Scholar]
  18. UNFCC. Adoption of the Paris Agreement; UNFCC: New York, NY, USA, 2015. [Google Scholar]
  19. IPBES. Global Assessment Report on Biodiversity and Ecosystem Services of the Intergovernmental Science-Policy Platform on Biodiversity and Ecosystem Services; Zenodo: Geneva, Switzerland, 2019. [Google Scholar]
  20. UN General Assembly. Transforming Our World: The 2030 Agenda for Sustainable Development; United Nations: New York, NY, USA, 2015. [Google Scholar]
  21. Andrews, M.; Pritchett, L.; Woolcock, M. Building State Capability: Evidence, Analysis, Action, 1st ed.; Oxford University Press: Oxford, UK, 2017; ISBN 978-0-19-874748-2. [Google Scholar]
  22. Collier, P.; Dollar, D. Aid Allocation and Poverty Reduction. Eur. Econ. Rev. 2002, 46, 1475–1500. [Google Scholar] [CrossRef]
  23. Moyo, D. Dead Aid: Why Aid Is Not Working and How There Is a Better Way for Africa, 1st ed.; Farrar, Straus and Giroux: New York, NY, USA, 2009; ISBN 978-0-374-13956-8. [Google Scholar]
  24. OECD. A Comprehensive Overview of Global Biodiversity Finance; OECD: Paris, France, 2020. [Google Scholar]
  25. Booth, D. Aid Effectiveness: Bringing Country Ownership (and Politics) Back In. Confl. Secur. Dev. 2012, 12, 537–558. [Google Scholar] [CrossRef]
  26. Pritchett, L.; Woolcock, M.; Andrews, M. Looking Like a State: Techniques of Persistent Failure in State Capability for Implementation. J. Dev. Stud. 2013, 49, 1–18. [Google Scholar] [CrossRef]
  27. Forstater, M.; Nakhooda, S.; Watson, C. The Effectiveness of Climate Finance: A Review of the Amazon Fund—ODI Working Papers 372—Research Reports and Studies; Overseas Development Institute: London, UK, 2013. [Google Scholar]
  28. World Bank. World Development Indicators Data Bank; World Bank: Washington, DC, USA, 2023. [Google Scholar]
  29. OECD Organisation for Economic Co-Operation and Development (OECD). (2021). Creditor Reporting System (CRS) 4.10: IV.1. General Environment Protection. 2023. Available online: https://stats.oecd.org (accessed on 29 September 2023).
  30. Hicks, R.L. (Ed.) Greening Aid? Understanding the Environmental Impact of Development Assistance; Oxford University Press: Oxford, UK, 2008; ISBN 978-0-19-921394-8. [Google Scholar]
  31. Butchart, S.H.M.; Di Marco, M.; Watson, J.E.M. Formulating Smart Commitments on Biodiversity: Lessons from the Aichi Targets. Conserv. Lett. 2016, 9, 457–468. [Google Scholar] [CrossRef]
  32. Tittensor, D.P.; Walpole, M.; Hill, S.L.L.; Boyce, D.G.; Britten, G.L.; Burgess, N.D.; Butchart, S.H.M.; Leadley, P.W.; Regan, E.C.; Alkemade, R.; et al. A Mid-Term Analysis of Progress toward International Biodiversity Targets. Science 2014, 346, 241–244. [Google Scholar] [CrossRef]
  33. Burgess, R.; Hansen, M.; Olken, B.A.; Potapov, P.; Sieber, S. The Political Economy of Deforestation in the Tropics. Q. J. Econ. 2012, 127, 1707–1754. [Google Scholar] [CrossRef]
  34. Ferraro, P.J.; Pattanayak, S.K. Money for Nothing? A Call for Empirical Evaluation of Biodiversity Conservation Investments. PLoS Biol. 2006, 4, e105. [Google Scholar] [CrossRef]
  35. Nolte, C. Identifying Challenges to Enforcement in Protected Areas: Empirical Insights from 15 Colombian Parks. Oryx 2016, 50, 317–322. [Google Scholar] [CrossRef]
  36. Pressey, R.L.; Visconti, P.; Ferraro, P.J. Making Parks Make a Difference: Poor Alignment of Policy, Planning and Management with Protected-Area Impact, and Ways Forward. Philos. Trans. R. Soc. B 2015, 370, 20140280. [Google Scholar] [CrossRef]
  37. Barbier, E.B.; Burgess, J.C.; Dean, T.J. How to Pay for Saving Biodiversity. Science 2018, 360, 486–488. [Google Scholar] [CrossRef]
  38. Easterly, W. The White Man’s Burden: Why the West’s Efforts to Aid the Rest Have Done so Much Ill and so Little Good; Penguin Books: London, UK, 2007; ISBN 978-0-14-303882-5. [Google Scholar]
  39. Mastrángelo, M.E.; Pérez-Harguindeguy, N.; Enrico, L.; Bennett, E.; Lavorel, S.; Cumming, G.S.; Abeygunawardane, D.; Amarilla, L.D.; Burkhard, B.; Egoh, B.N.; et al. Key Knowledge Gaps to Achieve Global Sustainability Goals. Nat. Sustain. 2019, 2, 1115–1121. [Google Scholar] [CrossRef]
  40. Bhatt, R.; Gill, M.J.; Hamilton, H.; Han, X.; Linden, E.; Young, B.E. Uneven Use of Biodiversity Indicators in 5th National Reports to the Convention on Biological Diversity. Environ. Conserv. 2020, 47, 15–21. [Google Scholar] [CrossRef]
  41. Larson, A.M.; Soto, F. Decentralization of Natural Resource Governance Regimes. Annu. Rev. Environ. Resour. 2008, 33, 213–239. [Google Scholar] [CrossRef]
  42. Waldron, A.; Mooers, A.O.; Miller, D.C.; Nibbelink, N.; Redding, D.; Kuhn, T.S.; Roberts, J.T.; Gittleman, J.L. Targeting Global Conservation Funding to Limit Immediate Biodiversity Declines. Proc. Natl. Acad. Sci. USA 2013, 110, 12144–12148. [Google Scholar] [CrossRef] [PubMed]
  43. McElwee, P.; Turnout, E.; Chiroleu-Assouline, M.; Clapp, J.; Isenhour, C.; Jackson, T.; Kelemen, E.; Miller, D.C.; Rusch, G.; Spangenberg, J.H.; et al. Ensuring a Post-COVID Economic Agenda Tackles Global Biodiversity Loss. One Earth 2020, 3, 448–461. [Google Scholar] [CrossRef] [PubMed]
  44. Otero, I.; Farrell, K.N.; Pueyo, S.; Kallis, G.; Kehoe, L.; Haberl, H.; Plutzar, C.; Hobson, P.; García-Márquez, J.; Rodríguez-Labajos, B.; et al. Biodiversity Policy beyond Economic Growth. Conserv. Lett. 2020, 13, e12713. [Google Scholar] [CrossRef] [PubMed]
  45. Wunder, S. Payments for Environmental Services and the Poor: Concepts and Preliminary Evidence. Environ. Dev. Econ. 2008, 13, 279–297. [Google Scholar] [CrossRef]
  46. Balvanera, P.; Quijas, S.; Karp, D.S.; Ash, N.; Bennett, E.M.; Boumans, R.; Brown, C.; Chan, K.M.A.; Chaplin-Kramer, R.; Halpern, B.S.; et al. Ecosystem Services. In The GEO Handbook on Biodiversity Observation Networks; Walters, M., Scholes, R.J., Eds.; Springer International Publishing: Cham, Switzerland, 2017; pp. 39–78. ISBN 978-3-319-27286-3. [Google Scholar]
  47. Daily, G.C.; Polasky, S.; Goldstein, J.; Kareiva, P.M.; Mooney, H.A.; Pejchar, L.; Ricketts, T.H.; Salzman, J.; Shallenberger, R. Ecosystem Services in Decision Making: Time to Deliver. Front. Ecol. Environ. 2009, 7, 21–28. [Google Scholar] [CrossRef]
  48. Ostrom, E. A General Framework for Analyzing Sustainability of Social-Ecological Systems. Science 2009, 325, 419–422. [Google Scholar] [CrossRef]
Figure 1. Flow diagram of the study methodology. This diagram provides a visual representation of the data acquisition, processing, and analysis steps undertaken in this study. Starting with data sourced from the OECD, the World Bank, Climate Watch, and the Climate Change Laws of the World database, it illustrates the steps of data extraction, cleaning, standardization, and segmentation followed by the trend, correlation, and regression analyses conducted to achieve this study’s objectives.
Land 12 01953 g001
Figure 2. Distribution of environmental aid in developing countries (2012–2021). Data source: Organization for Economic Co-operation and Development (OECD). (2021). Creditor Reporting System (CRS) 4.10: IV.1. General Environment Protection, total dataset for 2012–2021. Retrieved from https://stats.oecd.org (accessed on 29 September 2023).
Land 12 01953 g002
Figure 3. Yearly environmental aid trend analysis (2012–2021), comparing all donors, all recipients, top 10 donors, top 10 recipients, and biodiversity hotspot countries.
Land 12 01953 g003
Figure 4. This map illustrates the correlation between environmental policy development and environmental aid allocations from 2012 to 2021. Countries are color coded: high (e.g., green) correlation signifies a strong alignment between aid received and environmental policy development; medium (e.g., yellow) indicates a moderate relationship; low (e.g., red) represents weak or minimal linkage between aid and policy shifts. Each category sheds light on the effectiveness of environmental aid in influencing environmental policy initiatives in the respective nations. However, it is crucial to approach these categories with caution as they are general indicators. While they serve as starting points for analysis, careful interpretation is necessary, considering the unique environmental challenges and aid dynamics in each country.
Land 12 01953 g004
Figure 5. Regression predictions of forest cover (2012–2020). The color categories—green (high), yellow (medium), and red (low)—reflect predictions of forest cover percentages based on aid, GDP, and population for each country. Countries labeled “high” are where the model predicts higher forest cover based on these factors, but this does not imply a causal relationship due to the complexity and interaction of these variables.
Land 12 01953 g005
Table 1. Environmental aid by the top 10 donor countries and institutions and top five foundations between 2012 and 2021, with their largest recipient country.
DonorTotal Amount
(USD million)
Largest RecipientDonation Amount
(USD million)
Donor countries and multilateral institutions
France$4720Colombia$1080
Germany$4299Colombia$652
United States$3658Indonesia$311
Global Environment Facility$3271China$328
Norway$2721Brazil$1204
International Bank for Reconstruction and Development$2444Turkey$390
EU Institutions$2420Turkey$630
United Kingdom$1735Kenya$219
Inter-American Development Bank$1490Bolivia$303
Japan$1488Vietnam$652
Foundations
Bezos Earth Fund$218Congo$31
Gordon and Betty Moore Foundation$147Brazil$60
MAVA Foundation$142Guinea-Bissau$19
David & Lucile Packard Foundation$94Indonesia$50
Arcus Foundation$52Indonesia$13
Table 2. Environmental aid received by the top 10 recipient countries between 2012 and 2021, alongside their largest donor contributions.
RecipientTotal Amount
(USD million)
Largest DonorDonation Amount
(USD million)
Brazil$2642Norway$1204
Colombia$2563France$1080
China$2463Germany$471
Vietnam$1786Japan$652
Mexico$1695France$776
Indonesia$1516Norway$369
India$1493International Development Association$208
Turkey$1380EU Institutions$630
Peru$2642United States$209
Kenya$2563United Kingdom$219
Table 3. Financial contributions towards biodiversity hotspots in select countries from 2012 to 2021, highlighting their largest donor contributions.
Biodiversity HotspotTotal Amount
(USD million)
Largest DonorDonation Amount
(USD million)
Congo, Dem. Rep.$609Germany$204
Bolivia$562Inter-American Development Bank$303
Ecuador$499France$163
Philippines$491United States$226
Mozambique$458United States$76
Tanzania$393United States$95
Madagascar$346Germany$168
Guatemala$317Inter-American Development Bank$153
Cambodia$262United States$95
Papua New Guinea$80Australia$39
Table 4. Regional breakdown of environmental aid received from 2012 to 2021, detailing the total contributions and spotlighting the primary donor for each region.
RegionTotal Amount
(USD million)
Largest DonorDonation Amount
(USD million)
South America$7795Norway$1598
South of Sahara$7547Germany$1016
Far East Asia$7168Japan$998
South and Central Asia$3787International Development Association$625
Caribbean and Central America$3776France$959
Europe$2088EU Institutions$858
North of Sahara$1289International Bank for Reconstruction and Development$273
Oceania$481Global Environment Facility$124
Middle East$382United States$59
Table 5. Correlation coefficients with statistical significance denoted using symbols (*** p < 0.001, ** 0.01 ≤ p < 0.05, and * 0.05 ≤ p < 0.10) for distinct environmental indicators. These are categorized by all environmental aid recipients, top 10 recipients, and other biodiversity hotspots. Sample sizes (n) are indicated for each group.
Environmental IndicatorAll Recipient Countries
(n = 138)
Top 10 Recipient Countries (n = 10)Biodiversity Hotspots (n = 10)
Policy development0.6706 ***0.5138 *0.6397 **
CO2 emissions0.5884 ***0.5011 *0.9323 ***
Forest cover0.0523 *0.4917 *−0.1311 *
Protected areas0.03120.4829 *−0.0729
Table 6. Table summarizes the results from multiple regression analyses examining the relationship between aggregated aid, average GDP, and average population on various environmental outcomes, including policy development, CO2 emissions, forest cover percentage, and protected area percentage. Coefficients are presented for each predictor, and statistical significance is denoted by asterisks: *** p < 0.001, ** 0.01 ≤ p < 0.05, and * 0.05 ≤ p < 0.10.
Dependent VariableR-SquaredInterceptTotal AidAvg. GDPAvg. Pop
Policy development0.49545.6950 ***0.0150 ***0.0003 *−6.00 × 10⁻⁹
CO2 emissions0.7704−1789.7976 **2.3555 *0.2575 *4.45 × 10⁻⁵ ***
Forest cover0.0583250.3422 ***0.08280.0073−2.08 × 10⁻⁷
Protected areas0.050793.9168 ***0.0216−0.0008−3.92 × 10⁻⁸
Table 7. Lag analysis of the impact of environmental aid on various environmental indicators controlling for GDP and population. Coefficients are presented for each predictor, and statistical significance is denoted by asterisks: *** p < 0.001, ** 0.001 ≤ p < 0.01, * 0.01 ≤ p < 0.05, and 0.05 ≤ p < 0.10.
Dependent VariableLagR-SquaredInterceptTotal AidAvg. GDPAvg. Pop
Policy development00.4955.695 ***0.015 ***0.0003 −5.99 × 10⁻⁹
10.1607.116 ***0.0020.0008 ** 1.70 × 10⁻⁸ **
20.1758.991 ***−0.0030.0007 *1.65 × 10⁻⁸ **
30.1577.901 ***−0.0010.0008 **1.67 × 10⁻⁸ **
CO2 emissions00.770−1789.82.356 0.257 4.45 × 10⁻⁵ ***
10.764−1585.70.2100.317 *4.79 × 10⁻⁵ ***
20.765−1840.6 *0.8180.336 *4.80 × 10⁻⁵ ***
30.763−1487.1−0.1560.319 *4.79 × 10⁻⁵ ***
Forest cover00.051250.3 ***0.0830.007−2.08 × 10⁻⁷
10.030255.3 ***0.0140.009−8.96 × 10⁻⁸
20.036274.7 ***−0.0370.008−9.52 × 10⁻⁸
30.035252.8 ***0.0380.008−8.57 × 10⁻⁸
Protected area00.01493.9 ***0.022−0.001−3.92 × 10⁻⁸
10.00795.1 ***0.004−0.001−2.27 × 10⁻⁸
20.00897.9 ***−0.008−0.001−2.33 × 10⁻⁸
30.00796.0 ***−0.0002−0.001−2.29 × 10⁻⁸
Disclaimer/Publisher’s Note: The statements, opinions and data contained in all publications are solely those of the individual author(s) and contributor(s) and not of MDPI and/or the editor(s). MDPI and/or the editor(s) disclaim responsibility for any injury to people or property resulting from any ideas, methods, instructions or products referred to in the content.

