Article

Soil Organic Carbon Dynamics and Influencing Factors in the Zoige Alpine Wetland from the 1980s to 2020 Based on a Random Forest Model

1
College of Resources, Sichuan Agricultural University, Chengdu 611130, China
2
College of Environmental and Resource Sciences, Zhejiang University, Hangzhou 310058, China
3
School of Geography, Faculty of Geographical Science, Beijing Normal University, Beijing 100875, China
*
Author to whom correspondence should be addressed.
These authors contributed equally to this work.
Land 2023, 12(10), 1923; https://doi.org/10.3390/land12101923
Submission received: 5 September 2023 / Revised: 6 October 2023 / Accepted: 11 October 2023 / Published: 16 October 2023

Abstract

:
Wetlands provide important ecosystem services, such as water conservation, biodiversity protection, and carbon sequestration. The Zoige alpine wetland is the largest high-altitude swamp in the world and plays a critical role in regional ecological balance and climate change. However, little is known about the fate of its soil organic carbon (SOC) storage. In this study, we estimated the degradation status of the wetland over the past 35 years and used machine learning to investigate the dynamics and driving factors of SOC at different soil depths of the Zoige wetland in 1985, 2000, and 2020. We also simulated the future SOC balance under different scenarios. The results showed that the area of Zoige wetland has degraded by 378.71 km2 in the past 35 years. Increased precipitation and solar radiation offset the adverse effects of global warming, making the soil act as a carbon sink in the past 35 years. The total SOC storage of the wetland soils in 1985, 2000, and 2020 was estimated to be 2.03 Pg, 2.05 Pg, and 2.21 Pg, respectively, with 46.95% of SOC distributed in the subsoil layers. Climate change was the most important driving factor controlling the SOC storage of the Zoige wetland, explaining 51.33% of the SOC changes in the soil. Temperature change was always the most important factor controlling wetland SOC, and precipitation had a greater impact on the topsoil. Under the temperature control targets of 1.5 °C and 2 °C, the SOC pool of the Zoige wetland will decrease by 60.21 Tg C and 69.19 Tg C, respectively. Under scenarios of a 10% and 20% increase in precipitation, the wetland soil will accumulate an additional 46.53 Tg C and 118.89 Tg C, respectively. The study results provide important references for the sustainable management of the Zoige wetland under the background of global climate change.

1. Introduction

Wetlands exist in every country globally (everywhere except Antarctica) and in all types of climates [1]. They are not only an important component of global ecosystems, but are also one of the most vital living environments for humans [2]. Wetlands have unique ecological functions, including providing clean water (SDG 6), adapting to climate change (SDG 13), and supporting biodiversity (SDG 15) [3]. As a result, they are referred to as the kidneys of the earth. Due to long-term or short-term flooded conditions, wetland anaerobic environments inhibit the decomposition of litter, resulting in the accumulation of soil carbon pools [1]. Wetlands have become carbon sinks that mitigate the increase in atmospheric greenhouse gas concentrations, and also play a particularly significant role in regulating and stabilizing the global climate [4]. Although wetlands only occupy 5–8% of the Earth’s surface, they store 20–30% (2500 Pg) of the world’s total soil organic carbon (SOC) [1]. In China, wetlands cover a total area of 53.42 × 10⁶ hm2, accounting for 10% of the global wetland area and 5.58% of the country’s total land area [2].
Due to their ability to sequester carbon for thousands of years, wetland ecosystems have long been considered one of the most important and effective options for mitigating global climate change [4]. However, wetlands are highly vulnerable ecosystems that are easily impacted by climate change and human activities, which have significant effects on wetland carbon cycling and distribution processes [5]. Increasing evidence suggests that climate change is greatly altering the functioning and services of wetland ecosystems, which can be directly and indirectly influenced by changes in temperature, rainfall intensity and frequency, and extreme climate events, such as droughts, floods, and storms [1]. Hydrological changes and rising temperatures may lead to decomposition rates in wetlands exceeding photosynthetic production, resulting in CO2 and CH4 emissions into the atmosphere, exacerbating the greenhouse effect [1,6]. Additionally, wetlands have been increasingly impacted by human disturbance since the industrial revolution [7], with 3.4 million square kilometers of inland wetlands disappearing from the earth since 1700, mainly due to conversion into cropland [8]. Wetland losses have been concentrated in Europe, the United States, and China, and have rapidly expanded since the mid-20th century [8]. This non-climatic anthropogenic pressure further affects wetland responses to the climate [9], greatly impacting wetland structure, function, and carbon storage capacity [10]. Accurately estimating wetland carbon storage is a prerequisite for wetland conservation and implementation of carbon sequestration enhancement plans [11]. However, a series of challenges, including field sampling and on-site scaling, along with definition and inclusiveness of wetland types in different assessments, have made the global wetland area and carbon stock estimates controversial [12], and this uncertainty will be further enhanced with continued climate change and intensification of human activities, including those that are widespread in China’s wetlands [13]. For policymakers, obtaining accurate estimates of carbon storage and understanding which factors play a major role in organic carbon changes is crucial for developing sustainable wetland management strategies [14]. However, it is currently unclear whether the organic carbon stocks in wetlands will respond positively or negatively to climate change in the future, and the relative importance of biotic, abiotic, and anthropogenic factors in wetland carbon stock dynamics is also unclear.
Globally, climatic, biotic, and edaphic factors often interact with each other and jointly regulate SOC dynamics through various processes and mechanisms [15]. It is widely believed that the dynamic changes in SOC depend on the long-term balance between carbon inputs and carbon losses through a series of geophysical and biochemical processes [16]. Deciphering the effects of different biological, abiotic, and anthropogenic factors on SOC dynamics is crucial for understanding how SOC responds to future climate change, environmental changes, and anthropogenic disturbances [16]. The physicochemical properties of soil are closely related to the SOC stock under different scales and climate regimes, as the soil physicochemical environment controls the supply of resources, such as water, nutrients, and oxygen, which are essential for microbial communities to utilize SOC and for plants to assimilate carbon to supplement the soil carbon pool [17]. Increasing evidence suggests that the soil geochemistry and physical structure provide physicochemical barriers to SOC microbial accessibility [18]; for example, SOC can be physically protected from decomposition via adsorption and retention in soil aggregates and mineral particles [17]. Vegetative growth directly controls the carbon source in the soil surface, and plays an important role in controlling SOC distribution and dynamics through the generation of litter and the growth, exudation, and turnover of deep soil roots [16]. Environmental changes, such as CO2 fertilization and nitrogen deposition, may also have a significant impact on SOC dynamics [19]. Previous research has mostly focused on single independent factors, which may contribute to uncertainty in the results [16]. Previous studies have shown that for the global SOC stock, the contribution of climate is much greater in the soil surface layer than in the soil itself, but it shows similar importance in the range of 20–200 cm [17], and the impact of climate on organic carbon change may be overestimated. For China’s SOC dynamics, the relative contributions of each driving factor show significant spatial heterogeneity [16]. The development process of wetlands is mainly influenced by small-scale landforms and hydrological processes, and has nonzonal characteristics [20]. In addition, the magnitude, directionality, and seasonality of hydrological changes are expected to vary by region, and therefore, the fate of soil carbon stored in wetlands will depend on local conditions [21]. It is crucial to understand the controlling factors of wetland SOC storage on a site-specific basis to develop regional sustainable management strategies. It should be noted that although most research has focused on the dynamics of organic carbon in the soil above 0.3 m, the main part of SOC storage, which accounts for about half of the global SOC stock, is stored in soil layers deeper than 0.3 m [22]. Similar to the surface SOC pool, the subsoil SOC pool can actively respond to climate and environmental changes [22,23], but little is known about it to date. It has been observed that the loss of subsoil SOC increases under warming and increased fresh carbon supply, which is concerning [17]. Therefore, it is necessary to include deep SOC in our scope of concern, which will help develop unbiased strategies for the effective management of the entire soil profile carbon.
The Zoige alpine wetland (101°36′–103°55′ E, 32°20′–34°05′ N) is located at the eastern edge of the Qinghai–Tibet Plateau and is the largest alpine peat wetland in the world. It possesses unique climate, hydrological, topographical, and soil conditions [24], and plays an important role in water conservation, water supply, and ecological balance [2]. The distinctive climate, geology, and geography of the Zoige wetland provide environmental conditions for a large number of wetland wildlife and flora, making it one of the significant organic carbon pools in China [25]. However, these wetlands are vulnerable to the impacts of climate change and human activities [26]. In recent years, the Qinghai–Tibet Plateau has undergone significant temperature changes [27], with the temperature increasing by 0.3 °C per decade over the past 50 years, approximately three times faster than the global warming rate [28]. This has affected local atmospheric circulation and the water cycle, leading to changes in material and energy exchange between the land surface and the atmosphere [27], which is expected to increase the decomposition of organic matter in alpine wetlands. Furthermore, the combined effect of frequent artificial drainage, peat extraction, and livestock grazing has caused severe degradation of the Zoige alpine wetland [26], with wetland area reduced by over 30% since the 1970s [26]. These processes, and their resulting changes, may significantly impact SOC stocks. In this context, it is therefore necessary to quantify the recent changes in wetland area, dynamics of organic carbon, and the relative importance of influencing factors in the Zoige wetland, as well as to project the expected carbon dynamics under the 1.5 °C and 2 °C warming targets, to effectively monitor the ecological security of plateau wetlands and develop rational sustainable development policies in accordance with the Paris Climate Agreement. Previous studies on carbon cycling in the Zoige wetland have mainly focused on greenhouse gas emissions and carbon loss during different degradation stages [2,28,29,30], which deepens our understanding of carbon cycling in the Zoige wetland, but there is currently a lack of knowledge on the spatiotemporal variation and influencing factors of organic carbon in the Zoige wetland. Some scholars have used a space-for-time substitution approach to fit independent variables with carbon stocks to obtain the driving factors of organic carbon change [6,31], but most of them have only used annual temperature, precipitation, and soil moisture as their independent variables, neglecting other climate, biological, and soil factors. Additionally, this method cannot reflect the dynamics of organic carbon in the entire wetland. Based on this, the objectives of this study were as follows: (1) to analyze the changes in the area of Zoige alpine wetlands from 1985 to 2020; (2) to quantify the dynamics of organic carbon content, carbon density, and carbon storage in three standard depth soils (0–20 cm, 20–50 cm, and 50–100 cm) from the Zoige wetlands from 1985 to 2020; (3) to clarify the relative importance of 17 variables, including climate, environment, and soil properties, in controlling the SOC storage in different soil layers from the Zoige wetlands; and (4) to estimate the dynamics of organic carbon in Zoige alpine wetlands under the 1.5 °C and 2 °C temperature control targets and increased rainfall of +10%/+20%.

2. Materials and Methods
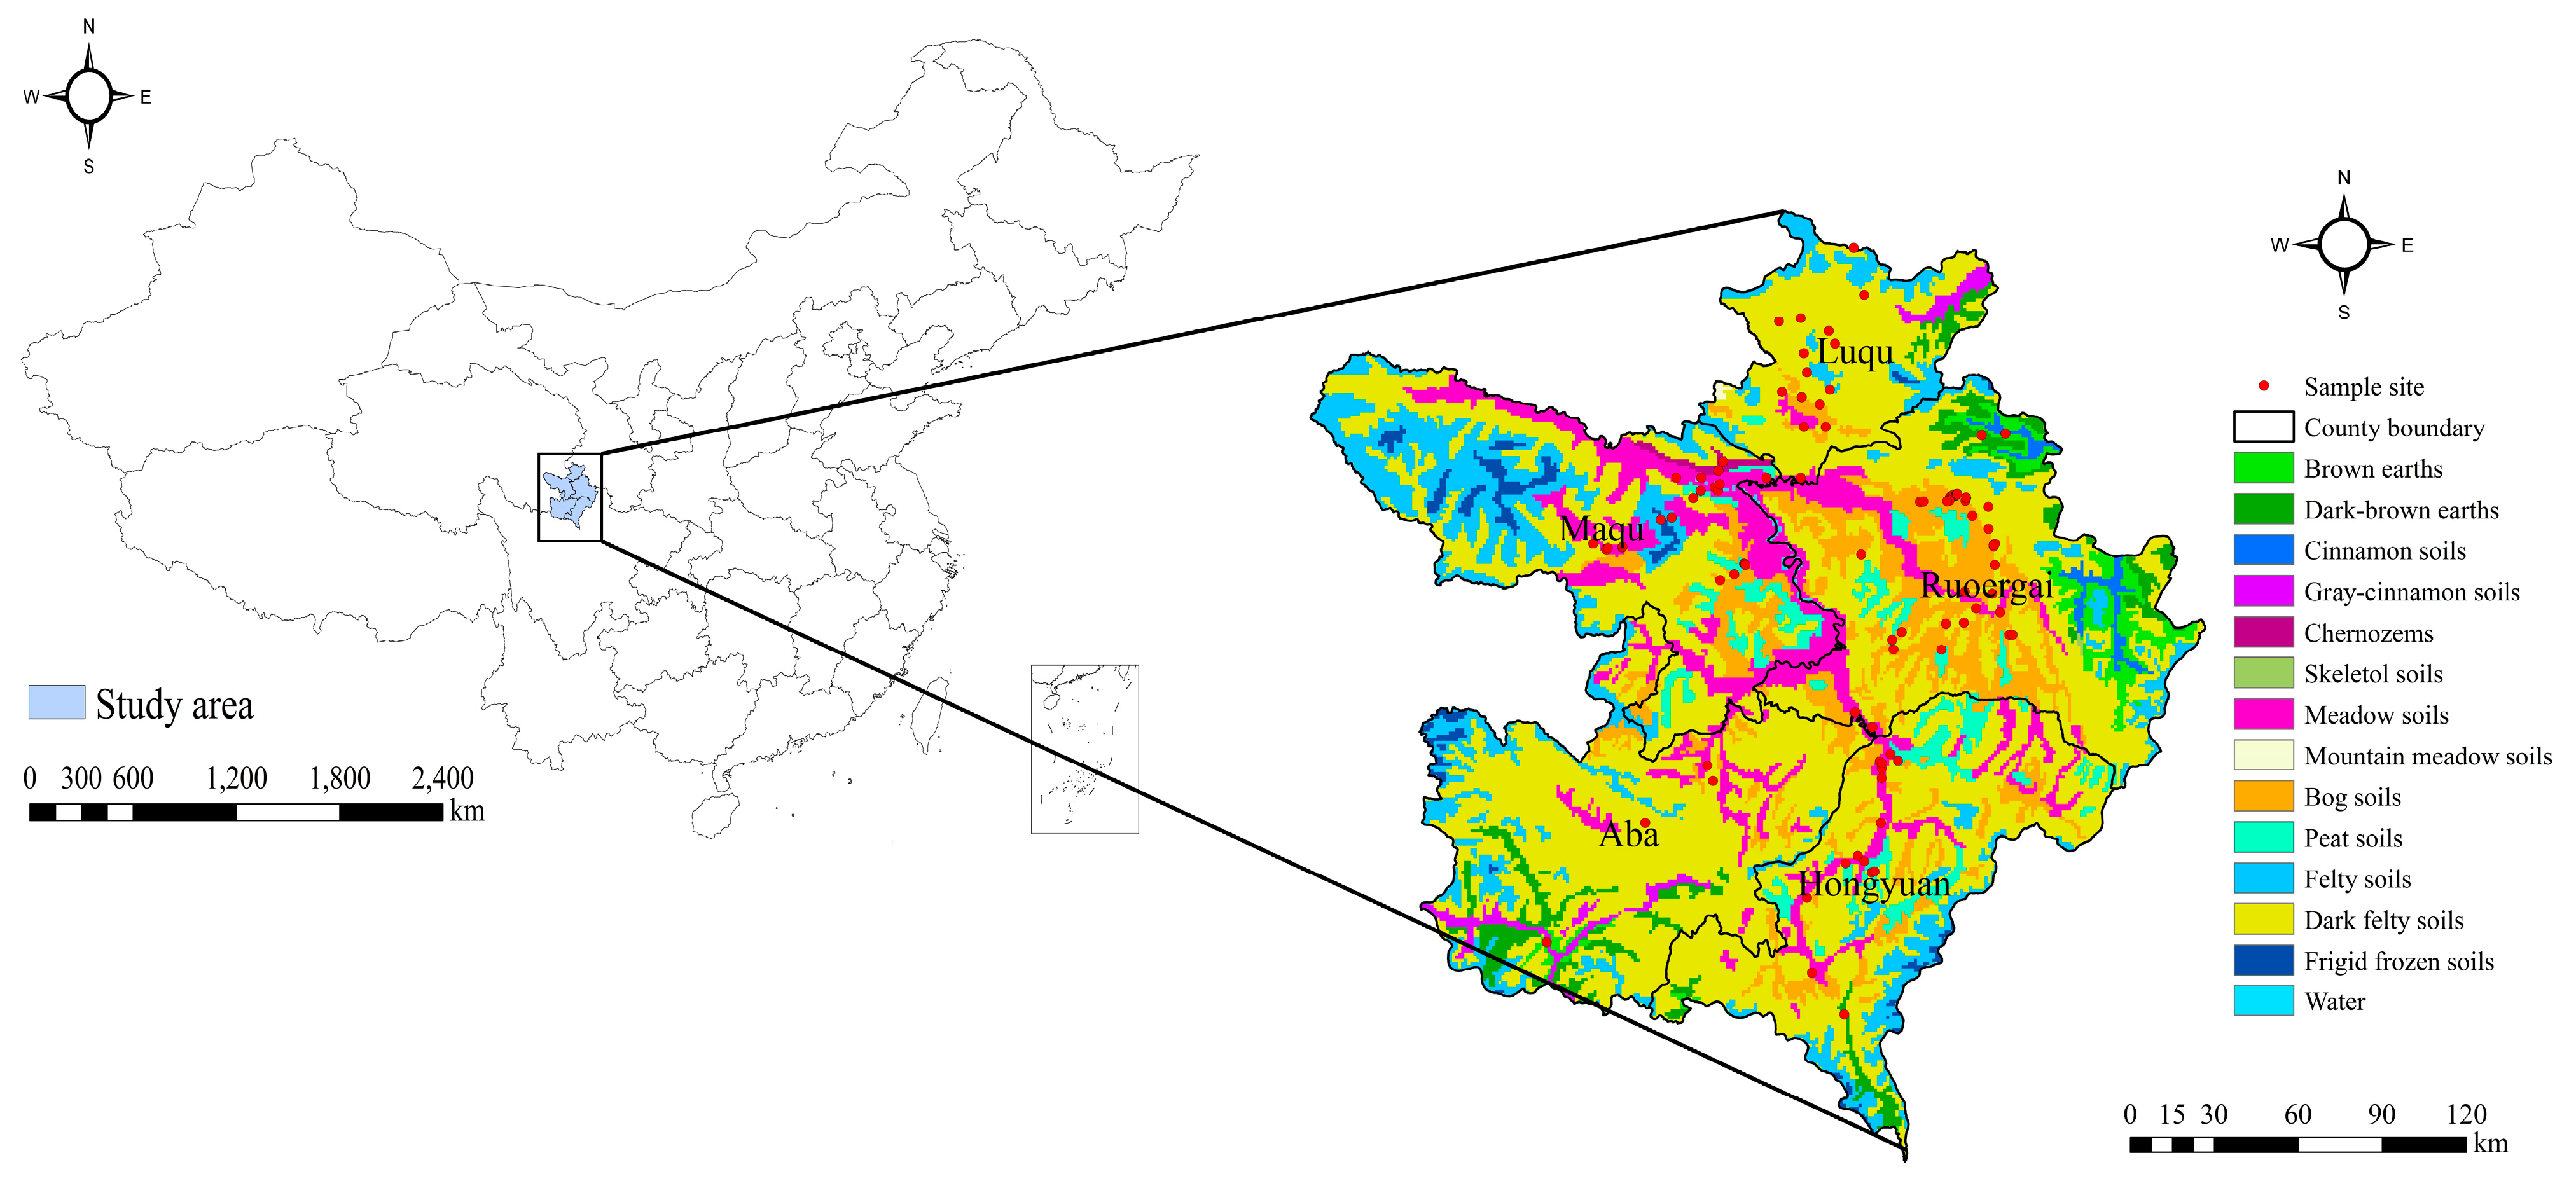
2.1. Study Area

The study area is located in the Zoige plateau (31°48′~34°48′ N, 100°48′~103°40′ E), which is situated on the northeastern edge of the Qinghai–Tibetan Plateau, where the world’s largest alpine swamp wetland is widely distributed, and is also considered to be one of the most important water source conservation areas for the upstream Yellow River and Yangtze River [32]. We chose the Hongyuan, Zoige, Aba, Maqu, and Luqu counties as our research objects, which cover the entire extent of the Zoige wetland (except for Section 3.1, where the Zoige wetlands in this study refer to the entire study area). The average altitude of the study area ranges from 2392 m to 5057 m, with an annual average temperature of 0.6 °C. The lowest average temperature occurs in January (−10.7 °C) and the highest in July (10.9 °C), with an annual precipitation of 656.8 mm [33], and a total area of approximately 42,797 km2 (Figure 1). The most widely distributed vegetation types in this area are marsh meadows and meadows [6]. Its subtypes include brown earths, dark-brown earths, cinnamon soils, gray-cinnamon soils, chernozems, skeletol soils, meadow soils, mountain meadow soils, bog soils, peat soils, felty soils, dark felty soils, and frigid frozen soils, accounting for a total of 13 subtypes (according to the Genetic Soil Classification of China (GSCC), see Table S1 for comparison with the Soli Taxonomy (ST)).

2.2. Data Source

2.2.1. Wetland Scope Extraction

The Landsat TM/OLI images were selected for remote sensing analysis and downloaded from the US Geological Survey (USGS) website (http://glovis.usgs.gov/ (accessed on 16 November 2022)). The images had a resolution of 30 m, and those captured during the vegetation growing season (from June to August) were uniformly chosen. The selection criteria required a cloud cover of less than 15% (considering the high annual cloud cover in the study area [34], meeting the usual 5% requirement [35] was challenging). Prior to wetland extraction, the Landsat TM/OLI images were radiometrically, geometrically, and atmospherically corrected to eliminate possible errors [2]. To enhance the display contrast of the land cover, a red–green–blue (RGB) image was generated using the near-infrared band, red band, and green band, which facilitated the clear differentiation of the water bodies. The wetland spatial distribution information for the years 1985, 2000, and 2020 was extracted using the support vector machine (SVM) algorithm for supervised classification in the feature extraction module of ENVI 5.3, and some patches were corrected by combining with the manual interpretation method to improve the classification accuracy as much as possible. The validation samples were selected from high-resolution Google Earth images, which provided accurate feature information [36]. The overall number of validation samples was 116, and the classification accuracy was more than 91%. To calculate the wetland area, the total area was equal to the number of water body pixels multiplied by the area of each pixel (in this study, the resolution of the pixels was 30 m, so the area of each pixel was 900 m2). The quantitative description of the dynamic changes in the wetland area was calculated using the following formula:
K = U b U a U a × 1 T × 100 %
where K is the dynamic degree of wetland area change, U a and U b are the wetland areas at the beginning and end of monitoring, respectively, and T is the monitoring duration. Therefore, the greater the absolute value of the dynamic degree, the faster the wetland area changes; the lower the absolute value of the dynamic degree, the more stable the change.

2.2.2. Soil Organic Carbon Samples

The data from the 1980s were sourced from the Second National Soil Survey of China (1979–1985), a national soil survey that provided information on more than 2500 typical soil profiles, each containing ten key soil parameters for various soil layers (National Soil Survey Office, 1996). This survey generated a dataset, with location information that characterizes the spatial position and distribution of each typical soil type. Data from the years 2000 to 2014 were obtained from an open-source database [14], which comprised data from the published literature and experimental test data collected by the authors and related research groups from 2004 to 2014. This dataset included SOC values for 4515 0–20 cm soil layers and 3026 0–100 cm soil layers, with their sampling times labeled. Data from 2015 to 2019 were derived from the Chinese Soil Series Sichuan and Gansu volumes of the National Science and Technology Basic Work Special Project, which investigated nearly 7000 typical soil monoliths in China, and analyzed and measured the physicochemical properties of the horizons, providing reliable soil information since the Second National Soil Survey of China. Sample sites located in the Zoige alpine wetland were extracted from the above dataset. The data for 2020 were obtained via field sampling and experimental testing conducted by our research group. Additionally, data were collected from the published literature with clear spatial information and sampling year requirements. A total of 138 profiles were obtained, of which some of the sample points were extracted from the data of the Second National Soil Survey of China; the data of the Chinese Soil Series were of land use types other than wetland (13), and the land use types of all the remaining sample points extracted were wetland (125). The locations and soil subtypes of the sample sites are shown in Figure 1. Soil bulk density (BD) data were obtained from the National Earth System Science Data Center (RESDC, https://www.resdc.cn/ (accessed on 6 November 2022)) at a horizontal spatial resolution of 90 m and vertically included six soil layer depths: 0–5 cm, 5–15 cm, 15–30 cm, 30–60 cm, 60–100 cm, and 100–200 cm.
Due to the inconsistent layer depths among soil profiles in each dataset, we used the ASRIS spline tool (https://www.asris.csiro.au (accessed on 3 December 2022)) to harmonize the SOC and BD data to three standard depths (0–20 cm, 20–50 cm, and 50–100 cm). This harmonization enabled us to calculate SOC stocks in the defined standard layers, thereby allowing direct comparison of the soil profiles [17]. Of the 138 profiles obtained, including 40 profiles with a depth of 0–100 cm (18 of which contained SOC information at the 3 standard depths, while 22 contained only SOC information at 0–100 cm), 7 profiles had a depth of 0–50 cm (containing SOC information at 0–20 cm and 20–50 cm), while 91 profiles encompassed a depth of 0–20 cm. These profiles covered 11 main soil subtypes out of the 13 in the Zoige wetland; thus, we considered them to be representative. Following Xia et al. (2022) [15], for the 18 profiles with SOC information at the 3 standard depths and the 7 profiles with a depth of 0–50 cm, we randomly selected 15 profiles out of the given 25 profiles as Group 1 to establish a linear regression equation between SOC content measured at 0–20 cm and 20–50 cm (Figure S1a). Based on the regression equation obtained from Group 1, we substituted the measured SOC content of the 10 remaining profiles (Group 2) at 0–20 cm into the equation to calculate the predicted SOC content at 20–50 cm and paired these values with the measured SOC content at 20–50 cm using a paired-sample t-test (p < 0.001) (Figure S1b). Therefore, we considered the prediction model to be effective. Based on this, we established a regression equation between the measured SOC content at 0–20 cm and 20–50 cm from 25 profiles (y = 0.99x − 1.70; R2 = 0.89, p < 0.001) (Figure S1c), which was used to predict the unknown SOC content in the 20–50 cm layer based on the measured SOC content in the 0–20 cm layer. We then used the same method to establish a regression equation between the measured SOC content at 20–50 cm and 50–100 cm (y = 1.17x − 1.17; R2 = 0.77, p < 0.001) (Figure S2c), which was used to predict the unknown SOC content in the 50–100 cm layer.
The organic carbon density (SOCD) of each layer was calculated using the following equation:
S O C D = S O C C × B D × D / 100
where SOCD is the SOC density (kg C m−2), SOCC is the SOC content (g kg−1), BD is the bulk density (g cm−3), and D is the soil layer thickness (cm).
Soil organic carbon storage was calculated using the following method:
S O C S = S O C D × S
where SOCS is the SOC storage capacity (kg), SOCD is the mean value of SOC density across the study area (kg C m−2), and S is the entire study area (m2) (obtained from the National Bureau of Statistics of China).

2.2.3. Variables Data Sources

Based on the synthesis of previous research [15,16,17,18], we identified 17 driving factors to estimate the soil organic carbon (SOC) stock in the Zoige wetland. These factors were divided into four categories: soil properties, climate change, environmental characteristics, and human disturbance (Table S2). The soil properties included the content of clay, silt, sand, pH value, cation exchange capacity (CEC), and total nitrogen density (TN density). The soil texture data were obtained from the Resource and Environment Science and Data Center (RESDC, https://www.resdc.cn/ (accessed on 6 November 2022)), which was compiled based on soil profile data obtained from the 1:1,000,000 soil type map and the second national soil survey. These data were divided into three categories: clay, silt, and sand, and each category was represented as a percentage. The pH, CEC, and TN density data were obtained from the National Earth System Science Data Center (NESSDC, http://www.geodata.cn/ (accessed on 8 November 2022)), which is based on soil profile samples collected from recent Chinese soil surveys. These three indicators were treated in the same way as SOC and BD. The environmental conditions of soil formation were precisely characterized and analyzed by integrating geographic information and remote sensing technology, developing an adaptive depth function fitting method, and integrating advanced ensemble machine learning methods to generate a high-resolution three-dimensional digital distribution map of soil properties in China.
The climate variables included temperature (Tem), precipitation (Pre), the humidity index (HI, the ratio of precipitation to potential evapotranspiration), soil moisture (SW), vapor pressure deficit (VPD), and solar radiation (SR). The Tem and Pre data were obtained from the publicly available 1 km resolution monthly mean temperature dataset and monthly precipitation dataset for China from 1901 to 2021, published by Peng et al. (2019) [37]. The potential evapotranspiration, SW, VPD, and SR were downloaded from the TerraClimate dataset (http://thredds.northwestknowledge.net:8080/thredds/catalog/TERRACLIMATE_ALL/data/catalog.html (accessed on 10 November 2022)).
The environmental variables included the digital elevation model (DEM), net primary productivity (NPP), CO2 fertilization (CO2), and nitrogen deposition (ND). The DEM data used the GDEMV3 30 m resolution digital elevation model (https://www.gscloud.cn (accessed on 8 November 2022)). The NPP was derived from the MODIS Net Primary Production Gap-Filled Yearly L4 Global 500 m SIN Grid V006 product (https://search.earthdata.nasa.gov (accessed on 9 November 2022)). CO2 fertilization was based on the CAMS global inversion-optimized greenhouse gas fluxes and concentrations product (https://ads.atmosphere.copernicus.eu (accessed on 11 November 2022)), which provides the daily mean atmospheric CO2 concentration. Nitrogen deposition was obtained from the NACP MsTMIP: Global and North American Driver Data for Multi-Model Intercomparison product (https://www.carboncyclescience.us/data-carbon#MsTMIP (accessed on 10 November 2022)), which distinguishes NHx and NOy; here, we summed them up as nitrogen deposition. We used the global human footprint dataset developed by Mu et al. (2022) [38] for the period from 2000 to 2018 to represent the degree of human disturbance. This dataset considered eight variables, including population density, nighttime lights, cropland, pasture, and highways, and can more comprehensively reflect human pressure.
More than 80% of sample sites have a definite sampling year, and since the carbon stocks were affected by temperature and precipitation in the previous years, except for the current year, the average of the five years prior to the sampling year was used as the temperature and precipitation data, with reference to previous studies [39]. The remaining 15 variables correspond to the sampling year. The values of 17 variables were extracted from 138 sample points according to their latitude and longitude coordinates (WGS84) [16]. For sample points where only a time range was given, the mean value of the variable within that time range was used. In addition, we provided statistical descriptions of organic carbon densities and selected variables for each sample point (Table S3).

2.3. Model Development

2.3.1. Random Forest

Random forest (RF) is a widely used machine learning method that is especially suitable for small observation sets and a large number of predictor variables [40]. RF is an ensemble of decision tree predictors that builds a decision tree for each bootstrap sample, and the sample selection is independent for each tree [41]. All trees in the forest have the same distribution, which ensures the robustness of the model [42]. The RF model is commonly used for data exploration and modeling complex relationships between predictors and target variables, and often demonstrates a strong ability to reduce experimental noise, showing low bias and low variance [40]. It has been successfully used for SOC mapping in many regions [40,42,43]. This algorithm provides a single prediction value by averaging the predictions of all trees, and generates a relative importance score for each predictor variable to reflect its contribution to the RF model [41]. The importance score of each predictor variable is estimated by observing the increase in prediction error when the variable is changed, while holding all other variables constant [43]. RF modeling has three parameters that need to be defined by the user: the number of features used for each node split (mtry), the number of decision trees in the forest (ntree), and the minimum node size for decision tree splitting (nodesize) [44]. Increasing the number of decision trees, and reducing the correlation between trees, can improve the predictive performance of the RF model [42].

2.3.2. Statistical Analysis

The statistical software “R 4.1.2” was used for all statistical analyses (R Core Team, 2019). In this study, soil organic carbon density was used as the dependent variable, and the 17 driving factors mentioned above were used as independent variables (predictor variables), and the functional relationship was established using the random forest algorithm. Three RF models were established using the “randomForest” package in R to simulate SOCD in the 0–20 cm, 20–50 cm, and 50–100 cm layers. We developed the best-fitting models for SOCD by iteratively changing the ntree and mtry parameters. Based on the error rate and percentage of explained variance under different parameter settings, we used 800 ntree and 5 mtry for all three models. However, it should be noted that conventional RF models have difficulty capturing temporal changes. Therefore, following the authors of [16], we split the samples into training sets (1979–2004 and 2010–2020, 72%) and a testing set (2005–2009, 28%), according to the time series. The square of coefficient of determination (R2) and significance test (p-value) were used to evaluate the performance of the RF models (Figure S3). The constructed and validated RF models, using this method, have temporal scalability, and can be used to estimate the SOCD for any year. Changes in SOCD over time were explained by changes in the 17 driving factors between years. The prediction maps were generated using the “raster” package in R.

3. Results

3.1. Changes in the Wetland Area

We analyzed changes in the area of alpine wetlands in Zoige based on remote sensing data during the vegetation growing seasons from 1985, 2000, and 2020. Wetlands were primarily distributed in Hongyuan County, which accounted for 43.32% of the entire wetland area in 2020, followed by Maqu County and Zoige County, which accounted for 25.41% and 17.11%, respectively. Wetlands were least distributed in Aba County, accounting for only 2.79% of the total wetland area in 2020. The wetland area in the entire study area showed a gradual trend of degradation. From a temporal perspective, the wetland area decreased by 378.71 km2 and 224.04 km2 in 2020 and 2000, respectively, compared to 1985. The degradation was most severe from 1985 to 2000, with a total degradation area of 224.04 km2 and an average annual degradation rate of 0.34% (Table 1).
From a spatial perspective, Hongyuan County displayed the most severe degradation, with an average annual degradation rate of 1.13% from 1985 to 2000, and a total degradation area of 339.83 km2 in 2000 compared to 1985. Although the situation improved between 2000 and 2020, this area still showed degradation over 35 years. Zoige County, Luqu County, and Aba County showed an overall trend of wetland recovery (Figure 2).

3.2. Statistical Description of Variables

Table S3 presents the descriptive statistics of SOCD, climate, environment, anthropogenic, and some soil variables across the profiles. These descriptive statistics revealed that the mean, median, and standard deviation (SD) of SOCD were 33.8 kg/m2, 26.5 kg/m2, and 31.0 kg/m2, respectively. The coefficient of variation (CV) can eliminate the effects of measurement scales and units and compare the relative dispersion degree among several groups of data with different units. The CV values of the variables ranged from 3.8% to 144.8%. Based on the CV values, the NPP, Pre, sand, VPD, SW, silt, ND, clay, Tem, SOCD, and HF variables displayed moderate variation (10.2~41.4%), while DEM, CO2, and HI showed slight variation (3.8~6.7%). SR had the highest CV values, which accounted for 144.8%, indicating a strong spatial variability of SR in the alpine wetlands of Zoige.

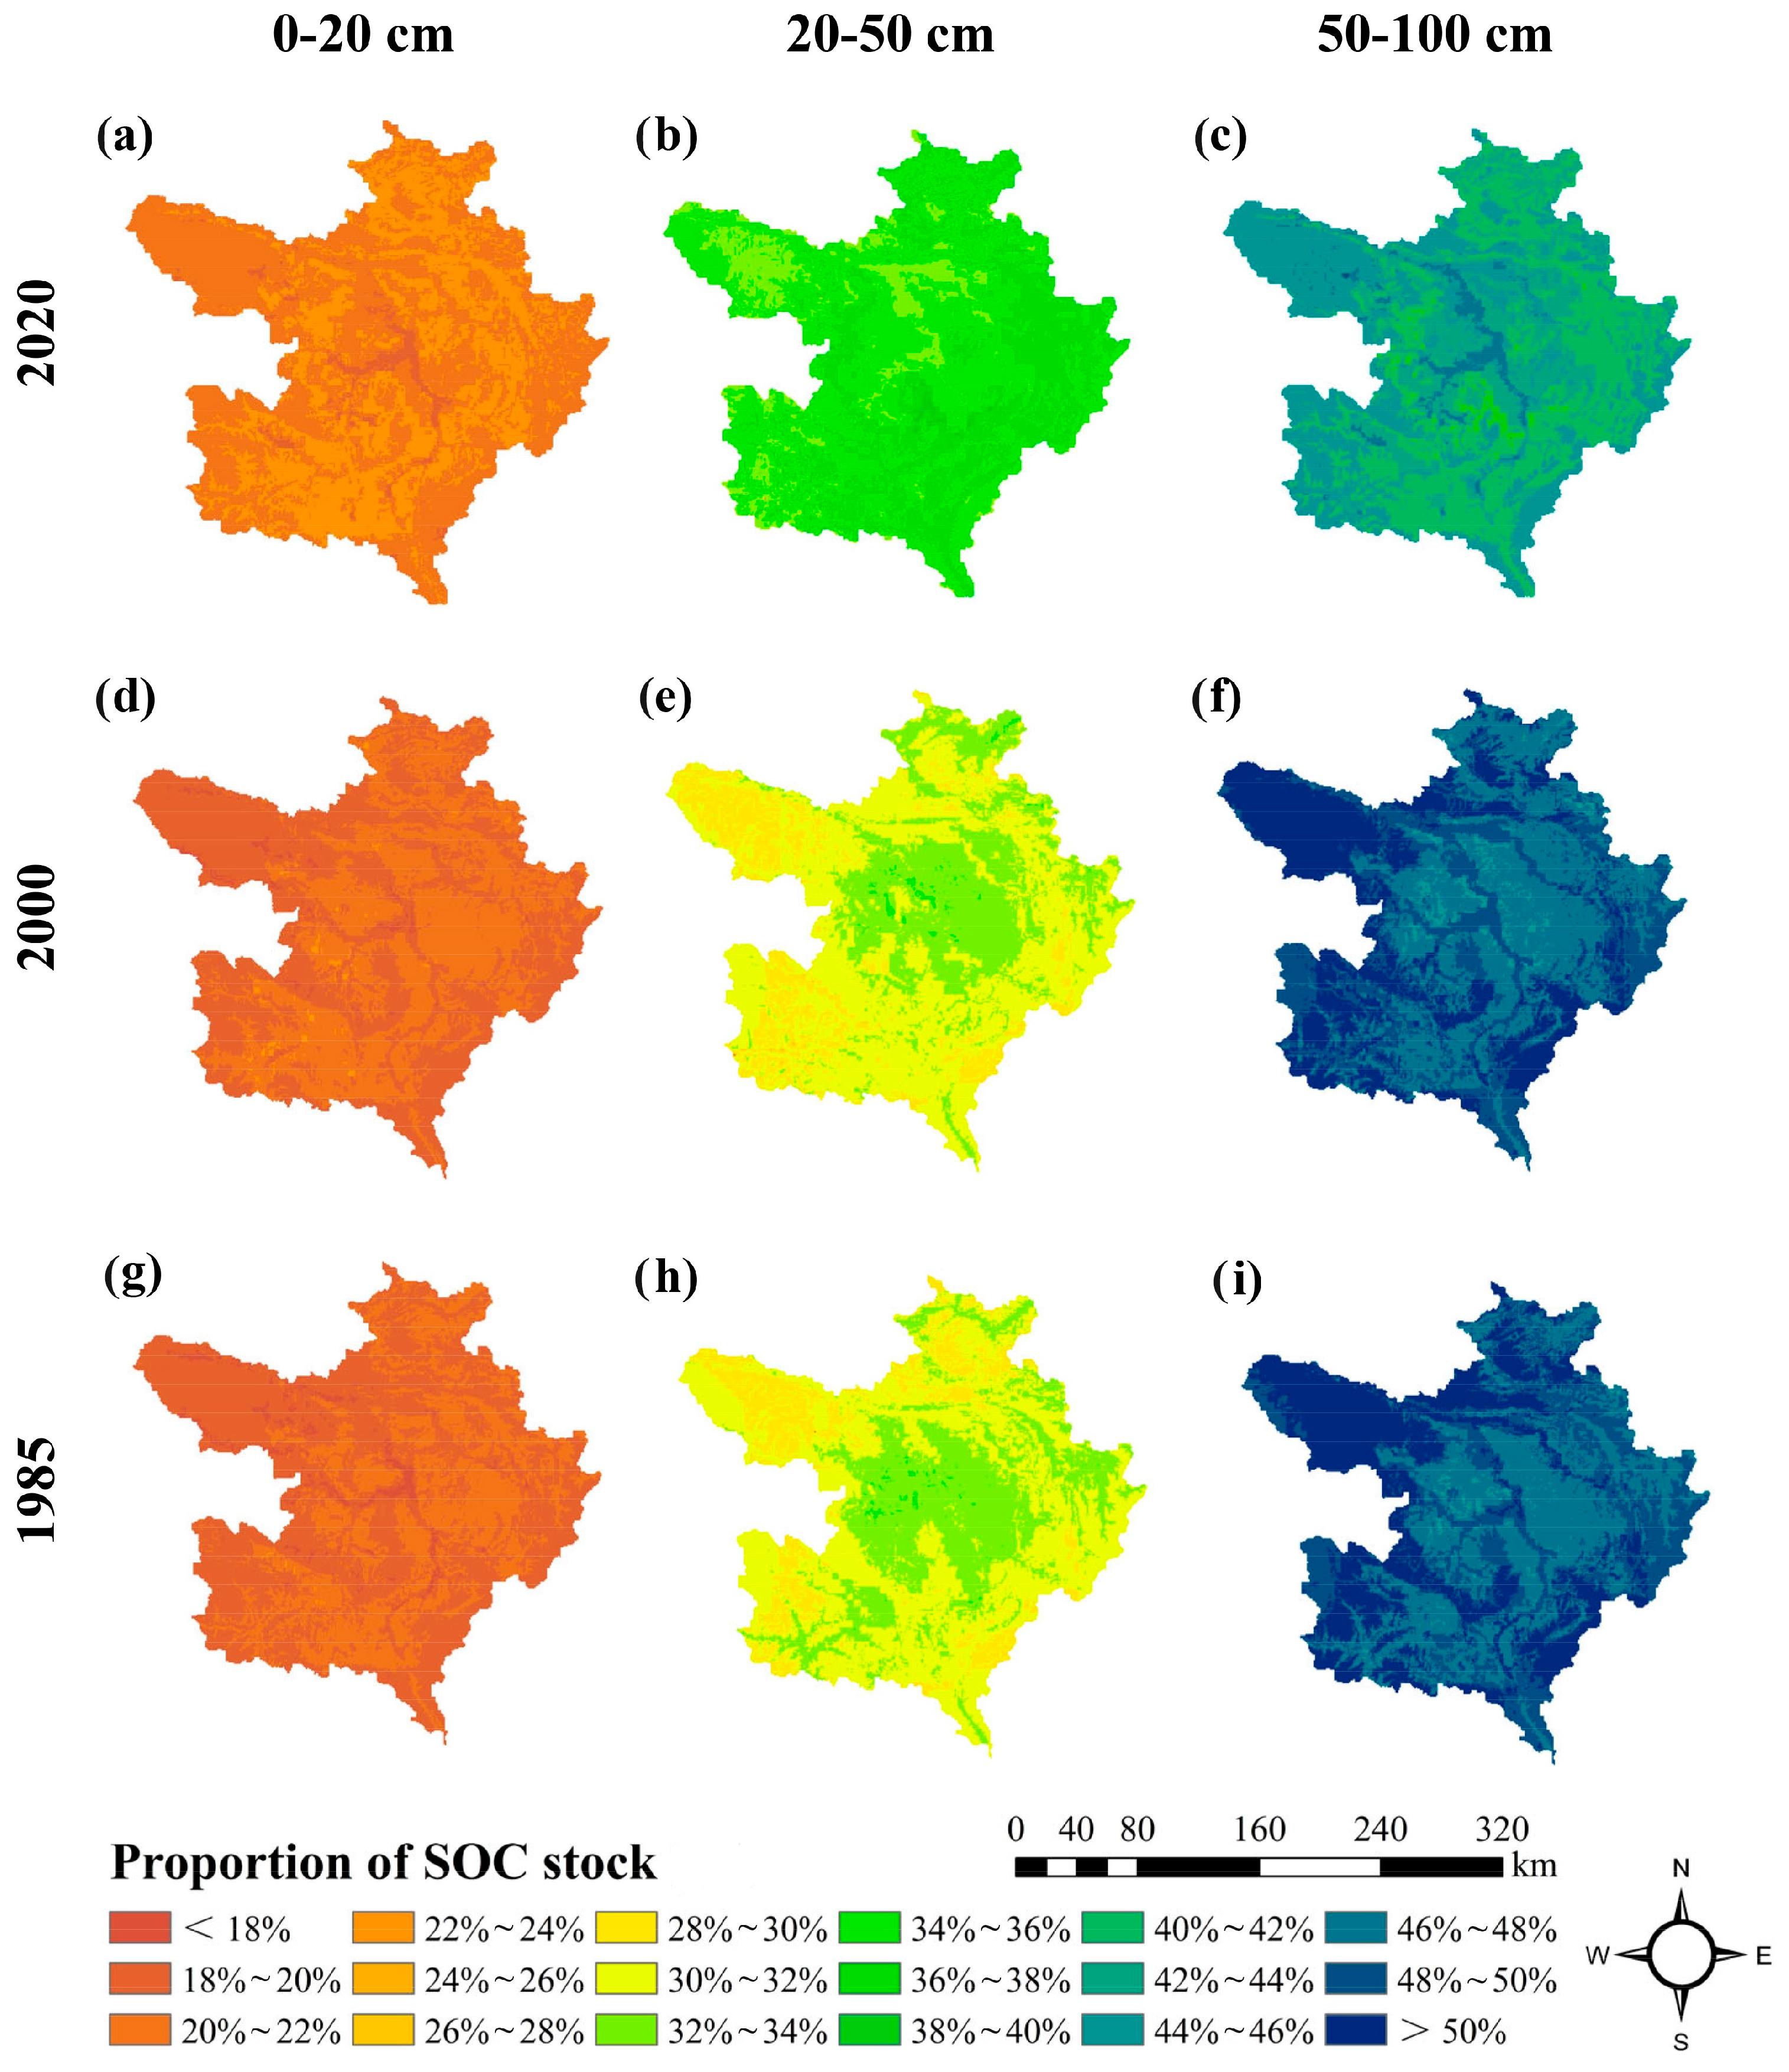
3.3. Spatiotemporal Characteristics of Soil Organic Carbon

We quantified the dynamics of soil organic carbon content and density at three standard soil depths (0–20 cm, 20–50 cm, and 50–100 cm) in the Zoige wetland in 1985, 2000, and 2020 using the random forest algorithm. The results showed that the SOC content decreased with increasing soil depth. Carbon sequestration in the Zoige wetland exhibited significant spatial variability, with the highest carbon storage areas mainly concentrated in the central swamp wetland, reaching a maximum of 66.22 kg/m2, located administratively at the junction of Zoige County and Maqu County (Figure 3). The main soil types were meadow soils, bog soils, and peat soils, and the main land use types were wetlands and high-coverage grasslands. The areas with low carbon storage were mainly distributed in Luqu County and Hongyuan County, with the main soil types being dark felty soils and felty soils, and the lowest value was 41.38 kg/m2.
In terms of temporal changes, we found that the SOC content in the Zoige wetland underwent large changes over the past 35 years, mainly occurring in the 0–50 cm soil layer from 2000 to 2020. The average SOC contents in the 0–20 cm, 20–50 cm, and 50–100 cm layers in the study area in 2020 were 47.19 ± 3.62 g/kg, 40.22 ± 3.26 g/kg, and 39.21 ± 3.47 g/kg, respectively (Table 2), which changed by +17.33%, +21.51%, and −4.59%, respectively, compared to 2000, and by +20.36%, +22.22%, and −3.96%, respectively, compared to 1985. The increase in the SOC content in the topsoil (0–20 cm) mainly occurred outside the central wetland swamp area, while the increase in the SOC content in the 20–50 cm layer was more evenly distributed throughout the wetland. At the same time, the organic carbon content of the subsoil (50–100 cm) decreased in the area surrounding the central wetland (Figure S4).
In the past 35 years, the subsoil of the Zoige wetland has shown a loss of organic carbon, but the significant carbon sequestration in the 0–50 cm soil layer has made the entire wetland a net carbon sink. In 2020, the carbon densities of the 0–20 cm, 20–50 cm, and 50–100 cm layers in the Zoige wetland were 10.69 ± 0.72 kg/m2, 17.49 ± 0.99 kg/m2, and 21.39 ± 2.00 kg/m2, respectively, changing by +17.35%, +21.66%, and −4.47%, respectively, compared to 2000, and +20.62%, +22.23%, and −3.78%, respectively, compared to 1985 (Table 2). Organic carbon has continuously accumulated in the 0–50 cm soil layer, with accumulation rates of 0.35 kg C m−2 yr−1 and 0.36 kg C m−2 yr−1 in the 0–20 cm and 20–50 cm SOC layers, respectively, over the past 20 years. However, the subsoil showed a loss of carbon. Spatially, over the 35-year period, topsoil organic carbon sequestration mainly occurred in the central part of the study area, with the maximum change rate of SOCD reaching 51.12%. The eastern parts of Zoige County and Hongyuan County were characterized by carbon losses, with a maximum change rate of −0.92%, while most other areas showed varying degrees of carbon accumulation (Figure 4). The increase in organic carbon in the 20–50 cm layer mainly occurred in the southern part of Zoige County, the northern part of Aba County, and the eastern part of Maqu County, with a maximum change rate of 47.05%. Different degrees of carbon emissions were observed in the marginal areas of the study area. Except for the strong carbon sink in the central part of the study area, the subsoil layer in other regions was characterized as a carbon source.
The total SOC storage in the Zoige wetland was 2.03 ± 0.11 Pg, 2.05 ± 0.14 Pg, and 2.21 ± 0.17 Pg in 1985, 2000, and 2020, respectively, mainly distributed in the western part of Zoige County and southeastern Maqu County (primarily meadow soils, bog soils, and peat soils) (Figure 3). From 1985 to 2000, the peripheral area of the study site was a carbon source (primarily dark felty soils, felty soils, and frigid frozen soils), and the central area showed a slight accumulation of SOC (primarily meadow soils). From 2000 to 2020, the soil in the study area was a carbon sink, where carbon sequestration was evident at the boundary of Zoige County and Maqu County (primarily meadow soils and bog soils), and the region with high SOC content expanded continuously from the central to the southern parts (Figure S5). The SOC density of the 13 soil types in the Zoige wetland in 2020 ranged from 47.70 to 54.24 kg/m2, ranked in the order of gray-cinnamon soils > cinnamon soils > peat soils > meadow soils > bog soils > brown earths > dark-brown earths > frigid frozen soils > chernozems > dark felty soils > felty soils > mountain meadow soils > skeletol soils (Table S3). Except for the skeletpl soils, which acted as a carbon source, all other soil types acted as a carbon sink, where the peat soils had the most significant carbon sequestration effect, followed by the gray-cinnamon soils and bog soils.
The organic carbon in the study area was distributed as follows: 20.32 ± 0.83% in the 0–20 cm layer, 32.74 ± 1.16% in the 20–50 cm layer, and 46.95 ± 1.71% in the 50–100 cm layer (Figure S6). Meadow soils, felty soils, and frigid frozen soils had a lower proportion of organic carbon in the topsoil, with most of it being distributed in the 50–100 cm soil layer, with allocation ratios of 44.69~49.67%, 44.60~50.56%, and 43.42~49.65%, respectively (Table S5). In contrast, organic carbon storage in bog soils, peat soils, dark felty soils, brown earths, skeletol soils, gray-cinnamon soils, cinnamon soils, and dark-brown earths was mainly distributed in the 0–50 cm layer. As climate and environmental factors change, the rate of organic carbon accumulation in the topsoil and subsoil varies, resulting in adjustments to the distribution ratios of SOC at different depths. The proportion of organic carbon accumulation in the 0–50 cm layer in 1 m deep soil has increased since 1985 (Figure 5), and the difference between the topsoil and subsoil SOCDs has gradually narrowed, from 13.70 kg/m2 in 1985 to 10.70 kg/m2 in 2020 (Table 2). The proportion of organic carbon storage in the subsoil decreased in all types of soils to varying degrees. Brown earths, dark-brown earths, cinnamon soils, chernozems, meadow soils, mountain meadow soils, felty soils, dark-brown earths, and frigid frozen soils had an increase in 0–50 cm SOC due to subsoil organic carbon loss. Although the SOC at 1 m depth increased in the gray-cinnamon soils, bog soils, and peat soils, more SOC accumulated in the 0–50 cm layer (Table S4).

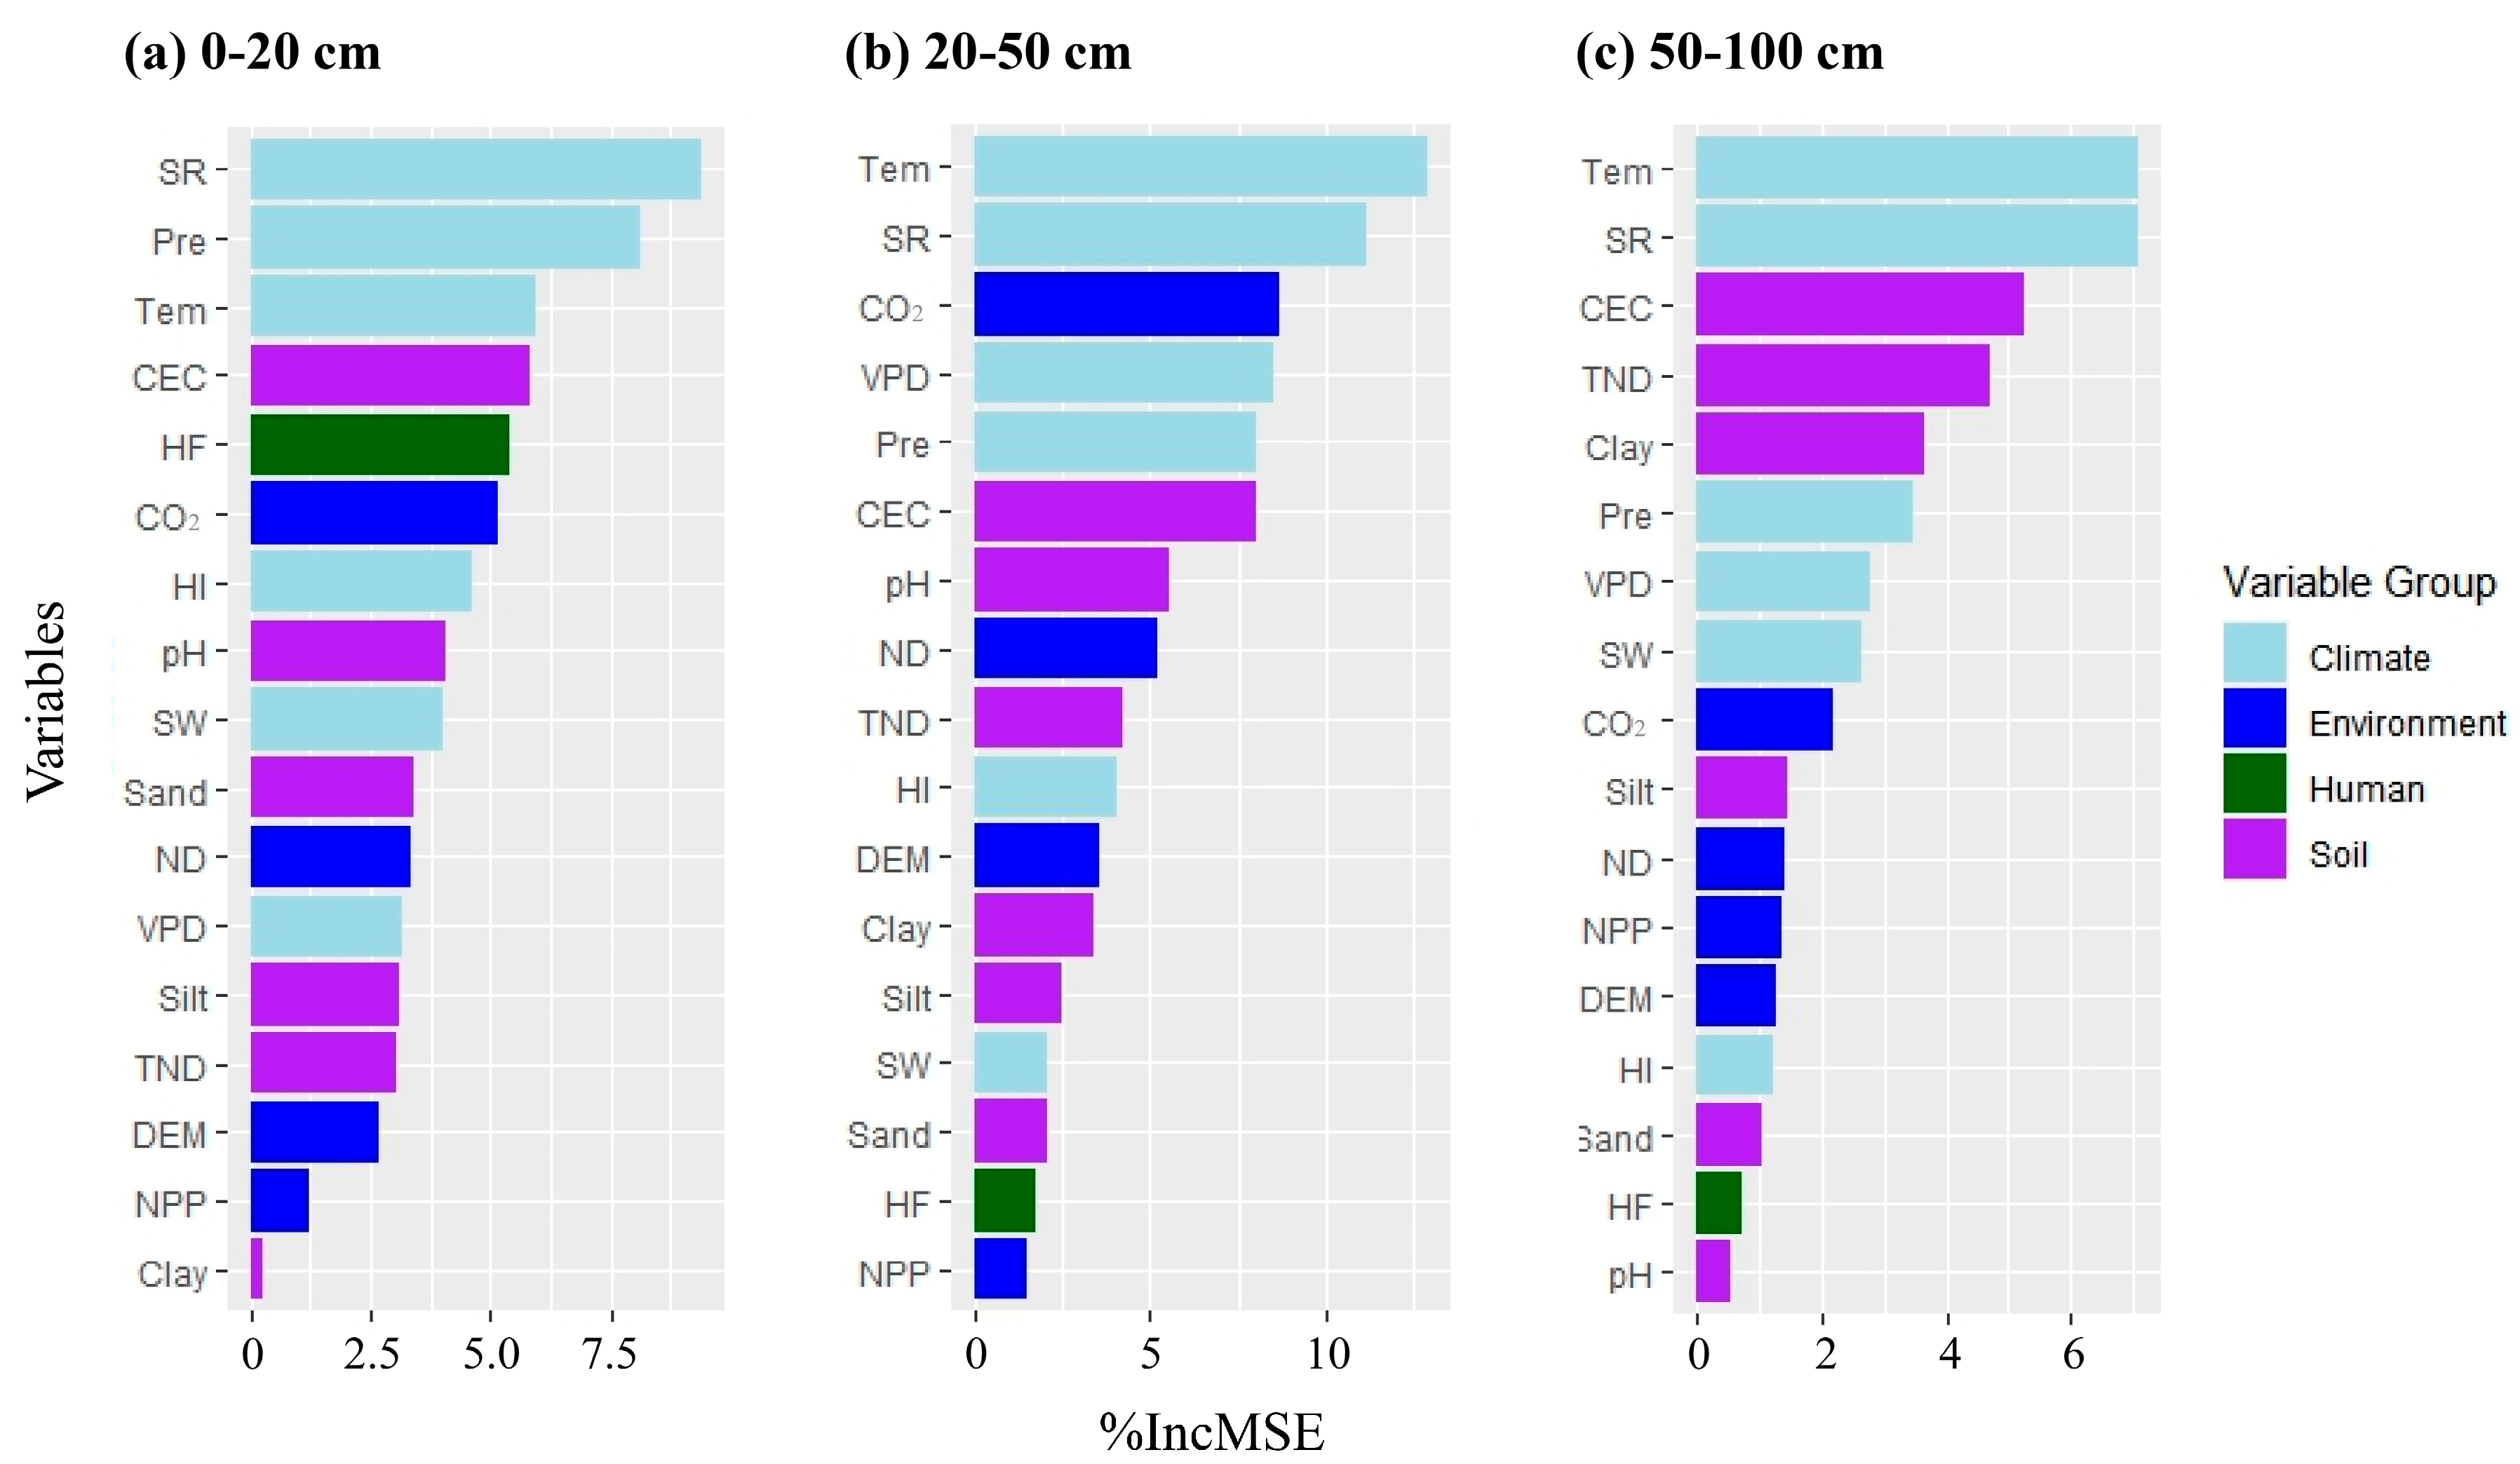
3.4. Relative Importance of Variables

Figure 6 shows the relative contributions of driving factors (i.e., climate change, soil properties, environmental characteristics, and human disturbance) to the three soil layers from 1985 to 2020. For the entire Zoige wetland, the average contributions of climate, soil, environment, and human driving factors to changes in organic carbon storage were 51.33%, 27.60%, 17.23%, and 3.85%, respectively, indicating that climate change was the most important driving factor category controlling organic carbon storage in the Zoige wetland over the past 35 years. However, the control over the subsoil (49.15%) was not as strong as that over the topsoil (55.00%), and the relative contribution of soil properties increased from 19.04% in the topsoil to 32.87% in the subsoil, indicating an enhanced effect of soil properties on organic carbon storage with depth. Meanwhile, the influences of environmental driving factors (from 14.97% to 20.75%) and human disturbance (from 3.01% to 5.21%) showed slight declines along the soil depth.
In addition, we further quantified the specific factors that affect organic carbon (Figure 7). The results showed that the main control variables for organic carbon in the topsoil were SR, Pre, Tem, CEC, and HF, Tem, SR, CO2, VPD, and Pre for 20–50 cm, and Tem, SR, CEC, TND, and clay for 50–100 cm. Temperature change was always the important factor controlling wetland organic carbon, followed by solar radiation. Precipitation had a greater impact on the topsoil, but its control over the organic carbon in the 20–100 cm layer was reduced. Human disturbance showed similar features. Among the environmental category variables, CO2 had the greatest impact on SOC storage, and the other variables were secondary factors regulating SOC density. Regarding soil conditions, silt, TND, and CEC showed increasingly important effects along the soil depth.
The correlation analysis results showed that the increase in precipitation in recent years significantly promoted the accumulation of soil organic carbon density (SOCD) in the Zoige wetland (Figure S7). To investigate the potential impacts of future climate change on SOCD in the Zoige wetland, we simulated the changes in SOCD under two scenarios: 1.5 °C/2 °C warming and +10%/+20% precipitation. The results showed that SOCD dynamics were negatively correlated with warming, while increased precipitation may have a positive effect on SOCD. Under the 2 °C temperature control target of the Paris Agreement, the SOC pool of the Zoige wetland would decrease by 69.19 Tg C, with meadow soils, bog soils, and peat soils at the boundary between Maqu County and Zoige County showing weak carbon sinks, while frigid frozen soils and felty soils acted as strong carbon sources (Figure 8). If the future warming is limited to 1.5 °C, the soil layers of 0–20 cm, 20–50 cm, and 50–100 cm would release 2.17 Tg, 5.34 Tg, and 1.47 Tg C less than that under 2 °C warming, respectively. Under a 10% increase in precipitation, the 0–20 cm, 20–50 cm, and 50–100 cm soil layers accumulated an additional 0.90 Tg, 2.78 Tg, and 42.86 Tg C, respectively. If precipitation was increased by 20%, the soil layers of 0–20 cm, 20–50 cm, and 50–100 cm would increase by 7.11 Tg, 28.84 Tg, and 82.94 Tg carbon sinks, respectively.

4. Discussion

4.1. Wetland Area Degradation and Management

In this study, we used remote sensing data to analyze the changes in the wetland area of the Zoige wetland from 1985 to 2020. We found that the wetland area in the study area showed a gradual degradation trend, with the most severe degradation occurring in Hongyuan County. The reduction in wetland area has important ecological and socioeconomic impacts. Wetlands provide important ecosystem services, including water conservation, biodiversity conservation, and carbon sequestration [45]. Wetlands are important habitats for various plant and animal species, and the reduction in wetland area can lead to the loss of ecosystem services and biodiversity [46]. In addition, the reduction in wetland area may also have adverse impacts on local socioeconomic development and human wellbeing, as wetlands are important for locals to obtain water, grazing land, and fuelwood resources [47]. The degradation of the Zoige alpine wetland has been mainly attributed to unsustainable human activities, with the greatest threat being excessive drainage and land use change [2,48]. The conversion of wetlands into croplands for agricultural production, or grasslands for grazing, to meet the growing demands of the population and economic development, has directly led to the destruction of wetland ecosystems [49]. In addition, the continuous expansion of peat mining in the Zoige wetland since the 1950s has directly caused the loss of wetland water, degradation of wetland vegetation, and imbalance of wetland ecosystems, resulting in the gradual reduction of the Zoige wetland area [2]. Protecting the Zoige wetland has become an important global task, requiring the rational use of water resources, especially the reduction in water consumption for agricultural production, and the control of excessive drainage. At the same time, it is necessary to prevent illegal and excessive peat mining, take reclamation measures, promote the restoration and regeneration of peatlands, strengthen wetland management, limit the human use of wetlands, and avoid the excessive development and destruction of wetland ecosystems.

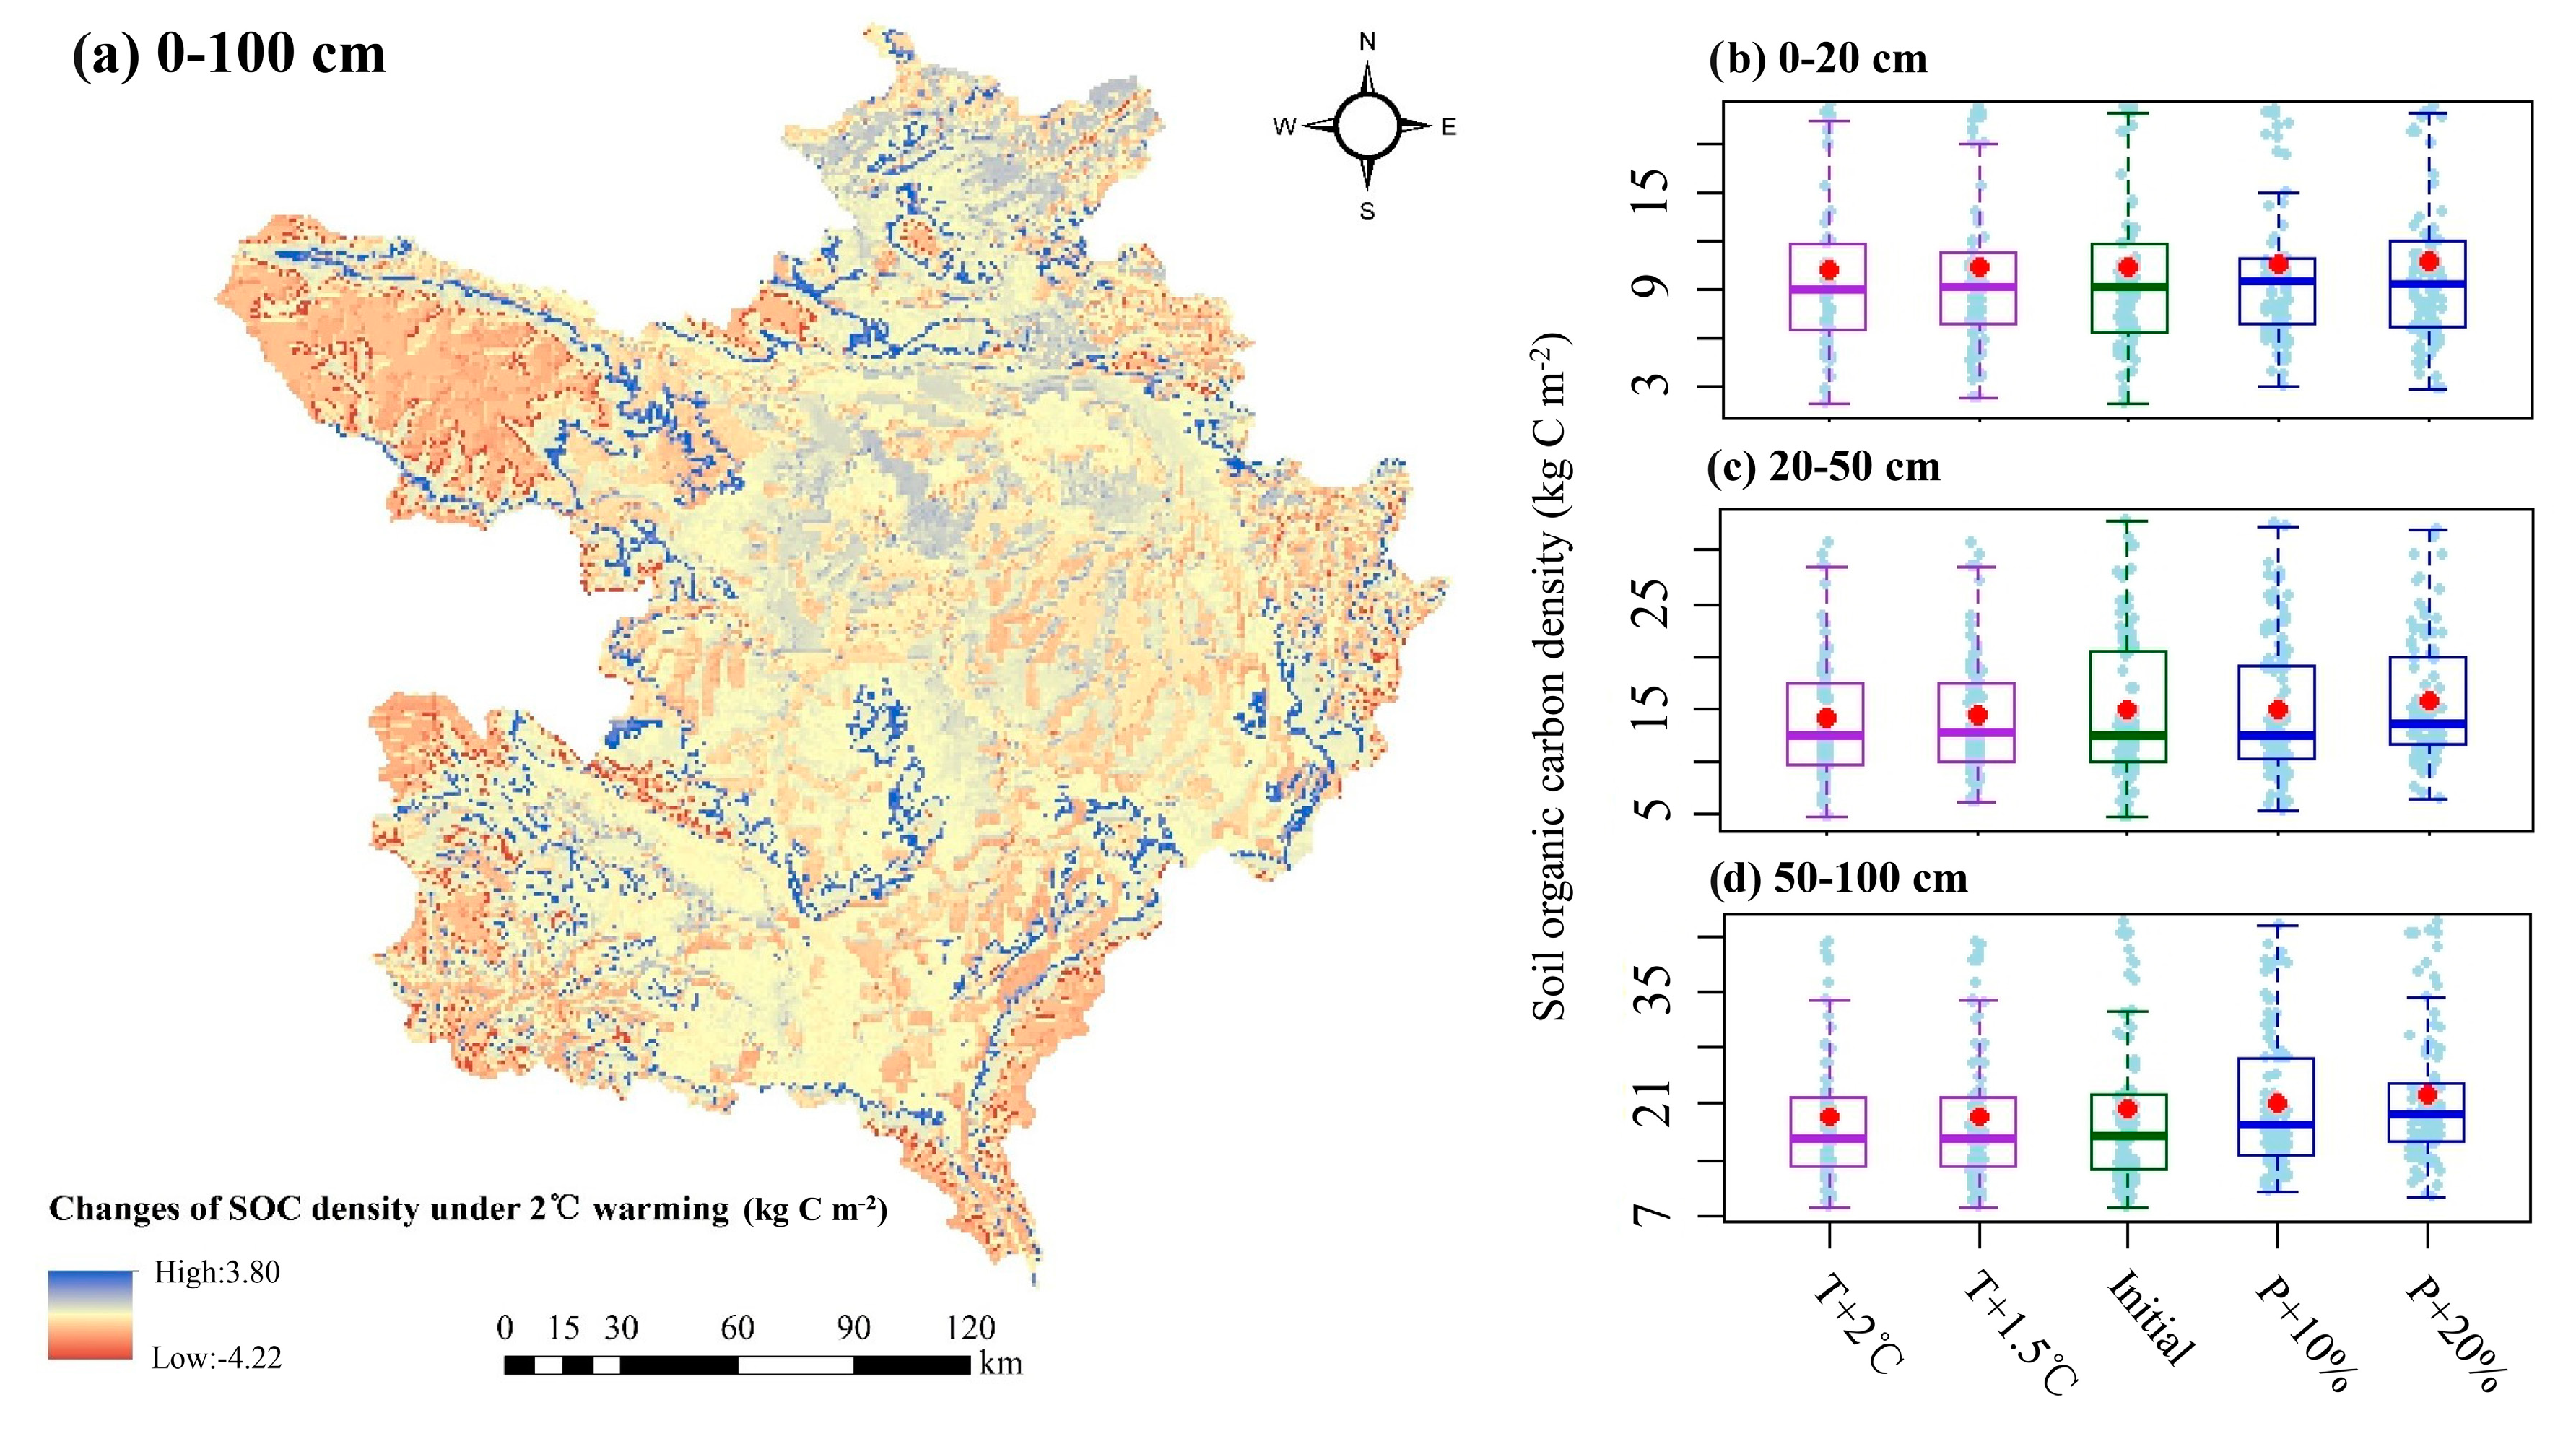
4.2. Implications for SOC Management in the Zoige Wetlands

We estimated the soil organic carbon density (SOCD) of the Zoige wetland by integrating multiple research data. Our study showed that the SOCD of the Zoige wetland was slightly higher than previous estimates and is within the acceptable range (Table S6). This difference may be attributed to the lack of sufficient sampling points in previous studies of the Zoige wetland [50]. The density of sampling points in the global or national datasets in this region is extremely low, and the estimation of organic carbon is affected by the sampling points in surrounding areas [51]. The SOCD in the surrounding areas is lower than that of the Zoige wetland [14], which may have resulted in the underestimation of organic carbon in previous studies. Our study analyzed the density of sampling points in the World Soil Information Service (WoSIS) global database, and found that the density of sampling points in China is relatively low compared to other regions, such as Europe, North America, and eastern Australia (Figure S8). In China, there are fewer sampling points in the western region, particularly for the Zoige wetland, indicating insufficient attention to this area (WoSIS, 2019). The lack of sampling points in the Zoige wetland may be due to its remote location, limited resources for soil sampling and analysis, and transportation inconvenience [50]. Considering that the Zoige wetland is an important high-altitude wetland ecosystem, we suggest that it should be given more attention, and more accurate estimations of carbon storage and carbon balance should be conducted to provide reliable scientific evidence for effective carbon reduction and management. Future research should focus on supplementing the WoSIS database’s sampling points in the Zoige wetland and other representative areas in China to improve the accuracy of global SOCD estimation, which is essential for formulating effective carbon management strategies to mitigate climate change [52]. Furthermore, we found that the SOCD of the Zoige high-altitude wetland was higher than that of the coastal wetland in China (Table S6), highlighting the importance of the Zoige wetland in carbon sequestration and accumulation. It should therefore be given more consideration in regional and global carbon budget assessments.
Due to its crucial role in soil fertility, global carbon cycling, and climate change mitigation [53], the distribution and dynamics of SOC in profiles have been extensively studied [18,22,23]. Our study found that the entire Zoige wetland acted as a carbon sink, with climate being the most important factor, even though the impact of the climate on SOC decreased with increasing soil depth (Figure 6). Previous studies have suggested that warming may result in soil CO2 emissions [54,55]. However, our research found that increased precipitation and solar radiation offset the adverse effects of warming (Figure S7 and Figure S9a), leading to soil acting as a carbon sink over the past 35 years. Our study also emphasized the importance of considering the role of deep soil in soil carbon sequestration practices, as solely focusing on topsoil carbon sequestration strategies may underestimate the soil’s carbon sequestration capacity. Traditionally, SOC research has focused on the topsoil, as most plant and animal residues accumulate there [22,23]. However, our study showed that the distribution of SOC is not confined to surface soil, as previously believed, but can accumulate in deeper soil layers over time [22]. As much as from 43.10% to 48.96% of SOC in the Zoige wetland is distributed in the 50–100 cm soil layer, becoming a long-term sink for atmospheric CO2, thus requiring an indiscriminate carbon management plan for the entire soil profile. Furthermore, over the past 35 years, the proportion of organic carbon stored in the subsoil has declined in the entire 1 m deep soil profile, with a significant increase in SOC distribution in the 0–20 cm and 20–50 cm soil layers, indicating carbon loss in the subsoil and carbon accumulation in the topsoil. The carbon loss observed in the lower soil layer was mainly attributed to a temperature rise, which accelerates the decomposition of SOC in the lower soil layer (Figure 7c and Figure S9b). However, it should be noted that the entire soil profile is still acting as a carbon sink, with carbon accumulation in the topsoil exceeding carbon loss in the subsoil. This finding highlights the potential risk of overlooking carbon loss in the subsoil and overestimating the soil profile’s carbon storage capacity. Therefore, future research and carbon management practices need to pay more attention to the dynamic changes in carbon in the subsoil.
In recent years, research on the decomposition of organic matter and its response and feedback to the climate has tended to divide soil organic carbon (SOC) into particulate organic carbon (POC) and mineral-associated organic carbon (MAOC) due to their significant differences in their physical and chemical properties, mean residence time in soils, and responses to land use changes, plant litter inputs, global warming, CO2 fertilization, and nitrogen deposition [56,57,58]. In the long term, the ability of soils to stabilize additional organic carbon is limited; that is, SOC storage has an upper limit, and in many soils, the capacity for organic carbon storage seems to be primarily related to soil organic matter with mineral surfaces [59,60]. Soil carbon, through its chemical and physical associations with minerals, restricts microbial access to decomposable substrates [57], and the turnover time of mineral-associated organic carbon may be a 1000 times longer than that of particulate organic carbon at the same depth [57]. A 5-year whole-soil warming experiment in California found that warming led to losses of subsoil carbon primarily from the decomposition of unprotected particulate organic matter [61]. In the Zoige wetland, different degrees of carbon loss were observed in the 50–100 cm soil layer, except for the bog soils, peat soils, and gray-cinnamon soils, and whether this carbon loss comes from the decomposition of particulate organic matter is unclear. Gray-cinnamon soils, peat soils, bog soils, and meadow soils have shown the most obvious carbon sequestration in the surface soils of the Zoige wetland over the past 35 years, but the proportion of mineral-associated organic carbon and the threshold range of future organic carbon sequestration in these soils are still unknown. Therefore, we suggest that future research in the Zoige wetland should focus on understanding the dynamics of MAOC and POC and the mechanisms by which they respond to environmental changes, which will help to deepen our understanding of carbon cycling in wetland ecosystems and develop effective management strategies to maintain their carbon sink function.
Over the past 35 years, the temperature and precipitation in the Zoige wetland have shown an increasing trend (Figure S9), and this trend is expected to continue in the future. Our results showed that changes in temperature and precipitation will lead to decreases and increases in the SOCD in the three standard soil layers, respectively. Under future climate change scenarios, the carbon sequestration capacity of the Zoige wetland will depend on the relative magnitudes of these two factors. In addition, if future climate warming is limited to 1.5 °C, it is expected that carbon emissions from the Zoige wetland will be 8.97 Tg C less than warming by 2 °C, highlighting the importance of controlling global warming. Frigid frozen soils and felty soils are considered to be the main sources of SOC release under warming conditions, indicating that they need to be given more attention in future studies. Our results provide valuable information for predicting the response of the Zoige wetland to future climate change.

4.3. Uncertainties and Limitations

Although we used diverse and representative datasets in this study, and the statistical evaluation of the model validation results is reasonable and acceptable, there are still some uncertainties and limitations in this study. One potential limitation is that the independent variables of the model have different spatial resolutions [16]. We used multiple gridded datasets to predict the distribution and dynamic changes in SOC, some of which were extracted from global datasets. However, when extracting these variable values to points, the values between adjacent sampling points may be identical, which may underestimate the importance of variables. In addition, although the sampling point data used to build the random forest model were representative and dispersed, covering the main soil types in the Zoige wetland, we can still increase the number of sampling points to further enhance the statistical significance [15]. Third, there was a large difference in the depth of soil in the Zoige wetland, ranging from 3 cm to 147 cm (Figure S10a). Most of the soil layers in the area are deeper than 1 m (Figure S10b), and even when the sampling depth reaches 100 cm, it may not truly represent the carbon storage potential of the Zoige wetland. Since some profile sampling depths were less than 1 m, we used other existing profile data with depths exceeding 1 m to predict the organic carbon content at a 1 m depth at these locations. Although this method has been validated, it may still overestimate or underestimate the carbon reserves of the Zoige wetland. Therefore, it is necessary to establish a high-resolution independent variable dataset based on surface-measured or observed data and increase the density of Zoige wetland full-profile sampling points for further research in the future on the basis of this study

5. Conclusions

This study evaluated the changes in wetland area, SOC dynamics, and driving factors in the Zoige alpine wetland from 1985 to 2020 by establishing a random forest model. The results showed that the Zoige wetland has severely degraded in the past 35 years, with reductions of 378.71 km2 and 224.04 km2 in wetland area in the years 2020 and 2000, respectively, compared with 1985. The SOC content in the Zoige wetland decreased with increasing soil depth, while its SOCD showed the opposite trend. The increase in precipitation and solar radiation offset the adverse effects of warming temperatures, resulting in organic carbon losses in the subsoil, but the soil acted as a carbon sink due to the significant carbon sequestration in the 0–50 cm soil layer over the past 35 years. The gray-cinnamon soils, cinnamon soils, and peat soils had the highest carbon density, while the gray-cinnamon soils, bog soils, and peat soils had the most significant carbon sequestration. The total soil organic carbon storage in the Zoige alpine wetland was 2.03 Pg, 2.05 Pg, and 2.21 Pg in 1985, 2000, and 2020, respectively. The 0–20 cm layer, 20–50 cm layer, and 50–100 cm layer accounted for 20.32%, 32.74%, and 46.95%, respectively. As time passed, the proportion of organic carbon in the topsoil increased. Climate change was the most crucial category of the driving factors that controlled the organic carbon storage in the entire Zoige wetland in the past 35 years, explaining 51.33% of SOC variability. The primary control variables for the topsoil’s SOC were SR, Pre, and Tem; those for 20–50 cm SOC were Tem, SR, and CO2, and those for 50–100 cm SOC were Tem, SR, and CEC. Under the 1.5 °C and 2 °C temperature control targets, the SOC stock in the Zoige wetland would decrease by 60.21 Tg C and 69.19 Tg C, respectively. Under the scenarios of a 10% and 20% increase in rainfall, the SOC stock in the Zoige wetland would accumulate an additional 46.53 Tg C and 118.89 Tg C, respectively. The future carbon sequestration capacity of the Zoige wetland will depend on the relative impact of these two factors. The information obtained in this study is essential for understanding the changes in SOC and the driving mechanisms in the Zoige wetland and will contribute to global efforts to mitigate climate change.

Supplementary Materials

The following supporting information can be downloaded at: https://www.mdpi.com/article/10.3390/land12101923/s1. Figure S1. Relationships between SOC content in 0–20 cm layer and 20–50 cm layer; Figure S2. Relationships between SOC content in 20–50 cm layer and 50–100 cm layer; Figure S3. Comparison between estimated and observed SOC at the training and testing phases in the three soil layers; Figure S4. Spatial distribution of SOC content in each soil layer of Zoige wetland during 1985–2020; Figure S5. Spatial distribution of SOC density changes across the Zoige wetland area during 1985–2020; Figure S6. Distribution of soil organic carbon stocks in different soil layers in Zoige wetland during 1985–2020; Figure S7. Pearson correlations between control variables and SOC density in Zoige wetland; Figure S8. Point density analysis of WOSIS global sampling points and the distribution of WOSIS sampling points in China; Figure S9. Annual precipitation and average annual temperature of the Zoige wetland from 1985 to 2020; Figure S10. Soil layer thickness and difference with 1m deep soil in Zoige wetland; Table S1. Comparison of GSCC soil types appearing in the manuscript with ST classifications; Table S2. Variables used in the modelling of changes in soil carbon; Table S3. Descriptive statistics of SOCD and other Variables in our dataset; Table S4. Soil organic carbon density of different soil types in Zoige wetland; Table S5. Soil organic carbon density in each layer of different soil types in Zoige wetlands; Table S6. Proportion of soil organic carbon allocated to different soil types during 1985 to 2020; Table S7. Synthesis of soil organic carbon density in the three soil layers in Zoige wetland from this study and previous investigations.

Author Contributions

Methodology, H.Z.; Software, H.Z., J.W. and C.Z.; Validation, H.Q. (Hongyu Qian) and C.Z.; Formal analysis, Y.Z.; Investigation, X.F.; Resources, H.Z., W.C. and S.D.; Data curation, Y.Z. and Z.X.; Writing—original draft, H.Z., J.W. and Y.H. (Yongjie Huang); Writing—review and editing, H.Z., H.Q. (Haoran Qi) and H.Q. (Hongyu Qian); Supervision, Y.H. (Yongjie Huang); Project administration, Y.H. (Yufu Hu); Funding acquisition, Y.H (Yufu Hu). All authors have read and agreed to the published version of the manuscript.

Funding

This research was supported by the National Natural Science Foundation of China (No. 42077046), the Sichuan Science and Technology Project (No. 2022YFS0469), and the National College Student Innovation and Entrepreneurship Training Program (No. 202210626029).

Data Availability Statement

The authors do not have permission to share data.

Conflicts of Interest

The authors declare no conflict of interest.

References

  1. Salimi, S.; Almuktar, S.A.; Scholz, M. Impact of Climate Change on Wetland Ecosystems: A Critical Review of Experimental Wetlands. J. Environ. Manag. 2021, 286, 112160. [Google Scholar] [CrossRef]
  2. Shen, G.; Yang, X.; Jin, Y.; Xu, B.; Zhou, Q. Remote Sensing and Evaluation of the Wetland Ecological Degradation Process of the Zoige Plateau Wetland in China. Ecol. Indic. 2019, 104, 48–58. [Google Scholar] [CrossRef]
  3. Janse, J.H.; Van Dam, A.A.; Hes, E.M.A.; De Klein, J.J.M.; Finlayson, C.M.; Janssen, A.B.G.; Van Wijk, D.; Mooij, W.M.; Verhoeven, J.T.A. Towards a Global Model for Wetlands Ecosystem Services. Curr. Opin. Environ. Sustain. 2019, 36, 11–19. [Google Scholar] [CrossRef]
  4. Bao, T.; Jia, G.; Xu, X. Weakening Greenhouse Gas Sink of Pristine Wetlands under Warming. Nat. Clim. Chang. 2023, 13, 462–469. [Google Scholar] [CrossRef]
  5. Kang, X.; Li, Y.; Wang, J.; Yan, L.; Zhang, X.; Wu, H.; Yan, Z.; Zhang, K.; Hao, Y. Precipitation and Temperature Regulate the Carbon Allocation Process in Alpine Wetlands: Quantitative Simulation. J. Soils Sediments 2020, 20, 3300–3315. [Google Scholar] [CrossRef]
  6. Gao, J.; Ouyang, H.; Lei, G.; Xu, X.; Zhang, M. Effects of Temperature, Soil Moisture, Soil Type and Their Interactions on Soil Carbon Mineralization in Zoigê Alpine Wetland, Qinghai-Tibet Plateau. Chin. Geogr. Sci. 2011, 21, 27–35. [Google Scholar] [CrossRef]
  7. Zou, J.; Ziegler, A.D.; Chen, D.; McNicol, G.; Ciais, P.; Jiang, X.; Zheng, C.; Wu, J.; Wu, J.; Lin, Z.; et al. Rewetting Global Wetlands Effectively Reduces Major Greenhouse Gas Emissions. Nat. Geosci. 2022, 15, 627–632. [Google Scholar] [CrossRef]
  8. Fluet-Chouinard, E.; Stocker, B.D.; Zhang, Z.; Malhotra, A.; Melton, J.R.; Poulter, B.; Kaplan, J.O.; Goldewijk, K.K.; Siebert, S.; Minayeva, T.; et al. Extensive Global Wetland Loss over the Past Three Centuries. Nature 2023, 614, 281–286. [Google Scholar] [CrossRef] [PubMed]
  9. Finlayson, C.M.; Capon, S.J.; Rissik, D.; Pittock, J.; Fisk, G.; Davidson, N.C.; Bodmin, K.A.; Papas, P.; Robertson, H.A.; Schallenberg, M.; et al. Policy Considerations for Managing Wetlands under a Changing Climate. Mar. Freshw. Res. 2017, 68, 1803–1815. [Google Scholar] [CrossRef]
  10. Lu, M.; Zou, Y.; Xun, Q.; Yu, Z.; Jiang, M.; Sheng, L.; Lu, X.; Wang, D. Anthropogenic Disturbances Caused Declines in the Wetland Area and Carbon Pool in China during the Last Four Decades. Glob. Change Biol. 2021, 27, 3837–3845. [Google Scholar] [CrossRef]
  11. Zheng, Y.; Niu, Z.; Gong, P.; Dai, Y.; Shangguan, W. Preliminary Estimation of the Organic Carbon Pool in China’s Wetlands. Chin. Sci. Bull. 2013, 58, 662–670. [Google Scholar] [CrossRef]
  12. Poulter, B.; Fluet-Chouinard, E.; Hugelius, G.; Koven, C.; Fatoyinbo, L.; Page, S.E.; Rosentreter, J.A.; Smart, L.S.; Taillie, P.J.; Thomas, N.; et al. A Review of Global Wetland Carbon Stocks and Management Challenges. In Wetland Carbon and Environmental Management; American Geophysical Union (AGU): Washington, DC, USA, 2021; pp. 1–20. ISBN 978-1-119-63930-5. [Google Scholar]
  13. Yang, G.; Peng, C.; Chen, H.; Dong, F.; Wu, N.; Yang, Y.; Zhang, Y.; Zhu, D.; He, Y.; Shi, S.; et al. Qinghai–Tibetan Plateau Peatland Sustainable Utilization under Anthropogenic Disturbances and Climate Change. Ecosyst. Health Sustain. 2017, 3, e01263. [Google Scholar] [CrossRef]
  14. Xu, L.; Yu, G.; He, N.; Wang, Q.; Gao, Y.; Wen, D.; Li, S.; Niu, S.; Ge, J. Carbon Storage in China’s Terrestrial Ecosystems: A Synthesis. Sci. Rep. 2018, 8, 2806. [Google Scholar] [CrossRef]
  15. Xia, S.; Song, Z.; Van Zwieten, L.; Guo, L.; Yu, C.; Wang, W.; Li, Q.; Hartley, I.P.; Yang, Y.; Liu, H.; et al. Storage, Patterns and Influencing Factors for Soil Organic Carbon in Coastal Wetlands of China. Glob. Change Biol. 2022, 28, 6065–6085. [Google Scholar] [CrossRef] [PubMed]
  16. Li, H.; Wu, Y.; Liu, S.; Xiao, J.; Zhao, W.; Chen, J.; Alexandrov, G.; Cao, Y. Decipher Soil Organic Carbon Dynamics and Driving Forces across China Using Machine Learning. Glob. Change Biol. 2022, 28, 3394–3410. [Google Scholar] [CrossRef] [PubMed]
  17. Luo, Z.; Viscarra-Rossel, R.A.; Qian, T. Similar Importance of Edaphic and Climatic Factors for Controlling Soil Organic Carbon Stocks of the World. Biogeosciences 2021, 18, 2063–2073. [Google Scholar] [CrossRef]
  18. Luo, Z.; Feng, W.; Luo, Y.; Baldock, J.; Wang, E. Soil Organic Carbon Dynamics Jointly Controlled by Climate, Carbon Inputs, Soil Properties and Soil Carbon Fractions. Glob. Change Biol. 2017, 23, 4430–4439. [Google Scholar] [CrossRef]
  19. Devaraju, N.; Bala, G.; Caldeira, K.; Nemani, R. A Model Based Investigation of the Relative Importance of CO2-Fertilization, Climate Warming, Nitrogen Deposition and Land Use Change on the Global Terrestrial Carbon Uptake in the Historical Period. Clim. Dyn. 2016, 47, 173–190. [Google Scholar] [CrossRef]
  20. Han, L.; Wan, Z.; Guo, Y.; Song, C.; Jin, S.; Zuo, Y. Estimation of Soil Organic Carbon Storage in Palustrine Wetlands, China. Int. J. Environ. Res. Public Health 2020, 17, 4646. [Google Scholar] [CrossRef]
  21. Moomaw, W.R.; Chmura, G.L.; Davies, G.T.; Finlayson, C.M.; Middleton, B.A.; Natali, S.M.; Perry, J.E.; Roulet, N.; Sutton-Grier, A.E. Wetlands in a Changing Climate: Science, Policy and Management. Wetlands 2018, 38, 183–205. [Google Scholar] [CrossRef]
  22. Luo, Z.; Wang, G.; Wang, E. Global Subsoil Organic Carbon Turnover Times Dominantly Controlled by Soil Properties Rather than Climate. Nat. Commun. 2019, 10, 3688. [Google Scholar] [CrossRef]
  23. Wang, M.; Guo, X.; Zhang, S.; Xiao, L.; Mishra, U.; Yang, Y.; Zhu, B.; Wang, G.; Mao, X.; Qian, T.; et al. Global Soil Profiles Indicate Depth-Dependent Soil Carbon Losses under a Warmer Climate. Nat. Commun. 2022, 13, 5514. [Google Scholar] [CrossRef]
  24. Ma, K.; Zhang, Y.; Tang, S.; Liu, J. Spatial Distribution of Soil Organic Carbon in the Zoige Alpine Wetland, Northeastern Qinghai–Tibet Plateau. CATENA 2016, 144, 102–108. [Google Scholar] [CrossRef]
  25. Yang, A.; Kang, X.; Li, Y.; Zhang, X.; Zhang, K.; Kang, E.; Yan, Z.; Li, M.; Wang, X.; Niu, Y.; et al. Alpine Wetland Degradation Reduces Carbon Sequestration in the Zoige Plateau, China. Front. Ecol. Evol. 2022, 10, 980441. [Google Scholar] [CrossRef]
  26. Ma, K.; Liu, J.; Balkovič, J.; Skalský, R.; Azevedo, L.B.; Kraxner, F. Changes in Soil Organic Carbon Stocks of Wetlands on China’s Zoige Plateau from 1980 to 2010. Ecol. Model. 2016, 327, 18–28. [Google Scholar] [CrossRef]
  27. Wang, R.; He, M.; Niu, Z. Responses of Alpine Wetlands to Climate Changes on the Qinghai-Tibetan Plateau Based on Remote Sensing. Chin. Geogr. Sci. 2020, 30, 189–201. [Google Scholar] [CrossRef]
  28. Cui, M.; Ma, A.; Qi, H.; Zhuang, X.; Zhuang, G.; Zhao, G. Warmer Temperature Accelerates Methane Emissions from the Zoige Wetland on the Tibetan Plateau without Changing Methanogenic Community Composition. Sci. Rep. 2015, 5, 11616. [Google Scholar] [CrossRef]
  29. Jiang, W.; Lv, J.; Wang, C.; Chen, Z.; Liu, Y. Marsh Wetland Degradation Risk Assessment and Change Analysis: A Case Study in the Zoige Plateau, China. Ecol. Indic. 2017, 82, 316–326. [Google Scholar] [CrossRef]
  30. Huo, L.; Chen, Z.; Zou, Y.; Lu, X.; Guo, J.; Tang, X. Effect of Zoige Alpine Wetland Degradation on the Density and Fractions of Soil Organic Carbon. Ecol. Eng. 2013, 51, 287–295. [Google Scholar] [CrossRef]
  31. Xue, J.; Zhang, H.; He, N.; Gan, Y.; Wen, X.; Li, J.; Zhang, X.; Fu, P. Responses of SOM Decomposition to Changing Temperature in Zoige Alpine Wetland, China. Wetl. Ecol. Manag. 2015, 23, 977–987. [Google Scholar] [CrossRef]
  32. Yan, W.; Wang, Y.; Chaudhary, P.; Ju, P.; Zhu, Q.; Kang, X.; Chen, H.; He, Y. Effects of Climate Change and Human Activities on Net Primary Production of Wetlands on the Zoige Plateau from 1990 to 2015. Glob. Ecol. Conserv. 2022, 35, e02052. [Google Scholar] [CrossRef]
  33. Qu, R.; He, L.; He, Z.; Wang, B.; Lyu, P.; Wang, J.; Kang, G.; Bai, W. A Study of Carbon Stock Changes in the Alpine Grassland Ecosystem of Zoigê, China, 2000–2020. Land 2022, 11, 1232. [Google Scholar] [CrossRef]
  34. Zhu, Z.; Woodcock, C.E. Object-Based Cloud and Cloud Shadow Detection in Landsat Imagery. Remote Sens. Environ. 2012, 118, 83–94. [Google Scholar] [CrossRef]
  35. Yang, Y.; Wang, Y.; Miao, X.; Li, H. Soil Moisture Retrieval with Backscatter Modeling and Satellite Datasets in Zoige Wetland, China. In Proceedings of the IGARSS 2018–2018 IEEE International Geoscience and Remote Sensing Symposium, Valencia, Spain, 22–27 July 2018; pp. 9090–9093. [Google Scholar]
  36. Zhao, F.; Feng, S.; Xie, F.; Zhu, S.; Zhang, S. Extraction of Long Time Series Wetland Information Based on Google Earth Engine and Random Forest Algorithm for a Plateau Lake Basin—A Case Study of Dianchi Lake, Yunnan Province, China. Ecol. Indic. 2023, 146, 109813. [Google Scholar] [CrossRef]
  37. Peng, S.; Ding, Y.; Li, Z. High-Spatial-Resolution Monthly Temperature and Precipitation Dataset for China for 1901–2017. Earth Syst. Sci. Data Discuss. 2019, 2019, 1–23. [Google Scholar] [CrossRef]
  38. Mu, H.; Li, X.; Wen, Y.; Huang, J.; Du, P.; Su, W.; Miao, S.; Geng, M. A Global Record of Annual Terrestrial Human Footprint Dataset from 2000 to 2018. Sci. Data 2022, 9, 176. [Google Scholar] [CrossRef]
  39. Zhang, Z.; Ding, J.; Zhu, C.; Wang, J.; Ge, X.; Li, X.; Han, L.; Chen, X.; Wang, J. Historical and Future Variation of Soil Organic Carbon in China. Geoderma 2023, 436, 116557. [Google Scholar] [CrossRef]
  40. Kim, J.; Grunwald, S. Assessment of Carbon Stocks in the Topsoil Using Random Forest and Remote Sensing Images. J. Environ. Qual. 2016, 45, 1910–1918. [Google Scholar] [CrossRef]
  41. Dai, L.; Ge, J.; Wang, L.; Zhang, Q.; Liang, T.; Bolan, N.; Lischeid, G.; Rinklebe, J. Influence of Soil Properties, Topography, and Land Cover on Soil Organic Carbon and Total Nitrogen Concentration: A Case Study in Qinghai-Tibet Plateau Based on Random Forest Regression and Structural Equation Modeling. Sci. Total Environ. 2022, 821, 153440. [Google Scholar] [CrossRef]
  42. Yang, R.; Zhang, G.; Liu, F.; Lu, Y.-Y.; Yang, F.; Yang, F.; Yang, M.; Zhao, Y.-G.; Li, D.-C. Comparison of Boosted Regression Tree and Random Forest Models for Mapping Topsoil Organic Carbon Concentration in an Alpine Ecosystem. Ecol. Indic. 2016, 60, 870–878. [Google Scholar] [CrossRef]
  43. Zhang, H.; Wu, P.; Yin, A.; Yang, X.; Zhang, M.; Gao, C. Prediction of Soil Organic Carbon in an Intensively Managed Reclamation Zone of Eastern China: A Comparison of Multiple Linear Regressions and the Random Forest Model. Sci. Total Environ. 2017, 592, 704–713. [Google Scholar] [CrossRef] [PubMed]
  44. Cutler, A.; Cutler, D.R.; Stevens, J.R. Random Forests. In Ensemble Machine Learning: Methods and Applications; Zhang, C., Ma, Y., Eds.; Springer: New York, NY, USA, 2012; pp. 157–175. ISBN 978-1-4419-9326-7. [Google Scholar]
  45. Xia, H.; Liu, L.; Bai, J.; Kong, W.; Lin, K.; Guo, F. Wetland Ecosystem Service Dynamics in the Yellow River Estuary under Natural and Anthropogenic Stress in the Past 35 Years. Wetlands 2020, 40, 2741–2754. [Google Scholar] [CrossRef]
  46. Kingsford, R.T.; Basset, A.; Jackson, L. Wetlands: Conservation’s Poor Cousins. Aquat. Conserv. Mar. Freshw. Ecosyst. 2016, 26, 892–916. [Google Scholar] [CrossRef]
  47. Merriman, J.C.; Gurung, H.; Adhikari, S.; Butchart, S.H.M.; Khatri, T.B.; Pandit, R.S.; Ram, A.K.; Thomas, D.H.L.; Thapa, I. Rapid Ecosystem Service Assessment of the Impact of Koshi Tappu Wildlife Reserve on Wetland Benefits to Local Communities. Wetl. Ecol. Manag. 2018, 26, 491–507. [Google Scholar] [CrossRef]
  48. McKenna, O.P.; Kucia, S.R.; Mushet, D.M.; Anteau, M.J.; Wiltermuth, M.T. Synergistic Interaction of Climate and Land-Use Drivers Alter the Function of North American, Prairie-Pothole Wetlands. Sustainability 2019, 11, 6581. [Google Scholar] [CrossRef]
  49. Junk, W.J.; An, S.; Finlayson, C.M.; Gopal, B.; Květ, J.; Mitchell, S.A.; Mitsch, W.J.; Robarts, R.D. Current State of Knowledge Regarding the World’s Wetlands and Their Future under Global Climate Change: A Synthesis. Aquat. Sci. 2013, 75, 151–167. [Google Scholar] [CrossRef]
  50. Luan, J.; Cui, L.; Xiang, C.; Wu, J.; Song, H.; Ma, Q. Soil Carbon Stocks and Quality across Intact and Degraded Alpine Wetlands in Zoige, East Qinghai-Tibet Plateau. Wetl. Ecol. Manag. 2014, 22, 427–438. [Google Scholar] [CrossRef]
  51. Emadi, M.; Taghizadeh-Mehrjardi, R.; Cherati, A.; Danesh, M.; Mosavi, A.; Scholten, T. Predicting and Mapping of Soil Organic Carbon Using Machine Learning Algorithms in Northern Iran. Remote Sens. 2020, 12, 2234. [Google Scholar] [CrossRef]
  52. Scharlemann, J.P.; Tanner, E.V.; Hiederer, R.; Kapos, V. Global Soil Carbon: Understanding and Managing the Largest Terrestrial Carbon Pool. Carbon Manag. 2014, 5, 81–91. [Google Scholar] [CrossRef]
  53. Zhang, Y.; Li, P.; Liu, X.; Xiao, L.; Li, T.; Wang, D. The Response of Soil Organic Carbon to Climate and Soil Texture in China. Front. Earth Sci. 2022, 16, 835–845. [Google Scholar] [CrossRef]
  54. Zhou, Y.; Hagedorn, F.; Zhou, C.; Jiang, X.; Wang, X.; Li, M.-H. Experimental Warming of a Mountain Tundra Increases Soil CO2 Effluxes and Enhances CH4 and N2O Uptake at Changbai Mountain, China. Sci. Rep. 2016, 6, 21108. [Google Scholar] [CrossRef] [PubMed]
  55. Liu, S.; Zheng, Y.; Ma, R.; Yu, K.; Han, Z.; Xiao, S.; Li, Z.; Wu, S.; Li, S.; Wang, J.; et al. Increased Soil Release of Greenhouse Gases Shrinks Terrestrial Carbon Uptake Enhancement under Warming. Glob. Change Biol. 2020, 26, 4601–4613. [Google Scholar] [CrossRef]
  56. Georgiou, K.; Jackson, R.B.; Vindušková, O.; Abramoff, R.Z.; Ahlström, A.; Feng, W.; Harden, J.W.; Pellegrini, A.F.A.; Polley, H.W.; Soong, J.L.; et al. Global Stocks and Capacity of Mineral-Associated Soil Organic Carbon. Nat. Commun. 2022, 13, 3797. [Google Scholar] [CrossRef] [PubMed]
  57. Lavallee, J.M.; Soong, J.L.; Cotrufo, M.F. Conceptualizing Soil Organic Matter into Particulate and Mineral-associated Forms to Address Global Change in the 21st Century. Glob. Change Biol. 2020, 26, 261–273. [Google Scholar] [CrossRef]
  58. Whalen, E.D.; Grandy, A.S.; Sokol, N.W.; Keiluweit, M.; Ernakovich, J.; Smith, R.G.; Frey, S.D. Clarifying the Evidence for Microbial- and Plant-derived Soil Organic Matter, and the Path toward a More Quantitative Understanding. Glob. Change Biol. 2022, 28, 7167–7185. [Google Scholar] [CrossRef] [PubMed]
  59. Wiesmeier, M.; Hübner, R.; Spörlein, P.; Geuß, U.; Hangen, E.; Reischl, A.; Schilling, B.; Von Lützow, M.; Kögel-Knabner, I. Carbon Sequestration Potential of Soils in Southeast Germany Derived from Stable Soil Organic Carbon Saturation. Glob. Change Biol. 2014, 20, 653–665. [Google Scholar] [CrossRef] [PubMed]
  60. Wiesmeier, M.; Munro, S.; Barthold, F.; Steffens, M.; Schad, P.; Kögel-Knabner, I. Carbon Storage Capacity of Semi-Arid Grassland Soils and Sequestration Potentials in Northern China. Glob. Change Biol. 2015, 21, 3836–3845. [Google Scholar] [CrossRef]
  61. Soong, J.L.; Castanha, C.; Pries, C.E.H.; Ofiti, N.; Porras, R.C.; Riley, W.J.; Schmidt, M.W.I.; Torn, M.S. Five Years of Whole-Soil Warming Led to Loss of Subsoil Carbon Stocks and Increased CO2 Efflux. Sci. Adv. 2021, 7, eabd1343. [Google Scholar] [CrossRef] [PubMed]
Figure 1. Location of the study area.
Land 12 01923 g001
Figure 2. Spatial changes in the Zoige wetlands from 1985 to 2020.
Land 12 01923 g002
Figure 3. Spatial distribution of SOC density across the Zoige wetland area from 1985 to 2020.
Land 12 01923 g003
Figure 4. Spatial distribution of SOC density in each soil layer of Zoige wetland from 1985 to 2020.
Land 12 01923 g004
Figure 5. Spatial distribution of proportion of SOC stocks in the Zoige wetland distributed among different soil layers from 1985 to 2020. (ac) represents the distribution of organic carbon in 0–20 cm, 20–50 cm, and 50–100 cm soil in 2020; (df) represents the distribution of organic carbon in 0–20 cm, 20–50 cm, and 50–100 cm soil in 2000; and (gi) represents the distribution of organic carbon in 0–20 cm, 20–50 cm, and 50–100 cm soil in 1985.
Land 12 01923 g005
Figure 6. The overall relative influence of environment, climate, soil, and humans on SOC stocks in three soil depths across the Zoige wetland. The relative influence of four categories of variables are calculated as the sum of the relative importance of individual variables in each variable group.
Land 12 01923 g006
Figure 7. The relative importance of predictor variables from the regression prediction analysis using the random forest algorithm of the changes to SOC density in 0–20 cm layer (a), 20–50 cm layer (b), and 50–100 cm layer (c). Light blue, blue, dark green, and purple represent the climate, environment, human, and soil groups, respectively.
Land 12 01923 g007
Figure 8. Spatial distribution of SOC density changes in the Zoige wetlands under future warming scenarios of 2 °C (a), and changes in SOC density under warming scenarios of 1.5 °C/2 °C, or precipitation of +10%/+20% in the 0–20 cm (b), 20–50 cm (c), and 50–100 cm (d) layers predicted using the random forest model. The five lines of the box plot represent the 0%, 25%, 50%, 75%, and 100% quartiles, and the red points represent the mean values.
Land 12 01923 g008
Table 1. Area and changes in the Zoige alpine wetland from 1985 to 2020.
RegionArea (km2)Area Change (km2)Dynamic Degree (%)
1985200020201985–
2000
2000–
2020
1985–
2020
1985–20002000–20201985–2020
Hongyuan County2009.581669.751741.14−339.8371.39−268.44−1.13%0.21%−0.38%
Zoige County655.80589.17687.69−66.6398.5231.89−0.68%0.84%0.14%
Aba County104.41171.86112.2467.45−59.627.834.31%−1.73%0.21%
Maqu County1199.201219.101021.4819.90−197.62−177.720.11%−0.81%−0.42%
Luqu County429.21524.35456.9895.14−67.3727.771.48%−0.64%0.18%
Summary4398.284174.244019.53−224.04−154.71−378.75−0.34%−0.19%−0.25%
Table 2. Descriptive statistics of SOC, SOCD, and SOC stocks in the Zoige wetlands.
YearSoil Organic Carbon (g C kg−1)Soil Organic Density (kg C m−2)Soil Organic Carbon Stock (Pg C)
0−20 cm20−50 cm50−100 cm0−20 cm20−50 cm50−100 cm0−20 cm20−50 cm50−100 cm
202047.19 ± 3.6243.77 ± 2.9027.89 ± 2.2210.69 ± 0.7217.49 ± 0.9921.39 ± 2.000.48 ± 0.030.78 ± 0.040.96 ± 0.09
200040.23 ± 3.2633.28 ± 2.2128.88 ± 2.149.10 ± 0.6814.40 ± 1.0022.39 ± 1.530.41 ± 0.030.64 ± 0.041.00 ± 0.07
198539.21 ± 3.4733.09 ± 2.2328.39 ± 2.038.86 ± 0.4214.30 ± 0.8022.23 ± 1.250.40 ± 0.020.64 ± 0.030.99 ± 0.06
Disclaimer/Publisher’s Note: The statements, opinions and data contained in all publications are solely those of the individual author(s) and contributor(s) and not of MDPI and/or the editor(s). MDPI and/or the editor(s) disclaim responsibility for any injury to people or property resulting from any ideas, methods, instructions or products referred to in the content.

