Article

Personal Cognition and Implicit Constructs Affecting Preferential Decisions on Farmland Ownership: Multiple Case Studies in Kediri, East Java, Indonesia

by
Ar. R. T. Hidayat
1,*,
Corinthias P. M. Sianipar
2,3,*,
Shizuka Hashimoto
4,
Satoshi Hoshino
2,3,
Muhammad Dimyati
5 and
Ahmad E. Yustika
6,7
1
Department of Regional and Urban Planning, Brawijaya University (UB), Malang 65145, Indonesia
2
Department of Global Ecology, Kyoto University, Kyoto 606-8501, Japan
3
Division of Environmental Science and Technology, Kyoto University, Kyoto 606-8502, Japan
4
Department of Ecosystem Studies, University of Tokyo, Tokyo 113-8657, Japan
5
Department of Geography, University of Indonesia (UI), Depok 16424, Indonesia
6
Department of Development Economics, Brawijaya University (UB), Malang 65300, Indonesia
7
Office of the Vice President, Government of Indonesia, Jakarta 10110, Indonesia
*
Authors to whom correspondence should be addressed.
Land 2023, 12(10), 1847; https://doi.org/10.3390/land12101847
Submission received: 23 July 2023 / Revised: 18 September 2023 / Accepted: 25 September 2023 / Published: 27 September 2023
(This article belongs to the Special Issue Institutions in Governance of Land Use: Mitigating Boom and Bust)

Abstract

:
Farmland ownership is a critical issue for sustainable agriculture since it affects short-term productivity and the long-term stability of the sector. However, existing literature largely focused on immediately simplifying individual opinions through statistical methods, neglecting how implicit values could drive preferential ownership decisions. Therefore, this study aimed to understand the driving factors underlying decisions on farmland ownership, especially when there are cognitive factors that induce hidden constructs in individual preferences. This research, to observe the cognition and implicit values leading to ownership decisions, applied the Repertory Grid Technique (RGT) with subsequent Principal Component Analysis (PCA). Taking the multiple case studies of three villages in Kediri, East Java, Indonesia, this study involved 40 farmland owners. The RGT revealed a staggering 85 constructs leading to six ownership decisions: keep farming, buying, joint farming, leasing, selling, and converting. In general, the driving forces were distinguished into landowners’ household profile, sustainability-related (community and social conditions), spatial (farmland conversion and accessibility), and economic aspects. Based on PCA, “buying” and “keep farming” shared several driving forces and led to sustainable farming. In contrast, “joint farming”, “leasing”, “selling”, and “converting” were found to threaten farming sustainability. In addition, this study offers in-depth insights into the driving factors of different preferential ownership decisions according to the cognition and implicit values of individual landowners, allowing policymakers and other stakeholders to tailor policies and strategies to context-specific farmland ownership issues in pursuing sustainable agriculture.

1. Introduction

Land plays an instrumental role in shaping societies, economies, and ecosystems [1,2,3]. Indeed, recognizing land as a mere tangible construct, while not incorrect, is inherently limited. This elementary perspective on land overlooks the rich cultural, historical, and social implications it embodies. The functions, meaning, and values of land transcend a physical space that facilitates the establishment of ecological habitats, neighborhoods, and communities [4,5,6]. Many cultures globally imbue their lands with reflective meaning, transforming them into a symbol of shared history, collective memory, and distinct group identity. For many people, land goes beyond the utilitarian function of merely providing living spaces. Its values inspire their livelihoods, providing the necessary resources for diverse income-generation activities such as farming, grazing, and forestry, among others. It underscores the role of land in supporting socio-economic activities, highlighting its importance in day-to-day human activities and various industries. In the agriculture sector, land serves as the primary resource and asset to establish sustainable food production [7]. Consequently, access to and the quality of farmlands become critical determinants in shaping society’s ability to cultivate and produce food [8]. At times, this is not solely limited to commercial production; the reach of this influence extends to personal consumption as well. The stakes associated with farmland ownership are thus high, having direct implications for food security.
In practice, farmland ownership often means immediate access to associated resources like water and grazing areas, which are essential to maintaining the ecological balance necessary for farming. Furthermore, owning farmland can provide a source of wealth [9], either inherently in the value of the land itself, or generated through the crops cultivated on it. The wealth generated can be used to purchase additional food, invest in agricultural technology, or build resilience against unforeseen economic or climatic disturbances. Land ownership also provides a sense of security, providing material and psychological foundations for farmers to make substantial long-term investments in the land [10]. They may involve better farming practices that consider the land’s long-term health and aim to minimize the degradation of its resources. Other investments may involve developing physical infrastructure and improving soil conditions, thereby optimizing the land’s agricultural potential. In that sense, farmland ownership can encourage sustainable agricultural practices [11]. Farmland owners, having a vested interest in the continued health and productivity of the land, are naturally inclined to adopt practices that enhance sustainability. By employing such practices, they not only conserve the environment, but also ensure consistent agricultural yields over time. In this manner, farmland ownership is a critical issue for sustainable agriculture since it affects short-term productivity and the long-term stability of the sector.
Basically, secure farmland ownership can ensure income stability and social status. However, different reasons can lead to preferential ownership decisions over the farmlands, which in turn can significantly affect the structure and sustainability of the agricultural sector in a region. For example, different factors, including aging farm owners [12], financial needs [13], a lack of successors [14], or changing market conditions [15], may influence the decision to sell farmland. Meanwhile, selling the farmland may result in continuous use for agriculture. It may also lead to land-use changes if the new owner decides to convert the land for development or other non-agricultural uses. The decision to convert the farmland to other uses, including residential or commercial development, may also be taken by the original owner if they believe it will result in greater financial returns. This decision can be influenced by factors like urbanization [16], market pressures [17], and land policy [18]. Additionally, leasing out farmland can provide a steady income to the landowner without requiring them to actively farm the land. This might be attractive for retired farmers [14], landowners who reside outside the region [19], or those who own more land than they can effectively manage [20]. Moreover, any of these decisions can have broader implications for economies, communities, and the environment, making it critical to understand the factors influencing farmland ownership decisions.
Considering the impact ownership decisions have on the sustainability of the agriculture sector, decision-making processes over farmland ownership have attracted the attention of scholars for a long time. Some studies have gone further to consider the preferences of individual farmland owners [21,22,23], and on rare occasions have included cognitive factors in their investigations [24,25,26]. Furthermore, most studies have focused primarily on socio-economic driving factors [26,27,28], with spatial and ecological issues as additional considerations [29,30,31]. In practice, existing studies typically treat driving factors affecting farmland ownership decisions as mere quantitative variables, and lack the in-depth understanding of individual differences among farmland owners over the driving factors. Previous research, in fact, has tended to immediately simplify individual opinions through quantitative data gathering based on statistical methods, neglecting how implicit values could drive preferential ownership decisions. In reality, various hidden constructs could accumulate and eventually affect ownership decisions, leading to preferential choices that deviate from common statistical models. Thus, this study aims to understand the driving factors underlying decisions on farmland ownership, especially when there are cognitive factors that induce hidden constructs within individual preferences. In particular, this study proposes an alternative way of discovering the hidden constructs underlying individual ownership preferences, on the basis of which subsequent statistical methods could use enriched inputs to produce more comprehensive results. This study, to achieve its aims and objectives, will go on to answer the following research questions:
  • RQ1 What approach could be used to discover implicit values induced by individual cognition in the context of farmland ownership decisions?
  • RQ2 What hidden constructs affect decision-making processes over farmland ownership?
  • RQ3 How do these hidden constructs relate to preferential ownership decisions?

2. Literature Review

2.1. Preferential Ownership Decisions over Farmlands

Farm ownership is legally derived from common land ownership [9,32], which refers to the rights to possess, use, control, and transfer specific areas of land. The ownership rights are not exclusive to individuals but extend to corporate entities and government bodies, depending on the applicable legal status of the lands. These rights manifest in various forms, including legal entitlements, responsibilities, and restrictions. Land ownership grants rights, such as the right to cultivate crops [33] and build structures [34], reflecting a functional perspective of ownership. It also grants the right to lease [35] or sell the land [34], an aspect highlighting the proprietary dimension of ownership. However, it is imperative to note that these rights are not absolute. In practice, these rights may be subject to various regulatory constraints designed to preserve agricultural productivity, environmental sustainability, and social fairness. These constraints ensure that exercising farmland ownership rights would align with broader societal and ecological goals, striking a balance between individual property rights [36] and collective interests [37]. Therefore, farmland ownership as an object of law, regulation, social status, and economic systems places it at the intersection of property law, agricultural policy, and socio-economic dynamics. It underscores the complexity of individual and social factors driving preferential ownership decisions, which extend beyond mere legal property issues to incorporate social, economic, and environmental considerations.
There are two types of preferential decision over farmland ownership. The first type covers those decisions that maintain the ownership and status of agricultural lands. This group includes keep farming [38], joint farming [39], leasing [40], and buying [41]. “Keep farming” refers to the status of owning the farmland and restricting farming activities to oneself or one’s family. When the owner decides to engage in joint farming, other farmers will look after the farmland. In exchange, the original owner receives some share of the yield. In the case of leasing, part or all of the owned farmland is leased to other farmers. The original owner may or may not cease being a farmer, but the land remains active for agricultural purposes. When the owner aims to expand one’s own farming activities, the owner might buy farmland from others and continue farming on the expanded lands. Meanwhile, the second type of decision involves those leading to the loss of ownership [42] or the conversion of farmlands [43]. When an owner decides to cease farming and does not want to deal with anything related to the farmland anymore, they can sell the land to others. If the owner plans to maintain ownership but aims to utilize the land for other purposes, the owner can convert the farmland to other land uses.

2.2. Superficial Constructs: Laying the Basis to Observe Implicit Values

Observing the underlying cognition of different ownership decisions requires an in-depth understanding of the implicit constructs forming the decisions. Constructs represent individuals’ interpretations of the world around them through their own system of personal constructs [44]. In a decision-making process, constructs refer to the personal categories, dimensions, or frameworks through which individuals perceive, understand, and interpret the world around them [45]. These constructs form the basis of personal meaning and guide the thoughts, feelings, and actions of individuals. Since hidden constructs are extremely particular to personal cognition, they are typically unobservable immediately [46]. In practice, hidden constructs are discoverable by examining more superficial ones that reflect the ways individuals try to make sense of the world [47]. Since constructs technically reflect a bipolar understanding of the world (e.g., good–bad, strong–weak, safe–dangerous), it is possible to let individuals appraise superficial constructs using bipolar positioning [48], in which they compare and contrast the superficial elements based on their own worldview. The compare-and-contrast process lets the individuals themselves define the essential dimensions (constructs) that they use to differentiate between the elements. In that sense, their responses allow observers to identify the underlying constructs that the individuals use to interpret their experiences, giving valuable insight into the unique perspective and cognitive processes of the individuals [49].
Looking at these explanations, superficial constructs lay the basis for observing individual cognition, which defines the groundwork for personal reasoning leading to decisions [50]. With respect to farmland ownership, at least four categories of superficial constructs help elicit the hidden constructs (Table 1): household conditions, agricultural sustainability, regional growth, and policy. These can be further distinguished into four dimensions: social, economic, spatial, and agricultural practices. Illbery [51] proposed certain household-focused variables that reflect the household conditions of observed individuals. Their inclusion assumes that the household remains the most personal space forming people’s worldview. Meanwhile, Conway and Barbier [52], Reytar et al. [53], and Bathaei et al. [54] suggested some indicators of sustainable agriculture, which can be further derived into several superficial constructs. These reflect how farmland owners define their activities as not only sustaining socio-economic aspects, but also preserving the environment. Furthermore, Böventer [55], Richardson [56,57], and Firman [58] recommended various variables relevant to regional growth, with the assumption here that personal situations related to exogenous (regional) development could influence farmland ownership. In addition, Stumpf et al. [59] and Fairweather [60] indicated that policy issues remained essential to observing decision-making processes by individuals. Despite their tight relations to agricultural sustainability and regional growth, policy variables go beyond “situations” in these categories by offering direct programs for farmland owners.

2.3. Eliciting Hidden Constructs: Repertory Grid Technique
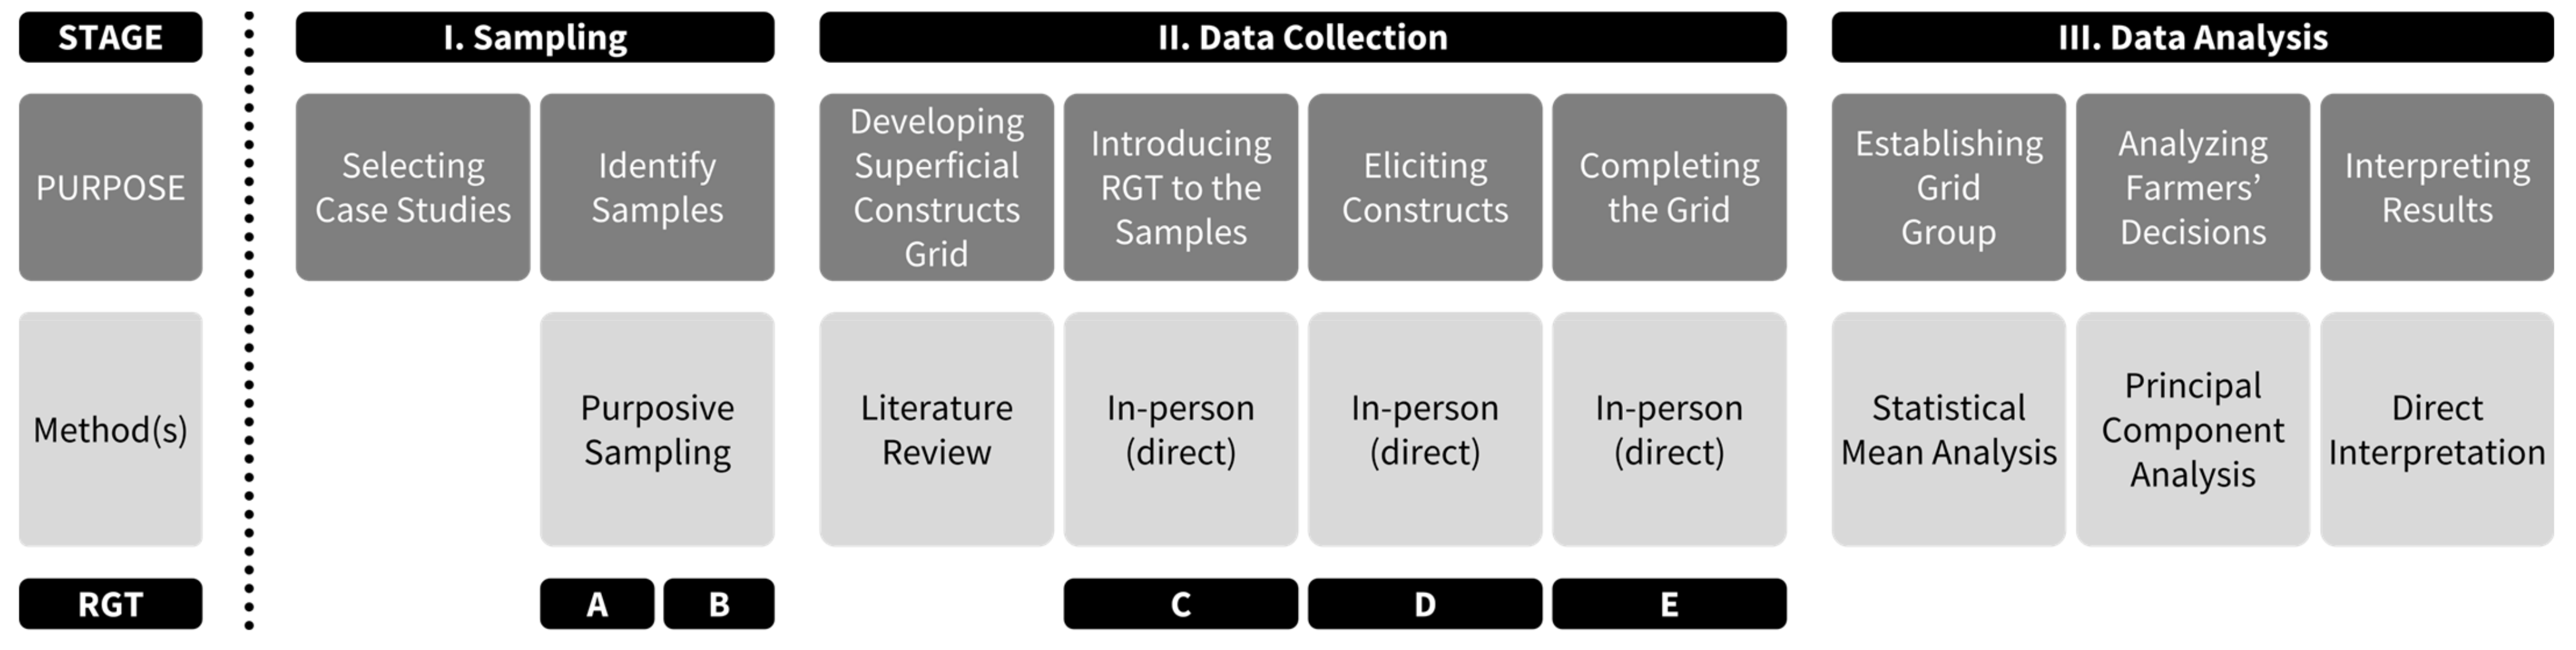
Focusing on the complex decision-making processes of farmland ownership requires expanded observations on individual cognition, not only by tangible economic factors, but also by personal, social, and cultural factors that may not be easily quantifiable. In that sense, the investigation should involve a cognitive mapping technique that could help describe how people think about decision-making processes over their farmlands based on their worldview [61]. At this point, the Repertory Grid Technique (RGT) [62,63,64,65] is particularly valuable in understanding ownership decisions regarding farmlands due to its focus on eliciting individuals’ subjective experiences and perceptions. The RGT is designed to reveal how individuals understand and interpret their world [66]. In the context of farmland ownership, it can shed light on how farmers perceive the benefits, challenges, and meanings associated with different ownership decisions. For example, it may reveal how farmers balance economic considerations with values related to family tradition, stewardship of the land, or community welfare [67,68,69]. Additionally, RGT can highlight individual differences in the ways farmers make ownership decisions, thereby acknowledging the heterogeneity within their communities. While individual differences are important, RGT can also identify common or shared constructs that are influential across a farming community or population [70,71]. These shared constructs could be indicative of broader cultural or social norms related to farmland ownership.
For decades, RGT has been the most recognized and widely utilized derivation of Kelly’s Personal Construct Theory [63]. RGT is an interpretative mapping technique aiming to describe how people use their cognition to perceive real-world phenomena [64]. It was originally used in psychotherapy, clinical counseling, and educational settings [72,73]. Since then, RGT has also been used to study human responses to urban activities [74], architecture [75], tourism [76], and natural environments [77]. Shaw and McKnight [78] stated that RGT is reliable for observing the underlying mechanism of the decision-making process. In the workflow (Figure 1), RGT gathers personal information (e.g., responses, opinions) from the observed individuals and turns it into a grid. In the repertory grid, elements represent the alternative decisions, while constructs represent what drives the alternative decisions. Links within the grid represent the importance of the criteria for the decisions. Theoretically, elements are the objects of attention within the domain of investigation. They are the things or events abstracted by constructs [79,80]. Consequently, the types of elements used in the grid will determine the types of elicited constructs [81]. Thus, the elements must be homogeneous (i.e., made up of all objects, events, and situations but not a combination of different groups), representative (i.e., represent an area under investigation [62]), and discrete (i.e., not a subset of other elements).

3. Methodology

3.1. Research Design
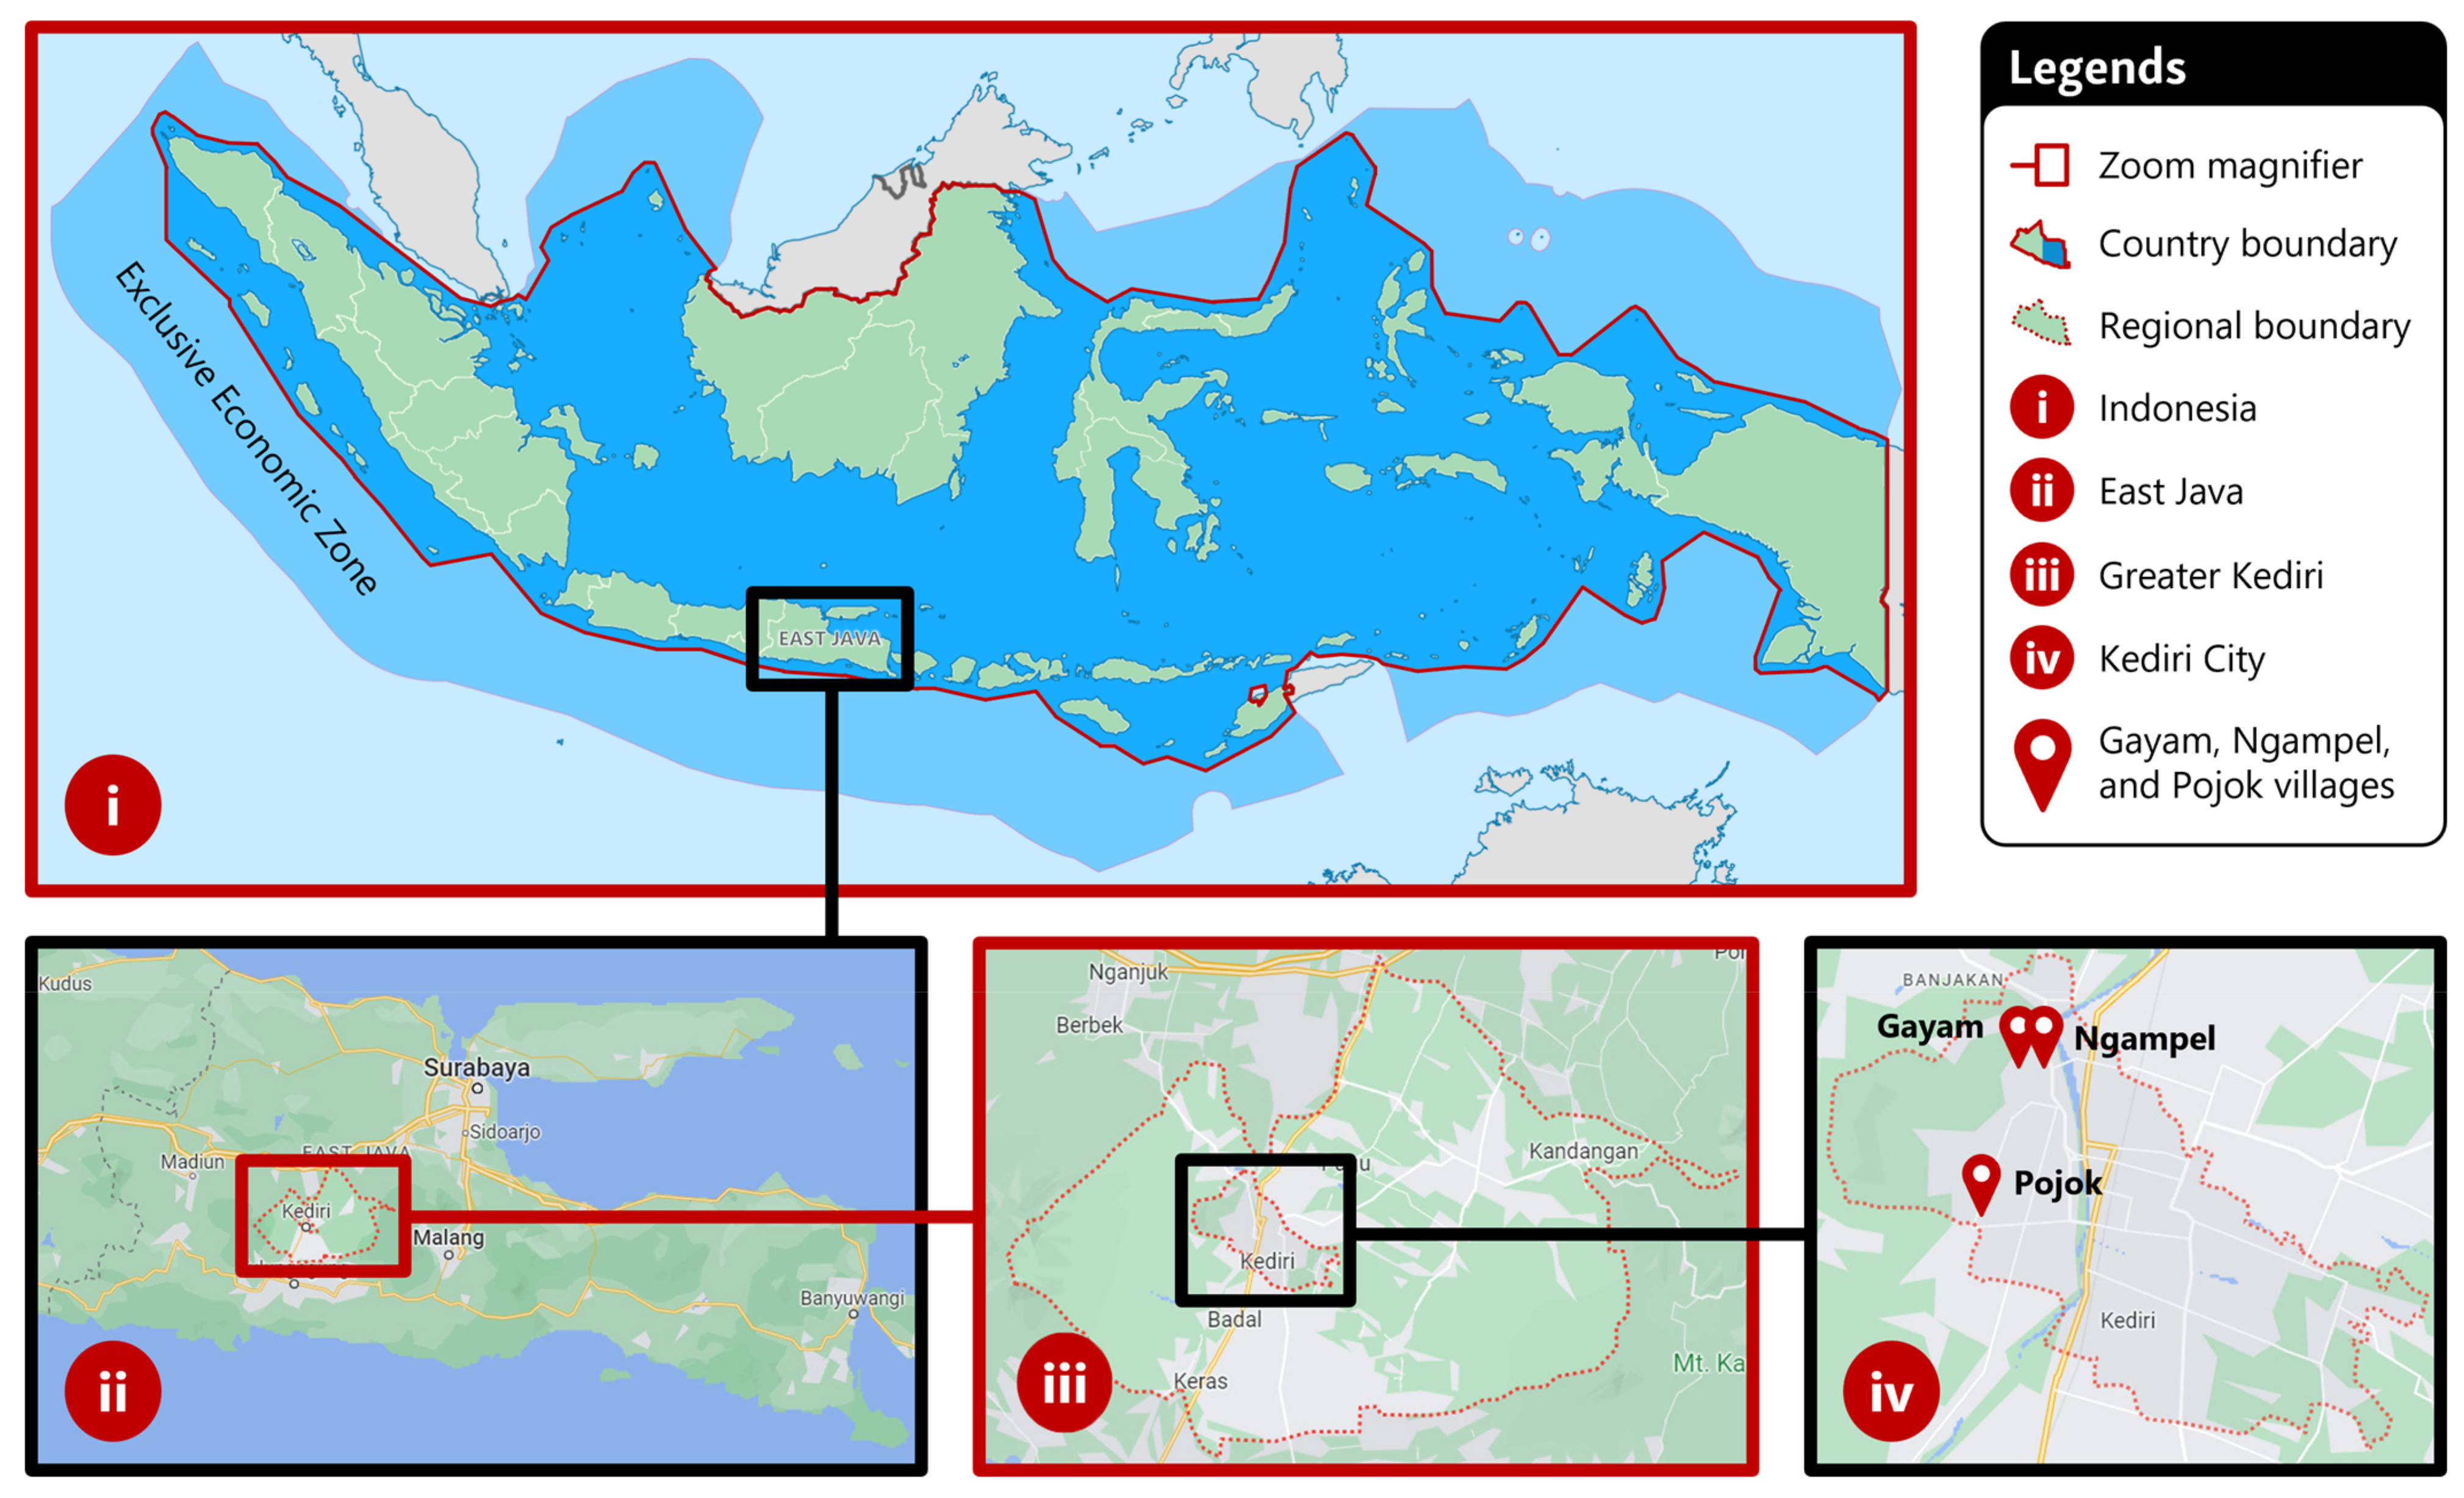
Following the research objectives, questions (RQs 1–3), and RGT workflow (Figure 1), this study was conducted based on a 3-stage design (Figure 2). In the first stage, this study selected multiple case studies within the same regional area for generalization purposes. In the next substage, the population of farmland owners in the case studies was identified and sampled using purposive sampling [82]. RGT, like other qualitative methods [83], aims toward achieving a more fine-grained and in-depth understanding of individual inquiries to build syntheses. Consequently, the issue of sample size and representativeness have little to no relevance to the validity of the research [84]. The second stage (Data Collection) began with the development of superficial constructs. Based on the third RGT step, the initial constructs were then introduced to the samples (farmland owners) through in-person meetings. In contrast to conventional research methods like questionnaires, the RGT protocol, as a qualitative method, avoids biasing the respondents with preconceived inquiries in formalized research instruments [85]. Thus, in the subsequent meetings, the involved farmland owners elicited their implicit constructs through their own thought processes with minimal intervention, as suggested by the fourth step in RGT. The constructs, according to the fifth RGT step, were later turned into the repertory grid in the meetings. After the grid had been completed, in the third research stage (Data Analysis), first, grid groups were established by applying statistical mean analysis [86]. The next substage focused on analyzing the farmers’ decisions according to the grid groups by employing Principal Component Analysis (PCA) [87]. Then, the results of the entire process were interpreted directly to synthesize the findings.

3.2. Case Study

Individual cognition and implicit constructs are extremely particular to the observed individuals. Consequently, generalizing relationships between cognitive views and ownership decisions requires multiple case studies to gather the regional pattern of decisions. Basically, the multi-case technique allows aggregation and/or cross-case analyses [88]. In practice, to aggregate farmland ownership decisions, the multiple case studies should be in the same region to ensure that the emerging constructs can be well aggregated to form the pattern of hidden constructs among farmland owners in the region. This research chose three villages (Gayam, Ngampel, and Pojok) in Kediri, East Java, Indonesia (Figure 3), as the case studies. These are located within the center of agricultural growth in Kediri [89]. Despite having solid traditional characteristics, Kediri is one of the more developed regions in East Java [90], while the province itself hosts the most extensive agricultural lands in Indonesia [91]. However, the rapid urbanization in Kediri has triggered farmland conversions [92,93]. In searching for solutions, it is imperative to first understand the driving factors behind ownership decisions among farmland owners in the region. As aforementioned, individual cognition and implicit constructs typically affect the driving factors. Looking at the explanations, choosing multiple case studies in Kediri is entirely beneficial to achieving the aims and objectives of this research.

3.3. Data Collection

The target population included 229 farmland owners locally residing in the three selected villages. This study sent invitations to 28, 7, and 18 potential respondents from Pojok, Ngampel, and Gayam villages, respectively. The invitees were selected from those who were acknowledged by the local government for their active participation in community meetings and organizations. In the data collection, 27, 8, and 5 landowners from these villages, respectively, attended the meetings. The total sample size (40) is significantly larger than the consensus in RGT studies (15–25) [94]. Of the attendees, those from the same village were divided into smaller groups consisting of 2–4 respondents. The field surveys began with an interview for every small group. The research purposes and RGT processes were introduced to each of the small groups to allow them to establish the same understanding. This study employed face validation [95] to ensure respondents understood the purposes and processes. After that, each respondent elicited their constructs based on personal knowledge and experiences, using research variables as clues. For each set of three elements, the respondents considered what the first two elements had in common, as opposed to the third, and the reasons for the answer. Since a construct is always a pair of one emerging pole and one implicit pole, the respondents were tasked with locating the pairs of constructs. The repertory grid (Figure 4) was formed from constructs (in rows) and elements (in columns) that were linked by “links” [96]. The best constructs based on respondents’ opinions were written on the left side (emerging pole) of the grid, and the worst ones were on the opposite (implicit pole). The best constructs referred to the expected condition, and the worst constructs were the opposite. Next, the respondents were asked to score the cell below each element. For example, if they agree with the construct “A” as a driver for the element “C”, they should give a score of 4 or 5, meaning that the construct “A” was a significant driver when respondents chose the option “C”. The respondents, to get an in-depth understanding, were allowed to remove or add additional constructs. Then, they were asked to fill out the constructs. In the end, the respondents had virtually positioned themselves into elements and completed the entire grid.

3.4. Data Analysis

Multiple grids in RGT can be analyzed using single or multi-grid analyses [67]. In single-grid analysis, the grids are analyzed one by one. In multi-grid analysis, a new grid is formed to aggregate the multiple grids by calculating the average (mean) of each cell in the original grids [86]. Basically, a multi-grid analysis might blur the personal identity of single grids. However, it is beneficial to gain a better vision of the groups. Since this research was observing patterns among individuals in multiple case studies, the data analysis applied multi-grid analysis. After producing the aggregate grid, this study employed PCA [87] to clarify the relationship between constructs and elements using Idiogrid software (version 2.4) [97]. In the PCA, the number of principal components was determined using a correlation matrix. Only those with eigenvalues of more than one were chosen to create a scree plot [98]. The next step was to rotate the dataset to produce loading scores for the elements and component scores. Varimax rotation was chosen, since the data (elements and constructs) were orthogonal [99]. The component score represented how each construct related to elements and its component. The scores were annotated to represent which pole the constructs or elements belonged to. When the number of principal components of constructs and elements was similar, the principal components of elements were determined prior to the constructs. Consequently, the first iteration of the step above determined the principal components of elements. The process used elements as if they were variables and constructs as samples. After that, it was switched to produce the loading scores of constructs.

4. Results

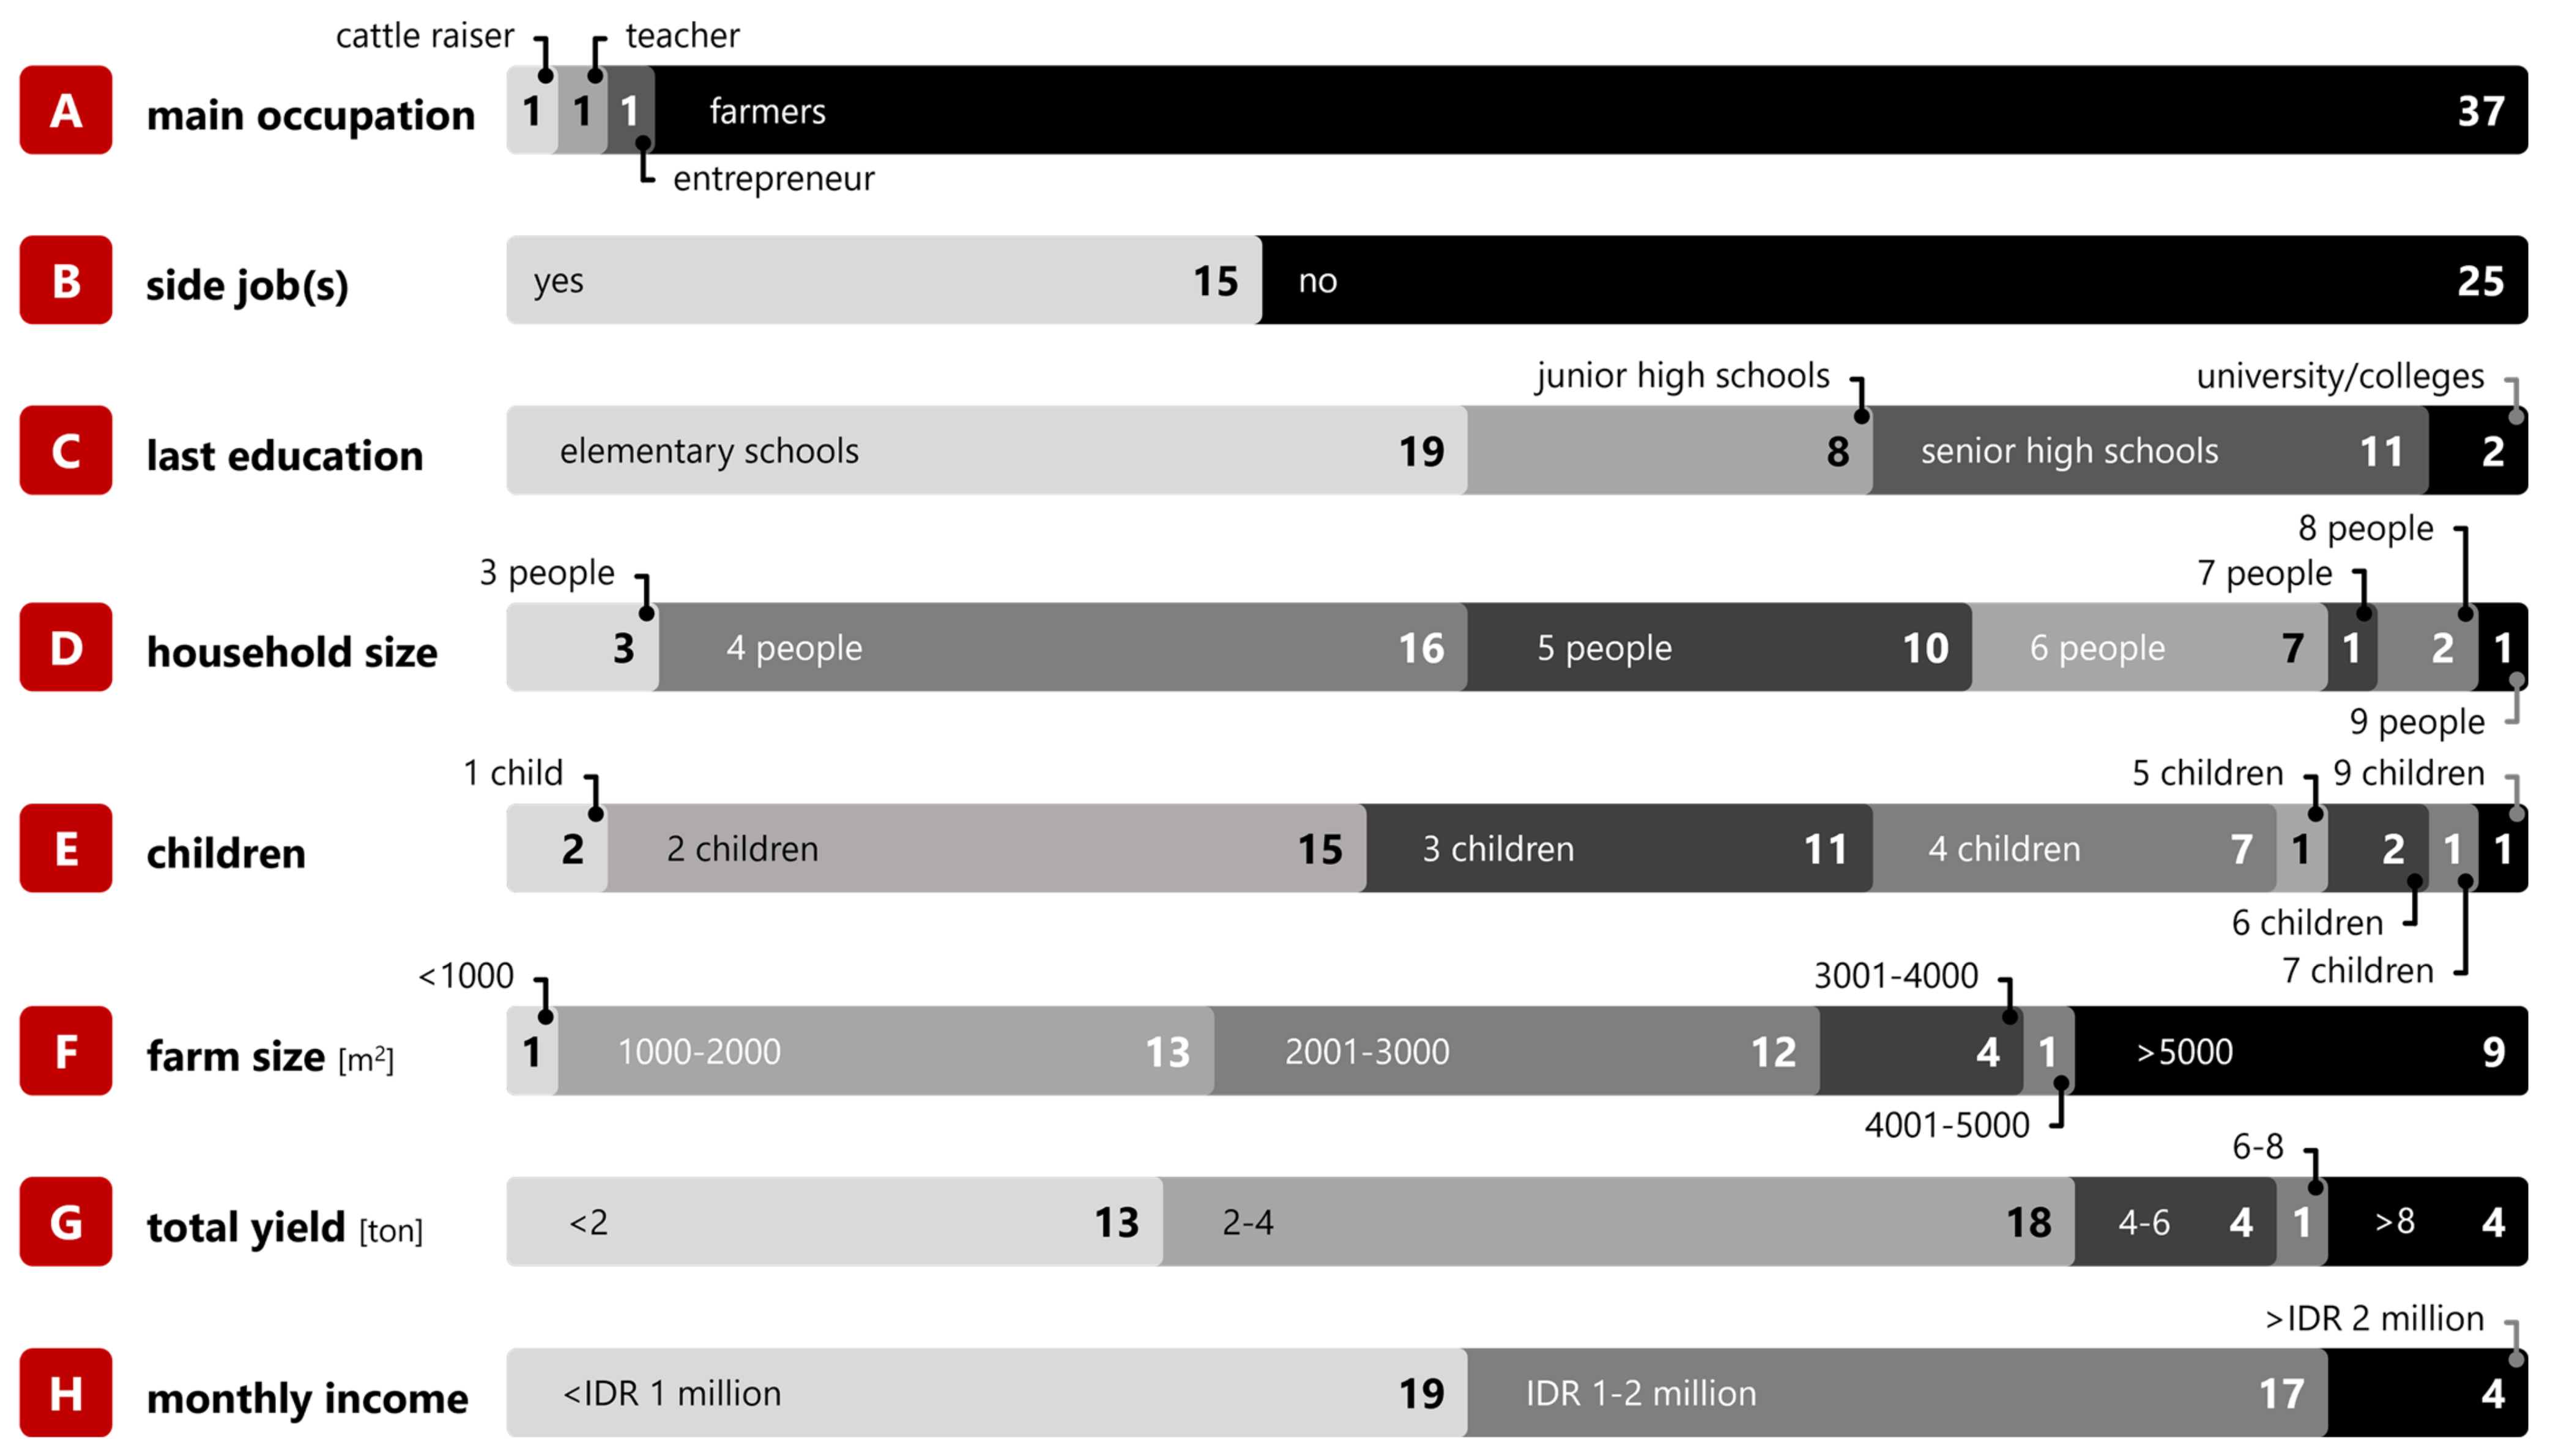
4.1. Profile of the Respondents

After completing the field surveys, this study first built the socio-economic profiles of the 40 respondents (Figure 5). In terms of occupations (A), most respondents considered farming their primary occupation. Only one respondent declared oneself primarily an entrepreneur while considering farming a side job. The rest (2 people) declared being a teacher or cattle raiser their primary occupation. Aside from their main livelihoods, more than half of the respondents (25 people) were not engaged in any side jobs, while 15 others had income-generating activities other than farming. Regarding the education level of the farmland owners (C), most of them (19 people) graduated from elementary schools, eight from junior high schools, and 11 from senior high schools, while only two have university or college degrees. Meanwhile, since this research involved farmland owners, only one person per family participated. Thus, this study gathered the profile of their household sizes (D). The sizes varied, with 3, 16, 10, and 8 owners having three, four, five, and six people in their households, respectively. A minor subset of the samples (four landowners) has more than six people in the households, with the largest size being nine people in one household. Regarding the number of children (E), only two respondents have a single child, while 15, 11, and 7 respondents have two, three, and four children, respectively. The rest (five landowners) have five or more children. Furthermore, most respondents (25 people) have 1000–3000 m2 of farmland. Nine people owned more than 5000 m2 of land. Only one person owned less than 1000 m2. Four people owned 3001–4000 m2 of land, while the rest (one person) held 4001–5000 m2 of farmland. From the farmland, 13 and 18 owners produced a total yield of 13 and 18 tons, respectively. Additionally, four people had 4–6 tons, one farmer had 6–8 tons, and four respondents had more than 8 tons of yield. In terms of monthly income (H), roughly half of the total participants (19 people) generated less than IDR 1 million (<USD 68.2; USD 1 ≈ IDR 14,670 as of April 30, 2023). A similar subset of the samples (17 people) earned IDR 1–2 million (≈USD 68.2–136.3), while the rest (4 people) generated more than IDR 2 million (>USD 136.3).

4.2. Repertory Grid Technique

Table A1 (Appendix A) shows the list of elicited constructs from the RGT process, including their direct relevance to the initial or superficial constructs (Table 1). According to the respondents, farm owners expected their children to take over the farm, eventually. However, they were unwilling to pass it on to successors lacking sufficient skills (G4). Despite some cases where successors had a high willingness to do farming and/or continue the farming businesses (G24), technical farming skills (G2, G3) remained necessary. Even children highly motivated to farm needed robust farming expertise, which could be gained through either working directly with the parents (G24) or formal education (G5). However, parents also prioritized formal education (G5) to give their children alternative job options. Still, this produced an unintended consequence. As their successors focused on school, their involvement in farming decreased. The excellent choice of letting the children have a better formal education than their parents somehow came at the cost of distracting them from gaining practical farming experience. Consequently, farmers had to balance their desire for skilled successors (G4) with their children’s formal education (G5), which reduced their fieldwork exposure.
Additionally, there were similar concerns around labor-related constructs essential to farming operations. Farmland owners viewed labor availability (G12) as being just as critical as access to capital (G14) and farming expertise (G3). They found a critical need for highly skilled laborers who could perform their tasks efficiently while remunerating at reasonable rates. However, respondents indicated that the number of these sought-after skilled workers was on a downward trend in the market (G12), a concerning phenomenon for farmland owners. Consequently, the owners had to travel substantial distances from their villages (G22, G23) to recruit skilled workers, despite relevant job opportunities closer to home. Amid this scarcity of local skilled labor, vital but less skill-intensive tasks, such as operating water pumps and conducting night patrols, do not require a high degree of expertise. Thus, local workers with less specialized skills could contribute effectively to these areas (G7), underscoring the potential for leveraging the local unskilled labor force for certain critical yet uncomplicated farming tasks. Nevertheless, while the community supplied unskilled job opportunities, the lack of locally available skilled laborers still forced farmers to seek workers much farther away.
Furthermore, the level and trend of income were both essential, along with the opportunity to have diversified income sources (G10). More specifically, farmers expected and desired a steadily progressive income over time. This expectation stemmed from the fact that their income as rice farmers only materialized at harvest time, which may occur just once or twice a year (G16). Thus, they had to carefully budget and save their income from one harvest to last until the next. However, the selling price of rice fluctuated according to unpredictable market conditions (G15), making it difficult to predict their total income from season to season. Consequently, diversifying their income sources emerged as a natural choice to generate more regular cash flow over shorter intervals between harvests. Since rice farming demanded extensive time and labor, farmers sought side jobs (G11) that required less intensive labor, such as craft making, cattle raising, and working as paid laborers on other farms. In particular, cattle raising emerged as a common way for farmers to secure alternative income between harvests, whereby they could sell their livestock at the market in difficult times. In short, farmers depended on both progressive rice farming income and income diversification to maintain financial stability.
On the other hand, farmers had to be creative and resourceful when managing expenditures for their farming activities and family needs to maintain positive cash flow. In practice, farmers actively reduced costs by decreasing their use of hired laborers (G12), pursuing side jobs (G11), and farming as much land as possible themselves (G1, G3, G24). They also exhibited resourcefulness by building their own livestock cages, self-repairing their homes, and leveraging their skills to earn extra income and improve livelihood security. Several landowners even worked as laborers on larger farms, not only for income but also to take advantage of scarce job opportunities (G13). Despite these efforts, inflation consistently drove prices of daily necessities higher (G1), unfortunately at a faster rate than income growth. Thus, both the level and trend of income (G10) were critical to creatively covering rising expenditures while still achieving a net positive cash flow. The results highlighted farmers’ creative cost-cutting and income-supplementing strategies to balance their budgets against inflation pressure on expenditures (G1, G17). Their resourcefulness (G2, G3) was key to maintaining financial stability, but their fundamental dependence on sufficient and steadily rising farming income remained.
Meanwhile, the results further revealed that, for farmers, the amount of income and benefits was not the primary factor. Accessibility, equitable distribution, and low barriers to exogenous support (G14, G18, G19) were also critical considerations. However, government programs intended to improve farmers’ lives often lacked transparency and imposed difficult requirements to access benefits. A typical example was the subsidy program (G19), which had both input subsidies (e.g., fertilizer, seeds, and machinery) and output subsidies (e.g., transportation, guaranteed minimum prices, and facilitated market access). While farmers deserved these benefits, the amount each received differed based on location and farm characteristics (G20, G21). For instance, native farmers on Java Island often qualified for and received less than farmers from other islands, likely reflecting regional economic disparities (G9, G26). In addition to absolute amounts, factors like equal information access, equitable geographic distribution aligned with need, and easy-to-meet requirements were therefore vital for farmers to actually obtain income and benefits from government programs (G9). In other words, both the amount and accessibility of support were critical to truly improving farmers’ livelihoods.
In practice, the number and amount of agricultural subsidies were generally sufficient for farmers to operate their businesses. However, accessibility and distribution of the subsidies created uneven impacts across regions, even down to the group and community levels (G6, G8). Additionally, subsidy programs were sometimes not equally accessible or distributed. In particular, the requirements to qualify for certain subsidies (G6, G25) could be difficult for farmers to satisfy. As a response, farmland owners elicited an implicit construct of “instructor capability” (G27), which would eventually be relevant to any farmland ownership decisions (G26). Central to this construct were instructors who could help them gather valuable information and meet the requirements of subsidy programs. However, individual instructors exhibited varying capabilities (G27). Therefore, authoritative institutions, ideally the same bodies administering the subsidies, should carefully select and appoint qualified instructors. In sum, while the subsidies were adequate in terms of number and amount (G19), their accessibility and distribution largely depended on instructors’ capabilities to assist farmers in seeking qualifications and applying for subsidy programs (G27).
The multi-grid analysis of individual RGT grids expanded the initial constructs provided (Table 1) into a staggering 85 constructs from the respondents (Appendix A). This study considered all 85 elicited constructs as variables. Meanwhile, the RGT process also confirmed six elements, which were then treated as samples in the subsequent Principal Component Analysis. Table 2 shows the minimum, maximum, and mean values for six different ownership decisions. Standard deviations were also provided to see how individual values in each decision differ from the mean value of the ownership decision. Looking at Table 2, the “keep farming” and “buying” decisions showed considerably higher mean values than other ownership decisions. Constructs in the “keep farming” decision were originally posited to have medium-level significance (3.00–3.50), which was supported by the mean value (3.28). However, looking at the standard deviation (0.479), the respondents thought that many constructs for the “keep farming” decision were indeed important at medium to low levels. Meanwhile, the “buying” decision showed a wide range of answers (1.88–4.68), implying that some elicited constructs might not be as vital as they were initially thought to be to drive respondents to choose this decision. Overall, all ownership decisions showed that the highest scores of the constructs confirmed their importance at medium to high levels (3.53–4.68).

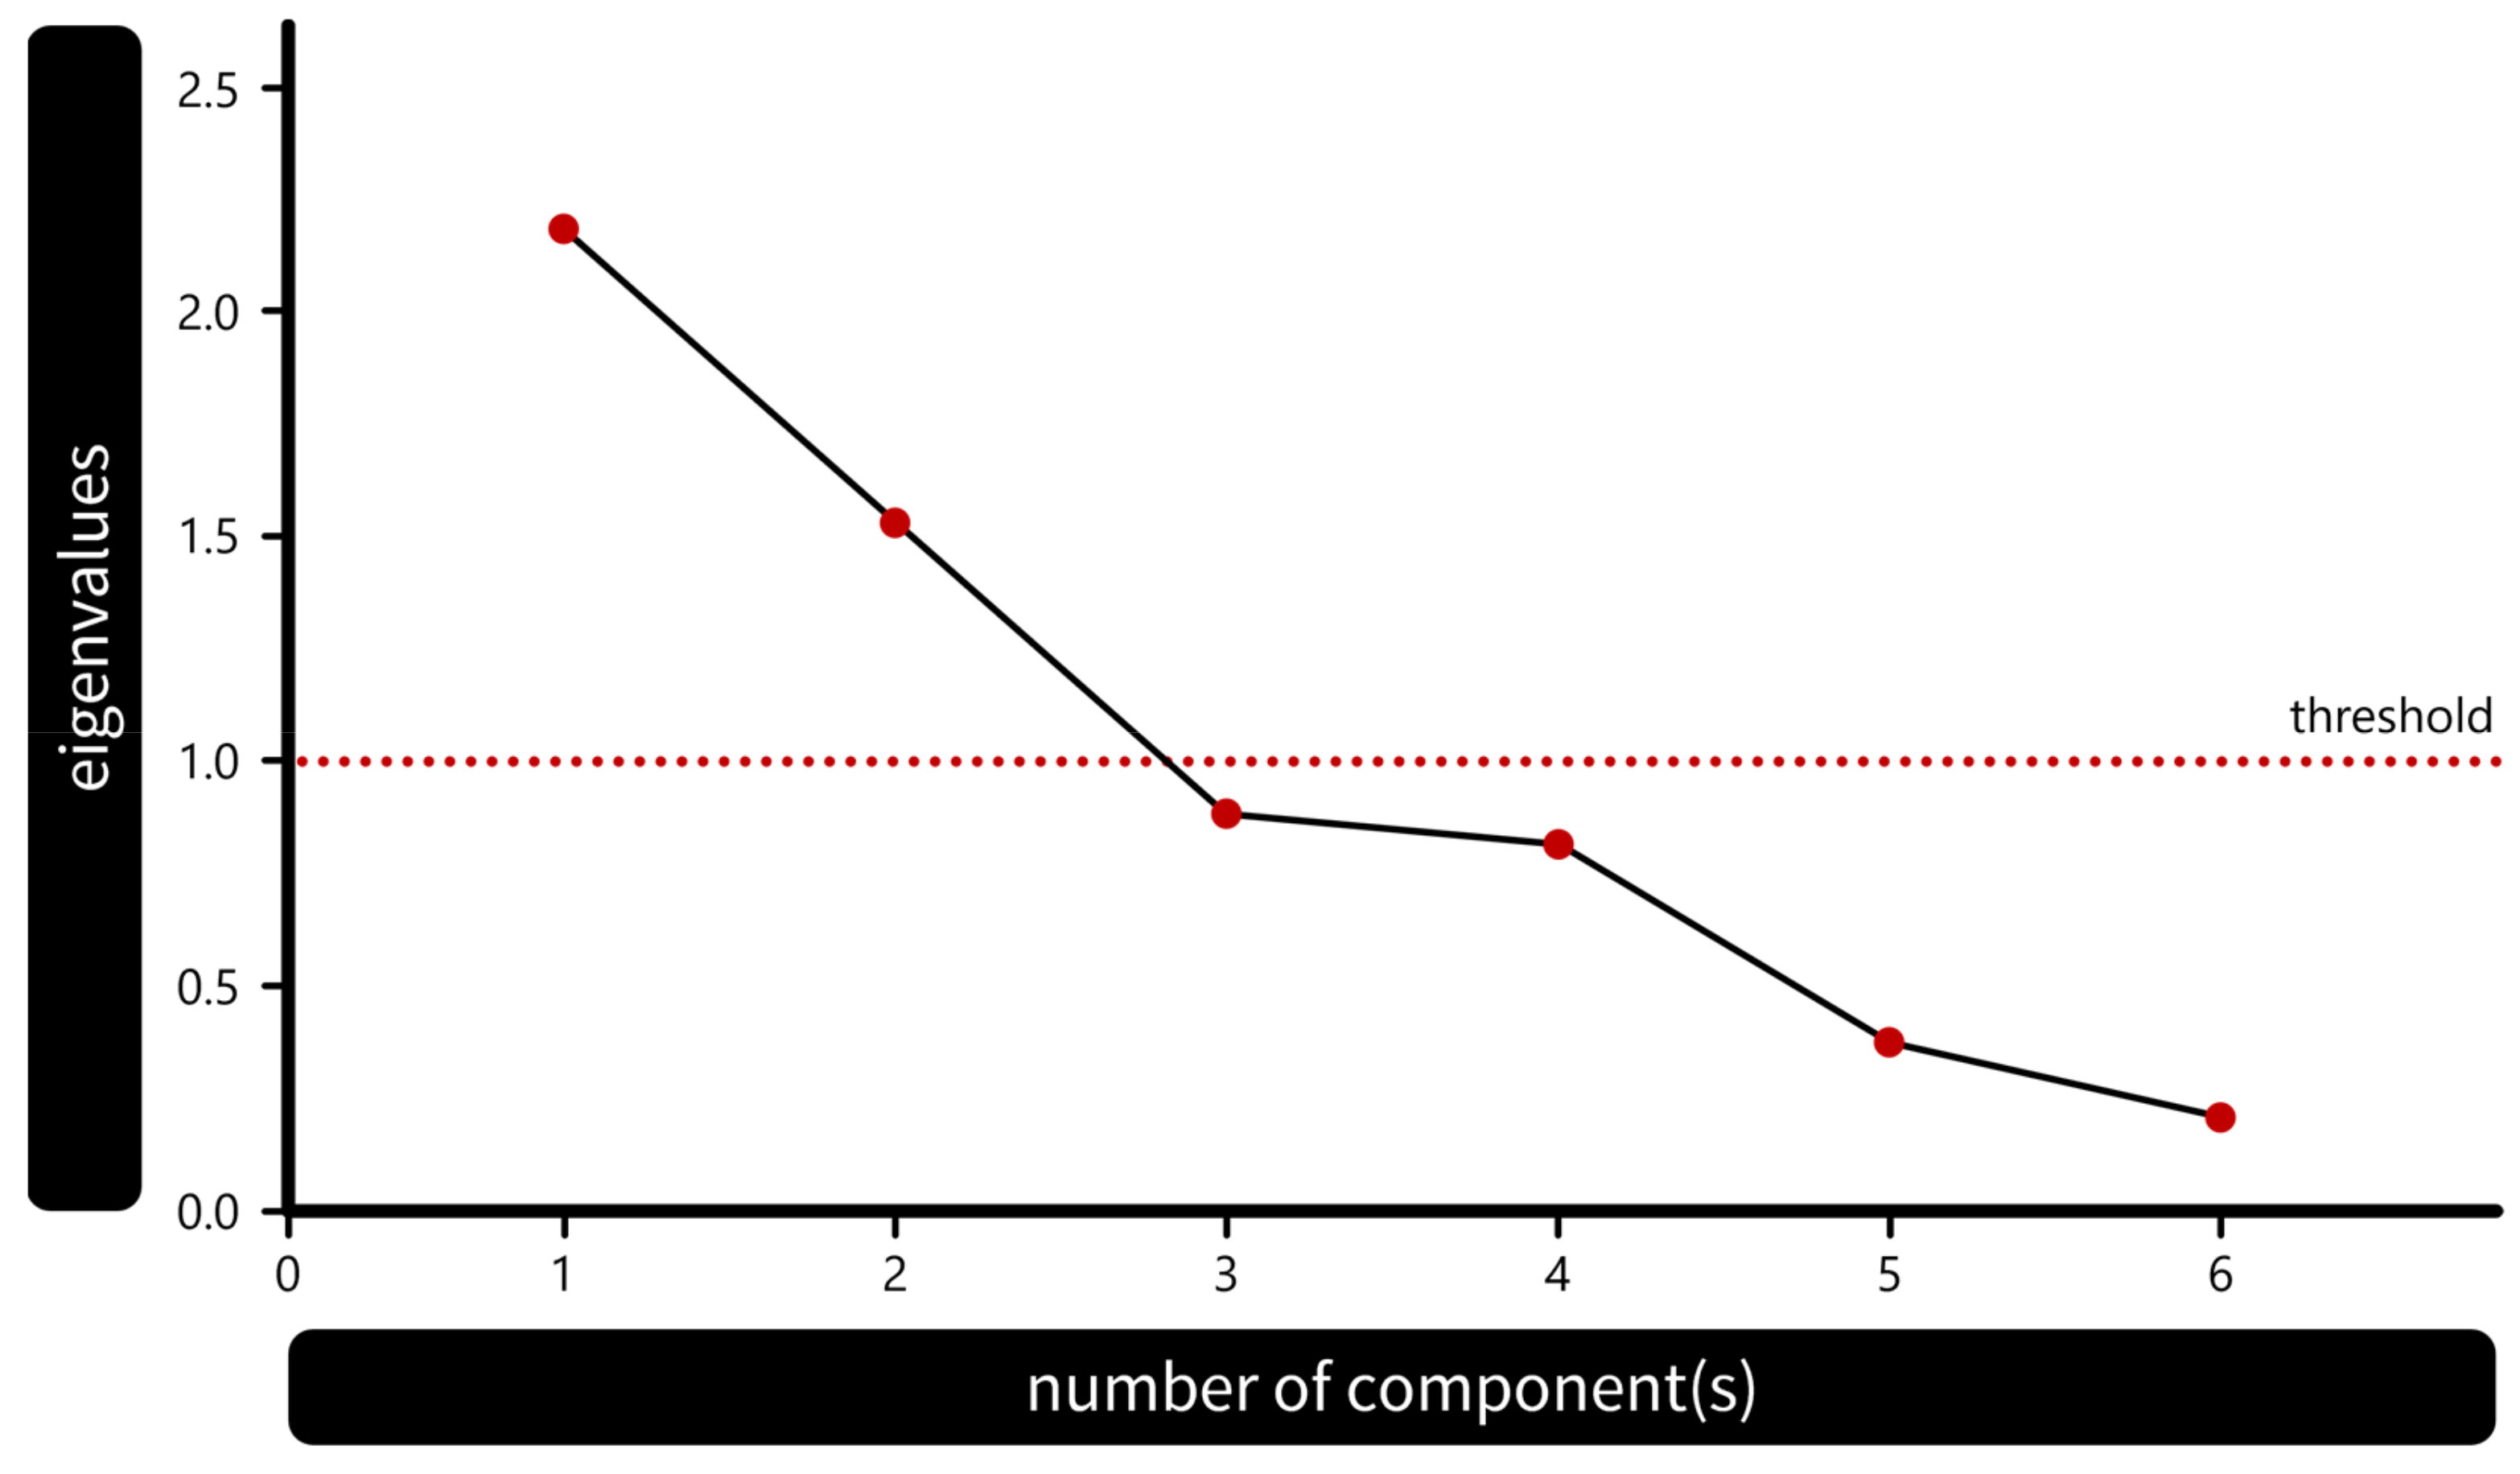
4.3. Principal Component Analysis

The primary purpose of conducting PCA was to better understand how the influencing factors or driving forces impacted decision-making processes. Running PCA in the Idiogrid software revealed the correlations between elements and constructs in the dataset. Through a Cartesian diagram, constructs found in the same quadrant with particular elements indicated high scores for the corresponding elements. These high-scoring constructs were subsequently considered the key drivers behind the decisions. At the start of the PCA, eigenvalues were calculated to determine the optimal number of components to retain. Figure 6 presents a graphical correlation between the number of components and the corresponding eigenvalues. The results showed that configurations with either one or two components were identified as the only instances in which the eigenvalues surpassed the threshold value of 1. Therefore, two components were retained for the PCA in this study. In the prior RGT stage, the elicited constructs were orthogonal or independent. Due to the orthogonal nature of constructs, the varimax rotation was elected for the PCA stage. This decision was intended to emphasize the characteristics of the two components (PC1 and PC2), thereby enhancing clarity in the PCA outcomes. Varimax rotation was therefore employed with the intention of providing a clearer understanding of the components retained.
In the PCA process, ownership decisions (the elements) were classified according to their driving forces. PC1 (X-axis) accounted for 39% of the total variance. The component’s loading scores were related to “keep farming” and “buying” decisions in the positive pole. In fact, the “buying” decision was particularly close to “keep farming”. This result implies that “keep farming” shared some driving forces with the “buying” decision. Additionally, when a farm owner intends to expand their farmland, they would prefer to continue the farming activities by themselves. In relation to the constructs, for instance, the “road condition” construct appeared to be correlated with the “keep farming” and “buying” decisions. This implies that improving road conditions would induce farmers to “keep farming” on their existing land or “buying” additional land. Conversely, deteriorating road conditions would prompt decisions like selling the land or making the other three decisions. On the other hand, “joint farming”, “leasing”, “selling”, and “converting” were at the negative pole. This implies that the “converting” decision was influenced by common driving forces shared with “leasing”, “selling”, and “joint farming” decisions. In particular, the “converting” element (decision) in the first component seemed to be associated with the other elements that were suspected of contributing to farmland conversion.
Meanwhile, the constructs were segmented into four groups, as reflected in the four quadrants of the cartesian diagram, to see their closeness to the elements (ownership decisions). In general, constructs closely associated with certain elements produced high scores for those elements. Based on PC1, “keep farming” and “buying” were clustered in the first group (PC1-based Group I) with high positive average loading scores for several constructs, including farming experience (+0.80), the availability of successors (+0.80), and laborers (+0.90). The other constructs in this group were rice quality (+0.86), government involvement in fuel subsidies (+0.88), and beneficial loan programs (+0.72). The two decisions were also positively correlated with the availability of transportation (+0.90), which was strongly associated with accessibility issues in the RGT results. The second group (PC1-based Group II) was closely associated with four other decisions (i.e., “joint farming”, “leasing”, “selling”, and “converting”), all of which were accounted for by negative loading scores. Some notable constructs in this group included the shifting custom-related farming activities (−0.95), loan payday schedule (−0.50), and the income level of side jobs (−0.18). However, it is particularly important to note that these factors had small loading scores, implying that they should be used to measure the associated decisions.
Furthermore, the second component (PC2, Y-axis) accounted for 36% of the total variance. In the PC2-based Group I, the “selling” (+2.82), “leasing” (+1.30), and “converting” (+2.31) elements remained clustered together. Additionally, “joint farming” was also clustered in this group with a considerably smaller loading score (+0.65). In agreement with the clustering based on the first component (PC1), “keep farming” and “buying” elements remained in the same cluster (PC2-based Group II). Still, these two decisions distinctly positioned each other, separated by a significant gap. Positive polarity based on PC2 indicated distinguished factors in the production aspect, such as workload (+0.53) and the seasonal price of yield (+0.67). Other significant factors identified included job opportunity (+0.6), job requirement (+0.72), and the conditions for side jobs (+0.8). On the other hand, the PC2-based Group II, located in the negative direction of PC2, also included many factors. The group was particularly characterized by driving factors with highly negative loading scores. In general, it was highly influenced by capital production, the sustainability of farming at the household level, government involvement, and the farmers’ economic conditions. Household conditions such as daily expenses (−0.76) and the trend of income (−0.78) were two examples of critical constructs characterizing this group.
Additionally, issues related to capital production appeared to hold a significant influence in the PC2-based Group II (negative loading factors). In particular, farming sustainability at the household level was affected by household size, which provided unpaid laborers (−0.84), the availability of successors (−0.81), and expected successors (−0.79). Additionally, family participation in the farming activity (−0.71) and the willingness of expected successors to inherit the farmland for farming (−0.92) were also important. Additionally, decisions in the group corresponded with the response to the government’s programs (−0.74) and the effectiveness of the programs (−0.75). This group was also associated with loan-related issues such as loan threat (−0.69), payback due date (−0.64), the availability of loan programs for farmers (−0.93), and the benefits of loan programs (−0.89). Subsidy-related factors also played a part in characterizing this group. They included the amount (−0.71) and distribution (−0.70) of subsidies. Furthermore, agricultural extension programs were available for farmers. The technical capability (−0.73) and innovative behavior (−0.81) of instructors were thus considered when owners made “keep farming” and/or “buying” decisions, since technology transfer and expert guidance would help farmland owners overcome all the obstacles that might harm their income security.
Looking at the positioning of six ownership decisions along with PC1 (X-axis) and PC2 (Y-axis), the elements were clearly separated into two major groups. The first group of elements consisted of “keep farming” and “buying” decisions, which were located within the fourth quadrant with positive PC1 and negative PC2. Since there was virtually no decision in this group that threatened the sustainability of farming activities, this group was referred to as involving sustainability-leading decisions. Based on the PCA, about 70% of the total constructs were located within the quadrant, implying that those constructs lead to farming sustainability. Maintaining these constructs would then be critical to induce “keep farming” and/or “buying” decisions. Meanwhile, the second major group consisted of “joint farming”, “leasing”, “selling”, and “converting” decisions. These decisions were within the second quadrant, with negative PC1 and positive PC2. Since these decisions and the associated constructs could make farmland vulnerable to abandonment or conversion, this group was referred to as including sustainability-threatening decisions. The low number of constructs in the quadrant implies that choosing sustainability-threatening decisions would only need a few considerations. This indicated that farmland owners might easily switch to sustainability-threatening decisions, mostly when those driving forces (i.e., constructs) satisfied their desires.
In general, all the constructs were scattered in all four quadrants. Since the two major groups were within two quadrants (II and IV), constructs scattered in the first and third quadrants created a residual group: the gray zone. Technically, the gray zone referred to the Cartesian positioning in which the constructs within it, to some extent, affected both the major groups of elements, but did not lean toward or become associated with one of them. In this gray zone, the constructs imply indecisiveness. From the respondents’ point of view, constructs within the gray zone moderately drove certain conditions. Some examples of constructs in this zone included prestige (−0.73), information technology for weather forecasts (−0.67), and the trend of output prices (−0.73). Additionally, the gray zone was associated with the impact of farmland conversion on farming (−0.35). Despite being considered indecisive factors, those constructs could drive certain ownership decisions if the users of the research results (e.g., policymakers and land-use planning agencies) are ignorant. Those constructs might correspond to certain other constructs, since they were elicited from the same variable. For example, farmland conversion could be closely related to the impact of regional growth on farming activity. If users ignore the possibility of farmland conversion, this might drive the owners to make sustainability-threatening decisions.

5. Discussion

The primary objective of this study was to uncover the cognition and implicit values that could drive individual farmland ownership decisions. This research, responding to the first research question, employed RGT [64] combined with subsequent PCA [87]. The Repertory Grid Technique, a method rooted in Kelly’s personal construct theory [79,80], allowed for the identification of individual cognition and implicit values. PCA was employed to examine the relationship between these constructs and the preferential decisions made by the owners. Reaching beyond fully quantitative approaches, the unique cross-methodological approach effectively unearthed the in-depth cognitive processes that might otherwise remain hidden in typical quantitative research methodologies. Responding to the second research question, this research closely examined the cognition and implicit values by deriving idiosyncratic constructs of personal meaning leading to insight into individual cognitive structures. This study identified a total of 85 hidden constructs that, corroborating previous land studies, led to six different ownership decisions: maintaining current farming practices (“keep farming”) [38], entering into cooperative farming agreements (“joint farming”) [39], leasing out the land [40], purchasing additional land [41], selling existing land [42], and converting the land for non-agricultural uses [43]. The significant number of hidden constructs and the variety of ownership decisions underscored the complexity of the decision-making process and the necessity of employing PCA to reveal the relationships between these constructs and decisions.
Responding to the third research question, this study discovered two distinct groups of decisions: those promoting farming sustainability and those posing threats to it. Sustainability-inducing decisions, which include maintaining current farming practices (keep farming) and buying additional land (buying), were primarily driven by issues related to household, farm, and policy. Supporting Shahzad et al. [100] and Foguesatto et al. [101], household-related issues included the presence of familial successors (children) to take over farming operations and the education level of the children. Farm-related factors, as also stated in other studies [102,103], interconnected the quality of the soil, the farming systems in use, and the yield and quality of the farm produce. Policy issues, parallel to Bekkerman et al. [104] and Jew et al. [105], included the presence of government support programs for farming, and the degree of dependency on government subsidies. Conversely, sustainability-threatening decisions, such as “joint farming”, leasing, selling, and converting farmland for other uses, were primarily driven by uncertainties. Corroborating other studies [106,107,108], these uncertainties included the inability to fulfill loan payment schedules, the number of work hours required, and the job requirements for supplementary occupations. Additionally, this study revealed a “gray zone” that could lead to either sustainability-promoting or sustainability-threatening decisions. It included floating factors that could influence ownership decisions in different directions, confirming decision-making dynamics in the context of farmland ownership [109,110,111].
Meanwhile, there were compelling insights into the decision-making tendencies of farmland owners, particularly in relation to their farming sustainability. In general, a healthy willingness to continue farming activities was exhibited by the landowners, indicating preferential considerations to maintaining their current agricultural activities. Supporting other studies [10,112], sustainability-leading decisions were remarkably represented by the strong willingness of farmland owners to engage in farming businesses. These decisions, therefore, appear to represent the safest mechanism that allows farmers to focus on their core competence: agriculture. On the other hand, the second group, i.e., sustainability-threatening decisions, exhibited a trend away from maintaining owned farmland. The interesting finding here was the noticeable inclination toward “joint farming” and “leasing” decisions, both belonging to this second group. Corroborating previous findings [113,114], this suggests a shift in the preferences of farmland owners toward entering partnerships with more active or larger-scale farmers. The original landowners opted to relinquish the day-to-day management of their farmlands to their farming partners, allowing the partners to continue utilizing the lands for agricultural purposes. In a situation such as this, the original owners chose to distance themselves from direct farming activities (on-farm) or related businesses (ex-farm). It indicates a notable shift in cognitive preferences concerning land management, highlighting, as also noted in other research [115,116], a transition from direct farming to partnership-based farming.
Moreover, numerous research has suggested farmland conservation to mitigate uncontrolled regional growth [16,117,118,119]. Ownership decisions that help sustain farming activities are not only desirable, but also crucial for agricultural sustainability, food security, and environmental protection. In this research, the “keep farming” decision appeared to involve a complex decision-making process influenced by various cognitive factors. Corroborating previous studies, this study has identified three main considerations that influence the decision to continue farming: farming capital [120], infrastructure [121], and certain non-farming factors [122]. Considering these issues, decisions such as “leasing” and “joint farming” might appear attractive due to their economic benefits and smaller amount of resources required. However, these alternatives share similar reasoning with “selling” and “converting”, making them potentially risky options to suggest to farmers. In promoting sustainability-inducing decisions, the government’s role in farmland conservation is pivotal. Any policy or strategy designed to conserve farmland must consider the cognitive concerns and implicit values of farmland owners. Farmland owners are not just economic actors; they are integral to their communities [123] and have the right to human wellbeing [124]. If the government designates their land as conserved, the owners must continue farming. If they decide to cease farming, they must sell the land to other farmers. This decision, however, is not a simple one to make.
In terms of research limitations, the multi-grid analysis ignored the personal identities of the respondents. As a result, the group profile was treated as the reference baseline instead of personal profiles. Driving forces were derived from the average scores of individual grids, implying that the drivers occurred at the individual level. Interaction between individuals and groups or communities, as in previous studies [125,126], might produce different results. Those multi-actor interactions were developed at the individual level but eventually formed group patterns, meaning that personal opinions remained needed to establish regional interventions. Since this study focused on individual-level construct-element links, the findings would work for individual-focused interventions, such as altering individual farmland owner decisions. Basically, the results of RGT are limited to cases with similar spatial and group profiles. Interventions at more macro levels may use these results, but more consideration is required, because these constructs reflect personal cognition rather than communal agreements. Furthermore, as suggested by other research [125,127], the fact that individual farmland owners establish communities with people from various personal and occupational backgrounds should be carefully considered. However, if the target of an intervention is homogenous (i.e., only farmland owners), it could be easier to adopt the results immediately. Of course, related stakeholders should be identified to reduce the noise and other unexpected effects.

6. Conclusions

The land is not just a physical space: it also holds socio-cultural significance. It provides resources for livelihoods and supports various industries. In the agriculture sector, access to and quality of farmland are crucial for sustainable food production and food security. Farmland ownership grants immediate access to resources, provides wealth-generation opportunities, and encourages sustainable practices. Ownership decisions can impact the structure and sustainability of the agricultural sector, as expanding, selling, or converting farmland can have socio-economic and environmental implications. Factors such as aging farm owners, financial needs, lack of successors, urbanization, and land policy influence farmland ownership decisions. Understanding the driving factors behind the decisions, including cognitive factors and hidden constructs, is vital for sustainable agriculture. Previous studies have primarily focused on socio-economic factors, and they have also applied simplistic treatment of these factors as mere quantitative variables, neglecting the roles of cognitive factors and implicit values deeply underlying ownership decisions. This study aimed to uncover these hidden constructs impacting individual ownership preferences, proposing an alternative approach that could enrich subsequent statistical analyses and yield more comprehensive results. This research thus sought to answer research questions related to discovering implicit values, identifying hidden constructs, and understanding their relationship to preferential ownership decisions.
Answering the first research question, this study used the Repertory Grid Technique in conjunction with Principal Component Analysis to help discover the cognition and implicit values of individual farmland owners that could influence their ownership decisions. Answering the second research question, this study found 85 constructs leading to six different ownership decisions: “keep farming”, “joint farming”, leasing, buying, selling, and converting. The staggering number of hidden constructs and six preferential decisions necessitated the use of PCA to expose the relationships between the constructs and the decisions. Answering the third research question, this study found two groups of decisions and their associated driving forces: those leading to and those threatening farming sustainability. Sustainability-leading decisions (i.e., buying and keep farming) were primarily driven by the availability of successors, soil quality, the farming system, the education of the farmers’ children, farm yield and its quality, the dependency on subsidies, and the support of farming programs from the government. Meanwhile, sustainability-threatening decisions (i.e., joint farming, leasing, selling, and converting) were driven mainly by the uncertain payment day, work hours, and job requirements for side jobs. The results also generated a gray zone involving floating issues that could lead to divergent decision groups, making them able to result in either sustainability-leading or sustainability-threatening decisions.
Derived from personal cognition, the driving forces reflected the respondents’ deeply personal opinions, which have typically been ignored. Discovering the factors and their relationships to preferential decisions allows observers to understand how the respondents thought about regional growth and agricultural sustainability. Looking at how RGT was able to feed enriched inputs to the PCA, the methodology used in this study could influence future research methods in this field. It could encourage a more holistic approach to studying land use and ownership, considering qualitative factors such as personal preferences and cognitive factors leading to quantitative findings from statistical analyses. Additionally, the findings of this study could inform strategies for regional development and sustainable agriculture in Indonesia. Understanding cognitive factors that influence preferential ownership decisions could help in designing interventions to encourage sustainable practices among landowners. Then, the findings may influence land use policies, particularly those related to farmland ownership. Applying similar processes to other regions in Indonesia could help tailor policies to area-specific farmland ownership issues in pursuing sustainable agriculture within certain regions. Long-term policies based on the findings could also be designed to support sustainable agricultural practices and secure food production in larger geographical areas, including provincial or national levels.

Author Contributions

Conceptualization, A.R.T.H., C.P.M.S. and S.H. (Satoshi Hoshino); methodology, A.R.T.H. and S.H. (Satoshi Hoshino); software, A.R.T.H., C.P.M.S. and S.H. (Satoshi Hoshino); validation, C.P.M.S., S.H. (Shizuka Hashimoto), S.H. (Satoshi Hoshino), M.D. and A.E.Y.; formal analysis, A.R.T.H., C.P.M.S. and S.H. (Satoshi Hoshino); investigation, A.R.T.H.; resources, A.R.T.H. and S.H. (Satoshi Hoshino); data curation, A.R.T.H. and C.P.M.S.; writing—original draft preparation, A.R.T.H. and C.P.M.S.; writing—review and editing, A.R.T.H., C.P.M.S., S.H. (Shizuka Hashimoto), S.H. (Satoshi Hoshino), M.D. and A.E.Y.; visualization, A.R.T.H. and C.P.M.S.; supervision, S.H. (Shizuka Hashimoto) and S.H. (Satoshi Hoshino); project administration, A.R.T.H.; funding acquisition, A.R.T.H. and S.H. (Satoshi Hoshino). All authors have read and agreed to the published version of the manuscript.

Funding

This research was funded by the Directorate General of Higher Education (DIKTI), Ministry of Culture and Education, Republic of Indonesia. The field survey was funded by the Laboratory of Rural Planning, Graduate School of Agriculture, Kyoto University.

Data Availability Statement

Datasets used in this study are available on request.

Acknowledgments

All authors would like to thank all respondents in Gayam, Ngampel, and Pojok villages, Kediri, who participated in the field surveys.

Conflicts of Interest

The authors declare no conflict of interest. The funder had no role in the design of the study; in the collection, analyses, or interpretation of data; in the writing of the manuscript; or in the decision to publish the results.

Appendix A

Table A1. Initial and elicited constructs, including their direct relevance.
Initial ConstructsElicited Constructs
NameCodeNo.Name
Household sizeG11Daily expenses
2Availability of unpaid laborers
Education level of farmland ownersG23Intellectuality
4Ability of interpret information
Farming experienceG35Farming ability
6Fertilization skill
7Pest management skill
8Seed selection skill
Availability of successor(s)G49Availability of successor(s)
10Farming experience of the successor(s)
11Presence of expected successor(s)
12Presence of expected successor(s) in the family
Education level of the successor(s)G513Prioritizing formal education
14Education level of the successor(s)
15Agricultural knowledge of the successor(s)
16Intellectuality of the successor(s)
Social management for farmingG617Cashflow record
18Customs related to farming practices
19Presence of farmer groups
20Leadership election
Contribution to the local communityG721Contribution to job opportunity
22Effect to local activities
Participation in community activitiesG823Frequency of knowledge sharing
24Frequency of group discussion
Participation in governments’ programsG925Response to governments’ programs
26Effectiveness of governments’ programs
IncomeG1027Income level
28Trend of income
29Diversified income
Side job(s)G1130Income level of side job
31Side job opportunity
32Workload
33Diverse income sources
34Payday schedule
LaborersG1235Availability of laborers
36Salary level of laborers
37Labor management
38Needs of transport workers
39Labor’s skill
Job opportunityG1340Job opportunity
41Level of job requirements
42Salary level
43Work hours
Input pricesG1444Level of farming capitals
45Availability of farmer loan programs
46Loan threat
Output pricesG1547Trend of output prices
48Dependency to seasonal prices
49Satisfactory toward output prices
ProductivityG1650Yield
51Quality of rice
52Percentage rice losses
Regional minimum wageG1753Fulfillment of daily needs
54Worse than other side jobs
55Trend of regional minimum wage
Loan programs for farmersG1856Advantage of loan programs
57Loan accessibility
58Payback due date
Agricultural subsidiesG1959Accessibility of subsidies
60Amount of subsidies
61Distribution of subsidies
62Fuel subsidies
Farmland sizeG2063Prestige
64Tenure system
65Irrigation system
Soil qualityG2166Soil quality
67Trend of soil quality
68Access to main road
Distance to main roadG2269Road condition
70Transportation cost
Distance to marketG2371Transportation availability
Family participation in farming activitiesG2472Family participation in farming activities
73Willingness of expected successors
Tools and technologyG2574Farming tools
75Farming systems
76Understanding of modern farming systems
77Information technology for weather forecasts
Farmland conversionG2678Impact of farmland conversion on farming activities
79Impact from household waste
80Impact to soil quality
81Possibility of farmland conversion
82Impact of landowner change
Farming guidanceG2783Instructors’ dedication
84Innovative behavior of instructors
85Instructors’ capability

References

  1. Fairclough, G. Essentially Cultural: Perspectives on Landscape from Europe. Landsc. J. 2016, 35, 149–166. [Google Scholar] [CrossRef]
  2. Haberl, H.; Erb, K.H.; Krausmann, F.; Gaube, V.; Bondeau, A.; Plutzar, C.; Gingrich, S.; Lucht, W.; Fischer-Kowalski, M. Quantifying and mapping the human appropriation of net primary production in earth’s terrestrial ecosystems. Proc. Natl. Acad. Sci. USA 2007, 104, 12942–12947. [Google Scholar] [CrossRef]
  3. Beyene, A.; Gibbon, D.; Haile, M. Heterogeneity in land resources and diversity in farming practices in Tigray, Ethiopia. Agric. Syst. 2006, 88, 61–74. [Google Scholar] [CrossRef]
  4. Chagutah, T. Land tenure insecurity, vulnerability to climate-induced disaster and opportunities for redress in southern Africa. Jàmbá J. Disaster Risk Stud. 2013, 5, 8. [Google Scholar] [CrossRef]
  5. Leigh, J.E.G.; Vermeij, G.J.; Wikelski, M. What do human economies, large islands and forest fragments reveal about the factors limiting ecosystem evolution? J. Evol. Biol. 2009, 22, 1–12. [Google Scholar] [CrossRef] [PubMed]
  6. Kidman, J. The Land Remains. Altern. Int. J. Indig. Peoples 2012, 8, 189–202. [Google Scholar] [CrossRef]
  7. Pawlak, K.; Kołodziejczak, M. The Role of Agriculture in Ensuring Food Security in Developing Countries: Considerations in the Context of the Problem of Sustainable Food Production. Sustainability 2020, 12, 5488. [Google Scholar] [CrossRef]
  8. Ntihinyurwa, P.D.; de Vries, W.T. Farmland Fragmentation, Farmland Consolidation and Food Security: Relationships, Research Lapses and Future Perspectives. Land 2021, 10, 129. [Google Scholar] [CrossRef]
  9. Kang, M.; Schwab, B.; Yu, J. Gender differences in the relationship between land ownership and managerial rights: Implications for intrahousehold farm labor allocation. World Dev. 2020, 125, 104669. [Google Scholar] [CrossRef]
  10. Jayne, T.S.; Muyanga, M.; Wineman, A.; Ghebru, H.; Stevens, C.; Stickler, M.; Chapoto, A.; Anseeuw, W.; van der Westhuizen, D.; Nyange, D. Are medium-scale farms driving agricultural transformation in sub-Saharan Africa? Agric. Econ. 2019, 50, 75–95. [Google Scholar] [CrossRef]
  11. Oyetunde-Usman, Z.; Olagunju, K.O.; Ogunpaimo, O.R. Determinants of adoption of multiple sustainable agricultural practices among smallholder farmers in Nigeria. Int. Soil Water Conserv. Res. 2021, 9, 241–248. [Google Scholar] [CrossRef]
  12. Griffin, B.; Hartarska, V.; Nadolnyak, D. Retirement Age Farmers’ Exit and Disinvestment from Farming. Int. J. Econ. Financ. 2019, 11, 136. [Google Scholar] [CrossRef]
  13. Kevane, M. Agrarian Structure and Agricultural Practice: Typology and Application to Western Sudan. Am. J. Agric. Econ. 1996, 78, 236–245. [Google Scholar] [CrossRef]
  14. Grubbström, A.; Eriksson, C. Retired Farmers and New Land Users: How Relations to Land and People Influence Farmers’ Land Transfer Decisions. Sociol. Rural. 2018, 58, 707–725. [Google Scholar] [CrossRef]
  15. Hazell, P.; Poulton, C.; Wiggins, S.; Dorward, A. The Future of Small Farms: Trajectories and Policy Priorities. World Dev. 2010, 38, 1349–1361. [Google Scholar] [CrossRef]
  16. Huang, Z.; Du, X.; Castillo, C.S.Z. How does urbanization affect farmland protection? Evidence from China. Resour. Conserv. Recycl. 2019, 145, 139–147. [Google Scholar] [CrossRef]
  17. Islam, M.; Jannat, A.; Dhar, A.R.; Ahamed, T. Factors determining conversion of agricultural land use in Bangladesh: Farmers’ perceptions and perspectives of climate change. GeoJournal 2020, 85, 343–362. [Google Scholar] [CrossRef]
  18. Milczarek-Andrzejewska, D.; Zawalińska, K.; Czarnecki, A. Land-use conflicts and the Common Agricultural Policy: Evidence from Poland. Land Use Policy 2018, 73, 423–433. [Google Scholar] [CrossRef]
  19. Busck, A.G.; Kristensen, S.P.; Præstholm, S.; Reenberg, A.; Primdahl, J. Land system changes in the context of urbanisation: Examples from the peri-urban area of Greater Copenhagen. Geogr. Tidsskr. J. Geogr. 2006, 106, 21–34. [Google Scholar] [CrossRef]
  20. Deininger, K.; Byerlee, D. The Rise of Large Farms in Land Abundant Countries: Do They Have a Future? World Dev. 2012, 40, 701–714. [Google Scholar] [CrossRef]
  21. Adnan, K.M.M.; Ying, L.; Sarker, S.A.; Yu, M.; Eliw, M.; Sultanuzzaman, R.; Huq, E. Simultaneous adoption of risk management strategies to manage the catastrophic risk of maize farmers in Bangladesh. GeoJournal 2021, 86, 1981–1998. [Google Scholar] [CrossRef]
  22. Mishra, A.K.; El-Osta, H.S. Effect of agricultural policy on succession decisions of farm households. Rev. Econ. Househ. 2008, 6, 285–307. [Google Scholar] [CrossRef]
  23. Twyman, J.; Useche, P.; Deere, C.D. Gendered Perceptions of Land Ownership and Agricultural Decision-making in Ecuador: Who Are the Farm Managers? Land Econ. 2015, 91, 479–500. [Google Scholar] [CrossRef]
  24. Elahi, E.; Zhang, H.; Lirong, X.; Khalid, Z.; Xu, H. Understanding cognitive and socio-psychological factors determining farmers’ intentions to use improved grassland: Implications of land use policy for sustainable pasture production. Land Use Policy 2021, 102, 105250. [Google Scholar] [CrossRef]
  25. Khan, N.A.; Qiao, J.; Abid, M.; Gao, Q. Understanding farm-level cognition of and autonomous adaptation to climate variability and associated factors: Evidence from the rice-growing zone of Pakistan. Land Use Policy 2021, 105, 105427. [Google Scholar] [CrossRef]
  26. Jha, C.K.; Gupta, V. Farmer’s perception and factors determining the adaptation decisions to cope with climate change: An evidence from rural India. Environ. Sustain. Indic. 2021, 10, 100112. [Google Scholar] [CrossRef]
  27. Suharyanto, A.; Hartono, B.; Irwansyah, I.; Tuwu, D.; Umanailo, M.C.B. Marginalization socio farm laborers due to conversion of agriculture land. Cogent Soc. Sci. 2021, 7, 1999563. [Google Scholar] [CrossRef]
  28. Mugumaarhahama, Y.; Mondo, J.M.; Cokola, M.C.; Ndjadi, S.S.; Mutwedu, V.B.; Kazamwali, L.M.; Cirezi, N.C.; Chuma, G.B.; Ndeko, A.B.; Ayagirwe, R.B.B.; et al. Socio-economic drivers of improved sweet potato varieties adoption among smallholder farmers in South-Kivu Province, DR Congo. Sci. Afr. 2021, 12, e00818. [Google Scholar] [CrossRef]
  29. Liu, J.; Jin, X.; Xu, W.; Sun, R.; Han, B.; Yang, X.; Gu, Z.; Xu, C.; Sui, X.; Zhou, Y. Influential factors and classification of cultivated land fragmentation, and implications for future land consolidation: A case study of Jiangsu Province in eastern China. Land Use Policy 2019, 88, 104185. [Google Scholar] [CrossRef]
  30. Rueda, X.; Velez, M.A.; Moros, L.; Rodriguez, L.A. Beyond proximate and distal causes of land-use change: Linking Individual motivations to deforestation in rural contexts. Ecol. Soc. 2019, 24, 4. [Google Scholar] [CrossRef]
  31. Perpiña Castillo, C.; Coll Aliaga, E.; Lavalle, C.; Martínez Llario, J.C. An Assessment and Spatial Modelling of Agricultural Land Abandonment in Spain (2015–2030). Sustainability 2020, 12, 560. [Google Scholar] [CrossRef]
  32. Ellixson, A.; Griffin, T.; Ferrell, S.; Goeringer, P. Legal and Economic Implications of Farm Data: Ownership and Possible Protections. Drake J. Agric. Law 2019, 24, 49. [Google Scholar] [CrossRef]
  33. Dutt, K. Changes in Land Relations in West Bengal. Econ. Political Wkly. 1977, 12, A106–A110. [Google Scholar]
  34. Coughlin, R.E.; Keene, J.C. The Protection of Farmland: An Analysis of Various State and Local Approaches. Land Use Law Zoning Dig. 2011, 33, 5–11. [Google Scholar] [CrossRef]
  35. Wehrwein, C.F. Bonds of Maintenance as Aids in Acquiring Farm Ownership. J. Land Public Util. Econ. 1932, 8, 396. [Google Scholar] [CrossRef]
  36. Lerman, Z.; Shagaida, N. Land policies and agricultural land markets in Russia. Land Use Policy 2007, 24, 14–23. [Google Scholar] [CrossRef]
  37. Wang, Q.; Zhang, X. Three rights separation: China’s proposed rural land rights reform and four types of local trials. Land Use Policy 2017, 63, 111–121. [Google Scholar] [CrossRef]
  38. Lequieu, A.M. Keeping the Farm in the Family Name. Rural Sociol. 2015, 80, 39–59. [Google Scholar] [CrossRef]
  39. Cush, P.; Macken-Walsh, Á. Farming ‘through the ages’: Joint farming ventures in Ireland. Rural Soc. 2016, 25, 104–116. [Google Scholar] [CrossRef]
  40. Katchova, A.L.; Ahearn, M.C. Dynamics of Farmland Ownership and Leasing: Implications for Young and Beginning Farmers. Appl. Econ. Perspect. Policy 2016, 38, 334–350. [Google Scholar] [CrossRef]
  41. Weber, J.G.; Key, N. Leveraging Wealth from Farmland Appreciation: Borrowing, Land Ownership, and Farm Expansion. Land Econ. 2015, 91, 344–361. [Google Scholar] [CrossRef]
  42. Valliant, J.C.; Ruhf, K.Z.; Gibson, K.D.; Brooks, J.; Farmer, J.R. Fostering farm transfers from farm owners to unrelated, new farmers: A qualitative assessment of farm link services. Land Use Policy 2019, 86, 438–447. [Google Scholar] [CrossRef]
  43. Francis, C.A.; Hansen, T.E.; Fox, A.A.; Hesje, P.J.; Nelson, H.E.; Lawseth, A.E.; English, A. Farmland conversion to non-agricultural uses in the US and Canada: Current impacts and concerns for the future. Int. J. Agric. Sustain. 2012, 10, 8–24. [Google Scholar] [CrossRef]
  44. Williams, R.L. Operational Definitions and Assessment of Higher-Order Cognitive Constructs. Educ. Psychol. Rev. 1999, 11, 411–427. [Google Scholar] [CrossRef]
  45. Butt, T. Understanding, explanation, and personal constructs. Pers. Constr. Theory Pract. 2004, 1, 21–27. [Google Scholar]
  46. Feixas, G.; Geldschläger, H.; Neimeyer, R.A. Content analysis of personal constructs. J. Constr. Psychol. 2002, 15, 1–19. [Google Scholar] [CrossRef]
  47. Bannister, D.; Fransella, F. Inquiring Man: The Psychology of Personal Constructs, 3rd ed.; Routledge: Oxon, UK, 2019. [Google Scholar] [CrossRef]
  48. Caputi, P.; Viney, L.L.; Walker, B.M.; Crittenden, N. Personal Construct Methodology; John Wiley & Sons: Oxford, UK, 2012. [Google Scholar] [CrossRef]
  49. Burkitt, I. Social and Personal Constructs. Theory Psychol. 1996, 6, 71–77. [Google Scholar] [CrossRef]
  50. Winter, D.A. Personal Construct Psychology in Clinical Practice: Theory, Research and Applications; Routledge: London, UK, 1992. [Google Scholar]
  51. Ilbery, B.W. Agricultural decision-making. Prog. Hum. Geogr. 1978, 2, 448–466. [Google Scholar] [CrossRef]
  52. Conway, G.R.; Barbie, E.B. After the Green Revolution: Sustainable and equitable agricultural development. Futures 1988, 20, 651–670. [Google Scholar] [CrossRef]
  53. Reytar, K.; Hanson, C.; Henninger, N. Indicators of Sustainable Agriculture: A Scoping Analysis; World Resources Institute: Washington, DC, USA, 2014. [Google Scholar]
  54. Bathaei, A.; Štreimikienė, D. A Systematic Review of Agricultural Sustainability Indicators. Agriculture 2023, 13, 241. [Google Scholar] [CrossRef]
  55. von Böventer, E. Regional Growth Theory. Urban Stud. 1975, 12, 1–29. [Google Scholar] [CrossRef]
  56. Richardson, H.W. Regional Growth Theory: A reply to von Boventer. Urban Stud. 1975, 12, 31–35. [Google Scholar] [CrossRef]
  57. Richardson, H.W. Empirical aspects of regional growth in the United States. Ann. Reg. Sci. 1974, 8, 8–23. [Google Scholar] [CrossRef]
  58. Firman, T. Rural to urban land conversion in Indonesia during boom and bust periods. Land Use Policy 2000, 17, 13–20. [Google Scholar] [CrossRef]
  59. Stumpf, S.A.; London, M. Management Promotions: Individual and Organizational Factors Influencing the Decision Process. Acad. Manag. Rev. 1981, 6, 539–549. [Google Scholar] [CrossRef]
  60. Fairweather, J.S. The Mythologies of Faculty Productivity. J. High. Educ. 2002, 73, 26–48. [Google Scholar] [CrossRef]
  61. Tan, R.; Beckmann, V.; van den Berg, L.; Qu, F. Governing farmland conversion: Comparing China with the Netherlands and Germany. Land Use Policy 2009, 26, 961–974. [Google Scholar] [CrossRef]
  62. Fransella, F.; Bell, R.; Bannister, D. A Manual for Repertory Grid Technique, 2nd ed.; John Wiley & Sons: London, UK, 2004. [Google Scholar]
  63. Bell, R.C. The repertory grid technique. In International Handbook of Personal Construct Psychology; Fransella, F., Ed.; John Wiley & Sons: West Sussex, UK, 2003; pp. 95–103. [Google Scholar] [CrossRef]
  64. Marsden, D.; Littler, D. Repertory grid technique—An interpretive research framework. Eur. J. Mark. 2000, 34, 816–834. [Google Scholar] [CrossRef]
  65. Goffin, K.; Lemke, F.; Koners, U. Identifying Hidden Needs, Creating Breakthrough Products; Palgrave Macmillan: London, UK, 2010; pp. 125–152. [Google Scholar] [CrossRef]
  66. Latta, G.F.; Swigger, K. Validation of the repertory grid for use in modeling knowledge. J. Am. Soc. Inf. Sci. 1992, 43, 115–129. [Google Scholar] [CrossRef]
  67. Ilbery, B.W.; Hornby, R. Repertory Grids and Agricultural Decision-Making: A Mid-Warwickshire Case Study. Geogr. Ann. Ser. B Hum. Geogr. 1983, 65, 77–84. [Google Scholar] [CrossRef]
  68. Briggs, J. An Exploratory Study of Farmers’ Choice of Crops in Central Sudan. Trans. Inst. Br. Geogr. 1985, 10, 170. [Google Scholar] [CrossRef]
  69. Moon, K.; Blackman, D.A.; Adams, V.M.; Kool, J. Perception matrices: An adaptation of repertory grid technique. Land Use Policy 2017, 64, 451–460. [Google Scholar] [CrossRef]
  70. Alexander, P.; van Loggerenberg, J.; Lotriet, H.; Phahlamohlaka, J. The Use of the Repertory Grid for Collaboration and Reflection in a Research Context. Group Decis. Negot. 2010, 19, 479–504. [Google Scholar] [CrossRef]
  71. Tan, F.B.; Hunter, M.G. The Repertory Grid Technique: A Method for the Study of Cognition in Information Systems. MIS Q. 2002, 26, 39–57. [Google Scholar] [CrossRef]
  72. Beail, N. Repertory Grid Technique and Personal Constructs: Applications in Clinical and Educational Setting; Croom Helm: Beckenham, UK, 1985; 50p. [Google Scholar] [CrossRef]
  73. Saúl, L.A.; López-González, M.A.; Moreno-Pulido, A.; Corbella, S.; Compañ, V.; Feixas, G. Bibliometric Review of the Repertory Grid Technique: 1998–2007. J. Constr. Psychol. 2012, 25, 112–131. [Google Scholar] [CrossRef]
  74. Harrison, J.N.; Sarre, P. Personal Construct Theory I N the Measurement of Environmental Images. Environ. Behav. 1975, 7, 3–58. [Google Scholar] [CrossRef]
  75. Honikman, B. Environmental Evaluation. J. Arch. Educ. 1976, 29, 14–15. [Google Scholar] [CrossRef]
  76. Fenton, M.; Pearce, P. Multidimensional scaling and tourism research. Ann. Tour. Res. 1988, 15, 236–254. [Google Scholar] [CrossRef]
  77. Fenton, D.M. Dimensions of meaning in the perception of natural settings and their relationship to aesthetic response. Aust. J. Psychol. 1985, 37, 325–339. [Google Scholar] [CrossRef]
  78. Shaw, M.L.G.; McKnight, C. Think Again: Personal Problem-Solving and Decision-Making; Prentice-Hall: Bergen, NJ, USA, 1981. [Google Scholar]
  79. Kelly, G. The Psychology of Personal Constructs (Volume 2: Clinical Diagnosis and Psychotherapy); Routledge: London, UK, 2003. [Google Scholar]
  80. Kelly, G. The Psychology of Personal Constructs (Volume 1: A Theory of Personality); Routledge: London, UK, 1991. [Google Scholar]
  81. Wright, R.P. Eliciting Cognitions of Strategizing Using Advanced Repertory Grids in a World Constructed and Reconstructed. Organ. Res. Methods 2008, 11, 753–769. [Google Scholar] [CrossRef]
  82. Tongco, M.D.C. Purposive Sampling as a Tool for Informant Selection. Ethnobot. Res. Appl. 2007, 5, 147–158. [Google Scholar] [CrossRef]
  83. Sandelowski, M. One is the liveliest number: The case orientation of qualitative research. Res. Nurs. Health 1996, 19, 525–529. [Google Scholar] [CrossRef]
  84. Crouch, M.; McKenzie, H. The logic of small samples in interview-based qualitative research. Soc. Sci. Inf. 2006, 45, 483–499. [Google Scholar] [CrossRef]
  85. Zuber-Skerritt, O.; Roche, V. A constructivist model for evaluating postgraduate supervision: A case study. Qual. Assur. Educ. 2004, 12, 82–93. [Google Scholar] [CrossRef]
  86. Rogers, B.; Ryals, L. Using the repertory grid to access the underlying realities in key account relationships. Int. J. Mark. Res. 2007, 49, 595–612. [Google Scholar] [CrossRef]
  87. Osterberg-Kaufmann, N. Innovating Empirical Research on Legitimacy: Repertory Grid Analysis. Front. Politi-Sci. 2022, 4, 832250. [Google Scholar] [CrossRef]
  88. Stake, R.E. Multiple Case Study Analysis; Guilford Press: New York, NY, USA, 2006. [Google Scholar]
  89. Sari, K.E.; Deswita, F.V. The mapping of sustainable food agriculture land in Kediri City. IOP Conf. Ser. Earth Environ. Sci. 2019, 361, 012027. [Google Scholar] [CrossRef]
  90. Wanto, H.S. The Effect of Organizational Culture and Organizational Learning towards the Competitive Strategy and Company Performance (Case Study of East Java SMEs in Indonesia: Food and Beverage Industry). Inf. Manag. Bus. Rev. 2012, 4, 467–476. [Google Scholar] [CrossRef]
  91. Statistics Indonesia. Luas Panen, Produksi, dan Produktivitas Padi Menurut Provinsi 2020–2022; Bapan Pusat Statistik (BPS): Jakarta, Indonesia, 2023. [Google Scholar]
  92. Putra, A.D.K. Kajian Faktor-Faktor Yang Mempengaruhi Petani Dalam Alih Fungsi Lahan Pertanian Di Kecamatan Pesantren Kota Kediri; Brawijaya University: Malang, Indonesia, 2017. [Google Scholar]
  93. Sekaranom, A.B.; Purnama, I.S.; Cahyadi, A.; Andika, N.; Febriarta, E.; Nurjani, E.; Firmansyah, A.J.; Maghfiroh, A.; Larasati, C.; Septyo, N.D. Analysis of Surface Water Availability to Meet Agricultural Water Demands in Kediri Regency, Indonesia. ASEAN J. Sci. Technol. Dev. 2022, 39, 111–118. [Google Scholar] [CrossRef]
  94. Rahman, R.; Bidoun, D.; Agiel, A.; Albdour, A. Advancing the use of the repertory grid technique in the built environment: A systematic review. Front. Built Environ. 2022, 8, 1082149. [Google Scholar] [CrossRef]
  95. Connell, J.; Carlton, J.; Grundy, A.; Buck, E.T.; Keetharuth, A.D.; Ricketts, T.; Barkham, M.; Robotham, D.; Rose, D.; Brazier, J. The importance of content and face validity in instrument development: Lessons learnt from service users when developing the Recovering Quality of Life measure (ReQoL). Qual. Life Res. 2018, 27, 1893–1902. [Google Scholar] [CrossRef] [PubMed]
  96. Siau, K.; Tan, X.; Sheng, H. Important characteristics of software development team members: An empirical investigation using Repertory Grid. Inf. Syst. J. 2010, 20, 563–580. [Google Scholar] [CrossRef]
  97. Grice, J.W. Idiogrid: Software for the management and analysis of repertory grids. Behav. Res. Methods Instrum. Comput. 2002, 34, 338–341. [Google Scholar] [CrossRef] [PubMed]
  98. Cattell, R.B. The Scree Test For The Number of Factors. Multivar. Behav. Res. 1966, 1, 245–276. [Google Scholar] [CrossRef] [PubMed]
  99. Öz, N.Y.; Demirkan, H. Strategic Decision Support for Urban Service Design. Open House Int. 2019, 44, 17–24. [Google Scholar] [CrossRef]
  100. Shahzad, M.A.; Abubakr, S.; Fischer, C. Factors Affecting Farm Succession and Occupational Choices of Nominated Farm Successors in Gilgit-Baltistan, Pakistan. Agriculture 2021, 11, 1203. [Google Scholar] [CrossRef]
  101. Foguesatto, C.R.; Mores, G.d.V.; Kruger, S.D.; Costa, C. Will I have a potential successor? Factors influencing family farming succession in Brazil. Land Use Policy 2020, 97, 104643. [Google Scholar] [CrossRef]
  102. Hou, D.; Bolan, N.S.; Tsang, D.C.; Kirkham, M.B.; O’Connor, D. Sustainable soil use and management: An interdisciplinary and systematic approach. Sci. Total Environ. 2020, 729, 138961. [Google Scholar] [CrossRef]
  103. Christel, A.; Maron, P.-A.; Ranjard, L. Impact of farming systems on soil ecological quality: A meta-analysis. Environ. Chem. Lett. 2021, 19, 4603–4625. [Google Scholar] [CrossRef]
  104. Bekkerman, A.; Belasco, E.J.; Smith, V.H. Does Farm Size Matter? Distribution of Crop Insurance Subsidies and Government Program Payments across U.S. Farms. Appl. Econ. Perspect. Policy 2019, 41, 498–518. [Google Scholar] [CrossRef]
  105. Jew, E.K.; Whitfield, S.; Dougill, A.J.; Mkwambisi, D.D.; Steward, P. Farming systems and Conservation Agriculture: Technology, structures and agency in Malawi. Land Use Policy 2020, 95, 104612. [Google Scholar] [CrossRef]
  106. Lence, S.H. Farmland Prices: Is This Time Different? Appl. Econ. Perspect. Policy 2014, 36, 577–603. [Google Scholar] [CrossRef]
  107. Su, W.; Eriksson, T.; Zhang, L. Off-farm employment, land renting and concentration of farmland in the process of urbanization. China Agric. Econ. Rev. 2018, 10, 338–350. [Google Scholar] [CrossRef]
  108. Wang, Y.; Li, X.; Xin, L.; Tan, M. Farmland marginalization and its drivers in mountainous areas of China. Sci. Total Environ. 2020, 719, 135132. [Google Scholar] [CrossRef] [PubMed]
  109. Hu, Q.; Zillig, L.M.P.; Lynne, G.D.; Tomkins, A.J.; Waltman, W.J.; Hayes, M.J.; Hubbard, K.G.; Artikov, I.; Hoffman, S.J.; Wilhite, D.A. Understanding Farmers’ Forecast Use from Their Beliefs, Values, Social Norms, and Perceived Obstacles. J. Appl. Meteorol. Clim. 2006, 45, 1190–1201. [Google Scholar] [CrossRef]
  110. Kalinda, T.; Filson, G.; Shute, J. Resources, household decision making and organisation of labour in food production among small-scale farmers in southern Zambia. Dev. S. Afr. 2000, 17, 165–174. [Google Scholar] [CrossRef]
  111. Noack, F.; Larsen, A. The contrasting effects of farm size on farm incomes and food production. Environ. Res. Lett. 2019, 14, 084024. [Google Scholar] [CrossRef]
  112. Zhou, T.; Koomen, E.; Ke, X. Determinants of Farmland Abandonment on the Urban–Rural Fringe. Environ. Manag. 2020, 65, 369–384. [Google Scholar] [CrossRef]
  113. Rogers, S.; Wilmsen, B.; Han, X.; Wang, Z.J.-H.; Duan, Y.; He, J.; Li, J.; Lin, W.; Wong, C. Scaling up agriculture? The dynamics of land transfer in inland China. World Dev. 2021, 146, 105563. [Google Scholar] [CrossRef]
  114. Muyombano, E.; Espling, M. Land use consolidation in Rwanda: The experiences of small-scale farmers in Musanze District, Northern Province. Land Use Policy 2020, 99, 105060. [Google Scholar] [CrossRef]
  115. Asiama, K.O.; Voss, W.; Bennett, R.; Rubanje, I. Land consolidation activities in Sub-Saharan Africa towards the agenda 2030: A tale of three countries. Land Use Policy 2021, 101, 105140. [Google Scholar] [CrossRef]
  116. Duan, J.; Ren, C.; Wang, S.; Zhang, X.; Reis, S.; Xu, J.; Gu, B. Consolidation of agricultural land can contribute to agricultural sustainability in China. Nat. Food 2021, 2, 1014–1022. [Google Scholar] [CrossRef] [PubMed]
  117. Caldwell, W.; Epp, S.; Wan, X.; Singer, R.; Drake, E.; Sousa, E.C. Farmland Preservation and Urban Expansion: Case Study of Southern Ontario, Canada. Front. Sustain. Food Syst. 2022, 6, 777816. [Google Scholar] [CrossRef]
  118. Hidayat, A.R.T.; Surjono, S.; Kurniawan, E.B. Pengaruh Keberadaan Kampung Inggris Terhadap Guna Lahan dan Sosial ekonomi Masyarakat di Desa Tulung Rejo dan Desa Pelem, Kabupaten Kediri. J. Tata Kota Dan Drh. 2012, 3, 11–18. [Google Scholar]
  119. Amponsah, O.; Blija, D.K.; Ayambire, R.A.; Takyi, S.A.; Mensah, H.; Braimah, I. Global urban sprawl containment strategies and their implications for rapidly urbanising cities in Ghana. Land Use Policy 2022, 114, 105979. [Google Scholar] [CrossRef]
  120. Myeni, L.; Mokhele, M.; Mulalo, T.; Mulalo, R.; Lebohang, M. Barriers Affecting Sustainable Agricultural Productivity of Smallholder Farmers in the Eastern Free State of South Africa. Sustainability 2019, 11, 3003. [Google Scholar] [CrossRef]
  121. Hailu, Y.G.; Brown, C. Regional Growth Impacts on Agricultural Land Development: A Spatial Model for Three States. Agric. Resour. Econ. Rev. 2007, 36, 149–163. [Google Scholar] [CrossRef]
  122. Fami, H.S.; Amghani, M.S.; Savari, M.; Nasrabadi, M.M.; Moetaghed, M. The Role of Non-Farming Activities in the Sustainability of Peasant Farming Systems: A Case in Osku County. Int. J. Agric. Manag. Dev. 2021, 11, 297–312. [Google Scholar]
  123. Chaudhuri, S.; Roy, M.; McDonald, L.M.; Emendack, Y. Reflections on farmers’ social networks: A means for sustainable agricultural development? Environ. Dev. Sustain. 2021, 23, 2973–3008. [Google Scholar] [CrossRef]
  124. Castle, S.E.; Miller, D.C.; Ordonez, P.J.; Baylis, K.; Hughes, K. The impacts of agroforestry interventions on agricultural productivity, ecosystem services, and human well-being in low- and middle-income countries: A systematic review. Campbell Syst. Rev. 2021, 17, e1167. [Google Scholar] [CrossRef]
  125. Duangjai, W.; Schmidt-Vogt, D.; Shrestha, R.P. Farmers’ land use decision-making in the context of changing land and conservation policies: A case study of Doi Mae Salong in Chiang Rai Province, Northern Thailand. Land Use Policy 2015, 48, 179–189. [Google Scholar] [CrossRef]
  126. Duguma, L.A.; Hager, H. Farmers’ Assessment of the Social and Ecological Values of Land Uses in Central Highland Ethiopia. Environ. Manag. 2011, 47, 969–982. [Google Scholar] [CrossRef] [PubMed]
  127. Rajpar, H.; Zhang, A.; Razzaq, A.; Mehmood, K.; Pirzado, M.B.; Hu, W. Agricultural Land Abandonment and Farmers’ Perceptions of Land Use Change in the Indus Plains of Pakistan: A Case Study of Sindh Province. Sustainability 2019, 11, 4663. [Google Scholar] [CrossRef]
Figure 1. Workflow of the Repertory Grid Technique.
Land 12 01847 g001
Figure 2. Research design.
Land 12 01847 g002
Figure 3. Gayam, Ngampel, and Pojok villages (iv) in Kediri (iii), East Java (ii), Indonesia (i).
Land 12 01847 g003
Figure 4. Example of an expandable form for the repertory grid.
Land 12 01847 g004
Figure 5. Socio-economic profiles of the respondents.
Land 12 01847 g005
Figure 6. Initial results of eigenvalues for the elements.
Land 12 01847 g006
Table 1. Research variables as superficial constructs.
CategoriesVariablesDimensions
Household
condition
Household sizeSocial
Education level of farmland owners
Farming experience
Availability of successor(s)
Education level of the successor(s)
IncomeEconomic
Side job(s)
Farmland sizeSpatial
Soil quality
Family participation in farming activitiesAgricultural practice
Agricultural
sustainability
Social management for farming Social
Contribution to the local community
Regional minimum wage Economic
Laborers
Tools and technologyAgricultural practice
Regional
growth
Participation in community activitiesSocial
Participation in governments programs
Job opportunity Economic
Input price
Output price
Productivity
Distance to the main roadSpatial
Distance to market
Farmland conversionAgricultural practice
PolicyLoan programs for farmers Economic
Agricultural subsidies
Farming guidanceAgricultural practice
Table 2. Descriptive analysis of elements (decisions).
DecisionNMinimumMaximumMeanStd. Deviation
Keep farming852.134.303.28250.47900
Buying851.884.683.74620.66926
Joint farming852.203.532.90720.33031
Leasing852.003.572.84410.32851
Selling852.053.672.73670.43217
Converting851.303.732.59620.63472
Valid N (listwise)85
Disclaimer/Publisher’s Note: The statements, opinions and data contained in all publications are solely those of the individual author(s) and contributor(s) and not of MDPI and/or the editor(s). MDPI and/or the editor(s) disclaim responsibility for any injury to people or property resulting from any ideas, methods, instructions or products referred to in the content.

