


Natural Dose of Blue Restoration: A Field Experiment on Mental Restoration of Urban Blue Spaces

 ,
,  , , , and
Abstract
:1. Introduction
1.1. Urban Health Problems and Blue-Green Solutions
1.2. Lack of Empirical Studies on the Restorative Effects of Urban Blue Space
1.3. Restorative Effects May Differ between UBSs
1.4. The Current Research Objectives
2. Methodology
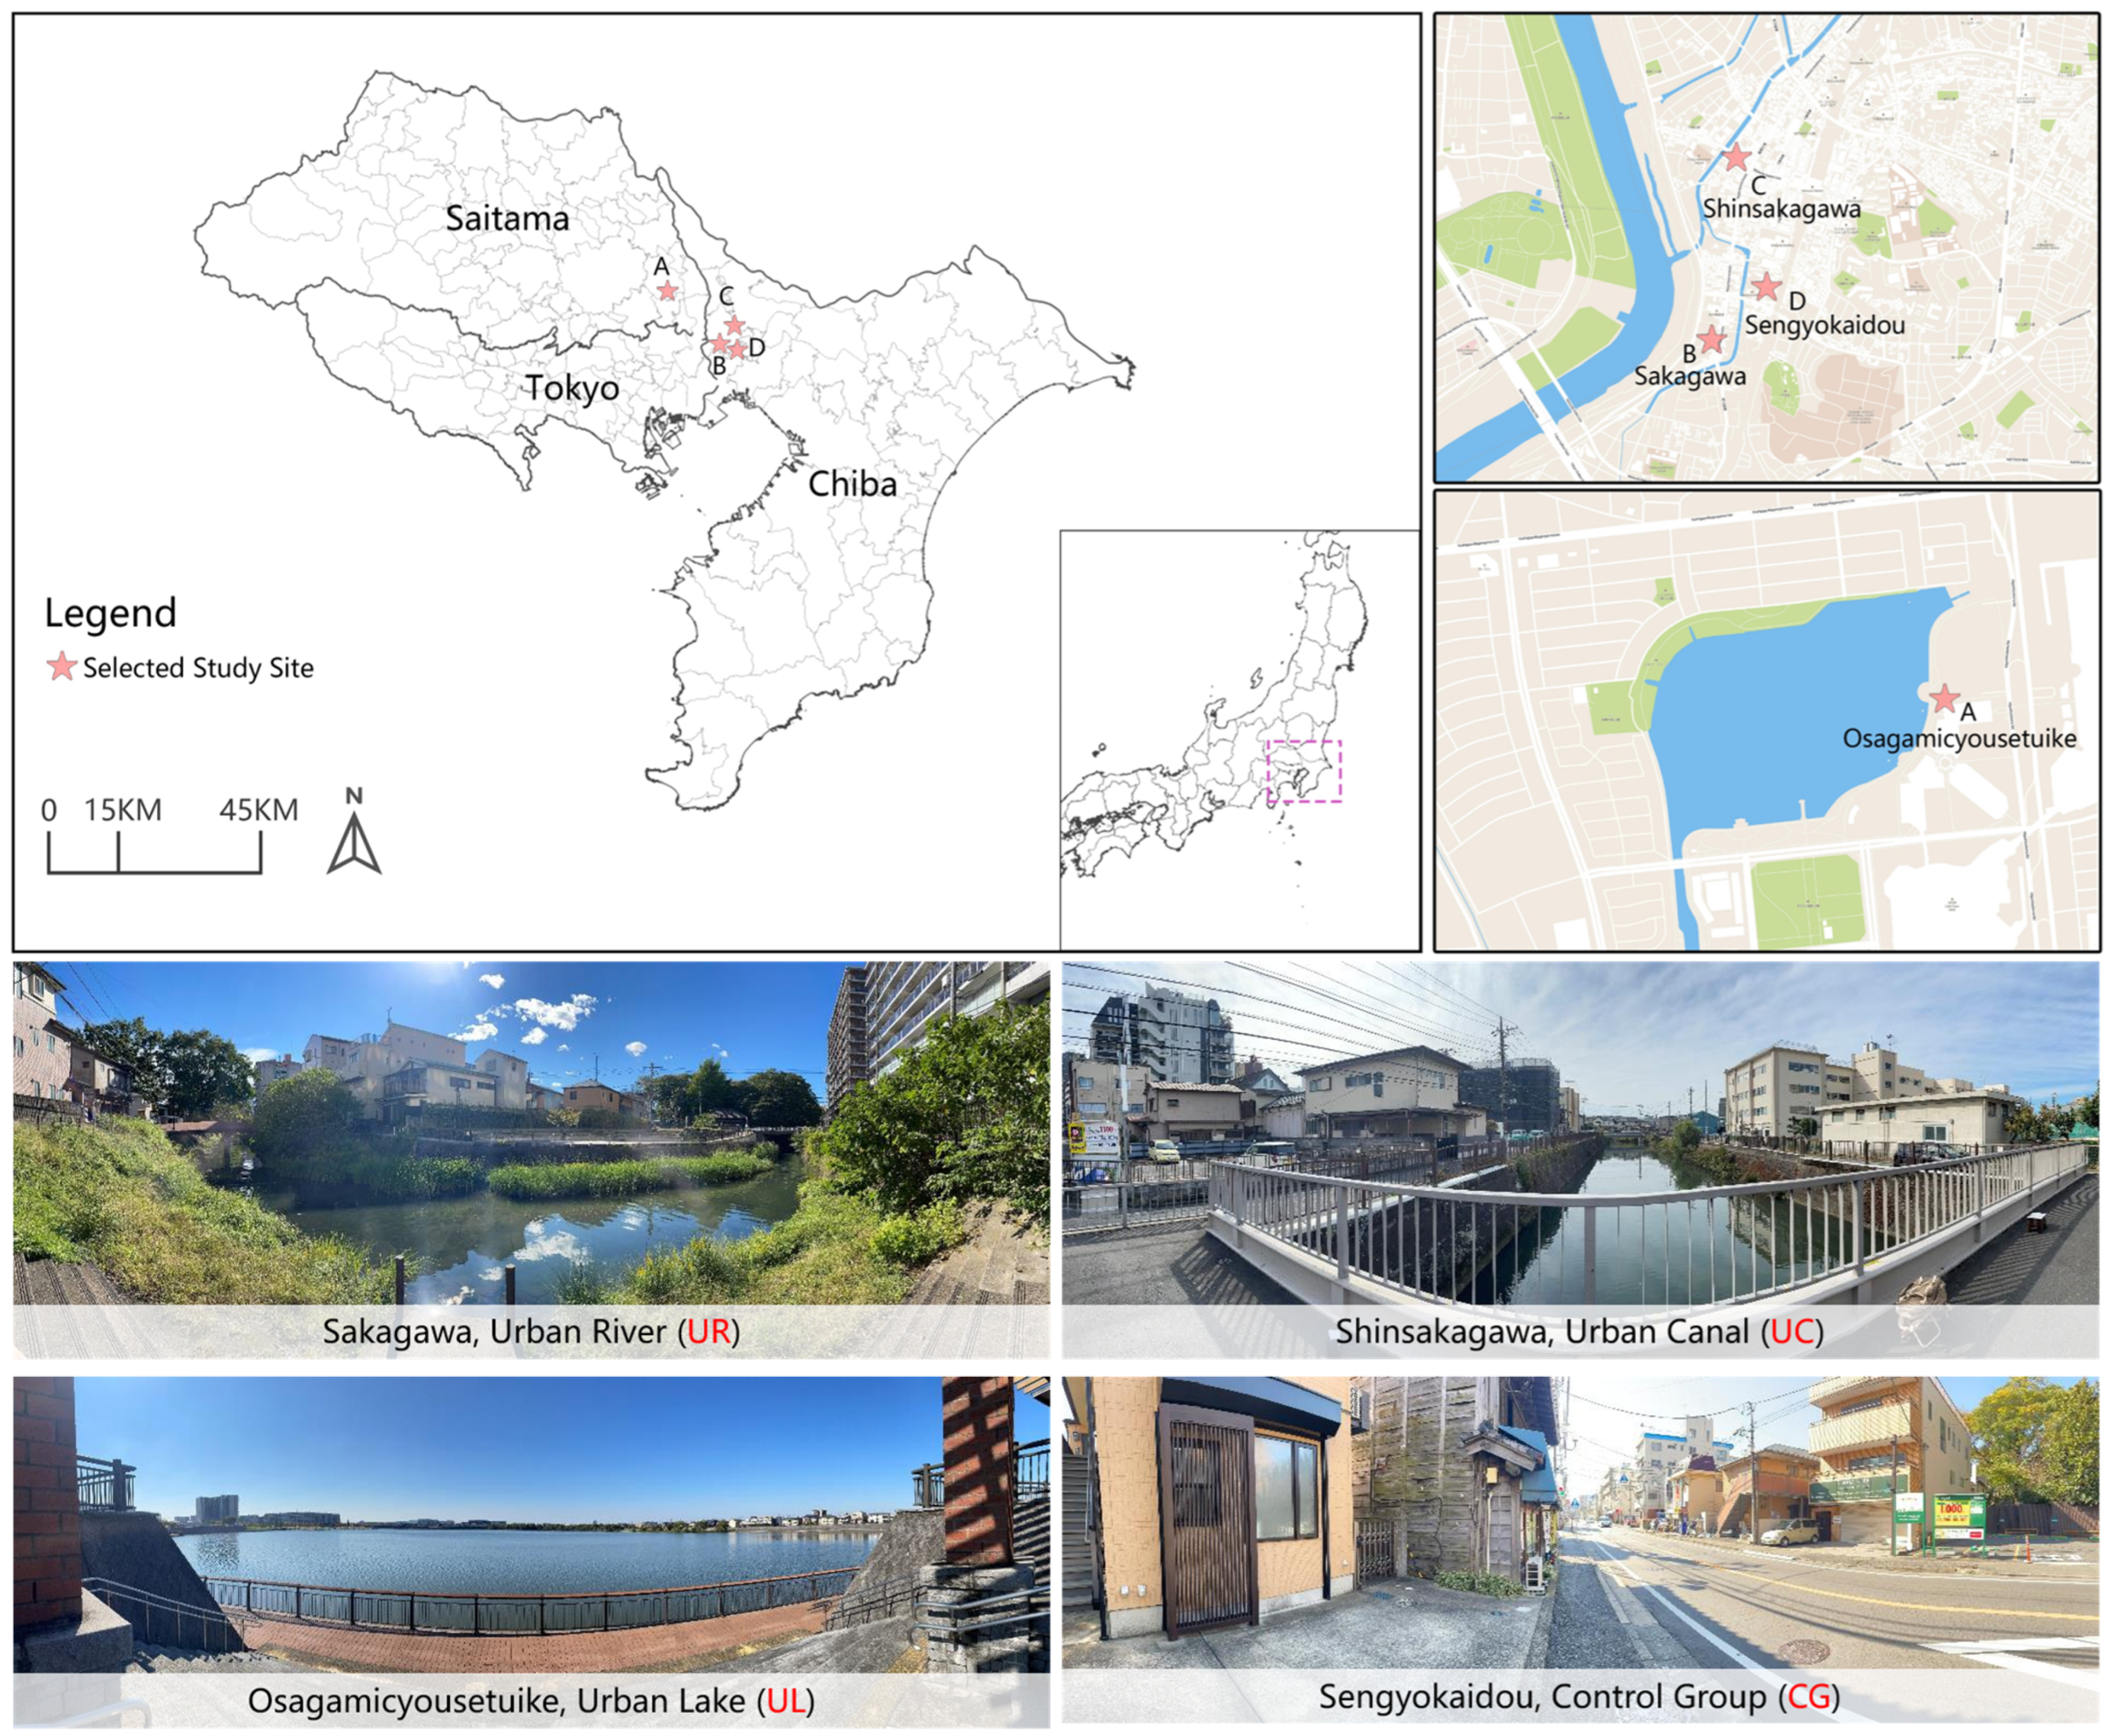
2.1. Study Sites
2.2. Study Sample
2.3. Measurements
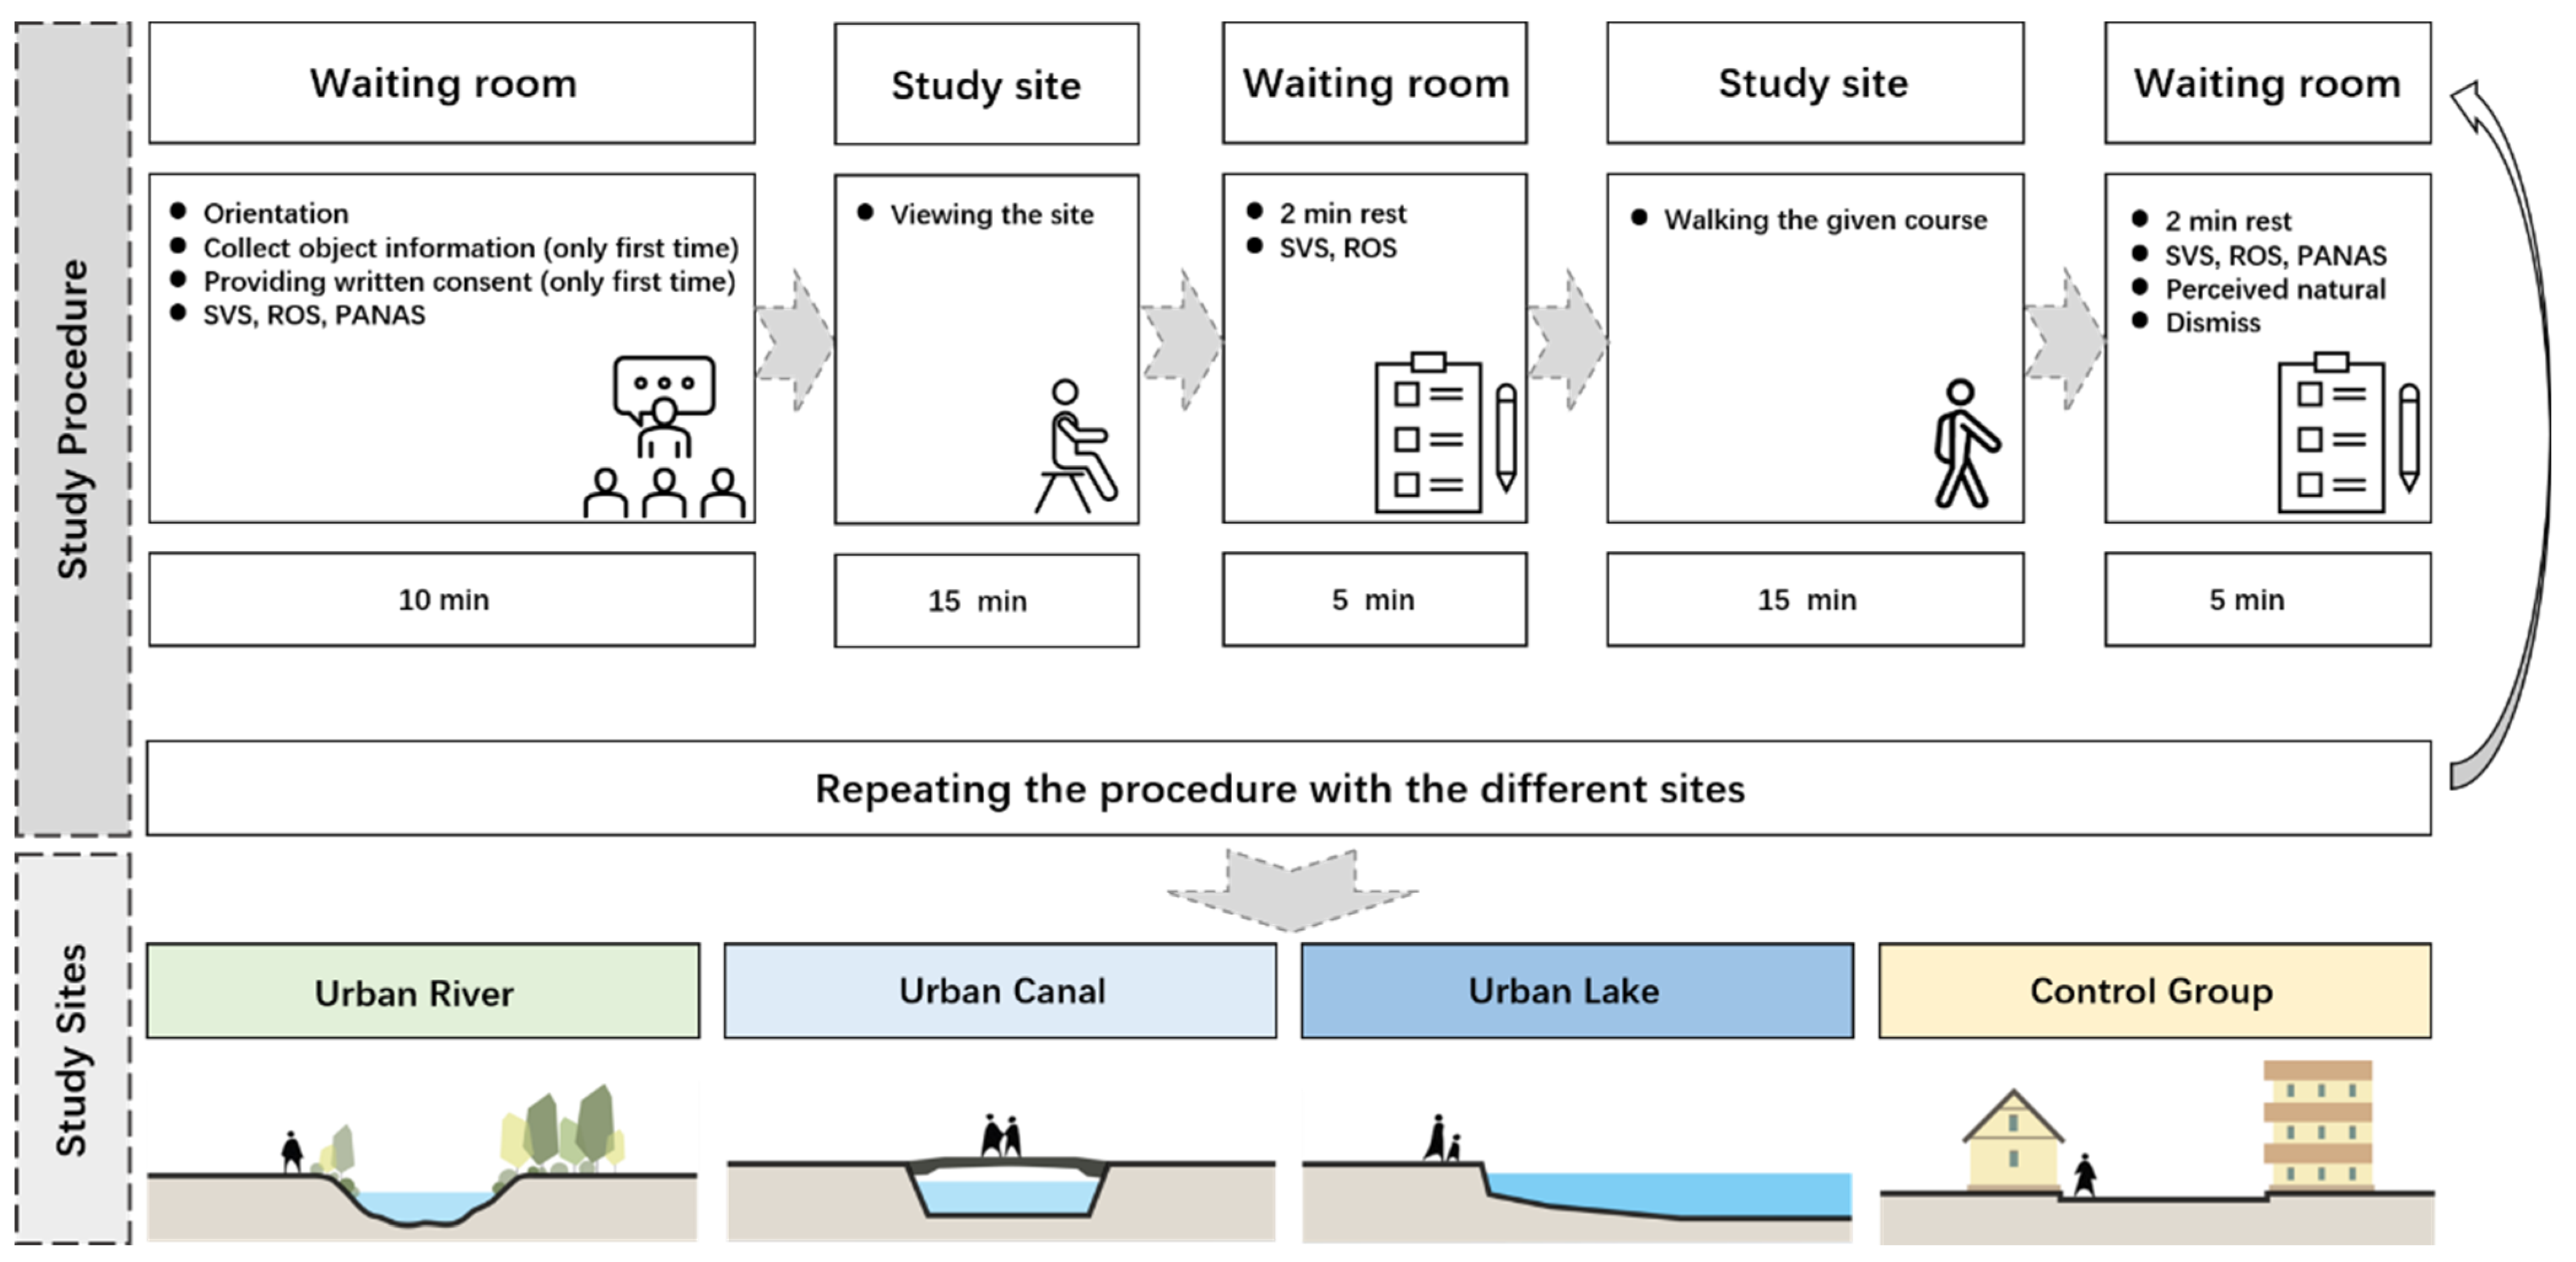
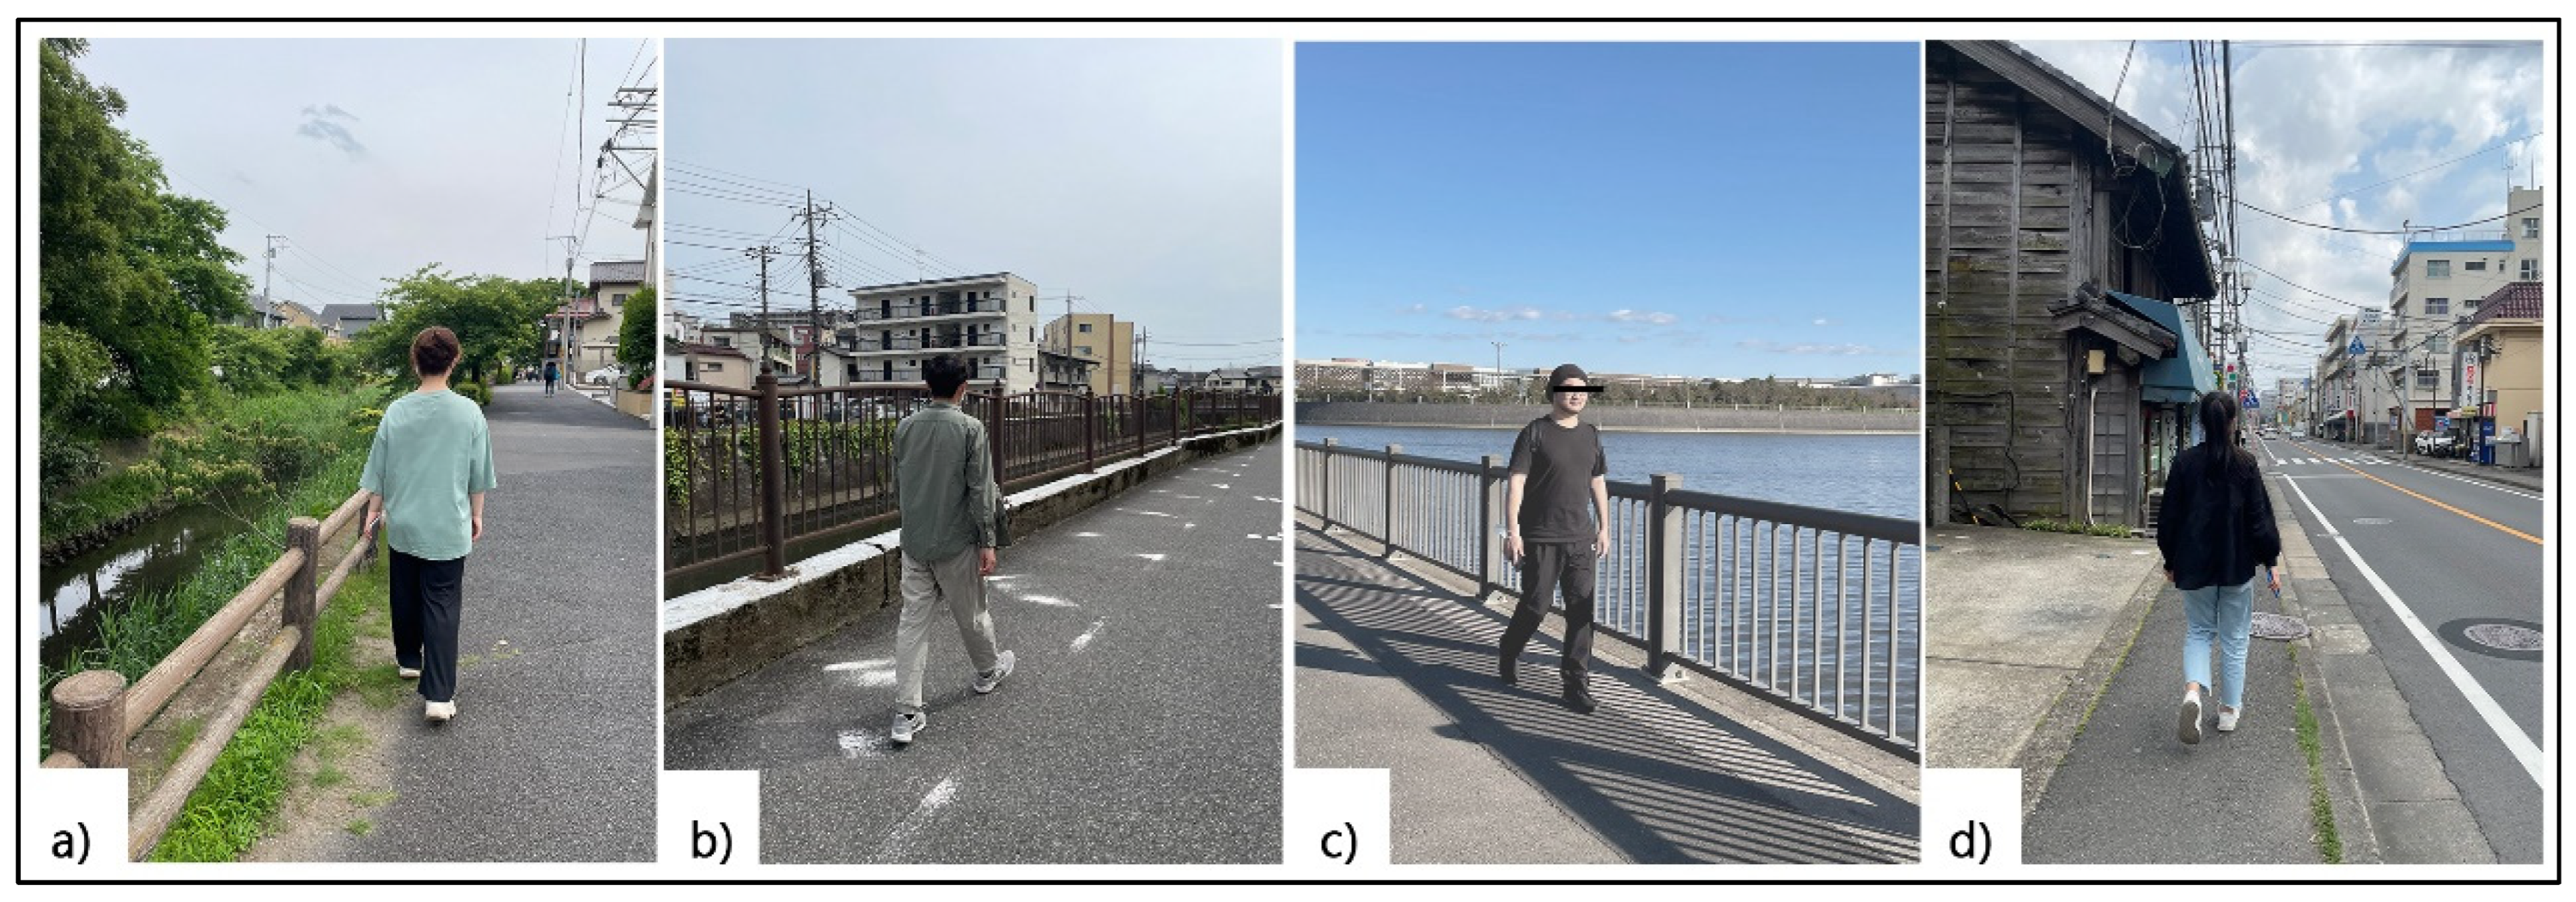
2.4. Experimental Procedure
2.5. Statistical Analysis
3. Results
3.1. Scale Statistics
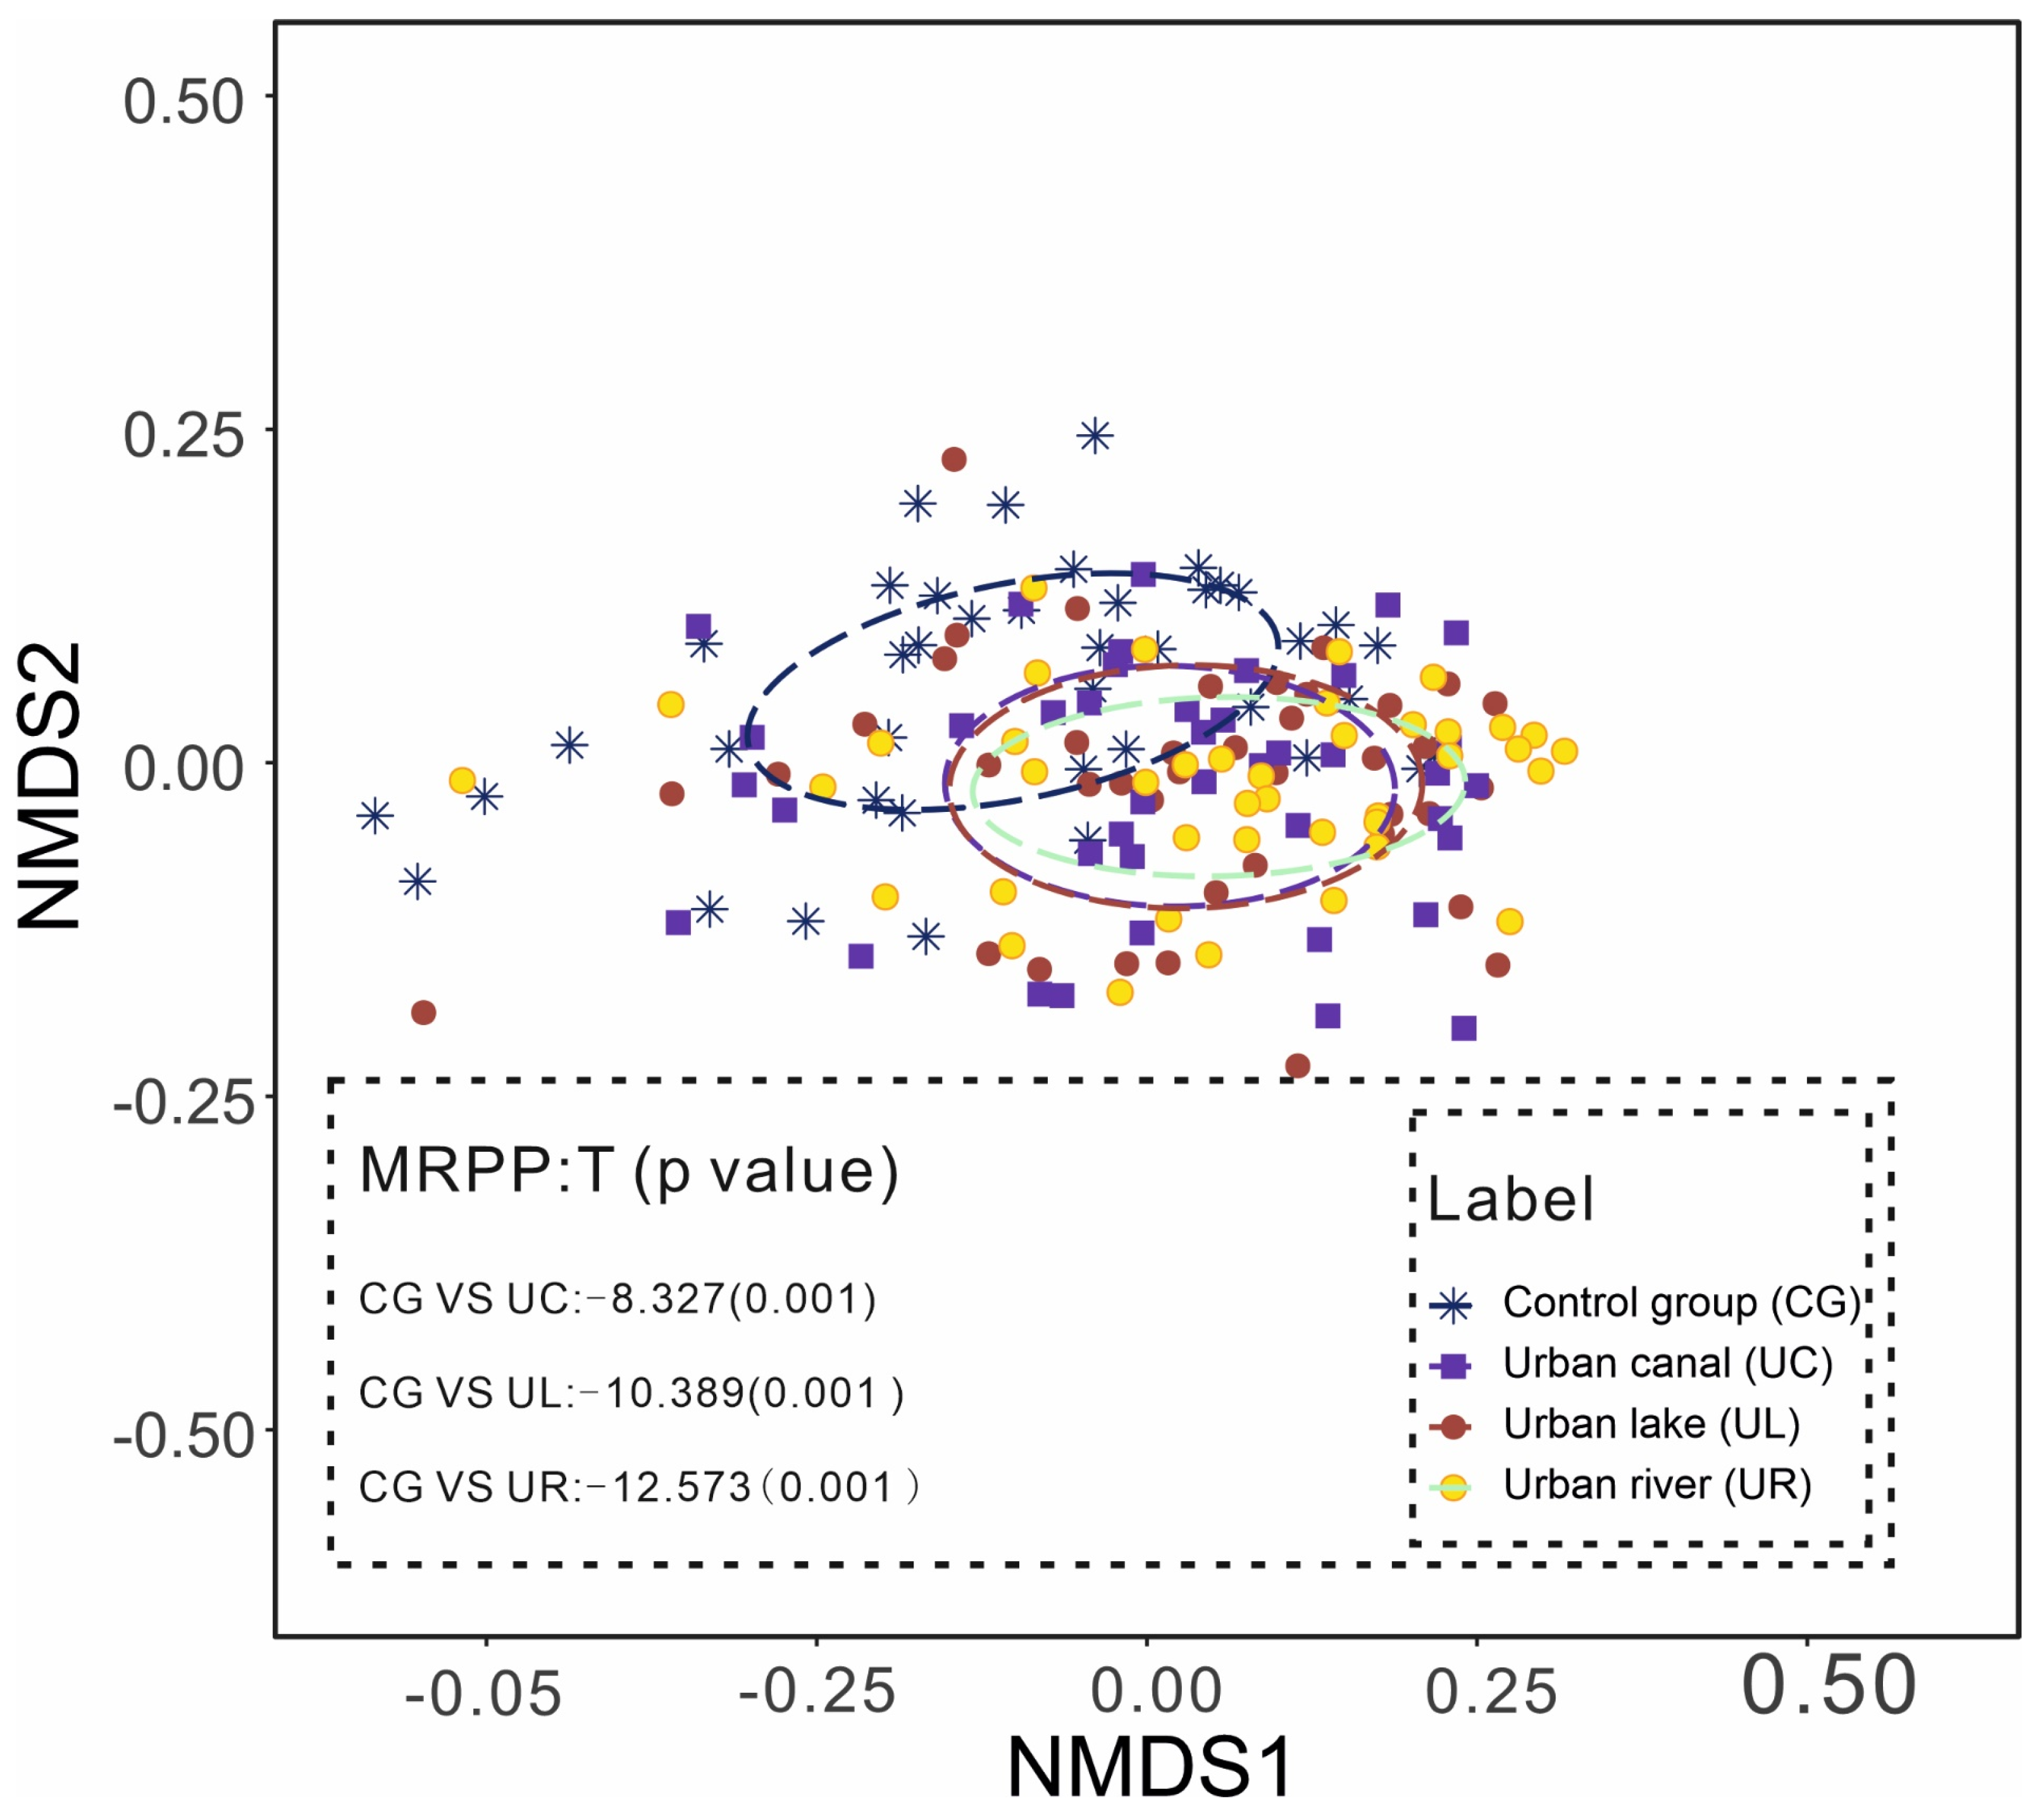
3.2. The NMDS and MRPP Results
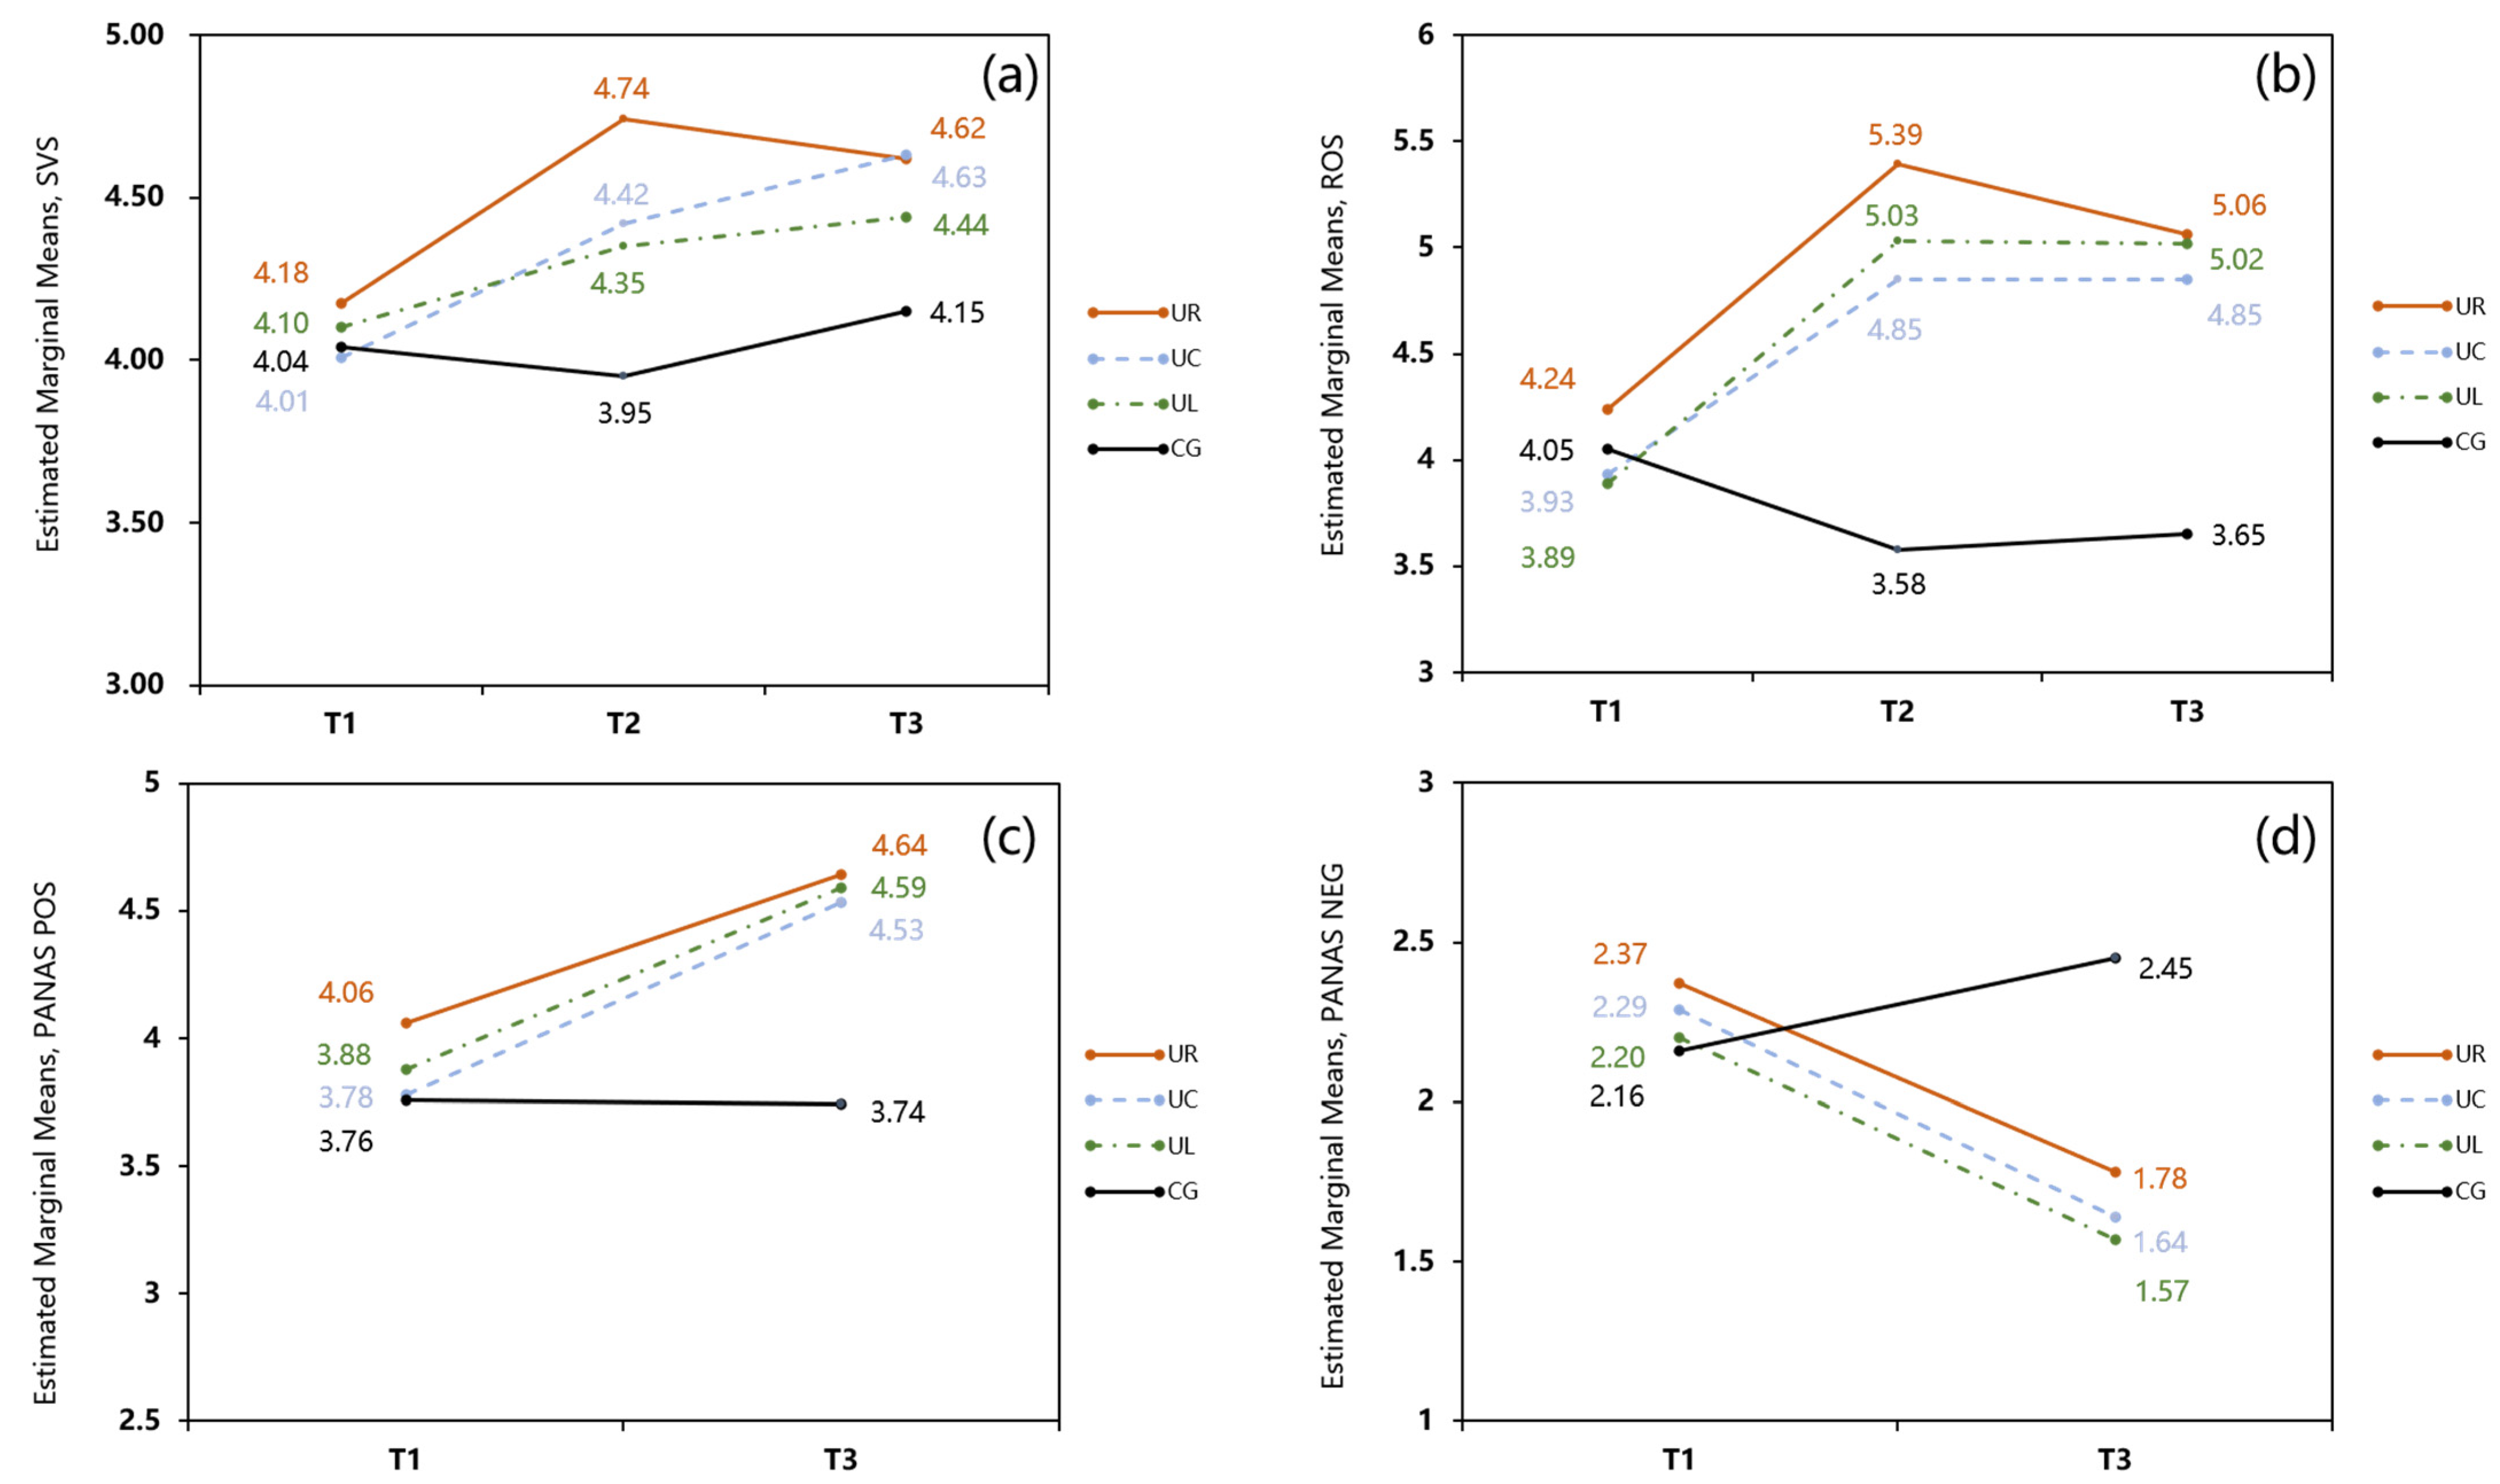
3.3. The Repeated-Measures ANOVA Results
3.4. Natural Element Level Perception of Three UBSs
4. Discussion
4.1. Summary of the Major Findings
4.2. Restorative Benefits Were Found at Different Time Points, but Not Significantly Different
- (1)
- Due to the plateau effect [53], the act of 15 min of viewing already caused subjects to perceive a high level of mental restoration. Therefore, a walking session (15 min of viewing combined with 15 min of physical activity) would hardly lead to a higher level of perceived mental recovery for the subjects compared to 15 min of viewing.
- (2)
- Second, the health effects of physical activity typically come from a reduction in blood pressure and heart rate. However, a previous study showed that no positive cardiovascular effects were observed for the walking behavior in the blue space [54]. Therefore, we speculate that unlike the green space [31,34,55], the walking behavior in the UBS had a limited effect on physical health and therefore led to the same psychological recovery outcome as the 15 min viewing.
- (3)
4.3. The Restorative Effect of Different UBS Is Different
4.4. Implications
4.5. Limitations
5. Conclusions
- (1)
- all three UBSs increased vitality, feelings of restoration, positive emotions, and decreased negative emotions, which suggest that the restorative benefits of UBSs are similar to those of other green environments;
- (2)
- the mental restoration effects between walking and viewing among three UBSs showed no significant differences;
- (3)
- of the three UBSs, urban rivers and urban lakes were the most restorative, while urban canals were less so;
- (4)
- the health experiences of different UBSs in urban settings can show differences depending on the natural components and their levels in the environment (blue, blue + green, blue + blue).
Author Contributions
Funding
Data Availability Statement
Acknowledgments
Conflicts of Interest
Appendix A

| Place | Psychological Indicators | Levene Statistic (Sig.) | Sum of Squares | F | Sig. |
|---|---|---|---|---|---|
| UR (N = 41) | SVS | 0.471 (0.497) | 0.032 | 0.029 | 0.867 |
| ROS | 0.474 (0.495) | 0.026 | 0.026 | 0.873 | |
| PANAS POS | 0.028 (0.867) | 0.199 | 0.316 | 0.577 | |
| PANAS NEG | 0.177 (0.676) | 0.230 | 0.277 | 0.602 | |
| UC (N = 41) | SVS | 0.680 (0.415) | 1.257 | 1.222 | 0.276 |
| ROS | 1.249 (0.271) | 0.115 | 0.135 | 0.715 | |
| PANAS POS | 0.524 (0.473) | 0.431 | 0.438 | 0.512 | |
| PANAS NEG | 0.277 (0.602) | 0.000 | 0.000 | 0.999 | |
| UL (N = 41) | SVS | 0.488 (0.489) | 2.638 | 3.933 | 0.054 |
| ROS | 0.554 (0.461) | 1.176 | 1.227 | 0.275 | |
| PANAS POS | 0.656 (0.423) | 2.638 | 3.933 | 0.054 | |
| PANAS NEG | 0.056 (0.814) | 0.024 | 0.019 | 0.892 | |
| CG (N = 41) | SVS | 0.085 (0.772) | 0.703 | 0.613 | 0.438 |
| ROS | 0.114 (0.738) | 0.441 | 0.519 | 0.476 | |
| PANAS POS | 0.118 (0.733) | 0.472 | 0.534 | 0.469 | |
| PANAS NEG | 0.024 (0.879) | 0.238 | 0.284 | 0.597 |
| Place | Correlation | Before the Experiment (T1) | After Viewing (T2) | After Walking (T3) | ||||||||
|---|---|---|---|---|---|---|---|---|---|---|---|---|
| SVS | ROS | POS | NEG | SVS | ROS | SVS | ROS | POS | NEG | |||
| UR (N = 41) | Before the experiment (T1) | SVS | 1 | 0.69 | 0.84 | −0.35 | 0.73 | 0.55 | 0.66 | 0.59 | 0.54 | −0.38 |
| ROS | 1 | 0.73 | −0.46 | 0.63 | 0.54 | 0.52 | 0.53 | 0.43 | −0.39 | |||
| POS | 1 | −0.32 | 0.71 | 0.59 | 0.70 | 0.59 | 0.63 | −0.42 | ||||
| NEG | 1 | −0.34 | −0.43 | −0.17 | −0.24 | 0.13 | 0.41 | |||||
| After viewing (T2) | SVS | 1 | 0.78 | 0.79 | 0.65 | 0.63 | −0.48 | |||||
| ROS | 1 | 0.71 | 0.82 | 0.71 | −0.65 | |||||||
| After walking (T3) | SVS | 1 | 0.81 | 0.81 | −0.53 | |||||||
| ROS | 1 | 0.87 | −0.71 | |||||||||
| POS | 1 | −0.65 | ||||||||||
| NEG | 1 | |||||||||||
| UC (N = 41) | Before the experiment (T1) | SVS | 1 | 0.76 | 0.77 | −0.34 | 0.54 | 0.28 | 0.37 | 0.39 | 0.39 | −0.29 |
| ROS | 1 | 0.75 | −0.43 | 0.51 | 0.42 | 0.31 | 0.47 | 0.37 | −0.34 | |||
| POS | 1 | −0.34 | 0.59 | 0.50 | 0.38 | 0.53 | 0.47 | −0.26 | ||||
| NEG | 1 | 0.18 | 0.05 | 0.20 | 0.03 | 0.13 | 0.60 | |||||
| After viewing (T2) | SVS | 1 | 0.75 | 0.79 | 0.69 | 0.70 | −0.17 | |||||
| ROS | 1 | 0.71 | 0.80 | 0.73 | −0.42 | |||||||
| After walking (T3) | SVS | 1 | 0.81 | 0.81 | −0.31 | |||||||
| ROS | 1 | 0.88 | −0.47 | |||||||||
| POS | 1 | −0.33 | ||||||||||
| NEG | 1 | |||||||||||
| UL (N = 41) | Before the experiment (T1) | SVS | 1 | 0.59 | 0.72 | −0.22 | 0.71 | 0.63 | 0.69 | 0.52 | 0.55 | −0.50 |
| ROS | 1 | 0.78 | −0.45 | 0.42 | 0.42 | 0.37 | 0.39 | 0.26 | −0.41 | |||
| POS | 1 | −0.34 | 0.50 | 0.51 | 0.53 | 0.46 | 0.51 | −0.40 | ||||
| NEG | 1 | −0.10 | −0.13 | 0.03 | 0.06 | 0.19 | 0.48 | |||||
| After viewing (T2) | SVS | 1 | 0.71 | 0.73 | 0.67 | 0.70 | −0.46 | |||||
| ROS | 1 | 0.71 | 0.73 | 0.69 | −0.41 | |||||||
| After walking (T3) | SVS | 1 | 0.77 | 0.83 | −0.51 | |||||||
| ROS | 1 | 0.89 | −0.54 | |||||||||
| POS | 1 | −0.42 | ||||||||||
| NEG | 1 | |||||||||||
| CG (N = 41) | Before the experiment (T1) | SVS | 1 | 0.77 | 0.78 | −0.31 | 0.73 | 0.46 | 0.70 | 0.35 | 0.49 | −0.19 |
| ROS | 1 | 0.77 | −0.51 | 0.78 | 0.59 | 0.68 | 0.45 | 0.45 | −0.40 | |||
| POS | 1 | −0.47 | 0.66 | 0.51 | 0.70 | 0.41 | 0.53 | −0.33 | ||||
| NEG | 1 | −0.34 | −0.45 | −0.27 | −0.43 | −0.30 | 0.71 | |||||
| After viewing (T2) | SVS | 1 | 0.61 | 0.72 | 0.53 | 0.62 | −0.34 | |||||
| ROS | 1 | 0.56 | 0.70 | 0.57 | −0.58 | |||||||
| After walking (T3) | SVS | 1 | 0.67 | 0.77 | −0.37 | |||||||
| ROS | 1 | 0.80 | −0.63 | |||||||||
| POS | 1 | −0.44 | ||||||||||
| NEG | 1 | |||||||||||
References
- Song, C.; Ikei, H.; Park, B.J.; Lee, J.; Kagawa, T.; Miyazaki, Y. Association between the psychological effects of viewing forest landscapes and trait anxiety level. Int. J. Environ. Res. Public Health 2020, 17, 5479. [Google Scholar] [CrossRef] [PubMed]
- Tanaka, A.; Takano, T.; Nakamura, K.; Takeuchi, S. Health levels influenced by urban residential conditions in a megacity—Tokyo. Urban Stud. 1996, 33, 879–894. [Google Scholar] [CrossRef]
- Peen, J.; Schoevers, R.A.; Beekman, A.T.; Dekker, J. The current status of urban-rural differences in psy-chiatric disorders. Acta Psychiatr. Scand. 2010, 121, 84–93. [Google Scholar] [CrossRef]
- McKenzie, K.; Murray, A.; Booth, T. Do urban environments increase the risk of anxiety, depression and psychosis? An epidemiological study. J. Affect. Disord. 2013, 150, 1019–1024. [Google Scholar] [CrossRef] [PubMed]
- Elsadek, M.; Liu, B.; Lian, Z.; Xie, J. The influence of urban roadside trees and their physical environment on stress relief measures: A field experiment in Shanghai. Urban For. Urban Green. 2019, 42, 51–60. [Google Scholar] [CrossRef]
- McDougall, C.W.; Quilliam, R.S.; Hanley, N.; Oliver, D.M. Freshwater blue space and population health: An emerging research agenda. Sci. Total Environ. 2020, 737, 140196. [Google Scholar] [CrossRef] [PubMed]
- Subiza-Pérez, M.; Hauru, K.; Korpela, K.; Haapala, A.; Lehvävirta, S. Perceived Environmental Aesthetic Qualities Scale (PEAQS)–A self-report tool for the evaluation of green-blue spaces. Urban For. Urban Green. 2019, 43, 126383. [Google Scholar] [CrossRef]
- Völker, S.; Heiler, A.; Pollmann, T.; Claßen, T.; Hornberg, C.; Kistemann, T. Do perceived walking distance to and use of urban blue spaces affect self-reported physical and mental health? Urban For. Urban Green. 2018, 29, 1–9. [Google Scholar] [CrossRef]
- Foley, R.; Kistemann, T. Blue space geographies: Enabling health in place. Health Place 2015, 35, 157–165. [Google Scholar] [CrossRef]
- Völker, S.; Matros, J.; Claßen, T. Determining urban open spaces for health-related appropriations: A quali-tative analysis on the significance of blue space. Environ. Earth Sci. 2016, 75, 1–18. [Google Scholar] [CrossRef]
- Van den Bogerd, N.; Elliott, L.R.; White, M.P.; Mishra, H.S.; Bell, S.; Porter, M.; Sydenham, Z.; Garrett, J.K.; Fleming, L.E. Urban blue space renovation and local resident and visitor well-being: A case study from Plymouth, UK. Landsc. Urban Plan. 2021, 215, 104232. [Google Scholar] [CrossRef]
- Pasanen, T.P.; White, M.P.; Wheeler, B.W.; Garrett, J.K.; Elliott, L.R. Neighbourhood blue space, health and wellbeing: The mediating role of different types of physical activity. Environ. Int. 2019, 131, 105016. [Google Scholar] [CrossRef] [PubMed]
- Dzhambov, A.M.; Markevych, I.; Hartig, T.; Tilov, B.; Arabadzhiev, Z.; Stoyanov, D.; Gatseva, P.; Dimitrova, D.D. Multiple pathways link urban green-and bluespace to mental health in young adults. Environ. Res. 2018, 166, 223–233. [Google Scholar] [CrossRef] [PubMed]
- Elliott, L.R.; White, M.P.; Grellier, J.; Garrett, J.K.; Cirach, M.; Wheeler, B.W.; Bratman, G.N.; van den Bosch, M.A.; Ojala, A.; Roiko, A.; et al. Research Note: Res-idential distance and recreational visits to coastal and inland blue spaces in eighteen countries. Landsc. Urban Plan. 2020, 198, 103800. [Google Scholar] [CrossRef]
- Poulsen, M.N.; Nordberg, C.M.; Fiedler, A.; DeWalle, J.; Mercer, D.; Schwartz, B.S. Factors associated with visiting freshwater blue space: The role of restoration and relations with mental health and well-being. Landsc. Urban Plan. 2022, 217, 104282. [Google Scholar] [CrossRef]
- Luo, S.; Xie, J.; Furuya, K. Assessing the Preference and Restorative Potential of Urban Park Blue Space. Land 2021, 10, 1233. [Google Scholar] [CrossRef]
- White, M.; Smith, A.; Humphryes, K.; Pahl, S.; Snelling, D.; Depledge, M. Blue space: The importance of water for preference, affect, and restorativeness ratings of natural and built scenes. J. Environ. Psychol. 2010, 30, 482–493. [Google Scholar] [CrossRef]
- Bulut, Z.; Yilmaz, H. Determination of waterscape beauties through visual quality assessment method. Environ. Monit. Assess. 2009, 154, 459–468. [Google Scholar] [CrossRef]
- Nasar, J.L.; Li, M. Landscape mirror: The attractiveness of reflecting water. Landsc. Urban Plan. 2004, 66, 233–238. [Google Scholar] [CrossRef]
- Herzog, T.R. A cognitive analysis of preference for waterscapes. J. Environ. Psychol. 1985, 5, 225–241. [Google Scholar] [CrossRef]
- Hermanski, A.; McClelland, J.; Pearce-Walker, J.; Ruiz, J.; Verhougstraete, M. The effects of blue spaces on mental health and associated biomarkers. Int. J. Ment. Health 2022, 51, 203–217. [Google Scholar] [CrossRef]
- Engemann, K.; Svenning, J.C.; Arge, L.; Brandt, J.; Erikstrup, C.; Geels, C.; Hertel, O.; Mortensen, P.B.; Plana-Ripoll, O.; Tsirogiannis, C.; et al. Associations be-tween growing up in natural environments and subsequent psychiatric disorders in Denmark. Environ. Res. 2020, 188, 109788. [Google Scholar] [CrossRef] [PubMed]
- Georgiou, M.; Tieges, Z.; Morison, G.; Smith, N.; Chastin, S. A population-based retrospective study of the modifying effect of urban blue space on the impact of socioeconomic deprivation on mental health, 2009–2018. Sci. Rep. 2022, 12, 13040. [Google Scholar] [CrossRef] [PubMed]
- Stieger, S.; Aichinger, I.; Swami, V. The impact of nature exposure on body image and happiness: An expe-rience sampling study. Int. J. Environ. Health Res. 2022, 32, 870–884. [Google Scholar] [CrossRef]
- Reeves, J.P.; Knight, A.T.; Strong, E.A.; Heng, V.; Neale, C.; Cromie, R.; Vercammen, A. The application of wearable technology to quantify health and wellbeing co-benefits from urban wetlands. Front. Psychol. 2019, 10, 1840. [Google Scholar] [CrossRef] [PubMed]
- Pitt, H. Muddying the waters: What urban waterways reveal about bluespaces and wellbeing. Geoforum 2018, 92, 161–170. [Google Scholar] [CrossRef]
- Pitt, H. What prevents people accessing urban bluespaces? A qualitative study. Urban For. Urban Green. 2019, 39, 89–97. [Google Scholar] [CrossRef]
- Korpela, K.M.; Ylén, M.; Tyrväinen, L.; Silvennoinen, H. Favorite green, waterside and urban environments, restorative experiences and perceived health in Finland. Health Promot. Int. 2010, 25, 200–209. [Google Scholar] [CrossRef]
- Carrus, G.; Lafortezza, R.; Colangelo, G.; Dentamaro, I.; Scopelliti, M.; Sanesi, G. Relations between naturalness and perceived restorativeness of different urban green spaces. Psyecology 2013, 4, 227–244. [Google Scholar] [CrossRef]
- Tyrväinen, L.; Ojala, A.; Korpela, K.; Lanki, T.; Tsunetsugu, Y.; Kagawa, T. The influence of urban green environments on stress relief measures: A field experiment. J. Environ. Psychol. 2014, 38, 1–9. [Google Scholar] [CrossRef]
- Lin, W.; Chen, Q.; Jiang, M.; Zhang, X.; Liu, Z.; Tao, J.; Wu, L.; Xu, S.; Kang, Y.; Zeng, Q. The effect of green space behaviour and per capita area in small urban green spaces on psychophysiological responses. Landsc. Urban Plan. 2019, 192, 103637. [Google Scholar] [CrossRef]
- McDougall, C.W.; Hanley, N.; Quilliam, R.S.; Oliver, D.M. Blue space exposure, health and well-being: Does freshwater type matter? Landsc. Urban Plan. 2022, 224, 104446. [Google Scholar] [CrossRef]
- Song, C.; Ikei, H.; Park, B.J.; Lee, J.; Kagawa, T.; Miyazaki, Y. Psychological benefits of walking through forest areas. Int. J. Environ. Res. Public Health 2018, 15, 2804. [Google Scholar] [CrossRef] [PubMed]
- Song, C.; Ikei, H.; Kagawa, T.; Miyazaki, Y. Physiological and psychological effects of viewing forests on young women. Forests 2019, 10, 635. [Google Scholar] [CrossRef]
- Simkin, J.; Ojala, A.; Tyrväinen, L. Restorative effects of mature and young commercial forests, pristine old-growth forest and urban recreation forest-A field experiment. Urban For. Urban Green. 2020, 48, 126567. [Google Scholar] [CrossRef]
- Korpela, K.M.; Ylén, M.; Tyrväinen, L.; Silvennoinen, H. Determinants of restorative experiences in everyday favorite places. Health Place 2008, 14, 636–652. [Google Scholar] [CrossRef]
- Ryan, R.M.; Frederick, C. On energy, personality, and health: Subjective vitality as a dynamic reflection of well-being. J. Personal. 1997, 65, 529–565. [Google Scholar] [CrossRef] [PubMed]
- Watson, D.; Clark, L.A.; Tellegen, A. Development and validation of brief measures of positive and negative affect: The PANAS scales. J. Personal. Soc. Psychol. 1988, 54, 1063. [Google Scholar] [CrossRef]
- Kaplan, S. Meditation, restoration, and the management of mental fatigue. Environ. Behav. 2001, 33, 480–506. [Google Scholar] [CrossRef]
- Ulrich, R.S.; Simons, R.F.; Losito, B.D.; Fiorito, E.; Miles, M.A.; Zelson, M. Stress recovery during exposure to natural and urban environments. J. Environ. Psychol. 1991, 11, 201–230. [Google Scholar] [CrossRef]
- Jiang, B.; He, J.; Chen, J.; Larsen, L.; Wang, H. Perceived green at speed: A simulated driving experiment raises new questions for attention restoration theory and stress reduction theory. Environ. Behav. 2021, 53, 296–335. [Google Scholar] [CrossRef]
- Shu, X.; Mesimäki, M.; Kotze, D.J.; Wales, M.; Xie, L.; Benicke, R.; Lehvävirta, S. Needs and expectations of German and Chinese children for livable urban green spaces revealed by the method of empathy-based stories. Urban For. Urban Green. 2022, 68, 127476. [Google Scholar] [CrossRef]
- Hussain, J.; Wang, X.; Sousa, L.; Ali, R.; Rittmann, B.E.; Liao, W. Using non-metric multi-dimensional scaling analysis and multi-objective optimization to evaluate green algae for production of proteins, carbohydrates, lipids, and simultaneously fix carbon dioxide. Biomass Bioenergy 2020, 141, 105711. [Google Scholar] [CrossRef]
- Mielke, P.W., Jr.; Berry, K.J.; Johnson, E.S. Multi-response permutation procedures for a priori classifications. Commun. Stat.-Theory Methods 1976, 5, 1409–1424. [Google Scholar] [CrossRef]
- Oksanen, J.; Kindt, R.; Legendre, P.; O’Hara, B.; Stevens, M.H.H.; Oksanen, M.J.; Suggests, M.A.S.S. The vegan package. Community Ecol. Package 2007, 10, 719. [Google Scholar]
- Faul, F.; Erdfelder, E.; Lang, A.G.; Buchner, A. G* Power 3: A flexible statistical power analysis program for the social, behavioral, and biomedical sciences. Behav. Res. Methods 2007, 39, 175–191. [Google Scholar] [CrossRef] [PubMed]
- Rouse, P.C.; Van Zanten, J.J.V.; Ntoumanis, N.; Metsios, G.S.; Yu, C.A.; Kitas, G.D.; Duda, J.L. Measuring the positive psychological well-being of people with rheumatoid arthritis: A cross-sectional validation of the subjective vitality scale. Arthritis Res. Ther. 2015, 17, 1–7. [Google Scholar] [CrossRef] [PubMed]
- Bielinis, E.; Takayama, N.; Boiko, S.; Omelan, A.; Bielinis, L. The effect of winter forest bathing on psychological relaxation of young Polish adults. Urban For. Urban Green. 2018, 29, 276–283. [Google Scholar] [CrossRef]
- Tugade, M.M.; Fredrickson, B.L.; Feldman Barrett, L. Psychological resilience and positive emotional gran-ularity: Examining the benefits of positive emotions on coping and health. J. Personal. 2004, 72, 1161–1190. [Google Scholar] [CrossRef] [PubMed]
- Mattila, O.; Korhonen, A.; Pöyry, E.; Hauru, K.; Holopainen, J.; Parvinen, P. Restoration in a virtual reality forest environment. Comput. Hum. Behav. 2020, 107, 106295. [Google Scholar] [CrossRef]
- Gidlow, C.J.; Jones, M.V.; Hurst, G.; Masterson, D.; Clark-Carter, D.; Tarvainen, M.P.; Smith, G.; Nieuwenhuijsen, M. Where to put your best foot forward: Psycho-physiological responses to walking in natural and urban environments. J. Environ. Psychol. 2016, 45, 22–29. [Google Scholar] [CrossRef]
- Luo, L.; Yu, P.; Jiang, B. Differentiating mental health promotion effects of various bluespaces: An electro-encephalography study. J. Environ. Psychol. 2023, 88, 102010. [Google Scholar] [CrossRef]
- Gelman, R.; Berg, M.; Ilan, Y. A subject-tailored variability-based platform for overcoming the plateau effect in sports training: A narrative review. Int. J. Environ. Res. Public Health 2022, 19, 1722. [Google Scholar] [CrossRef] [PubMed]
- Vert, C.; Gascon, M.; Ranzani, O.; Márquez, S.; Triguero-Mas, M.; Carrasco-Turigas, G.; Arjona, L.; Koch, S.; Llopis, M.; Donaire-Gonzalez, D.; et al. Physical and mental health effects of repeated short walks in a blue space environment: A randomised crossover study. Environ. Res. 2020, 188, 109812. [Google Scholar] [CrossRef]
- Pratiwi, P.I.; Xiang, Q.; Furuya, K. Physiological and psychological effects of walking in urban parks and its imagery in different seasons in middle-aged and older adults: Evidence from matsudo city, Japan. Sustainability 2020, 12, 4003. [Google Scholar] [CrossRef]
- Jiang, B.; Chang, C.Y.; Sullivan, W.C. A dose of nature: Tree cover, stress reduction, and gender differences. Landsc. Urban Plan. 2014, 132, 26–36. [Google Scholar] [CrossRef]
- Wilson, E.O. Biophilia and the conservation ethic. In The Biophilia Hypothesis; Kellert, S., Wilson, E.O., Eds.; Island Press: Washington, DC, USA, 1993. [Google Scholar]
- Depledge, M.H.; Bird, W.J. The Blue Gym: Health and wellbeing from our coasts. Mar. Pollut. Bull. 2009, 58, 947–948. [Google Scholar] [CrossRef] [PubMed]
- Tennessen, C.M.; Cimprich, B. Views to nature: Effects on attention. J. Environ. Psychol. 1995, 15, 77–85. [Google Scholar] [CrossRef]
- Elsadek, M.; Liu, B.; Xie, J. Window view and relaxation: Viewing green space from a high-rise estate improves urban dwellers’ wellbeing. Urban For. Urban Green. 2020, 55, 126846. [Google Scholar] [CrossRef]
- Haeffner, M.; Jackson-Smith, D.; Buchert, M.; Risley, J. Accessing blue spaces: Social and geographic factors structuring familiarity with, use of, and appreciation of urban waterways. Landsc. Urban Plan. 2017, 167, 136–146. [Google Scholar] [CrossRef]
- Subiza-Perez, M.; Vozmediano, L.; San Juan, C. Welcome to your plaza: Assessing the restorative potential of urban squares through survey and objective evaluation methods. Cities 2020, 100, 102461. [Google Scholar] [CrossRef]
- Wang, K.; Cui, Q.; Xu, H. Desert as therapeutic space: Cultural interpretation of embodied experience in sand therapy in Xinjiang, China. Health Place 2018, 53, 173–181. [Google Scholar] [CrossRef] [PubMed]
- Gallou, E.; Uzzell, D.; Sofaer, J. Perceived place qualities, restorative effects and self-reported wellbeing benefits of visits to heritage sites: Empirical evidence from a visitor survey in England. Wellbeing Space Soc. 2022, 3, 100106. [Google Scholar] [CrossRef]
- Luo, S.; Shi, J.; Lu, T.; Furuya, K. Sit down and rest: Use of virtual reality to evaluate preferences and mental restoration in urban park pavilions. Landsc. Urban Plan. 2022, 220, 104336. [Google Scholar] [CrossRef]


| Site (Code in Figure 1) | Category | Features | Main Vegetation around the Site | Description |
|---|---|---|---|---|
| Sakagawa (B) | Urban River | Mainly vegetation and water bodies | Quercus myrsinifolia; Zelkova serrata; Celtis sinensis; Cornus officinalis; Acorus calamus; Prunus subgen.Cerasus; Rhododendron; Hydrangea macrophylla | Sakagawa is a river with a long history, originating in Kashiwa City and eventually flowing into the Edo River. There are many aquatic plants in the river, and many trees have been planted on both sides of the river, resulting in an area that is a blend of natural and artificial environments. |
| Shinsakagawa (C) | Urban Canal | Mainly water bodies and buildings | Parthenocissus tricuspidate; Rhododendron; Hydrangea macrophylla; Quercus myrsinifolia; Cornus officinalis | An artificial waterway located in the center of Matsudo City. It is an engineered channel built for drainage management, and the river is lined mainly with commercial buildings and residential houses. This area has little vegetation or natural elements and is therefore a highly artificial environment. |
| Osagamicyousetuike (A) | Urban Lake | Mainly water bodies | It is located in Koshigaya City, Saitama Prefecture, and is a reservoir (with a capacity of 1.2 million cubic meters of water) designed to resist urban flooding. As part of the Koshigaya Lake City business district, it is surrounded by commercial buildings and residential communities. It is also a highly artificial environment where many visitors and residents come to walk and relax every day. | |
| Sengyokaidou (D) | Control Group | Mainly buildings | Sengyokaidou, as a control group, is a street located in the central urban area of Matsudo City, which is used by many pedestrians and vehicles every day. It only has a small amount of vegetation and does not contain any water bodies, so it is a completely built-up urban environment. |
| Information | Value (Mean ± SD) |
|---|---|
| Male | 19 |
| Female | 22 |
| Age | 26.8 ± 2.9 |
| Weight (Kg) | 59.1 ± 11.2 |
| Height (cm) | 168.1 ± 8.7 |
| BMI (Kg/m2) | 20.8 ± 2.5 |
| Parameter | Urban River | Urban Canal | Urban Lake | Control Group |
|---|---|---|---|---|
| Temperature (°C) | 23.09 (±2.22) | 22.62 (±1.36) | 22.96 (±1.68) | 23.44 (±1.43) |
| Humidity (%) | 38.63 (±4.49) | 35.38 (±7.23) | 33.25 (±4.73) | 32.25 (±4.92) |
| Absolute illumination (lx) | 43,539 (±8051) | 50,331 (±2492) | 50,774 (±2476) | 55,945 (±5001) |
| Noise (dB) | 50.81 (±5.85) | 50.55 (±3.27) | 44.66 (±2.89) | 63.13 (±3.90) |
| Place | UR (N = 41) | UC (N = 41) | UL (N = 41) | CG (N = 41) | ||||||||
|---|---|---|---|---|---|---|---|---|---|---|---|---|
| Measures | M | SD | α | M | SD | α | M | SD | α | M | SD | α |
| Before the experiment (T1) | ||||||||||||
| SVS | 4.18 | 1.03 | 0.88 | 4.01 | 1.00 | 0.85 | 4.10 | 0.84 | 0.80 | 4.04 | 1.05 | 0.84 |
| ROS | 4.24 | 0.98 | 0.89 | 3.93 | 0.90 | 0.88 | 3.89 | 0.97 | 0.87 | 4.05 | 0.91 | 0.84 |
| PANAS POS | 4.06 | 0.78 | 0.88 | 3.78 | 0.97 | 0.94 | 3.88 | 1.01 | 0.91 | 3.76 | 0.92 | 0.91 |
| PANAS NEG | 2.37 | 0.89 | 0.93 | 2.29 | 0.96 | 0.93 | 2.20 | 1.10 | 0.96 | 2.16 | 0.90 | 0.93 |
| After viewing (T2) | ||||||||||||
| SVS | 4.74 | 1.05 | 0.83 | 4.42 | 0.93 | 0.73 | 4.35 | 1.03 | 0.81 | 3.95 | 0.93 | 0.60 |
| ROS | 5.39 | 1.19 | 0.93 | 4.85 | 1.11 | 0.91 | 5.03 | 1.06 | 0.90 | 3.58 | 1.24 | 0.91 |
| After walking (T3) | ||||||||||||
| SVS | 4.62 | 0.97 | 0.78 | 4.63 | 1.00 | 0.77 | 4.44 | 1.09 | 0.79 | 4.15 | 0.97 | 0.76 |
| ROS | 5.06 | 1.29 | 0.95 | 4.85 | 1.20 | 0.93 | 5.02 | 1.20 | 0.93 | 3.65 | 1.13 | 0.90 |
| PANAS POS | 4.64 | 1.02 | 0.92 | 4.53 | 1.03 | 0.91 | 4.59 | 1.04 | 0.91 | 3.74 | 0.94 | 0.89 |
| PANAS NEG | 1.78 | 0.78 | 0.93 | 1.64 | 0.64 | 0.91 | 1.57 | 0.82 | 0.96 | 2.45 | 1.20 | 0.95 |
| Indicators | Sum of Squares | df | Mean Square | F | Sig. | Partial η2 | Pairwise Comparisons |
|---|---|---|---|---|---|---|---|
| SVS (score) | |||||||
| Constant | 9106.542 | 1 | 9106.542 | 8992.726 | 0.000 | 0.949 | |
| Place | 13.991 | 3 | 4.664 | 4.605 | 0.003 ** | 0.028 | UR, UC, UL > CG |
| Time | 12.753 | 2 | 6.376 | 6.297 | 0.002 ** | 0.026 | T3, T2 > T1 |
| Place × Time | 6.048 | 6 | 1.008 | 0.995 | 0.428 | 0.012 | |
| Error | 486.075 | 480 | 1.013 | ||||
| (Adj R2 = 0.201) | |||||||
| ROS (score) | |||||||
| Constant | 9797.722 | 1 | 9797.722 | 7821.063 | 0.000 | 0.942 | |
| Place | 88.706 | 3 | 29.569 | 23.603 | 0.000 ** | 0.129 | UR, UL > UC > CG |
| Time | 46.839 | 2 | 23.420 | 18.695 | 0.000 ** | 0.072 | T3, T2 > T1 |
| Place × Time | 45.443 | 6 | 7.574 | 6.046 | 0.000 ** | 0.070 | |
| Error | 601.313 | 480 | 1.253 | ||||
| (Adj R2 = 0.314) | |||||||
| PANAS POS (score) | |||||||
| Constant | 5569.581 | 1 | 5569.581 | 5806.570 | 0.000 | 0.948 | |
| Place | 16.724 | 3 | 5.575 | 5.812 | 0.001 ** | 0.052 | UR, UC, UL > CG |
| Time | 20.801 | 1 | 20.801 | 21.686 | 0.000 ** | 0.063 | T3 > T1 |
| Place × Time | 7.675 | 3 | 2.558 | 2.667 | 0.048 * | 0.024 | |
| Error | 306.940 | 320 | 0.959 | ||||
| (Adj R2 = 0.209) | |||||||
| PANAS NEG (score) | |||||||
| Constant | 1391.159 | 1 | 1391.159 | 1576.624 | 0.000 | 0.831 | |
| Place | 8.024 | 3 | 2.675 | 3.031 | 0.030 * | 0.028 | CG > UR, UL, UC |
| Time | 12.684 | 1 | 12.684 | 14.375 | 0.000 ** | 0.043 | T1 > T3 |
| Place × Time | 12.906 | 3 | 4.302 | 4.876 | 0.002 ** | 0.044 | |
| Error | 282.357 | 320 | 0.882 | ||||
| (Adj R2 = 0.217) |
| Indicators | Sum of Squares | df | Mean Square | F | Sig. | Partial η2 | Pairwise Comparisons |
|---|---|---|---|---|---|---|---|
| ROS (score) | |||||||
| Place (Time = T1) | 3.038 | 3 | 1.013 | 0.808 | 0.490 | 0.005 | |
| Error | 601.313 | 480 | 1.253 | ||||
| Place (Time = T2) | 76.100 | 3 | 25.367 | 20.249 | 0.000 ** | 0.112 | UR, UL > UC > CG |
| Error | 601.313 | 480 | 1.253 | ||||
| Place (Time = T3) | 55.012 | 3 | 18.337 | 14.638 | 0.000 ** | 0.084 | UR, UC, UL > CG |
| Error | 601.313 | 480 | 1.253 | ||||
| Time (Place = UR) | 28.745 | 2 | 14.373 | 11.473 | 0.000 ** | 0.046 | T3, T2 > T1 |
| Error | 601.313 | 480 | 1.253 | ||||
| Time (Place = UC) | 23.072 | 2 | 11.536 | 9.209 | 0.000 ** | 0.037 | T3, T2 > T1 |
| Error | 601.313 | 480 | 1.253 | ||||
| Time (Place = UL) | 35.282 | 2 | 17.641 | 14.082 | 0.000 ** | 0.055 | T3, T2 > T1 |
| Error | 601.313 | 480 | 1.253 | ||||
| Time (Place = CG) | 5.183 | 2 | 2.592 | 2.069 | 0.127 | 0.009 | |
| Error | 601.313 | 480 | 1.253 | ||||
| PANAS POS (score) | |||||||
| Place (Time = T1) | 2.378 | 3 | 0.793 | 0.826 | 0.480 | 0.008 | |
| Error | 306.940 | 320 | 0.959 | ||||
| Place (Time = T3) | 22.020 | 3 | 7.340 | 7.652 | 0.000 ** | 0.067 | UR, UC, UL > CG |
| Error | 306.940 | 320 | 0.959 | ||||
| Time (Place = UR) | 6.792 | 1 | 6.792 | 7.081 | 0.008 ** | 0.022 | T3 > T1 |
| Error | 306.940 | 320 | 0.959 | ||||
| Time (Place = UC) | 11.494 | 1 | 11.494 | 11.983 | 0.001 ** | 0.036 | T3 > T1 |
| Error | 306.940 | 320 | 0.959 | ||||
| Time (Place = UL) | 10.185 | 1 | 10.185 | 10.619 | 0.001 ** | 0.032 | T3 > T1 |
| Error | 306.940 | 320 | 0.959 | ||||
| Time (Place = CG) | 0.004 | 1 | 0.004 | 0.005 | 0.946 | 0.000 | |
| Error | 306.940 | 320 | 0.959 | ||||
| PANAS NEG (score) | |||||||
| Place (Time = T1) | 1.069 | 3 | 0.356 | 0.404 | 0.750 | 0.004 | |
| Error | 282.357 | 320 | 0.882 | ||||
| Place (Time = T3) | 19.861 | 3 | 6.620 | 7.503 | 0.000 ** | 0.066 | CG > UR, UC, UL |
| Error | 282.357 | 320 | 0.882 | ||||
| Time (Place = UR) | 7.024 | 1 | 7.024 | 7.961 | 0.005 ** | 0.024 | T1 > T3 |
| Error | 282.357 | 320 | 0.882 | ||||
| Time (Place = UC) | 8.629 | 1 | 8.629 | 9.779 | 0.002 ** | 0.030 | T1 > T3 |
| Error | 282.357 | 320 | 0.882 | ||||
| Time (Place = UL) | 8.181 | 1 | 8.181 | 9.271 | 0.003 ** | 0.028 | T1 > T3 |
| Error | 282.357 | 320 | 0.882 | ||||
| Time (Place = CG) | 1.756 | 1 | 1.756 | 1.990 | 0.159 | 0.006 | |
| Error | 282.357 | 320 | 0.882 |
| N | Test Statistic | df | Sig. | η2 | Cohen’s d | ||
|---|---|---|---|---|---|---|---|
| Perceive Blue | 123 | 47.121 | 2 | <0.001 | 0.376 | 1.553 | |
| UR vs. UC | 41 | −14.659 | 0.157 | ||||
| UR vs. UL | 41 | −50.427 | <0.001 | ||||
| UC vs. UL | 41 | −35.768 | <0.001 | ||||
| Perceive Green | 123 | 33.360 | 2 | <0.001 | 0.261 | 1.19 | |
| UC vs. UR | 41 | 40.146 | <0.001 | ||||
| UL vs. UR | 41 | 36.866 | <0.001 | ||||
| UC vs. UL | 41 | −3.280 | 1.000 | ||||
| Perceive of Total Nature | 123 | 11.790 | 2 | 0.003 | 0.082 | 0.596 | |
| UC vs. UR | 41 | 21.707 | 0.016 | ||||
| UC vs. UL | 41 | −24.354 | 0.005 | ||||
| UR vs. UL | 41 | −2.646 | 1.000 |
Disclaimer/Publisher’s Note: The statements, opinions and data contained in all publications are solely those of the individual author(s) and contributor(s) and not of MDPI and/or the editor(s). MDPI and/or the editor(s) disclaim responsibility for any injury to people or property resulting from any ideas, methods, instructions or products referred to in the content. |
© 2023 by the authors. Licensee MDPI, Basel, Switzerland. This article is an open access article distributed under the terms and conditions of the Creative Commons Attribution (CC BY) license (https://creativecommons.org/licenses/by/4.0/).
Share and Cite
Luo, S.; Xie, J.; Wang, H.; Wang, Q.; Chen, J.; Yang, Z.; Furuya, K. Natural Dose of Blue Restoration: A Field Experiment on Mental Restoration of Urban Blue Spaces. Land 2023, 12, 1834. https://doi.org/10.3390/land12101834
Luo S, Xie J, Wang H, Wang Q, Chen J, Yang Z, Furuya K. Natural Dose of Blue Restoration: A Field Experiment on Mental Restoration of Urban Blue Spaces. Land. 2023; 12(10):1834. https://doi.org/10.3390/land12101834
Chicago/Turabian StyleLuo, Shixian, Jing Xie, Huixin Wang, Qian Wang, Jie Chen, Zhenglun Yang, and Katsunori Furuya. 2023. "Natural Dose of Blue Restoration: A Field Experiment on Mental Restoration of Urban Blue Spaces" Land 12, no. 10: 1834. https://doi.org/10.3390/land12101834