Article

Analysis of Landscape Character Assessment and Cultural Ecosystem Services Evaluation Frameworks for Peri-Urban Landscape Planning: A Case Study of Harku Municipality, Estonia

1
Institute of Agricultural and Environmental Sciences, Estonian University of Life Sciences, 51014 Tartu, Estonia
2
Department of Landscape Architecture, Estonian University of Life Sciences, 51006 Tartu, Estonia
3
OPENspace Research Centre, Edinburgh College of Art, University of Edinburgh, Edinburgh EH3 9DF, UK
*
Author to whom correspondence should be addressed.
Land 2023, 12(10), 1825; https://doi.org/10.3390/land12101825
Submission received: 19 August 2023 / Revised: 18 September 2023 / Accepted: 22 September 2023 / Published: 25 September 2023
(This article belongs to the Special Issue Rural–Urban Gradients: Landscape and Nature Conservation II)

Abstract

:
This study combined landscape character assessment (LCA) and cultural ecosystem services (CES) frameworks to evaluate human well-being in the peri-urban area of Harku Municipality, Estonia. Using geospatial data combined with expert opinions, the study investigated the interplay between landscape character types and environmental/contact types through the LCA method. In total, 21 distinct landscape types comprising 47 separate areas were identified, with CES values determined for each. Restorative, social, and cognitive values were associated with each landscape character type. The findings demonstrated the higher restorative potential of blue and green elements (water bodies, forests) with low settlement density and minimal agriculture. High-density settlements with good road access demonstrated significant social values, while mixed forests and wetlands tended to be associated with higher cognitive values. Coastal zones with semi-dense settlements and mixed forests earned favourable ratings, whereas industrial/agricultural landscapes were rated lowest for all values. These findings offer valuable insights into the complex dynamics of urban–rural interactions, resilience, and the impact of urbanisation on CES. They may inform future landscape management strategies, urban planning decisions, and policy considerations. Additionally, this study highlights the need for further research to explore the long-term trends and potential changes in CES in evolving peri-urban environments.

1. Introduction

Landscape character assessment (LCA) is a well-established tool in understanding the physical, aesthetic, and perceptual features of an area encompassing various types of landscapes, including urban, peri-urban, and rural settings. While LCA was initially developed to assess and understand the character of rural landscapes, its principles and methodologies have been adapted and extended to different contexts, considering a landscape’s physical, ecological, and cultural attributes [1], and it is used as a basis for subsequent decision-making, such as strategic planning. LCA may be helpful in assisting planners, policymakers, and researchers to determine the ways in which different landscapes are perceived and valued, and how they might contribute to the overall well-being of individuals and communities [1,2].
While LCA was originally carried out by manual methods, the adoption of geographical information systems (GIS) and pattern recognition algorithms has emerged as a promising avenue in assessing landscape character, enabling the quantitative analysis of landscape patterns and identification of region-defining features [3,4].
In the quest for holistic landscape assessment, approaches that integrate LCA principles have gained prominence. However, a distinct gap persists in the availability of tailored frameworks designed specifically for dynamic and complex peri-urban areas. In the context of rural landscapes, Zakariya et al. [5] endeavoured to bridge this gap by conceptualising a framework for LCA within rural landscape corridors. Their framework incorporates both tangible and intangible character components, contributing to a richer understanding of rural landscapes and their potential ecosystem services [5].
Mapping and evaluating ecosystem services (ESs) has simultaneously emerged as a useful approach in identifying their contribution to human well-being. However, challenges persist in this domain, including methodological limitations and the ongoing need for the standardisation, validation, and comparative assessment of different techniques [6]. Spatial assessments, while clarifying linkages between ES supply and human beneficiaries, show a limited combination of LCA and cultural ecosystem services (CES) frameworks within broader decision-making processes [7].
Cultural ecosystem services (CES) introduce an added layer of complexity in the ecosystem services approach due to their intricate and intangible nature. However, their significance in policymaking means that they need to be incorporated more effectively. Mapping and evaluating a diverse range of CES can improve decision-making, especially in areas such as land use planning, conservation, and resource management. By recognising the implications of CES on well-being, policymakers can integrate them into frameworks to promote sustainable resource management, as shown by Metzger et al. [8]. This comprehensive approach can produce a deeper understanding of the cultural aspects that amplify ecosystems’ contributions to human societies.
The efficient mapping and identification of primary data forms the basis for effective ES management and more sustainable development trajectories [9,10,11]. Various frameworks and methods have been employed to assess and manage ESs, with CES tools forming an integral part of these. However, the coverage of CES tools might be relatively narrow compared to other aspects of ESs, while the challenge remains of integrating multiple ES assessments to address real-world problems [10]. Nevertheless, CES mapping may draw upon a range of primary data sources, including surveys, interviews, and participatory mapping, as well as some secondary sources and remote sensing, as highlighted by Plieninger et al. [12]. Furthermore, the assessment and mapping of ESs helps to improve our understanding of their contributions to human well-being and sustainable natural resource use [13]. Using scoring methods linked to land cover types, it is possible to reveal areas at risk of losing vital ESs. GIS tools can be used to assess service movement between supply and demand [14]. Additionally, mapping clusters of ESs can help to identify places where their management has generated significant benefits and provide insights for landscape planning and conservation [15]. The importance of preserving and ensuring a resilient supply of ESs in urban areas has been demonstrated through studies [10,11,16,17,18] that have shown that ESs contribute to liveability and sustainability. In addition to economic indicators like gross domestic product (GDP), human well-being also encompasses social, environmental, and human rights factors, including key elements of a good life, such as freedom, health, social connections, and security [19,20,21,22,23].
The impacts of urbanisation on landscapes and CES highlight the need for comprehensive frameworks in addressing these challenges and underscore the need to understand how urbanisation influences landscapes and shapes CES. This understanding becomes particularly crucial in peri-urban contexts, where urban expansion often encroaches upon rural and natural landscapes and transforms the patterns of service supply and demand. An improved understanding of these dynamics can help to guide planning and management strategies to balance urban growth with environmental conservation and human well-being [24].
Mixed-method approaches offer insights into the implications of land use changes for ecosystem management. Similar to He et al. [25], our study seeks to adapt and apply a comprehensive approach to assess CES in a case study of the peri-urban area of Harku Municipality, located in Northern Estonia. The incorporation of landscape indicators, ESs, and landscape valuation frameworks can improve the assessment and management of the urban fringe [26]. The concept of landscape services, encompassing both natural and cultural aspects, emphasises the functions provided by human–ecological systems valued for economic, sociocultural, and ecological reasons [27,28]. Mapping ESs is fundamental in understanding their spatial distribution and facilitating their management. Standardisation, clarity in terminology, and the employment of different frameworks and methods enhances the comparability and integration of ES assessment [29].

Estonia: A Particular Case of Peri-Urban Expansion

In the context of ES research, this study aligns with the EU-wide framework for CES mapping and outdoor recreation potential assessment [30], which is particularly relevant in Estonia, due to its low population density. These features significantly influence the interplay between urban and rural landscapes, as well as the provision of ESs.
Estonia’s case can offer insights into the intricate relationship between human activities, landscape attributes, and the preservation of natural environments. This commitment is evident through initiatives like the ELME project, which involved the economic mapping and assessment of terrestrial ESs at a national level, underscoring the integration of ES knowledge in spatial planning and decision-making processes [31,32,33].
The impact of urbanisation on landscape change and ESs highlights the importance of various frameworks, especially in peri-urban areas like Harku Municipality, a peri-urban area to the west of Tallinn. Here, approaches such as landscape character assessment (LCA) have the potential to provide a manageable framework in understanding ecosystem dynamics. Incorporating sociocultural valuation with ES assessment could improve the means of capturing diverse values associated with cultural landscapes. While our earlier research in Harku concentrated on the development and testing of a particular CES framework [34], this study extends its scope by incorporating the LCA methodology with the aim of strengthening the knowledge of the relationships between CES and well-being in the peri-urban context.
The urbanisation process in Estonia, following the collapse of the Soviet Union over 30 years ago, resulted from the subsequent rapid urban growth and transformation in the country. Rural areas became depopulated and former industrial areas have transformed into sprawling suburbs [35]. This trend of urbanisation and the expansion of urban peripheries present significant challenges for sustainable development planning [36,37]. Cities in Eastern Europe, including Tallinn, consumed the most land in Europe between 2006 and 2012 [38], making it important to understand the impacts of urbanisation on ESs in peri-urban areas such as Harku Municipality. Green and blue spaces, often referred to as green and blue infrastructure (GBI), represent the interconnected natural and semi-natural areas essential for ecosystem services and biodiversity preservation [39]. In urban areas, GBI, including parks, gardens, forests, and water bodies, presents many opportunities to enhance physical and mental health and to offer aesthetic and sensory benefits [40,41,42]. However, the loss and deterioration of these elements can have significant impacts on both biodiversity and human health and well-being [43,44,45,46,47,48]. The green and blue spaces in Harku are not only used by residents but also attract many visitors from nearby Tallinn due to their accessibility and variety. Consequently, the well-being benefits derived from these spaces extend beyond the boundaries of Harku Municipality itself.
The research aims to provide insights for targeted interventions, policies, and sustainable landscape management encompassing both methodological and conceptual aspects:
  • To combine landscape character assessment (LCA) and cultural ecosystem services (CES) frameworks;
  • To enhance the understanding of relationships between natural environment types (NETs) and contact types (CTs);
  • To use geospatial data to identify clusters and patterns of landscape character types (LCTs).
Aligned with these objectives, the study was guided by several research questions:
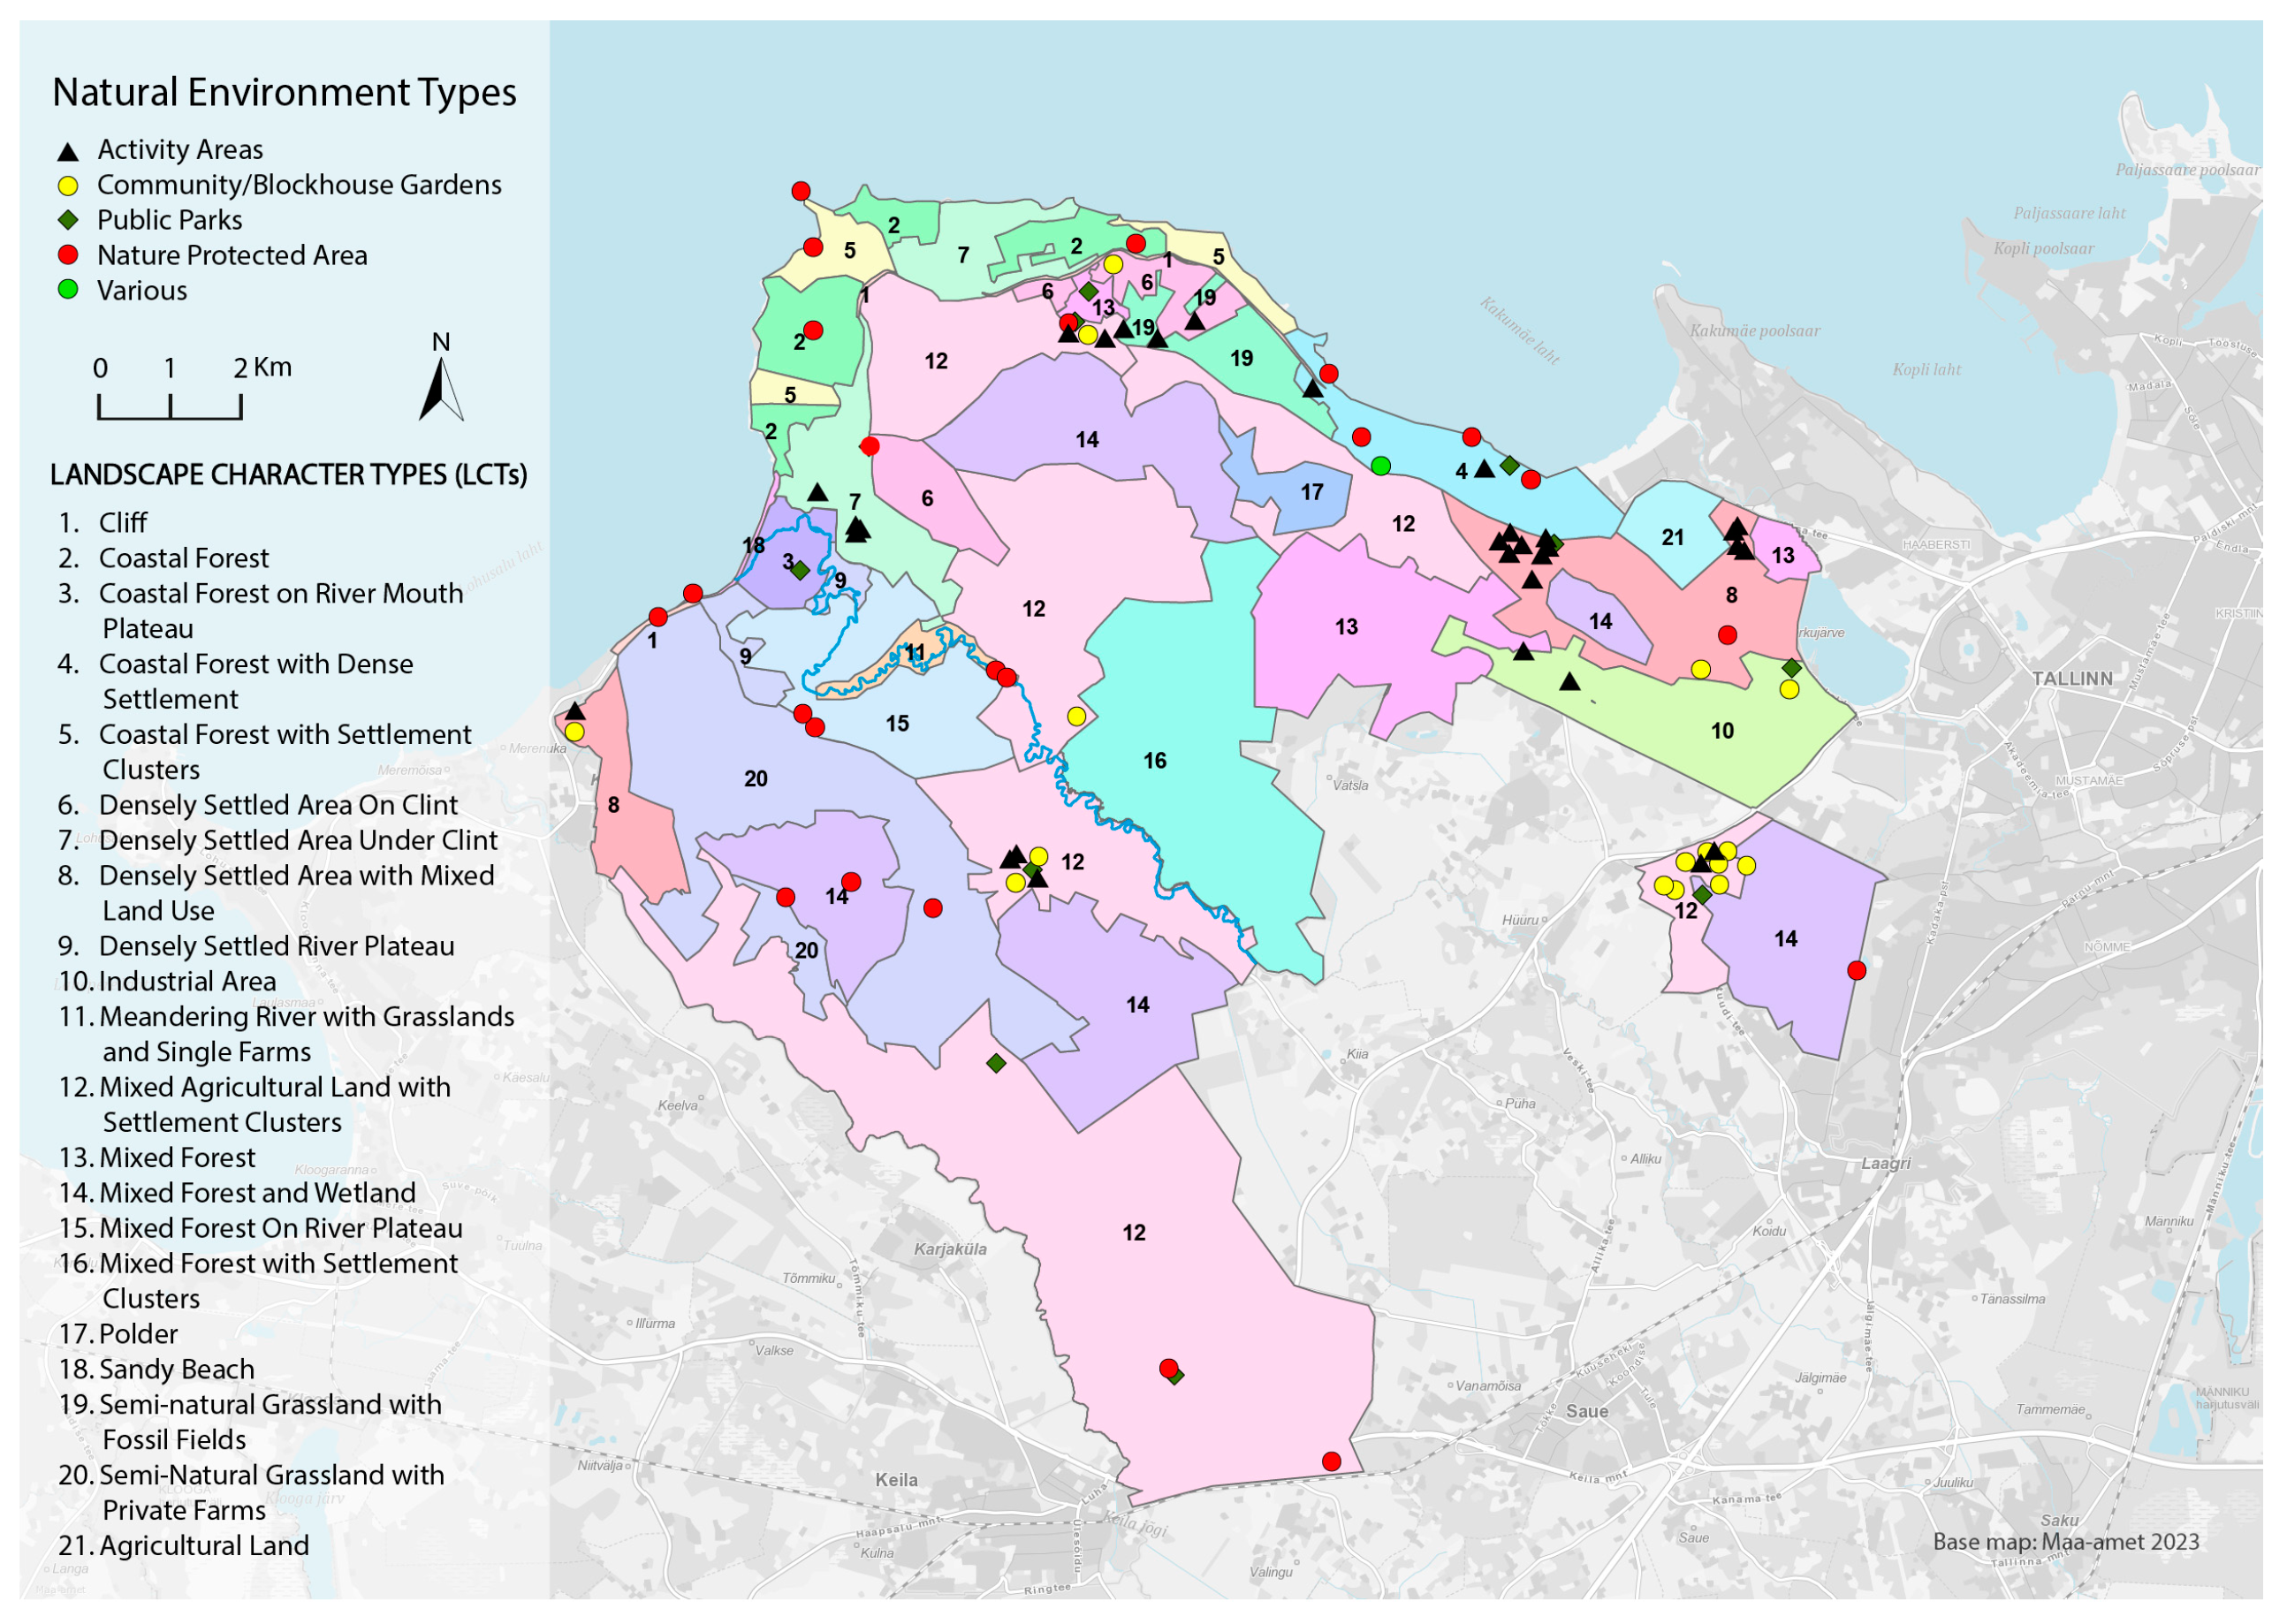
  • Research Question 1: Which natural environment types (NETs) are associated with which landscape character types (LCTs)?
  • Research Question 2: How do the landscape character types (LCTs) vary in terms of their well-being ratings and characteristics?
  • Research Question 3: How do the landscape character types (LCTs) cluster, and which values are concentrated within these clusters?

2. Materials and Methods
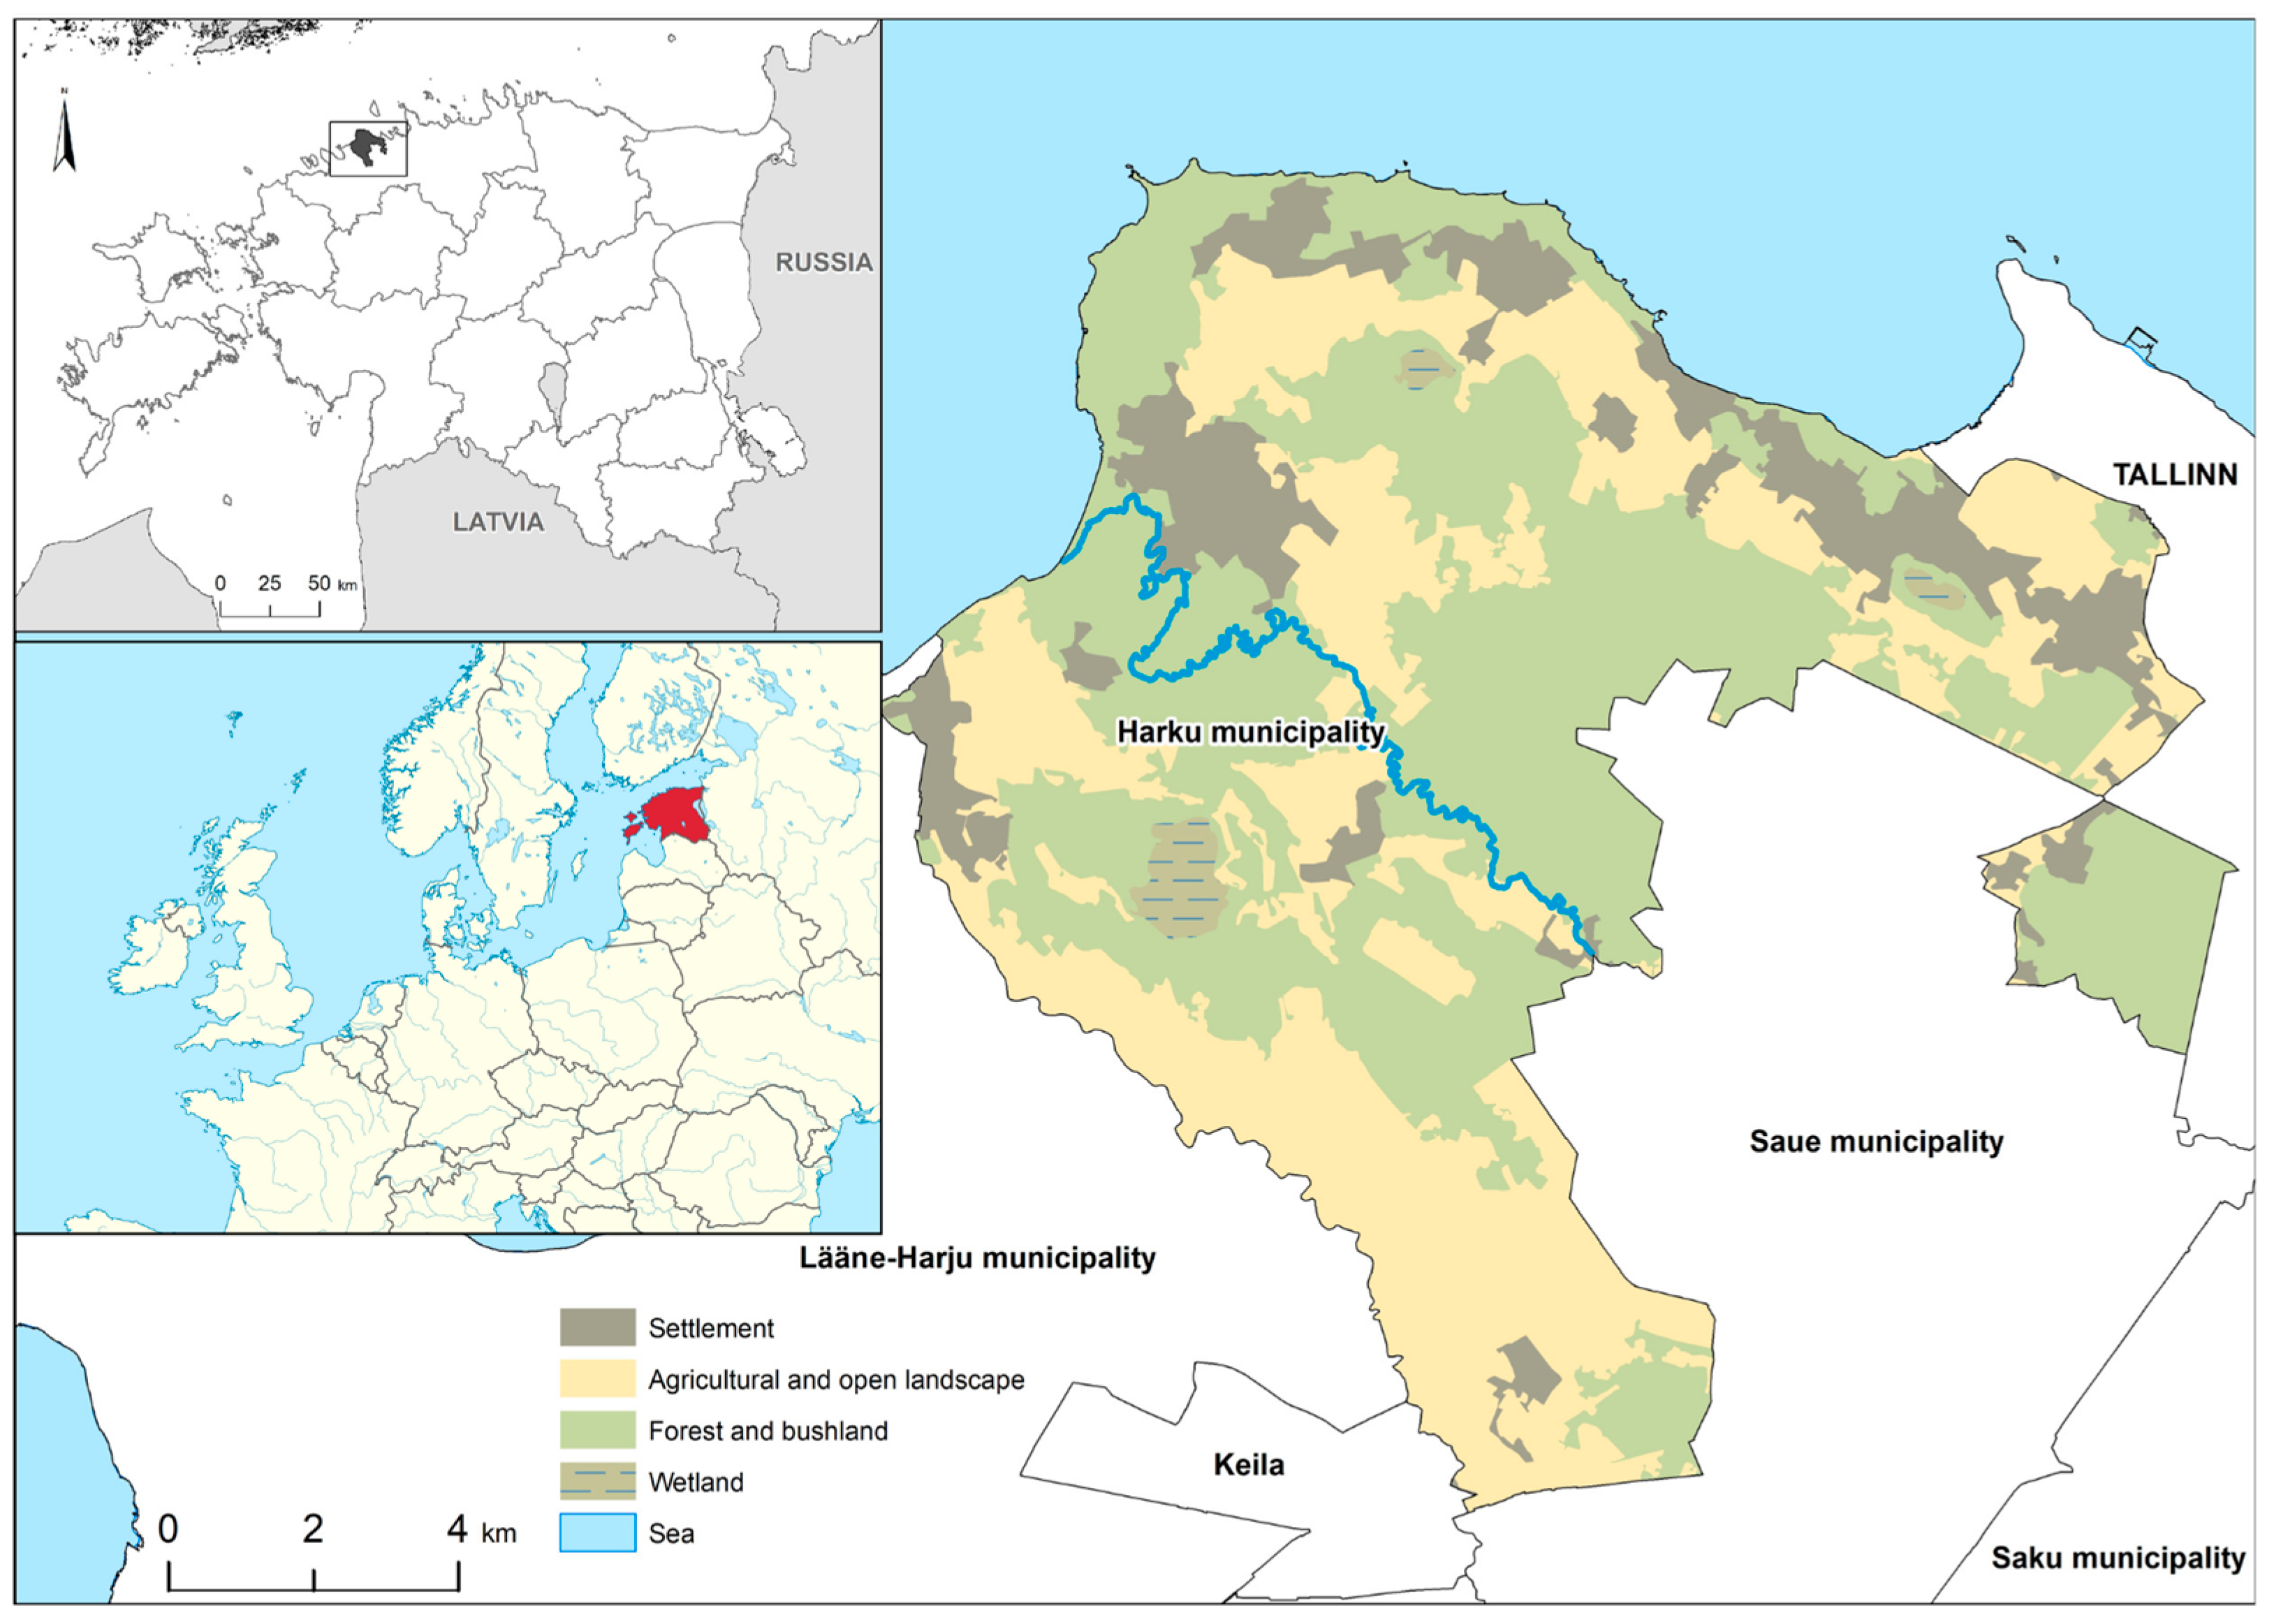
2.1. Case Study

The focus of the case study is the municipality of Harku, which is situated west of Tallinn, the capital of Estonia. It was chosen because it represents the typical peri-urban area around Tallinn. Harku is bounded by the Gulf of Finland to the north, and Lake Harku and Tallinn to the east, and it shares borders with neighbouring municipalities such as Saue, Keila, and Lääne-Harju (see Figure 1). As of March 2023, the population of Harku comprises 17,606 residents, covering an area of 159.7 km2 [49]. The municipality’s centre is the town of Tabasalu, home to over 3900 people and most of the municipality’s services and businesses. Tabasalu is 3.5 km from the Tallinn city border and 13 km from the city centre. The municipality possesses forest cover of approximately 40%, concentrated in the central part. Additionally, there are four nature conservation areas, numerous Natura 2000 sites, and other protected territories within the municipality [50].
In terms of climate, the Tallinn region receives an average of 700 mm of precipitation annually, slightly above Estonia’s average of 662 mm. Spring, from March to May, is the driest period, with monthly precipitation around 34–37 mm. The wettest months are August (85 mm) and July (82 mm). The average annual air temperature is 6.5 °C, matching the national average [51]. Harku Municipality has 172 sites listed in the National Cultural Heritage Register. Notable among these are historic lighthouses in Suurupi, Baltic–German manor complexes in Harku, Muraste, Kumna, and Vääna, along with fossil fields in Ilmandu and Muraste [52].
Although the population density is lower than that of Tallinn (454,000), it is higher than in most rural areas in Estonia [53]. The number of inhabitants fluctuates seasonally, being significantly higher during the summer. The study area can be considered peri-urban due to its location and characteristics. It exhibits a blend of urban and rural features, wetlands, and coastal areas (Figure 1 and Figure 2a–d). In the 1990s, over 20,000 Tallinn residents moved to the city suburbs. Higher-social-status individuals, about one fifth of the total population, opted for prestigious housing in newly developed coastal locations such as Harku and Viimsi [54,55]. However, these areas face pressures from both urban and rural development, leading to conflicts between land uses and potential environmental degradation [56], as well as challenges in securing land for housing and agriculture [57].
During the Soviet period (1940–1991), significant changes occurred in the land use structure. Agricultural land decreased, while the share of forests increased. These changes were primarily driven by land reforms in 1940, 1949 (collectivisation and deportations), and 1989, as well as urbanisation and concentrated agricultural production [58]. Since Estonia regained independence in 1991, the country has experienced urban expansion, and it has observed a 34% increase in urban land in Harku since 1993 (Figure 2a–d) [59]. As the country underwent economic and political transformations, the liberalisation of land ownership and the transition to a market economy led to increased urbanisation and population movement towards the fringes of the city.
Figure 2. Aerial views of two different sections of Harku show the urbanisation of the area in the past 20 years. (a,b) View 1: Muraste in 2002 and 2022. (c,d) View 2: Tabasalu in 2002 and 2022. Estonian Land Board (Maa-Amet) [60] (accessed on 17 August 2023).
Land 12 01825 g002

2.2. Methodology

Our methodological strategy was a two-step approach, which commenced with a landscape character assessment (LCA) to establish a comprehensive understanding of the features and qualities inherent to the study area. This method enabled a systematic evaluation of the landscape’s physical, biological, and cultural layers, facilitating the identification of distinctive landscape units and their defining characteristics. This was followed by the identification of natural environment types (NETs) and contact types (CTs) related to each landscape character type (LCT) and an assessment of the well-being benefits associated with these particular spatial patterns.

2.2.1. Landscape Character Assessment

The landscape character assessment (LCA) method separates the distinctive physical, visual, spatial, and perceptual attributes of a landscape [2]. To conduct this assessment, we applied a layering approach using geospatial datasets available from the Estonian Land Board’s spatial repository [60]. The dataset comprised the following layers:
  • Elevation;
  • Soil;
  • Hydrology;
  • Land Cover and Land Use;
  • Settlement Patterns and Roads;
  • Cultural Heritage and Nature-Protected Areas.
By overlaying and comparing these layers, we defined the distinct landscape character types (LCTs) across the area. The classification of these LCTs was based on the combination of specific features.
  • Typical Features: This approach involved classifying provisional LCTs based on the dominant features such as landforms combined with land cover, leading to, for example, flat agricultural land, forested coasts, and mixed forest on river plateaus.
  • Characteristic Features: In addition to the typical features, further categorisation was based on distinctive attributes, which encompassed factors such as settlement patterns (dense or scattered), coastal characteristics (cliffs, sandy beach, the presence of wetlands, and the composition of forests (mixed or single species).

2.2.2. Identification of Natural Environment Types and Contact Types

We gathered geospatial data from diverse sources, e.g., satellite imagery, aerial photographs, and land use maps [60], to enrich our understanding of the landscape character and component distribution, especially for natural environment types (NETs) and contact types (CTs). Processing and integrating the geospatial data provided a spatial context, enhancing our understanding of how landscape features, NETs, and CTs interacted within the study area. Secondly, by incorporating geospatial data, our analysis accurately reflected the study area’s attributes, ensuring precision in representing landscape characters and their associations with CES.
Building upon the outcomes of the LCA, we implemented the cultural ecosystem services (CES) framework, outlined in our earlier work [34] and summarised for ease of reference below. The CES framework was developed through a series of expert interviews, in order to assess various green and blue spaces and Cultural Ecosystem Services (CES) in the area, categorising them into Natural Environment Types (NETs) and Contact Types (CTs). NETs represented a spectrum of landscape elements, while CTs encompassed dimensions such as recreation, stress relief, aesthetic perception, and restoration (see Supplementary File S1). Experts were chosen on their diverse background relevant to our research context, encompassing ecological, urban, social, and educational dimensions. The panel included a chief forest manager, a spatial developer, a former council member and mayors, a municipality architect and a local schoolteacher and geographer. To compile the data, we provided the experts with an extensive matrix (Supplementary File S1) that outlined various NETs and CTs for their evaluation. To ensure validity, we ensured the following measures:
  • Inter-Rater Reliability Analysis: To assess agreement among experts’ ratings.
  • Experts Panel Discussion: To discuss and refine their ratings.
  • Average Mean Scores Calculation: To provide a broader perspective on the relationship between green and blue spaces, contact types, and well-being.
These measures collectively enhanced the data’s reliability and utility, providing a reliable foundation for our research findings. This foundation supported our continued investigation of the CES and well-being relationship, now augmented by the addition of Landscape Character Assessment (LCA) methods to ensure a comprehensive analysis.
During the interviews, the experts assigned ratings to each NET and CT combination, resulting in average scores that quantified the provision of CES for different landscape contexts. These scores encapsulated the varying degrees of cultural benefits associated with each distinct landscape unit and laid the groundwork for our subsequent analyses.

2.2.3. Integration of LCA and CES

The next step was to integrate the average scores derived from the CES assessment into the LCA framework. Geographic Information System (ArcGIS 10.8.2) software was used to map the distribution of NETs and CTs based on CES assessment outcomes. This synthesis resulted in the creation of three primary maps, each visually depicting the distribution of natural environment types (NETs) aligned with “restorative”, “social”, and “cognitive” contact type (CT) categories. Colour-coded maps were used to show the varying degrees of CES provision across the landscape. We employed the natural breaks algorithm (Jenks) [61,62] to group similar values together while maximising differences between classes. This aided in categorising features based on significant differences in data values and the creation of the clusters.
Following the landscape character assessment (LCA), each LCT was aligned with its corresponding NET. CT values inherent to each unit were assigned based on its corresponding NET. Through this procedure, we calculated the average CT value for each unit by synthesising the CT values of its respective NET. This step allowed us to capture the specific relationship between landscape attributes and the cultural benefits that they provide. By amalgamating the CT values of the NETs within each LCT, we derived an average CT value that represented the broader landscape category. This gave a comprehensive measure of the restorative, social, and cognitive impacts that specific LCTs offer to human well-being.
To calculate the CT values displayed in Table 1, we followed a systematic process based on the data from the LCA. Below, we provide a breakdown of the procedure employed to calculate these values specific to the landscape character type no. 12 (LCT 12) as a worked example.
  • Identification of NETs: We began by identifying natural environment types (NETs) associated with each polygon in our study. In the case of “Mixed Agricultural Land with Settlement Clusters” (LCT 12), there were six distinct areas (polygons) considered.
  • Assignment of CT values: For each of these identified NETs within LCT 12, we assigned specific contact type (CT) values. These CT values were based on the characteristics of each NET and the cultural benefits that it offers in terms of restorative, social, and cognitive aspects.
  • Calculation of Average CT Value for LCT 12: Once the CT values for each NET within LCT 12 were determined, we calculated the overall average CT, which represents the combined impact of all the NETs within this specific landscape character type (LCT).
The average CT value for LCT 12 in Table 1 quantifies the influence of this specific landscape type on cultural benefits, encompassing restorative, social, and cognitive well-being. Importantly, this methodology was consistently applied to calculate CT values for all LCTs included in our study.

3. Results

3.1. Identifying the Landscape Character Types (LCTs)

Our landscape character assessment produced 21 distinct landscape character types, distributed across 47 individual landscape character areas (see Table 2). These LCTs presented a mosaic of combined physical, ecological, and aesthetic attributes.

3.2. Grouping of Natural Environment Types (NETs)

In the study area, prominent NETs included activity areas, community and blockhouse gardens, nature-protected areas, and various types like cemeteries and quarries. These NETs closely connected with the 21 LCTs spatially distributed LCTs throughout the region. Activity areas were most common in LCT 8 (a densely settled area with mixed land use), while LCT 4 (coastal forest with dense settlement) was characterised by NETs such as nature-protected areas, various types, public parks, and activity areas (Figure 3, Table 1, and Supplementary File S2).

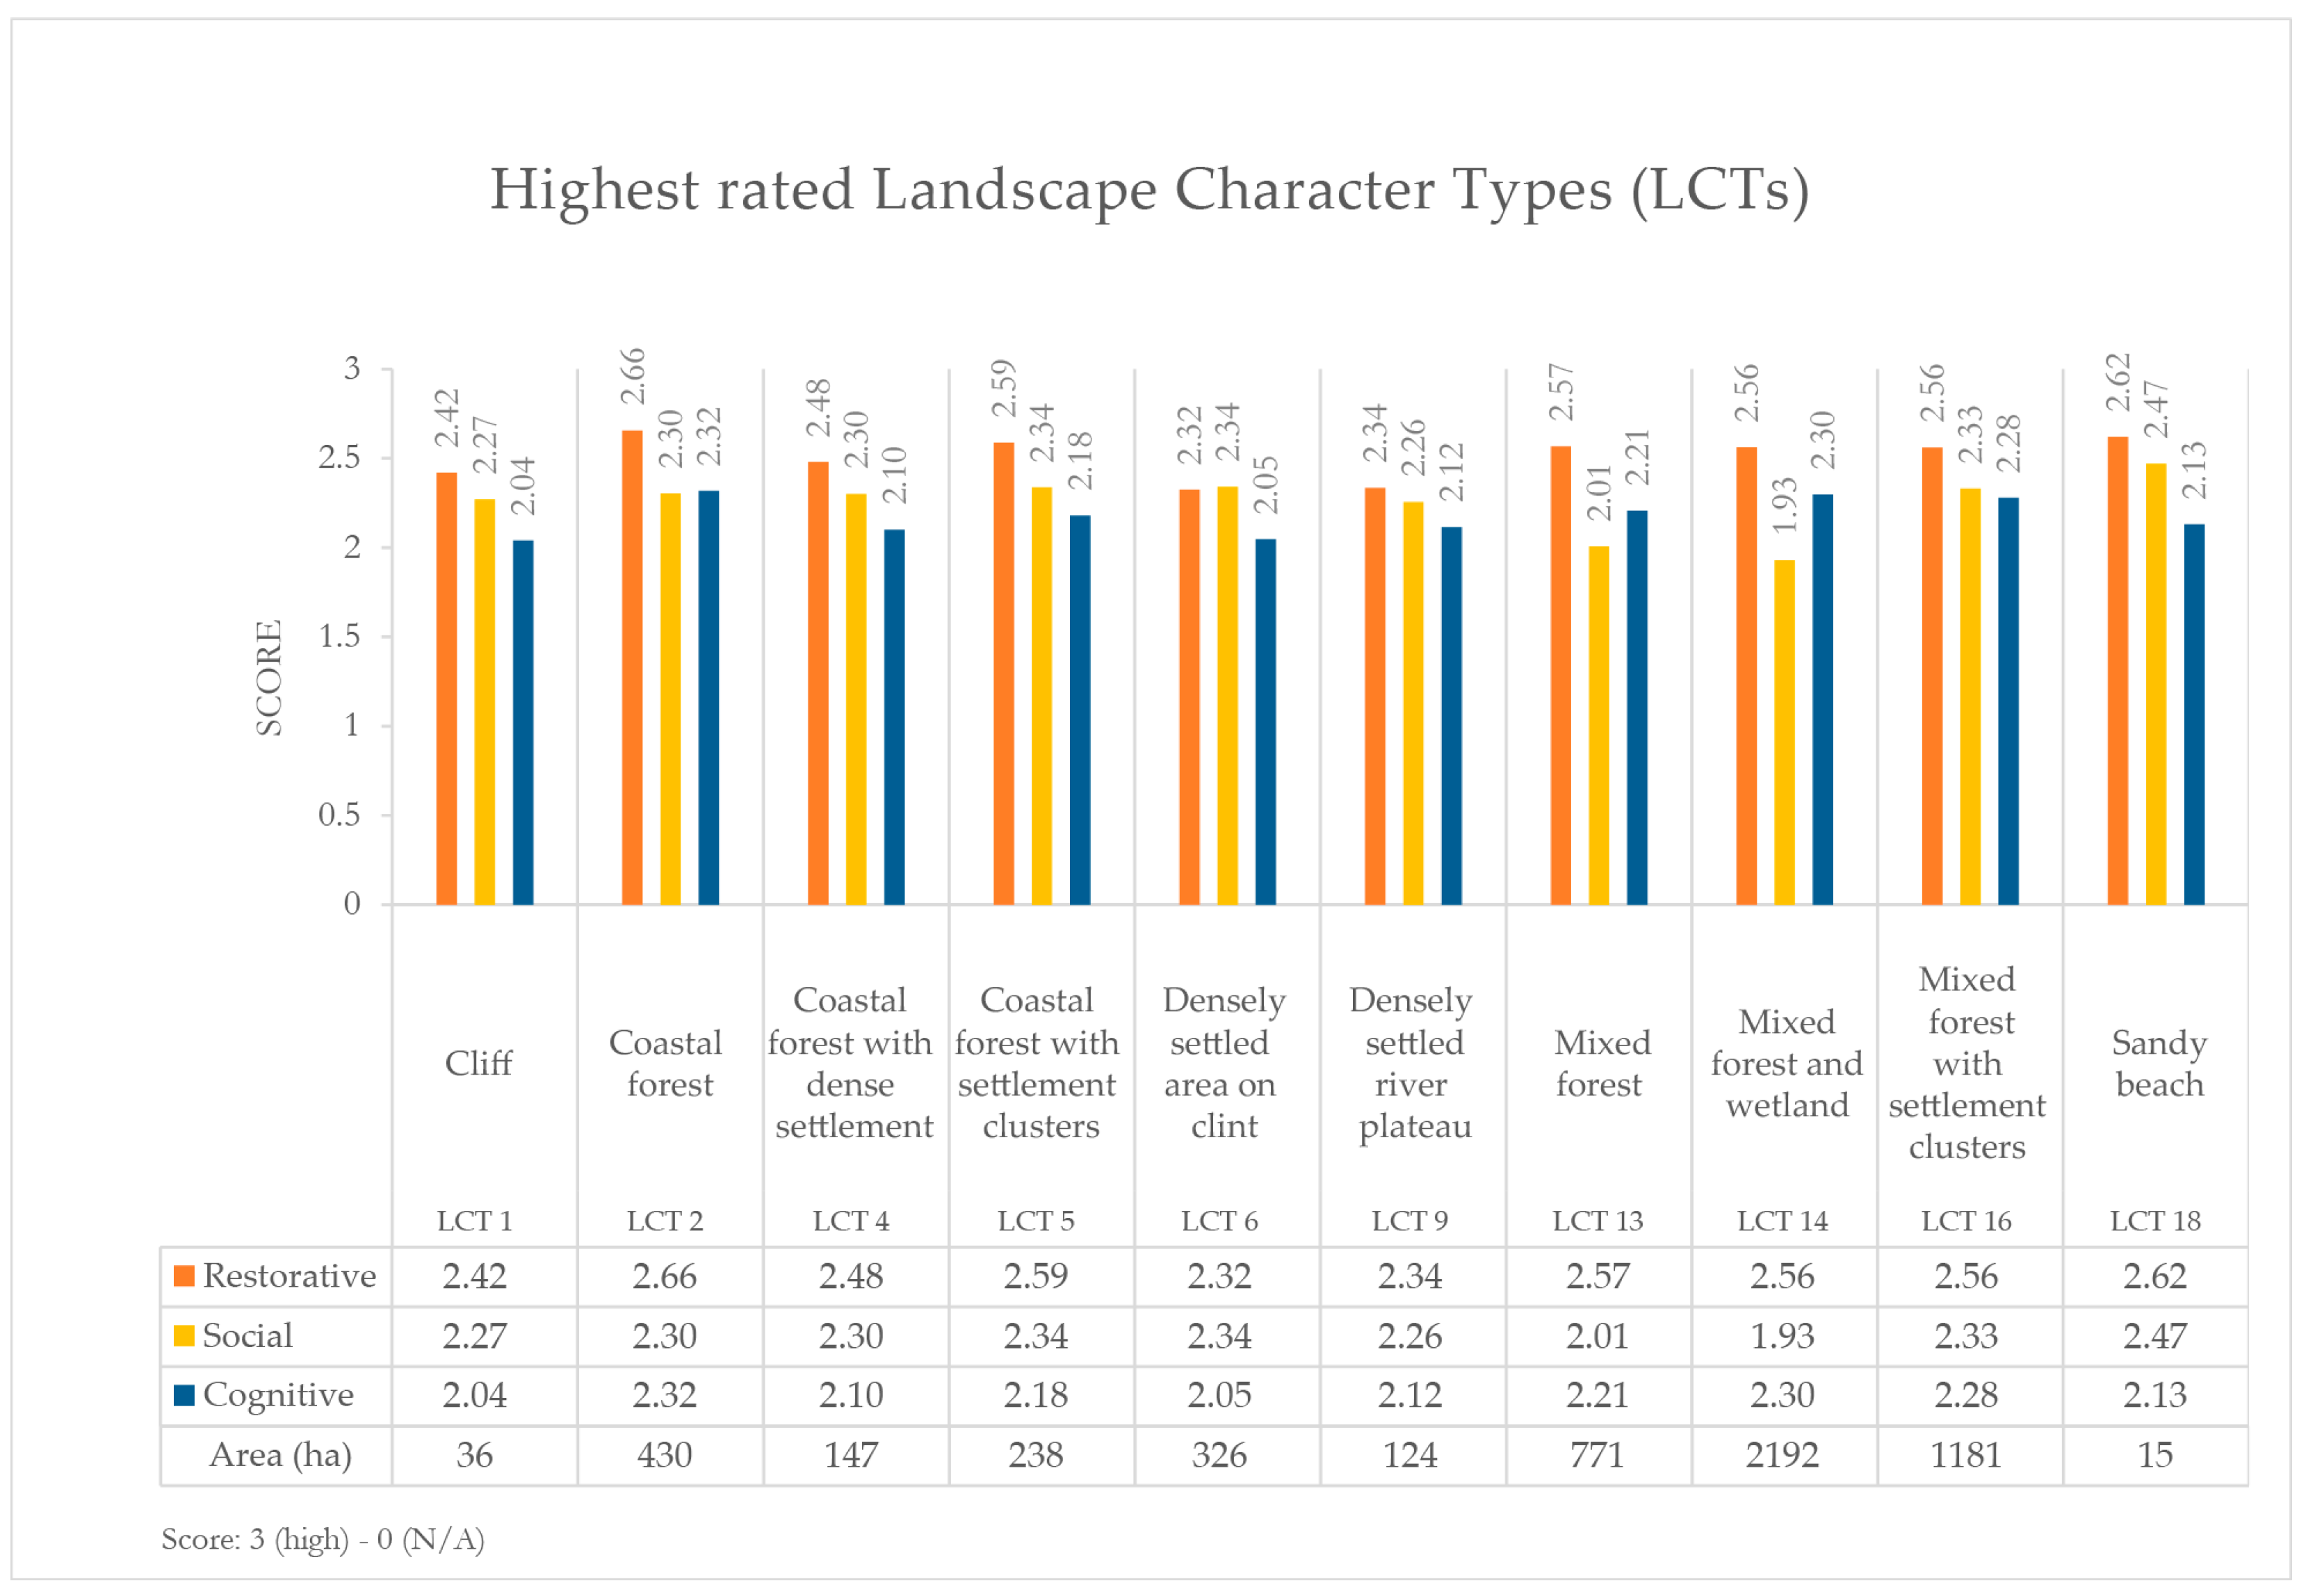
3.3. Landscape Character Type (LCT) Value Ranking

The ten highest-ranked LCTs based on their restorative, social, and cognitive values were as follows (Figure 4, Supplementary File S3):
  • Cliff (LCT 1);
  • Coastal Forest (LCT 2);
  • Coastal Forest with Dense Settlement (LCT 4);
  • Coastal Forest with Settlement Clusters (LCT 5);
  • Densely Settled Area on Clint (LCT 6);
  • Densely Settled River Plateau (LCT 9);
  • Mixed Forest (LCT 13);
  • Mixed Forest and Wetland (LCT 14);
  • Mixed Forest with Settlement Clusters (LCT 16);
  • Sandy Beach (LCT 18).
The analysis of the three dimensions—“restorative”, “cognitive”, and “social” values—across all LCTs revealed interesting patterns. These findings are explained and illustrated below through three different value maps (Figure 5, Figure 6 and Figure 7), presenting assessment scores ranging from 0 (indicating a lack of values) to 3 (indicating high value) across the area. Moreover, these maps illustrate the overlay of these scores and the spatial arrangement of the 21 LCTs.
The “restorative” value emerged as the highest-ranked dimension in all LCTs, showing strong connections in several landscape types, namely Coastal Forest (2.66), Sandy Beach (2.62), Coastal Forest with Settlement Clusters (2.59), Mixed Forest (2.57), Mixed Forest and Wetland (2.56), Mixed Forest with Settlement Clusters (2.56), Coastal Forest with Dense Settlement (2.48), Cliff (2.42), Densely Settled River Plateau (2.34), and Densely Settled Area on Clint (2.32). The lowest-ranked landscape types were Polder (1.56), Semi-Natural Grassland with Fossil Fields (1.86), and Agricultural Land (1.72) (Figure 5, Supplementary File S2).
The “social” value, showed strong connections in Sandy Beach (2.47), Coastal Forest with Settlement Clusters (2.34), Densely Settled Area on Clint (2.34), Mixed Forest with Settlement Clusters (2.33), Coastal Forest with Dense Settlement (2.30), Coastal Forest (2.30), Cliff (2.27), and Densely Settled River Plateau (2.26). The weakest connections were observed in Agricultural Land (1.66), Industrial Area (1.84), Mixed Forest and Wetland (1.93), and Polder on (1.93) (Figure 6, Supplementary File S2).
The “cognitive” value ranked second highest, demonstrating significant connections in Coastal Forest (2.32), Mixed Forest and Wetland (2.30), Mixed Forest with Settlement Clusters (2.28), Mixed Forest (2.21), and Coastal Forest with Settlement Clusters (2.18). The lowest rankings were found in Industrial Area (1.67), Densely Settled Area under Clint (1.97), and Densely Settled Area with Mixed Land Use (2.01) (Figure 7, Supplementary File S2).

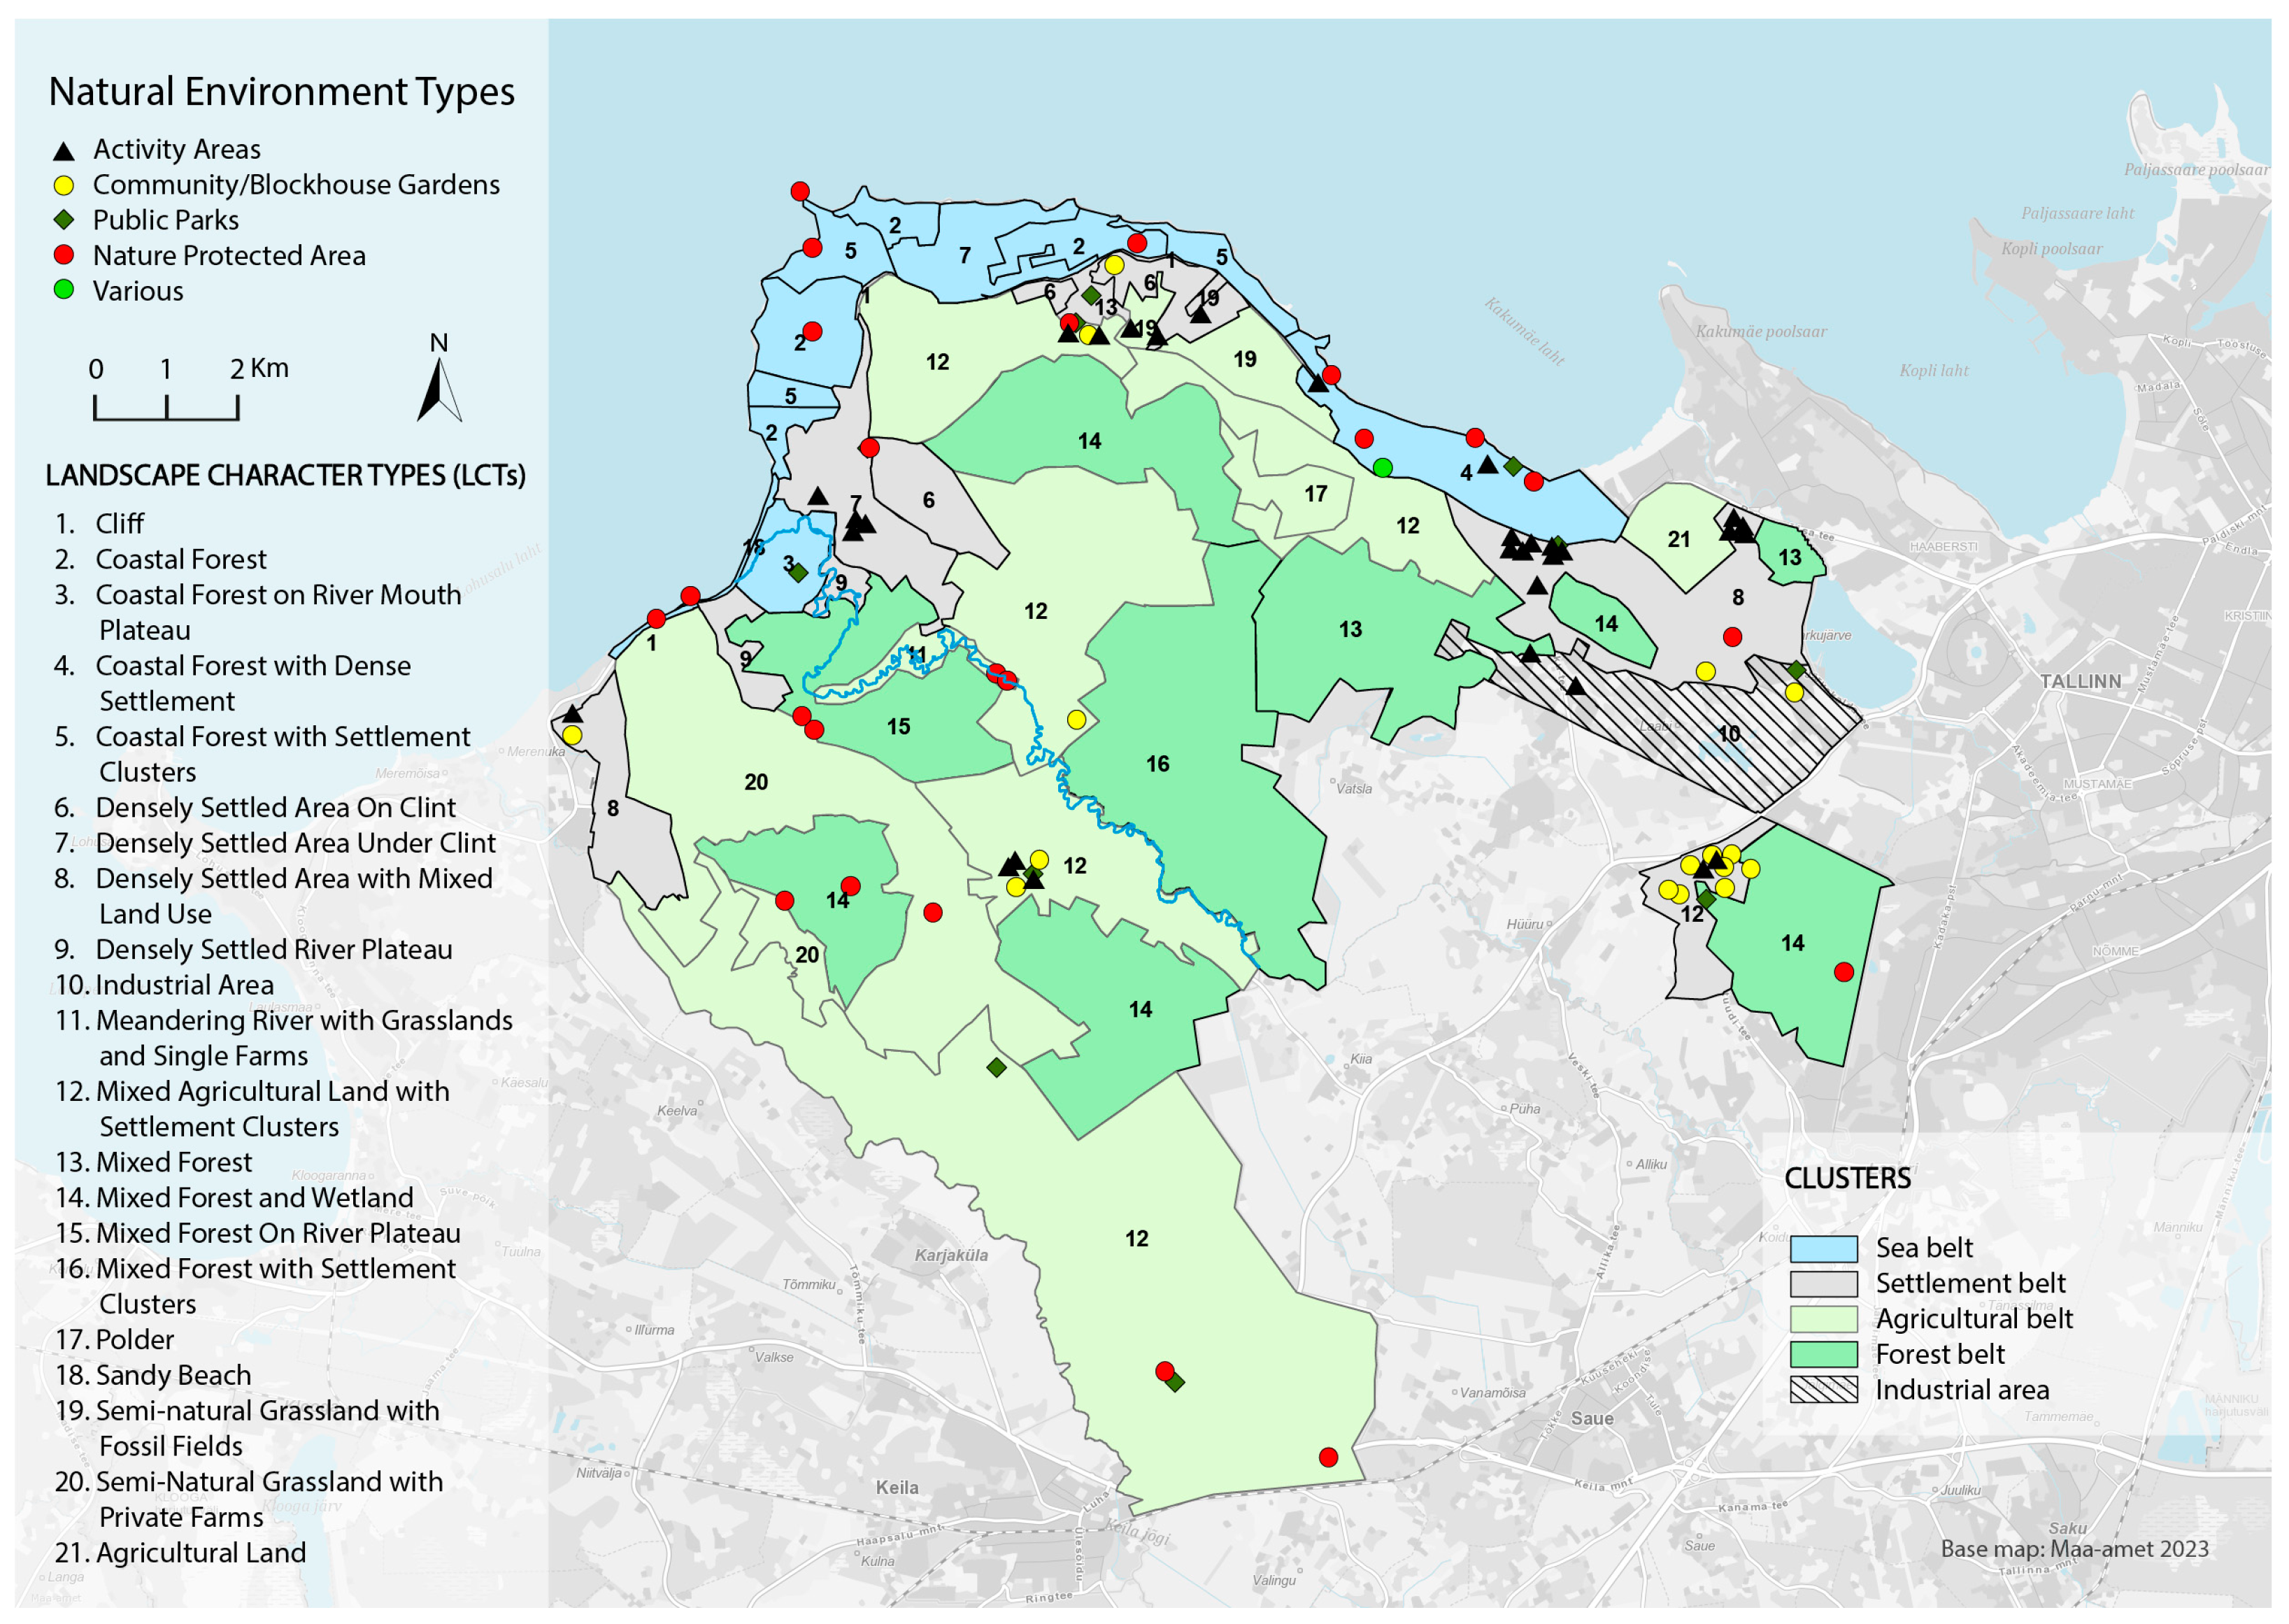
3.4. Clustering Landscape Character Type (LCT) Belts

The application of LCA effectively established that, driven by different landscape attributes, LCTs naturally aggregated into four clusters or belts, progressing from north to south: sea belt, settlement belt, agricultural belt, and forest belt.
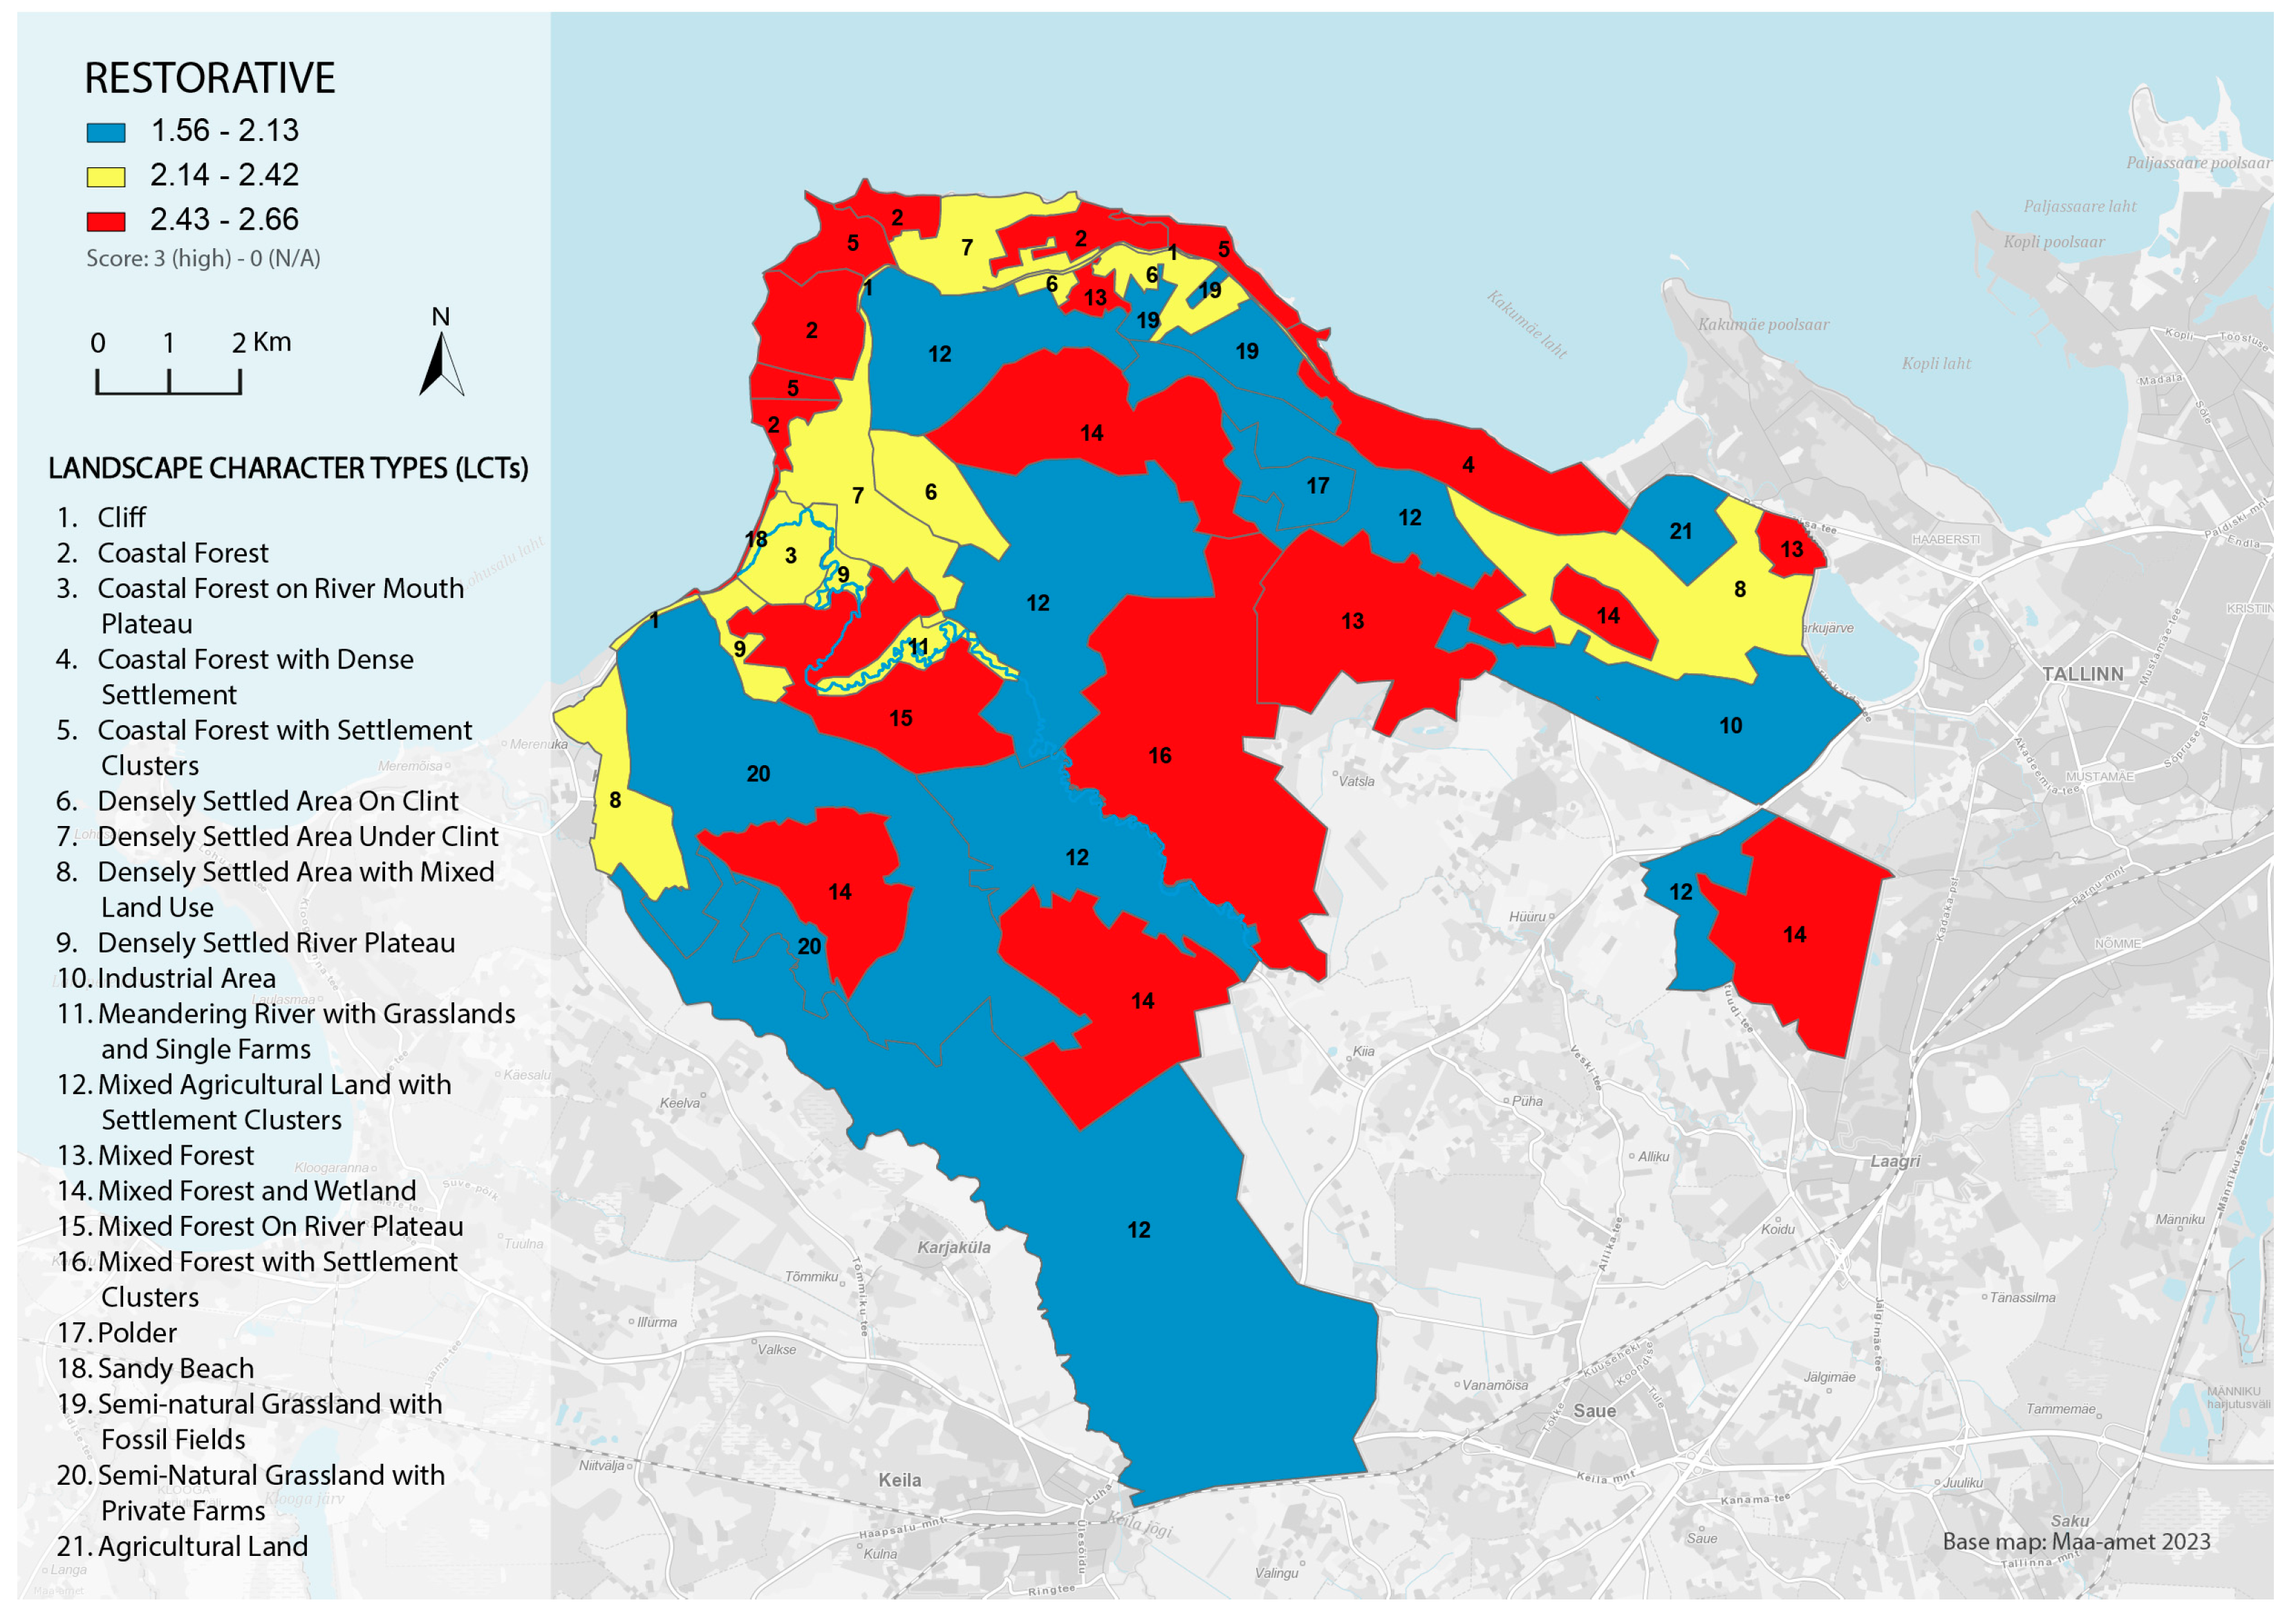
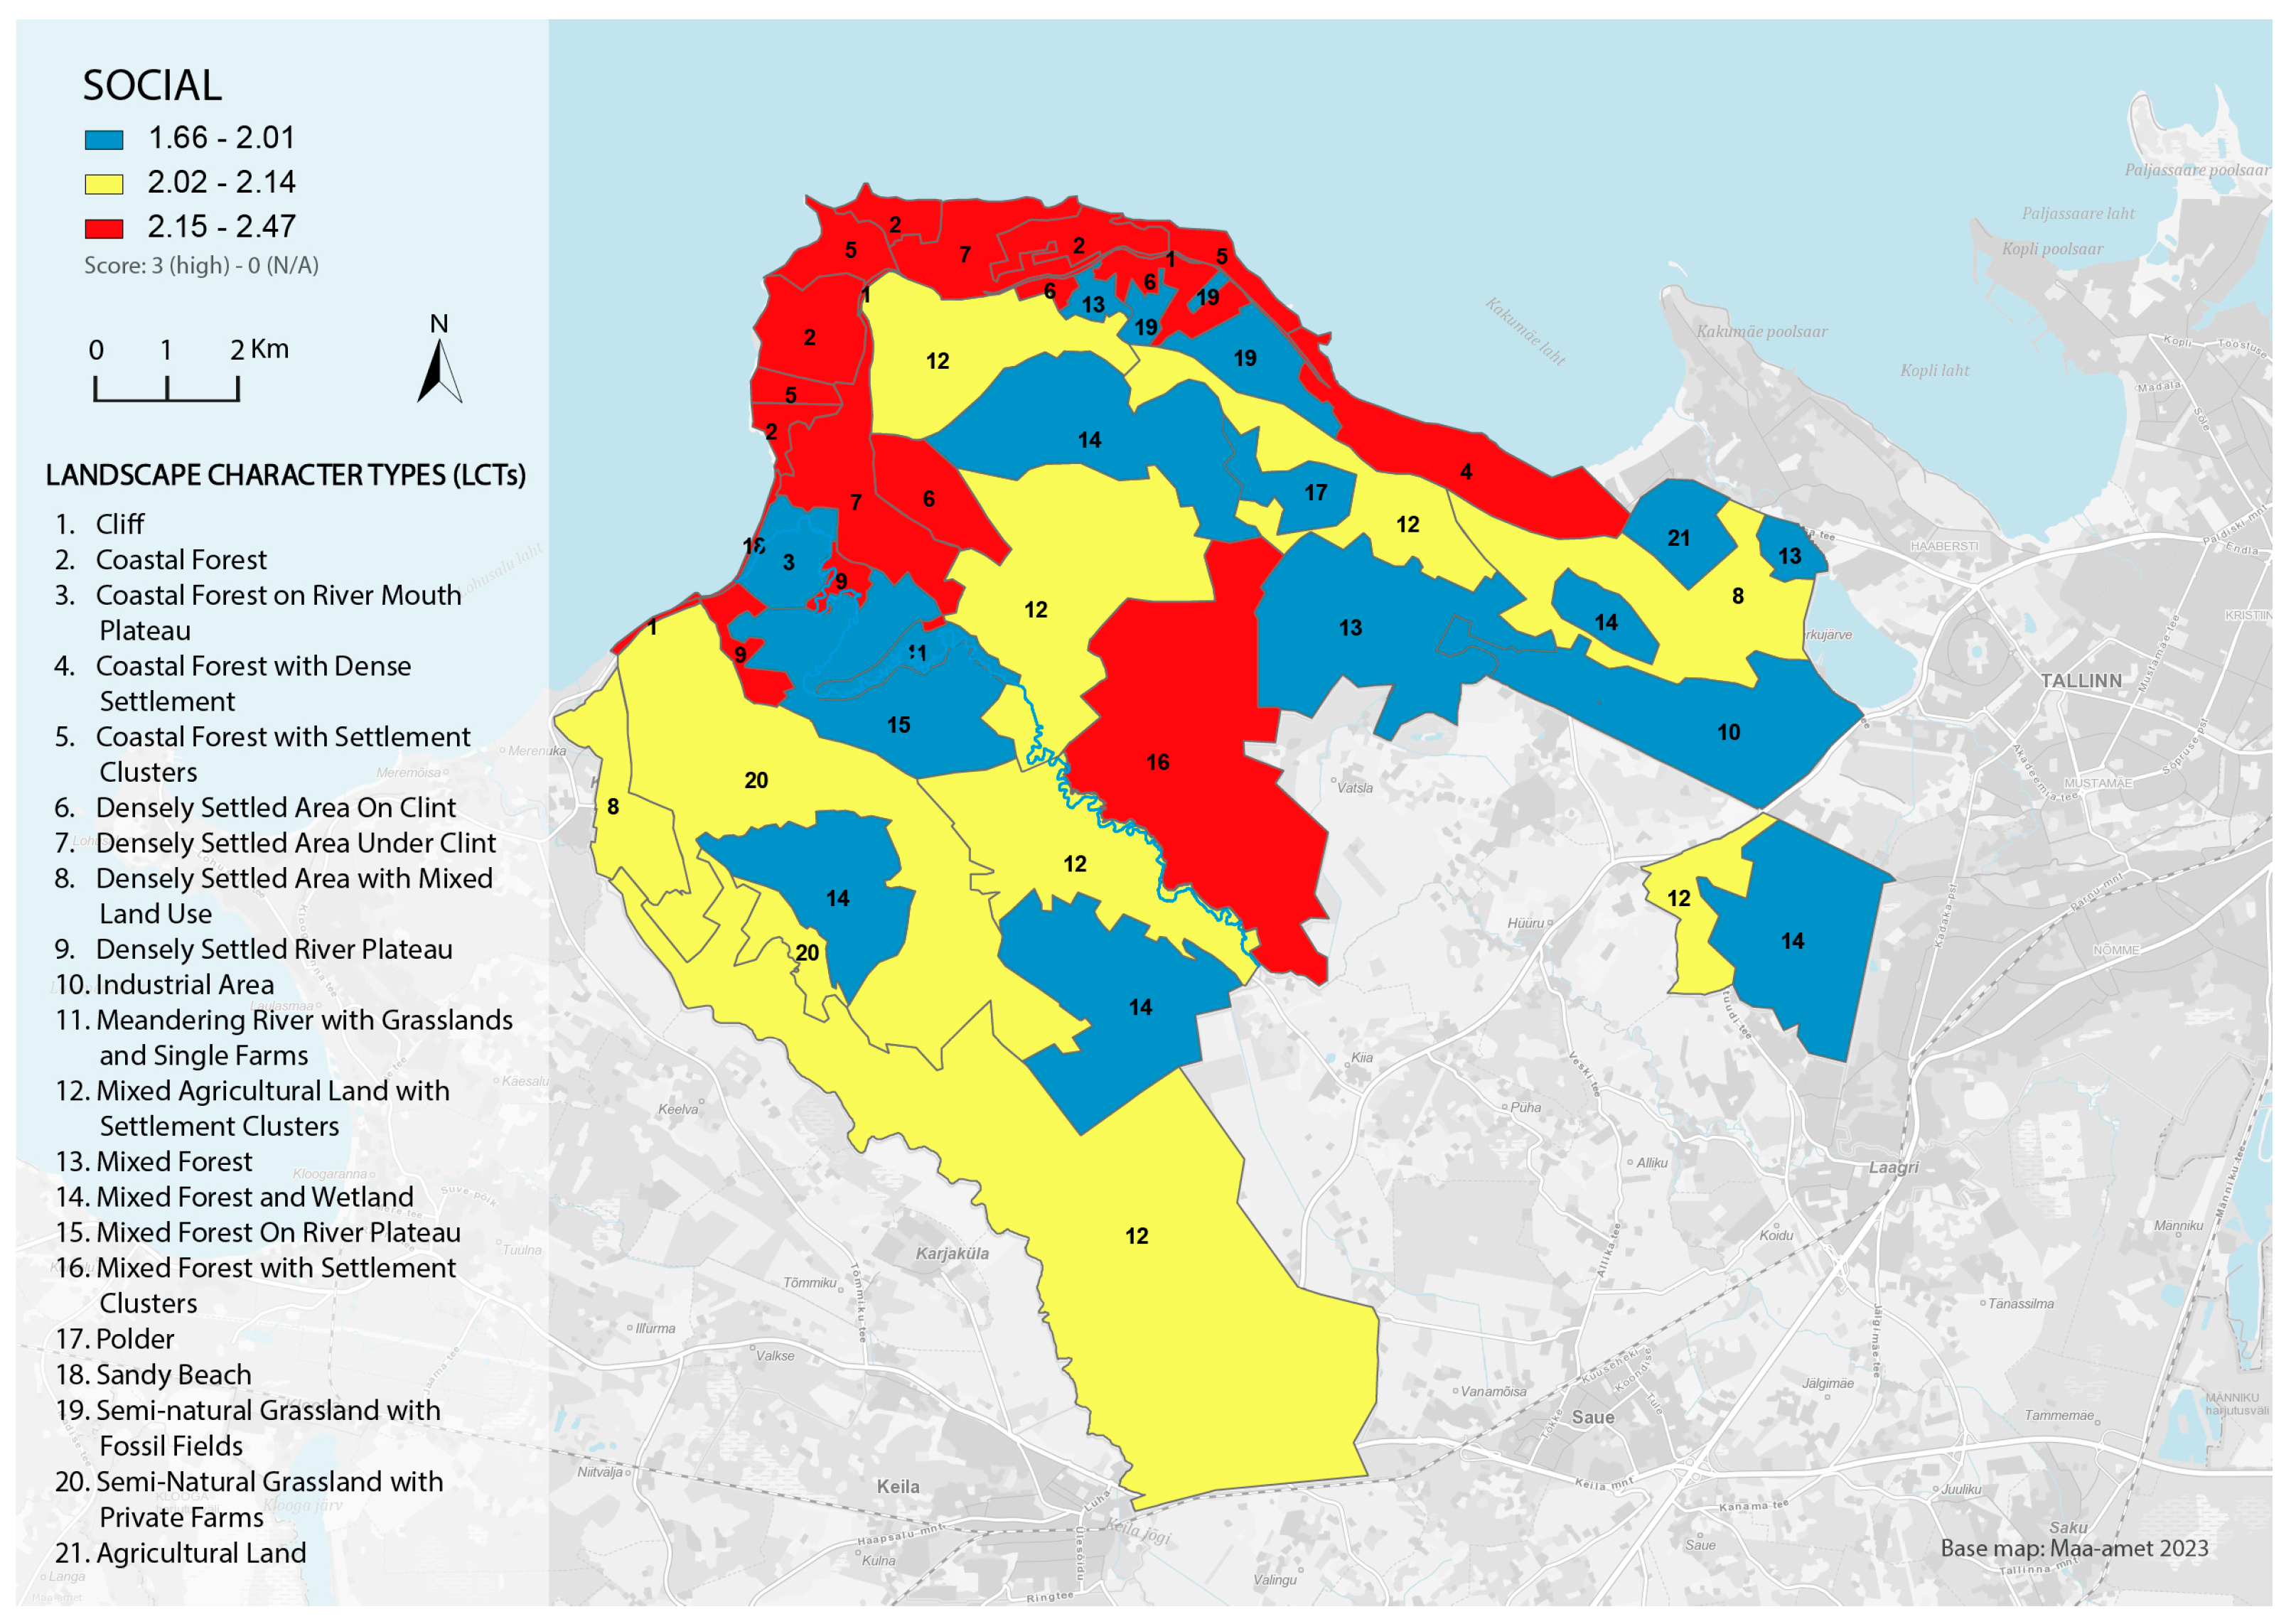
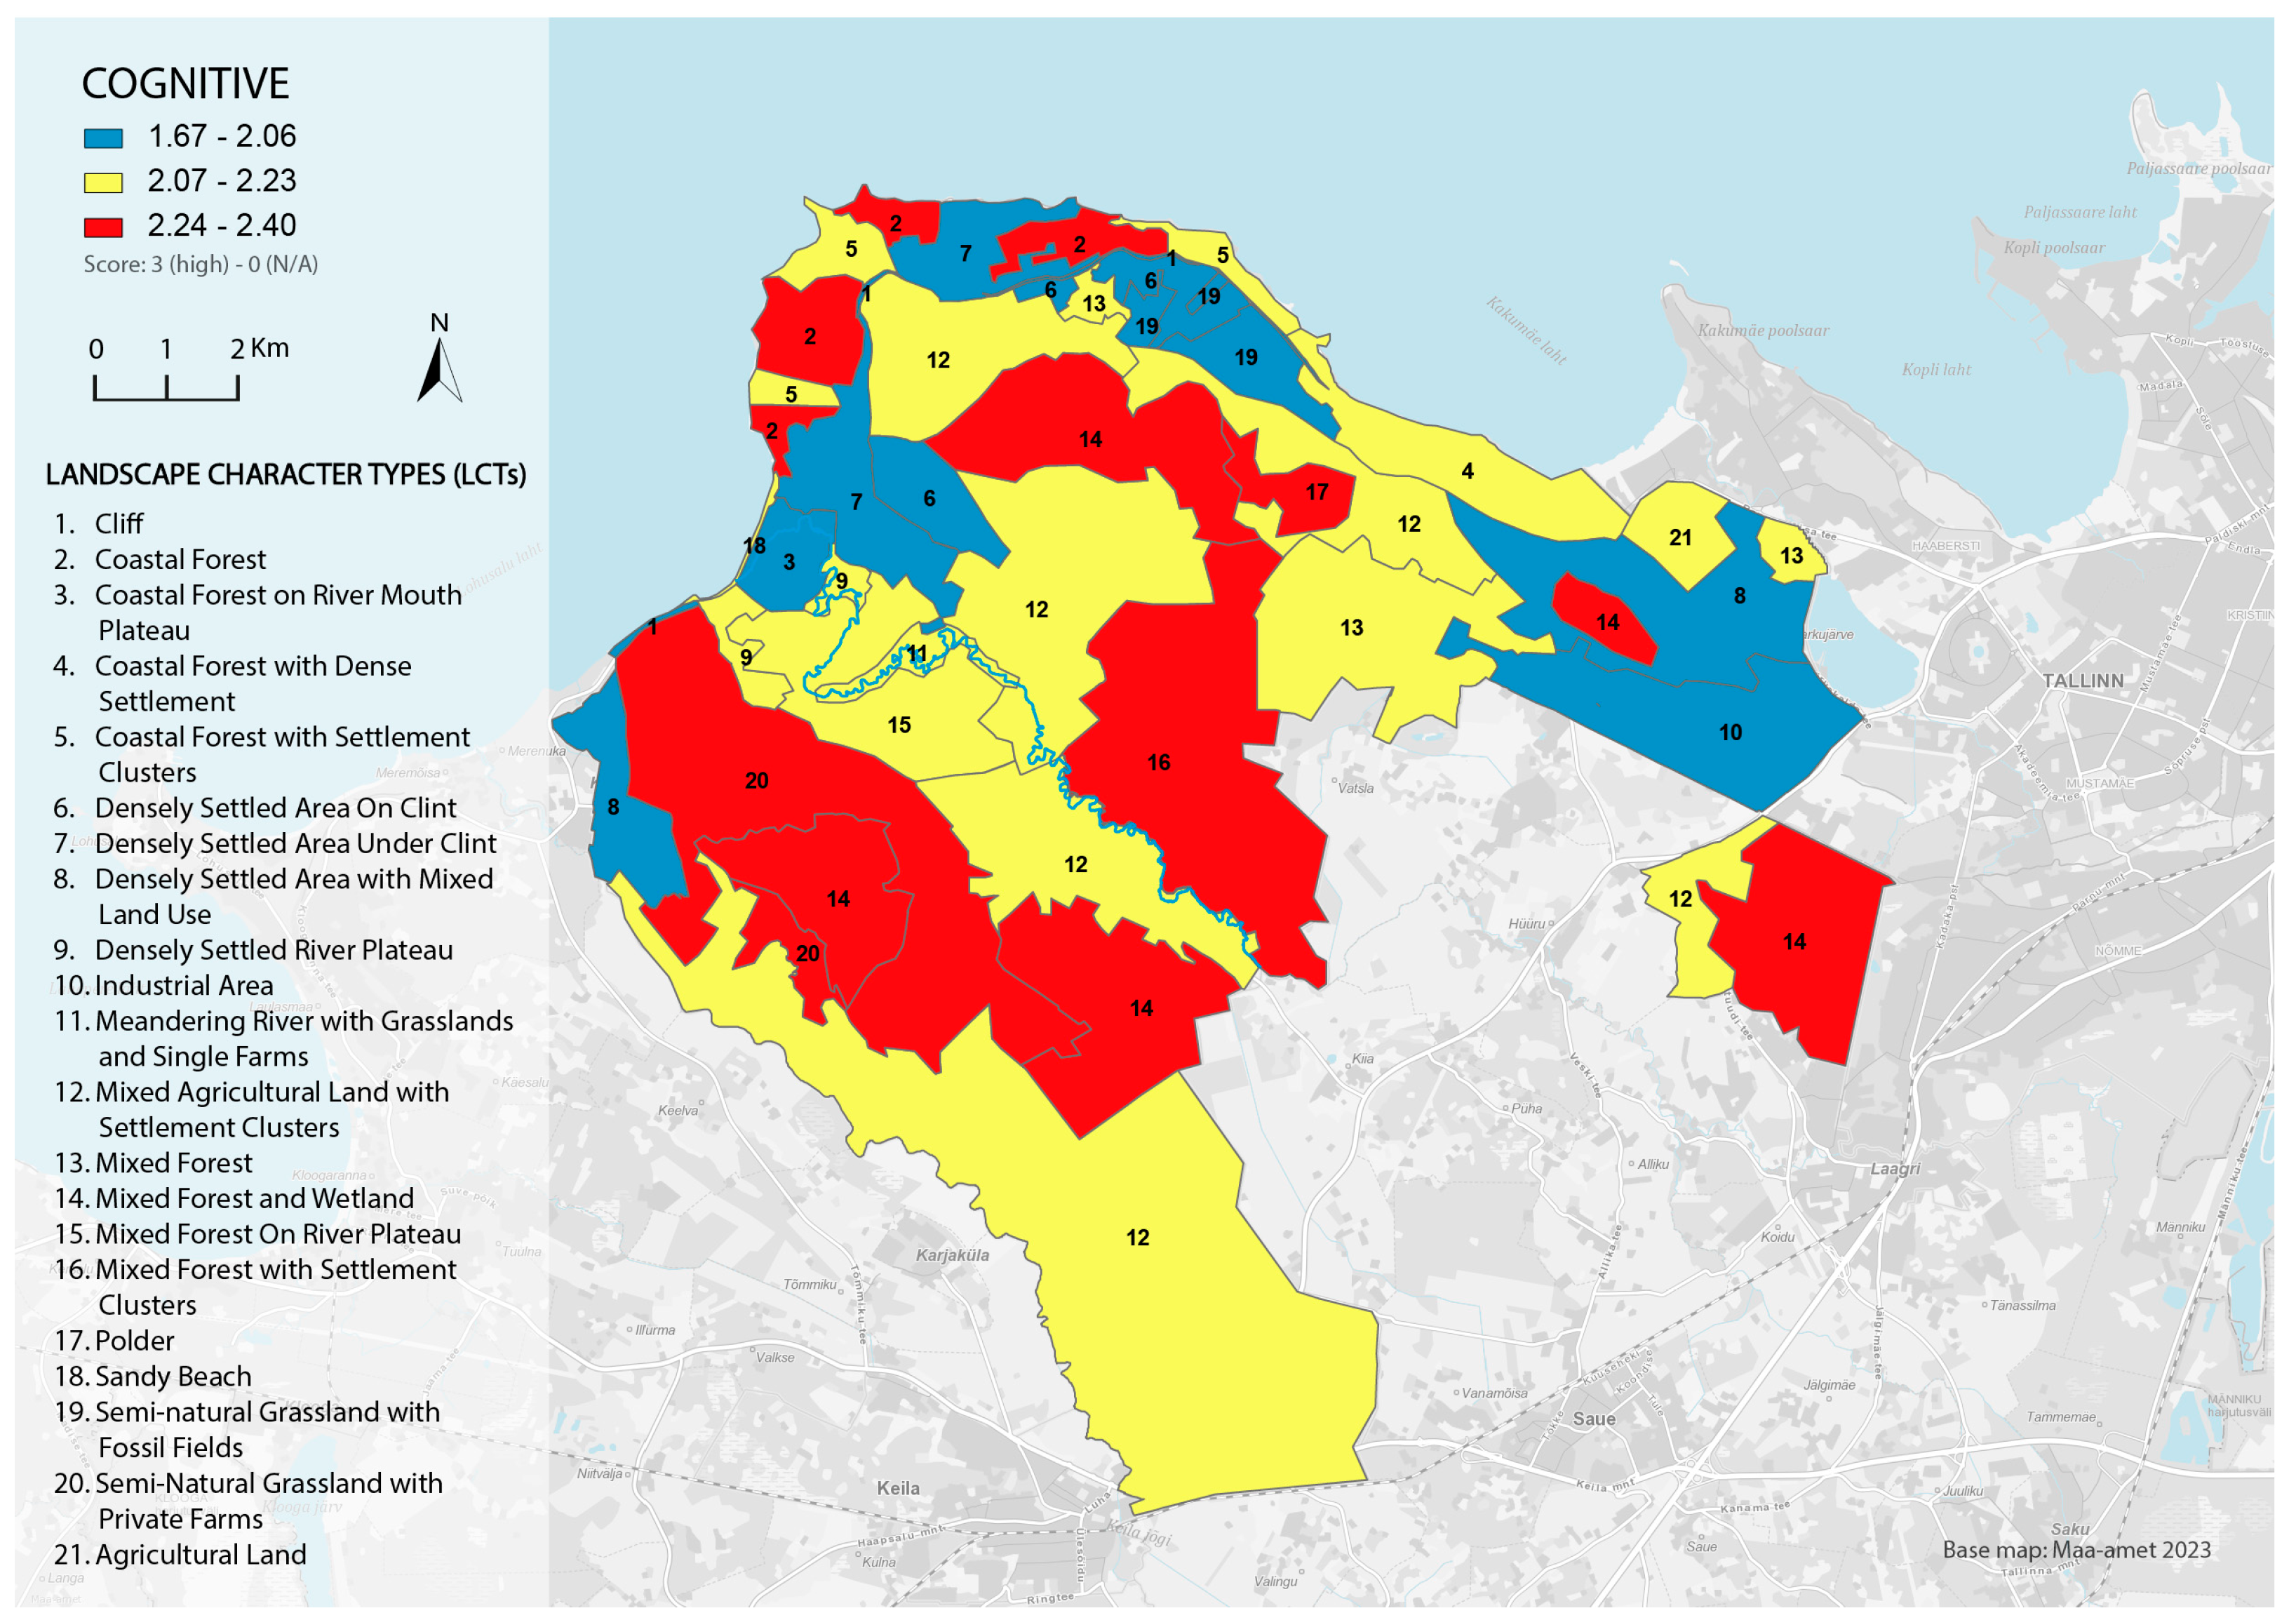
  • Sea Belt: situated along the northern coast and bounded by the sea, this features a coastal forest landscape marked by predominantly sparse or small settlement clusters. The region encompasses many nature protection areas linked to the sea, such as a beach, coastal nature park, and cliff NETs. LCTs within the sea belt exhibit the highest restorative (2.66–2.38) and social (2.47–1.95) CT values, whereas cognitive values are low, between 2.31 and 1.97.
  • Settlement Belt: characterised by densely populated areas featuring private houses and blockhouses, this is concentrated in core zones like Tabasalu, Harku, and Keila-Joa. This area demonstrates high values for both restorative (2.48–2.13) and social (2.34–2.13) CT values under the activity areas’ NETs. These results also extend through the community gardens and public playgrounds near blockhouses.
  • Agricultural Belt: characterised by mixed agricultural land of cultivated fields, (semi-)natural grasslands, settlement clusters, and single farms. It presents relatively lower restorative (2.24–1.56) and social (2.13–1.66) CT values. However, it features comparatively higher cognitive values (2.4–2.16).
  • Forest Belt: characterised by a mix of forests, wetlands, and minimal settlement density. While distinct NET clusters are absent in this belt, the restorative CT value remains generally high, ranging between 2.56 and 2.24. This value is the second highest after the sea belt. The social value of LCTs within the forest belt varies from 2.33 to 1.99, contingent on settlement density.
In addition, the industrial area (LCT 7) does not fit into any of these established belts, indicating a degree of uncertainty or complexity in its association with NETs and CTs (Figure 8).

4. Discussion

4.1. Answering the Research Questions

The synthesis of cultural ecosystem services (CES) and landscape character assessment (LCA) frameworks within this study marks a useful development in understanding the interplay between the two aspects. By combining these frameworks, we have built a means of illuminating the multifaceted relationships that underpin dynamic peri-urban landscapes, contributing to the enhancement of landscape management strategies [34]. The integration of the CES evaluation of cultural values spanning restorative, social, and cognitive dimensions with the LCA has resulted in a clear pattern of different benefits associated with specific landscape types.
In terms of answering research question 1, regarding which natural environment types (nets) are associated with which landscape character types (LCTs), the results have revealed valuable insights into the complexity of peri-urban landscapes. The interaction of NETs, encompassing activity areas, community and blockhouse gardens, nature-protected zones, and various types like cemeteries and quarries, demonstrates specific associations between the LCTs and NETs within the study area. These NETs intertwine with the 21 identified LCTs, each emerging as a distinctive composition of natural attributes and human interactions. LCT no. 8 stands as a testament to the prevalence of activity areas within densely populated regions characterised by mixed land use. Similarly, LCT no. 12 underscores the fusion of community and blockhouse gardens amid mixed agricultural land with settlement clusters. LCT no. 4, marked by a coastal forest amidst dense settlements, fosters a harmonious blend of NETs, encompassing nature-protected areas, diverse spatial categories, public parks, and bustling activity hubs.
Research question 2 asked, how do the landscape character types (LCTs) vary in terms of their well-being ratings and characteristics? Further delving into the dimensions of restorative, social, and cognitive values across all 21 LCTs, the results go beyond conventional analysis to offer a comprehensive exploration of the many benefits that these diverse landscapes extend to both individuals and communities. The prominence of “restorative” value emerged as the highest-ranked dimension across all LCTs, accentuating the potential of landscapes to provide psychological rejuvenation and stress reduction. Specific landscapes, such as Coastal Forest, Sandy Beach, and Coastal Forest with Settlement Clusters, emerged as strongholds of restorative values. The presence of natural elements such as forests, wetlands, and coastal zones significantly contributed to their restorative potential, aligning with the idea that ecologically rich environments also provide many human benefits [63].
“Social” dimensions, ranking last, were related to landscapes such as Sandy Beach, Coastal Forest with Settlement Clusters, and Mixed Forest with Settlement Clusters as representing enclaves of social interactions. These landscapes serve as catalysts for community gatherings, fostering a sense of belonging and interconnectedness among residents and visitors. This communal engagement enriches the fabric of social cohesion within these areas [64,65]. Meanwhile, the second-highest dimension, “cognitive” value, presented significant connections within landscape types like Coastal Forest, Mixed Forest and Wetland, and Mixed Forest. These landscapes act as conduits for cognitive engagement, fostering curiosity, intellectual stimulation, and avenues for learning experiences. Their composition, enriched with diverse natural elements, accentuated their potential to foster cognitive well-being by offering places for exploration, discovery, and immersive educational undertakings [66,67,68].
Research question 3, how do the landscape character types (LCTs) cluster, and which values are concentrated within these clusters?, can be answered as follows. The LCA analysis outcomes provided further insights by delineating the clustering of LCTs into four distinct belts: sea, settlement, agricultural, and forest. The sea belt, characterised by coastal forests, emerged with the highest restorative and social values, albeit the lowest cognitive values. This can be attributed to its natural disposition with limited settlements, affording individuals opportunities for relaxation and communion with nature [69]. The settlement belt boasted high restorative and social values, combined with moderate cognitive values, owing to its prevalence of dense settlements with a mix of private and blockhouses that allows social interactions and recreation to thrive. The agricultural belt, while characterised by the lowest restorative and social values, stood out with the highest cognitive values due to its mixed agricultural landscape and semi-natural grasslands, which serve as rich educational resources [70,71]. The forest belt, featuring the second-highest restorative value and moderate social and cognitive values, offers an oasis of tranquillity characterised by mixed forests and wetlands [66,72,73,74,75].

4.2. Limitations and Future Projections

While our study has provided a comprehensive understanding, we acknowledge certain limitations. The reliance on subjective perceptions, albeit of experts, might introduce inherent biases into the analysis. The focus on a single municipality may limit the generalisability of the findings to broader contexts. The absence of socioeconomic variables might influence the interpretation of values, necessitating prudence in extrapolating the results.
Exploring how changing landscapes influence cultural values is a promising avenue for future research. Longitudinal studies can reveal shifts in these values over time, helping with adaptive management [76,77,78,79]. Additionally, studying the economic aspects of cultural values can improve their integration into decision-making processes and enhance landscape management [80,81,82]. Based on the trends observed in our findings, we can offer valuable insights into the future projections of cultural ecosystem services (CES) within peri-urban landscapes. These projections consider the dynamic interplay between landscape characteristics and human well-being values.
  • “Restorative” values dominate across all landscape character types (LCTs), emphasising the importance of landscapes like “Coastal Forests”, “Sandy Beaches”, and “Coastal Forests with Settlement Clusters” for stress relief and well-being. If urban expansion continues in these areas, habitat loss and fragmentation may reduce restorative CES, impacting public well-being.
  • “Social” values thrive in “Sandy Beaches”, “Coastal Forests with Settlement Clusters”, and “Mixed Forest with Settlement Clusters”, fostering community connections. Urbanisation in densely populated areas (the “settlement belt”) could limit access to these socially vibrant spaces, affecting social cohesion.
  • The “cognitive” value dimension highlights “Coastal Forests”, “Mixed Forest and Wetlands”, and “Mixed Forests” as places for intellectual engagement and learning. Preserving natural diversity and promoting educational initiatives in these areas is crucial to sustaining cognitive CES.
  • The clustering of LCTs into belts like the “sea belt” and “settlement belt” offers spatial insights for policymakers. Sustainable land use practices, conserving ecosystems like coastal forests, and ecosystem-based land management can maintain CES provision and community well-being in evolving peri-urban landscapes.

4.3. Practical Recommendations

In response to potential landscape challenges, it is recommended for stakeholders, policymakers, and practitioners to adopt proactive measures.
  • Conservation: Prioritising the conservation of critical ecosystems (in our case, coastal forests and wetlands) is essential to maintaining the provision of CES. Protecting these natural areas can safeguard their ability to offer restorative and recreational benefits to the community.
  • Sustainable Urban Planning: Responsible urban expansion practices that consider the preservation of green and blue spaces and the integration of natural elements into urban design can help to mitigate the loss of CES. Urban planning should focus on creating spaces that support well-being.
  • Ecosystem-Based Land Management: Adopting ecosystem-based approaches to land management can help to balance human development with the preservation of ecosystem services. These approaches can involve sustainable land use practices that prioritise both human well-being and environmental conservation.
In summary, the findings enhance our understanding of landscape benefits and can help stakeholders to make informed decisions. By integrating indicators and valuation frameworks, this study reveals complex links between ecosystems and well-being. This knowledge can empower stakeholders to balance conservation and societal well-being effectively.

5. Conclusions

This study offers valuable insights to guide landscape management and sustainable development and enhance well-being in Harku, Northern Estonia’s peri-urban context. By incorporating the cultural ecosystem services (CES) [34] and landscape character assessment (LCA) frameworks, we aimed to unravel the complex relationship between landscape character types (LCTs) and CES, shedding light on the diverse dimensions of well-being within peri-urban landscapes.
Grouping natural environment types (NETs) into distinct landscape character types (LCTs) has provided a foundational understanding of the landscape diversity within Harku. Our analysis of the restorative, social, and cognitive values across these LCTs has revealed the significant contributions of different landscapes to individual and communal well-being. Notably, “restorative” value emerges as prominent, with landscapes like “Coastal Forest”, “Sandy Beach”, and “Mixed Forest” offering profound psychological rejuvenation. The exploration of “cognitive” value underscores the significance of landscapes such as “Mixed Forests” and “Wetlands” in fostering intellectual engagement and learning experiences. Additionally, landscapes like “Coastal Forests with Settlement Clusters” and “Densely Settled Area on Clint” exhibit strong connections with “social” value, promoting community interactions and a sense of belonging.
Acknowledging the study limitations, including subjectivity and a focus on Harku, we recommend incorporating identified landscape clusters into urban planning to enhance CES and overall well-being in Harku. This integration aligns with the aspirations of the municipality for a liveable and sustainable environment that can positively affect overall well-being and quality of life in the Harku area.
We have used real-world data and theories to show that ecosystems and human well-being are closely connected. This should help decision-makers to strike a balance between conserving nature and meeting the needs of society. While primarily academic, these findings offer practical guidance to stakeholders in the studied spatial context, namely ecosystem services conservation, sustainable planning, and ecosystem-services-based land management.
For future studies, we suggest examining potential changes in CES based on our findings, anticipating landscape cluster evolution in dynamic peri-urban areas—for example, investigating how urban expansion and changing land use policies affect the restorative values of coastal forests, using our study as a baseline to project potential shifts in CES within these ecosystems over the next decade. Exploring the methodology’s applicability in diverse peri-urban contexts beyond Harku would provide valuable insights into its effectiveness in guiding sustainable development and landscape management.
In conclusion, our study not only advances our understanding of the relationships between landscape characteristics and cultural ecosystem services but also offers practical guidance to enhance human well-being while safeguarding the environment.

Supplementary Materials

The following supporting information can be downloaded at: https://www.mdpi.com/article/10.3390/land12101825/s1, Supplementary File S1 (CES framework); Supplementary File S2 (Grouping of NETs into LCTs—table); Supplementary File S3 (All LCTs’ value scores—chart).

Author Contributions

Conceptualisation, F.N., M.V., M.K. and S.B.; methodology, F.N., M.V. and M.K.; software, F.N. and M.V.; validation, F.N., M.V., M.K. and S.B.; formal analysis, F.N., M.V. and M.K.; investigation, F.N., M.V. and M.K.; resources, F.N., M.V. and M.K.; data curation, F.N., M.V. and M.K.; writing—original draft preparation, F.N. and M.V.; writing—review and editing, F.N., M.V., M.K. and S.B.; visualisation, F.N. and M.V.; supervision, M.K.; project administration, F.N. and M.K.; funding acquisition, F.N. All authors have read and agreed to the published version of the manuscript.

Funding

This research was funded by the Estonian Government Scholarship for Doctoral Students—F.N.

Data Availability Statement

We have additional analyses that we intend to conduct in our further study, therefore, we are refraining from releasing the database at this stage of our research.

Conflicts of Interest

The authors declare no conflict of interest.

References

  1. Fairclough, G.; Herlin, I.S.; Swanwick, C. Routledge Handbook of Landscape Character Assessment: Current Approaches to Characterisation and Assessment; Routledge: Oxfordshire, UK, 2018; ISBN 978-1-317-62103-4. [Google Scholar]
  2. McAlpine, G. Landscape Character Assessment—Guidance for England and Scotland. Available online: https://digital.nls.uk/pubs/e-monographs/2020/216649977.23.pdf (accessed on 7 August 2023).
  3. Martin, L.; White, M.P.; Hunt, A.; Richardson, M.; Pahl, S.; Burt, J. Nature contact, nature connectedness and associations with health, wellbeing and pro-environmental behaviours. J. Environ. Psychol. 2020, 68, 101389. [Google Scholar] [CrossRef]
  4. Jellema, A.; Stobbelaar, D.-J.; Groot, J.C.J.; Rossing, W.A.H. Landscape character assessment using region growing techniques in geographical information systems. J. Environ. Manag. 2009, 90, S161–S174. [Google Scholar] [CrossRef] [PubMed]
  5. Zakariya, K.; Ibrahim, P.; Abdul Wahab, N. Conceptual Framework of Rural Landscape Character Assessment to Guide Tourism Development in Rural Areas. J. Constr. Dev. Ctries. 2019, 24, 85–99. [Google Scholar] [CrossRef]
  6. Urbina-Cardona, N.; Cardona, V.O.; Cuellar, S. Uncovering thematic biases in ecosystem services mapping: Knowledge shortfalls and challenges for use in conservation. Biol. Conserv. 2023, 283, 110086. [Google Scholar] [CrossRef]
  7. Andrew, M.E.; Wulder, M.A.; Nelson, T.A.; Coops, N.C. Spatial data, analysis approaches, and information needs for spatial ecosystem service assessments: A review. GIScience Remote Sens. 2015, 52, 344–373. [Google Scholar] [CrossRef]
  8. Metzger, J.P.; Villarreal-Rosas, J.; Suárez-Castro, A.F.; López-Cubillos, S.; González-Chaves, A.; Runting, R.K.; Hohlenwerger, C.; Rhodes, J.R. Considering landscape-level processes in ecosystem service assessments. Sci. Total Environ. 2021, 796, 149028. [Google Scholar] [CrossRef]
  9. Díaz, S.; Demissew, S.; Carabias, J.; Joly, C.; Lonsdale, M.; Ash, N.; Larigauderie, A.; Adhikari, J.R.; Arico, S.; Báldi, A.; et al. The IPBES Conceptual Framework—connecting nature and people. Curr. Opin. Environ. Sustain. 2015, 14, 1–16. [Google Scholar] [CrossRef]
  10. Geneletti, D.; Cortinovis, C.; Zardo, L.; Esmail, B.A. Planning for Ecosystem Services in Cities; SpringerBriefs in Environmental Science; Springer International Publishing: Cham, Switzerland, 2020; ISBN 978-3-030-20023-7. [Google Scholar]
  11. Tzoulas, K.; Korpela, K.; Venn, S.; Yli-Pelkonen, V.; Kaźmierczak, A.; Niemela, J.; James, P. Promoting ecosystem and human health in urban areas using Green Infrastructure: A literature review. Landsc. Urban Plan. 2007, 81, 167–178. [Google Scholar] [CrossRef]
  12. Plieninger, T.; Dijks, S.; Oteros-Rozas, E.; Bieling, C. Assessing, mapping, and quantifying cultural ecosystem services at community level. Land Use Policy 2013, 33, 118–129. [Google Scholar] [CrossRef]
  13. Burkhard, B.; Maes, J.; Potschin-Young, M.; Santos-Martín, F.; Geneletti, D.; Stoev, P.; Kopperoinen, L.; Adamescu, C.; Esmail, B.A.; Arany, I.; et al. Mapping and assessing ecosystem services in the EU—Lessons learned from the ESMERALDA approach of integration. One Ecosyst. 2018, 3, e29153. [Google Scholar] [CrossRef]
  14. Vrebos, D.; Staes, J.; Vandenbroucke, T.; D’Haeyer, T.; Johnston, R.; Muhumuza, M.; Kasabeke, C.; Meire, P. Mapping ecosystem service flows with land cover scoring maps for data-scarce regions. Ecosyst. Serv. 2015, 13, 28–40. [Google Scholar] [CrossRef]
  15. Kong, L.; Zheng, H.; Xiao, Y.; Ouyang, Z.; Li, C.; Zhang, J.; Huang, B. Mapping Ecosystem Service Bundles to Detect Distinct Types of Multifunctionality within the Diverse Landscape of the Yangtze River Basin, China. Sustainability 2018, 10, 857. [Google Scholar] [CrossRef]
  16. McPhearson, T.; Andersson, E.; Elmqvist, T.; Frantzeskaki, N. Resilience of and through urban ecosystem services. Ecosyst. Serv. 2015, 12, 152–156. [Google Scholar] [CrossRef]
  17. Frantzeskaki, N.; Kabisch, N.; McPhearson, T. Advancing urban environmental governance: Understanding theories, practices and processes shaping urban sustainability and resilience. Environ. Sci. Policy 2016, 62, 1–6. [Google Scholar] [CrossRef]
  18. McPhearson, T.; Kabisch, N.; Frantzeskaki, N. Nature-based solutions for sustainable, resilient, and equitable cities. In Nature-Based Solutions for Cities; Edward Elgar Publishing: Cheltenham, UK, 2023; pp. xviii–11. ISBN 978-1-80037-676-2. [Google Scholar]
  19. McGillivray, M.; Clarke, M. (Eds.) Understanding Human Well-Being; United Nations University Press: Tokyo, Japan; New York, NY, USA, 2006; ISBN 978-92-808-1130-8. [Google Scholar]
  20. McGillivray, M. (Ed.) Human Well-Being: Concept and Measurement; Studies in Development Economics and Policy: Palgrave Macmillan, UK, 2007; ISBN 978-0-230-00498-6. [Google Scholar]
  21. Diener, E.; Inglehart, R.; Tay, L. Theory and Validity of Life Satisfaction Scales. Soc Indic Res 2013, 112, 497–527. [Google Scholar] [CrossRef]
  22. Veenhoven, R. Happiness as a Priority in Public Policy. In Positive Psychology in Practice; John Wiley & Sons, Ltd.: Hoboken, NJ, USA, 2015; pp. 731–750. ISBN 978-1-118-99687-4. [Google Scholar]
  23. Millennium Ecosystem Assessment. Ecosystems and Human Well-Being: Synthesis. In A Report of the Millennium Ecosystem Assessment; The Millennium Ecosystem Assessment series; Island Press: Washington, DC, USA, 2005; ISBN 978-1-59726-040-4. [Google Scholar]
  24. Su, S.; Xiao, R.; Jiang, Z.; Zhang, Y. Characterizing landscape pattern and ecosystem service value changes for urbanization impacts at an eco-regional scale. Appl. Geogr. 2012, 34, 295–305. [Google Scholar] [CrossRef]
  25. He, J.; Yan, Z.; Wan, Y. Trade-offs in ecosystem services based on a comprehensive regionalization method: A case study from an urbanization area in China. Env. Earth Sci 2018, 77, 179. [Google Scholar] [CrossRef]
  26. Sylla, M.; Solecka, I. Highly valued agricultural landscapes and their ecosystem services in the urban-rural fringe—An integrated approach. J. Environ. Plan. Manag. 2020, 63, 883–911. [Google Scholar] [CrossRef]
  27. Rescia, A.J.; Willaarts, B.A.; Schmitz, M.F.; Aguilera, P.A. Changes in land uses and management in two Nature Reserves in Spain: Evaluating the social–ecological resilience of cultural landscapes. Landsc. Urban Plan. 2010, 98, 26–35. [Google Scholar] [CrossRef]
  28. Syrbe, R.-U.; Walz, U. Spatial indicators for the assessment of ecosystem services: Providing, benefiting and connecting areas and landscape metrics. Ecol. Indic. 2012, 21, 80–88. [Google Scholar] [CrossRef]
  29. Englund, O.; Berndes, G.; Cederberg, C. How to analyse ecosystem services in landscapes—A systematic review. Ecol. Indic. 2017, 73, 492–504. [Google Scholar] [CrossRef]
  30. Paracchini, M.L.; Zulian, G.; Kopperoinen, L.; Maes, J.; Schägner, J.P.; Termansen, M.; Zandersen, M.; Perez-Soba, M.; Scholefield, P.A.; Bidoglio, G. Mapping cultural ecosystem services: A framework to assess the potential for outdoor recreation across the EU. Ecol. Indic. 2014, 45, 371–385. [Google Scholar] [CrossRef]
  31. Maes, J.; Liquete, C.; Teller, A.; Erhard, M.; Paracchini, M.L.; Barredo, J.I.; Grizzetti, B.; Cardoso, A.; Somma, F.; Petersen, J.-E.; et al. An indicator framework for assessing ecosystem services in support of the EU Biodiversity Strategy to 2020. Ecosyst. Serv. 2016, 17, 14–23. [Google Scholar] [CrossRef]
  32. Maes, J.; Barbosa, A.; Baranzelli, C.; Zulian, G.; Batista e Silva, F.; Vandecasteele, I.; Hiederer, R.; Liquete, C.; Paracchini, M.L.; Mubareka, S.; et al. More green infrastructure is required to maintain ecosystem services under current trends in land-use change in Europe. Landsc. Ecol 2015, 30, 517–534. [Google Scholar] [CrossRef] [PubMed]
  33. The final report of ELME project is now published—University of Tartu Landscape Biodiversity Group. Available online: https://landscape.ut.ee/the-final-report-of-elme-project-is-now-published/?lang=en (accessed on 13 June 2023).
  34. Nevzati, F.; Külvik, M.; Storie, J.; Tiidu, L.-M.; Bell, S. Assessment of Cultural Ecosystem Services and Well-Being: Testing a Method for Evaluating Natural Environment and Contact Types in the Harku Municipality, Estonia. Sustainability 2023, 15, 10214. [Google Scholar] [CrossRef]
  35. Raagmaa, G. Estonian population and regional development during the last 30 years. Back to the small town? Reg. Sci. Policy Pract. 2023, 15, 826–844. [Google Scholar] [CrossRef]
  36. Geneletti, D.; La Rosa, D.; Spyra, M.; Cortinovis, C. A review of approaches and challenges for sustainable planning in urban peripheries. Landsc. Urban Plan. 2017, 165, 231–243. [Google Scholar] [CrossRef]
  37. UN-Habitat (Ed.) Prosperity of Cities; The state of the world’s cities; Routledge: New York, NY, USA, 2013; ISBN 978-0-415-83888-7. [Google Scholar]
  38. Salvati, L.; Zambon, I.; Chelli, F.M.; Serra, P. Do spatial patterns of urbanization and land consumption reflect different socioeconomic contexts in Europe? Sci. Total Environ. 2018, 625, 722–730. [Google Scholar] [CrossRef]
  39. European Commission. Directorate General for the Environment. Mapping and Assessment of Ecosystems and Their Services: Indicators for Ecosystem Assessments under Action 5 of the EU Biodiversity Strategy to 2020: 2nd Report—Final, February 2014; Publications Office: Luxembourg, 2014. [Google Scholar]
  40. Gómez-Baggethun, E.; Barton, D.N. Classifying and valuing ecosystem services for urban planning. Ecol. Econ. 2013, 86, 235–245. [Google Scholar] [CrossRef]
  41. Pickett, S.T.A.; Cadenasso, M.L.; Grove, J.M.; Nilon, C.H.; Pouyat, R.V.; Zipperer, W.C.; Costanza, R. Urban Ecological Systems: Linking Terrestrial Ecological, Physical, and Socioeconomic Components of Metropolitan Areas. Annu. Rev. Ecol. Syst. 2001, 32, 127–157. [Google Scholar] [CrossRef]
  42. Kaplan, R.; Kaplan, S. The Experience of Nature: A Psychological Perspective; CUP Archive: Cambridge, UK, 1989; ISBN 978-0-521-34939-0. [Google Scholar]
  43. Aronson, M.F.J.; La Sorte, F.A.; Nilon, C.H.; Katti, M.; Goddard, M.A.; Lepczyk, C.A.; Warren, P.S.; Williams, N.S.G.; Cilliers, S.; Clarkson, B.; et al. A global analysis of the impacts of urbanization on bird and plant diversity reveals key anthropogenic drivers. Proc. R. Soc. B Biol. Sci. 2014, 281, 20133330. [Google Scholar] [CrossRef] [PubMed]
  44. Dallimer, M.; Irvine, K.N.; Skinner, A.M.J.; Davies, Z.G.; Rouquette, J.R.; Maltby, L.L.; Warren, P.H.; Armsworth, P.R.; Gaston, K.J. Biodiversity and the Feel-Good Factor: Understanding Associations between Self-Reported Human Well-being and Species Richness. BioScience 2012, 62, 47–55. [Google Scholar] [CrossRef]
  45. Dearborn, D.C.; Kark, S. Motivations for Conserving Urban Biodiversity. Conserv. Biol. 2010, 24, 432–440. [Google Scholar] [CrossRef] [PubMed]
  46. Faeth, S.H.; Bang, C.; Saari, S. Urban biodiversity: Patterns and mechanisms. Ann. N. Y. Acad. Sci. 2011, 1223, 69–81. [Google Scholar] [CrossRef]
  47. Marselle, M.; Stadler, J.; Korn, H.; Irvine, K.; Bonn, A. Biodiversity and Health in the Face of Climate Change: Challenges, Opportunities and Evidence Gaps; Springer: Cham, Switzerland, 2019; pp. 1–13. ISBN 978-3-030-02317-1. [Google Scholar]
  48. McKinney, M.L. Effects of urbanization on species richness: A review of plants and animals. Urban Ecosyst 2008, 11, 161–176. [Google Scholar] [CrossRef]
  49. Statistics—Harku Municipal Government. Available online: https://www.harku.ee/statistika (accessed on 12 September 2022).
  50. Kohv, K. Harku valla rohevõrgustiku tuumalade ja koridoride uuring. Eest. Looduse Fond 2017, 48. [Google Scholar]
  51. Keskkonnaagentuur|ILM. Available online: https://www.ilmateenistus.ee/ (accessed on 12 September 2023).
  52. Muinas • Kultuurimälestiste Registri Andmebaas. Available online: https://register.muinas.ee/m/ (accessed on 12 September 2023).
  53. RV0240: Population by Sex, Age and Place of Residence after the 2017 Administrative Reform, 1 January. Available online: https://andmed.stat.ee:443/pxweb/en/stat/stat__rahvastik__rahvastikunaitajad-ja-koosseis__rahvaarv-ja-rahvastiku-koosseis/RV0240.px/ (accessed on 6 April 2023).
  54. Samarüütel, A.; Steen Selvig, S.; Holt-Jensen, A. Urban sprawl and suburban development around Pärnu and Tallinn, Estonia. Nor. Geogr. Tidsskr. Nor. J. Geogr. 2010, 64, 152–161. [Google Scholar] [CrossRef]
  55. Tammaru, T.; Leetmaa, K. Suburbanisation in relation to education in the Tallinn metropolitan area. Popul. Space Place 2007, 13, 279–292. [Google Scholar] [CrossRef]
  56. Thapa, R.B.; Murayama, Y. Scenario based urban growth allocation in Kathmandu Valley, Nepal. Landsc. Urban Plan. 2012, 105, 140–148. [Google Scholar] [CrossRef]
  57. Foley, J.A.; Defries, R.; Asner, G.P.; Barford, C.; Bonan, G.; Carpenter, S.R.; Chapin, F.S.; Coe, M.T.; Daily, G.C.; Gibbs, H.K.; et al. Global consequences of land use. Science 2005, 309, 570–574. [Google Scholar] [CrossRef]
  58. Mander, Ü.; Palang, H. Changes of landscape structure in Estonia during the Soviet period. GeoJournal 1994, 33, 45–54. [Google Scholar] [CrossRef]
  59. Mozaffaree Pour, N.; Oja, T. Prediction Power of Logistic Regression (LR) and Multi-Layer Perceptron (MLP) Models in Exploring Driving Forces of Urban Expansion to Be Sustainable in Estonia. Sustainability 2022, 14, 160. [Google Scholar] [CrossRef]
  60. Homepage|Maa-amet. Available online: https://maaamet.ee/en (accessed on 19 August 2023).
  61. Geospatial Analysis 6th Edition, 2021 Update—De Smith, Goodchild, Longley and Colleagues. Available online: https://www.spatialanalysisonline.com/HTML/index.html (accessed on 19 August 2023).
  62. Data Classification Methods—ArcGIS Pro|Documentation. Available online: https://pro.arcgis.com/en/pro-app/latest/help/mapping/layer-properties/data-classification-methods.htm (accessed on 19 August 2023).
  63. Yang, D.; Luo, T.; Lin, T.; Qiu, Q.; Luo, Y. Combining Aesthetic with Ecological Values for Landscape Sustainability. PLoS ONE 2014, 9, 102437. [Google Scholar] [CrossRef] [PubMed]
  64. Blackwell, B. The Value of a Recreational Beach Visit: An Application to Mooloolaba Beach and Comparisons with Other Outdoor Recreation Sites**This paper does not necessarily reflect the views of the NCME or AMC. Econ. Anal. Policy 2007, 37, 77–98. [Google Scholar] [CrossRef]
  65. Korpela, K.M.; Hartig, T.; Kaiser, F.G.; Fuhrer, U. Restorative Experience and Self-Regulation in Favorite Places. Environ. Behav. 2001, 33, 572–589. [Google Scholar] [CrossRef]
  66. Almeida, I.; Rösch, C.; Saha, S. Comparison of Ecosystem Services from Mixed and Monospecific Forests in Southwest Germany: A Survey on Public Perception. Forests 2018, 9, 627. [Google Scholar] [CrossRef]
  67. Pichlerová, M.; Önkal, D.; Bartlett, A.; Výbošťok, J.; Pichler, V. Variability in Forest Visit Numbers in Different Regions and Population Segments before and during the COVID-19 Pandemic. Int. J. Environ. Res. Public Health 2021, 18, 3469. [Google Scholar] [CrossRef]
  68. Shin, W.S.; Shin, C.S.; Yeoun, P.S.; Kim, J.J. The influence of interaction with forest on cognitive function. Scand. J. For. Res. 2011, 26, 595–598. [Google Scholar] [CrossRef]
  69. Oh, R.R.Y.; Fielding, K.S.; Nghiem, L.T.P.; Chang, C.C.; Carrasco, L.R.; Fuller, R.A. Connection to nature is predicted by family values, social norms and personal experiences of nature. Glob. Ecol. Conserv. 2021, 28, e01632. [Google Scholar] [CrossRef]
  70. Chou, R.-J.; Wu, C.-T.; Huang, F.-T. Fostering Multi-Functional Urban Agriculture: Experiences from the Champions in a Revitalized Farm Pond Community in Taoyuan, Taiwan. Sustainability 2017, 9, 2097. [Google Scholar] [CrossRef]
  71. Grasslands—More important for ecosystem services than you might think—Bengtsson—2019—Ecosphere—Wiley Online Library. Available online: https://esajournals.onlinelibrary.wiley.com/doi/10.1002/ecs2.2582 (accessed on 19 August 2023).
  72. Takayama, N.; Fujiwara, A.; Saito, H.; Horiuchi, M. Management Effectiveness of a Secondary Coniferous Forest for Landscape Appreciation and Psychological Restoration. Int. J. Environ. Res. Public Health 2017, 14, 800. [Google Scholar] [CrossRef]
  73. Takayama, N.; Morikawa, T.; Bielinis, E. Relation between Psychological Restorativeness and Lifestyle, Quality of Life, Resilience, and Stress-Coping in Forest Settings. Int. J. Environ. Res. Public Health 2019, 16, 1456. [Google Scholar] [CrossRef]
  74. Huuskonen, S.; Domisch, T.; Finér, L.; Hantula, J.; Hynynen, J.; Matala, J.; Miina, J.; Neuvonen, S.; Nevalainen, S.; Niemistö, P.; et al. What is the potential for replacing monocultures with mixed-species stands to enhance ecosystem services in boreal forests in Fennoscandia? For. Ecol. Manag. 2021, 479, 118558. [Google Scholar] [CrossRef]
  75. Simkin, J.; Ojala, A.; Tyrväinen, L. The Perceived Restorativeness of Differently Managed Forests and Its Association with Forest Qualities and Individual Variables: A Field Experiment. Int. J. Environ. Res. Public Health 2021, 18, 422. [Google Scholar] [CrossRef] [PubMed]
  76. Land|Free Full-Text|Responding to Landscape Change: Stakeholder Participation and Social Capital in Five European Landscapes. Available online: https://www.mdpi.com/2073-445X/7/1/14 (accessed on 19 August 2023).
  77. Dramstad, W.E.; Fry, G.; Fjellstad, W.J.; Skar, B.; Helliksen, W.; Sollund, M.-L.B.; Tveit, M.S.; Geelmuyden, A.K.; Framstad, E. Integrating landscape-based values—Norwegian monitoring of agricultural landscapes. Landsc. Urban Plan. 2001, 57, 257–268. [Google Scholar] [CrossRef]
  78. Dou, Y.; Zhen, L.; De Groot, R.; Du, B.; Yu, X. Assessing the importance of cultural ecosystem services in urban areas of Beijing municipality. Ecosyst. Serv. 2017, 24, 79–90. [Google Scholar] [CrossRef]
  79. Plieninger, T.; van der Horst, D.; Schleyer, C.; Bieling, C. Sustaining ecosystem services in cultural landscapes. Ecol. Soc. 2014, 19, 259. [Google Scholar] [CrossRef]
  80. La Rosa, D.; Spyra, M.; Inostroza, L. Indicators of Cultural Ecosystem Services for urban planning: A review. Ecol. Indic. 2016, 61, 74–89. [Google Scholar] [CrossRef]
  81. Schirpke, U.; Scolozzi, R.; Dean, G.; Haller, A.; Jäger, H.; Kister, J.; Kovács, B.; Sarmiento, F.O.; Sattler, B.; Schleyer, C. Cultural ecosystem services in mountain regions: Conceptualising conflicts among users and limitations of use. Ecosyst. Serv. 2020, 46, 101210. [Google Scholar] [CrossRef]
  82. Cooper, N.; Brady, E.; Steen, H.; Bryce, R. Aesthetic and spiritual values of ecosystems: Recognising the ontological and axiological plurality of cultural ecosystem ‘services’. Ecosyst. Serv. 2016, 21, 218–229. [Google Scholar] [CrossRef]
Figure 1. Case study area, Harku Municipality, Estonia, and the main land use types. Adapted from Nevzati et al. [34] (accessed on 17 July 2023).
Land 12 01825 g001
Figure 3. Spatial distribution of natural environment types (NETs) and their grouping into landscape character types (LCTs).
Land 12 01825 g003
Figure 4. Highest-rated landscape character types (LCTs) based on restorative, social, and cognitive values.
Land 12 01825 g004
Figure 5. Restorative values assessment map—spatial distribution of restorative values within the 21 landscape character types (LCTs), from 0 (no restorative value) to 3 (substantial restorative values).
Land 12 01825 g005
Figure 6. Social values assessment map—spatial distribution of social values within the 21 landscape character types (LCTs), from 0 (no social value) to 3 (substantial social values).
Land 12 01825 g006
Figure 7. Cognitive values assessment map—spatial distribution of cognitive values within the 21 landscape character types (LCTs), from 0 (no cognitive value) to 3 (substantial cognitive values).
Land 12 01825 g007
Figure 8. The spatial distribution of landscape character types (LCTs) and their clustering into four belts—sea, settlement, agricultural, and forest. The industrial area (LCT 10) defies classification.
Land 12 01825 g008
Table 1. Landscape character type (LCT) no. 12, Mixed Agricultural Land with Settlement Clusters, and the associated natural environment types (NETs).
LCT No. 12: Mixed Agricultural Land with Settlement Clusters
PolygonNatural Environment Type (NET)RestorativeSocialCognitive
Muraste (Area 1)Blockhouse playgrounds2.582.301.72
Community gardens2.462.932.73
Manor parks2.662.732.40
Nature protection areas2.842.332.53
Public playgrounds
Agricultural lands
2.582.301.72
Grasslands0.861.072.40
Settlements1.561.932.40
Private gardens2.102.671.53
Roads2.562.602.60
Average 2.212.192.11
Ilmandu (Area 2)NETs specific to polygon1.791.862
Liikva (Area 3)NETs specific to polygon1.941.952.15
Vääna (Area 4)NETs specific to polygon2.252.192.15
Kumna (Area 5)NETs specific to polygon2.282.182.24
Harku (Area 6)NETs specific to polygon2.342.412.23
Calculated CT value 2.132.132.15
Table 2. Landscape character types (LCTs) with their definitions and areas.
No.Landscape
Character Type
DefinitionArea (Ha)
1CliffSeaside cliff in a nature protection area36
2Coastal forestCoastal area with seaside forest, local roads, nature protection area, and no settlement430
3Coastal forest on river mouth plateauCoastal area on meandering river mouth plateau characterised by forest park535
4Coastal forest with a dense settlementCoastal area with dense settlement of private gardens and local roads intermittent with patches of forest147
5Coastal forest with settlement clustersCoastal area with settlement clusters of private gardens and local roads intermittent with patches of forest238
6A densely settled area on clintDensely settled area of private gardens on a high clint plateau with occasional small patches of open grassland326
7Densely settled area
under clint
Densely settled area of private gardens on a low plateau under clint with occasional small patches of forest and open grasslands555
8Densely settled area with mixed land useDensely settled area with private gardens, blockhouses, and public sporting facilities intermittent with small patches of forest and open grassland860
9Densely settled river plateauDensely settled area of private gardens on a meandering river plateau124
10Industrial areaIndustrial area with active and former quarry with patches of forest and grassland612
11Meandering river with grasslands and single farmsMeandering river plateau characterised by open grassland and occasional single farms95
12Mixed agricultural land with settlement clustersAgricultural landscape with cultivated fields and open grasslands, with small patches of forest with dense settlement clusters of private gardens and blockhouses5350
13Mixed forestAn area covered with mixed commercial forest771
14Mixed forest and wetlandAn area covered with mixed forest in a wetland2192
15Mixed forest on river plateauAn area covered with mixed forest on the river plateau576
16Mixed forest with settlement clustersAn area characterised by mixed forest and occasional settlement clusters of private gardens1181
17PolderLow land area with drainage ditches and grassland134
18Sandy beachPublic sandy beach on a river mouth15
19Semi-natural grassland with fossil fieldsOpen grassland with fossil fields334
20Semi-natural grassland with private farmsOpen grassland with occasional private farms1381
21Agricultural landCultivated agricultural landwith patches of grassland149
Disclaimer/Publisher’s Note: The statements, opinions and data contained in all publications are solely those of the individual author(s) and contributor(s) and not of MDPI and/or the editor(s). MDPI and/or the editor(s) disclaim responsibility for any injury to people or property resulting from any ideas, methods, instructions or products referred to in the content.

