Article

Current and Expected Value Assessment of the Waterfront Urban Design: A Case Study of the Comprehensive Urban Design of Beijing’s Waterfront

1
School of Architecture, Harbin Institute of Technology, Harbin 150006, China
2
Key Laboratory of National Territory Spatial Planning and Ecological Restoration in Cold Regions, Ministry of Natural Resources, Harbin 150006, China
3
School of Art and Archaeology, Zhejiang University City College, Hangzhou 310015, China
*
Authors to whom correspondence should be addressed.
Land 2023, 12(1), 85; https://doi.org/10.3390/land12010085
Submission received: 5 December 2022 / Revised: 20 December 2022 / Accepted: 24 December 2022 / Published: 27 December 2022

Abstract

:
Beijing, capital of China, and its exuberant waterfront is supposed to be a significant component of the city’s charm. However, due to urbanization and population growth, Beijing’s waterfront is experiencing a variety of issues, needing comprehensive urban design and overall value assessment. The main purposes of this study are to develop an urban layer system of waterfront urban design and to assess the current and expected value of Beijing’s waterfront. Beijing’s waterfront was divided into four urban layer subsystems: ecological subsystem, spatial subsystem, demand subsystem, and cultural subsystem. This study includes the waterfront of 26 rivers and 9 lakes, which are divided into 54 waterfront segments by main roads. This study assessed the current and expected values of 54 waterfront segments in Beijing with the urban layer system by citizen questionnaires, expert questionnaires, and field surveys. A series of maps and radar maps were generated to visualize the assessment results. This study analyzes and describes the characteristics of four urban layer subsystems and different waterfront segments, based on a comprehensive evaluation of the value of Beijing’s waterfront. It provides strategies for the master urban design of Beijing’s waterfront. Furthermore, the results of this study and the urban layer system can provide insight on waterfront urban design.

1. Introduction

Urban waterfront, the interface between the built environment and water [1], is a complex system that plays an important ecological, aesthetic, recreational, economic, educational, and social role in cities [2,3]. Improving the attractiveness of waterfronts and re-engaging people to the waterfront through waterfront urban design is an effective means to promote urban renewal and high-quality urban development [4,5,6,7].
Numerous studies have shown that urban design can change the economic and property values [8], spatial and functional values [9,10], landscape values [4,11,12], and cultural and historical values [13,14] of blocks by optimizing their spatial features. These spatial features include walkability [15,16,17], block-form and land-use mix [18], and others.
The study of waterfront regeneration urban design includes cultural-led regeneration [13], ecological restoration [11], landscape aesthetic design [5], spatial regeneration [3,5], and urban design governance [19,20]. For waterfront regeneration, it is important to systematically assess the current value, key elements, and assumptions of waterfront urban design [4].
Synthesizing existing studies, the study of waterfront urban design quality and value assessment includes single-dimension or -element assessment and several-dimensional assessment studies. Assessment of urban design quality and value in the existing literature includes the waterfront vitality [21], the classification of urban waterfront parks and walks [22], the connectivity and comfort of the waterfront [23], the public accessibility of the waterfront [6], the place quality and user satisfaction in waterfronts [24], urban design of multi-functional river space [11], and assessment of other elements.
Some waterfront urban-design-values assessment studies have explored multidimensional indicators and element categories, generally including one or more of the social, economic, ecological, and environmental dimensions. The assessment of the environmental dimension includes physical environment and architecture, natural environment, and risk [5,9,25]. The economic assessment of the waterfront includes surrounding park and building density, space functional mix, surrounding house prices, and land use [10,21,26]. Integrated assessment studies of environmental and social dimensions include natural subsystems, activity subsystems, and subsystems with evaluation dimensions [27]. Social impact, citizen demand [28], and ecological dimensions of waterfronts are generally assessed in terms of resources and identity, social status, access and activity, waterfront experience, open space, sustainable design, amenities, environmental sensitivity, public participation, and contextual characteristics [9,11,29]. In terms of spatial, aesthetic, and social aspects, several studies proposed multidimensional assessment models of connectivity and public accessibility, consisting of the spatial subsystem, visual subsystem, ecological corridor subsystem, activity subsystem, ecological subsystem, social subsystem connection, and contextual subsystem [6,30]. Although the studies have their own emphasis points, the assessment subsystem could be summarized as the ecological subsystem, activity and demand subsystem, landscape and spatial design subsystem, and cultural subsystem.
Some waterfront urban design studies have assessed and critiqued the transformed waterfront [5]. However, there are few commonly accepted methods for guiding waterfront planning and assessing the effectiveness of retrofitting prior to retrofitting [6,11], although it is regarded as an effective way to promote waterfront regeneration and development. In addition, for the comprehensive urban design of the waterfront, the values of different waterfront segments vary from location to site. As a result, the value of each waterfront segment should be assessed separately, and then macro analysis and planning should be done in combination with the waterfront segment’s location. In terms of waterfront segment evaluation, Che used questionnaires and field data to assess the spatial, visual, ecological, and activity public accessibility of 24 reaches of Suzhou Creek [6]. Nowadays, urban-design-value assessment studies have gradually evolved from a single level of assessment to a strategy aimed at integrating environmental science, technology, and policy issues [27]. For successful waterfront regeneration, there must be clear tools to assess the current value of a waterfront to support different decisions. To understand waterfronts, we should consider them as a system [31].
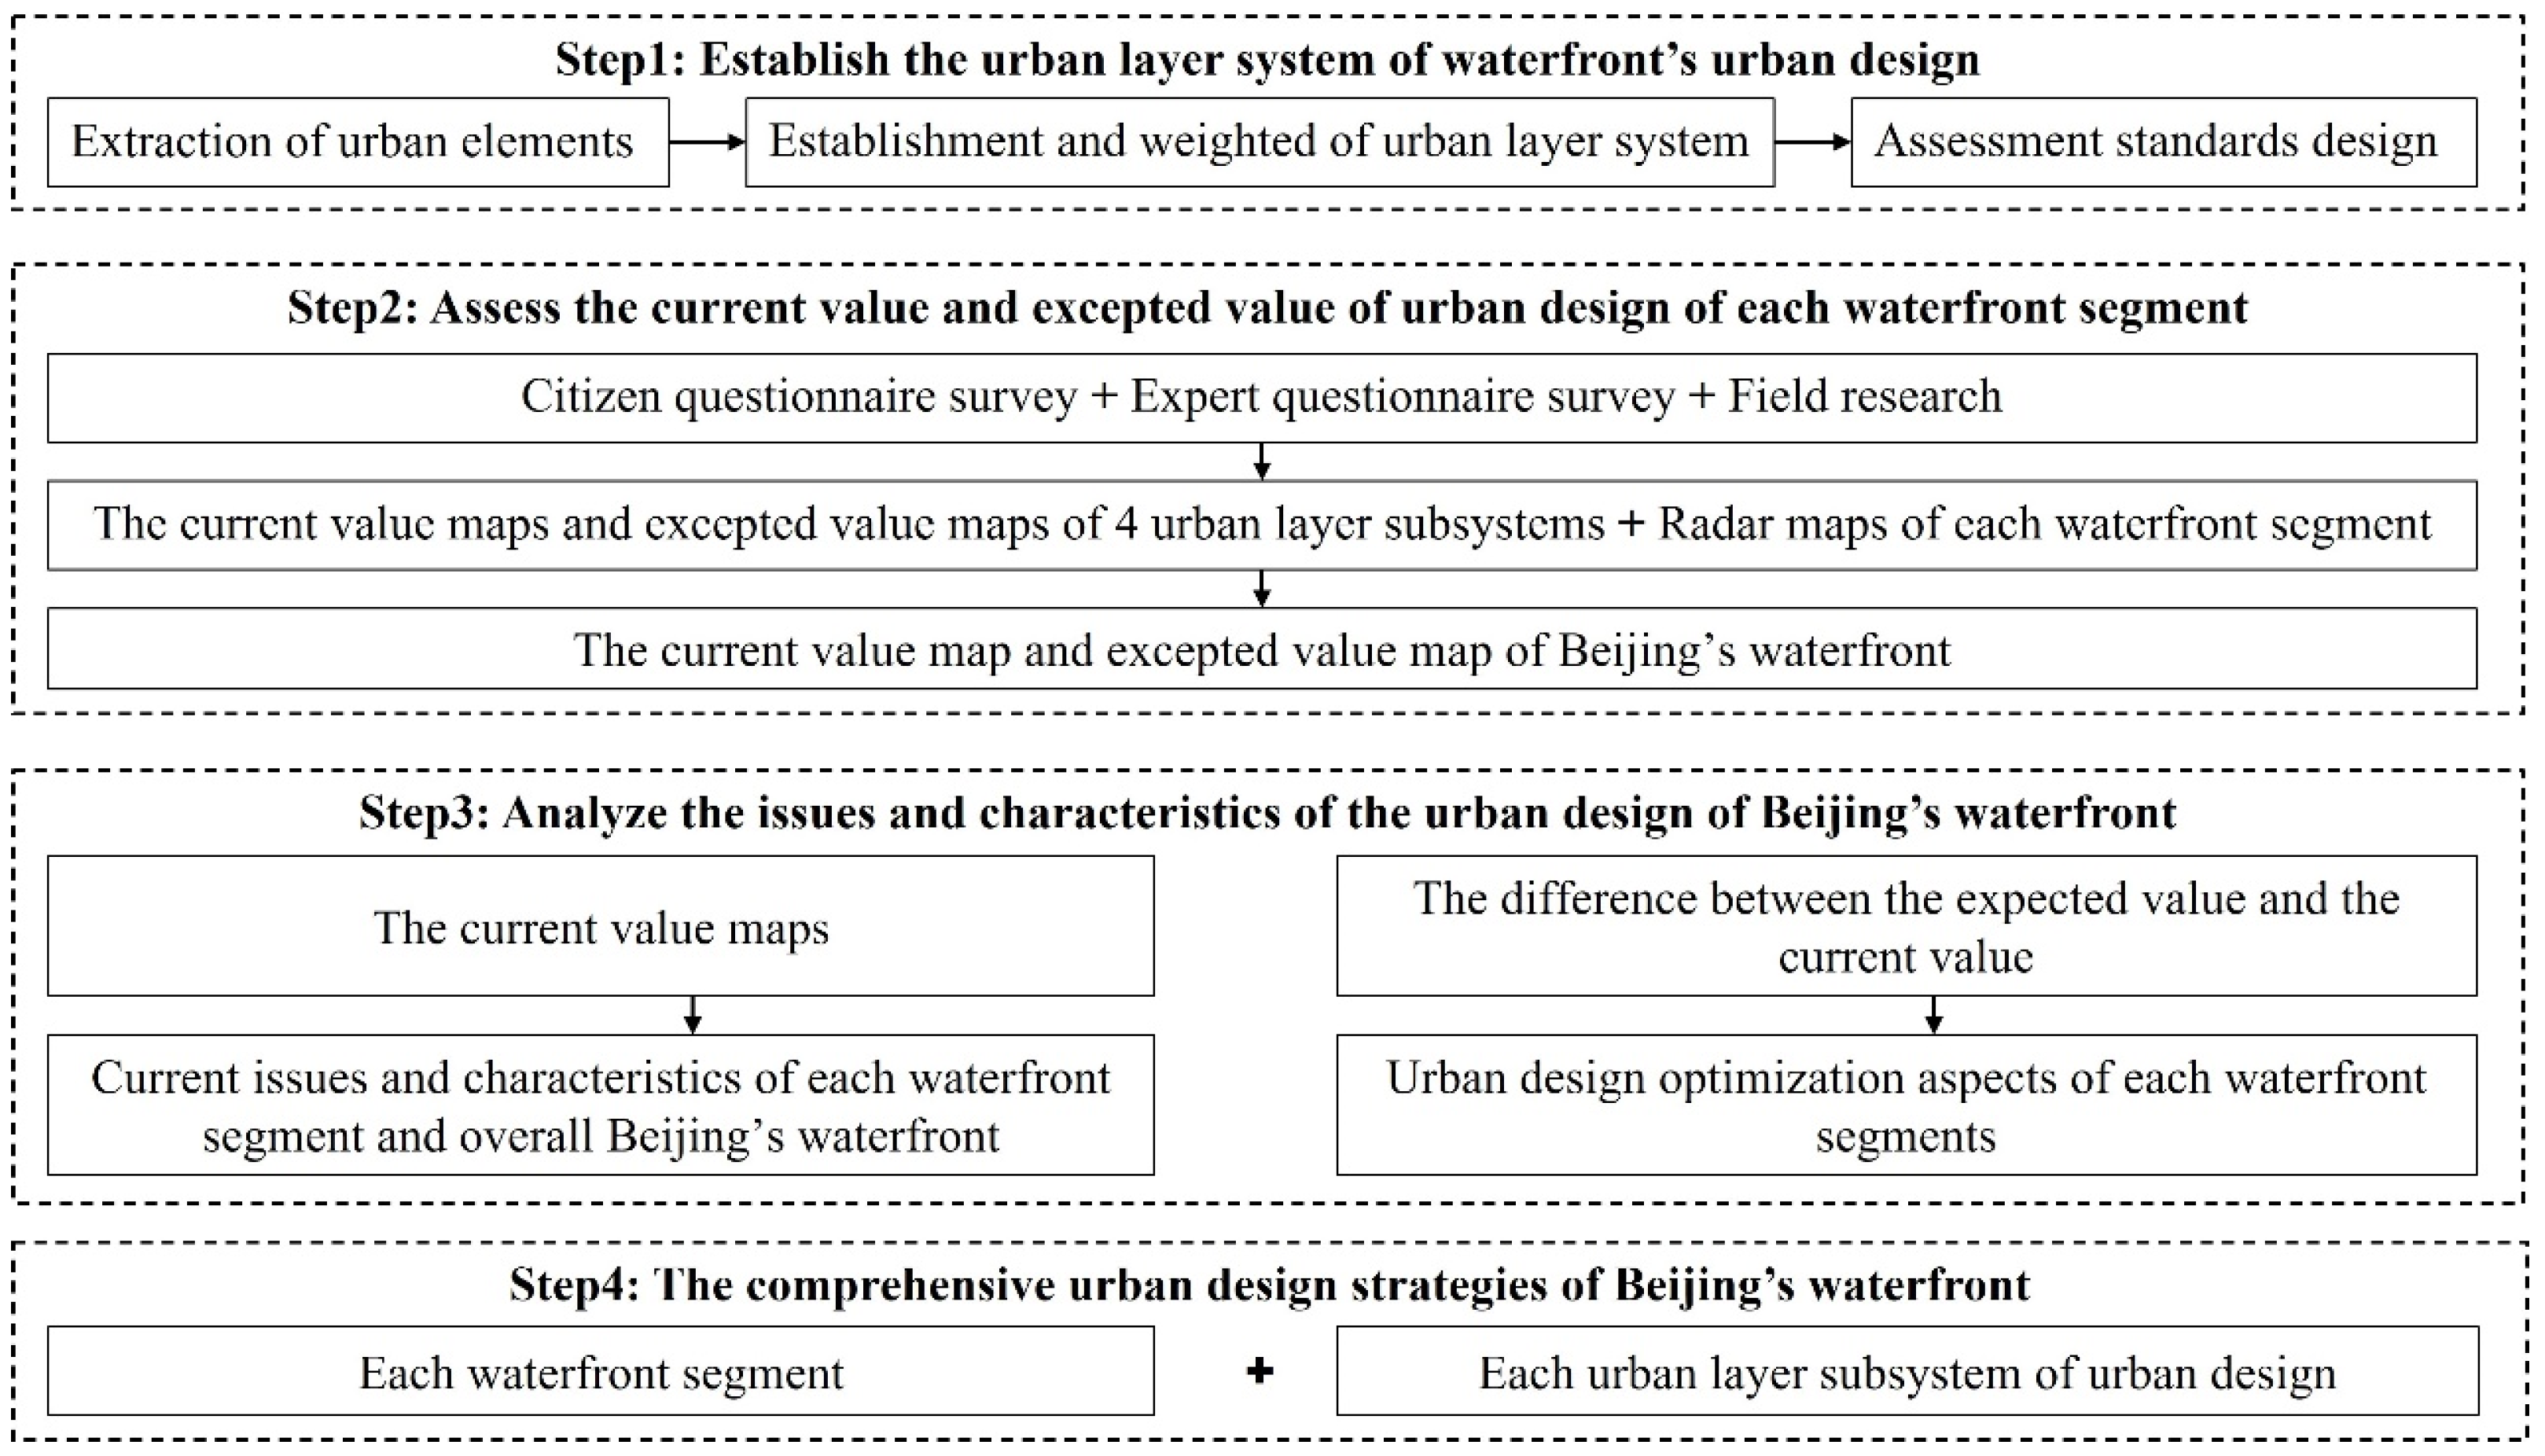
Therefore, the main objective of this study is to develop an urban layer system for waterfront urban design and use it to assess the current and expected value of a waterfront. Current value refers to the urban design value of the current waterfront. Expected value can reflect the expectations of citizens and experts for the waterfront after the urban design transformation. The purpose of this study was to investigate three issues: (1) What are the layers and elements of urban design that influence the value of the waterfront? (2) How to systematically and flexibly assess the urban design value of the waterfront? (3) How to summarize the problems and opportunities of urban design for the waterfront through the assessment results. The analysis method of the urban layer system allows for numerical and visual comparative analysis of different waterfront segments. The study can analyze planning priorities for the same waterfront segment from the differences in current and expected values to enhance the planning and design of urban targeting and decision-making processes. An urban layer system for the waterfront urban design is built and weighted by expert interviews, focus group discussions, and the target hierarchy method. This assessment method was applied to Beijing’s waterfront to test its validity. Maps of the current and expected values of urban design for Beijing’s waterfront were derived, as well as value radar maps for each waterfront segment. The case study results allow us to discuss the issues and characteristics of Beijing’s waterfront as a means to propose effective urban design strategies for Beijing’s waterfront.

2. Methods

2.1. Study Framework

This study proceeded as follows (Figure 1). First, this study extracts the urban design elements from expert interviews and focus group discussions, then used the target hierarchy approach to classify the urban elements into an urban layer system of waterfront to assess the value of Beijing’s waterfront. Second, this study assesses the current value and expected value of the urban design of each waterfront segment in stages to use a citizen questionnaire survey, expert questionnaire survey, and field surveys. The value results of each waterfront segment are mapped on Beijing’s map and radar maps. Third, this study analyzes the current issues of Beijing’s waterfront through current value assessment and field surveys and analyzes the urban design optimization aspects of different waterfront segments by the difference between the expected value and the current value. Finally, based on the above research, this study proposes some optimization strategies for the comprehensive urban design of Beijing’s waterfront.

2.2. Study Area

Problems and characteristics of waterfronts can vary significantly between cities [32] and within the same city or on the same river [22,33]. In order to make the urban design value assessment of waterfront areas more relevant, this study first used questionnaires and field data to assess the urban design value of Beijing’s waterfront in segments [6]. Then the assessment results were mapped on the same map to analyze the distribution of the comprehensive characteristics of Beijing’s waterfront.
The study was held in the Fifth Ring Road of Beijing, the capital of China. There are 26 rivers and 9 lakes in the study area. The total length is more than 500 kilometers, and the drainage area is more than 1260 square kilometers.
The waterfront of each water body is divided into numerous waterfront segments by main roads. There are 54 waterfront segments in the study area (Figure 2). According to the water system classification of “Master Urban Planning of Beijing (2016–2035)”, waterfront segments in the study area are divided into A-six seas and eight rivers, B- two corridors, C- two rings, D- multiple branches, E- lakes and parks. In this study, the waterfront segment contains the water body, the channel, the riparian area, the adjacent road, and the surrounding land use (Figure 3).

2.3. Establishment of Urban Layer System of Waterfront Urban Design

2.3.1. Preliminary Extraction of Urban Elements

First, according to the characteristics of Beijing’s waterfront, key urban design elements were extracted from the literature and cases related to waterfront regeneration urban design. These elements are gradually classified and ranked using typological ideas and the following methods. Four urban layer subsystems of the waterfront were obtained from the literature review: ecological subsystem, spatial subsystem, demand subsystem, and cultural subsystem.
Each subsystem was composed of urban layers and elements to support the measurement of the current and expected values of Beijing’s waterfront and give a more detailed description. The choice of elements and layers depended on the following criteria [23,34]: (1) easy to research and evaluation analysis; (2) easy to obtain the data through field surveys, questionnaire investigation, and public government information; (3) able to be researched at a reasonable cost; (4) able to adequately represent the systems and influence urban design; (5) easy to evaluate causes, effects, and trends; (6) does not depend significantly on other elements that are difficult to obtain; (7) easy to understand by users and investigation population; (8) plays a crucial role in policy and decision making for urban planning and design.
Second, expert interviews and focus group discussions were used to secondarily extract the urban elements and explore whether other waterfront elements needed to be added. The focus group consisted of 13 members, including 3 urban planners, 5 urban planning master students, 4 citizens who live near Beijing’s waterfront, and 1 chairperson. The focus group discussed the preliminary extracted elements for 2 hours and recorded the discussion results. Five experts who were professors from the department of urban planning were interviewed to improve the accuracy of the elements. All members of focus group and the five experts were familiar with the waterfront to ensure that the urban elements and layers they selected were localized, professional, and viable.

2.3.2. Establishment of Urban Layer System Framework

The target hierarchy method was used to classify the selected urban elements of the waterfront. Take the value of waterfront urban design as the goal, and establish the level of urban layer and the level of urban element.
An importance-level questionnaire was used to obtain the impact of the elements. The questionnaire was divided into four levels: unimportant, generally important, important, and very important. The four levels were also assigned values, in the order of 1, 2, 3, and 4, to facilitate ranking the element data after the questionnaire. After the selection of the established elements, there was a link to allow the respondents to add or modify the elements affecting the waterfront urban design according to their own wishes and to further expand and improve the elements [35].
In this study, 40 questionnaires were distributed, and the actual valid questionnaires returned included 17 expert questionnaires and 19 citizen questionnaires. The questionnaire data were analyzed by Excel and SPSS24 software to calculate the average value (Q), standard deviation (SD), and coefficient of variation (CV) of each element of data (Table 1).
C V i = S D i Q i
CVi is the coefficient of variation of the element scores; SDi is the standard deviation of the element scores, and Qi is the average value of the element scores. The adoption rate of the element increases as the mean rises. The lower the coefficient of variation, the higher the consensus of the element. Based on the selection principle [35,36] (Table 2), elements with an average value higher than 1.50 and a coefficient of variation lower than 0.1900 were selected and classified into the corresponding urban layer subsystem. An urban layer system for waterfront urban design with 29 elements, 10 layers, and 4 subsystems was built (Table 3).
Table 1. The average value, standard deviation, and coefficient of variation of elements.
Urban Layer SubsystemUrban LayerUrban ElementAverage Value (Q)Standard Deviation (SD)Coefficient of Variation (CV)
Ecological subsystemWaterbody [28]Water quality [28]5.380.740.1383
Water quantity [28]3.240.480.1485
Width of water surface [28]2.820.420.1472
Landscape and greening [11,22,23,37]Landscape quality [11]3.270.560.1702
Connectivity with urban green corridors or parks [17,23,37]1.380.250.1812
Greenspace ratio [6]3.220.530.1660
Width of waterfront corridor [6,37]2.530.360.1437
Plant community structure [22]1.650.310.1892
Buffer [11,22]2.280.390.1728
Species [23]0.870.130.1509
Openness of water-oriented interface [22,23,38]1.630.240.1452
Shoreline [22,23]Shoreline form [22]3.140.500.1583
Shoreline gradient [22,37]2.230.320.1423
Shoreline material [22,23]2.490.390.1584
Biological [22,23]Biodiversity [22,23]2.550.390.1531
Habitat [11]1.870.320.1733
Spatial subsystemNeighborhood [6,11,15,23,37]Skyline [6,23]0.620.090.1476
Function mix [11,15,23]3.260.560.1719
Building facade [6,23]1.720.310.1820
Block scale [11]0.670.100.1528
Land value [11,15]2.670.380.1416
Openness of water-oriented interface [23]1.290.240.1834
Openness of waterfront [23]0.760.120.1586
Traffic [6,11,23,28]External traffic [6,11,23]3.220.540.1677
Internal traffic [6,17,22]3.140.500.1592
Water transportation [11]2.140.300.1402
Demand subsystemUsage demand [6,23,28,38]Interruption of waterfront [6]2.940.500.1701
Activity carrying capacity [6,22,28,38]3.850.630.1636
Activity richness [6,22,23,28,38]2.280.390.1711
Activity convenience [6,28,38]1.560.210.1346
Labor force [28]2.490.390.1566
Emotional need [28]Sense of security [6,23,28]3.260.560.1718
Sense of belonging [28]1.130.170.1504
Privacy [28]0.620.090.1476
Place spirit [17,23,28]1.780.270.1517
Cultural systemCulture and history [13]Historical preservation [13]3.150.510.1619
Regional characteristics [13]2.940.500.1701
Culture symbol [13]2.670.380.1423
For convenience, Q and SD are taken to 2 decimal places, and CV is taken 4 decimal places.

2.3.3. Weighted of the Urban Layer System

A nine-level scale method was used to determine the importance of the elements in the urban layer system of waterfront urban design [35] (Table 4). Ten expert questionnaires on the weights of urban layer system of waterfront urban design were distributed, all of them valid. All of the experts were urban planners, master students, and professors of the urban planning department. YAAHP software, which is software used in hierarchical analysis method, was used to establish an analytic hierarchy process and a weight model of the urban layer system of waterfront urban design.
In this study, the arithmetic mean method was used to obtain the expert scores of each element, and the consistency test was performed with a judgment matrix.
C I = λ m a x n n 1
C R = C I R I
CI is the consistency index; CR is the random consistency ratio; RI is the average random consistency index, and n is the number of elements. When CR < 0.1, the calculated weighting coefficients are acceptable. If not, the judgments in the table matrix need to be re-evaluated.
Due to the large number of urban elements and multi-level of urban layers in the urban layer system, this study constructed a separate table-matrix for each layer and subsystem, then calculated them with AHP method separately. Therefore, the sum of the urban element’s weights within each urban layer is 1, and the sum of the urban layer’s weights within each urban layer subsystem is 1, and the sum of the urban layer subsystem’s weights is 1.
After calculation, the weights of the urban layer system were calculated by YAAHP software [35] (Table 5).

2.3.4. Assessment Standards Design

First, based on the literature [6,11,15,17,22,23,28,38,39,40,41], the assessment standards of each element were set in combination with the urban layer system established previously. Each urban element was composed of quantitative condition indicators. Second, to improve accuracy and target, we invited five urban planners and experts who participated in the comprehensive urban design of Beijing’s waterfront to adjust and modify the assessment standards. Finally, the assessment standards of 4 urban layer subsystems were integrated (Table 6, Table 7, Table 8, Table 9, Table 10, Table 11 and Table 12).

2.4. Data Collection and Analysis

2.4.1. Data Sources

In this study, the value assessment data of the urban design of Beijing’s waterfront were divided into current and expected value data.
There are six elements’ current value data that were obtained from questionnaire data; the other 24 elements’ current value data were obtained from field survey data, and the expected value data were all from the questionnaire data (Figure 4). The data for the study were mainly obtained from field surveys and questionnaires on Beijing’s waterfront from April 2019 to December 2020.
The current water quality data in Beijing came from the “Beijing Water Quality Report (2019)” issued by the Beijing Municipal Ecology and Environment Bureau. The images, maps, and spatial data used in this paper came from Baidu Map Open Platform and Baidu Map Panoramic Platform. Some urban elements’ value scores from the questionnaire can be obtained directly from the current value questionnaires. However, some urban elements’ current value depends on data from surveys, requiring researchers to rate the field study’s underlying data according to the above assessment standards in Table 6, Table 7, Table 8, Table 9, Table 10, Table 11 and Table 12.
The expected value data of Beijing’s waterfront used in this study came from citizen questionnaire surveys and expert questionnaire surveys. The citizens and experts who answered the expected value questionnaires were the same as the current value questionnaires.

2.4.2. Questionnaire Design

In this study, the value assessment questionnaire for the urban design of Beijing’s waterfront was divided into current value and expected value, and each part consisted of an expert questionnaire and a citizen questionnaire.
Since most of the current value data of the urban design of Beijing’s waterfront can be obtained through field surveys and open map data analysis, the current value questionnaire only contains the value assessment of six elements, which are marked as “the current value was concluded from the questionnaire” in Table 6, Table 7, Table 8 and Table 9. The expected value data of the urban design of Beijing’s waterfront were all obtained from the questionnaire.
The current value and expected value questionnaire survey for each waterfront segment included five citizen questionnaires and five expert questionnaires. The citizens who answered the questionnaire all live or work near the waterfront, ensuring familiarity with the waterfront. There were 270 citizen questionnaires (246 valid questionnaires), and 270 expert questionnaires (270 valid questionnaires). The questionnaires were distributed from April to October 2019.

2.4.3. Data Calculation and Representation

In the value assessment standard of the urban design of Beijing’s waterfront, the ratings of urban elements were 0–10, which can be accurate to single digits.
Five professors and experts from the Department of Urban Planning were interviewed to obtain the weight of the citizen questionnaire and expert questionnaire scores. Each expert gives weight to the citizen and expert questionnaires, and the total sum is 100%, and the average weight is taken (Table 13). For ease of calculation, take a ten-digit number. Therefore, 40% is for the citizen questionnaire and 60% is for the expert questionnaire. The citizens seem to have some misunderstandings about each urban element and the waterfront urban design, so experts consider the weight of the expert questionnaire higher than that of the citizen questionnaire.
Firstly, this study used Excel software to calculate the current value ratings of six elements from the questionnaire survey and the expected value ratings of all elements. At the same time, we analyzed and rated the current situation survey of the other 24 elements by SPSS24 and GIS software (version 2.5). The data obtained from the questionnaire survey were calculated as follows:
R k j i = 40 % × R C + 60 % × R E
RC is the citizen rating, and RE represents the expert rating.
Secondly, this study used EXCEL to calculate the current and expected values for each element, layer, and layer subsystem by weighting them at hierarchical levels. The specific formula applied was as follows:
V = k = 1 1 { W k j = 1 m [ W k j i = 1 n ( W k j i × R k j i ) ] }
V = k = 1 l V k
V k = W k j = 1 m V k j
V k j = W k j i = 1 n V k j i
V k j = W k j × R k j i
V is the total value of Beijing’s waterfront space (including current value and expected value). Vk is the value of urban layer subsystem k. Wk is the weight of urban layer subsystem k, and Vkj is the value of urban layer kj. Wkj is the weight of the urban layer kj. Vkji is the value of the element kji. Wkji is the weight of the element kji. Rkji is the rating of the element kji.
Thirdly, this study used Excel software to calculate the difference between the expected and current values of the four urban layer subsystems in each waterfront segment. It can provide a better analysis of the next urban design focus.
Finally, GIS software was used to generate a series of urban design value maps of Beijing’s waterfront by combining the current and expected values of each urban layer subsystem to visualize the results spatially, thereby clearly presenting the characteristics and problems of each river segment. The current problems and urban design focus were found by the difference between each waterfront segment’s expected and current values. Since the current issues of each waterfront segment’s urban design are different, urban planning decision-making will be more effective and relevant.

3. Results

3.1. Scale of Comprehensive Urban Waterfront

According to the calculation in Section 2.4.3, the values of the urban elements in Beijing’s waterfront were weighted and superimposed to obtain the current and expected values for the four subsystems and the overall system. Then, GIS software was used to visualize and represent the guide map, which is Figure 5. Figure 6 shows the expected and current values of Beijing’s waterfront. Then the GIS software was used to visualize and represent the current and expected value maps of Beijing’s waterfront, which is Figure 5 and Figure 7. Combined with the geographical location of each waterfront segment, the characteristics and issues of Beijing’s waterfront were analyzed.
(1)
Twelve waterfront segments (numbers A1, A4-2, A5-1, A5-2, C1-1, C1-2, C1-3, D5-3, E2, E3, E4, E10) are identified as good value (above six points), which take only 22.22% of the total number of waterfront segments. A total of 26 waterfront segments (numbers A6-2, D1, D8-2, B1, D2-1, D4-1, D13-2, D3-2, D7-1, D6-4, B2, D2-2, D5-2, D8-3, E7, D3-1, D6-3, D5-1, D6-2, D10, D11, D6-1, C2-2, C2-1, D12-2, D14) are identified as good value (above six points), which take 48.15% of the total number of waterfront segments. These results indicate that the current situation of Beijing’s waterfront is unsatisfactory.
(2)
The map of current values shows a distribution characterized by lower values the further out you go. The current values are relatively high in the northern area and within the Second Ring Road, and conversely, the lowest in the southern area. The current value between the Second Ring Road and the Third Ring Road is good. The current values of the waterfront outside the South Third Ring Road, East Fourth Ring Road, and West Third Ring Road are insufficient.
(3)
The waterfront segments of Class A and some historical water systems have high current value. Conversely, the waterfront segments of class D have a low current value. These results depend on the significance of the different waterfronts in “Master Urban Planning of Beijing (2016-2035)”.
(4)
The average expected value of Beijing’s waterfront is 1.66 times higher than the current value. These results indicate that Beijing citizens expect the waterfront to be worth a level above the current value. The interviewers were consulted about the issue of ”why the expected value is only 1.66 higher than the current value, not too high”. Because the questionnaire for the current value and the expected value were both filled out by the same person, the interviewers filled out the current value questionnaire first and then the expected value, so they scored the expected value of a waterfront segment with reference to the current status of the waterfront segment. Some waterfront segments are in poor condition, and there is little potential for improvement, so the expected value of these segments is only six points, and not all waterfront segments’ expected value is 8–10 points. Thus, the average expected value of Beijing’s waterfront is higher than the current value but not significantly.
(5)
As Figure 5 shows, the expected value distribution of Beijing’s waterfront is the same as the current value distribution, decreasing outward, although the downward trend is not evident.
In this study, it was determined that each urban layer subsystem was represented on the map, including the current value and expected value (Figure 7).
(1)
The northern area has a higher ecological value than the southern area, and the North Second Ring Road area is the highest. Since the environment is better in the city’s outer regions, the further out, the higher the ecological value of the waterfront.
(2)
The current spatial value of the waterfront in the central area is relatively high and decreases as it goes out.
(3)
The current demand value of waterfront space is higher in the north than in the south, particularly from the North Fourth Ring Road to the South Second Ring Road and from the West Third Ring Road to the East Second Ring Road. It justifies the deeming of waterfront activities as reasonable in these areas.
(4)
Research results show that most historical blocks and buildings were built along with the trend of water systems. However, the historical value of Beijing’s waterfront is uneven. The current historical value of the historical water system’s waterfront segments is the highest, mainly concentrated within the Fourth Ring Road.

3.2. Scale of Waterfront Segment

For the value assessment at the waterfront segment scale in Beijing’s waterfront, this study places more emphasis on the difference between the expected value and the current value, because the difference can directly point out which urban layers and subsystems need to be prioritized or focused on in the future urban design.
In this study, radar maps of the difference between expected and current values were created for each waterfront segment for 10 layers. As examples, we present two waterfront segments (A4-2, A4-3) that give detailed information for 10 layers and the total expected and current value (Figure 8). By using these methods and radar maps, the decision-making of the urban design will be more targeted and effective.
(1)
There are 18 waterfront segments in which the expected value differs from the current value by more than two points. There urgently need to be optimized through urban planning and design (C2-2, A4-3, D5-2, D14, A2, E6, A6-2, D12-2, C2-1, D5-1, A6-1, A7, A4-1, E9, B2, D3-2, D2-2, D11).
(2)
Twenty waterfront segments need ecological renovation, which is when the difference between the expected and current value is higher than two points (A2, E6, C2-2, D14, A7, A4-3, D5-2, D5-1, D12-2, D3-2, A6-1, A6-2, D12-1, C1-1, D3-3, C1-2, C1-3, D11, E9, C2-1).
(3)
The urban design of 26 waterfront segments needs to give the spatial layer subsystem more consideration (E6, C2-2, E9, A4-3, D5-2, A6-2, A7, B2, D12-2, D14, D5-1, C2-1, D2-2, E10, D3-2, E1, C3, C1-2, D3-3, A6-1, D11, C1-3, E7, A4-2, D12-1).
(4)
In 23 waterfront segments, there is a large discrepancy between expected and current demand values. (A4-3, C2-2, D5-2, D14, C3, C2-1, D12-2, A6-1, D5-1, A7, D11, D2-2, B2, A6-2, E9, E6, A2, D3-2, A5-2, E1, D2-1, E10, D3-3), most of which are in the east and south.
(5)
To reinforce cultural development, some waterfront segments of historical water systems are still required (A1, A6-2, A6-1, D5-2, C2-2, D5-3, D5-1, C2-1, A4-3, A4-2, E6, E11, D12-2, A3-2, A3-1, A2).

4. Discussion

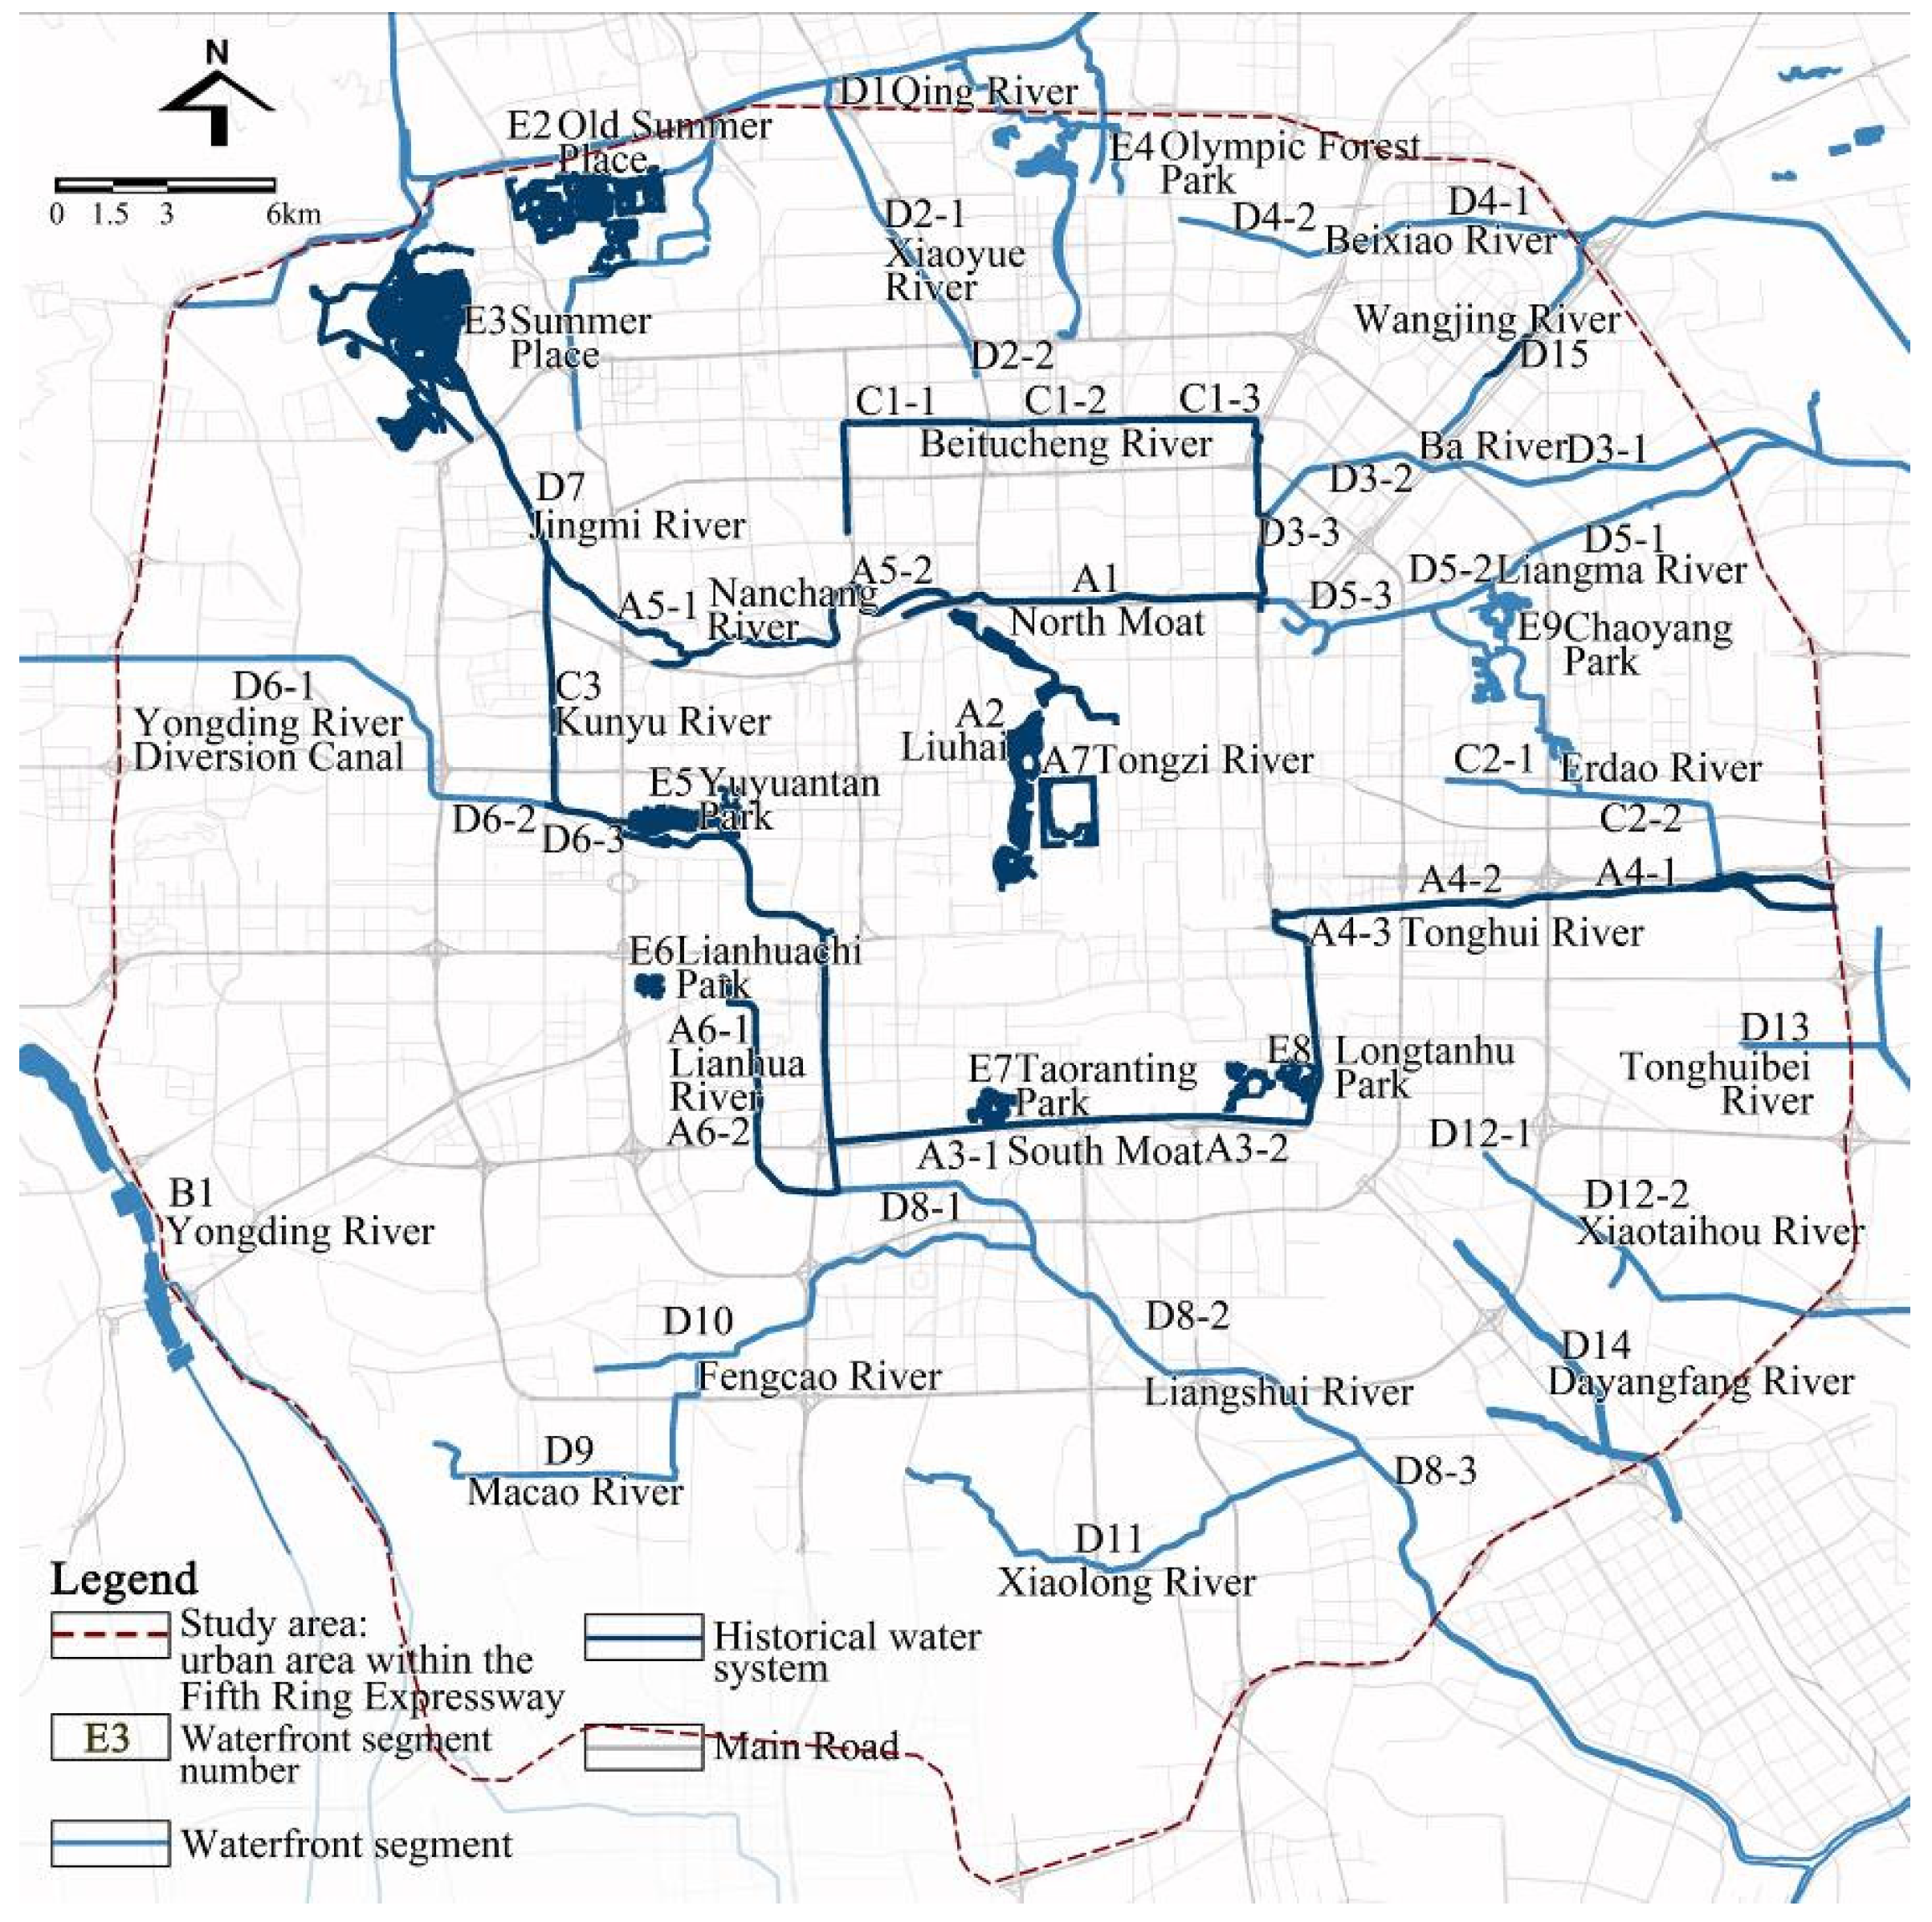
In contrast to other cities that are influenced by only one or two rivers, Beijing is traversed by numerous rivers and lakes. As a result, Beijing’s waterfront areas should serve more purposes for social relationship building and experience sharing than those in other cities. If we want to encourage new uses and encounters, the quality of the waterfront urban design becomes critical. Assessing the current and expected values of waterfront space prior to urban design in order to understand what kind of waterfront space citizens envision. Additionally, a better planning and urban design process can be facilitated by the value of the various subsystems and layers expressed through maps [23].
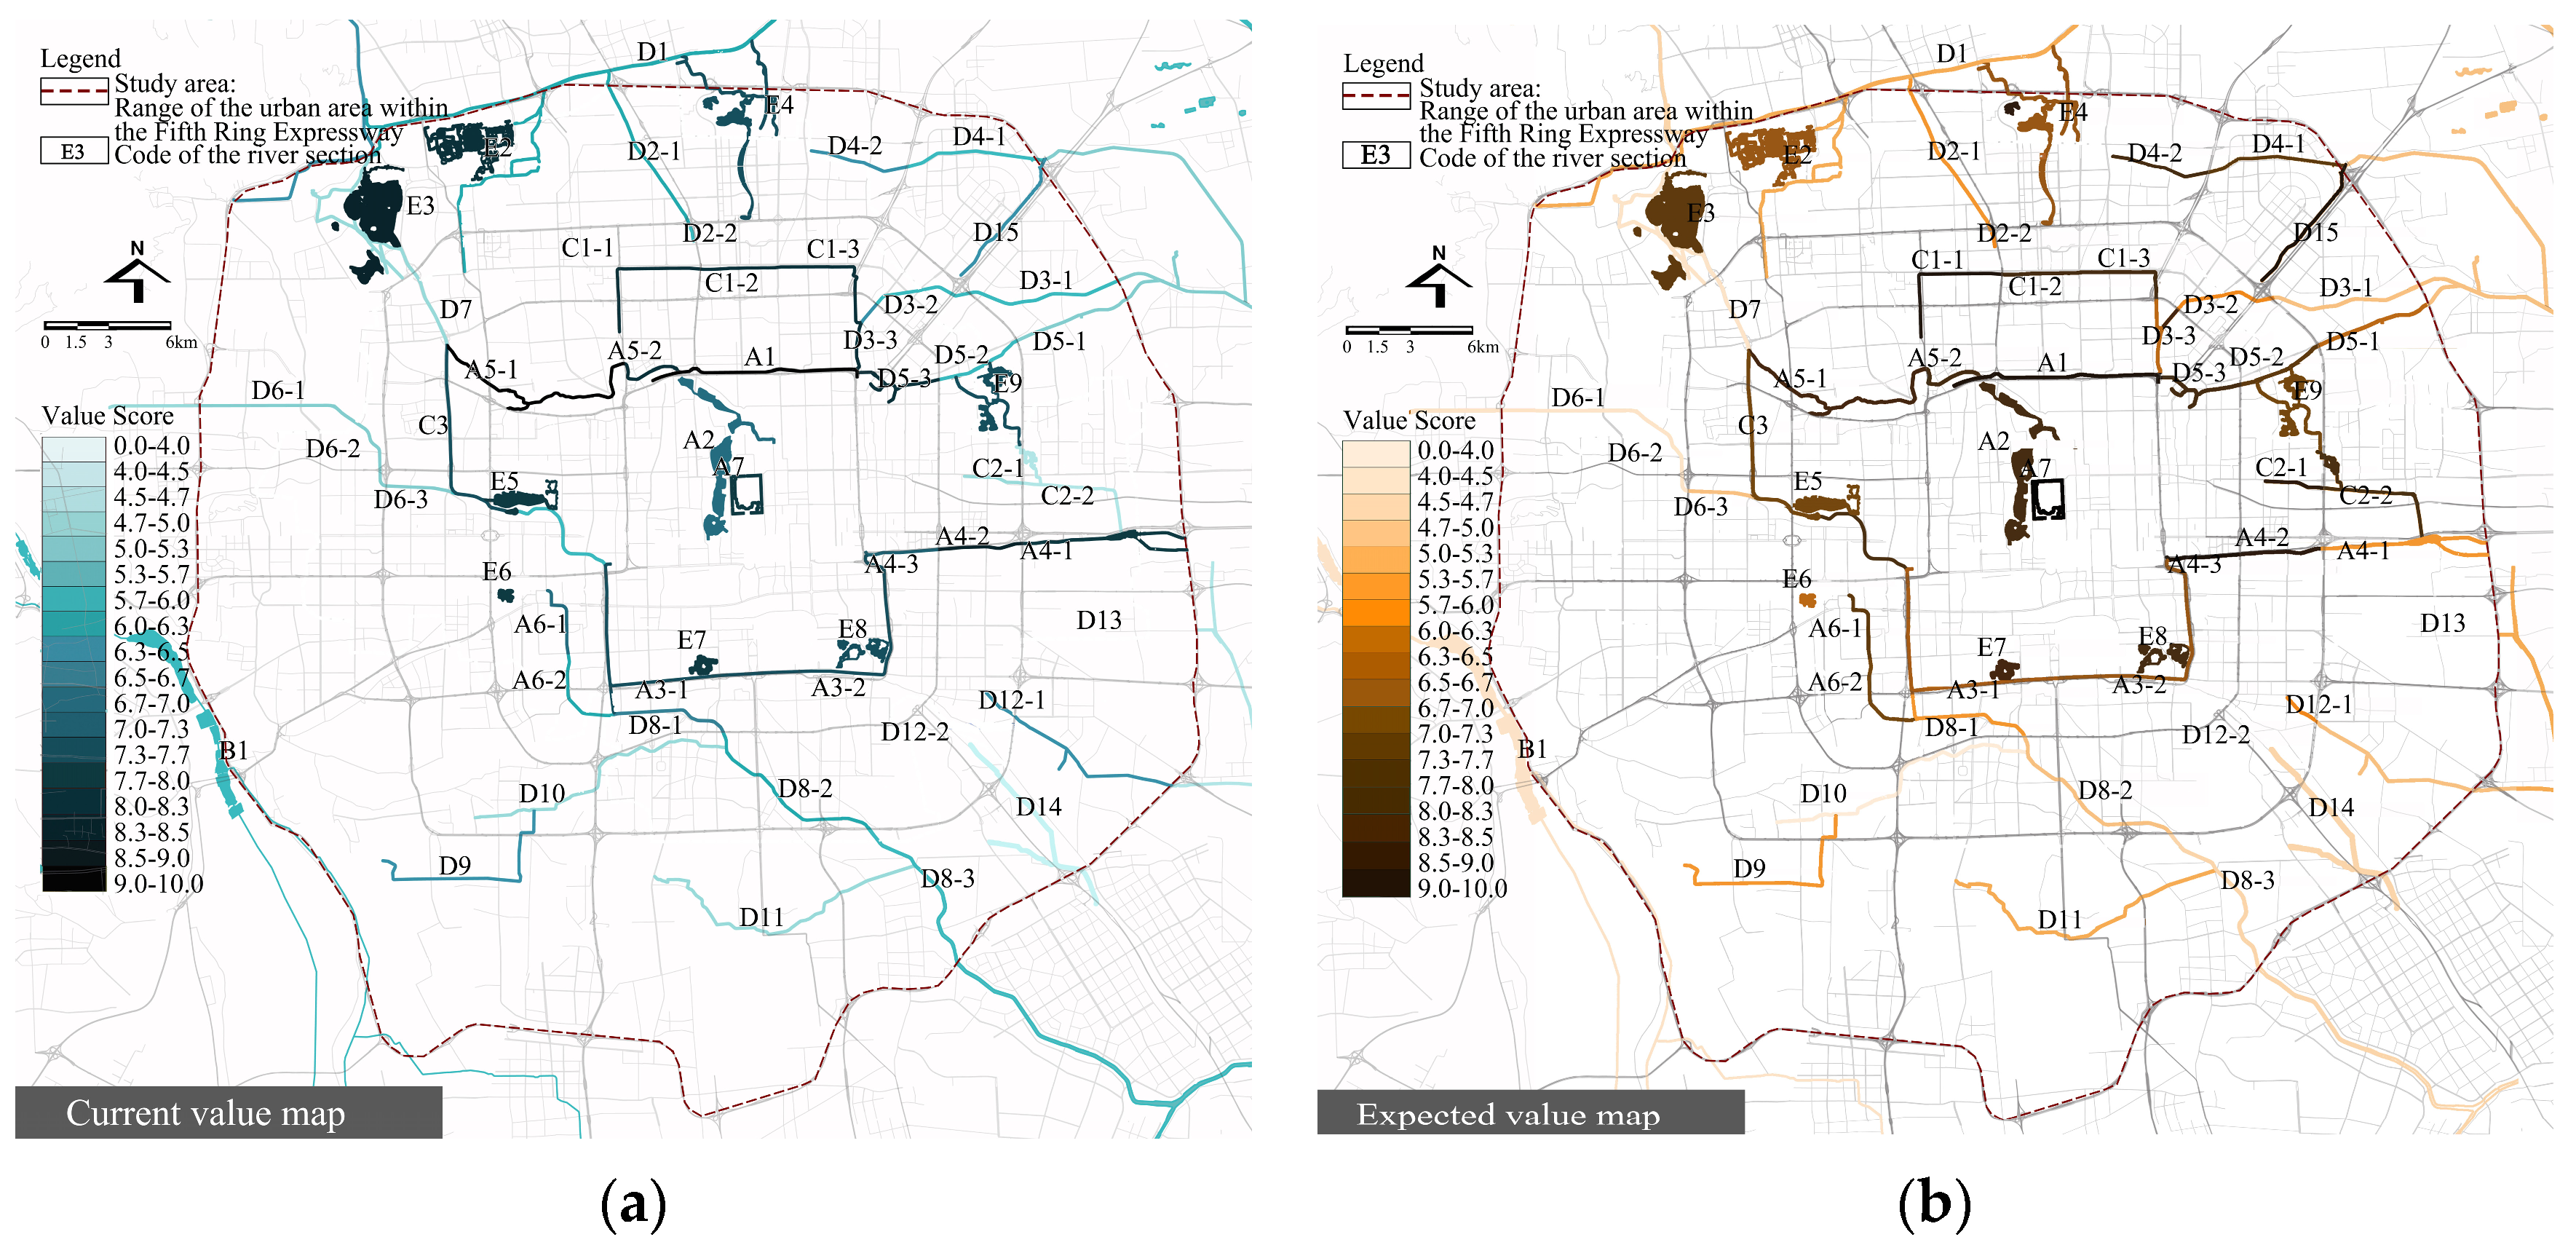
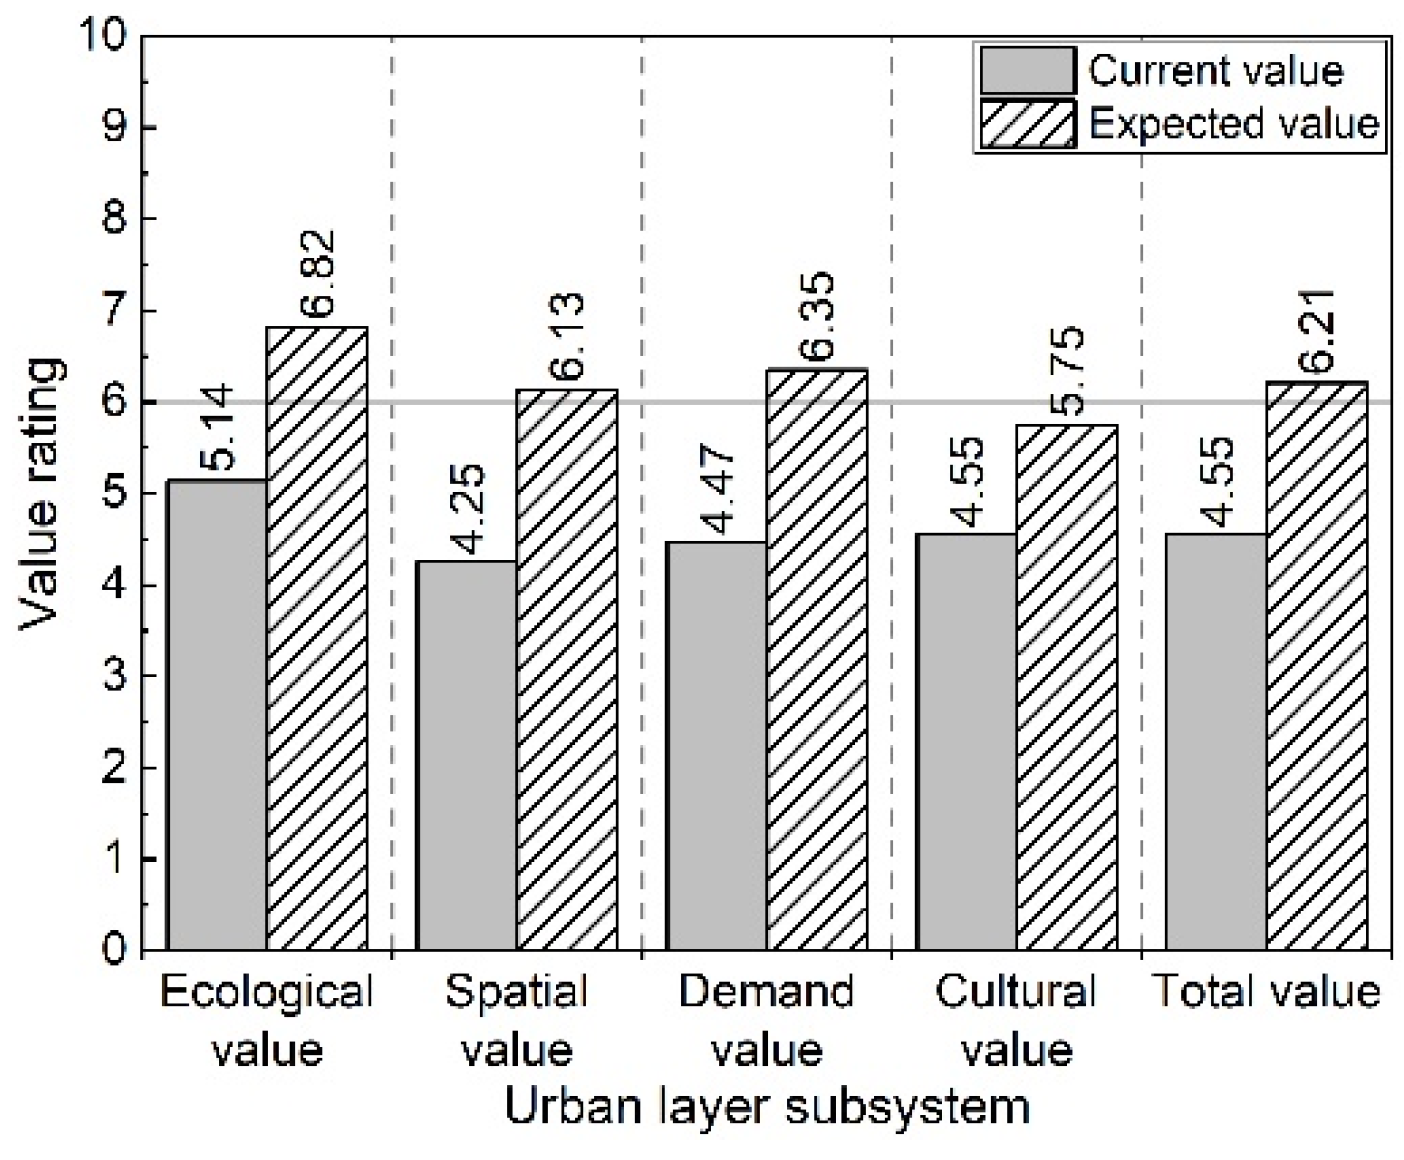
Further discussion of the results indicates that Beijing citizens are not extremely satisfied with the waterfront, which means there are some issues that need to be addressed through a comprehensive urban design of Beijing’s waterfront. The current value study reveals that the value of Beijing’s waterfront can be classified into threee categories: excellent, normal, and poor. First, the landscape area’s waterfront is generally of high quality, and it consists primarily of the large river and lake park within the fifth ring and the moat in the north part. Second, the majority of the waterways that need to be upgraded in terms of waterfront value are ecological rivers in the suburbs and some drainage channels that have been rehabilitated in recent years. Third, the overall waterfront value of drainage channels is poor, and a black color and bad odor are common, and it is in urgent need of comprehensive improvement.
In addition, this study found that there are some patterns in Beijing’s waterfront. First, previous studies have found that the value of waterfronts is most related to their location [6,22]. Nevertheless, the results of this study show that the differences in waterfront between different segments of the same river are significant, and they are related to the distinct administrative areas of its passage and whether any urban design project has been implemented, such as A4, A5, A6, D5, and D12. Second, an interesting discovery is that the low difference between the expected and current values of some waterfront segments is not because they already have a good urban design quality. Instead, it is the location and surroundings of these waterfront segments that lead to a lower public expectation.

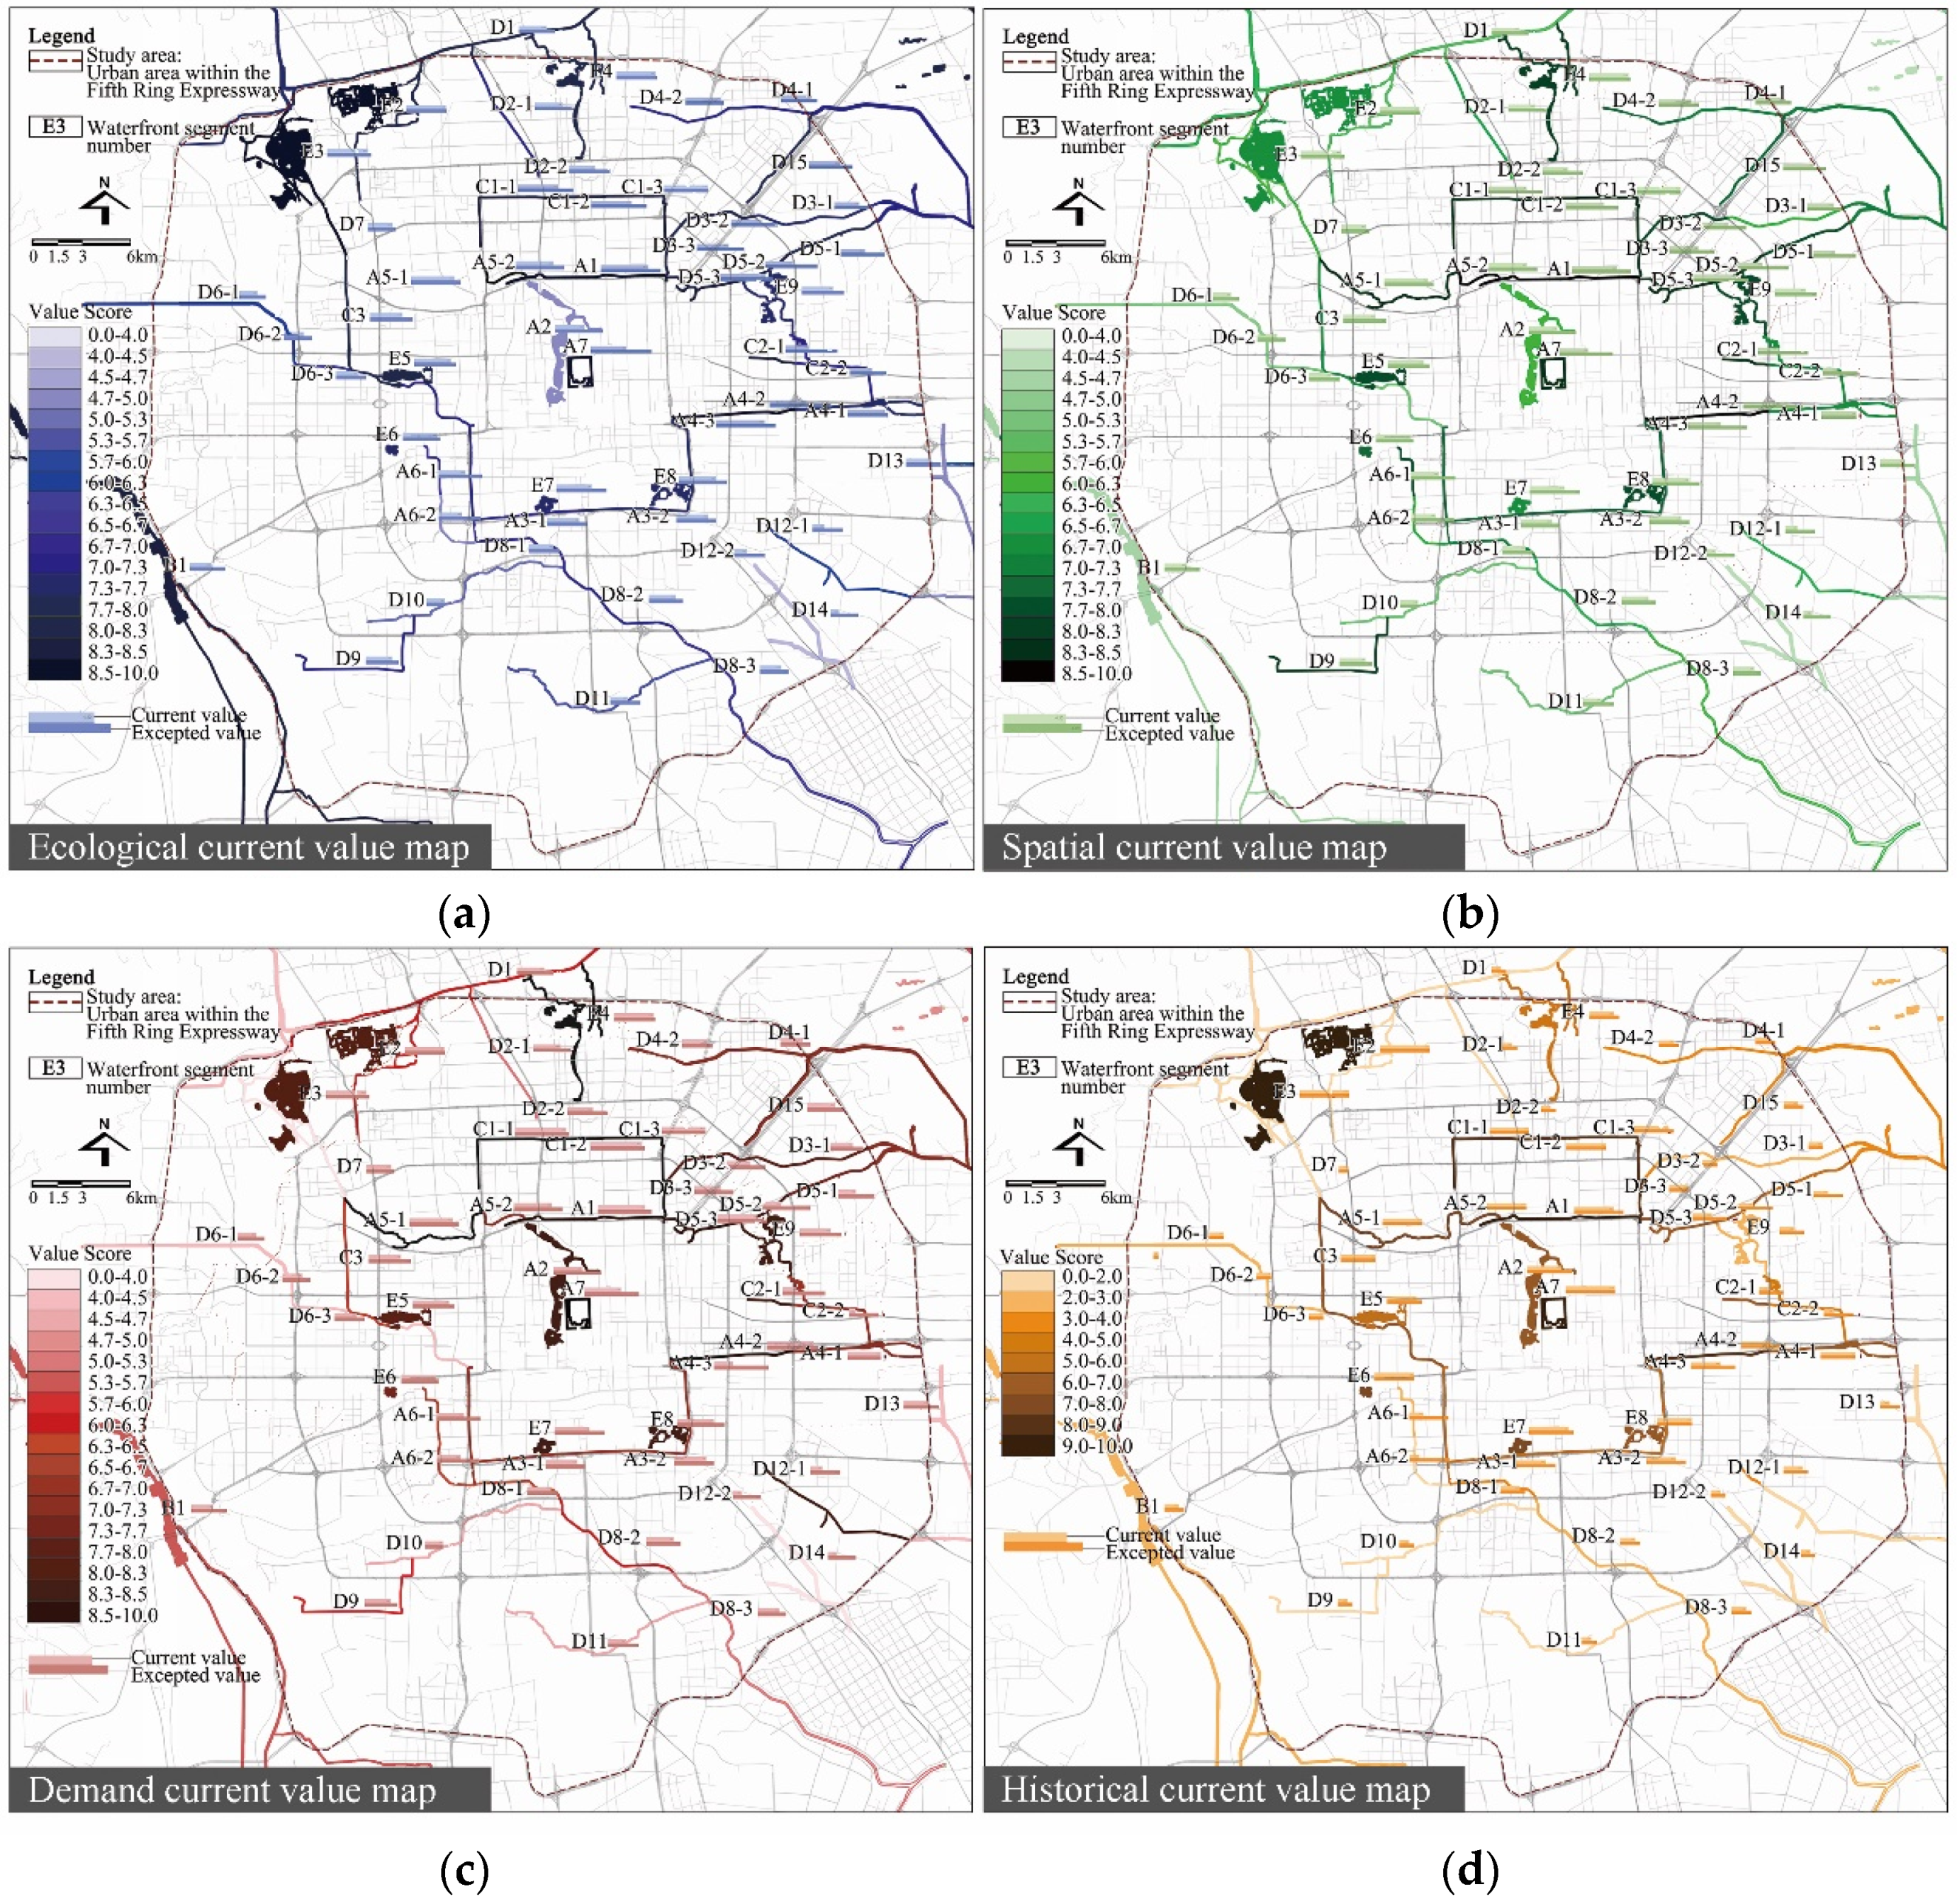
4.1. Ecological Subsystem

For waterbodies, most of Beijing’s rivers and lakes are artificial. The water source is adjusted manually, so the water quantity is greatly affected by man, which is low (current average of 5.4). In addition to a water shortage [39,41], this study discovered that Beijing’s unstable water quantity is another factor contributing to its low water quantity rating. It is also worth noting that, as a result of artificial control and seasonality, some rivers and lakes that have been planned or are in good ecological condition experience drying up or seasonal water shortages. The channel management and waterfront planning were not integrated and well-coordinated. Therefore, we need to control the water quantity and the width of the water surface within a specific range through manual management.
The result of this study found that the water quality in Beijing has a large gap. The water source area has relatively independent management, and the water quality condition is good. The overall water quality of the drainage channel is relatively poor, and water pollution is widespread and needs to be fully rectified. Through human intervention and ecological restoration, particularly source control, Beijing’s rivers and lakes will have better water quality. In the upstream areas, a combination of artificial and natural facilities will be used to purify the water by using wetlands and water-purifying plants to filter contaminants and absorb nutrients.
The contemporary waterfront green belt landscape consists largely of protected greenery [22]. In general, the landscape quality of Beijing’s waterfront is typically coarse, and the flora is only one color and lacks ornamentation. Through the urban design project, a portion of the waterfront has developed a good three-dimensional landscape structure (such as A1, A5, C1, A4), but there is no articulation with the landscape of other nearby waterfront segments and neighborhood blocks, such as A4-3 with A4-2 and A4-1, D5-3 with D5-2 and D5-1.
Regarding the green rate, we found that, compared to artificial rivers in urban centers, ecological rivers in the countryside have a considerably higher rate of greening [19,20]. Further discussion of the study results indicates that excessive artificial disturbance actually reduces the green rate and permeability of the waterfront. Thus, waterfronts in urban centers should be designed to promote greenery over hard surfaces, better stormwater management, and higher infiltration rates. The natural ecological structure should be protected and artificial alterations should be avoided in waterfront urban design in the countryside.
The capacity of Beijing’s water system, particularly the Yongding River basin, to conserve water and soil has been significantly decreased by rapid population expansion and urban construction. To ensure water quality and flood safety, the width of the waterfront corridor should be increased, while the number of man-made infrastructures, such as roads, on both banks should be decreased.
This study found that, unlike other cities, the design of plant community structure and buffer zones in Beijing’s waterfront mainly focused on the design of hydro-dynamic belts rather than riparian areas [11,22]. This is due to the fact that the dryness of Beijing’s water system is strongly influenced by the seasons. When there is an abundance of water, it is submerged and dominated by the watershed environment; when there is a lack of water, it is exposed as the water level drops and is dominated by the land environment. As a result, the plant community at the subsidence zone should be both aquatic and terrestrial, and its height should vary. The majority of the plants along the waterfront are water-resistant, and the plants along the waterfront of wetlands are indigenous aquatic plants. Ground cover with attractive blooming is present in important places.
For openness of the water-oriented interface, research has discovered that water activities and transportation, shoreline form and gradient, and water quantity are most closely related to how open a water-oriented interface is [23]. The overall water-oriented interface of Beijing’s waterfront lacks openness, implying that Beijing’s waterfront is low in hydrophilicity, particularly the waterfront in the central city. The waterfronts of parks and lakes are more hydrophilic since they have more water activities and traffic. The openness of water-oriented interaction is preferable because rural water systems have more biological shorelines and a softer gradient. Therefore, the urban design of Beijing’s waterfront should focus on enhancing the openness of the water-oriented interface in the waterfront of the central city.
The key to improving the ecological value of the waterfront is the optimized design of the shoreline form and material, particularly hydrophilicity, biodiversity, and habitat [42]. The shoreline in Beijing is too artificial and lacks both ecological character and diversity. Only in the suburban areas are there three kinds of ecological embankments: natural waterline, terrain-formed canal, and natural flood protection buffer, while in urban centers, they are all artificial embankments. The shoreline form in Beijing should reflect the features of the Beijing water system during abundant and dry periods, and the slope of the waterfront slope should be as slow as possible. For instance, alter the shape of the shoreline and the terrain to convert the preceding trapezoidal cross-section into a compound cross-section or alter the embankment line setback and the topography [26,27]. This study found that the ecological value and hydrophilicity of waterfront segments with multi-level embankment forms were higher. Therefore, to improve the hydrophilicity, the open space of the waterfront can be split into two levels first: the upper level and the lower level. The upper space adds sidewalks, bicycle paths, and other infrastructures to meet people’s daily needs, as well as to allow people to rest and play in the upper space when the lower space is flooded during the abundant water period. A large number of steps and water-friendly facilities are built next to the lower water body.
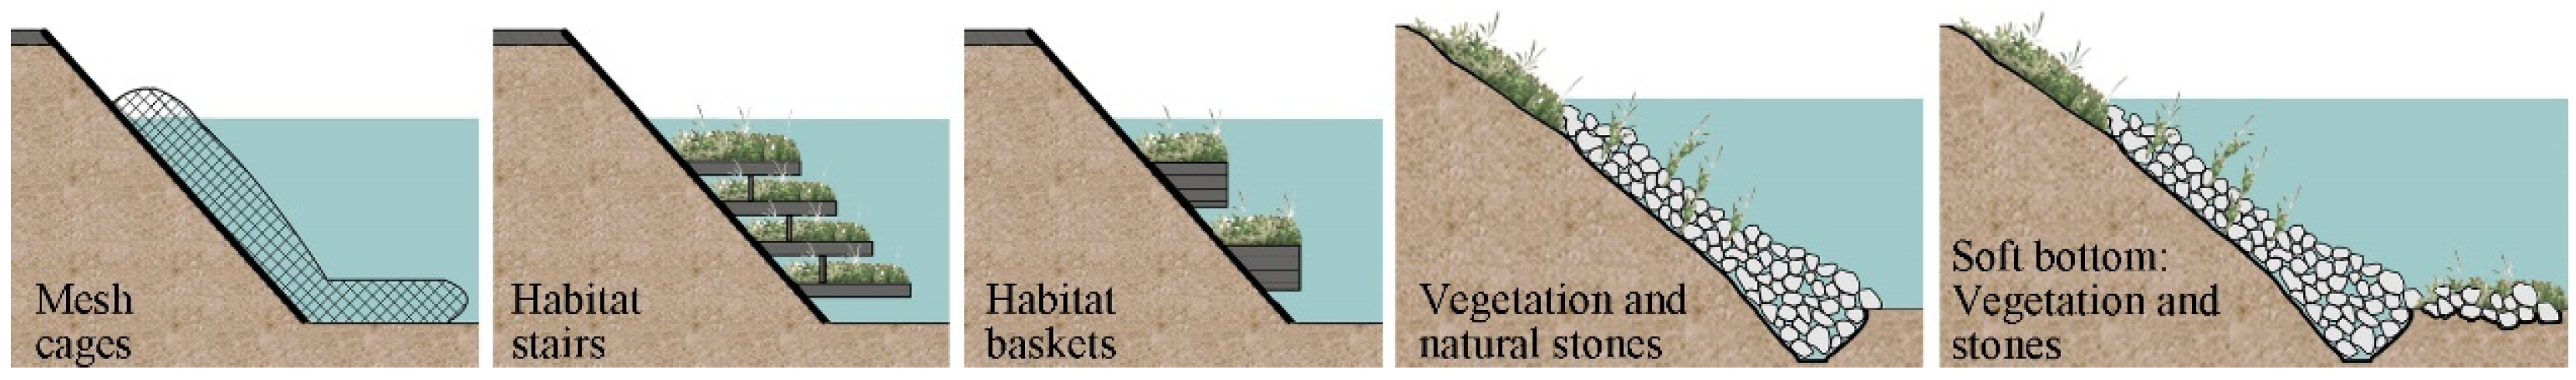
Shoreline forms should incorporate a combination of ecological berms, green berms, wetlands, habitats, and gray and green infrastructure to increase ecological diversity and habitat along the waterfront [43,44]. First, the artificial shoreline’s berm material should be transformed into an ecological material combining vegetation and natural stones, or habitat baskets, habitat stairs, and mesh cages should be added to the artificial berm to increase fish, benthic, and bird organisms. Second, the bottoms of artificial shoreline should be replaced with soft bottom materials such as natural stones, vegetation mixed with stones, and other materials [45] (Figure 9). Finally, the ecological shoreline’s flood control facilities and wetland protection planning should be improved.

4.2. Spatial Subsystem

The result of this study indicates that the value of the waterfront is directly correlated with the function mix of the surrounding blocks [15]. Nevertheless, it is challenging to alter a beachfront building’s purpose. By using urban design guidelines to promote publicness and a variety of purposes, it can be integrated with urban regeneration initiatives to transform the ground floor building function of waterfront buildings [22]. Make sure that at least 30% of the ground floor of residential buildings along the waterfronts are accessible to the public and that at least 80% of the ground floor of commercial and official buildings is accessible to the public.
According to the survey, waterfront segments with a high value of building facades share characteristics like higher variance in facade details, better permeability, and a certain fluctuation in skyline height. The value of building facades with three-dimensional vegetation or large terraces combined with greening is higher. Unexpectedly, this study found that there is no correlation between a building’s façade value and height, despite skyline hierarchy having a larger influence. The waterfront building facades should follow urban design guidelines. First, include more balconies, windows, semi-outdoor activity spaces, and other vivid architectural details and spatial changes. Second, in order to increase the openness of the building’s ground floor, there should be more doors and windows open to the water system. Third, the building’s ground-floor construction is expertly planned to complement the facade’s human scale. Forth, to extend the waterfront landscape into the neighboring communities and buildings, the buildings around the waterfront should be given extra multi-story open platforms paired with three-dimensional greening.
In general, the higher the price of a land value, the higher the value of the local waterfront [46]. Furthermore, the higher the ecological quality of the waterfront scenery, the higher the value of the surrounding land [46,47]. However, the results of this study indicate that the main cause of this phenomenon is the consequence of waterfront urban design projects in areas with high land values and a significant functional mix. For external traffic, improving accessibility is critical to increasing the utilization of the waterfront [
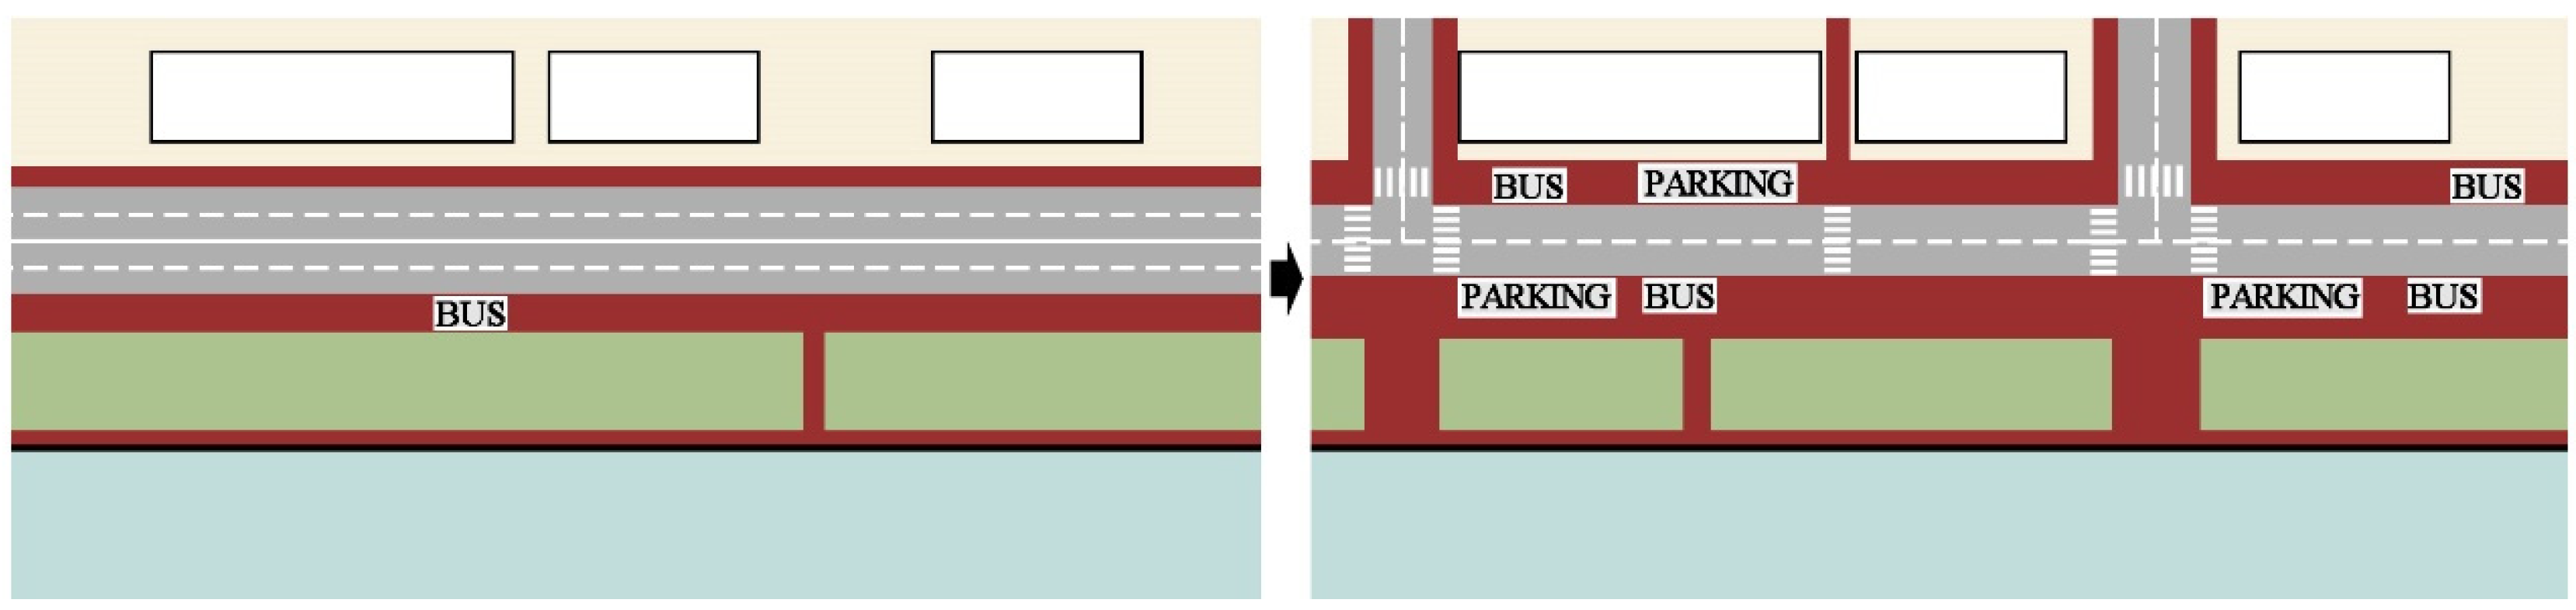
30]. In Beijing, there is a conflict between the waterfront network and the transportation network. Some waterfront segments are inaccessible, and the pedestrian system lacks consistency. Beijing’s waterfront should be planned through a comprehensive urban design that integrates the conflicts and connections between the waterfront and transportation network to maximize the natural waterfront character and supports all modes of transportation while maintaining a pedestrian-oriented transportation environment. Beijing’s waterfront should have urban design with transportation planning together (Figure 10). First, external transportation along the waterfront ought to boost the number of bus stations and guarantee that slow-moving roads are directly connected to bus routes. Second, degrade the waterfront urban roadways, make the road network denser, add pedestrian crossings, improve the connection between the waterfront and the neighborhood, and keep the traffic environment pedestrian-friendly. Third, the waterfront can be better utilized by increasing parking areas in less desirable waterfront areas, including subsidence zones, flood control roads, and places under bridges.
Beijing’s waterfront has fewer internal transportation options, generally just walking and jogging, and the majority of waterfronts have not yet installed dedicated jogging tracks. Lots of waterfront segments that lack internal walkways along Beijing’s waterfront are occasionally cut off by urban roads, and there is a lot of negative space under bridges along the waterfront. First, Beijing’s waterfront should have a thorough urban design that considers both cycling and walking paths; connects with the urban slow transport system; expands facilities for sharing, renting, and maintaining bicycles; and promotes cycling along the waterfront. Second, separate and continuous walking and jogging tracks should be established. Third, the continuation of the slow transport system can be assured by installing trestle walkways and other structures if it is interrupted by a bridge.
For water transportation, Beijing’s rivers were first used for irrigation, water supply, and navigation, with no or little interaction between people and the water. Public activities become more prevalent during the Ming and Qing eras. People began participating in water sports like boating and ice skating during the Republican era. Due to the general functional and managerial limits of waterways, the shorelines of large lakes and rivers are heavily used nowadays. Boating and ice skating are just a couple of the activities you may do on lakes. In contrast, riverfront activities are typically lacking. The boating route along the Kunyu River (E3-D7-C3-E5) is the only remaining water traffic-flow route; however, it has the drawback of having no landscape to tour. To provide additional water traffic-flow lines, such as the Tonghui River (A4), the comprehensive urban design for Beijing’s waterfront should consider the water quantity, the width of the water surface, and the surrounding landscape.

4.3. Demand Subsystem

There are numerous activities available in Beijing’s waterfront, especially in the northern section of the city, including fishing, singing, running, reading, playing the saxophone, picnicking, and badminton. However, some waterfront parts do not have enough activity venues, and the venues’ spatial configuration does not correspond to the requirements of the various activities. In general, Beijing’s waterfront lacks sports fields, and only a few waterfront areas have synthetic racetracks and cycle lines.
Through urban design, Beijing’s waterfront should be outfitted with recreational or fitness spaces for usage by locals on a regular basis, such as multipurpose courts, fitness centers, jogging routes, and others. Different types of citizens should be considered in urban design, with special emphasis paid to activity spaces for the elderly and children. According to the utilization characteristics of various activities, including the size, material, and location of the sites, urban design should strengthen the connection between spatial forms and public needs through public participation so that the waterfront has positive urban cultural connotations, historical significance, and neighborhoods. For greater public involvement, vegetated buffers, trails, and parking between the river and the street are needed to increase the waterfront’s access, transportation, and openness while reducing noise and dust pollution. There is also a need to provide the widest possible range of public activities.
Additionally, to increase the waterfront’s utilization rate, the comprehensive urban design of Beijing’s waterfront should improve the public service facilities that support it and give a reasonable location for public service facilities. Along the waterfront, comprehensive service stations can be set up to provide tourist information, public toilets, water bars, wireless network coverage, emergency medical aid stations, maintenance stations, and other facilities. The distance between comprehensive service stations should not exceed 1 km. Second, bicycle parking facilities should be set up in conjunction with public green spaces and transportation hubs, including shared and private bicycle parking areas. Clear signs and fixed racks should be installed at the bicycle parking facilities. In order to best facilitate the development of the slow transport system, the distance between bicycle parking facilities should not exceed 100 m. Third, when combined with the trail set shading facilities, the shaded area should not be less than 40% of the trail area. Pavement constructed of permeable concrete is advised. In addition, to improve the comfort of trail running, walking, and other activities, the spatial identifiability of the slow walking trail is highlighted through urban design.
Except for lakes and park waterfront places, the research indicates that there is now very little labor force along Beijing’s waterfront. There is some waterfront with more activity that at first developed some impromptu stalls. For instance, the waterfront at C1 North Moat is already hosted by places that sell food, tourist trinkets, etc. This shows that there is great potential for providing jobs and economic activities along the waterfront. In addition to community services, the comprehensive urban design of Beijing’s waterfront should offer a variety of service jobs and commercial activities there. Public spaces like stores, cafes, restaurants, bookstores, and mini-libraries can be placed in the areas close to water bodies as a strategy to create jobs, as can community service centers in larger waterfront places.
Additionally, this study discovers a correlation between the waterfront’s activity richness and the emotional demand values of the general public, such as a sense of place and security. First, to improve the sense of place in waterfront, use waterfront buildings and space under bridges to construct popular leisure spaces integrating art and creativity, art parks, creative exhibition halls, etc. Second, to improve the sense of security of the waterfront, aesthetic treatment of the bridge’s columns and underbelly, enrichment of the underpass’s landscape pattern, and breaking up the negative space under the bridge.
This study found that some areas of Beijing’s waterfront now lack adequate lighting, which leads to a low sense of security [23], especially in the south and suburbs. The waterfront should have adequate lighting installed in order to improve safety. The lighting facilities should be both useful and aesthetically pleasing, with the functional lighting making sure that pedestrians can see the road surface, ramps, steps, and other slow-moving pathway illumination. Due to the functional lighting, the pedestrian should be able to see the road, ramps, steps, obstacles, and the faces of people coming from four meters away.
In addition, it is advisable to encourage the opening of the ground floor of waterfront buildings, set up entrances and exits facing the water, and add ground floor commercial and public space to increase the vitality and safety of the waterfront.

4.4. Cultural Subsystem

This study found that, for a historically significant city like Beijing, the water system’s historical preservation can affect its 
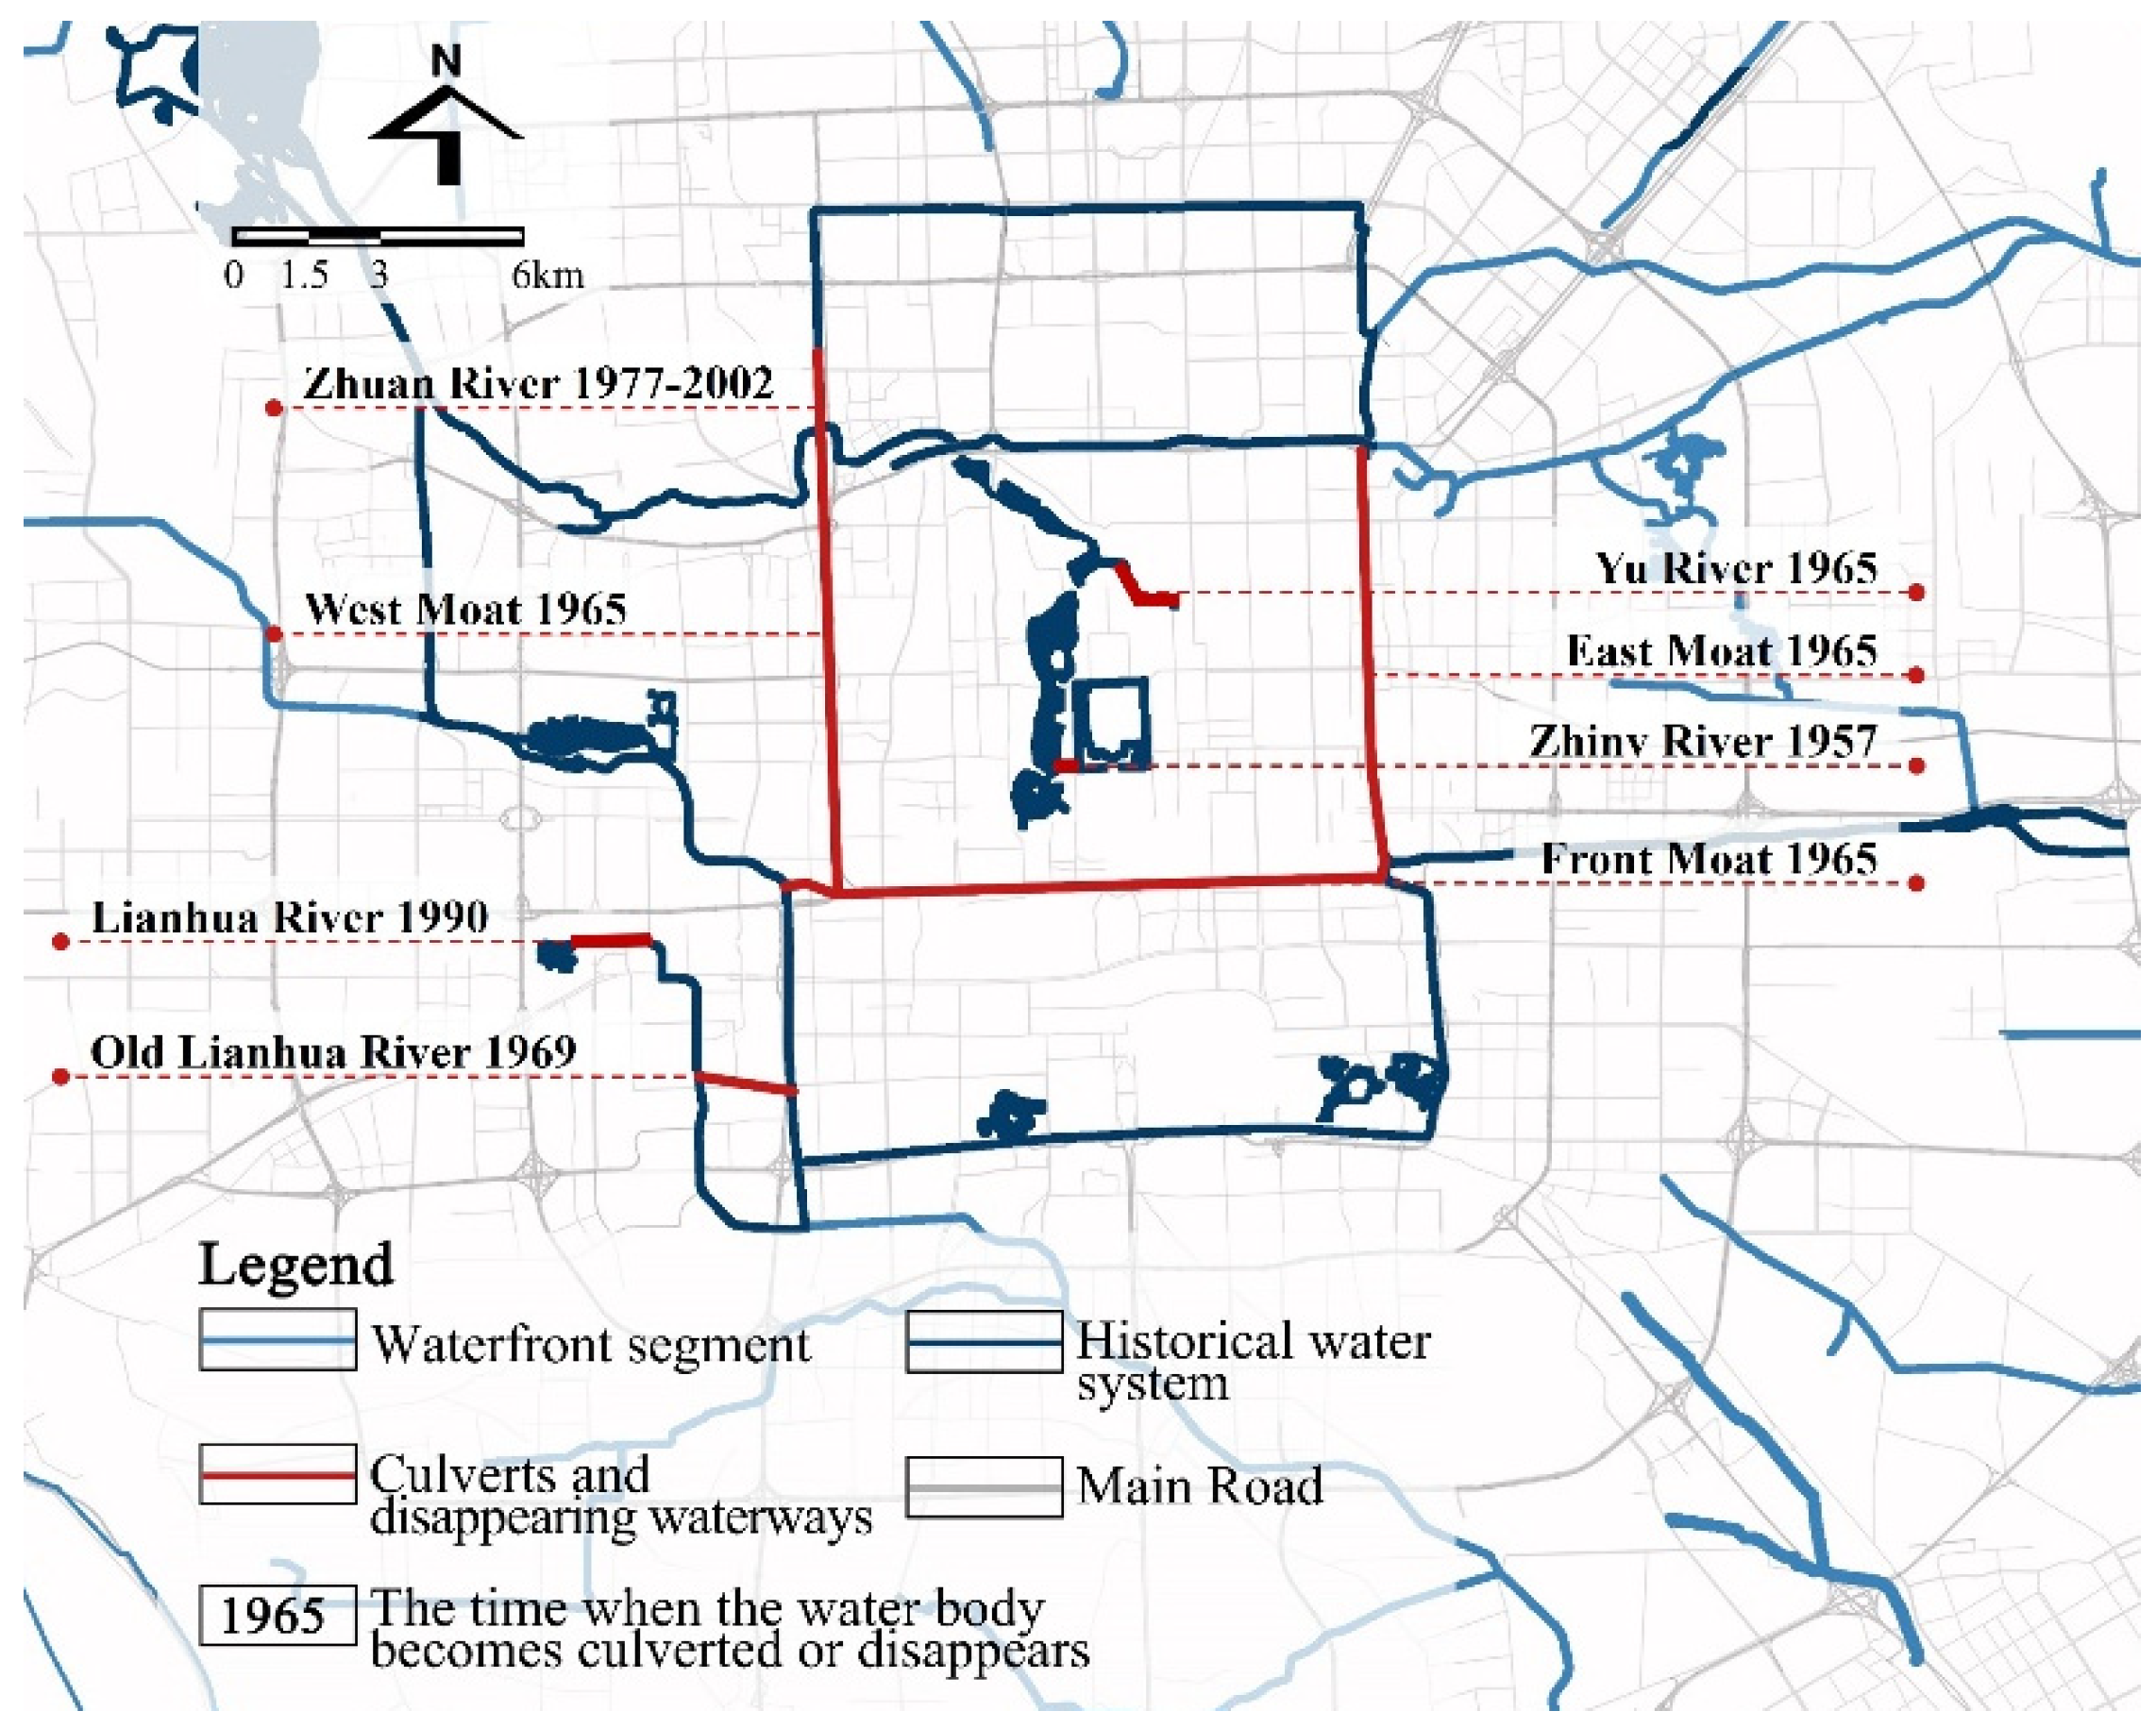
cultural value. The water system in Beijing was constructed during the period of the city’s history. The waterfront of Beijing has accumulated cultural elements over time. It is important to do a thematic urban design study for the historical water system as part of the comprehensive urban design of Beijing’s waterfront. The waterfront’s historical features in Beijing are not sufficiently extracted, which weakens the sense of place and history. Some historic rivers have been lost or transformed into underground culverts for the sake of urban development, weakening the historic character of the waterfront (Figure 11). However, diverting water into underground culverts presents issues since it reduces drainage capacity, increases the risk of flooding downstream, affects aquatic ecosystems, deteriorates water quality, and obscures water space to the public.
At the macro-level, the comprehensive urban design of Beijing’s waterfront should restore the structure of the urban historic water system and should open up underground culverts (“de-culverting” or “daylighting”) [48]. The first suggestion is to restore the Yu River and the Qiansanmen Moat, as specified in the “Master Urban Planning of Beijing (2016-2035)”. Second, gradually reopen other historical waterways. Third, recreate the historical water feature pattern in Beijing. Fourth, on the basis of reopening the culverts, an open waterfront that integrates water, alleys, and neighborhoods should be restored simultaneously. At the meso-level, the urban design should strengthen the relationship between the waterfront district, the historic neighborhood, and the historic water system. At the micro-level, the urban design should emphasize the sense of history of the waterfront through the excavation and application of historical symbols.
This study proves that pre-investigation, assessment of current and expected values, and identification problems are vital processes in waterfronts’ urban design and transformation. Managers, citizens, planners, and visitors should all be involved in the value assessment of the waterfront urban design. Value assessment can help planners identify the problems and deficiencies of the waterfront and understand the views and needs of different stakeholders on the waterfront. At the same time, value assessment can provide targeted recommendations for urban planning and the design of Beijing’s waterfront and increase public participation in urban design [9].

5. Conclusions

A waterfront is both ecological space and social activity space for a city. Ecologically, the waterfront can prevent flooding, reduce soil and water pollution, and improve the ecological carrying capacity of the city. Socially, a waterfront can provide ecological places for citizen’s activities, promote urban economic development. Understanding the contributing elements of poor value at different spatial scales and urban layer systems will help to design and build infrastructure that successfully supports ecosystem processes, functions, and services to supplement the current focus on the waterfront urban design [45,49,50,51].
An essential contribution of this study is to propose a stratification method for waterfront value assessment based on the urban layer system. The urban layer system of Beijing’ waterfront consists of four subsystems, 10 urban layers, and 29 urban elements. The urban layers and elements in the urban layer system and their weights can be adapted to different local situations and particular recommendations, expanding the possibilities of applying this method to other cities and waterfronts. As a viable method, the data of all urban layers and elements can be easily obtained and monitored. It is also easy to analyze their development trends and causes.
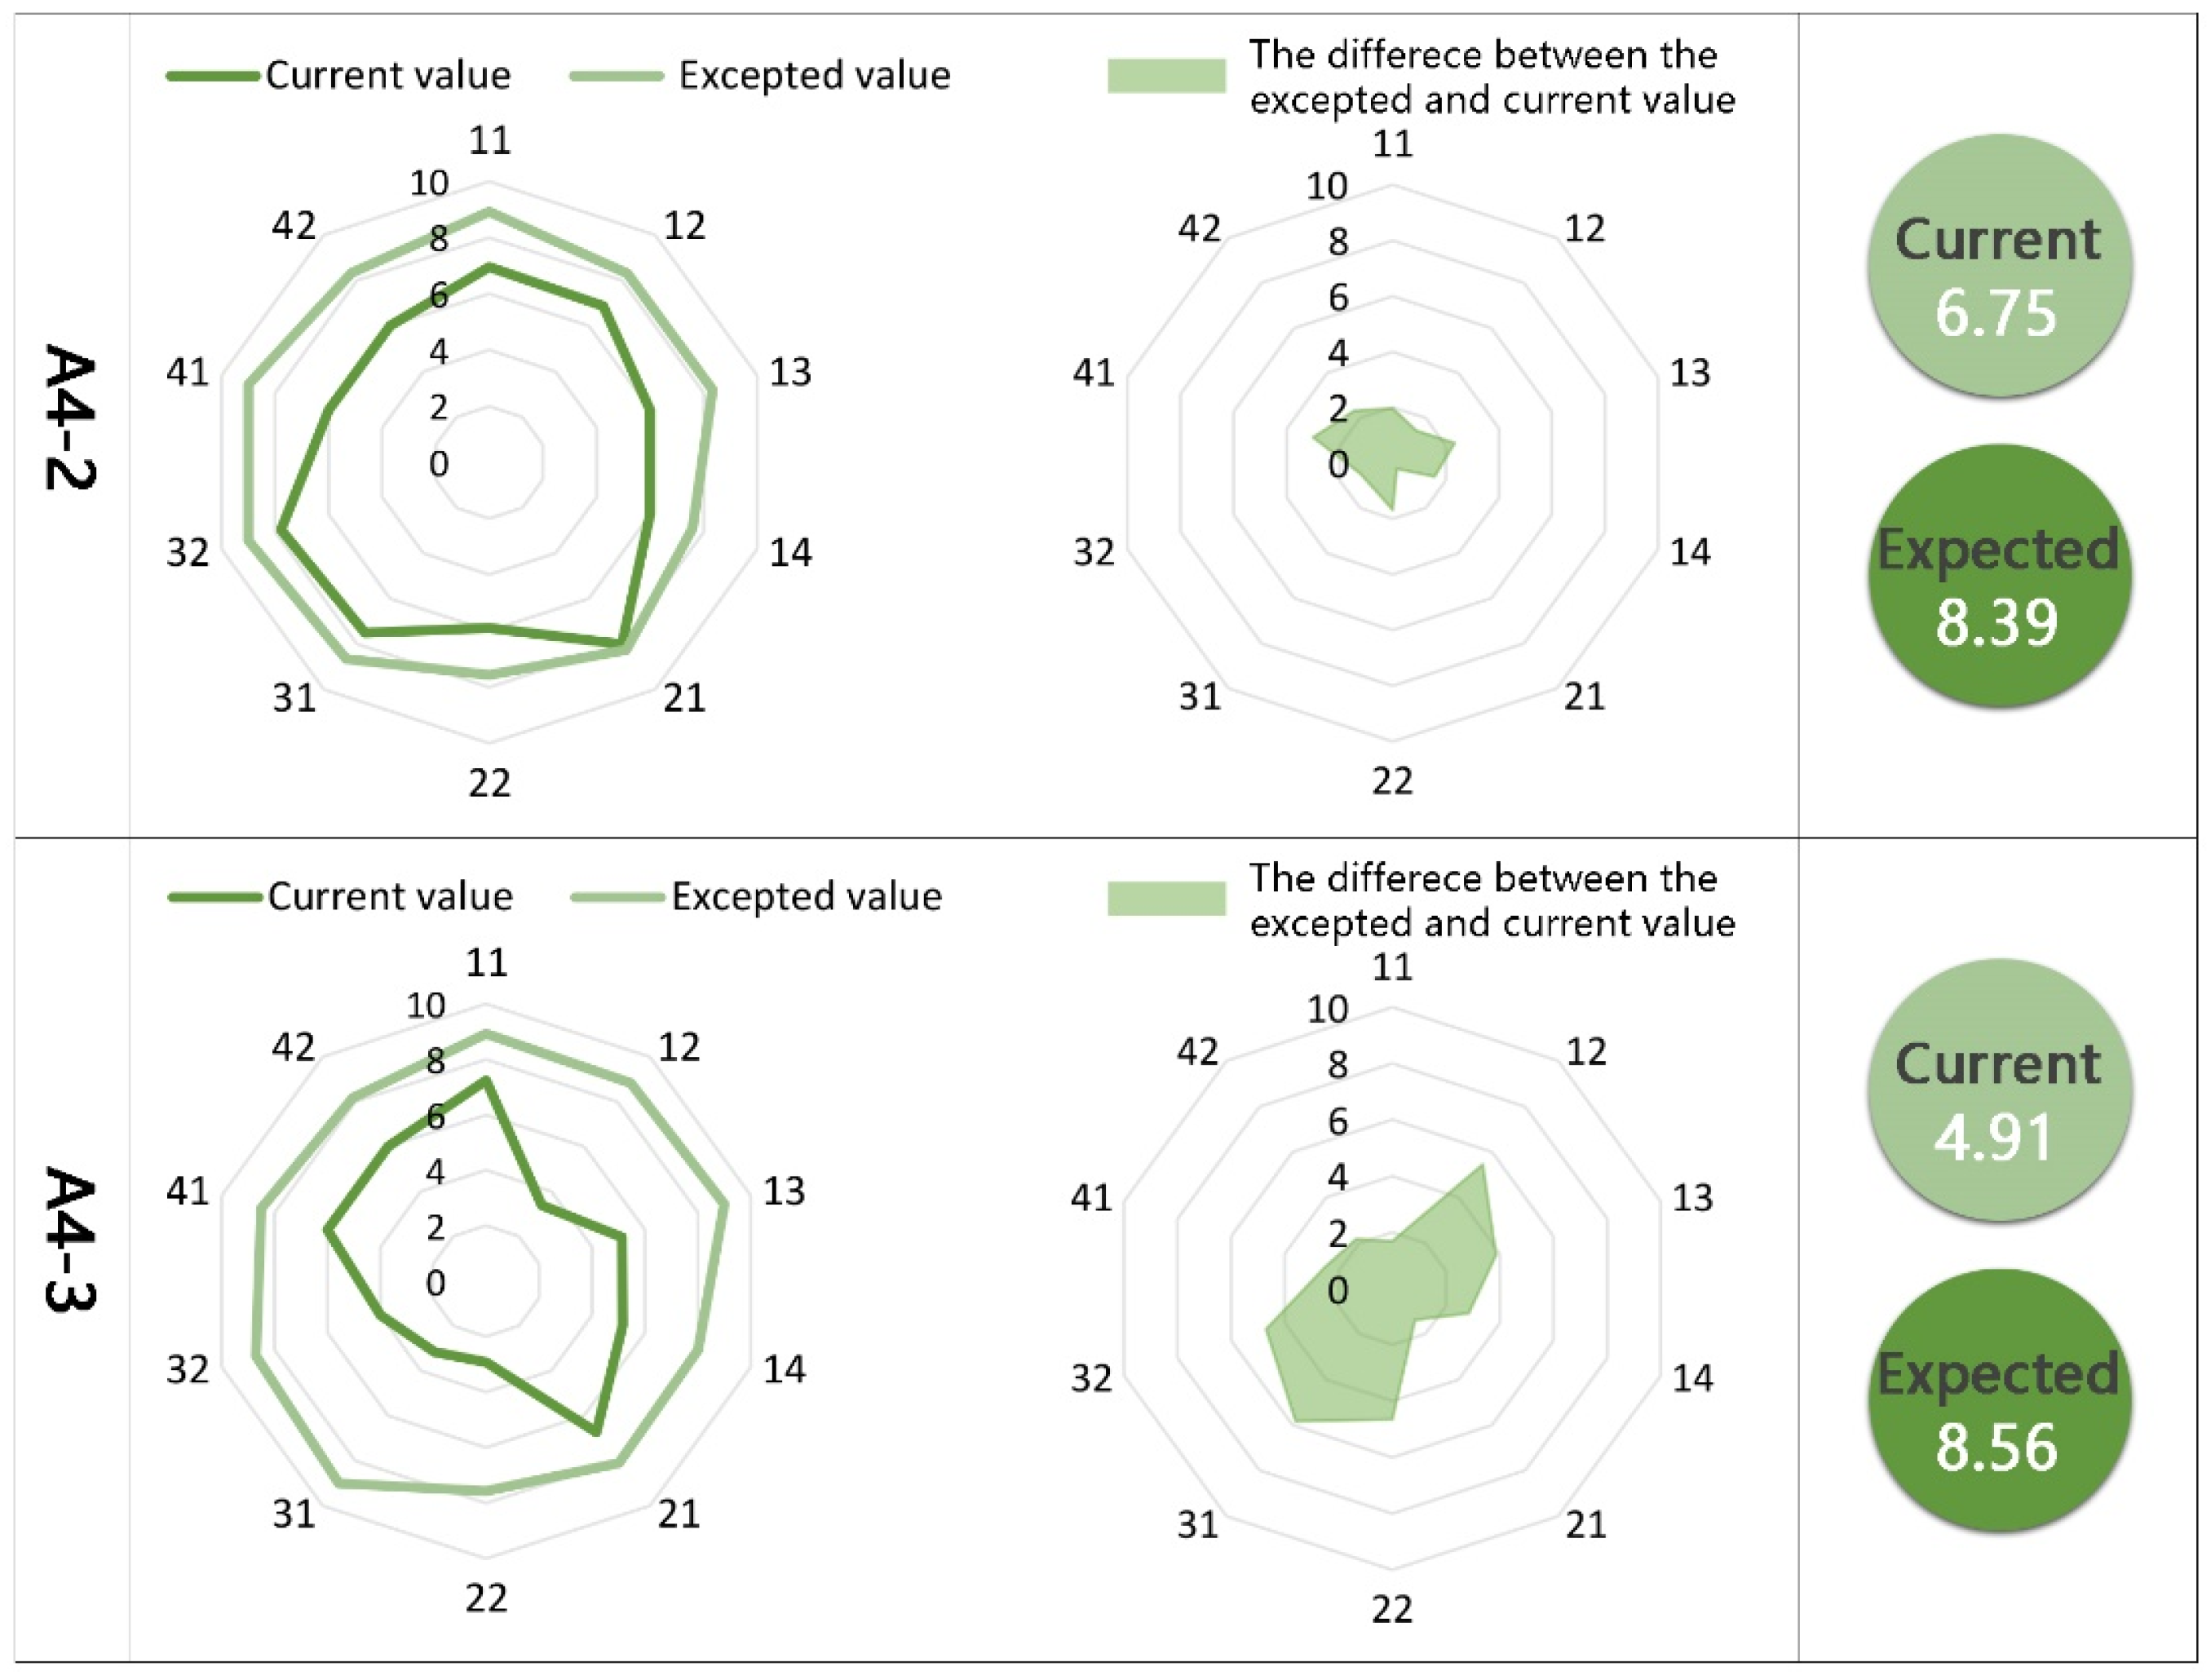
Compared with previous value assessment studies, this study has two improvements. First, the weights of each urban element and layer were increased to make this assessment method more flexible and targeted. Second, in addition to the current value assessment, the expected value assessment was also added. By investigating and using the difference between the expected and the current value of the waterfront, we can identify the specific problems of each waterfront segment. The greater the difference in which urban subsystem or layer, the more that urban subsystem or layer needs to be transformed through urban design.
This study shows that the current value of Beijing’s waterfront is not satisfactory to the public and differs from the expected value. Beijing’s waterfront needs to enhance its value through comprehensive urban design. Furthermore, this study identifies the issues of each urban subsystem and the waterfront segments that need to be planned and renovated. Each waterfront segment is unique and faced different problems [9,22]. Urban planning and design are endless [32,37]. Nonetheless, this study provides an understanding of critical design characteristics, issues, and strategies for Beijing’s waterfront segments.
The comprehensive urban design of Beijing’s waterfront should consider the interests of the public and government, followed by multifaceted, long-term, and hierarchical planning. Pre-investigation, assessment of current and expected values, and identification problems should be the processes of the urban design studies to absorb public and expert opinions.
There are some limitations in this study that need to be improved in future studies. First, future studies should apply the urban layer system into waterfront urban design studies in other cities, increase the weight of the urban elements and layers’ flexibility, and add elements and layers which are suitable for other cities. Second, in further studies, the urban layer system needs to be applied to different types of urban design studies and projects.

Author Contributions

Conceptualization and methodology, L.C. and S.X.; data curation, formal analysis, investigation, L.C.; software and visualization, L.C. and Y.L.; writing—original draft, L.C.; writing—review and editing, L.C., Y.L., H.L. and Y.W.; Supervision, H.L. and S.X. All authors have read and agreed to the published version of the manuscript.

Funding

This research was funded by Heilongjiang Province Social Science Research Planning Foundation, grant number 22GLC275; financial assistance under Heilongjiang Postdoctoral Fund, grant number LBH-Z22158; the Fundamental Research Funds for the Central Universities, grant number HIT. HSS. 202207.

Institutional Review Board Statement

Not applicable.

Informed Consent Statement

Not applicable.

Data Availability Statement

Not applicable.

Acknowledgments

This research acknowledge the support of China Architecture Design and Research Group for the field survey.

Conflicts of Interest

The authors declare no conflict of interest.

References

  1. Hall, P. Cities in Civilization: Culture, Innovation and Urban Order; Weidenfeld and Nicolson: London, UK, 1998. [Google Scholar]
  2. Silva-Sánchez, S.; Jacobi, P. Implementation of riverside parks in the city of São Paulo—Progress and constraints. Local Environ. 2014, 21, 65–84. [Google Scholar] [CrossRef]
  3. Chen, L.L.; Xu, S.N.; Hou, X.H.; Xue, B.X. Study on the Framework of Water Environment Layer in Urban Layer System. In Proceedings of the 54th ISOCARP, Bode, Noway, 1–8 October 2018. [Google Scholar]
  4. Hillman, M.; Brierley, G. A critical review of catchment-scale stream rehabilitation programs. Prog. Phys. Geogr. 2005, 29, 50–76. [Google Scholar] [CrossRef]
  5. Hagerman, C. Shaping neighborhoods and nature: Urban political ecologies of urban waterfront transformations in Portland, Oregon. Cities 2007, 24, 285–297. [Google Scholar] [CrossRef]
  6. Che, Y.; Yang, K.; Chen, T.; Xu, Q. Assessing a riverfront rehabilitation project using the comprehensive index of public accessibility. Ecol. Eng. 2012, 40, 80–87. [Google Scholar] [CrossRef]
  7. Attia, S.; Ibrahim, A.A.A.M. Accessible and Inclusive Public Space: The Regeneration of Waterfront in Informal Areas. Urban Res. Pract. 2018, 11, 314–337. [Google Scholar] [CrossRef]
  8. Hamidia, S.; Bonakdarb, A.; Keshavarzib, G.; Ewing, R. Do Urban Design qualities add to property values? An empirical analysis of the relationship between Urban Design qualities and property values. Cities 2020, 98, 102564. [Google Scholar] [CrossRef]
  9. Sairinen, R.; Kumpulainen, S. Assessing social impacts in urban waterfront regeneration. Environ. Impact Assess. Rev. 2006, 26, 120–135. [Google Scholar] [CrossRef]
  10. Evans, G. Measure for measure: Evaluating the evidence of culture’s contribution to regeneration. Urban Stud. 2005, 42, 959–983. [Google Scholar] [CrossRef]
  11. Chou, R.J. Achieving successful river restoration in dense urban areas: Lessons from Taiwan. Sustainability 2016, 8, 1159. [Google Scholar] [CrossRef] [Green Version]
  12. Talen, E.; Hermida, S. Neighborhood evaluation using GIS: An exploratory study. Environ. Behav. 2007, 39, 583–615. [Google Scholar] [CrossRef]
  13. Gunay, Z.; Dokmeci, V. Culture-led regeneration of Istanbul waterfront: Golden Horn Cultural Valley Project. Cities 2012, 29, 213–222. [Google Scholar] [CrossRef]
  14. Timur, U.P. Urban Waterfront Regenerations. Advances in Landscape Architecture; InTech Open Acess: London, UK, 2013; pp. 169–206. [Google Scholar]
  15. Diao, M.; Ferreira, J. Residential property values and the built environment. Transp. Res. Rec. J. Transp. Res. Board 2010, 2174, 138–147. [Google Scholar] [CrossRef]
  16. Gilderbloom, J.I.; Riggs, W.W.; Meares, W.L. Does walkability matter? An examination of walkability’s impact on housing values, foreclosures and crime. Cities 2015, 42, 13–24. [Google Scholar] [CrossRef]
  17. Hamidi, S.; Moazzeni, S. Examining the relationship between urban design qualities and walking behavior: Empirical evidence from Dallas, TX. Sustainability 2019, 11, 2720. [Google Scholar] [CrossRef] [Green Version]
  18. John, M.; Geoffrey, T. Neighborhood street layout and property value: The interaction of accessibility and land use mix. J. Real Estate Financ. Econ. 2007, 35, 111–141. [Google Scholar] [CrossRef]
  19. White, J. Pursuing design excellence: Urban design governance on Toronto’s waterfront. Prog. Plan. 2016, 110, 1–41. [Google Scholar] [CrossRef] [Green Version]
  20. Oakley, S. Waterfront regeneration in Australia: Local responses to global trends in reimagining disused city docklands. Geogr. Res. 2021, 59, 394–406. [Google Scholar] [CrossRef]
  21. Liu, S.; Lai, S.Q.; Liu, C.; Jiang, L. What influenced the vitality of the waterfront open space? A case study of Huangpu River in Shanghai, China. Cities 2021, 114, 103197. [Google Scholar] [CrossRef]
  22. Vian, F.; Izquierdo, J.; Martínez, M. River-city recreational interaction: A classification of urban riverfront parks. Urban For. Urban Green. 2021, 59, 127042. [Google Scholar] [CrossRef]
  23. Hermida, A.; Cabrera-Jarab., N.; Osoriob, P.; Cabrera, S. Methodology for the assessment of connectivity and comfort of urban rivers. Cities 2019, 95, 102376. [Google Scholar] [CrossRef]
  24. Isa, M.; Marzbali, M.; Saad, S. Mediating role of place identity in the relationship between place quality and user satisfaction in waterfronts: A case study of penang, malaysia. J. Place Manag. Dev. 2021, 15, 130–148. [Google Scholar] [CrossRef]
  25. Joseph, M.; Wang, F.H.; Wang, L. GIS-based assessment of urban environmental quality in Port-au-Prince, Haiti. Habitat Int. 2014, 41, 33–40. [Google Scholar] [CrossRef]
  26. Tang, Z.H. Evaluating local coastal zone land use planning capacities in California. Ocean Coast. Manag. 2008, 51, 544–555. [Google Scholar] [CrossRef] [Green Version]
  27. Turner, R.K. Integrating natural and socio-economic science in coastal management. J. Mar. Syst. 2000, 25, 447–460. [Google Scholar] [CrossRef]
  28. Gao, W.F.; Zhu, J.W.; Hao, X.W. Landscape spatial accessibility analysis of urban water system planning: A case stud-y of Xixian New Area. IOP Conf. Ser. Earth Environ. Sci. 2019, 344, 012155. [Google Scholar] [CrossRef]
  29. Moe, R.; Wilkie, C. Changing Places: Rebuilding Community in the Age of Sprawl; Henry Holt & Company: New York, NY, USA, 1997. [Google Scholar]
  30. Da, T.; Xu, Y.J. Evaluation on connectivity of urban waterfront redevelopment under hesitant fuzzy linguistic environment. Ocean Coast. Manag. 2016, 132, 101–110. [Google Scholar] [CrossRef]
  31. Xu, S.N.; Chen, L.L. Knowing the end from the beginning: The traceability of layer thoughts in urban design. City Plan. Rev. 2020, 44, 62–72+82. [Google Scholar]
  32. Forgaci, C. Integrated Urban River Corridors: Spatial Design for Social-Ecological Resilience in Bucharest and Beyond. Doctoral Dissertation, University of Technology, Delft, The Netherlands, 2018. [Google Scholar]
  33. Hofmann, M.; Westermann, J.R.; Kowarik, I.; Van der Meer, E. Perceptions of parks and urban derelict land by landscape planners and residents. Urban For. Urban Green. 2012, 11, 303–312. [Google Scholar] [CrossRef]
  34. Xu, S.N.; Chen, L.L. Construction of technical method and path for urban layer system research in urban design. Planners 2020, 20, 20–26. [Google Scholar]
  35. Liu, Y.; Chen, L.L.; Jiang, H.Z. Influencing factor extraction of healing environment identifiability based on environmental psychoanalysis. Psychiatr. Danub. 2022, 34, 620–627. [Google Scholar]
  36. Tang, Y. Landscape Quality Evaluation of Chengdu Luoshui Wetland Park Based on Analytic Hierarchy Process and Fuzzy Comprehensive Evaluation Method. Master’s Thesis, Sichuan Agricultural University, Ya’an, China, 2020. [Google Scholar]
  37. Shi, S.H.; Kondolf, G.M.; Li, D.H. Urban river transformation and the landscape garden city movement in China. Sustainability 2018, 10, 4103. [Google Scholar] [CrossRef] [Green Version]
  38. Shah, S.; Roy, A.K. Social sustainability of urban waterfront-the case of carter road waterfront in Mumbai, India. Procedia Environ. Sci. 2017, 37, 195–204. [Google Scholar] [CrossRef]
  39. Dumbaugh, E.; Rae, R. Safe urban form: Revisiting the relationship between community design and traffic safety. J. Am. Plan. Assoc. 2009, 75, 309–329. [Google Scholar] [CrossRef]
  40. Stamps, A.; Nasar, J.L.; Hanyu, K. Using pre-construction validation to regulate urban skylines. J. Am. Plan. Assoc. 2005, 71, 73–91. [Google Scholar] [CrossRef]
  41. Badland, H.; Schofield, G. Transport, urban design, and physical activity: An evidence-based update. Transp. Res. Part D Transp. Environ. 2005, 10, 177–196. [Google Scholar] [CrossRef]
  42. Goff, M. Evaluating Habitat Enhancements of an Urban Intertidal Seawall: Ecological Responses and Management Implications. Master’s Thesis, School of Aquatic and Fishery Sciences, University of Washington, Washington, DC, USA, 2010. [Google Scholar]
  43. Yu, K.J.; Wang, S.S. Ecological Baseline for Beijing’s Urban Sprawl: Basic Ecosystem Services and Their Security Patterns. City Plan. Rev. 2010, 34, 19–24. [Google Scholar]
  44. Li, F.; Ma, X. Study on Plan of rural waterfront greenway in Beijing based on valley economy. Earth Environ. Sci. 2018, 108, 042121. [Google Scholar]
  45. Dyson, K.; Yocom, K. Ecological design for urban waterfronts. Urban Ecosyst 2015, 18, 189–208. [Google Scholar] [CrossRef]
  46. Alain, J.F.; Louie, S.; Frances, P. Values in urban design: A design studio teaching approach. Des. Study 2017, 49, 66–100. [Google Scholar] [CrossRef] [Green Version]
  47. Jim, C.Y.; Chen, W.Y. External effects of neighbourhood parks and landscape elements on high-rise residential value. Land Use Policy 2010, 27, 662–670. [Google Scholar] [CrossRef]
  48. Jones, P.; Macdonald, N. Making space for unruly water: Sustainable drainage systems and the disciplining of surface runoff. Geoforum 2007, 38, 534–544. [Google Scholar] [CrossRef]
  49. Forsyth, A. Innovation in urban design: Does research help? J. Urban Des. 2007, 12, 61–473. [Google Scholar] [CrossRef]
  50. Perkol-Finkel, S.; Ferrario, F.; Nicotera, V.; Airoldi, L. Conservation challenges in urban seascapes: Promoting the growth of threatened species on coastal infrastructures. J. Appl. Ecol. 2012, 49, 1457–1466. [Google Scholar] [CrossRef]
  51. Toft, J.; Ogston, A.; Heerhartz, S.; Cordell, J.; Flemer, E. Ecological response and physical stability of habitat enhancements along an urban armored shoreline. Ecol. Eng. 2013, 57, 97–108. [Google Scholar] [CrossRef]
Figure 1. Study framework.
Land 12 00085 g001
Figure 2. Study area.
Land 12 00085 g002
Figure 3. Schematic diagram of the waterfront segment.
Land 12 00085 g003
Figure 4. Data source.
Land 12 00085 g004
Figure 5. The current and excepted value map of Beijing’s waterfront: (a) the current value map and (b) the expected value map.
Land 12 00085 g005
Figure 6. The average current and expected value of Beijing’s waterfront.
Land 12 00085 g006
Figure 7. Maps of the values of four urban layer subsystems of Beijing’s waterfront: (a) the ecological current value map, (b) the spatial current value map, (c) the demand current value map, (d) the historical current value map.
Land 12 00085 g007
Figure 8. Radar maps of A4-2 and A4-3.
Land 12 00085 g008
Figure 9. Shoreline forms to enhance biodiversity.
Land 12 00085 g009
Figure 10. Urban design strategies for external traffic in Beijing’s waterfront.
Land 12 00085 g010
Figure 11. The culverts and disappearing waterways in Beijing.
Land 12 00085 g011
Table 2. Selection principles [35,36].
Score StandardsSelection Situation
Qi ≥ 2.80The element has high recognition and significance.
1.50 ≤ Qi < 2.80, CV < 0.1900The element has a certain degree of recognition and significance.
Qi < 1.50Selected elements need to be considered.
Table 3. The framework of urban layer system.
Urban Layer Subsystem (k)Urban Layer (kj)Urban Element (kji)
1 Ecological subsystem11 Waterbody111 Water quality
112 Water quantity
113 Width of water surface
12 Landscape and greening121 Landscape quality
122 Greenspace ratio
123 Width of waterfront corridor
124 Plant community structure
125 Buffer
126 Openness of water-oriented interface
13 Shoreline131 Shoreline form
132 Shoreline gradient
133 Shoreline material
14 Biological141 Biodiversity
142 Habitat
2 Spatial subsystem21 Neighborhood211 Function mix
212 Building facade
213 Land value
22 Traffic221 External traffic
222 Internal traffic
223 Water transportation
3 Demand subsystem31 Usage demand311 Interruption of waterfront
312 Activity carrying capacity
313 Activity richness
314 Labor force
32 Emotional need321 Sense of security
322 Place spirit
4 Cultural system41 History411 Historical preservation
42 Culture421 Regional characteristics
422 Culture symbol
Table 4. Nine-level scaling method and scaling explanation.
ScaleScale Interpretation (Comparison of Pairwise Elements or Factors)
1Two elements are equally significant.
3The former element is slightly more significant than the latter element 1.
5The former element is clearly more significant than the latter element.
7The former element is strongly more significant than the latter element.
9The former element is extremely more significant than the latter element.
2, 4, 6, 8The middle value of the above adjacent scales represents the middle value of the adjacent scales’ significance.
ReciprocalFor the significance of element A and element B,
if E l e m e n t   A E l e m e n t   B = g A B , then E l e m e n t   B E l e m e n t   A = 1 g A B
1 Both elements in the layer are compared, and in the comparison Element A with Element B, then Element A is the former and B is the latter.
Table 5. The weights of the urban layer system.
Urban Layer Subsystem (k)Weight of the SubsystemUrban Layer (kj)Weight of the LayerUrban Element (kji)Weight of the Element
1 Ecological subsystem0.34611 Waterbody0.310111 Water quality0.397
112 Water quantity0.318
113 Width of water surface0.285
12 Landscape and greening0.368121 Landscape quality0.205
122 Greenspace ratio0.280
123 Width of waterfront corridor0.159
124 Plant community structure0.124
125 Buffer0.120
126 Openness of water-oriented interface0.112
13 Shoreline0.202131 Shoreline form0.333
132 Shoreline gradient0.136
133 Shoreline material0.531
14 Biological0.120141 Biodiversity0.580
142 Habitat0.420
2 Neighborhood spatial subsystem0.28821 Neighborhood space0.491211 Function mix0.380
212 Building facade0.255
213 Land value0.365
22 Traffic0.509221 External traffic0.412
222 Internal traffic0.427
223 Water transportation0.161
3 Demand subsystem0.24631 Usage demand0.547311 Interruption of waterfront0.306
312 Activity carrying capacity0.357
313 Activity richness0.176
314 Labor force0.161
32 Emotional need0.453321 Sense of security0.593
322 Place spirit0.407
4 Cultural system0.12041 History0.500411 Historical preservation1.000
42 Culture0.500421 Regional characteristics0.667
422 Culture symbol0.333
Table 6. Rating for elements of waterbody layer in ecological subsystem.
11 Waterbody
111 Water quality [28]Rating112 Water quantity [28]Rating113 Width of water surface [28]Rating
I8–10Abundant8–1010–15 m8–10
II6–8Suitable6–810–15 m6–8
III4–6Less4–65–10 m4–6
IV2–4Seasonally dry2–42–5 m2–4
V0–2Dry all year round0–2<2 m0–2
Table 7. Rating for elements of landscape and greening layer in ecological subsystem.
12 Landscape and Greening
121 Landscape quality (the current value was concluded from the questionnaire)Rating122 Green rate [6]Rating123 Width of waterfront corridor [6]Rating
Excellent8–10≥75%8–10≥1.5 channel width8–10
Good6–850–75%6–81–1.5 channel width6–8
General4–625–50%4–60.5–1 channel width4–6
Bad2–415–25%2–40.25–0.5 channel width2–4
Poor0–2<15%0–2<0.25 channel width0–2
124 Plant community structure [22]Rating125 Buffer [11,22]Rating126 Openness of water-oriented interface [22,23,38]Rating
Near-natural plant community structure8–10The adequate buffer zone of site8–10≥90%8–10
Good stratification of plant communities6–8Wider buffer zone6–870–90%6–8
Plant community has some stratification4–6Some buffers4–650–70%4–6
Plant community structure not evident2–4Few buffers2–430–50%2–4
No structure0–2No buffer0–2<30%0–2
Table 8. Rating for elements of shoreline layer in ecological subsystem.
13 Shoreline
131 Shoreline form [22]Rating132 Shoreline gradient [22]Rating133 Shoreline material (the water permeability and ecological properties of the material) [22,23]Rating
All-natural9–10Moderate8–10Excellent8–10
Excellent combination of natural shoreline and artificial shoreline7–9Gentle6–8Good6–8
Ordinary combination4–7Steep4–6General4–6
All artificial or poor combination0–4Extremely steep2–4Bad2–4
Vertical0–2Poor0–2
Table 9. Rating for elements of biology layer in ecological subsystem.
14 Biology
141 Biodiversity [23]Rating142 Habitat [11]Rating
Outstanding biodiversity both in water and on land8–10Ecological Protection Area8–10
Abundant biodiversity in water or on land6–8Provides sufficient habitat6–8
Medium biodiversity4–6Some limited habitat4–6
Poor biodiversity2–4Few habitats2–4
No creatures0–2No habitat0–2
Table 10. Rating for elements of spatial subsystem.
21 Neighborhood Space
211 Function mix [11,15,23] (types of land use of surrounding sites)Rating212 Building facades [6,23,40] (the style, height, color, and facade detail of waterfront buildings)Rating213 Land value [11,15] (housing prices of surrounding sites)Rating
≥48–10Unified architectural style, same color scheme, staggering skyline, and rich details8–10≥120,000 yuan/m28–10
3–46–82 architectural styles, 2–3 color schemes, reasonable height, and some details6–8100,000–120,0006–8
2–34–62–3 architectural styles, 3–4 color schemes, a large gap in building heights, and little details4–680,000–100,0004–6
1–20–4Clutter architectural styles, color, detail, and skyline0–460,000–80,0002–4
<60,0000–2
22 Traffic
221 External traffic [6,11,23,37,39] (the traffic types)222 Internal traffic [6,11,17,22,41] (the traffic types)223 Water transportation [6,11,41] (the traffic types)
Has vehicular=1; has bus=1; has metro=1; has shared bicycle=1; has parking=2; has cycle path=2; has pedestrian=2
(The score is the sum of the traffic types)
Has shared bicycle=2; has parking=2; has cycle path=2; has pedestrian=2; has barrier-free path=2
(The score is the sum of the traffic types)
Has planned cruise lines=3; has public cruise=2; has pier=2; has private cruise 2
(The score is the sum of the traffic types)
Table 11. Rating for elements of demand subsystem.
31 Usage Demand
311 Interruption of waterfront [6] (the number of gaps in the waterfront segment)Rating312 Activity carrying capacity [6,28,38] (the number of venues and equipment)Rating313 Activity richness [6,22,23,28,37,38] (type of activity)Rating
0, 18–10≥58–10≥88–10
2, 36–846–86–76–8
4, 54–634–65–64–6
5, 62–422–43–42–4
≥60–20–10–2≤20–2
314 Labor force [28] (jobs and commercial activities provided by waterfront)Rating
Sufficient 18–10
Adequate 26–8
Acceptable 34–6
Inadequate2–4
No job and economic activity0–2
32 Emotional need
321 Sense of security [6,23,28,39] (the current value was concluded from the questionnaire)Rating324 Place spirit 4 [17,23,28] (the current value was concluded from the questionnaire)Rating
Excellent8–10Excellent8–10
Good6–8Good6–8
Acceptable4–6Acceptable4–6
Deficient2–4Deficient2–4
Detrimental0–2Detrimental0–2
1 Sufficient labor force means there is enough jobs and commercial activities provided by waterfront. 2 Adequate labor force means there are proper jobs and commercial activities provided by waterfront. 3 Acceptable labor force means there is insufficient jobs and commercial activities provided by waterfront, but it can be accepted. 4 “Place spirit” refers to a set of spatial features that give that space a particular emotion or imageability.
Table 12. Rating for elements of cultural subsystem.
41 History
411 Historical preservation [13] (the current value was concluded from the questionnaire)Rating
Excellent8–10
Good6–8
Acceptable4–6
Deficient2–4
Detrimental0–2
42 Culture
421 Regional characteristics 1 [13] (the current value was concluded from the questionnaire)Rating422 Culture symbol [13] 2 (the current value was concluded from the questionnaire)Rating
Excellent8–10Excellent8–10
Good6–8Good6–8
Acceptable4–6Acceptable4–6
Deficient2–4Deficient2–4
Detrimental 0–2Detrimental 0–2
1 “Regional characteristics” refers to whether this waterfront segment reflects the characteristics of the area in which it is located, such as urban function, landmark, surrounding people, surrounding architectural features, etc. 2 “Culture symbol” refers whether this waterfront segment reflects the cultural of the area in which it is located, such as CBD culture, commercial culture, sports culture, various traditional cultures, etc.
Table 13. Weight of the citizen and expert questionnaire.
Expert 1Expert 2Expert 3Expert 4Expert 5Average Weight
Weight of citizen questionnaire52%37%38%35%40%40.4%
Weight of expert questionnaire48%63%62%65%60%59.6%
Disclaimer/Publisher’s Note: The statements, opinions and data contained in all publications are solely those of the individual author(s) and contributor(s) and not of MDPI and/or the editor(s). MDPI and/or the editor(s) disclaim responsibility for any injury to people or property resulting from any ideas, methods, instructions or products referred to in the content.

