Article

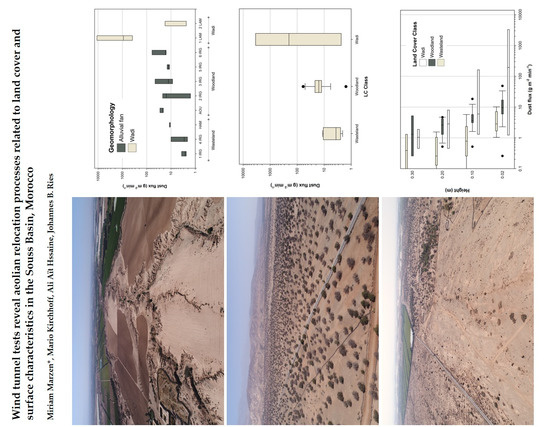
Wind Tunnel Tests Reveal Aeolian Relocation Processes Related to Land Cover and Surface Characteristics in the Souss Basin, Morocco

1
Department of Physical Geography, Trier University, DE-54286 Trier, Germany
2
Department of Geography, Université Ibn Zohr, Agadir MA-80060, Morocco
*
Author to whom correspondence should be addressed.
Land 2023, 12(1), 40; https://doi.org/10.3390/land12010040
Submission received: 22 November 2022 / Revised: 16 December 2022 / Accepted: 19 December 2022 / Published: 23 December 2022

Abstract

:
The Souss Basin is a dryland environment featuring soil, surface and climatic conditions enhancing processes of wind erosion and mineral and organic dust emissions while subject to frequent grazing, tillage and driving. The fine-grained compacted surfaces are covered by physical and biological crusts and stone cover and are sparsely vegetated by open argan woodland and patchily distributed bushes. Wind-tunnel experiments and soil sampling were conducted on the deeply incised alluvial fans originating from High Atlas and Anti-Atlas mountains to investigate the dryland ecosystem, including the open argan woodland, for information on local wind-induced relocation processes and associated dust emission potential. To investigate possible connections between dryland environmental traits and dust emissions, we used two approaches: (a) surface categories (stone cover, crust and cohesionless sand) and (b) Land Cover Classes (wasteland, woodland and wadi). The results indicate omnipresent dynamic aeolian surface processes on a local to regional scale. Wind impact is a powerful trigger for the on-site relocation of available mineral and organic dust and may be crucial to explain the heterogeneous spatial distribution of soil organic carbon and nutrients associated with mineral fines. Aeolian dust flux showed statistically significant relations with surface categories and, to some extent, with Land Cover Classes. While wind erosion processes are key to understanding on-site sediment and nutrient dynamics between fertile dryland islands, the results also indicate a considerable dust emission potential under increasing climate impact and anthropogenic pressure.

Graphical Abstract

1. Introduction

Aeolian dust includes mineral and organic particles and is a paramount factor in understanding local, regional and global substrate relocation dynamics and resulting on-site and off-site impacts. On a local to regional scale, wind erosion and dust dynamics are key drivers of substrate relocation, including nutrients, particularly in semi-arid and arid environments but are rarely addressed [1]. The transport dynamics are of particular importance in dryland environments and differ strongly from that of surface runoff in terms of temporal and spatial characteristics of entrainment and deposition. Variations of mineral and organic matter relocation and deposition may affect sediment characteristics on a small temporal and spatial scale but may also be a powerful influence on pedogenesis [2]. The degradation from grassland to shrubland increasingly limits the spatial distribution of soil nutrients to fertile islands in the vicinity of plants surrounded by depleted soil and bare surfaces [3,4]. Process studies and quantification of horizontal fluxes are the basis for understanding and explaining the distribution of soil nutrients, including dynamic matter and organic carbon (OC), but are generally scarce [5]. While dust sources and atmospheric dust loads on a regional to global scale are determined with increasing accuracy by means of satellite-derived data mapping and tracking of dust plumes [6], observations about local to regional aeolian dynamics in the low atmospheric layer and particularly at the earth surface level are rare. North Africa is assumed to be the main contributor to the atmospheric dust cycle emitting more than 50% of the total global dust emissions [7]. The output is estimated to equal 170 to 1600 Tg yr−1 [8], including 11 to 15 Tg yr−1 of particles ≤ 20 μm [9]. In the arid and semi-arid regions of Moroccan environments, aeolian processes are mostly investigated in the context of dust emissions from particularly active source regions into higher atmospheric levels induced by sand storms or dust devil activities (e.g., [10,11]). Although the processes of wind erosion and dust emission are ubiquitous phenomena in Morocco, investigations based on measurements and observation data are scarce.
In this study, we focus on a semi-arid environment in the Souss Basin. As one of the most fertile and productive regions in North Africa, the Souss Basin is under severe pressure from land use and climate change which are identified as the main triggers of degradation and desertification [12]. While desertification threatens the greatest part of Morocco [13,14], the National Action Plan [15] identifies the regions Southeast, Southwest and Oriental as being particularly endangered from the south winds Chergui and Scirocco, impacting the lower valley of Drâa, Tafilalet and Souss-Massa. The characteristic landscape includes the endemic open argan woodlands, areas of sparsely vegetated bushland, the dry riverbed of the Souss River and mostly episodic streams deeply incised into the alluvial fan material originating from torrential flood events, which is one of the most characteristic forms of dryland morphology. Ground measurements to investigate aeolian particle flux are crucial for the understanding of dryland environments [16] and reliable quantification of local to regional dust emissions [17]. Model results are supposed to improve greatly by incorporating surface properties [18] and geomorphological features [19]. On-site methods such as low- and high-volume samplers or particle counters, as well as passive collectors for measurement of dust load per volume air, require electricity and permanent maintenance, which is often not feasible due to lacking personnel and equipment as well as remoteness of test areas or safety issues. Field wind-tunnel tests are a valuable tool to close data gaps and gain information about local dust entrainment and flux, particularly in remote areas. They have been increasingly applied for various research aims such as dust emissions due to anthropogenic activity [20], investigation of fine dust development from desert regions [21], wind erosion related to specific crops [22] and the diffusion of salt particles from a dry lake site [23].
To investigate the research hypotheses (H1, H2), aeolian horizontal dust flux was quantified by means of wind tunnel tests on autochthonous substrate surfaces representative of the Souss Basin landscape and morphology. The results were interpreted concerning potential local and regional dust flux dynamics and statistically tested for correlations between dust flux and environment characteristics.
H1 Aeolian flux dynamics on the surface level are a relevant factor for local and regional redistribution processes of mineral and organic material;
H2 Measured aeolian flux is associated with specific (a) surface characteristics and (b) Land Cover Classes.

2. Materials and Methods

2.1. Location of Study Area

The study areas were located in the Souss-Massa Region (30–31° N and 7–9° W, Figure 1) surrounded by the High Atlas in the north with Paleozoic, Mesozoic and Cenozoic rocks, the Anti-Atlas in the south with Precambrian and Paleozoic rocks [24] and the Siroua massif in the east with volcanics and granites [25]. The Souss-Massa Basin covers an area of 27,000 km2 with a plain area (up to 700 m height) of 5700 km2 and 21,300 km2 mountain area [26]. It is characterized by coalescing alluvial fans with Pliocene-Quaternary fluvial, fluvio-lacustrine and aeolian sediments [27,28]. Alluvial fans build the transition section from mountain range to floodplain and constitute the basic morphological structure of the greatest part of the basin. The basin is the catchment of the traversing River Souss, which is the regional base level for the wadis developing in the fan material from the surrounding mountains. The region’s climatic conditions are semi-arid to arid, with 24 °C mean annual temperature showing a trend to temperature rise and a constant negative water balance [29]. The annual precipitation of 200 mm is highly variable, often characterized by torrential rains, and shows a marked decreasing trend over the period 1976–2006 (−3 to −30%), including an ongoing increase in evaporation [30]. The tests were conducted in Taroudannt province and Aït Baha province in winter 2019/2020 during a prolonged period of drought with minor precipitation in the months before and no precipitation during tests [31].
Since the Souss Basin is one of the most productive agricultural regions of Morocco, there is a very high land-use pressure from fruit-tree plantations, irrigated greenhouses and uncontrolled livestock grazing. Overgrazing is one of the top reasons for global desertification, and 90% of Morocco’s land area is under grazing impact from local and nomadic herds [32], as well as a severe issue in the Souss Basin [33]. Combined with increasing water scarcity, the geomorphological consequences range from sinking groundwater tables to intensified gully and badland development and severely affect the vulnerable environment [34,35].

2.2. Tested Sites

The Taroudannt sites are situated on an alluvial fan formed by the Wadi Irguitène, which originates from the High Atlas in the north, the Site in Aït Baha is located on an alluvial fan originating from the Anti-Atlas Mountains in the south. The substrates are compacted and crusted fluvial sediments, substrate types that are associated with the most active dust sources globally [10]. The soils are Fluvisols and weakly developed Regosols with loamy texture and 48% sand, 35% silt and 17% clay [36]. Ten test sites were chosen in three environments/ Land Cover Classes (LCC) representative for the Souss Basin: open woodland including one established site and one reforestation site (Figure 2a,b), wasteland (Figure 2c) and wadi (Figure 2d).
The Souss-Massa region is the remaining habitat of the endemic keystone species argan tree (Argania spinosa) that grows in a characteristic open woodland on an area of ca. 950,000 ha [37]. Adapted to the extreme conditions of the semi-arid to arid environment along the Sahara peripheries, it is considered a buffer against desertification but severely threatened by degradation [38]. The traditional agrosilvopastoral land use includes harvesting of argan fruit, speculative rainfed agriculture and pasture for browsing goat and camel herds. Tillage is applied in autumn for preparation of seedbed, but lacking rain may prevent the seeds from germination. As a measure against argan woodland degradation, great areas are covered with reforestation sites, but young plants seem to suffer severely under uncontrolled browsing and drought. The surfaces included structural crusts, stone and litter cover and destroyed crust from fresh tillage (Table 1). Wasteland occurred ubiquitously and was related to not or very sparsely vegetated bushland without obvious use or management (Figure 2c). The respective specific site’s origin was not implied by its current appearance and may comprise climate, substrate or abandonment and degradation of formerly forested land or incision by fluvial processes. The third LCC was Wadi bed (Figure 2d) with different surface characteristics. One surface type was cohesionless sand which was patchily accumulated in specific locations on the dry river bed. The second type was stone cover on a loamy crust.

2.3. Experimental Procedure

The Trier Portable Wind Simulator’s test section measures 4 m in length, 0.7 m in width and 0.7 m in height. The test section for wind erosion tests is 2.2 m2 open ground to test an undisturbed soil surface on-site (Figure 3a). The air stream is generated by a rotor-type fan led through a 4 m-long transition section and through a honeycomb in order to generate a quasi-laminar airflow. The produced air stream is reliably stable concerning temporal and spatial variability of wind velocities and shows a logarithmic wind-velocity profile up to 0.15 m height [39,40]. Applied wind velocity was 7.5 m s−1 at 0.3 m height.
The test duration was 10 min. Airborne material was collected by means of Modified Wilson and Cook samplers (MWAC, [41]) mounted at 4.0 m in flow direction (the end of tunnel and test section) at 0.02, 0.10, 0.20 and 0.30 m height on a beam (Figure 3b). Collector efficiency was found to be good, particularly for fine-size classes [42,43]. Additionally, two wedge traps [39] were applied for collection of a greater quantity of eroded material with openings 0.02 m ∗ 0.3 m positioned 3.70 m distance in flow direction from test section start. The collected material thus ranges in size from fine dust to coarse particles. We used the term “dust” as a generalized term related to transport by air rather than referring to specific size classes. The experimental device is applied to study effects of a steady wind stream on undisturbed soil surfaces in remote regions where measurement data are lacking. The measured values represent the easily erodible material mainly entrained by fluid impact, since the test section length is not sufficient for onset of effects such as abrasion and avalanche [44]. The experimental setup’s physical limitations concerning reliability, validity and upscaling of experimental setup, as well as adequate application of experimentally derived results, are addressed in Iserloh et al. (2013) [45] and Marzen et al. (2017) [46].

2.4. Surface Parameters

The plot surface was estimated concerning stone and crust cover, available fine material, litter and vegetation by visual observation. Inclination and exposition were measured using an inclinometer and compass. Surface roughness was approached after Saleh (1993) [47]: Cr = (1-L2/L1) ∗ 100 with L1 = Length of chain and L2 = Length of plot. Shear strength was measured by means of a pocket vane test device (Eijkelkamp Product Code 14.10) and given as the mean of 10 tests per surface type in kg cm−2.

2.5. Laboratory Analysis

Samples for soil analysis were collected at 0–0.05 m depth, air dried and sieved for fine fraction (<2 mm). Gravimetric soil water content (%) and particle size distribution (PSD, [48]) were measured. Percolation stability was assessed by means of a Mariotte bottle [49,50,51] and corrected for total sand [52]. Eroded and collected material was stored >24 h in a thermo-constant room and weighed by means of precision scales to 0.0001 g. Organic carbon (OC) was derived by means of Euro CHNS Elemental Analyzer 3000 by HEKAtech in concentration (%) of tested sample.

2.6. Horizontal Dust Flux

The eroded material (g) was calculated by subtracting the weight of the collector before from the weight after the experiment. The dust flux q (g m−2 min−1) was calculated by dividing the mass values (g) by collector opening (0.000028 m2) and duration of experiment (10 min). For comparison of q, values from heights 0.02, 0.10 and 0.20 m were added since not all cases included values from height 0.30 m.
For cases with four available measurement values (heights 0.02, 0.10, 0.20 and 0.30 m), an integration was conducted to estimate the total horizontal mass flux over the whole height profile (g m−1 min−1). A non-linear regression was calculated and fitted to the data for all heights. We chose an exponential decay function (Equation (1)) as proposed by Ellis et al. (2009) [53] and Poortinga et al. (2014) [54].
qz = q0 e−βz
where q0 represents the horizontal mass flux at surface level, z is the elevation, β is the decay coefficient and qz represents the horizontal mass flux at elevation z. The integration of Equation (1) between heights z = 0 m and z = 1 m gives the total mass transport over this height in g m−1 min−1. Since this operation is not valid for only three values, we chose to conduct the statistical analyses by means of the smaller yet reliable measurement values instead of the integrated values.
From OC values (% of sample weight), enrichment ratios were calculated by dividing the concentration of OC in eroded sediment by the concentration of OC in the parent material. Horizontal OC flux (g m−2 min−1) was calculated per sample.

2.7. Statistical Analysis

The nonparametric analysis of variance after Kruskal–Wallis was applied to test both defined categories for differences between mean horizontal fluxes, including a general differentiation (significance level 0.05) and subsequent 2-sided test of asymptotic significances (significance level 0.05) for each pair. Correlation analysis was performed for nonparametric dataset by means of Pearson’s Rho. Analyses were performed with SPSS 27 [55] and boxplots derived using SigmaPlot 11 [56].

3. Results

3.1. Soil and Surface Parameters

Soil and surface parameters are given in Table 1. Each ID marks one test. The soil type was classified as weakly developed Regosol for all sites, reflecting the uniform genesis of the alluvial fan morphology. Pictures of a selection of test plot surfaces are given in Figure 4. While most surfaces are found in a specific range of characteristics, such as percentage crust, stone cover and vegetation, some surfaces have very special characteristics, such as available cohesionless sand grain in the wadi and a dense litter cover underneath the argan tree. The tested sites included various surface characteristics and LCC representativefor the dryland environment in the Souss Basin.

3.1.1. Particle Size Distribution

The particle size distribution (PSD) shows the relative homogeneity of the alluvial fan material in the Souss Basin with median particle diameter (D50) in the narrow range of 0.052–0.084 mm for most substrates. Exceptions are the substrates found in the wadi bed with D50 of 0.54 and 0.45. Following the categorization according to LCC, substrates from woodland show a comparably broad range with their main share in the fine sand to medium silt range and with median particle diameter D50 of 0.057 mm (coarse silt); wastelands had the highest mean percentage of fine sand and a resulting mean D50 (0.07 mm). Wadi is the most variable group concerning surface conditions (sand/rock/crust) but shows a very narrow as well as similar PSD with a D50 of 0.49 mm (medium sand).

3.1.2. Organic Carbon (OC)

Organic carbon (OC) values were derived per site. The lowest and highest percentages of OC in parent material are 0.09% in sandy wadi substrate and 3.6% underneath the argan tree. All other values are found in a narrow range from 0.49 to 0.78%. OC values from eroded material were a maximum of 4.52% from open argan forest and a minimum of 0.15% from the sandy wadi surface, with a mean of ca. 3% for the other sites. Enrichment rates ranged from 0.86 for the litter-covered under-tree area and 1.72 for sandy wadi to ca. 5 for most other sites up to 9.29 from the crusted surface in the open woodland area.

3.2. Categories (a) Surface and (b) Land Cover Class

(a) Surface
The categorizationssoil crust, stone cover and cohesionless sand are based on the specific surface characteristics (Table 2).
The sand class was related exclusively to a wadi with cohesionless, predominantly medium and coarse sand (<2 mm) and low shear strength (0.1 kg cm−2.). The sand was transported during the latest flash flood event from undefined locations in the catchment area and accumulated where velocity and turbulence ceased to keep the material suspended. Soil crust included diverse surface characteristics, including a strong physical and/or biological crust of 5.0–10.0 mm (mean 48%), partly embedded but mostly loose stones originating from residual accumulation (mean 26%) and intense compaction (mean shear strength 1.38 kg cm−2). The stone cover class (origin either residual accumulation, accumulation by overland flow or anthropogenic) with stones loose or embedded (mean 76%) also included loose grains (mean 1 %) or crust (mean 8%) and measured the highest shear strength (mean 1.48 kg cm−2).
(b) Land Cover Classes
The LCC wasteland, open woodland and wadi are based on landscape features (Figure 2). Considering the investigated surface characteristics, there is a broad heterogeneity for most classes, including a variety of associated surface traits (Table 3).
Wasteland has the highest percentage of stone cover (72.78%) and the highest shear strength (2.03 kg cm−2). Woodland shows the highest percentage of crust (50.93%), litter cover (11.73%), the highest OC content (1.16%) and the highest roughness (9.32). Wadi is a highly variable class with three tests on 100% sand cover and three tests on crusted/stone cover surfaces (Table 1). The mean values for loose grain are 54.17%; it has the lowest OC value (0.09%), lowest shear strength (0.15 kg cm−2) and the highest D50 (0.49 mm).

3.3. Horizontal Dust Flux

A total of 30 tests were conducted on 30 test plots. Horizontal dust flux was measured on all tested surfaces (Table 1). The measured flux ranged over three orders of magnitude mainly due to the impact of great q values from cohesionless sand wadi surface (Table 1). Related to geomorphology, the mean q on the alluvial fan (24 tests) was 15.10 g m−2 min−1 and 2066.94 g m−2 min−1 in the wadi bed (6 tests). The single results are highly diverse, with a standard deviation of 13.65 for the alluvial fan and 2066.94 for the wadi. The lowest measured q was 1.56 g m−2 min−1.measured on soil crust/woodland, and the highest value was 11,080.72 g m−2 min−1 from wadi/cohesionless sand (Figure 5).
Related to (a) surface and (b) LCC are different mean values for a variable number of tests (Table 4).
Of the three surface types, cohesionless sand and stone cover produced the highest and lowest mean q with 4126.52 and 4.33 g m−2 min−1, respectively. Soil crust produced 19.20 g m−2 min−1 with the comparably lowest standard deviation (13.66). Organic carbon flux was 0.15 g m−2 min−1 from stone cover, 0.62 g m−2 min−1 and 6.09 g m−2 min−1 from cohesionless sand. Of the three LCCs, wadi and wasteland produced the highest and lowest mean q with 2066.94 g m−2 min−1 and 6.27 with the highest standard deviation for wadi (4430.16). Woodland produced 20.40 g m−2 min−1 with the lowest standard deviation (14.69). OC flux was 3.06 g m−2 min−1 for wadi, 0.69 g m−2 min−1 for woodland and 0.16 g m−2 min−1 for wasteland sites.

3.4. Horizontal Mass Flux by Integration

Measurements show a vertical transport pattern with reduced flux with increasing height (Figure 6), which is in line with findings from studies carried out with vertically mounted catcher systems (e.g., [57,58]). For the mean values of each surface type or landscape unit, exponential decay functions were applied (Figure 7). Power functions fitted best for most cases but overestimated surface creep, especially for the wadi/cohesionless sand surface type. Total transport between 0 and 1 m height was obtained by integration of the curves’ equations. The LCC type wadi showed the highest value with 74.95 g m−1 min−1, while the values for woodland and wasteland were much lower with 1.84 and 0.59 g m−1 min−1, respectively. The surface type cohesionless sand showed an even higher value of 160.09 g m−1 min−1. The soil crust showed 1.70 g m−1 min−1 and stone cover had the lowest value of 0.37 g m−1 min−1.

3.5. Nonparametric ANOVA

By testing both categories’ surfaces (Table 5) and LCC (Table 6) for significant differences concerning the explained dust flux values, the nonparametric analysis of variance (K-W) finds highly significant differences between groups for LCC (0.011). The post-hoc test confirms partly significant results by adjusted significance between wasteland and wadi (0.047), wasteland and woodland (0.017), but not between woodland and wadi (1.000).
The nonparametric analysis of variance (K-W) finds highly significant differences between groups for surface characteristics (0.000). The group stone cover differed clearly from soil crust (0.015) and cohesionless sand (0.001). Soil crust differed from cohesionless sand by simple significance (0.039) but not by adjusted significance (0.118).

3.6. Correlation Analysis for Horizontal Mass Flux and Surface/Substrate Parameters

The Spearman rank analysis was performed to correlate horizontal dust flux q with the substrate and surface characteristics of all test plots (Table 7). The rank analysis found dust flux positively correlating with the available loose grain (0.395) and fine soil content (0.579) and negatively with stone cover (−0.665) and litter cover (−0.368).
The OC content (%) was positively correlated with silt (0.565) and clay (0.557) and negatively correlated with D50 (−0.747) and sand (−0.756), while enrichment was positively correlated with crust (0.632), fine soil content (0.479) and silt (0.398).

4. Discussion

4.1. Research Hypotheses

Hypothesis 1 (H1). 
Aeolian flux dynamics on the surface level are a relevant factor for local and regional redistribution processes of mineral and organic material.
Aeolian transport and deposition are measured on all tested sites and be a paramount factor for mineral and organic material dynamics on site and also on a regional scale. A mean of 15.10 g m−2 min−1 was measured on the alluvial fans, including woodland and wasteland surfaces and 2066.94 g m−2 min−1 on wadi bed surfaces under a wind velocity that is not exceptional for the region. Measured fluxes are probably, to a great percentage, constantly redistributed material, detached and accumulated by the prevailing SW- and, to a lesser extent, NE-winds in the Basin. Another factor is the redistribution of dust material originating from the Sahara with the periodically passing dust plumes. Dry or wet deposition of this material in the basin could both be enhanced by trapping effects of the surrounding mountain ranges and would introduce autochthonous material, potentially enriching the Basin substrates. However, the input of autochthonous material has not been quantified yet. Local to regional redistribution affects mineral components as well as organic material of various sizes according to the respective transport process. The wind, thus, is not only a factor of redistribution but also fragmentation of larger particles. It leads to a scouring effect that disintegrates organic material such as dry leaves, which may be considered a crucial preparation for further processing by soil organisms. This assumption may be supported by relatively large percentages of organic carbon on total eroded material and also the enrichment factors, which show that a large quantity of organic material is subject to very dynamic transport processes. The lowest enrichment factor, 1.72, was measured on the sandy Wadi substrate (parent substrate 0.09%), and the highest factor, 9.29, was measured from a crusted woodland site (parent substrate 0.49%). In an Australian semi-arid to arid environment, Webb et al. 2013 [5] found, during a longer-term sampling study, even higher enrichment factors of 7.75–30.67% on a sandy, vegetated dune crest (parent substrate 0.12% OC) and 5.94–31.18% in woodland (parent substrate OC 0.93%). They could also show seasonal variations. The organic soil material is generally of a lighter and more easily erodible texture as well as associated with the fine fractions, which explains increasing percentages of OC with measurement height from 0.09 to 2.00 m [5]. A general low OC on all sites except underneath the trees shows an ongoing severe depletion of soils by erosion [59] and is in line with findings from other semi-arid and arid environments [53,54]. Entrained coarser particles in creep and saltation mode may lead to the scouring of the soil surface. The entrained material may not even leave the site if one considers the often-changing SE/NW winds. During the process of constant transport and reduction of particle size, the material may be at some point integrated into local to regional pedogenic processes or available to processes of long-range transport. Knowledge about the residence time of OC in the landscape is the basis for understanding the Souss basin dryland environment as a carbon sink or source. The specific spatial characteristics of drylands ecosystems have been discussed to enhance considerable abiotic transport through connected pathways due to a high proportion of bare soil and patchily distributed vegetation [1]. This concept is confirmed for a variety of typical landscapes associated with the Souss Basin region by our measurements. The main characteristics of the tested environment are associated with the dryland vegetation zone of the Souss Basin region in the transition section from the Mediterranean to the Sahara desert zone [60]. The “fertile islands” concept originally investigates enrichment of specific soil nutrients in the vicinity of shrubs and associated depletion of inter-shrub area in contrast to a uniform distribution in grassland [3]. In the Souss Basin, we found the open argan woodland exhibits a similar spatial heterogeneity with areas of higher fertility in contrast to a less nutrient-rich surrounding inter-tree area. The argan tree area was found enriched with OC with highest OC values measured directly underneath the tree crown (3.6%), while values from all other spots related to the open argan forest range were much lower (mean 0.6%). The impact of the tree may be direct by shed leaves, fruit and fruit skin, as well as the attraction of grazing livestock or wild animals that gather among or in the trees with subsequent feces and hair accumulating in the close vicinity of the trees. Particularly, the impact of grazing livestock is assumed to be crucial in the development of heterogeneous distribution of nutrients [61]. The accumulation of soil organisms may be assumed in the direct vicinity of the tree stem and root system as well as underneath the crown caused by a slightly more advantageous microclimate (e.g., temperature and soil moisture). The higher rate of actual humification and mineralization of available organic material explains the relatively high OC underneath the trees as well as the burring activity which caused a greater mixing of organic material in the soil [62]. Kirchhoff et al. (2021) [63] also found enrichment of OC underneath argan trees with a steep gradient radially outwards with the highest values of OC in the plant lee from the main wind direction (SE), which supports the study results.
With the wind as a major redistributor of available material, the key role of the argan tree may be further supported as the essential source of organic matter not only for the direct vicinity and the local scale but also for the regional scale. The depletion of inter-shrub soil area and the resulting spatial heterogeneity of soil properties is stated as a key threshold in the desertification process [3]. The argan forest south of the Souss River is considered in a state of severe degradation with grasses with short generation periods and short appearance during advantageous periods [64].
Hypothesis 2 (H2). 
Measured aeolian flux is associated with specific (a) surface characteristics and (b) Land Cover Classes.
(a)
Surface characteristics
Aeolian dust flux showed statistically significant relations to surface categories. The surface type least prone to wind erosion was the stone cover; cohesionless sand produced the highest and most strongly crusted surfaces produced medium emission fluxes. While the lower values from stone cover and high values from cohesionless sand are in line with findings from other studies, crusts are generally assumed to be relatively stable, particularly against minor abrasion (e.g., [65,66,67]). After the destruction of the intact crust, high emissions were reported for car driving [68], military personnel trampling [69] and animal trampling [70]. Since slight disturbances occur either by burying insects (ants, termites), (animal) trampling, driving or dry cracks, it may be assumed for a large percentage of crusted surfaces in semi-arid and arid regions. The concept of “intact crusts” reported in the literature may also be restricted to a very small scale related to the observed test area. Once tilled, the completely destroyed crust releases highest emissions compared to other test conditions, which is in line with findings from several other experimental studies (e.g., [70,71]). Agricultural activities and grazing result in the advancing disintegration of soil aggregates, subsequently leading to a higher amount of wind erodible material and high emissions of fine dust [20]. The highest OC enrichment factors were associated with soil crust and higher silt content of topsoil, which is in contrast to results showing the highest enrichment from sandy parent soil [5]. A second factor is a possible detention function for dry or wet deposited dust from regional to trans-regional transport, as well as material entrained and accumulated during prior interrill erosion. Both factors would provide readily available material for the subsequent wind event. However, the budgeting of the dust emission dynamics on site is not possible without data concerning the actual input of long-range transported Sahara dust by dry or wet deposition.
(b)
Land Cover Classes (LCC)
Aeolian dust flux showed, to some extent, statistically significant relations to Land Cover Classes. The LCC woodland and wasteland were found to differ significantly, thus offering an opportunity to approach dust emission potential from the site by considering a rather broad LCC. The class woodland has a broader range of dust flux which prevents this LCC from being statistically distinguishable. The woodland class comprised a great variety of surfaces, including crusts and litter cover, as well as all surfaces related to agricultural activity (old and freshly tilled sites). The wadi class also involves a great variety of surface characteristics and shows different dust fluxes from sandy and stone-covered plots. The wasteland site shows the smallest variability in surface characteristics and is mostly covered by stone. Compared to the surface approach, the LCC approach was much less applicable for the estimation of aeolian flux dynamics but gave insights into the spatial distribution of OC. The highest percentage of OC is included in the woodland substrate (mean 1.16%), redistributing the organic material from the closest vicinity of the trees (4.52%) to areas further away. The wasteland sites show less OC (0.69%) as well as organic output, while the sandy material accumulated on the wadi bed (OC 0.06%) yielded the greatest amount of wind-eroded sediment by far. Compared to Sterk et al. (2012) [72], who measured mean values ranging from 7.9 to 835.9 kg m−1 for similar substrate and highly dependent on the duration of the measured storm event, our wadi test results (calculated for the same units and durations) ranging from 41.1 to 198.7 kg m−1 seem plausible. The strong connection between wind and water erosion, especially in arid and semi-arid regions, has been acknowledged as “aeolian-fluvial transport corridors” [73] and is also indicated by the results presented herein.

4.2. Possible Development of Dust Emission Potential in the Souss Basin

Remote sensing studies suggest a steady degradation of the argan forest during the past decades [74] with increasing fragmentation of important stabilizing shrubs [75]. Most authors associate desertification with high population and livestock pressure (e.g., [76,77]) accompanied by intensifying water scarcity due to declining aquifer recharge [78] and a rising risk of water shortages [79]. The overexploitation of water resources is aggravated by climate change [80]. Under the ongoing degradation of tree area, the bare and susceptible surface in between the individuals increases [81]. It may also trigger wind erosion and dust emissions due to increased connectivity [82], with effects ranging from reduced soil fertility (e.g., [83,84]) and abrasion and deflation damage of young crops to infrastructure damage such as the regional decreased efficiency of solar modules by settled airborne dust [85]. Direct health risks associated with dust production are contamination of drinking water and respiratory diseases (e.g., [86,87,88]) and may include bacteria whose species and abundance relate to land use [89]. Adapted land management is a powerful tool against degradation, desertification and the mitigation of climate change effects [30].
Apart from the local impact, the combined impact of the decreased forested area together with potentially highly erodible substrates may lead to a marked impact on dust emissions regarding potential long-range transport and connection to the global dust cycle. Wadis are specifically highlighted as dust sources [90] and yielded the greatest amount of erodible material during wind tunnel tests in this study, but the large mean grain sizes (medium sand) suggest a limited transport on the local to regional scale. On the basis that abrasion processes in the saltation layer are well known for generating fine dust available for long-range aeolian transport [91,92], the vast amount of entrained material may lead to a great release of fine dust into the atmosphere. Experimental studies highlight particulate matter (10 µm) to originate from bombardment and inter-particle contact during saltation [21], while other authors find the origin of clay and silt particles mostly related to mineral coatings of the carrying sand grain [92,93]. Compared to non-sandy soils with high percentages of fine-sized clay and silt, active sands are a minor contributor to global dust [18] but may act as a potent scour agent over longer temporal scales, releasing the fine material from the alluvial fans.

5. Conclusions

  • Entrainment of aeolian dust, including mineral and organic material, is a paramount factor in understanding local, regional and global matter dynamics in the Souss Basin. Under moderate-wind conditions, considerable amounts of mobilized dust were measured for various surfaces related to the characteristic dryland environment and land management.
  • Effects of wind erosion partly explain the heterogeneity of OC distribution in the argan woodland environment.
  • If thorough field studies and characterization of surface parameters are not possible, a less complex classification oriented on landscape features, as applied in this study, has shown to provide valuable and reliable data to some extent.
  • The revision of the concept of “intact crusts” in all semi-arid and arid regions with probable animal or anthropogenic activity could increase the understanding and modeling quality of dust emission potential. The status “intact” for an entire area may be based on very small-scale plot observations, whereas on a larger scale, the crust may be found to be disturbed.
  • For a thorough understanding and budgeting of the dust emission dynamics from the Souss Basin, the actual input of long-range transported Sahara dust by dry or wet deposition is needed.

Author Contributions

Conceptualization, M.M; methodology, M.M.; software: M.M. and M.K.; validation, M.M., formal analysis, M.M. and M.K.; investigation, M.M. and M.K.; resources, A.A.H. and J.B.R..; data curation, M.M.; writing—original draft preparation, M.M.; writing—review and editing, M.M. and M.K.; visualization, M.M.; supervision, M.M. and J.B.R.; project administration, M.K. and M.M.; funding acquisition, J.B.R. All authors have read and agreed to the published version of the manuscript.

Funding

This research was funded by Deutsche Forschungsgemeinschaft (DFG) (RI 835/24-1 and MA 2549/6-1).

Data Availability Statement

The data are available from Miriam Marzen.

Acknowledgments

We would like to thank the Dpt. of Hydrology, Trier University, for support with analyses. We would like to thank L. Engelmann, A. Janik and A. Hanna for their help during fieldwork.

Conflicts of Interest

The authors declare no conflict of interest.

References

  1. Okin, G.S.; las Heras, M.M.; Saco, P.M.; Throop, H.L.; Vivoni, E.R.; Parsons, A.J.; Wainwright, J.; Peters, D.P. Connectivity in Dryland Landscapes: Shifting Concepts of Spatial Interactions. Front. Ecol. Environ. 2015, 13, 20–27. [Google Scholar] [CrossRef] [PubMed] [Green Version]
  2. De Soyza, A.G.; Whitford, W.G.; Martinez-Meza, E.; van Zee, J.W. Variation in Creosotebush (Larrea tridentata) Canopy Morphology in Relation to Habitat, Soil Fertility and Associated Annual Plant Communities. Am. Midl. Nat. 1997, 137, 13–26. [Google Scholar] [CrossRef]
  3. Schlesinger, W.H.; Reynolds, J.F.; Cunningham, G.L.; Huenneke, L.F.; Jarrell, W.M.; Virginia, R.A.; Whitford, W.G. Biological Feedbacks in Global Desertification. Science 1990, 247, 1043–1048. [Google Scholar] [CrossRef] [Green Version]
  4. Bolling, J.D.; Walker, L.R. Fertile Island Development Around Perennial Shrubs Across a Mojave Desert Chronosequence. West. N. Am. Nat. 2002, 62, 88–100. [Google Scholar]
  5. Webb, N.P.; Strong, C.L.; Chappell, A.; Marx, S.K.; McTainsh, G.H. Soil Organic Carbon Enrichment of Dust Emissions: Magnitude, Mechanisms and Its Implications for the Carbon Cycle. Earth Surf. Process. Landf. 2013, 38, 1662–1671. [Google Scholar] [CrossRef]
  6. Schepanski, K. Transport of Mineral Dust and Its Impact on Climate. Geosciences 2018, 8, 151. [Google Scholar] [CrossRef] [Green Version]
  7. Ginoux, P.; Prospero, J.M.; Gill, T.E.; Hsu, N.C.; Zhao, M. Global-Scale Attribution of Anthropogenic and Natural Dust Sources and Their Emission Rates Based on MODIS Deep Blue Aerosol Products. Rev. Geophys. 2012, 50, RG3005. [Google Scholar] [CrossRef]
  8. Engelstaedter, S.; Tegen, I.; Washington, R. North African Dust Emissions and Transport. Earth-Sci. Rev. 2006, 79, 73–100. [Google Scholar] [CrossRef]
  9. Kok, J.F.; Adebiyi, A.A.; Albani, S.; Balkanski, Y.; Checa-Garcia, R.; Chin, M.; Colarco, P.R.; Hamilton, D.S.; Huang, Y.; Ito, A.; et al. Contribution of the World’s Main Dust Source Regions to the Global Cycle of Desert Dust. Atmos. Chem. Phys. 2021, 21, 8169–8193. [Google Scholar] [CrossRef]
  10. Prospero, J.M.; Ginoux, P.; Torres, O.; Nicholson, S.E.; Gill, T.E. Environmental Characterization of Global Sources of Atmospheric Soil Dust Identified with the Nimbus 7 Total Ozone Mapping Spectrometer (Toms) Absorbing Aerosol Product. Rev. Geophys. 2002, 40, 2-1–2-31. [Google Scholar] [CrossRef]
  11. Bakker, N.L.; Drake, N.A.; Bristow, C.S. Evaluating the Relative Importance of Northern African Mineral Dust Sources Using Remote Sensing. Atmos. Chem. Phys. 2019, 19, 10525–10535. [Google Scholar] [CrossRef]
  12. Intergovernmental Panel on Climate Change. IPCC-SRCCL Special Report on Climate Change and Land; Intergovernmental Panel on Climate Change: Geneva, Switzerland, 2019. [Google Scholar]
  13. Ghanam, M. La desertification au Maroc—Quelle stratégie de lutte? In Proceedings of the 2nd FIG Regional Conference, Marrakech, Morocco, 2–5 December 2003; p. 13. [Google Scholar]
  14. Bouabid, R.; Rouchdi, M.; Badraoui, M.; Diab, A.; Louafi, S. Assessment of Land Desertification Based on the MEDALUS Approach and Elaboration of an Action Plan: The Case Study of the Souss River Basin, Morocco. In Land Degradation and Desertification: Assessment, Mitigation and Remediation; Zdruli, P., Pagliai, M., Kapur, S., Faz Cano, A., Eds.; Springer: Dordrecht, The Netherlands, 2010; pp. 131–145. ISBN 978-90-481-8657-0. [Google Scholar]
  15. AGR/DAF. The National Action Plan for Combating Desertification Report; AGR/DAF: Rabat, Morocco, 2002. [Google Scholar]
  16. Breshears, D.D.; Whicker, J.J.; Johansen, M.P.; Pinder, J.E. Wind and Water Erosion and Transport in Semi-Arid Shrubland, Grassland and Forest Ecosystems: Quantifying Dominance of Horizontal Wind-Driven Transport. Earth Surf. Process. Landf. 2003, 28, 1189–1209. [Google Scholar] [CrossRef]
  17. Klose, M.; Gill, T.E.; Etyemezian, V.; Nikolich, G.; Ghodsi Zadeh, Z.; Webb, N.P.; van Pelt, R.S. Dust Emission from Crusted Surfaces: Insights from Field Measurements and Modelling. Aeolian Res. 2019, 40, 1–14. [Google Scholar] [CrossRef]
  18. Swet, N.; Kok, J.F.; Huang, Y.; Yizhaq, H.; Katra, I. Low Dust Generation Potential from Active Sand Grains by Wind Abrasion. J. Geophys. Res. Earth Surf. 2020, 125, e2020JF005545. [Google Scholar] [CrossRef]
  19. Parajuli, S.P.; Zender, C.S. Connecting Geomorphology to Dust Emission through High-Resolution Mapping of Global Land Cover and Sediment Supply. Aeolian Res. 2017, 27, 47–65. [Google Scholar] [CrossRef]
  20. Katra, I. Soil Erosion by Wind and Dust Emission in Semi-Arid Soils Due to Agricultural Activities. Agronomy 2020, 10, 89. [Google Scholar] [CrossRef] [Green Version]
  21. Zhang, W.; Tan, L.; Liang, L.; Chen, S.; Zhang, G.; Zhan, H.; Qiu, F.; Ma, S. Dynamic Processes of Dust Emission from Gobi: A Portable Wind Tunnel Study atop the Mogao Grottoes, Dunhuang, China. Aeolian Res. 2022, 55, 100784. [Google Scholar] [CrossRef]
  22. Funk, R.; Engel, W. Investigations with a Field Wind Tunnel to Estimate the Wind Erosion Risk of Row Crops. Soil Tillage Res. 2015, 145, 224–232. [Google Scholar] [CrossRef]
  23. Abdolahzadeh, M.; Fakheri-Fard, A.; Shao, Y.; Dinpashoh, Y.; Jafari, M. Investigation of Salt Diffusion from Lake Urmia Using Wind Tunnel. Arab. J. Geosci. 2022, 15, 1722. [Google Scholar] [CrossRef]
  24. Dijon, R. Etude Hydrogéologique et Inventaire Des Ressources En Eau de La Vallée Du Souss; Editions du Service Géologique du Maroc: Rabat, Morocco, 1969. [Google Scholar]
  25. EL Aouad, N.; Admou, H.; Wafik, A.; Ahmid, H.; Kharis, A.; Atif, Y.; Daafi, Y.; Chaib, L. Geology, Geochemistry, and Geodynamic Implications of Ediacaran Magmatic Rocks of the Zgounder Inlier, Siroua Window, Anti-Atlas, Morocco. Arab. J. Geosci. 2021, 14, 314. [Google Scholar] [CrossRef]
  26. Hssaisoune, M.; Boutaleb, S.; Benssaou, M.; Bouaakkaz, B.; Bouchaou, L. Physical Geography, Geology, and Water Resource Availability of the Souss-Massa River Basin. In The Souss-Massa River Basin, Morocco; Choukr-Allah, R., Ragab, R., Bouchaou, L., Barceló, D., Eds.; The Handbook of Environmental Chemistry; Springer International Publishing: Cham, Switzerland, 2017; pp. 27–56. ISBN 978-3-319-51131-3. [Google Scholar]
  27. Chakir, L.; Hssaïne, A.A.; Bridgland, D. Morphogenesis and Morphometry of Alluvial Fans in the High Atlas Morocco: A Geomorphological Model of the Fans of the Wadi Beni Mhammed, Souss Valley. Int. J. Environ. 2014, 3, 294–311. [Google Scholar] [CrossRef]
  28. Aït Hssaine, A.; Bridgland, D. Pliocene–Quaternary Fluvial and Aeolian Records in the Souss Basin, Southwest Morocco: A Geomorphological Model. Glob. Planet. Change 2009, 68, 288–296. [Google Scholar] [CrossRef]
  29. AQUASTAT. FAO’s Global Information System on Water and Agriculture. Available online: https://www.fao.org/aquastat/en/ (accessed on 21 November 2022).
  30. IPCC. IPCC Special Report on Climate Change, Desertification, Land Degradation, Sustainable Land Management, Food Security, and Greenhouse Gas Fluxes in Terrestrial Ecosystems; IPCC: Geneva, Switzerland, 2019; p. 43. [Google Scholar]
  31. Nomades, D.C. Historique-Météo.net. Available online: https://www.historique-meteo.net/ (accessed on 21 November 2022).
  32. Organisation for Economic Co-Operation and Development; United Nations. Environmental Performance Reviews, v. [11, 14, 15, 16, 31]; Environmental Performance Reviews Series; Organisation for Economic Co-Operation and Development: Paris, France, 2001. [Google Scholar]
  33. Lybbert, T.J.; Aboudrare, A.; Chaloud, D.; Magnan, N.; Nash, M. Booming Markets for Moroccan Argan Oil Appear to Benefit Some Rural Households While Threatening the Endemic Argan Forest. Proc. Natl. Acad. Sci. USA 2011, 108, 13963–13968. [Google Scholar] [CrossRef] [PubMed] [Green Version]
  34. Kirchhoff, M.; Peter, K.D.; Hssaine, A.A.; Ries, J.B. Land Use in the Souss Region, South Morocco and Its Influence on Wadi Dynamics. Z. Geomorphol. Suppl. Issues 2019, 62, 137–160. [Google Scholar] [CrossRef]
  35. Hssaisoune, M.; Bouchaou, L.; Sifeddine, A.; Bouimetarhan, I.; Chehbouni, A. Moroccan Groundwater Resources and Evolution with Global Climate Changes. Geosciences 2020, 10, 81. [Google Scholar] [CrossRef] [Green Version]
  36. Marzen, M.; Kirchhoff, M.; Marzolff, I.; Aït Hssaine, A.; Ries, J.B. Relative Quantification of Wind Erosion in Argan Woodlands in the Souss Basin, Morocco. Earth Surf. Process. Landf. 2020, 45, 3808–3823. [Google Scholar] [CrossRef]
  37. FAO. Morocco—Evaluation des Ressources Forestières Mondiales 2015—Rapport National; Évaluation des Ressources Forestières Mondiales; FAO: Rome, Italy, 2015. [Google Scholar]
  38. UNESCO. Argan, Practices and Know-How Concerning the Argan Tree. Available online: https://ich.unesco.org/en/RL/argan-practices-and-know-how-concerning-the-argan-tree-00955 (accessed on 21 November 2022).
  39. Fister, W.; Iserloh, T.; Ries, J.B.; Schmidt, R.-G. A Portable Wind and Rainfall Simulator for in Situ Soil Erosion Measurements. Catena 2012, 91, 72–84. [Google Scholar] [CrossRef]
  40. Wirtz, S.; Iserloh, T.; Marzen, M.; Fister, W. Chapter 8: Experimental FIeld Methods to Quantify Soil Erosion by Water and Wind-Driven Rain. In Field Measurement Methods in Soil Science; Wessel-Bothe, S., Weihermüller, L., Eds.; Gebr. Borntraeger Science Publishers: Stuttgart, Germany, 2020; pp. 165–190. ISBN 978-3-443-01109-3. [Google Scholar]
  41. Wilson, S.J.; Cooke, R.U. Wind Erosion. In Soil Erosion; Kirkby, M.J., Morgan, R.P.C., Eds.; Wiley: Chichester, UK, 1980; pp. 217–251. [Google Scholar]
  42. Goossens, D.; Nolet, C.; Etyemezian, V.; Duarte-Campos, L.; Bakker, G.; Riksen, M. Field Testing, Comparison, and Discussion of Five Aeolian Sand Transport Measuring Devices Operating on Different Measuring Principles. Aeolian Res. 2018, 32, 1–13. [Google Scholar] [CrossRef]
  43. Goossens, D.; Offer, Z.; London, G. Wind Tunnel and Field Calibration of Five Aeolian Sand Traps. Geomorphology 2000, 35, 233–252. [Google Scholar] [CrossRef]
  44. Bagnold, R.A. The Physics of Blown Sand and Desert Dunes; William Morrow: New York, NY, USA, 1941. [Google Scholar]
  45. Iserloh, T.; Fister, W.; Marzen, M.; Seeger, M.; Kuhn, N.J.; Ries, J.B. The Role of Wind-Driven Rain for Soil Erosion—An Experimental Approach. Z. Geomorphol. Supp. 2013, 57, 193–201. [Google Scholar] [CrossRef]
  46. Marzen, M.; Iserloh, T.; de Lima, J.L.M.P.; Fister, W.; Ries, J.B. Impact of Severe Rain Storms on Soil Erosion: Experimental Evaluation of Wind-Driven Rain and Its Implications for Natural Hazard Management. Sci. Total Environ. 2017, 590ߝ591, 502–513. [Google Scholar] [CrossRef] [PubMed]
  47. Saleh, A. Soil Roughness Measurement: Chain Method. J. Soil Water Conserv. 1993, 48, 527–529. [Google Scholar]
  48. Köhn, M. Korngrößenanalyse Vermittels Pipettenanalyse. Tonind.-Ztg. 1929, 53, 729–731. [Google Scholar]
  49. Becher, H.H. Influence of Long-Term Liming on Aggregate Stability of a Loess-Derived Soil. Int. Agrophysics 2001, 15, 67–72. [Google Scholar]
  50. Becher, H.H.; Kainz, M. Auswirkungen einer langjahrigen Stallmistdungung auf das Bodengefuge im Lossgebiet bei Straubing. Z. Acker Pflanzenbau J. Agron. Crop Sci. 1983, 152, 152–158. [Google Scholar]
  51. Auerswald, K. Percolation Stability of Aggregates from Arable Topsoils. Soil Sci. 1995, 159, 142–148. [Google Scholar] [CrossRef]
  52. Mbagwu, J.S.C.; Auerswald, K. Relationship of Percolation Stability of Soil Aggregates to Land Use, Selected Properties, Structural Indices and Simulated Rainfall Erosion. Soil Tillage Res. 1999, 50, 197–206. [Google Scholar] [CrossRef]
  53. Ellis, J.T.; Li, B.; Farrell, E.J.; Sherman, D.J. Protocols for Characterizing Aeolian Mass-Flux Profiles. Aeolian Res. 2009, 1, 19–26. [Google Scholar] [CrossRef]
  54. Poortinga, A.; Keijsers, J.G.S.; Maroulis, J.; Visser, S.M. Measurement Uncertainties in Quantifying Aeolian Mass Flux: Evidence from Wind Tunnel and Field Site Data. PeerJ 2014, 2, e454. [Google Scholar] [CrossRef] [Green Version]
  55. IBM Corp. IBM SPSS Statistics for Windows, Released 2020; Version 27.0; IBM Corp.: Armonk, NY, USA, 2020. [Google Scholar]
  56. SigmaPlot. Systat Software, Inc.; SigmaPlot: San Jose, CA, USA, 2008. [Google Scholar]
  57. Leys, J.F.; Mctainsh, G.H. Sediment Fluxes and Particle Grain-Size Characteristics of Wind-Eroded Sediments in Southeastern Australia. Earth Surf. Process. Landf. 1996, 21, 661–671. [Google Scholar] [CrossRef]
  58. Dong, Z.; Liu, X.; Wang, H.; Zhao, A.; Wang, X. The Flux Profile of a Blowing Sand Cloud: A Wind Tunnel Investigation. Geomorphology 2003, 49, 219–230. [Google Scholar] [CrossRef]
  59. Sharratt, B.S.; Kennedy, A.C.; Hansen, J.C.; Schillinger, W.F. Soil Carbon Loss by Wind Erosion of Summer Fallow Fields in Washington’s Dryland Wheat Region. Soil Sci. Soc. Am. J. 2018, 82, 1551–1558. [Google Scholar] [CrossRef] [Green Version]
  60. White, F. The Vegetation of Africa: Natural Resources Research; UNESCO: Paris, France, 1983; p. 20. [Google Scholar]
  61. Allington, G.R.H.; Valone, T.J. Islands of Fertility: A Byproduct of Grazing? Ecosystems 2014, 17, 127–141. [Google Scholar] [CrossRef]
  62. Garner, W.; Steinberger, Y. A Proposed Mechanism for the Formation of ‘Fertile Islands’ in the Desert Ecosystem. J. Arid. Environ. 1989, 16, 257–262. [Google Scholar] [CrossRef]
  63. Kirchhoff, M.; Romes, T.; Marzolff, I.; Seeger, M.; Aït Hssaine, A.; Ries, J.B. Spatial Distribution of Argan Tree Influence on Soil Properties in Southern Morocco. Soil 2021, 7, 511–524. [Google Scholar] [CrossRef]
  64. Barbero, M.; Bonin, G.; Loisel, R.; Quézel, P. Changes and Disturbances of Forest Ecosystems Caused by Human Activities in the Western Part of the Mediterranean Basin. Vegetatio 1990, 87, 151–173. [Google Scholar] [CrossRef]
  65. Zobeck, T.M. Abrasion of Crusted Soils: Influence of Abrader Flux and Soil Properties. Soil Sci. Soc. Am. J. 1991, 55, 1091–1097. [Google Scholar] [CrossRef]
  66. McKenna Neuman, C.; Maxwell, C.D.; Boulton, J.W. Wind Transport of Sand Surfaces Crusted with Photoautotrophic Microorganisms. Catena 1996, 27, 229–247. [Google Scholar] [CrossRef]
  67. Singer, M.; Shainberg, I. Mineral Soil Surface Crusts and Wind and Water Erosion. Earth Surf. Process. Landf. 2004, 29, 1065–1075. [Google Scholar] [CrossRef]
  68. Gillette, D.A.; Adams, J.; Muhs, D.; Kihl, R. Threshold Friction Velocities and Rupture Moduli for Crusted Desert Soils for the Input of Soil Particles into the Air. J. Geophys. Res. Ocean. 1982, 87, 9003–9015. [Google Scholar] [CrossRef] [Green Version]
  69. Belnap, J.; Phillips, S.L.; Herrick, J.E.; Johansen, J.R. Wind Erodibility of Soils at Fort Irwin, California (Mojave Desert), USA, before and after Trampling Disturbance: Implications for Land Management. Earth Surf. Process. Landf. 2007, 32, 75–84. [Google Scholar] [CrossRef]
  70. Marzen, M.; Iserloh, T.; Fister, W.; Seeger, M.; Rodrigo-Comino, J.; Ries, J.B. On-Site Water and Wind Erosion Experiments Reveal Relative Impact on Total Soil Erosion. Geosciences 2019, 9, 478. [Google Scholar] [CrossRef] [Green Version]
  71. Sharratt, B.; Wendling, L.; Feng, G. Surface Characteristics of a Windblown Soil Altered by Tillage Intensity during Summer Fallow. Aeolian Res. 2012, 5, 1–7. [Google Scholar] [CrossRef]
  72. Sterk, G.; Parigiani, J.; Cittadini, E.; Peters, P.; Scholberg, J.; Peri, P. Aeolian Sediment Mass Fluxes on a Sandy Soil in Central Patagonia. Catena 2012, 95, 112–123. [Google Scholar] [CrossRef]
  73. Belnap, J.; Munson, S.M.; Field, J.P. Aeolian and Fluvial Processes in Dryland Regions: The Need for Integrated Studies. Ecohydrology 2011, 4, 615–622. [Google Scholar] [CrossRef]
  74. Le Polain de Waroux, Y.; Lambin, E.F. Monitoring Degradation in Arid and Semi-Arid Forests and Woodlands: The Case of the Argan Woodlands (Morocco). Appl. Geogr. 2012, 32, 777–786. [Google Scholar] [CrossRef]
  75. Kouba, Y.; Gartzia, M.; El Aich, A.; Alados, C.L. Deserts Do Not Advance, They Are Created: Land Degradation and Desertification in Semiarid Environments in the Middle Atlas, Morocco. J. Arid Environ. 2018, 158, 1–8. [Google Scholar] [CrossRef]
  76. Del Barrio, G.; Sanjuan, M.E.; Hirche, A.; Yassin, M.; Ruiz, A.; Ouessar, M.; Martinez Valderrama, J.; Essifi, B.; Puigdefabregas, J. Land Degradation States and Trends in the Northwestern Maghreb Drylands, 1998–2008. Remote Sens. 2016, 8, 603. [Google Scholar] [CrossRef] [Green Version]
  77. Lahlaoi, H.; Rhinane, H.; Hilali, A.; Lahssini, S.; Moukrim, S. Desertification Assessment Using MEDALUS Model in Watershed Oued El Maleh, Morocco. Geosciences 2017, 7, 50. [Google Scholar] [CrossRef] [Green Version]
  78. Jilali, A. Impact of Climate Change on the Figuig Aquifer Using a Numerical Model: Oasis of Eastern Morocco. J. Biol. Earth Sci. 2014, 4, E16–E24. [Google Scholar]
  79. Johannsen, I.M.; Hengst, J.C.; Goll, A.; Höllermann, B.; Diekkrüger, B. Future of Water Supply and Demand in the Middle Drâa Valley, Morocco, under Climate and Land Use Change. Water 2016, 8, 313. [Google Scholar] [CrossRef] [Green Version]
  80. Van Dijck, S.J.E.; Laouina, A.; Loos, S.; Schipper, A.; van der Kwast, H.; Nafaa, R.; Antari, M.; Roccha, A.; Borrego, C.; Ritsema, C.J. Desertification in Northern Morocco Due to Effects of Climate Change on Groundwater Recharge. In Desertification in the Mediterranean Region. A Security Issue; Kepner, W.G., Rubio, J.L., Mouat, D.A., Pedrazzini, F., Eds.; Springer: Dordrecht, The Netherlands, 2006; pp. 549–577. [Google Scholar]
  81. Kirchhoff, M.; Engelmann, L.; Zimmermann, L.L.; Seeger, M.; Marzolff, I.; Aït Hssaine, A.; Ries, J.B. Geomorphodynamics in Argan Woodlands, South Morocco. Water 2019, 11, 2193. [Google Scholar] [CrossRef] [Green Version]
  82. Okin, G.S.; Sala, O.E.; Vivoni, E.R.; Zhang, J.; Bhattachan, A. The Interactive Role of Wind and Water in Functioning of Drylands: What Does the Future Hold? BioScience 2018, 68, 670–677. [Google Scholar] [CrossRef] [Green Version]
  83. Gillette, D.A. Fine Particle Emissions Due to Wind Erosion. Trans. ASAE 1977, 20, 890–897. [Google Scholar] [CrossRef]
  84. Katra, I.; Gross, A.; Swet, N.; Tanner, S.; Krasnov, H.; Angert, A. Substantial Dust Loss of Bioavailable Phosphorus from Agricultural Soils. Sci. Rep. 2016, 6, 24736. [Google Scholar] [CrossRef] [Green Version]
  85. Piedra, P.; Moosmüller, H. Optical Losses of Photovoltaic Cells Due to Aerosol Deposition: Role of Particle Refractive Index and Size. Sol. Energy 2017, 155, 637–646. [Google Scholar] [CrossRef]
  86. Goudie, A.S. Desert Dust and Human Health Disorders. Environ. Int. 2014, 63, 101–113. [Google Scholar] [CrossRef]
  87. Duniway, M.C.; Pfennigwerth, A.; Fick, S.; Nauman, T.; Belnap, J.; Barger, N. Wind Erosion and Dust from US Drylands: A Review of Causes, Consequences, and Solutions in a Changing World. Ecosphere 2019, 10, e02650. [Google Scholar] [CrossRef] [Green Version]
  88. Field, J.P.; Belnap, J.; Breshears, D.D.; Neff, J.C.; Okin, G.S.; Whicker, J.J.; Painter, T.H.; Ravi, S.; Reheis, M.C.; Reynolds, R.L. The Ecology of Dust. Front. Ecol. Environ. 2010, 8, 423–430. [Google Scholar] [CrossRef] [Green Version]
  89. Hagiwara, K.; Matsumoto, T.; Tsedendamba, P.; Baba, K.; Hoshino, B. Bacterial Characteristics of Dust Particle Saltation in Gobi Dust Sites, Mongolia. Atmosphere 2021, 12, 1456. [Google Scholar] [CrossRef]
  90. Knippertz, P.; Deutscher, C.; Kandler, K.; Müller, T.; Schulz, O.; Schütz, L. Dust Mobilization Due to Density Currents in the Atlas Region: Observations from the Saharan Mineral Dust Experiment 2006 Field Campaign. J. Geophys. Res. Atmos. 2007, 112, D21109. [Google Scholar] [CrossRef] [Green Version]
  91. Bhattachan, A.; D’Odorico, P.; Baddock, M.C.; Zobeck, T.M.; Okin, G.S.; Cassar, N. The Southern Kalahari: A Potential New Dust Source in the Southern Hemisphere? Environ. Res. Lett. 2012, 7, 024001. [Google Scholar] [CrossRef] [Green Version]
  92. Bullard, J.E.; McTainsh, G.H.; Pudmenzky, C. Aeolian Abrasion and Modes of Fine Particle Production from Natural Red Dune Sands: An Experimental Study. Sedimentology 2004, 51, 1103–1125. [Google Scholar] [CrossRef]
  93. Bullard, J.E.; Mctainsh, G.H.; Pudmenzky, C. Factors Affecting the Nature and Rate of Dust Production from Natural Dune Sands. Sedimentology 2007, 54, 169–182. [Google Scholar] [CrossRef]
Figure 1. Location of study area (a) at provinces Taroudannt and Chtouka-Ait Baha and (b) in the Souss Basin.
Land 12 00040 g001
Figure 2. Sites (a) argan woodland, (b) reforestation area, (c) wasteland, (d) wadi (with marked test areas).
Land 12 00040 g002
Figure 3. (a) mobile wind tunnel on site and (b) outlet area with collectors (modified from Marzen et al. 2020 [31]).
Land 12 00040 g003
Figure 4. Tested surfaces (selection).
Land 12 00040 g004
Figure 5. Mass flux for geomorphology per site (each site = three tests). Solid lines show the medians.
Land 12 00040 g005
Figure 6. Horizontal mass flux total and in different measurement heights with respect to (a) surface and (b) LCC. Solid lines show the medians, dots the outliers and whiskers mark the 10. and 90. percentile.
Land 12 00040 g006
Figure 7. Exponential decay functions fitted to vertical distribution of horizontal mass flux.
Land 12 00040 g007
Table 1. Soil and surface parameters.
IDLand Cover ClassLand Cover Class
Specific
SurfaceCrust StoneGrain < 2 mmLitterVegetationShear StrenghtRough-ness PS (mL/D50Fine Soil (<2 mm)SandSiltClay OCOC ErodedEnrichment
Factor
OC FluxDust Flux
%%%%%(kg cm−2)(Cr)10 min) %%%%%%(g m−2 min−1)
AOU1Agropastoral WoodlandWoodlandSoil crust9055001.51.415.60.05499.6745.8439.4914.670.653.735.750.77620.798
AOU2Agropastoral WoodlandWoodlandSoil crust8555051.51.415.60.05499.6745.8439.4914.671.05828.337
AOU3Agropastoral WoodlandWoodlandSoil crust9055001.50.015.60.05499.6745.8439.4914.670.79621.318
1 IRG 1WastelandWastelandStone cover07030000.70.611.20.05858.2547.1440.0112.850.643.194.990.1163.640
1 IRG 2WastelandWastelandStone cover07525000.70.811.20.06158.2549.1635.6415.200.0832.600
1 IRG 3WastelandWastelandStone cover08020000.70.611.20.06158.2549.1635.6415.200.0752.340
1LAM1WadiWadi, sandyCohesionless sand05950002.80.00.53974.0591.114.474.420.090.151.720.569385.805
1LAM2WadiWadi, sandyCohesionless sand05950002.80.00.53974.0591.114.474.421.347913.038
1LAM3WadiWadi, sandyCohesionless sand010900000.00.00.53974.0591.114.474.4216.34611,080.723
2LAM1WadiWadi, stonyStone cover25705500.26.70.00.44635.9584.368.926.720.100.383.700.0092.340
2LAM2WadiWadi, stonySoil crust305515500.24.10.00.44635.9584.368.926.720.06617.418
2LAM3WadiWadi, stonyStone cover57025500.26.70.00.44635.9584.368.926.720.0092.340
HAM1WastelandWastelandSoil crust3560500>2.57.32.40.08460.0055.9928.2715.750.653.305.100.35110.659
HAM2WastelandWastelandSoil crust30502000>2.50.42.40.08460.0055.9928.2715.750.37711.439
HAM3WastelandWastelandStone cover10801000>2.51.12.40.08460.0055.9928.2715.750.36010.919
2 IRG 1 *Agropastoral WoodlandWoodlandSoil crust1030204001.18.663.30.05692.9746.9535.6217.433.603.090.860.67521.838
2 IRG 2 *Agropastoral WoodlandWoodlandSoil crust3520103501.13.063.30.05691.7646.9535.6217.430.48215.599
2 IRG 3 *Agropastoral WoodlandWoodlandSoil crust01828001.11.463.30.05692.3746.9535.6217.430.0481.560
3 IRG 1 *Agropastoral WoodlandWoodlandSoil crust80200002.51.55.30.05996.8647.9541.6510.400.494.529.292.03544.976
3 IRG 2 *Agropastoral WoodlandWoodlandSoil crust80200002.52.35.30.05978.5247.9541.6510.400.57612.739
3 IRG 3Agropastoral WoodlandWoodlandSoil crust89100102.512.85.30.05990.9047.9541.6510.400.3888.579
4 IRG 1 *WastelandWastelandStone cover10750510>2.59.023.30.05266.0143.0846.4310.490.783.704.730.0982.080
4 IRG 2 *WastelandWastelandStone cover1080055>2.58.323.30.05572.8344.1847.008.820.4679.879
4 IRG 3 *WastelandWastelandStone cover1085050>2.56.023.30.05567.2544.1847.008.820.1352.860
5 IRG 1 *Agropastoral WoodlandArable, crustSoil crust60400001.213.65.40.06092.8348.8534.4316.730.532.755.150.39314.299
5 IRG 2 *Agropastoral WoodlandArable, crustSoil crust751051001.212.05.40.06092.8348.8534.4316.730.31411.439
5 IRG 3 *Agropastoral WoodlandArable, crustSoil crust602510501.218.55.40.06092.8348.8534.4316.730.34312.479
6 IRG 1 *Agropastoral WoodlandArable, tilledSoil crust53560000.115.05.40.06092.8348.8534.4316.730.45016.379
6 IRG 2 *Agropastoral WoodlandArable, tilledSoil crust53060500.119.05.40.06092.8348.8534.4316.730.43515.859
6 IRG 3 *Agropastoral WoodlandArable, tilledSoil crust03070000.129.35.40.06092.8348.8534.4316.731.64259.795
* Data partly from Marzen et al. 2020; PS = Percolation stability; D50 = Mean particle diameter; OC = Organic carbon.
Table 2. Mean characteristics of surface classes.
(a) SurfaceStonesCrustLoose Grain < 2 mmLitterVegetationSoil Organic CarbonShear StrengthRoughness (Cr)D50
%(kg cm−2) (mm)
Cohesionless sand6.670.0093.330.000.000.090.101.860.54
Soil crust26.0047.7216.2210.060.281.051.388.430.08
Stone cover76.117.7812.782.781.670.571.484.410.15
D50 = median particle diameter.
Table 3. Mean characteristics of LCC.
(b) LCCStonesCrustLoose Grain < 2 mmLitterVegetationSoil Organic CarbonShear Strength Roughness (Cr)D50
%(kg cm−2) (mm)
Wasteland72.7811.6712.221.671.670.692.033.790.07
Woodland20.2050.9316.8011.730.331.161.289.320.06
Wadi35.8310.0054.172.500.000.090.153.840.49
D50 = median particle diameter.
Table 4. Mean horizontal dust flux and organic carbon flux for surface and LCC categories.
Surface CategoriesLand Cover Classes
g m−2 min−1Stone CoverSoil CrustCohesionless SandWoodlandWadiWasteland
MeanNSDMeanNSDMeanNSDMeanNSDMeanNSDMeanNSD
Dust flux4.3393.4819.151813.664126.5236028.2820.401514.682066.9464430.166.2794.27
OC flux0.1590.160.62180.156.0938.890.69150.533.0666.530.2390.16
SD = Standard deviation.
Table 5. Pairwise comparisons surface.
Post-Hoc Pairwise SurfaceTest StatisticStd. ErrorStd. Test
Statistic
Sig.Adj. Sig. a
Stone cover–Soil crust9.8473.5082.8070.0050.015
Stone cover–Cohesionless sand21.2005.7953.6580.0000.001
Soil crust–Cohesionless sand11.3535.5132.0590.0390.118
a. Significance values have been adjusted by the Bonferroni correction for multiple tests.
Table 6. Pairwise comparisons of LCC.
Post-Hoc Pairwise LCCTest StatisticStd. ErrorStd. Test
Statistic
Sig.Adj. Sig. a
Wasteland–Woodland10.2893.7122.7720.0060.017
Wasteland–Wadi11.2224.6402.4190.0160.047
Woodland–Wadi-0.9334.252-0.2190.8261.000
a. Significance values have been adjusted by the Bonferroni correction for multiple tests.
Table 7. Correlation analysis (selected results).
Spearman’s RhoCrustStone CoverLoose Grain < 2 mmLitterShear Strength (kg cm−2)Roughness (Cr)Fine Soil
(<2 mm)
D50Sand (%)Silt (%)Clay (%)OC Parent Soil (%)OC Enrichment Factor
Dust flux (g m−2 min−1)CC0.116−0.665 **0.395 *−0.368 *−0.347−0.0060.579 **0.1310.171−0.295−0.083−0.3150.146
Sig. (2-tailed)0.5420.0000.0310.0450.0600.9770.0010.4910.3670.1130.6600.0900.442
N30303030303030303030303030
CrustCC −0.329−0.665 **0.0230.595 **0.0930.460 *−0.434−0.394 *0.3400.0920.1540.632 **
Sig. (2-tailed) 0.0760.0000.9040.0010.6250.0110.0170.0310.0660.6290.4180.000
N 303030303030303030303030
Loose grain <2 mmCC−0.665 **−0.114 −0.243−0.786 **0.105−0.1690.601 **0.621 **−0.658 **−0.028−0.384 *−0.362 *
Sig. (2-tailed)0.0000.545 0.1950.0000.5770.3710.0000.0000.0000.8800.0360.049
N3030 30303030303030303030
LitterCC0.0230.130−0.243 0.0230.416 *−0.034−0.238−0.2790.0860.2390.305−0.453 *
Sig. (2-tailed)0.9040.4920.195 0.9060.0220.8550.2030.1350.6530.2030.1020.012
N303030 303030303030303030
VegetationCC0.1050.137−0.3530.1140.373 *0.0960.049−0.480 **−0.493 **0.428 *−0.1540.369 *0.013
Sig. (2-tailed)0.5820.4690.0550.5490.0430.6120.7970.0070.0060.0180.4160.0450.946
N30303030303030303030303030
Fine soil (<2mm)CC0.460 *−0.686 **−0.169−0.0340.0480.212 −0.535 **−0.488 **0.2740.430 *0.2230.479 **
Sig. (2-tailed)0.0110.0000.3710.8550.8020.261 0.0020.0060.1420.0180.2360.007
N303030303030 303030303030
D50CC−0.434 *0.0800.601 **−0.238−0.512 **−0.052−0.535 ** 0.993 **−0.866 **−0.317−0.747 **−0.304
Sig. (2-tailed)0.0170.6730.0000.2030.0040.7830.002 0.0000.0000.0870.0000.102
N30303030303030 3030303030
Sand (%)CC−0.394 *0.0100.621 **−0.279−0.533 **−0.085−0.488 **0.993 ** −0.886 **−0.297−0.756 **−0.264
Sig. (2-tailed)0.0310.9580.0000.1350.0020.6540.0060.000 0.0000.1100.0000.159
N3030303030303030 30303030
Silt (%)CC0.3400.145−0.658 **0.0860.578 **−0.0240.274−0.866 **−0.866 ** 0.0990.565 **0.398 *
Sig. (2-tailed)0.0660.4440.0000.6530.0010.8990.1420.0000.000 0.6040.0010.029
N303030303030303030 303030
Clay (%)CC0.0920.003−0.0280.2390.0760.2820.430 *−0.317−0.2970.099 0.557 **0.138
Sig. (2-tailed)0.6290.9860.8800.2030.6880.1320.0180.0870.1100.604 0.0010.467
N30303030303030303030 3030
CC = Correlation coefficient; D50 = median particle diameter; OC = Organic carbon. * Correlation is significant at the 0.05 level (2-tailed). ** Correlation is significant at the 0.01 level (2-tailed).
Disclaimer/Publisher’s Note: The statements, opinions and data contained in all publications are solely those of the individual author(s) and contributor(s) and not of MDPI and/or the editor(s). MDPI and/or the editor(s) disclaim responsibility for any injury to people or property resulting from any ideas, methods, instructions or products referred to in the content.

