Article

Spatio-Temporal Variation of the Ecosystem Service Value in Qilian Mountain National Park (Gansu Area) Based on Land Use

1
College of Earth and Environmental Sciences, Lanzhou University, Lanzhou 730000, China
2
Institute of County Economic Development & Rural Revitalization Strategy, Lanzhou University, Lanzhou 730000, China
*
Author to whom correspondence should be addressed.
Land 2023, 12(1), 201; https://doi.org/10.3390/land12010201
Submission received: 2 December 2022 / Revised: 5 January 2023 / Accepted: 6 January 2023 / Published: 7 January 2023
(This article belongs to the Special Issue National Parks and Protected Areas)

Abstract

:
The value of ecosystem services and service capabilities continue to improve, and the way to form a path of resource industrialization development has become one of the important directions of sustainable development. This paper mainly takes the construction of national parks as a major opportunity and explores the temporal and spatial changes in the value of ecosystem services in Qilian Mountain National Park (Gansu area) and the construction path of the industrial system of national park construction. The total value of ecosystem services was calculated using a comprehensive index of the degree of land use, land contribution rate, ecological service value, equivalent factor of economic value, and the improved value coefficient of farmland ecological services, and then the Sensitivity index was used to reveal the dependence of the value of ecosystem services on the value index over time. The results showed the following: (1) Human disturbance factors in Qilian Mountain National Park (Gansu area) are weak, and the land use of Qilian Mountain National Park (Gansu Area) was mainly grassland, followed by unused land, forest land, and glacial snow, with the change in glacial snow cover being the largest. (2) The ecosystem of Qilian Mountain National Park (Gansu area) is strong, and the contribution rate of forest land, construction land, unused land, and glacial snow cover in Qilian Mountain National Park (Gansu Area) was positive, while cultivated land, grassland, and water area were negative. Among them, glacial snow cover contributed the most at 10.4723 the ecological barrier function plays a stable role. (3) The ecosystem service value (ESV) in Qilian Mountain National Park (Gansu Area) showed a fluctuating growth trend on the whole, showing the characteristics of high northwest and low southeast, among which the total value of grassland was the largest, the value of unused land was the smallest with the largest increase range, and the increase in water area was the smallest. (4) Qilian Mountain National Park (Gansu Area) is mainly based on regulated services, followed by support services, supply services, and cultural services, all showing a clear growth trend, increasing by 181.77%, 183.90%, 196.19%, and 170.38%, respectively. With the development of low-carbon economy and circular economy as the main idea, we aim to build a national park industrialization development path of direct product supply, indirect product supply, and basic guarantee.

1. Introduction

The continuous satisfaction of economic and social service functions by ecosystem services is an important basic prerequisite for achieving their continued function [1]. In 2015, China promulgated and implemented the “Opinions of the Development and Reform Commission on the Key Work of Deepening Economic System Reform in 2015” to carry out a “pilot national park system” in nine provinces, including Sichuan, Hainan, and Guangdong, and in 2021, China officially established the first batch of national parks, which included Sanjiangyuan, giant pandas, Northeast tigers and leopards, Hainan tropical rainforest, and Wuyi Mountain, covering an area of 230,000 square kilometers, covering nearly 30% of the terrestrial areas of the national key protected wild animal and plant species. Due to the coupling characteristics of the natural and cultural landscapes of China’s natural resources themselves [2], more attention is being paid to the attributes of cultural characteristics and the needs for integrated development, such as ecosystem service functions, social functions, and premium functions, in the process of their development [3]. The proposal national park construction explores the shift from the ecological protection system dominated by nature reserves to the nature reserve system with national parks as the main body, providing a typical development model for the overall protection of the global natural system and paying attention to the important role of ecological assets [4]. As an important ecological barrier typical of western China [5], the Qilian Mountains play an important role in helping to maintain the balance of the oasis ecosystem in the Hexi Corridor [6] and cultural symbols [7,8], and the way to better highlight the service characteristics in the protection system dominated by national parks has become an urgent problem.
Ecosystem services refer to the environmental conditions and utilities formed and maintained by ecosystems for human survival and development, and all the benefits directly or indirectly obtained by human beings from the ecosystem, including four aspects of supply services, regulation services, support services, and cultural services [9]. The research on the value of China’s ecosystem services has been carried out by Xie Gaodi [10] to develop the “China terrestrial ecosystem service value equivalent factor table”. It provides a basis for calculating regional ecosystem values and is widely used, and the coordination between ecosystem services is constantly weighed [11]. The main types of ecosystems are farmland, forests, grasslands, wetlands, oceans, and cities [12], which can provide people with systematic service functions—that is, the various utilities that humans obtain from the ecosystem [13]. Similarly, they provide a variety of services to humans, directly or indirectly, and have been widely discussed in the academic community [14]. For example, Costanza first assessed global natural capital in 1997, mainly using ecosystem goods and services [15]. De Groot et al. defined ecosystem functioning as the ability of natural processes and their components to provide goods and services that meet direct or indirect human needs [16]. Since the United Nations Millennium Assessment (2005), which pointed out that ecosystem services refer to the benefits that people receive from ecosystems, ecosystem services science has made many advances in developing the core concepts and methods [17]. The research and development of ecosystems continue to deepen, and the importance of the development of economy [18], society [19], and urban ecosystem service value prediction continues to increase [20], which not only plays an important role in the construction of national parks [21] but also in human development, such as cultural development [22] and landscape value [23]. In 2021, the United Nations officially adopted the new framework of environmental–economic accounting–ecosystem accounting (SEEA-EA) to further promote sustainable economic and social development. In the study of ecosystem service value in China, it has been proposed that ecological equivalent factors [10] rely on continuous optimization and in-depth calculation of ecosystem value. In 2020, the Ministry of Ecology and Environment and the Research Center for Eco-Environmental Sciences of the Chinese Academy of Sciences jointly compiled a technical guide for accounting for the terrestrial ecosystem product (GEP) and then extending the function and value of recreation services to the ecosystem [24], which continues to enrich the research on the value system of ecosystem services with a focus on counties [25]. Similarly, with the transformation and development of China’s economy and society, more attention should be paid to connotative development and cross-regional ecological economic linkage development [26], and the role of the vegetation index in ecosystems should be fully utilized [27].
Ecosystem service function and ecological sensitivity are important contents of ecological protection evaluation [28], and the process of national park construction not only pays attention to the supply capacity of the ecosystem itself but also divides national parks into strictly protected areas, ecological conservation areas, traditional use areas, and scientific and educational recreation areas [29], and also pays more attention to the reuse of other extended functions such as cultural aesthetics. Some scholars have made calculations based on GEP (gross ecosystem product), demonstrating that the ecological value is the most prominent [30]. The Qilian Mountains are ecologically fragile and sensitive areas, and ecological restoration is more difficult [31], but the way to further realize the service value of the ecosystem as a national park, better serve the local economy, and society to play a better role and form a benign interaction with the ecosystem has become an urgent problem to be solved. As such, the systematic protection of national parks as the main body has become a typical case demonstration.
This paper mainly relies on the importance and resource characteristics of ecological economic development, taking Qilian Mountain National Park (Gansu area) as an example. First, the ecosystem service value equivalent factor was used to analyze the changes in ecosystem service value from 2000 to 2019 and enrich the application research of ecosystem service value equivalent factor. Second, combined with the economic development of the Qilian Mountains and its surrounding areas, highlight the characteristics shared by the people of national park construction, build a national park industrialization development path of direct product supply, indirect product supply and basic guarantee, and put forward countermeasures and suggestions for national park construction. We also hoped to provide a typical case for the development of terrestrial ecosystems around the world.

2. Overview of the Study Area

Qilian Mountain National Park (Gansu Area) covers an area of 34,400 km2, accounting for 68.5% of the total area, involving the seven counties (districts) of Subei Mongol Autonomous County, Aksai Kazakh Autonomous County, Sunan Yugur Autonomous County, Minle County, Yongchang County, Tianzhu Tibetan Autonomous County, and Liangzhou District, including Qilian Mountain National Nature Reserve, Yanchiwan National Nature Reserve, Tianzhu Three Gorges National Forest Park, Horseshoe Temple Provincial Forest Park, Binggou River Provincial Forest Park, and other protected areas. The terrain is basically high in the south and low in the north, located in a cold area with a plateau continental climate and rich natural environment. It consists mainly of Qinghai spruce forest, shrub forest, and a small number of Qilian cypress, birch, and aspen forests, grassland meadow steppe, desert steppe, and alpine grassland. The vegetation growth in the area is good, and the forest coverage rate reaches 28.8% [32] (Figure 1).
As of 2019, The 7 counties (districts) of Qilian Mountain National Park (Gansu Area) have a land area of 1232.2 square kilometers and a population of 1460.3 thousand, the GDP totaled 7.974 billion USD, the investment in fixed assets was 5.338 billion USD, and the added value of the primary, secondary, and tertiary output was 1.964, 1.641, and 4.369 billion USD, respectively (According to the information released by the National Bureau of Statistics of China, the conversion of US dollars and RMB is based on the average exchange rate of US dollars and RMB in 2020—that is, 1 US dollar to 6.8974 yuan) (Table 1).

3. Materials and Methods

3.1. Data Sources and Processing

The remote sensing monitoring dataset of land cover change in China (CNLUCC) provided by the Data Center for Resources and Environmental Sciences of the Chinese Academy of Sciences from 2000 to 2019 was provided by the Data Center for Resources and Environment Science of the Chinese Academy of Sciences, and this paper analyzed the land use changes according to the first-level classification method of land use type of the system, namely, arable land, forest land, grassland, water, construction land, and unused land. The data on grain crop output and sown area came from the Gansu Development Yearbook, while the grain price data were from the Summary of National Agricultural Product Cost and Benefit Data. These data are widely used in the study of the value of ecosystem services in China [33,34] (Figure 2).

3.2. Research Methods

3.2.1. Analysis of Degree of Land Use and Change Characteristics

  • Composite Index of Land Use
The comprehensive index of the degree of land use (L) reflects the degree of human development and utilization of regional land and is an important indicator to measure the depth and breadth of regional land use. Its formula is expressed as [35]:
I = n 1 n ( L i · P i ) · 100 % ,
where I represents the comprehensive index of land use intensity, Li represents the land use intensity grade of the class I land use type, and Pi represents the proportion of class I land use type to the total land area.
In order to quantify the influence of each land use type on the change of the comprehensive index of land use intensity, the contribution rate of land type use intensity was introduced, and the calculation method is as follows [35]:
R i = I i b I i a I i a = L i · P i b P i a L i · P i a ,
where Iib and Iia are the land use intensity index for the class I land use types b year and a year, respectively. Pib and Pia refer to ratio of the type I land use type to the total land area, respectively. L-i. denotes the land use intensity rating of the class I land use type. Ri is the contribution rate of the land use intensity composite index of class I land use type from a to b years, where a negative value means that its contribution makes the land use intensity composite index smaller, while a positive value indicates that its contribution makes the land use intensity composite index larger. The larger the absolute value of Ri, the greater the contribution of class I land use types to the change of the overall land use intensity composite index—that is, the greater the impact.
2.
Analysis of land use change characteristics
The land use transfer matrix is the basis for analyzing the direction of regional land use change, which can reveal the structural characteristics and transfer direction of land use changes [36]. The rate of land use change can be expressed in terms of land use dynamics. A single land use dynamic degree can visually reflect the intensity of change in various land types [37].
K = U b U a U a × 1 T × 100 % ,
where K is the dynamic degree of a certain land use type. Ua and Ub represent the area of a land use type at the beginning and end of the study period, respectively. T is the study period for a land type.

3.2.2. Approaches to Valuing Ecosystem Services

Referring to the research results of Xie Gaodi [38], Sutton and Costanza [39], and others, the economic value of the national ecosystem ecological service value equivalent factor was calculated, and the proposed equivalent factor table defines the economic value of the annual natural food yield of farmland, with a national average yield of 1 hm2 being 1 [40] and the value equivalent factor of other ecosystem services being a relative quantity, which refers to the contribution of the ecological service relative to the farmland food production service.
The economic value of grain production can be calculated as [35]:
E c = 1 7 T a · T b ,
where Ec is the economic value of grain production. Ta is the average grain benchmark yield (kg/hm2) in the study area study area. Tb is the unit price of grain in the study area. 1/7 refers to the natural ecosystem without human input in the unit area, and the economic value provided by the natural ecosystem without human input is 1/7 provided by existing farmland [35]. According to the biomass factor table of farmland ecosystem in different provinces in China [10], the biomass factor of farmland ecosystem in Gansu was 0.42, and the value coefficient of farmland ecological service in Qilian Mountain area was 0.85 after adjustment according to the actual situation.
The service value coefficient of each ecological service function can be calculated as follows [41]:
V C i j = E c · f i j ,
where VCij is the coefficient of the jth ecological service value of the ith land use type (dollar/hm2∙a), and fij represents the equivalent factor of the jth ecological service value of the ith land use type. From 2000 to 2019, the average grain output of Qilian Mountain National Park (Gansu Area) was 66,009.02 kg/hm2, and in 2019, the average grain price of the seven counties (districts) of Qilian Mountain National Park (Gansu Area) was 4.26 USD/hm2, while the value of ecosystem services in Qilianshan National Park (Gansu Area) was calculated as 38,587.18 USD/hm2. Furthermore, the value of ecosystem services in the study area was calculated [41]:
E S V = i = 1 n A k × V C k                 E S V f = i = 1 n A k × V C j k ,
where ESV and ESVf are the total value of ecosystem services and the functional value of the f-service, respectively. Ak represents the area of land use type k (hm2). VCk and VCjk are the ecosystem service value coefficient and the f-service function value coefficient for land use type k, respectively.

3.2.3. Sensitivity Analysis

This paper used the Coefficient of Sensitive (CS) index commonly used in economics to reveal the dependence of the value index on the change of ecosystem service value over time, so as to reduce the uncertainty of the results. According to CS, to better verify the stability of the change trend and characteristics of the total value of ecosystem services in Qilian Mountain National Park (Gansu area) from 2000 to 2019. In this paper, CS was calculated by increasing or decreasing the ecological service value coefficient VC by 50% for each land use type [42].
C S = E S V j E S V i / E S V i V C j k V C i k / V C i k ,
where VCik and VCjk represent the value coefficient of ecological services per unit area of Category k ecosystems before and after adjustment. ESVi and ESVj represent the total value of ecological services before and after the adjustment, respectively. CS is the sensitivity of the value coefficient of each ecosystem service in the study area. If CS > 1, ESV is elastic to VC, the accuracy of the value coefficient is poor, and the confidence is low. If CS < 1, ESV is not elastic to VC and the results are credible.

4. Results

4.1. Change Characteristics of Land Use Degree

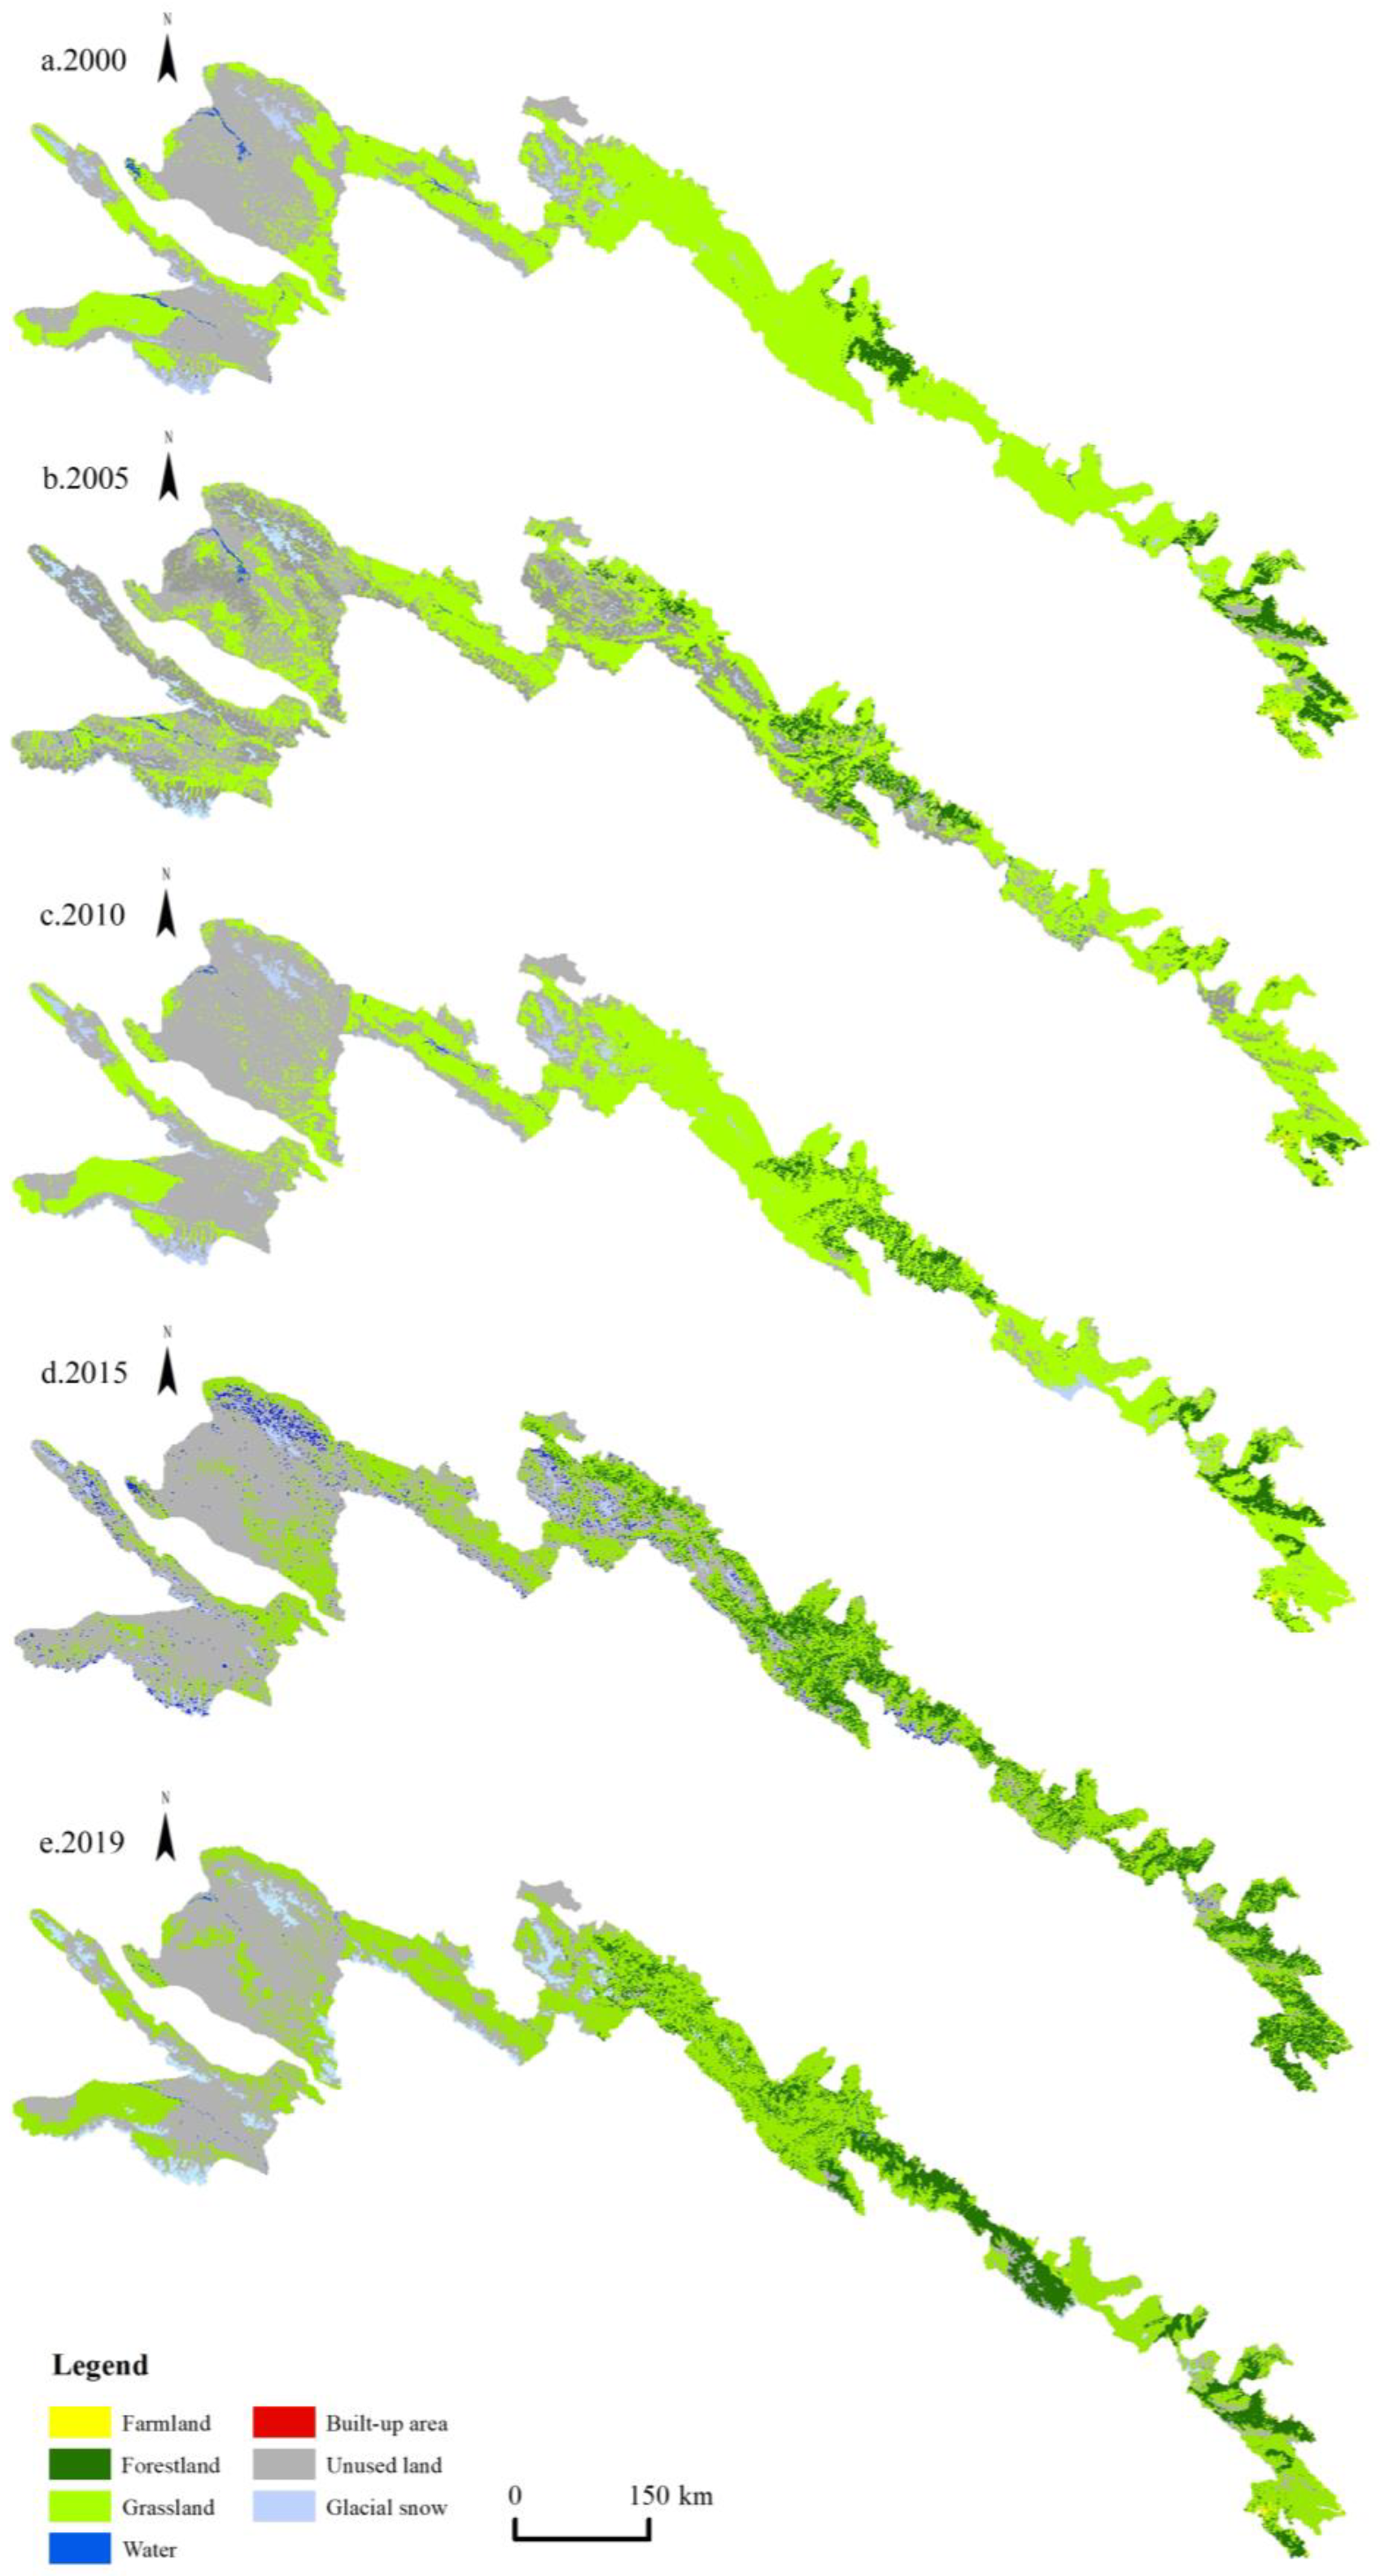
4.1.1. Land Use Change Characteristics

From 2000 to 2019, Qilian Mountain National Park (Gansu Area) was mainly divided into four phases of arable land, forest land, grassland, water, unused land, construction, and glacier five types of land use types. Specifically, there were mainly the following aspects:
In the study periods of 2000, 2005, 2010, 2015, and 2019, different land types in Qilian Mountain National Park (Gansu Area) changed to varying degrees according to the remote sensing monitoring dataset of land cover change in China, mainly as follows: The area of unused land continued to increase, and the area of forest land, glacial snow cover, and construction land fluctuated and increased. The fluctuation of cultivated land and grassland area decreased. Specifically, the proportion of unused land increased from 35.21% (1,075,888.26 hm2) in 2000 to 36.43% (1,122,641.01 hm2) in 2019. The proportion of forest land increased from 5.18% (158,374.26 hm2) in 2000 to 11.37% (350,380.26 hm2) in 2019, the proportion of glacial snow area increased from 0.29% (8892.72 hm2) in 2000 to 3.34% (102,892.68 hm2) in 2019, the proportion of construction land increased from 0.0015% in 2000 (46.08 hm2) to 0.0048% (147.60 hm2) in 2019, the proportion of cultivated land decreased from 0.31% (9324.27 hm2) in 2000 to 0.28% (8717.04 hm2) in 2019, and the proportion of grassland area decreased from 58.4668% (1,786,700.07 hm2) in 2000 to 48.34% in 2019 (1,489,829.58 hm2) (Table 2).
From the perspective of land use structure, grassland was the main one, followed by unused land, forest land, and glacial snow cover, with annual average area ratios of 48.66%, 38.18%, 9.35%, and 2.45%, respectively, while the annual average area ratios of cultivated land and construction land were 0.32% and 0.0023%, respectively. In terms of change rate and up, the change range was 1057.04%, 220.31%, and 121.24%, and the dynamic degree of single land use was 2.64%, 0.55%, and 0.30%, respectively (Figure 3).

4.1.2. Land Use Change Characteristics

In this paper, with reference to the land use intensity grading method [35,43], the use intensity of the land use type in the study area was divided into five levels and assigned the corresponding index in Formula (1), with the specific land use degree detailed in Table 3.
According to the actual situation of the study area and the division of land use intensity grades in existing studies, this paper divided them into five levels, assigned them to the grades, and obtained the land use intensity index and its changes in the four phases of Qilian Mountain National Park (Gansu Area) in 2000, 2005, 2010, 2015, and 2019 (Table 4).
The variation range of Qilian Mountain National Park (Gansu Area) was large during the study period, and the change range of each study period was very different, but the land use intensity index was very low. Analysis of the results calculated according to Formulas (2) and (3), The land use intensity indices and their changes for the five periods 2000, 2005, 2010, 2015, and 2019 are shown in Table 5.
From the study period from 2000 to 2019, the contribution rate of forest land, construction land, unused land, and glacial snow cover was positive, while for cultivated land, grassland, and water area, it was negative. The contribution rate of glacial snow cover was 10.4723, and the contribution rate of construction land and forest land was also relatively large and positive, indicating that during the study period, a very small portion of arable land, grassland, and water areas in Qilian Mountain National Park (Gansu Area) was developed or developed into glacial snow, construction land, or woodland. Specifically:
First, from 2000 to 2005, the contribution rate of arable land, forest land, water area, construction land, unused land, and glacial snow cover was positive, only grassland contributed negatively. The contribution rate of glacial snow cover was the largest at 7.1931, and the contribution rate of forest land and cultivated land was 1.8288 and 0.3271, respectively. This shows that from 2000 to 2005, grassland was developed or developed into arable land, forest land, water, construction land, unused land, or glacial snow.
Second, from 2005 to 2010, the contribution rate of grassland and glacial snow cover was positive, while the contribution rate of cultivated land, forest land, water area, construction land, and unused land was negative, and the contribution rate of water area was the largest and negative. This indicates that from 2000 to 2005, arable land, forest land, water areas, construction land, and unused land were developed or developed into grassland or glacier snow.
Third, from 2010 to 2015, the contribution rate of arable land, forest land, water area, and construction land was positive, while the contribution rate of grassland, unused land, and glacial snow cover was negative, and the contribution rate of water area was the largest and positive. This illustrates that grassland, unused land, and glacial snow cover were developed or developed into arable land, forest land, water area, or construction land.
Fourth, from 2015 to 2019, the contribution rate of forest land, grassland, construction land, unused land, and glacial snow cover was positive, while the contribution rate of cultivated land and water area was negative, and the contribution rate of construction land was the largest and positive. This shows that, from 2015 to 2019, cultivated land and water areas were developed or developed into forest land, grassland, construction land, unused land, or glacier snow.

4.2. The Value of Ecosystem Services

4.2.1. The Temporal Variation Characteristics of the Total Value of the Service

From the perspective of the total value of ecosystem services of land types, the total value of ecosystem services in Qilian Mountain National Park (Gansu Area) from 2000 to 2019 showed a trend of fluctuation with an increase, with an overall increase of 990.2085 billion USD according to Formulas (4)–(6).
First, the total value of services increased from 542.1147 billion USD in 2000 to 3521.2048 billion USD in 2015, an increase of 182.66%, and then dropped to 1532.3232 billion USD in 2019, a decrease of 54.68%, showing a clear inverted “U” growth trend (Table 6).
Second, from the perspective of the total value, the total value of all types of land types showed an increasing trend, with the largest total value for grassland, the smallest and largest increase for unused land, and the smallest increase for water areas. First, the total value of grassland was the largest and showed an increasing trend, increasing from 455.8161 to 1131.9449 billion USD, an increase of 148.33%, with the average proportion being 70.9316%. Second, the total amount of unused land was the smallest, but its increase was the largest—that is, from 0.0007 billion USD in 2000 to 0.0062 billion USD in 2019, an increase of 853.95%. Third, the total value of water areas increased the least, from 37.9062 billion USD in 2000 to 50.3932 billion USD in 2019, an increase of 32.94% (Table 6).

4.2.2. Spatial Variation Characteristics of the Total Service Value

From the perspective of the spatial total ecosystem service value of land type, the total ecosystem service value of Qilian Mountain National Park (Gansu Area) from 2000 to 2019 showed the characteristics of high northwest and low southeast values. In 2000, it was mainly high in the Western Arctic, while other regions were mainly moderately distributed. In 2005, it was mainly high in the west and arctic, while other regions were low and very low. In 2010, it was dominated by extremely high in the northwest, and in 2015, it was basically the same as in 2010. In 2019, the northwest was dominated by extremely high, the middle region was dominated by very low, and the southeast region was dominated by medium and low values (Figure 4).

4.2.3. The Function of the Service and the Changing Characteristics of the Value of the Individual Service

The service functions of Qilian Mountain National Park (Gansu Area) were analyzed from the perspective of supply, regulation, support, and cultural services, mainly based on regulation services, followed by support, supply, and cultural services, all showing obvious growth trends, increasing by 181.77%, 183.90%, 196.19%, and 170.38%, respectively (Table 7).
From 2000 to 2019, the single service functions of Qilian Mountain National Park (Gansu Area) were mainly based on climate, water, and soil regulation and remained basically stable, accounting for an average of 24.04% and 25.63%. Meanwhile, soil conservation, diversity, gas regulation, environmental purification, aesthetic landscape, raw material production, water supply, food production, and nutrient cycling accounted for 10.87%, 10.34%, 8.95%, 8.20%, 4.47%, 2.57%, 2.47%, 1.64%, and 0.82%, respectively. In terms of the proportion of total ecological service value, the proportion of total ecological service value basically maintained a growth trend, except for air purification, water and soil regulation, soil conservation, diversity, and aesthetic landscape, while the proportion of other individual service functions showed a growth trend (Table 8).

4.3. Sensitivity Analysis

According to the sensitivity analysis in Formula (7) of the 50% increase in the value coefficient of ecological services, the sensitivity index of different land use types was very different, but there was little difference between different years of the same type, and the sensitivity index was less than 1. Among them, grassland had the largest sensitivity index, while arable land had the lowest sensitivity index. The total value of ecosystem services in the study area was not elastic to the value coefficient, so the value coefficient used in this calculation was suitable for Qilian Mountain National Park (Gansu Area), and the results are credible (Table 9).

5. Discussion

(1) First, the land use of Qilian Mountain National Park (Gansu Area) was mainly grassland from 2000 to 2019, followed by unused land, forest land, and glacial snow, with an annual average area ratio of 48.66%, 38.18%, 9.35%, and 2.45%, respectively, during which the largest variation of glacial snow cover occurred. From 2000 to 2020, the area of water bodies increased significantly, and the desert area decreased significantly in Sanjiangyuan National Park [44], while the changes in Qilian Mountain National Park (Gansu Area) were mainly glacial snow, construction land, and forest land, reflecting that Qilian Mountain National Park (Gansu Area) has low human interference factors and obvious originality and integrity characteristics. It shows that the construction and self-repair ability of the ecosystem of Qilian Mountain National Park (Gansu Area) continue to improve, provide high-quality system service resources for the construction of the national park, provide original natural landscape, provide a more intuitive landscape system for further exerting its ecosystem service value, which is conducive to the development of a green industrial system based on sightseeing and tourism, and lay the foundation for the optimization of the ecosystem for the construction of the national park.
(2) Second, the contribution rate of forest land, construction land, unused land, and glacial snow cover in Qilian Mountain National Park (Gansu Area) from 2000 to 2019 was positive, while that of cultivated land, grassland, and water area was negative. Among them, the contribution rate of glacial snow cover was 10.4723, and the contribution rate of construction land and forest land was relatively large and positive. Conversely, the grassland and water bodies of Sanjiangyuan National Park contributed greatly to the ecological environment of the park [45], and the evolution of land use types was related to the value of ecosystem services. This shows that a very small portion of arable land, grassland, and water areas in Qilian Mountain National Park (Gansu Area) has been developed or developed into glacial snow, construction land, or woodland, which reflects the integrity of the system. This poses a new challenge to how to realize the protection of ecosystem integrity in the construction of national parks, not only focusing on strengthening the authenticity and integrity protection of natural ecosystems in the process of national park construction but also putting forward a more severe test for the path of utilization.
(3) Third, the ESV in Qilian Mountain National Park (Gansu Area) from 2000 to 2019 showed a fluctuating growth trend on the whole, demonstrating the characteristics of high northwest and low southeast values, and showed opposite spatial characteristics with the characteristics of a high value in the northeast and a low value in the northwest of the ecosystem service value of the Yangtze River Source Park and Lancang River Source Park, The Yellow River Source Park presented the characteristics of a high value in the west and a low value in the east. [46]. Qilian Mountain National Park (Gansu Area) had the largest total grassland value, the smallest unused land value, and the smallest increase in water area. Regulating services, followed by support services, supply services, and cultural services, all showed a clear growth trend, increasing by 181.77%, 183.90%, 196.19%, and 170.38%, respectively. It shows that as an important ecological barrier in the western region of China, the Qilian Mountains play an important role in the regulation of the overall environment, and at the same time, with the opportunity of developing eco-tourism in the western region, the cultural service function of the Qilian Mountains ecosystem is well played, and the construction results of the national park are shared by the whole people.
(4) Fourth, this article took the comprehensive services of Qilian Mountain National Park (Gansu Area) as the mainstay, giving full play to the four major service functions of supply, regulation, support, and cultural services, maintaining ecological security, ensuring ecological regulation functions, providing products for a good living environment, establishing a sound long-term ecological compensation mechanism to help provide financial guarantee for the park [47], taking the development of low-carbon economy and circular economy as the main idea, and building direct product supply. The industrialization development path of national parks with indirect product supply and basic guarantee appropriately develops the construction of direct market and life-oriented product systems for agricultural production, forestry services, animal husbandry production, and fishery production according to the characteristics of the region. Agricultural production mainly relies on the natural conditions of the region to develop the production of wheat, corn, vegetables, fruits, and other green agriculture, meet the basic needs of the region, and the most suitable development of large-scale agricultural seed production and production base. Develop a forestry service system focusing on forestry breeding and renewal and better realize the breeding and renewal of forest land. In turn, high-quality natural ecosystems are used to develop circular pastoral production and suitable fishery production. In addition, it extends and cultivates business systems such as accommodation and catering, leisure vacation, culture and art, and fitness and leisure activities, such as the development of campsite products, ecological catering services, and other green and ecological tertiary industry service systems. Similarly, effective conversion mechanisms for ecosystem goods and markets should be combined and considers the use of carbon sink compensation mechanisms and ecological banks in the process of consumption or marketization of these products. Through the systematic and intelligent sustainable use of the ecosystem of Qilian Mountain National Park (Gansu Area), we can better help the construction of national parks and become an area jointly built and shared by the people. In particular, the construction of national parks is more prominent in the construction of the people’s sharing mechanism for construction results, paying attention to the integrity of the ecosystem and paying more attention to the realization of its added value and maximizing its benefits. Build a mechanism for mutual coordination and unification of direct product supply, indirect product supply and basic security system, and explore the construction of a sustainable industrial system with the goal of human and natural communities. Combined with the actual situation and industrial characteristics of China’s national park construction, fully tap the cultural supply capacity of ecosystem services, provide direct product supply, such as agriculture, forestry, animal husbandry, and fishery, explore diversified indirect product supply, such as accommodation and catering, leisure vacation, culture and art, fitness and leisure activities, and more direct, systematic, and intelligent protection and supervision systems, so as to realize the effective docking of product supply and sustainable utilization (Figure 5).

6. Conclusions

Based on the equivalent factor of ecosystem services, this paper calculated the ecosystem value of Qilian Mountain National Park (Gansu Area) by assetization, which provides theoretical support for its market-oriented development. From 2000 to 2019, the land use of Qilian Mountain National Park (Gansu Area) was mainly grassland, during which the largest change in glacial snow cover occurred. The value of ecosystem services in 2019 was 1532.32 billion USD, showing a clear inverted “U” growth trend, taking the development of the low-carbon and circular economies as the main idea, and putting forward the path of marketization or industrialization development of national parks. However, it is mainly based on the analysis of economic equivalent factors, and more GEP and other methods should be used in the process of method selection for in-depth research and exploration, and the research area is mainly selected for the study of Qilian Mountain National Park (Gansu Area), and the comparative study with Qinghai Area and Qilian Mountain National Park should be considered, and the actual development of the industry in the region should be explored in depth.
This paper studied the calculation of the total value of ecosystem services in Qilian Mountain National Park (Gansu Area) from 2000 to 2019, which needs to be combined with the new framework of the environmental–economic accounting–ecosystem accounting (SEEA EA) officially adopted by the United Nations in 2021 and China 2020. The annual compilation of the gross ecosystem product (GEP) calculation guide further deepens the value research of ecosystems, and the value comparison of different internal regions should also be studied in depth.

Author Contributions

Conceptualization, L.P., X.C. and C.L.; methodology, L.P. and C.L.; software, L.P. and X.Y.; validation, X.C. and L.P.; resources, L.P.; data curation, L.P. and X.Y.; writing—original draft preparation, L.P. and X.Y.; writing—review and editing, L.P., X.Y. and C.L. All authors have read and agreed to the published version of the manuscript.

Funding

Open Project of Institute of County Economy Developments & Rural Revitalization Strategy, Lanzhou University (xyjj2019007).

Data Availability Statement

Not applicable.

Conflicts of Interest

The authors declare no conflict of interest.

References

  1. Yang, Q.; Wang, X.H. Evaluating relationship between water projects and ecological protection from the respect of Dujiang Weir. China Water Resour. 2020, 3, 22–24. [Google Scholar]
  2. Xu, L.L.; Yu, H. Research progress of international landscape evaluation, protection, and utilization of national parks and implications to China. Resour. Sci. 2022, 44, 1520–1532. [Google Scholar] [CrossRef]
  3. Wang, S.K.; Jiao, Y. On realization of the concept of ‘benefit to all’ in legislation on national parks. J. Southeast Univ. (Philos. Soc. Sci.) 2021, 23, 50–59. [Google Scholar]
  4. Qiu, X.; Xiao, Y.; Shi, L.; Wang, H.M.; Liu, Y.H.; Sun, H.L. Assessment of ecological conservation benefit in the Inner Mongolia based on ecological assets. Acta Ecol. Sin. 2022, 42, 5255–5263. [Google Scholar]
  5. Lv, Z.X.; Zhao, T.W. Pluralistic Co-governance System Construction of Qilian Mountain National Park. J. Northwest Minzu Univ. (Philos. Soc. Sci.) 2021, 4, 82–88. [Google Scholar]
  6. Chang, Z.Q.; Xu, B.L.; Wang, J.Y.; Chang, X.X.; Wang, Y.L. Forest Grazing Ecosystem and the Sustainable Management in Qilian Mountains. J. Northwest For. Univ. 2001, S1, 66–69. [Google Scholar]
  7. Wang, Y.Z.; Zeng, G. Research on the construction of the Silk Road Cultural Heritage Corridor from the spatial perspective—A case of Gansu section. World Reg. Stud. 2022, 31, 862–871. [Google Scholar]
  8. Dong, S.C.; Li, B.; Xue, M.; Li, Z.H. Comparative analysis and discussion on tourism development between Gansu and six neighboring provinces and regions. Gansu Soc. Sci. 2008, 1, 240–243. [Google Scholar]
  9. Daily, G.C. Nature’s Service: Societal Dependence on Natural Ecosystems, 4th ed.; Island Press: Washington, DC, USA, 1997; pp. 49–68. [Google Scholar]
  10. Xie, G.D.; Xiao, Y.; Zhen, L.; Lu, C.X. Study on ecosystem services value of food production in China. Chin. J. Eco-Agric. 2005, 3, 10–13. [Google Scholar]
  11. Wen, Y.L.; Zhang, X.L.; Wei, J.H.; Wang, X.L.; Cai, Y.J. Temporal and spatial variation of ecosystem service value and its trade-offs and synergies in the peripheral region of the Poyang Lake. Sci. Geogr. Sin. 2022, 42, 1229–1238. [Google Scholar]
  12. Yang, Y.T.; Yin, Y.; Jiang, K.D. Ecological security pattern planning of coastal zone in Maoming city from land-sea integration perspectives. Mar. Environ. Sci. 2022, 41, 705–713. [Google Scholar]
  13. Ouyang, Z.Y.; Wang, X.K.; Miao, H. A primary study on Chinese terrestrial ecosystem services and their ecological-economic values. Acta Ecol. Sin. 1999, 19, 19–25. [Google Scholar]
  14. Frelichova, J.; Vackar, D.; Lorencova, E. Integrated assessment of ecosystem services in the Czech Republic. Ecosyst. Serv. 2014, 8, 110–117. [Google Scholar] [CrossRef]
  15. Costanza, R.; d’Arge, R.; DeGroot, R.; Farber, S.; Grasso, M.; Hannon, B.; Limburg, K.; Naeem, S.; ONeill, R.V.; Paruelo, J.; et al. The value of the world’s ecosystem services and natural capital. Nature 1997, 387, 253–260. [Google Scholar] [CrossRef]
  16. DeGroot, R.S.; Wilson, M.A.; Boumans, R.M. A typology for the classification, description and valuation of ecosystem functions, goods and services. Ecol. Econ. 2002, 41, 393–408. [Google Scholar] [CrossRef] [Green Version]
  17. Small, N.; Munday, M.; Durance, I. The challenge of valuing ecosystem services that have no material benefits. Glob. Environ. Chang.-Hum. Policy Dimens. 2017, 44, 57–67. [Google Scholar] [CrossRef]
  18. Grabowski, J.H.; Brumbaugh, R.D.; Conrad, R.F.; Keeler, A.G.; Opaluch, J.J.; Peterson, C.H.; Piehler, M.F.; Powers, S.P.; Smyth, A.R. Economic Valuation of Ecosystem Services Provided by Oyster Reefs. Bioscience 2012, 62, 900–909. [Google Scholar] [CrossRef] [Green Version]
  19. Ding, M.M.; Liu, W.; Xiao, L.; Zhong, F.X.; Lu, N.; Zhang, J.; Zhang, Z.H.; Xu, X.L.; Wang, K.L. Construction and optimization strategy of ecological security pattern in a rapidly urbanizing region: A case study in central-south China. Ecol. Indic. 2022, 136, 108604. [Google Scholar] [CrossRef]
  20. Morshed, S.R.; Fattah, M.A.; Haque, M.N.; Morshed, S.Y. Future ecosystem service value modeling with land cover dynamics by using machine learning based Artificial Neural Network model for Jashore city, Bangladesh. Phys. Chem. Earth 2022, 126, 103021. [Google Scholar] [CrossRef]
  21. Sutton, P.C.; Duncan, S.L.; Anderson, S.J. Valuing Our National Parks: An Ecological Economics Perspective. Land 2019, 8, 54. [Google Scholar] [CrossRef] [Green Version]
  22. Chan, K.M.A.; Satterfield, T.; Goldstein, J. Rethinking ecosystem services to better address and navigate cultural values. Ecol. Econ. 2012, 74, 8–18. [Google Scholar] [CrossRef]
  23. Castro, A.J.; Verburg, P.H.; Martin-Lopez, B.; Garcia-Llorente, M.; Cabello, J.; Vaughn, C.; Lopez, E. Ecosystem service trade-offs from supply to social demand: A landscape-scale spatial analysis. Landsc. Urban Plan. 2014, 132, 102–110. [Google Scholar] [CrossRef]
  24. Zeng, Y.X.; Zhong, L.S.; Yu, H.; Zhou, B. The structure of recreational ecosystem services: A case study of the Sanjiangyuan National Park. Acta Ecol. Sin. 2022, 42, 5653–5664. [Google Scholar]
  25. Li, J.H.; Huang, L.; Cao, W.; Wu, D. Accounting of gains and losses of ecological assets in counties of key ecological function regions in Yangtze River Delta. J. Nat. Resour. 2022, 37, 1946–1960. [Google Scholar] [CrossRef]
  26. Guo, F.Y.; Tong, L.J.; Qiu, F.D.; Li, Y.M. Spatio-temporal differentiation characteristics and influencing factors of green development in the eco-economic corridor of the Yellow River Basin. Acta Geogr. Sin. 2021, 76, 726–739. [Google Scholar]
  27. Lu, C.P.; Hou, M.C.; Liu, Z.L.; Li, H.J.; Lu, C.Y. Variation Characteristic of NDVI and its Response to Climate Change in the Middle and Upper Reaches of Yellow River Basin, China. IEEE J. Sel. Top. Appl. Earth Obs. Remote Sens. 2021, 14, 8484–8496. [Google Scholar] [CrossRef]
  28. Wang, S.L.; Qu, Y.B.; Zong, H.N.; Zhang, Y.J.; Guan, M.; Zhang, Y. Research on multi-dimensional decomposition and conduction path of territory spatial pattern at the municipal level. J. Nat. Resour. 2022, 37, 2803–2818. [Google Scholar] [CrossRef]
  29. Wu, D.T.; Wang, X.; Liu, H.H.; Hu, J.; Wang, G.Q. Building a National Park System Based on World Natural Heritage Sites. Study Nat. Cult. Herit. 2022, 7, 61–70. [Google Scholar]
  30. Fan, Z.L.; Li, N.; Li, W.M. Assessment of ecosystem service value in Qilian Mountain National Park, Gansu Province. Contemp. Econ. 2021, 12, 70–77. [Google Scholar]
  31. Wang, Z.Y.; Shi, P.J.; Zhang, X.B.; Yao, L.T.; Tong, H.L. Grid-scale-based ecological security assessment and ecological restoration: A case study of Suzhou district, Jiuquan. J. Nat. Resour. 2022, 37, 2736–2749. [Google Scholar]
  32. Su, J.D.; Pu, J.L.; Li, G.X.; Zhao, X.J. Study on ecosystem benefit evaluation of Qilian Mountains National Nature Reserve of Gansu Province. Ecol. Sci. 2021, 40, 89–94. [Google Scholar]
  33. Zhang, C.Y.; Bai, Y.P.; Yang, X.D.; Li, L.W.; Liang, J.S.; Wang, Q.; Chen, Z.J. Identification of ecosystem service bundles in Ningxia Plain under multi-scenario simulation. Geogr. Res. 2022, 41, 3364–3382. [Google Scholar]
  34. Zhang, N.L. Dynamic Changes of Land Use and Ecosystem Services Value in Altai Mountains. Chin. J. Soil Sci. 2022, 53, 1286–1294. [Google Scholar]
  35. Wang, J.; Zhou, S.K.; Meng, F.L.; Zhang, L. Impacts of Land Use Evolution on the Evaluation of Ecosystem Service Value and Temporal Variation in the Lugu Lake Basin. J. West China For. Sci. 2022, 51, 34–42. [Google Scholar]
  36. Cheng, G.B.; Ju, X.Q. Response of Ecosystem Service Value to Land Use Change Based on RS and GIS Technology: Taking Urumqi City Circle as an Example. J. Nat. Resour. 2021, 37, 169–175. [Google Scholar]
  37. Zhu, H.; Li, X. Discussion on the Index Method of Regional Land Use Change. Acta Geogr. Sin. 2003, 58, 643–650. [Google Scholar]
  38. Tan, Z.; Guan, Q.Y.; Lin, J.K.; Yang, L.Q.; Luo, H.P.; Ma, Y.R.; Tian, J.; Wang, Q.Z.; Wang, N. The response and simulation of ecosystem services value to land use/land cover in an oasis, Northwest China. Ecol. Indic. 2020, 118, 106711. [Google Scholar] [CrossRef]
  39. Xie, G.D.; Zhen, L.; Lu, C.X.; Xiao, Y.; Chen, C. Expert Knowledge Based Valuation Method of Ecosystem Services in China. J. Nat. Resour. 2008, 5, 911–919. [Google Scholar]
  40. Sutton, P.C.; Costanza, R. Global estimates of market and non-market values derived from nighttime satellite imagery, land cover, and ecosystem service valuation. Ecol. Econ. 2002, 41, 509–527. [Google Scholar] [CrossRef]
  41. Xie, G.D.; Lu, C.X.; Cheng, S.K. Progress in Evaluating the Global Ecosystem services. Resour. Sci. 2001, 6, 5–9. [Google Scholar]
  42. Zhang, F.; Yusufujiang, R.S.L.; Aierken, T.E.S. Spatio-temporal change of ecosystem service value in Bosten Lake Watershed based on land use. Acta Ecol. Sin. 2021, 41, 5254–5265. [Google Scholar]
  43. Huang, M.Y.; Fang, B.; Yue, W.Z.; Feng, S.R. Spatial differentiation of ecosystem service values and its geographical detection in Chaohu Basin during 1995–2017. Geogr. Res. 2019, 38, 2790–2803. [Google Scholar]
  44. Zhuang, D.F.; Liu, J.Y. Study on the Model of Regional of differentiation of Land Use Degree in China. J. Nat. Resour. 1997, 2, 10–16. [Google Scholar]
  45. Wang, Z.F.; Xu, J. Impacts of land use evolution on ecosystem service value of national parks: Take Sanjiangyuan National Park as an example. Acta Ecol. Sin. 2022, 42, 6948–6958. [Google Scholar]
  46. Zheng, D.F.; Hao, S.; Lv, L.T.; Xu, W.J.; Wang, Y.Y.; Wang, H. Spatial-temporal change and trade-off/synergy relationships among multiple ecosystem services in Three-River-Source National Park. Geogr. Res. 2020, 39, 64–78. [Google Scholar]
  47. Wu, P.; Zhang, H. Assessment of Appropriate Standards for Ecological Compensation in Sanjiangyuan National Park: Based on the Perspective of Value Supply of Ecosystem Services. Qinghai Soc. Sci. 2022, 1, 50–58. [Google Scholar]
Figure 1. Location of the study area.
Land 12 00201 g001
Figure 2. Flow chart. Based on the background of the construction of a community with a shared future for man and nature with Chinese characteristics, relying on the construction of the main body of national parks, highlighting the relationship between ecological economic development and ecosystem protection and utilization, calculating the value of ecosystem services through the equivalent factor of ecosystem services, maximizing the benefits of the four major ecosystem service functions of supply, regulation, support and culture, and analyzing the changing characteristics and trends of the four, and then putting forward countermeasures and suggestions for the construction of an industrial system dominated by national parks.
Land 12 00201 g002
Figure 3. Land use status of Qilian Mountain National Park (Gansu Area) from 2000 to 2019. a-e represent the current status of land use in 2000, 2005, 2010, 2015, and 2019, respectively.
Land 12 00201 g003
Figure 4. Value characteristics of land ecosystem services in Qilian Mountain National Park (Gansu area), 2000–2019. (ae) represent the value characteristics of land ecosystem services in 2000, 2005, 2010, 2015, and 2019, respectively. I–V mainly represent the intensity ranking of the total value of ecosystem services from low to high, classified according to the five-level natural fracture method in ArcGIS software.
Land 12 00201 g004
Figure 5. Industrial system construction diagram.
Land 12 00201 g005
Table 1. Statistics of major indicators of Qilian Mountain National Park (Gansu Area) in 2019.
County
(District)
Major Indicators
Area 1Population 2GDPValue of the PrimaryValue of the SecondaryValue of the Tertiary OutputFixed Investment
sq. km.tpBillion USDBillion USDBillion USDBillion USDBillion USD
Subei mongolian prefecture66715.10.2360.0160.0990.1210.6
Akesai kazak autonomous county31411.00.1490.0120.0460.0910.416
Minle county37192.50.8510.2750.1630.4130.793
Yongchang county74177.61.130.2630.3030.5640.451
Tianzhu tibetan autonomous county711510.6630.170.1270.3660.552
Liangzhou district49885.34.5591.1270.7882.6442.368
Sunan Yugur Autonomous County20227.80.3860.1010.1150.170.158
Total1232.21460.37.9741.9641.6414.3695.338
1. sq. km.: Square kilometer. The data are mainly from the official websites of seven county (district) governments. 2. Population data are the seventh national census. “tp” represents “thousand people”.
Table 2. Changes in land use area and proportion of Qilian Mountain National Park (Gansu Area) from 2000 to 2019 (units: hm2, %).
Land Use TypesArea and Proportion2000–2019
Rate of Change/%
Dynamics of Single Land Use/%
20002005201020152019
Farmland9324.2712,627.639274.599231.308717.04−6.51−0.02
0.31%0.40%0.30%0.30%0.28%
Forestland158,374.26457,176.42164,074.86319,009.05350,380.26121.240.30
5.18%14.66%5.26%10.2883%11.37%
Grassland1,786,700.071,166,820.211,613,574.541,468,309.321,489,829.58−16.62−0.04
58.47%37.42%51.72%47.35%48.34%
Water16,695.9017,494.116078.24113,096.977452.81−55.36−0.14
0.55%0.56%0.19%3.65%0.24%
Built-up area46.0858.4122.5988.47147.60220.310.55
0.0015%0.0019%0.0007%0.0029%0.0048%
Unused land1,075,888.261,389,957.391,219,935.601,103,931.091,122,641.014.350.01
35.21%44.57%39.11%35.60%36.43%
Glacial snow8892.7274,350.26106,632.4587,024.51102,892.681057.042.64
0.29%2.38%3.42%2.81%3.34%
Table 3. Assignment table for land use intensity ratings.
Unused Land (Glacial Snow)WaterForestland (Grassland)FarmlandBuilt-Up Area
Degree of land use12345
Table 4. Land use intensity and rate of change in Qilian Mountain National Park (Gansu Area).
Land Use Intensity IndexAmount of Change in the Land
Use Intensity Index
Rate of Change in Land Use Intensity
20002.2877
20052.0594−0.2283−9.98%
20102.15060.09124.43%
20152.19840.04782.22%
20192.20520.00690.31%
Table 5. Contribution rate of land use intensity by land type in Qilian Mountain National Park (Gansu Area).
FarmlandForestlandGrasslandWaterBuilt-Up AreaUnused LandGlacial Snow
2000–20050.32711.8288−0.36000.02680.24210.26607.1931
2005–2010−0.2658−0.64120.3824−0.6527−0.6134−0.12260.4337
2010–20150.00140.9561−0.084517.72032.9402−0.0896−0.1789
2015–2019−0.05000.10500.0208−0.93370.67840.02310.1895
2000–2019−0.07311.1936−0.1732−0.55742.17600.034610.4723
Table 6. The total value and proportion of ecosystem services of each land type in Qilian Mountain National Park (Gansu Area) and the corresponding changes.
Total Value of the Service and Percentage
20002005201020152019
Farmland0.48440.09%1.22630.14%1.99250.10%2.28980.06%1.34880.09%
Forestland46.72408.62%252.086327.94%200.16019.91%449.328912.76%307.854620.08%
Grassland455.816184.08%556.355161.65%1702.186884.26%1788.387250.79%1131.944973.87%
Water37.90626.99%74.23398.22%57.06352.82%1225.907634.81%50.39323.29%
Unused land0.00070.01%0.00160.01%0.00130.01%0.00610.01%0.00620.01%
Glacial snow1.18330.21%18.49072.04%58.67232.90%55.28531.57%40.77542.66%
Total542.1147100%902.3941100%2020.0764100%3521.2048100%1532.3232100%
Amount of Change
2000–20052005–20102010–20152015–20192000–2019
Farmland0.74170.76640.2972−0.94110.8644
Forestland205.3623−51.9262249.1688−141.4742261.1306
Grassland100.53901145.831586.2005−656.4423676.1288
Water36.3277−17.17041168.8439−1175.514412.4869
Unused land0.0009−0.00030.00460.00030.0057
Glacial snow17.307540.1814−3.3868−14.510039.5920
Total360.27941117.68231501.1284−1988.8816990.2085
Table 7. Total value and proportion of ecosystem services by land type in Qilian Mountain National Park (Gansu Area) and the corresponding changes (billion USD %).
Service FeaturesSupply ServicesConditioning ServicesSupport ServicesCultural Services
200034.8308356.9154125.012525.3560
6.4265.8423.064.68
200560.1541599.3683203.683039.1886
6.6766.4222.574.34
2010137.22451323.3005466.652192.8994
6.7965.5123.14.6
2015238.66772489.8058642.5233150.2079
6.7870.7118.254.27
2019103.16541005.6898354.911068.5569
6.7365.6323.164.47
2000–2019
Amount/rate of change
68.334668.334668.334668.3346
196.19%181.77%183.90%170.38%
Table 8. Total value of ecosystem services by land type in Qilian Mountain National Park (Gansu Area) and the corresponding proportion (billion USD %).
Service FeaturesIndividual Service Features20002005201020152019Amount of Change (2000–2019)Rate of Change (2000–2019)
Supply servicesFood production9.663314.679136.190345.244726.492516.8292174.16%
1.78%1.63%1.79%1.28%1.73%
Raw material production14.627024.115255.089470.209642.137427.5105188.08%
2.70%2.67%2.73%1.99%2.75%
Water supply10.540521.359945.9448123.213434.535523.9950227.65%
1.94%2.37%2.27%3.50%2.25%
Subtotal34.830860.1541137.2245238.6677103.165468.3346196.19%
Conditioning servicesGas conditioning51.106383.3408193.1937245.3344146.732995.6266187.11%
9.43%9.24%9.56%6.97%9.58%
Climate comfort136.0364227.8777516.8104644.0117398.0173261.9808192.58%
25.09%25.25%25.58%18.29%25.97%
Clean-up operation45.910974.8265170.1298260.4256129.087183.1762181.17%
8.47%8.29%8.42%7.40%8.42%
Soil–water regulation123.861814,713.7630,566.9792,427.5222,889.1914,345.9491167.92%
22.85%23.64%21.94%38.06%21.66%
Subtotal356.9154599.36831323.302489.8061005.69648.7744181.77%
Support servicesSoil conservation62.2532101.1645234.1863297.6786177.9187115.6654185.80%
22.85%23.64%21.94%38.06%21.66%
Nutrient cycling4.68707.664317.635822.507813.43478.7477186.64%
0.86%0.85%0.87%0.64%0.88%
Diversity58.072494.8543214.8300322.3370163.5577105.4854181.64%
10.71%10.51%10.63%9.15%10.67%
Subtotal125.0125203.6830466.6521642.5233354.9110229.89851.8390
Cultural servicesAesthetic landscape25.356039.188692.8994150.207968.556943.2010170.38%
4.68%4.34%4.60%4.27%4.47%
Subtotal25.356039.188692.8994150.207968.556943.2010170.38%
Table 9. Ecosystem service value sensitivity index by land type in Qilian Mountain National Park (Gansu Area).
Amount of Change
20002005201020152019
Farmland (VC ± 50%)0.000890.001360.000990.000650.00088
Forestland (VC ± 50%)0.086190.279350.099090.127610.20091
Grassland (VC ± 50%)0.840810.616530.842630.507890.73871
Water (VC ± 50%)0.069920.082260.028250.348150.03289
Unused land (VC ± 50%)0.000000.000000.000000.000000.00000
Glacial snow (VC ± 50%)0.000000.000000.000000.000000.00000
Disclaimer/Publisher’s Note: The statements, opinions and data contained in all publications are solely those of the individual author(s) and contributor(s) and not of MDPI and/or the editor(s). MDPI and/or the editor(s) disclaim responsibility for any injury to people or property resulting from any ideas, methods, instructions or products referred to in the content.

