
Impact of Climate Change on the Ground Thermal Regime in the Lower Lena Region, Arctic Central Siberia
 , ,
, ,
Abstract
:1. Introduction
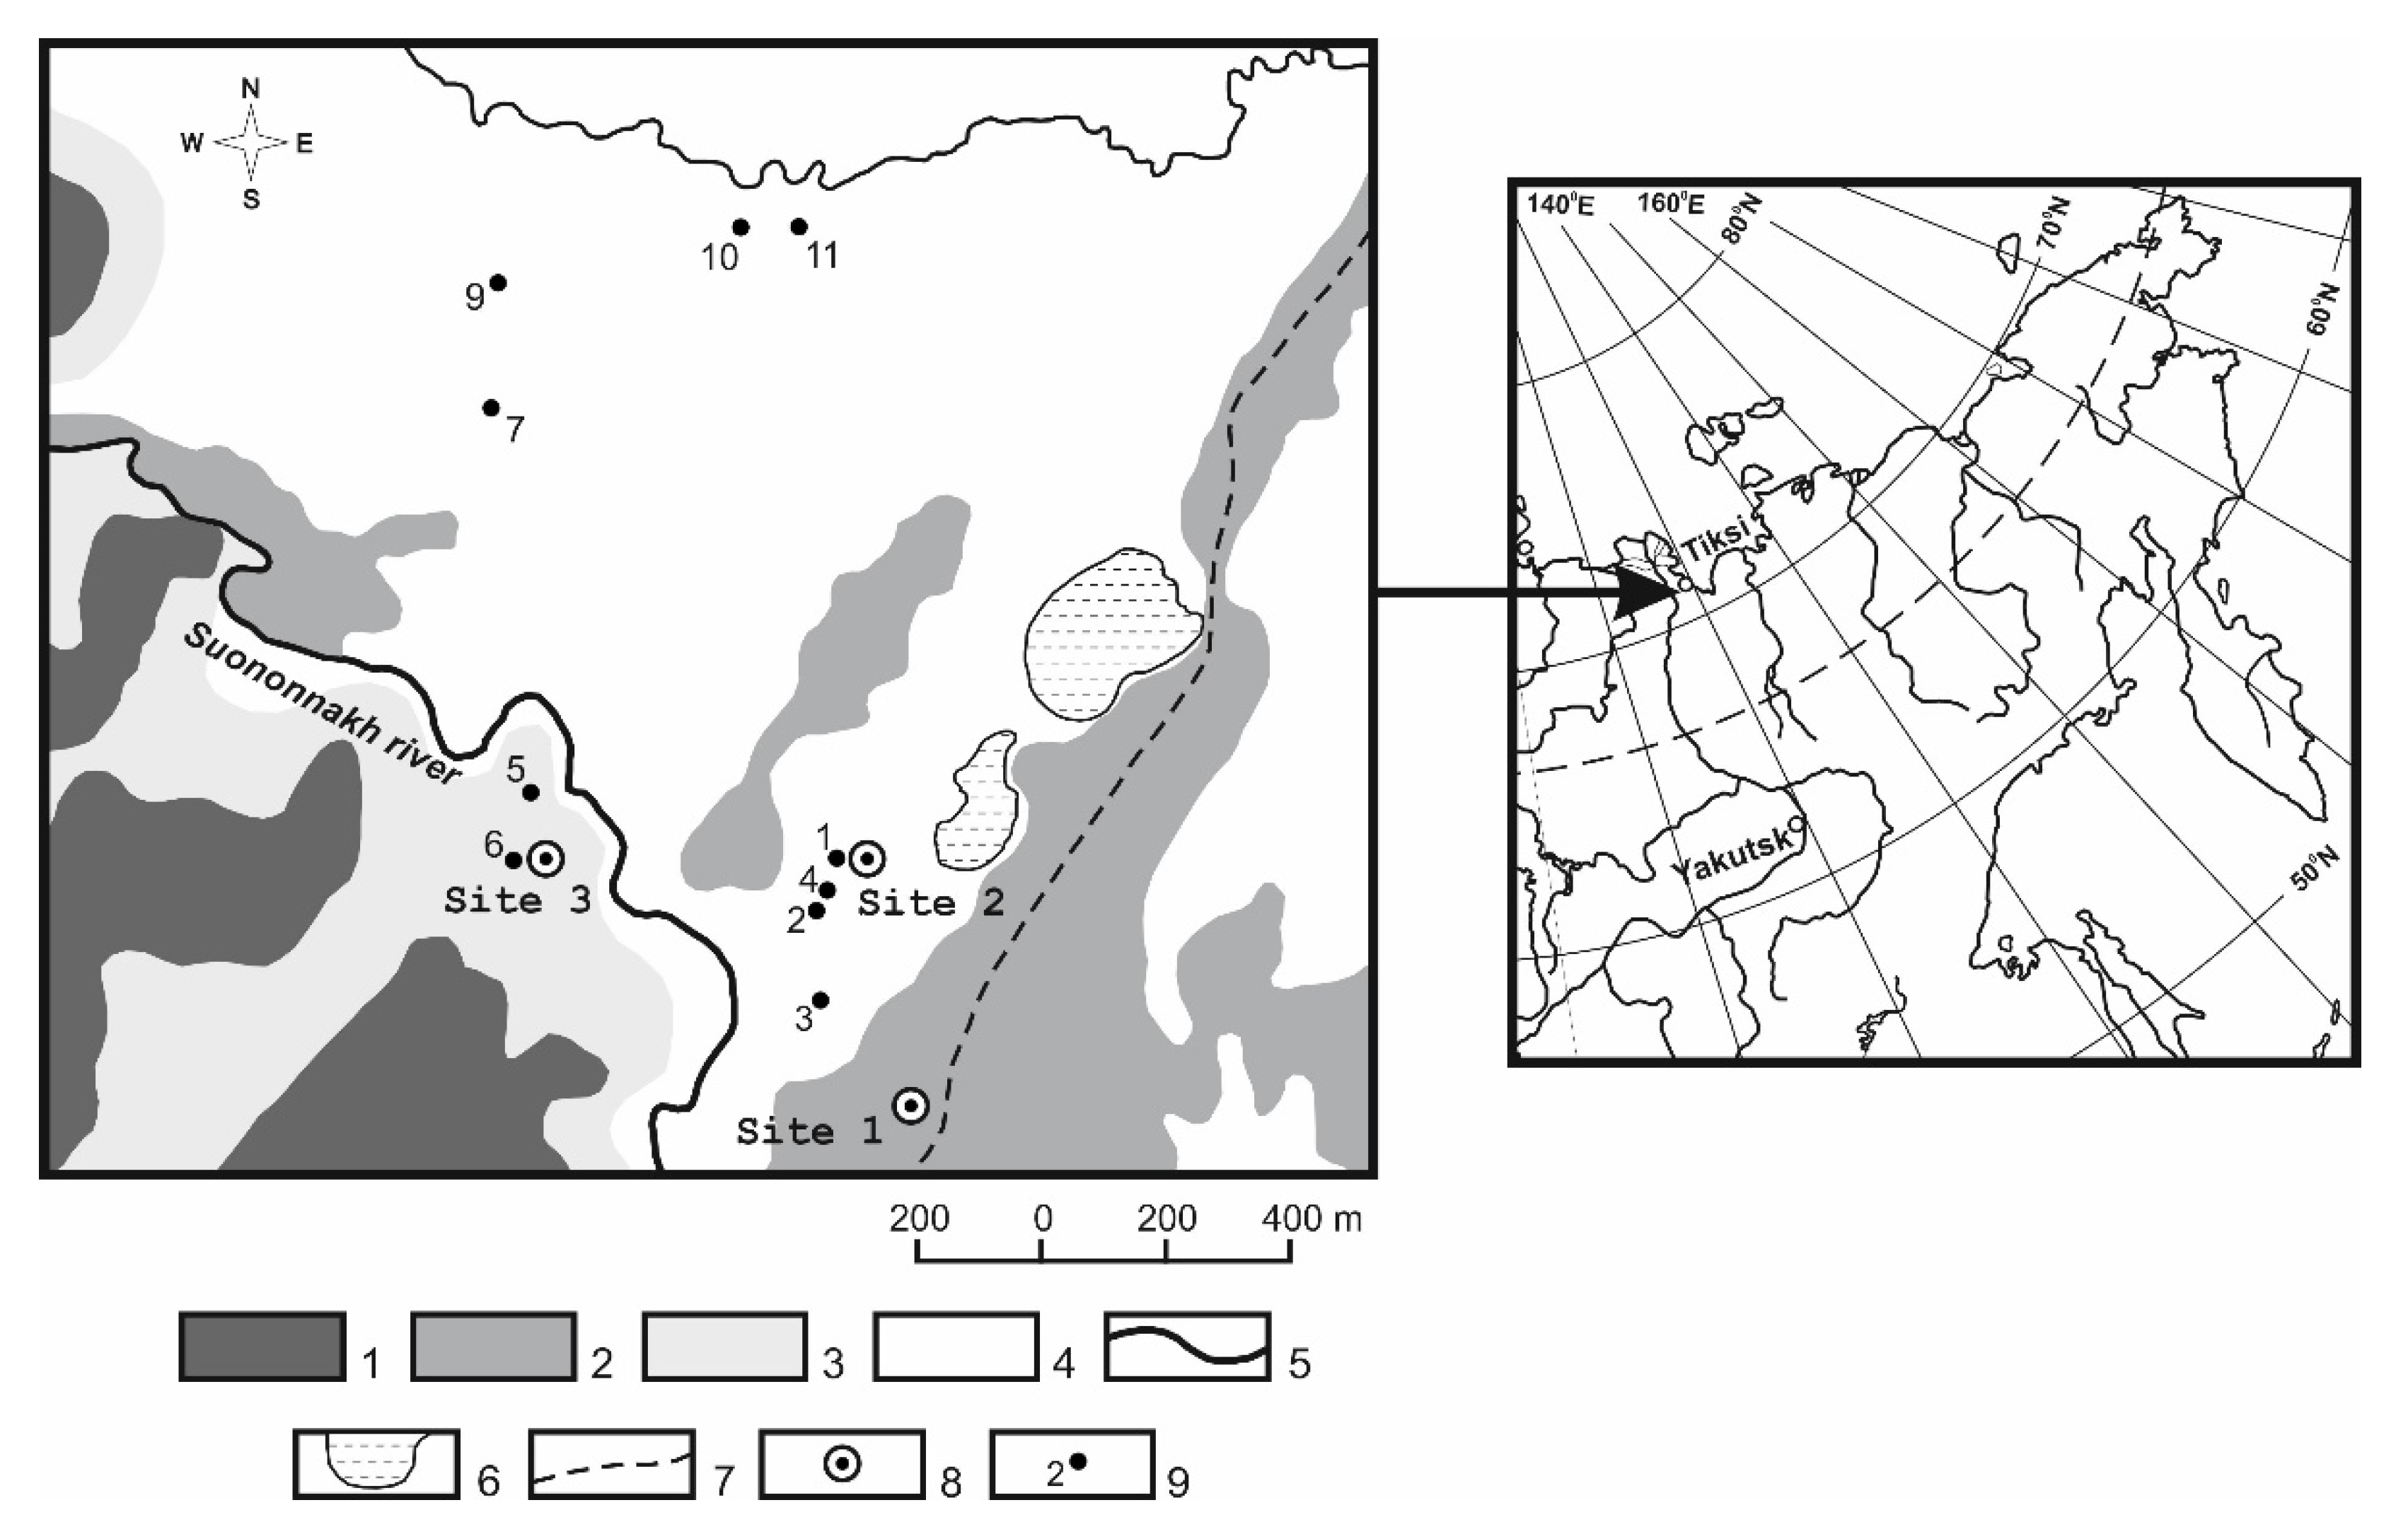
2. Study Area
3. Monitoring Sites and Methods
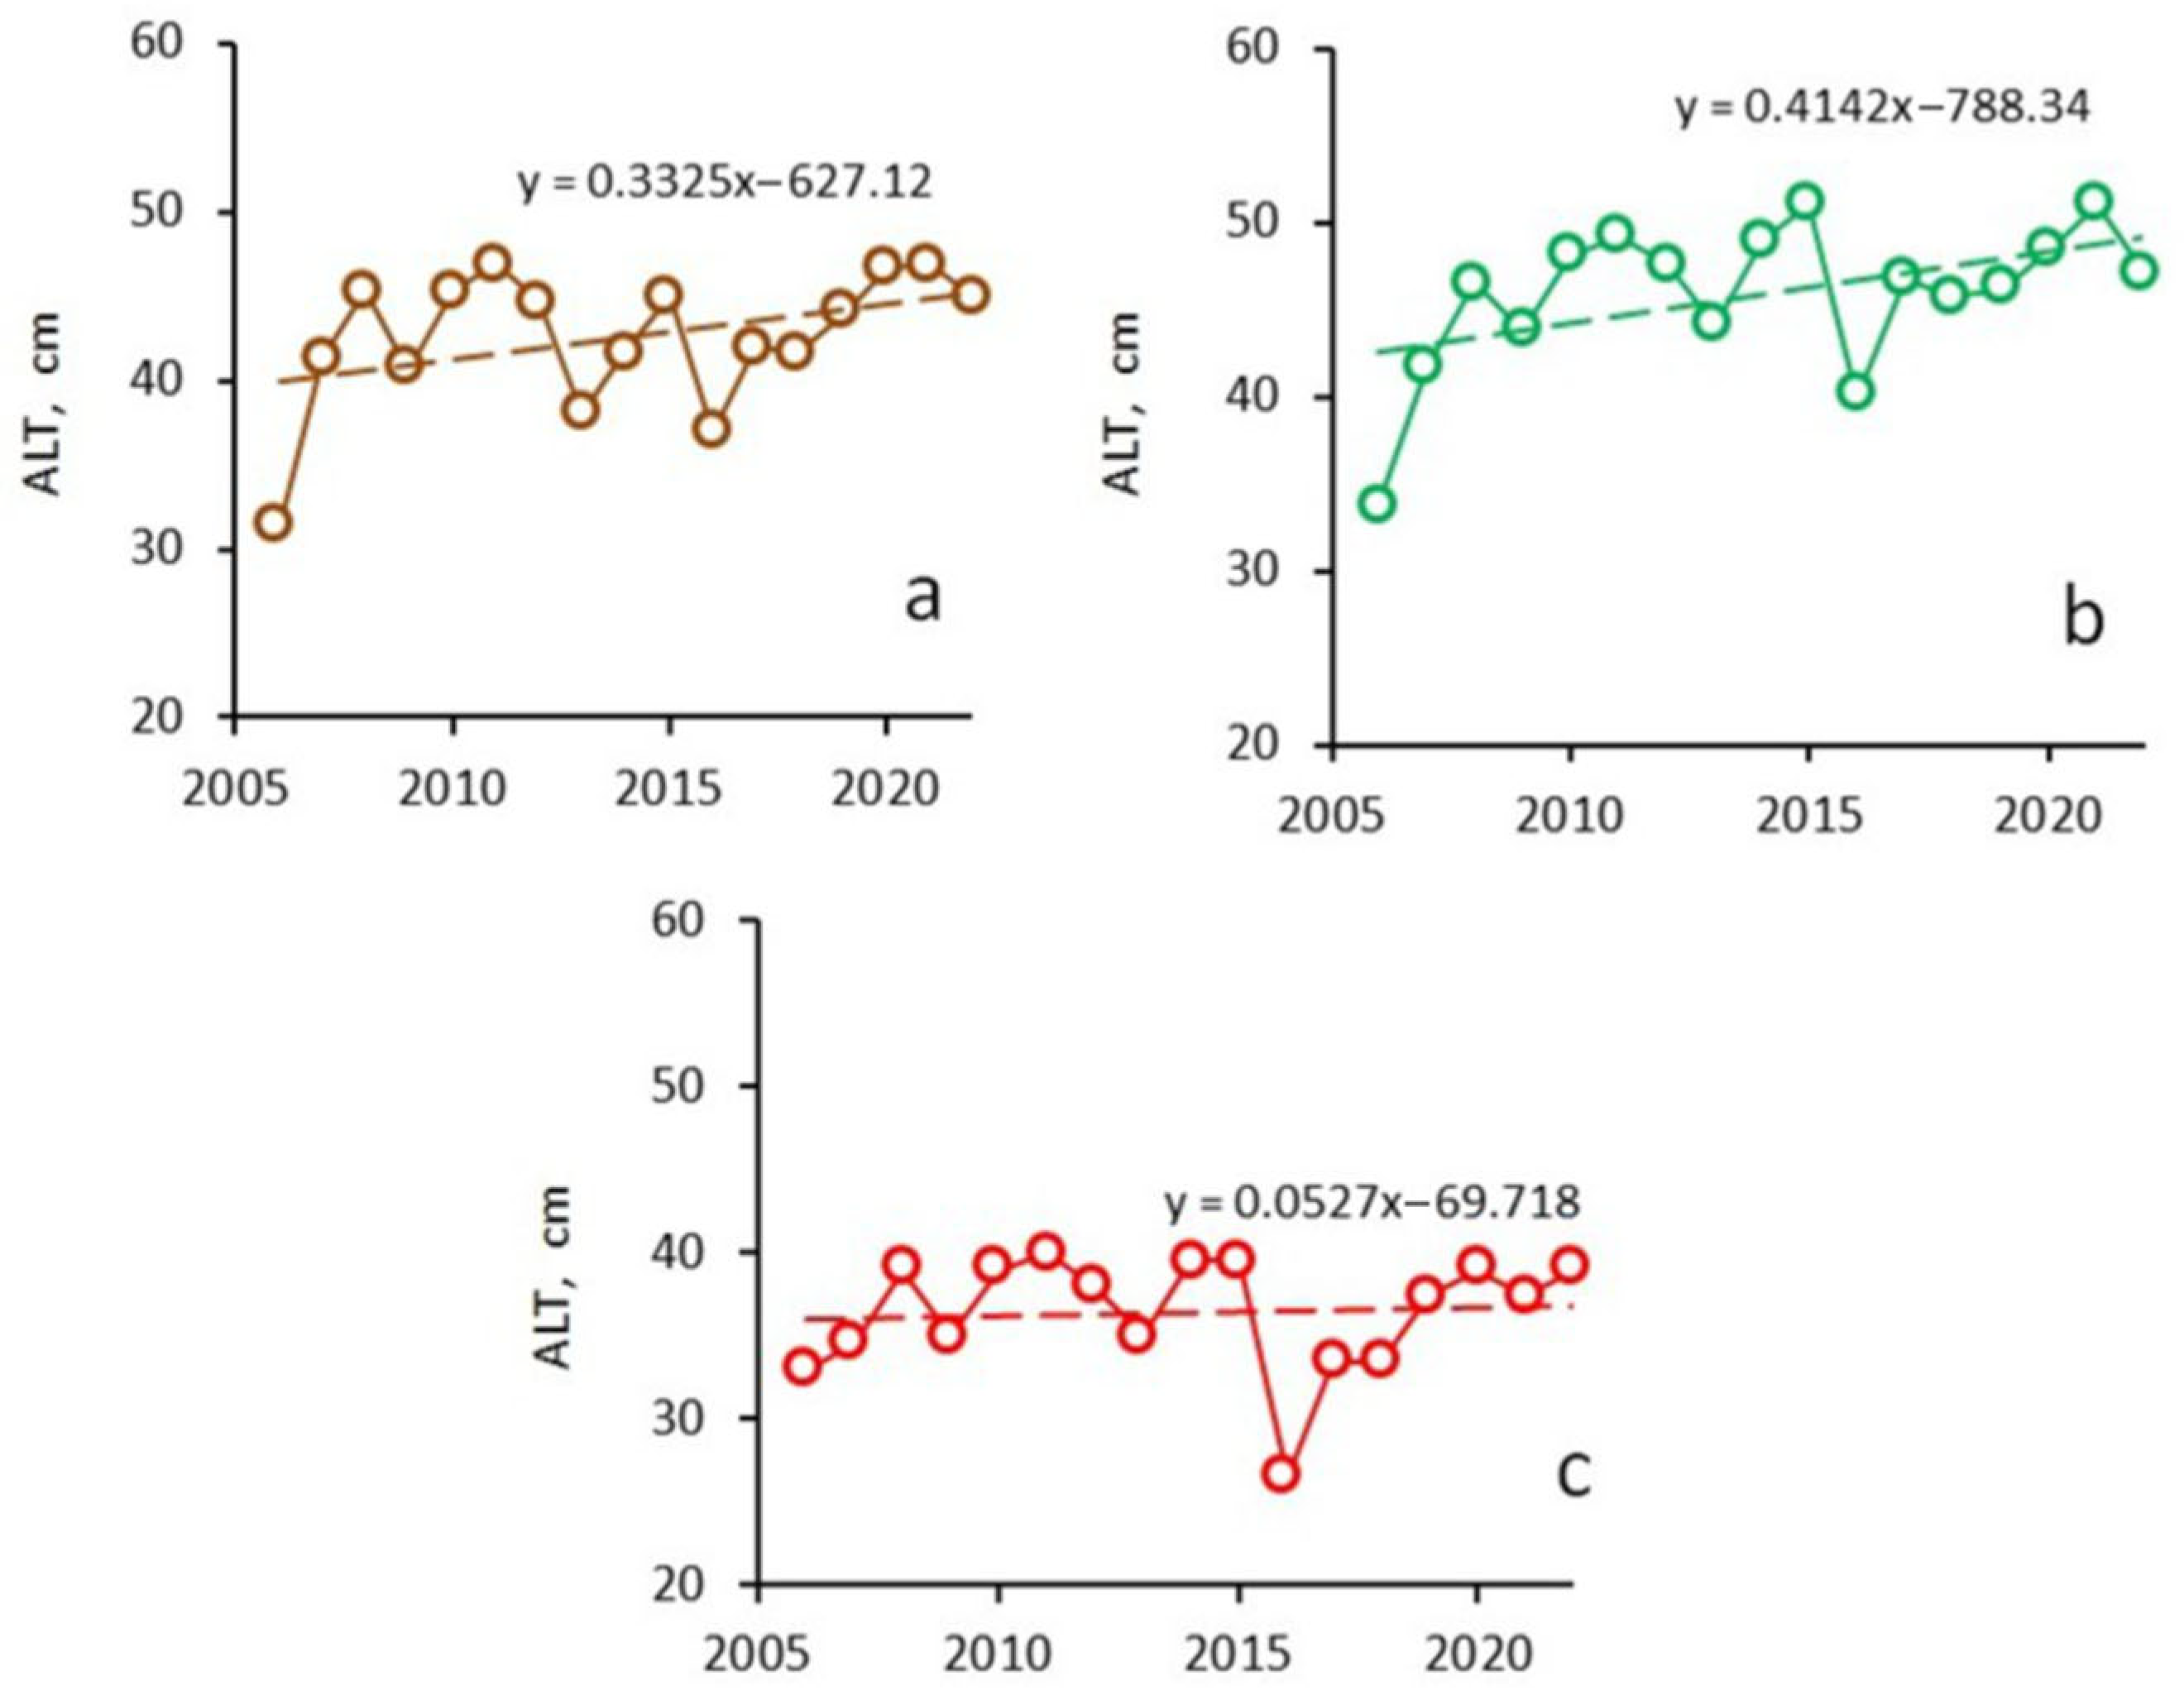
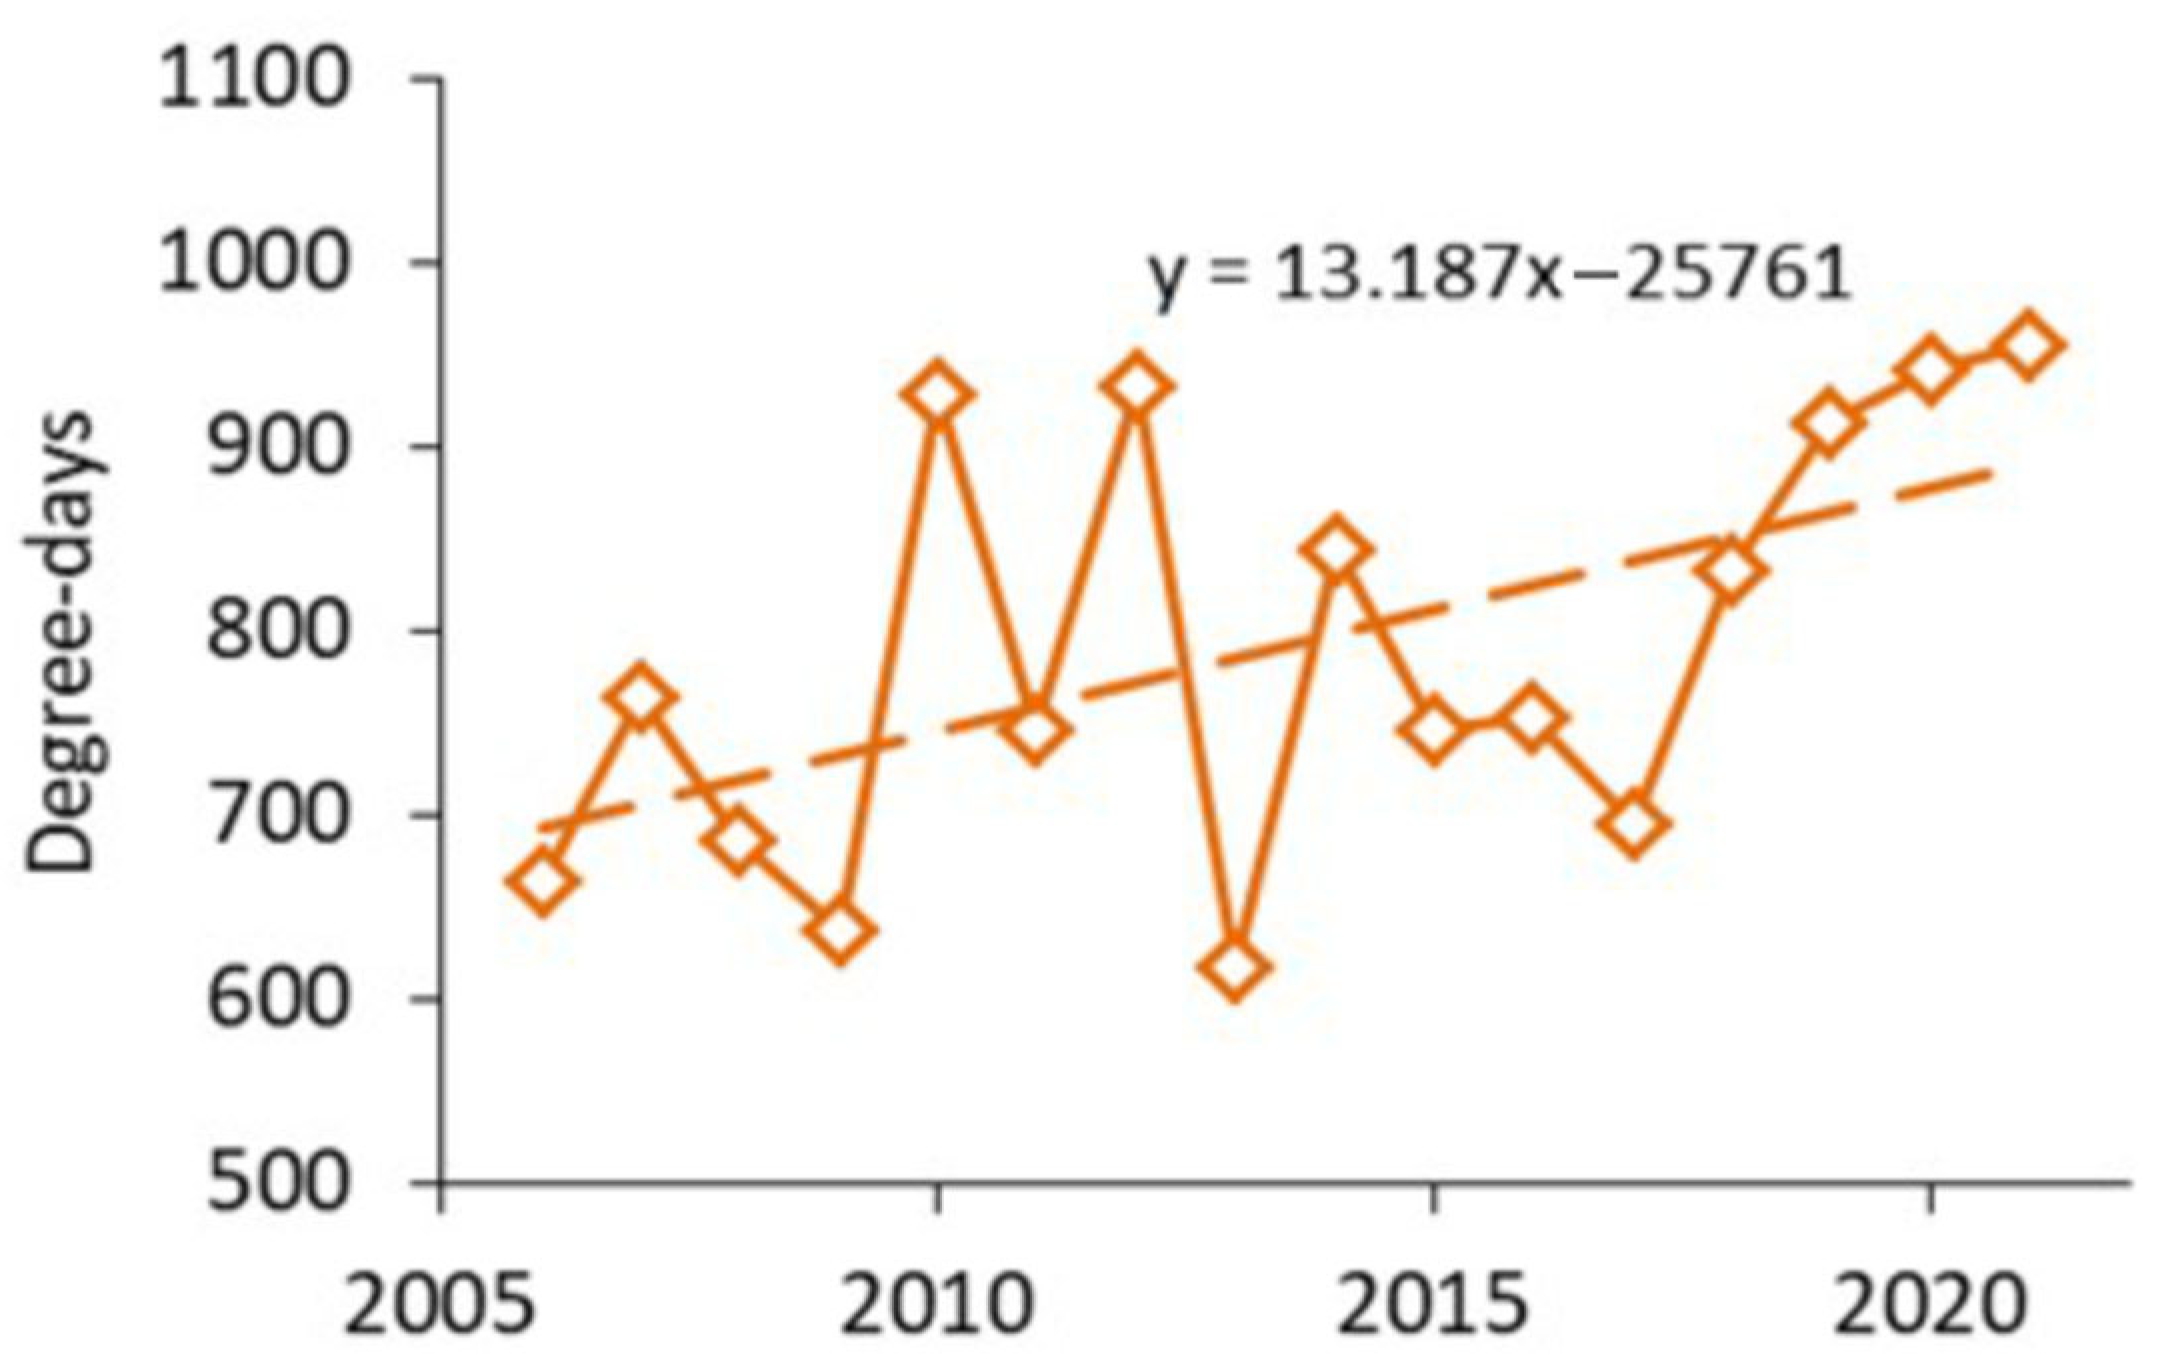
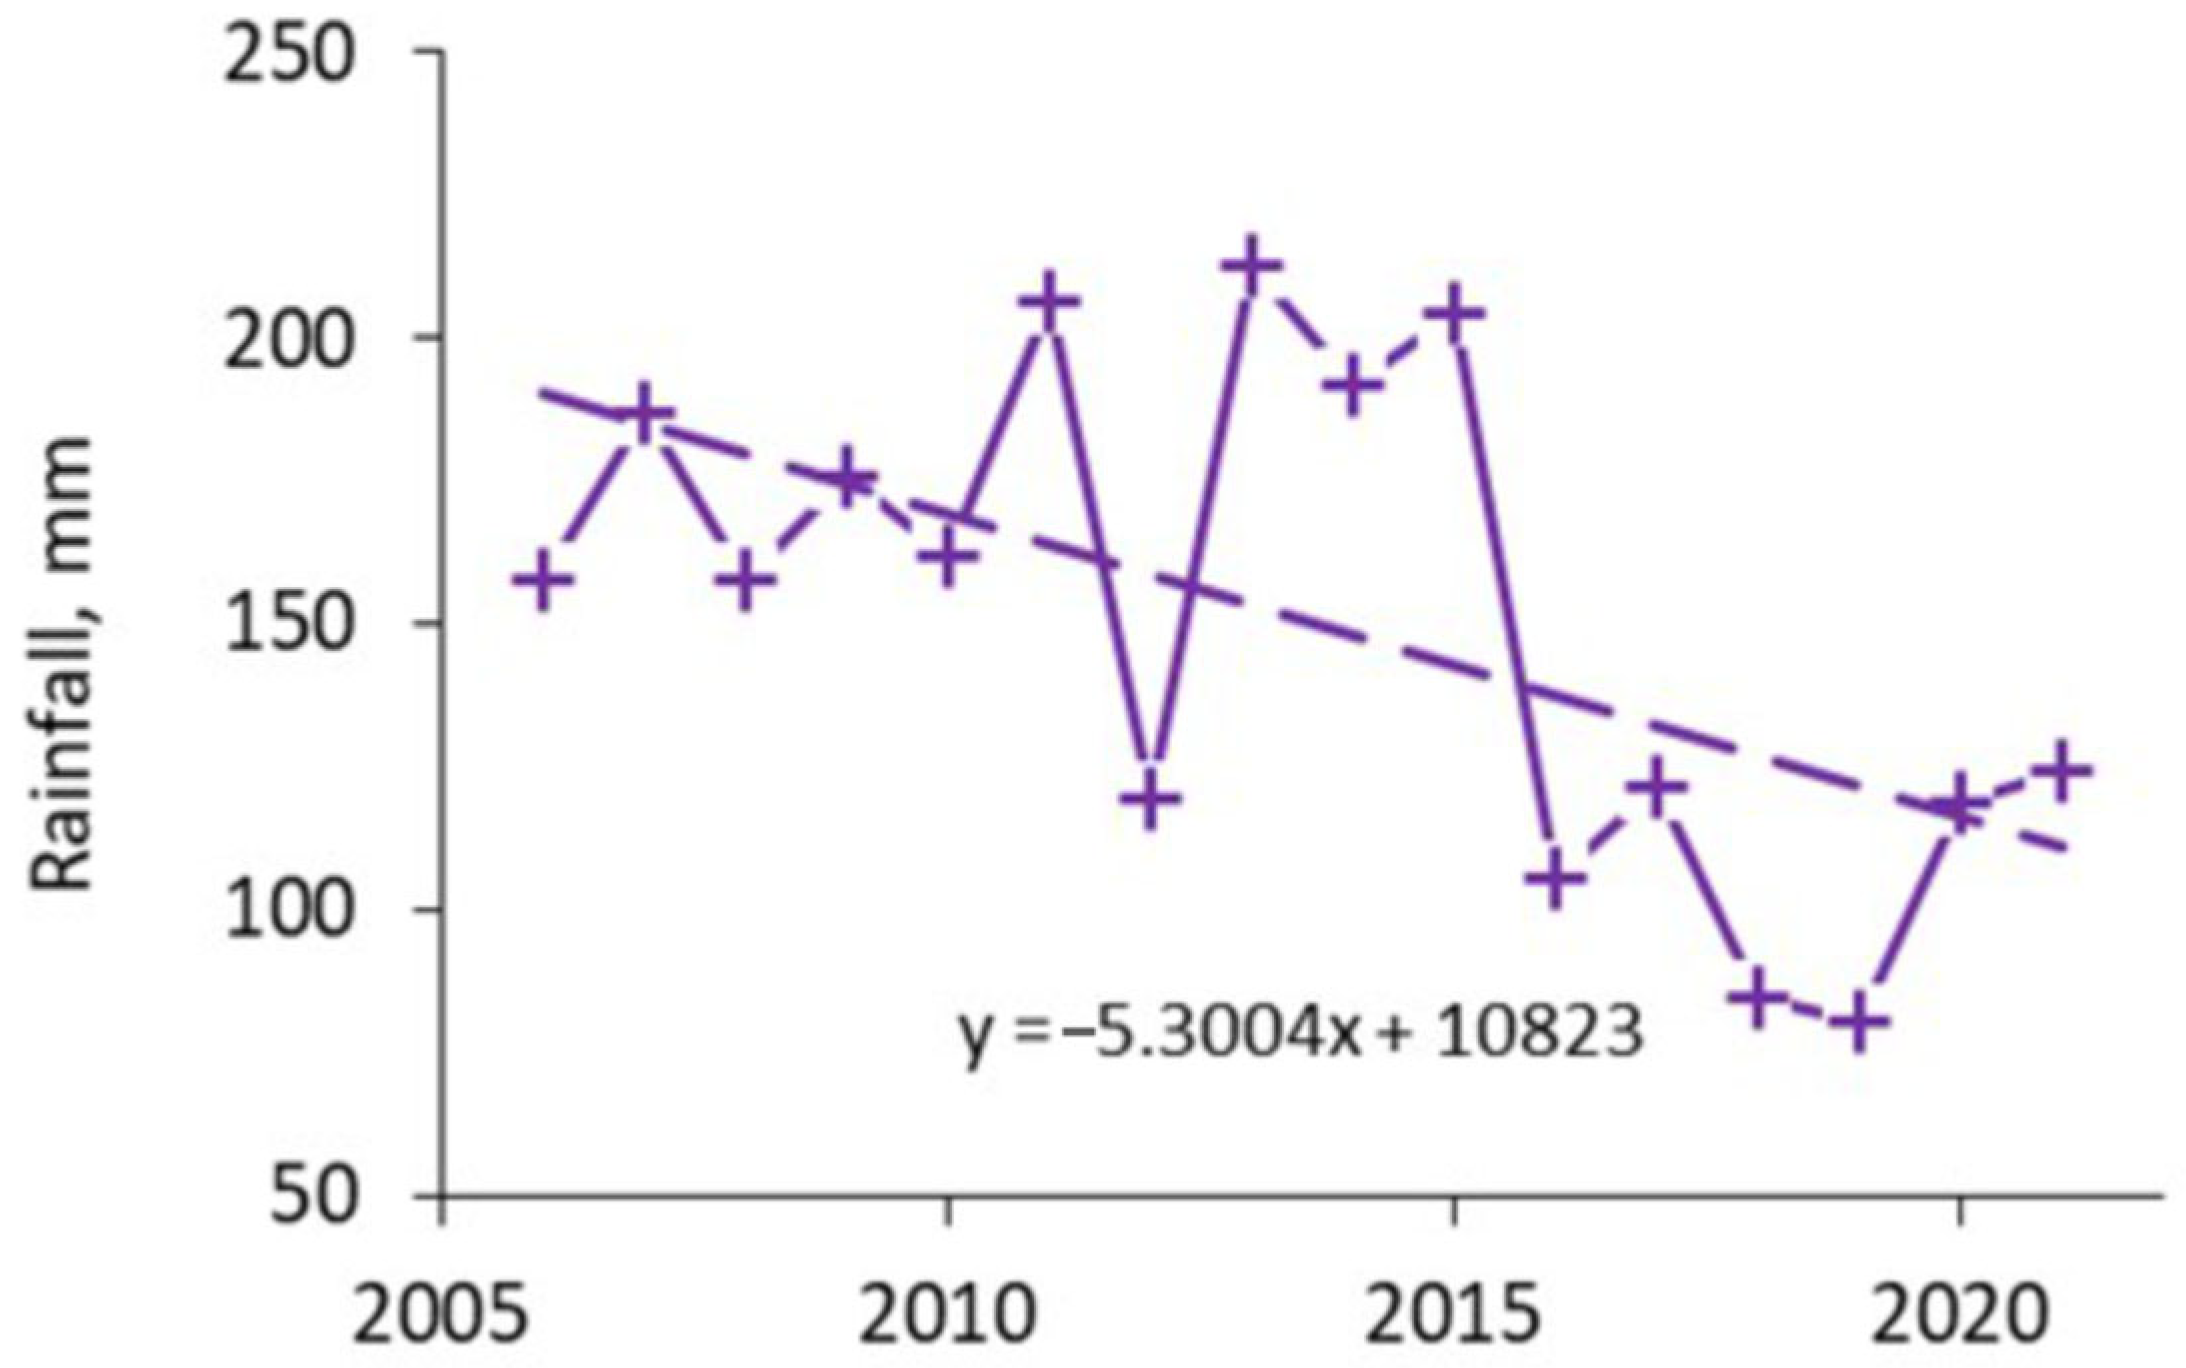
4. Results and Discussion
5. Conclusions
Author Contributions
Funding
Data Availability Statement
Conflicts of Interest
References
- ACIA. Arctic Climate Impact Assessment Cambridge; Cambridge University Press: Cambridge, UK, 2005; p. 1042. [Google Scholar]
- Romanovsky, V.E.; Sazonova, T.S.; Balobaev, V.T.; Shender, N.I.; Sergueev, D.O. Past and recent changes in air and permafrost temperatures in Eastern Siberia. Glob. Planetary Chang. 2007, 56, 399–413. [Google Scholar] [CrossRef]
- Osterkamp, T.E. Thermal state of permafrost in Alaska during the fourth quarter of the twentieth century. In Proceedings of the Ninth International Conference on Permafrost; Kane, D.L., Hinkel, K.M., Eds.; Institute of Northern Engineering, University of Alaska: Fairbanks, AK, USA, 2008; Volume 2, pp. 1333–1338. [Google Scholar]
- Smith, S.L.; Romanovsky, V.E.; Lewkowicz, A.G.; Burn, C.R.; Allard, M.; Clow, G.D.; Yo-shikawa, K.; Throop, J. Thermal state of permafrost in North America: A contribution to the international Polar year. Permafr. Perigl. Process. 2010, 21, 117–135. [Google Scholar] [CrossRef] [Green Version]
- Romanovsky, V.E.; Drozdov, D.S.; Oberman, N.G.; Malkova, G.V.; Kholodov, A.L.; Marchenko, S.S.; Moskalenko, N.G.; Sergeev, D.O.; Ukraintseva, N.G.; Abramov, A.A. Thermal state of permafrost in Russia. Permafr. Perigl. Process. 2010, 21, 136–155. [Google Scholar] [CrossRef] [Green Version]
- Romanovsky, V.E.; Smith, S.L.; Christiansen, H.H. Permafrost thermal state in the polar Northern Hemisphere during the international polar year 2007–2009: A synthesis. Permafr. Perigl. Process. 2010, 21, 106–116. [Google Scholar] [CrossRef] [Green Version]
- Romanovsky, V.; Smith, S.; Isaksen, K.; Shiklomanov, N.I.; Streletskiy, D.A.; Kholodov, A.L.; Khoshkam, M.; Kidd, R.; Killick, R.; Kim, H.; et al. Terrestrial permafrost. In: State of the Climate in 2018. Bull. Am. Meteorol. Soc. 2019, 100.9, 153–156. [Google Scholar]
- Vasiliev, A.A.; Streletskaya, I.D.; Shirokov, R.S.; Oblogov, G.E. Coastal permafrost evolution of Western Yamal in context of climate change. Eart Cryosphere 2011, 2, 56–64. (In Russian) [Google Scholar]
- Vasiliev, A.A.; Drozdov, D.S.; Gravis, A.; Malkova, G.; Nyland, K.E.; Streletskiy, D.A. Permafrost degradation in the Western Russian Arctic. Environ. Res. Lett. 2020, 10, 045001. [Google Scholar] [CrossRef]
- Kraev, G.; Abramov, A.; Bykhovets, S.; Fyodorov-Davydov, D.; Kholodov, A.; Lupachev, A.; Mamykin, V.; Ostroumov, V.; Sorokovikov, V.; Gilichinsky, D.; et al. Ther-mal State of Permafrost in the Eastern Arctic. In Tenth International Conference on Permafrost; Kane, D.L., Hinkel, K.M., Eds.; Institute of Northern Engineering, University of Alaska Fairbanks: Fairbanks, AK, USA, 2012; Volume 1, pp. 993–998. [Google Scholar]
- Malkova, G.V. The Last Twenty-Five Years of Changes in Permafrost Temperature in the Eu-ropean Russian Arctic. In Tenth International Conference on Permafrost; Kane, D.L., Hinkel, K.M., Eds.; Institute of Northern Engineering, University of Alaska Fairbanks: Fairbanks, AK, USA, 2012; Volume 2, pp. 1119–1124. [Google Scholar]
- Way, R.G.; Lewkowicz, A.G. Environmental controls on ground temperature and permafrost in Labrador, 576 northeast Canada. Permaf. Perigl. Process. 2018, 29, 73–85. [Google Scholar] [CrossRef]
- Westergaard-Nielsen, A.; Karami, M.; Hansen, B.U.; Westermann, S.; Elberling, B. Contrasting temperature trends across the ice-free part of Greenland. Sci. Rep. 2018, 8, 1586. [Google Scholar] [CrossRef] [PubMed] [Green Version]
- Abramov, A.; Davydov, S.; Ivashchenko, A.; Karelin, D.; Kholodov, A.; Kraev, G.; Lupachev, A.; Maslakov, A.; Ostroumova, V.; Rivkina, E.; et al. Two Decades of Active Layer Thickness Monitoring in Northeastern Asia. Polar Geogr. 2019, 44, 186–202. [Google Scholar] [CrossRef]
- Dubrovin, V.A.; Brushkov, A.V.; Drozdov, D.S.; Zheleznyak, M.N. Study, current state, future and challenges of development of permafrost in the Arctic. In Mineralnye Resursy Rossii. Ekonomika i Upravlenie; PravoTEK: Moscow, Russia, 2019; Volume 3, pp. 55–64. (In Russian) [Google Scholar]
- Biskaborn, B.K.; Smith, S.L.; Noetzli, J.; Matthes, H.; Vieira, G.; Streletskiy, D.A.; Schoeneich, P.; Romanovsky, V.E.; Lewkowicz, A.G.; Abramov, A.; et al. Permafrost is warming at a global scale. Nat. Commun. 2019, 10, 264. [Google Scholar] [CrossRef] [PubMed] [Green Version]
- Wang, C.; Wang, Z.; Kong, Y.; Zhang, F.; Yang, K.; Zhang, T. Most of the Northern Hemisphere Permafrost Remains under Climate Change. Sci. Rep. 2019, 9, 3295. [Google Scholar] [CrossRef] [PubMed]
- Zhelezniak, M.N.; Semenov, V.P. The Subsurface Temperature Field and Permafrost in the Vilyui Basin; SB RAS: Novosibirsk, Russia, 2020; 123p. (In Russian) [Google Scholar]
- Kaverin, D.; Malkova, G.; Zamolodchikov, D.; Shiklomanov, N.; Pastukhov, A.; Novakovskiy, A.; Sadurtdinovb, M.; Skvortsov, A.; Tsarev, A.; Pochikalovg, A.; et al. Long-Term Active Layer Monitoring at CALM Sites in the Russian European North. Polar Geogr. 2021, 44, 203–216. [Google Scholar] [CrossRef]
- Strand, S.M.; Christiansen, H.H.; Johansson, M.; Åkerman, J.; Humlum, O. Active layer thickening and controls on interannual 568 variability in the Nordic Arctic compared to the circum-Arctic. Permafr. Perigl. Process. 2021, 32, 47–58. [Google Scholar] [CrossRef]
- Li, G.; Zhang, M.; Pei, W.; Melnikov, A.; Khristoforov, I.; Li, R.; Yu, F. Changes in permafrost extent and active layer thickness in the Northern Hemisphere from 1969 to 2018. Sci. Total Environ. 2022, 804, 150182. [Google Scholar] [CrossRef] [PubMed]
- Ran, Y.; Li, X.; Cheng, G.; Che, J.; Aalto, J.; Karjalainen, O.; Hjort, J.; Luoto, M.; Jin, H.; Obu, J.; et al. New high-resolution estimates of the permafrost thermal state and hydrothermal conditions over the Northern Hemisphere. Earth Syst. Sci. Data 2022, 14, 865–884. [Google Scholar] [CrossRef]
- Geology of the Yakutian ASSR; Spektor, V.B. (Ed.) Nedra: Moscow, Russia, 1981; 300p. (In Russian) [Google Scholar]
- Budyko, M.I.; Grigoriev, A.A. Climatic zonation of the USSR. In The Climatic Atlas of the USSR; Gl. Upr. Gidrometeorol. Sluzhby pri Sovmine SSSR: Moscow, Russia, 1960; Volume 1, pp. 178–179. (In Russian) [Google Scholar]
- The Atlas of the USSR; GUGK: Moscow, Russia, 1984; 260p. (In Russian)
- Desyatkin, R.V.; Karpov, N.S.; Zakharova, V.I.; Desyatkin, A.R.; Hinzmann, L.D. Soil and vegetative covers on tundra polygon of the GAME project in the vicinity of Tiksi. Research Re-port of IHAS. In Proceedings of Second International Workshop of Energy and Water Cycle in GAME-Siberia; Institute for Hydrospheric-Atmospheric Sciences: Nagoya, Japan, 1998; Volume 4, pp. 1–10. [Google Scholar]
- Balobaev, V.T. Geothermy of the Permafrost Zone of the Lithosphere in Northern Asia; Nauka: Novosibirsk, Russia, 1991; p. 194. (In Russian) [Google Scholar]
- Grigoriev, N.F. Permafrost in the Coastal Zone of Yakutia; Nauka: Moscow, Russia, 1966; p. 180. (In Russian) [Google Scholar]
- Soloviev, P.A. Thickness of the surficial seasonally frozen layer in Yakutian ASSR. In Geocryological and Hydrogeological Investigations in Yakutia; Kn. Izdatelstvo: Yakutsk, Russia, 1978; pp. 3–12. (In Russian) [Google Scholar]
- Pavlov, A.V. Heat Exchange of Freezing and Thawing Soils with the Atmosphere; Russian Academy of Sciences: Moscow, Russia, 1965; p. 254. (In Russian) [Google Scholar]
- Boike, J.; Nitzbon, J.; Anders, K.; Grigoriev, M.; Bolshiyanov, D.; Langer, M.; Lange, S.; Bornemann, N.; Morgenstern, A.; Schreiber, P.; et al. A 16-year record (2002–2017) of permafrost, active layer, and meteorological conditions at the Samoylov Island Arctic permafrost research site, Lena River Delta, northern Siberia: An opportunity to validate remote sensing data and land surface, snow, and permafrost models. Earth Syst. Sci. Data Discuss. 2018, 11, 261–299. [Google Scholar] [CrossRef]
- Boike, J.; Kattenstroth, B.; Abramova, K.; Bornemann, N.; Chetverova, A.; Fedorova, I.; Fröb, K.; Grigoriev, M.N.; Grüber, M.; Kutzbach, L.; et al. Baseline characteristics of climate, permafrost and land cover from a new permafrost observatory in the Lena River Delta, Siberia (1998–2011). Biogeosciences 2013, 10, 2105–2128. [Google Scholar] [CrossRef]


| Depth, m | Temperature, °C |
|---|---|
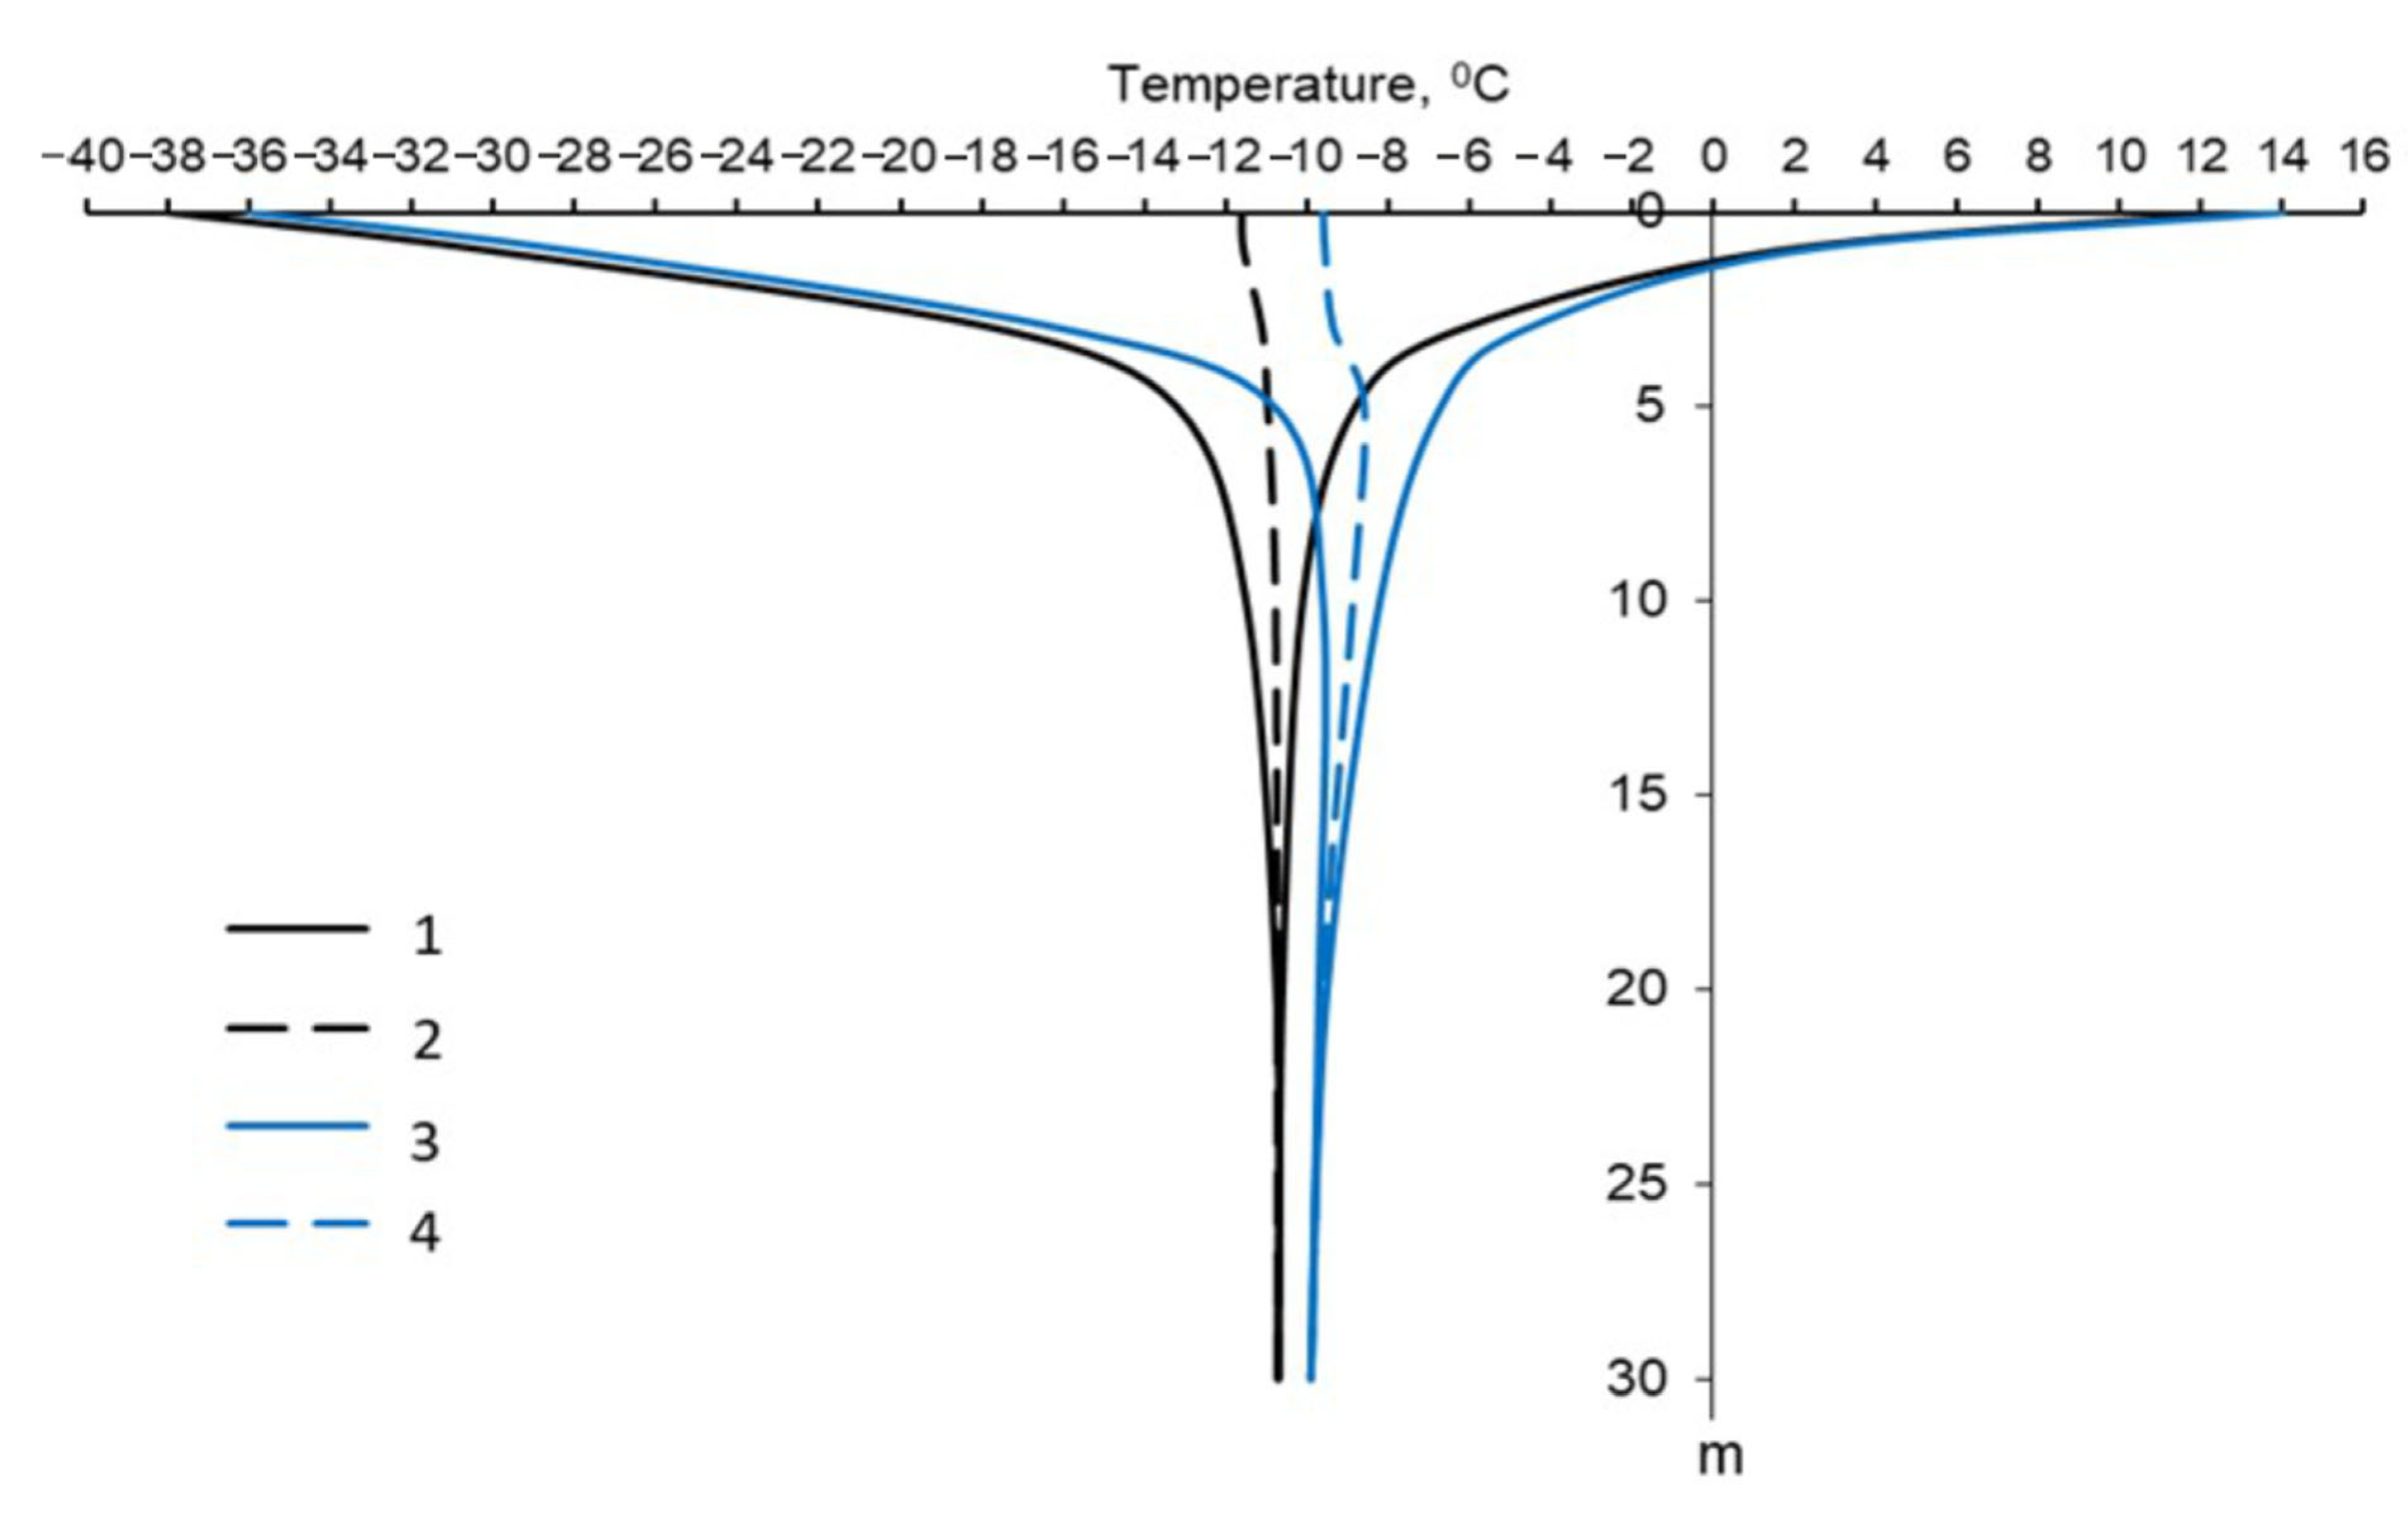
| 20 | −11.1 |
| 100 | −10.5 |
| 200 | −8.6 |
| 300 | −6.8 |
| 400 | −4.8 |
| 500 | −2.9 |
| Granulometric Composition, % (to Fractions, mm) | Depth, m | ||||
|---|---|---|---|---|---|
| 0.20–0.30 | 0.20–0.30 | 0.25–0.30 | 0.25–0.30 | 0.25–0.30 | |
| 10–7 | 3 | - | - | - | - |
| 7–5 | - | - | - | - | - |
| 7–3 | - | - | - | - | - |
| 3–2 | - | - | - | - | - |
| 2–1 | - | - | - | - | - |
| 1–0.5 | - | - | - | - | - |
| 0.5–0.25 | 3 | 1.4 | 1.1 | 1.1 | 1.4 |
| 0.25–0.19 | 7 | 4.6 | 6.5 | 6.7 | 9.8 |
| 0.10–0.05 | 0.6 | 17 | 8.2 | 7.7 | 9.4 |
| 0.05–0.01 | 19.5 | 15 | 28.4 | 29.9 | 32 |
| 0.01–0.005 | 31.5 | 22.1 | 22.4 | 20.6 | 14.9 |
| 0.005–0.002 | 6.8 | 7.8 | 7.4 | 2.9 | 6.2 |
| <0.002 | 28.6 | 32.1 | 26.2 | 31.1 | 26.3 |
| Clay loam | Clay | Clay loam | Clay | Clay loam | |
| Depth, cm | Soil Composition | Gravimetric Moisture Content, % | Volumetric Moisture Content, % | Bulk Density of humid Soil, g/cm3 | Bulk Density of Dry Soil, g/cm3 |
|---|---|---|---|---|---|
| 10 | Peat | 157 | 72 | 1.18 | 0.46 |
| 12 | Peat | 190 | 74 | 1.14 | 0.39 |
| 15 | Peat | 158 | 74 | 1.20 | 0.47 |
| 16 | Peaty soil | 61 | 56 | 1.48 | 0.92 |
| 17 | Peaty soil | 95 | 60 | 1.23 | 0.63 |
| 17 | Peaty soil | 68 | 58 | 1.43 | 0.85 |
| 20 | Clay soil | 37 | 47 | 1.74 | 1.27 |
| 23 | Clay soil | 39 | 48 | 1.69 | 1.22 |
| 25 | Clay soil | 36 | 48 | 1.80 | 1.33 |
| 27 | Clay soil | 29 | 41 | 1.82 | 1.41 |
| Month | 1991–1995 | 1996–2000 | 2001–2005 | 2006–2010 | 2011–2015 | 2015–2021 |
|---|---|---|---|---|---|---|
| Oct. | −10.8 | −10.7 | −11.9 | −9.0 | −8.8 | −7.5 |
| Nov. | −25.6 | −24.4 | −22.8 | −21.7 | −19.9 | −19.4 |
| Dec. | −27.8 | −30.0 | −29.5 | −26.9 | −26.8 | −27.8 |
| Jan. | −30.3 | −30.9 | −30.3 | −26.9 | −30.3 | −29.0 |
| Feb. | −27.5 | −29.8 | −33.0 | −31.4 | −31.4 | −28.1 |
| Mar. | −25.8 | −29.4 | −26.4 | −25.5 | −23.5 | −22.5 |
| Apr. | −18.7 | −18.7 | −18.4 | −17.6 | −14.8 | −13.4 |
| May | −5.4 | −6.4 | −6.3 | −4.3 | −4.4 | −5.5 |
| June | 3.3 | 3.0 | 2.7 | 4.3 | 4.0 | 5.7 |
| July | 8.7 | 7.3 | 8.5 | 8.3 | 9.0 | 8.8 |
| Aug. | 7.6 | 6.9 | 8.1 | 9.0 | 9.3 | 9.3 |
| Sept. | 2.0 | 0.5 | 1.4 | 2.4 | 3.0 | 3.9 |
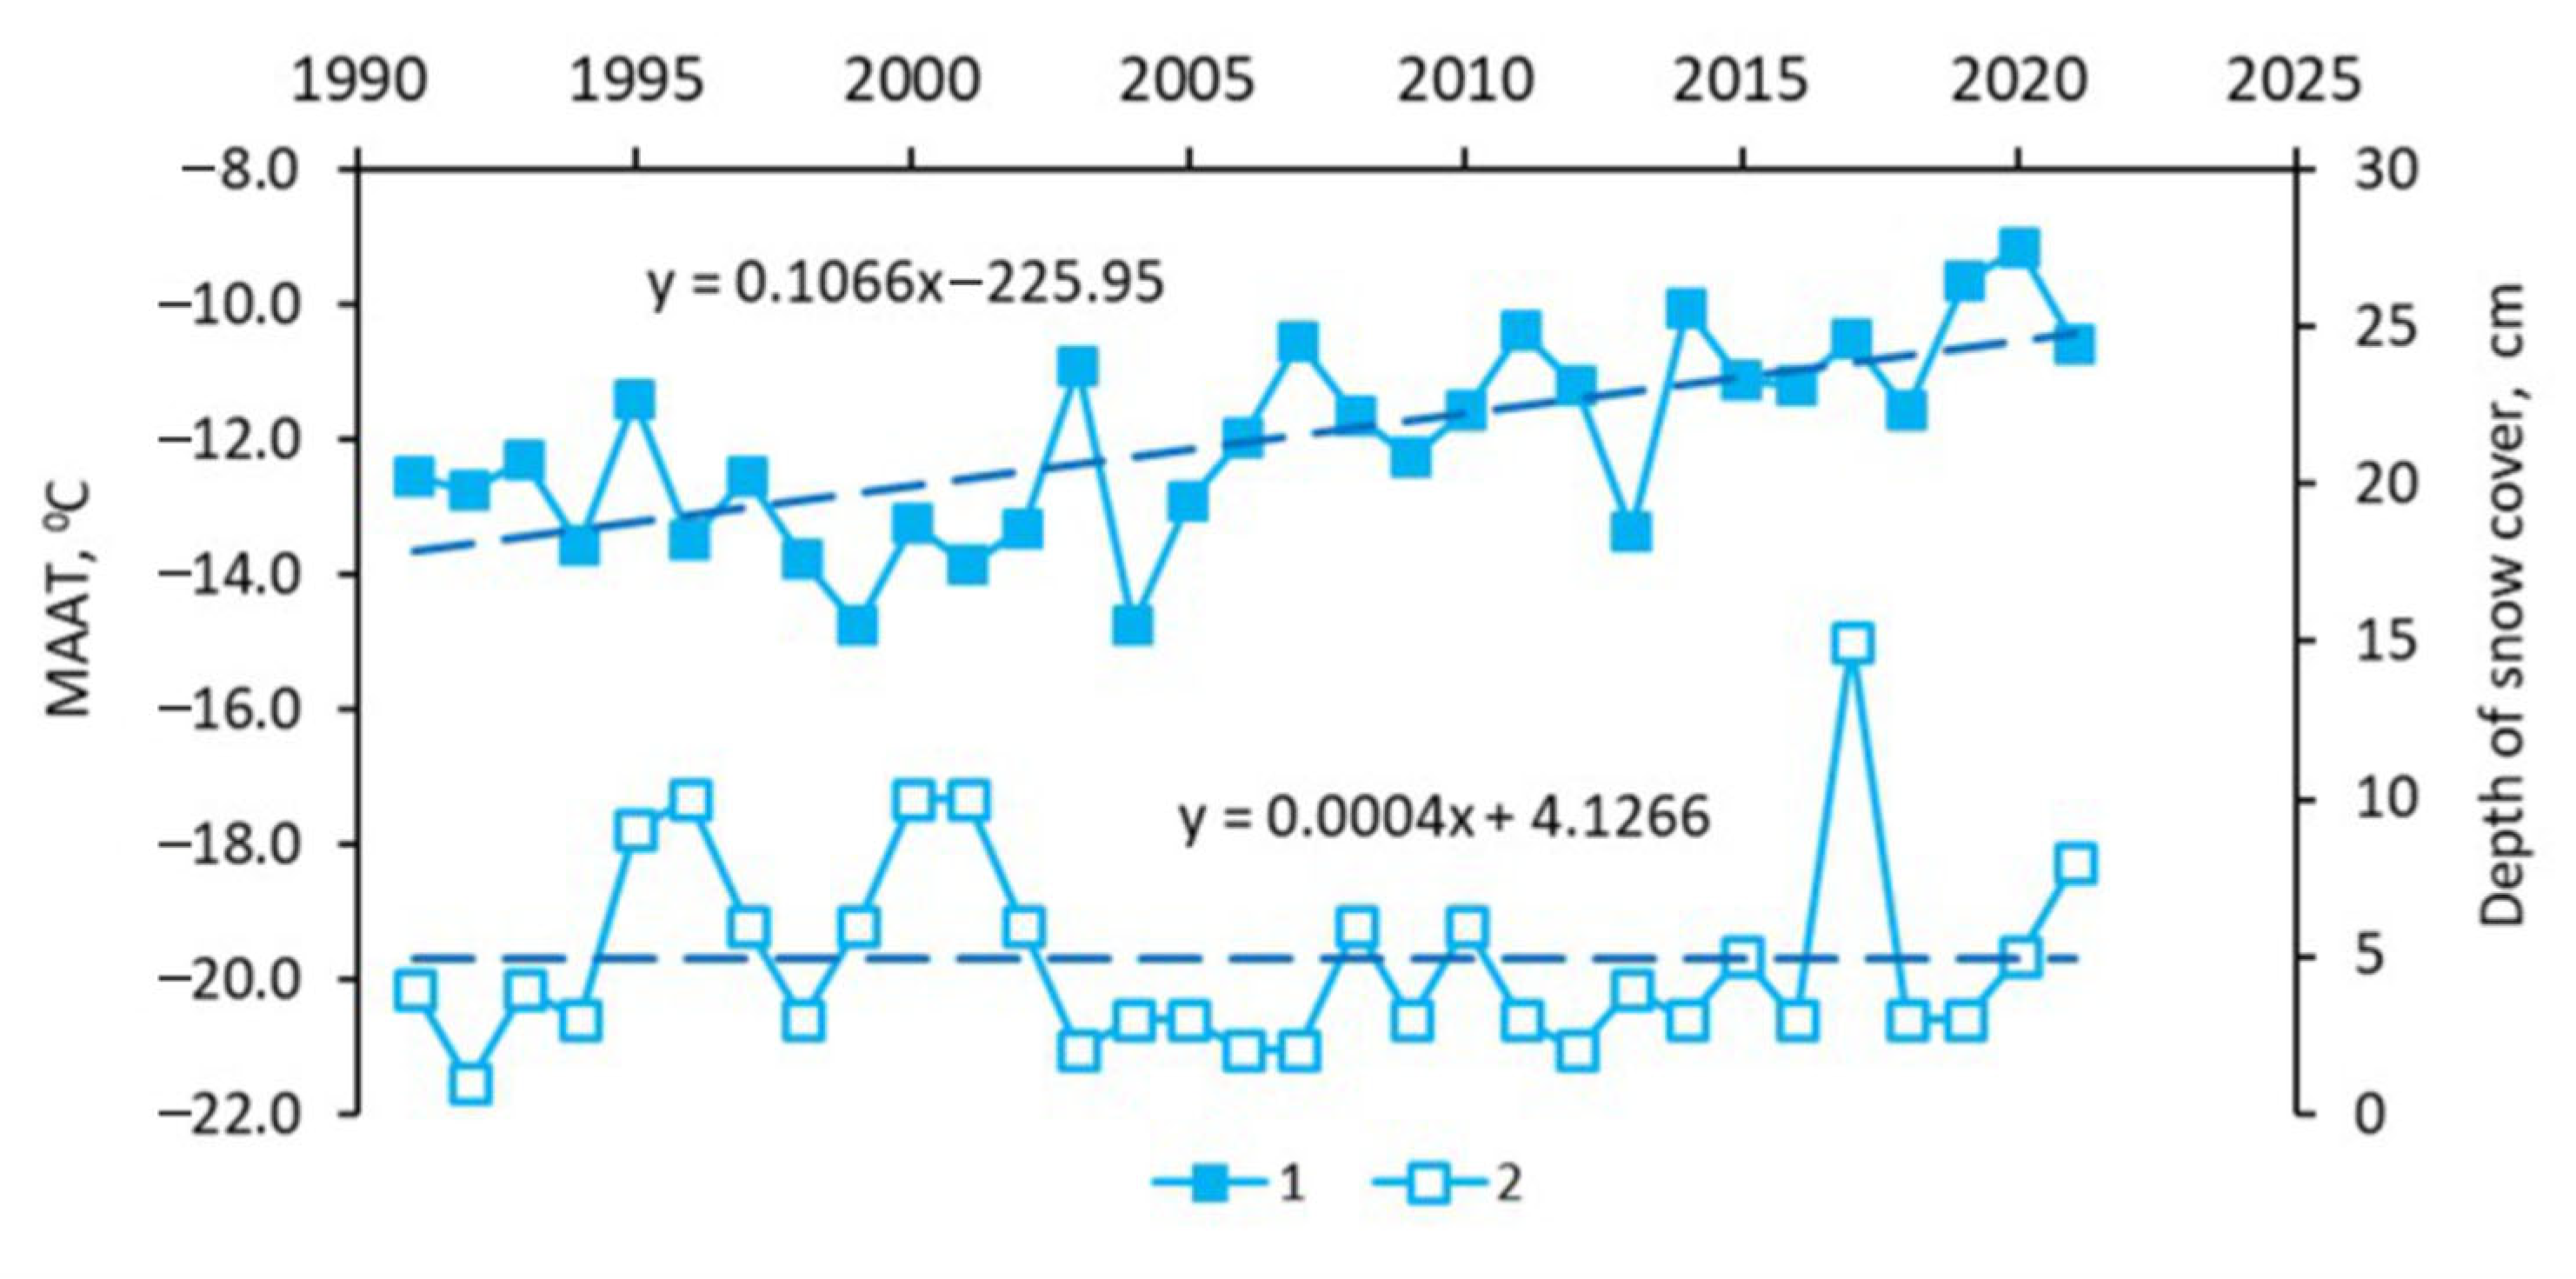
| MAAT (°C) | −12.5 | −13.6 | −13.2 | −11.6 | −11.2 | −10.5 |
| Years | MAGT Trends (°C/yr) | ||
|---|---|---|---|
| 3 m | 10 m | 30 m | |
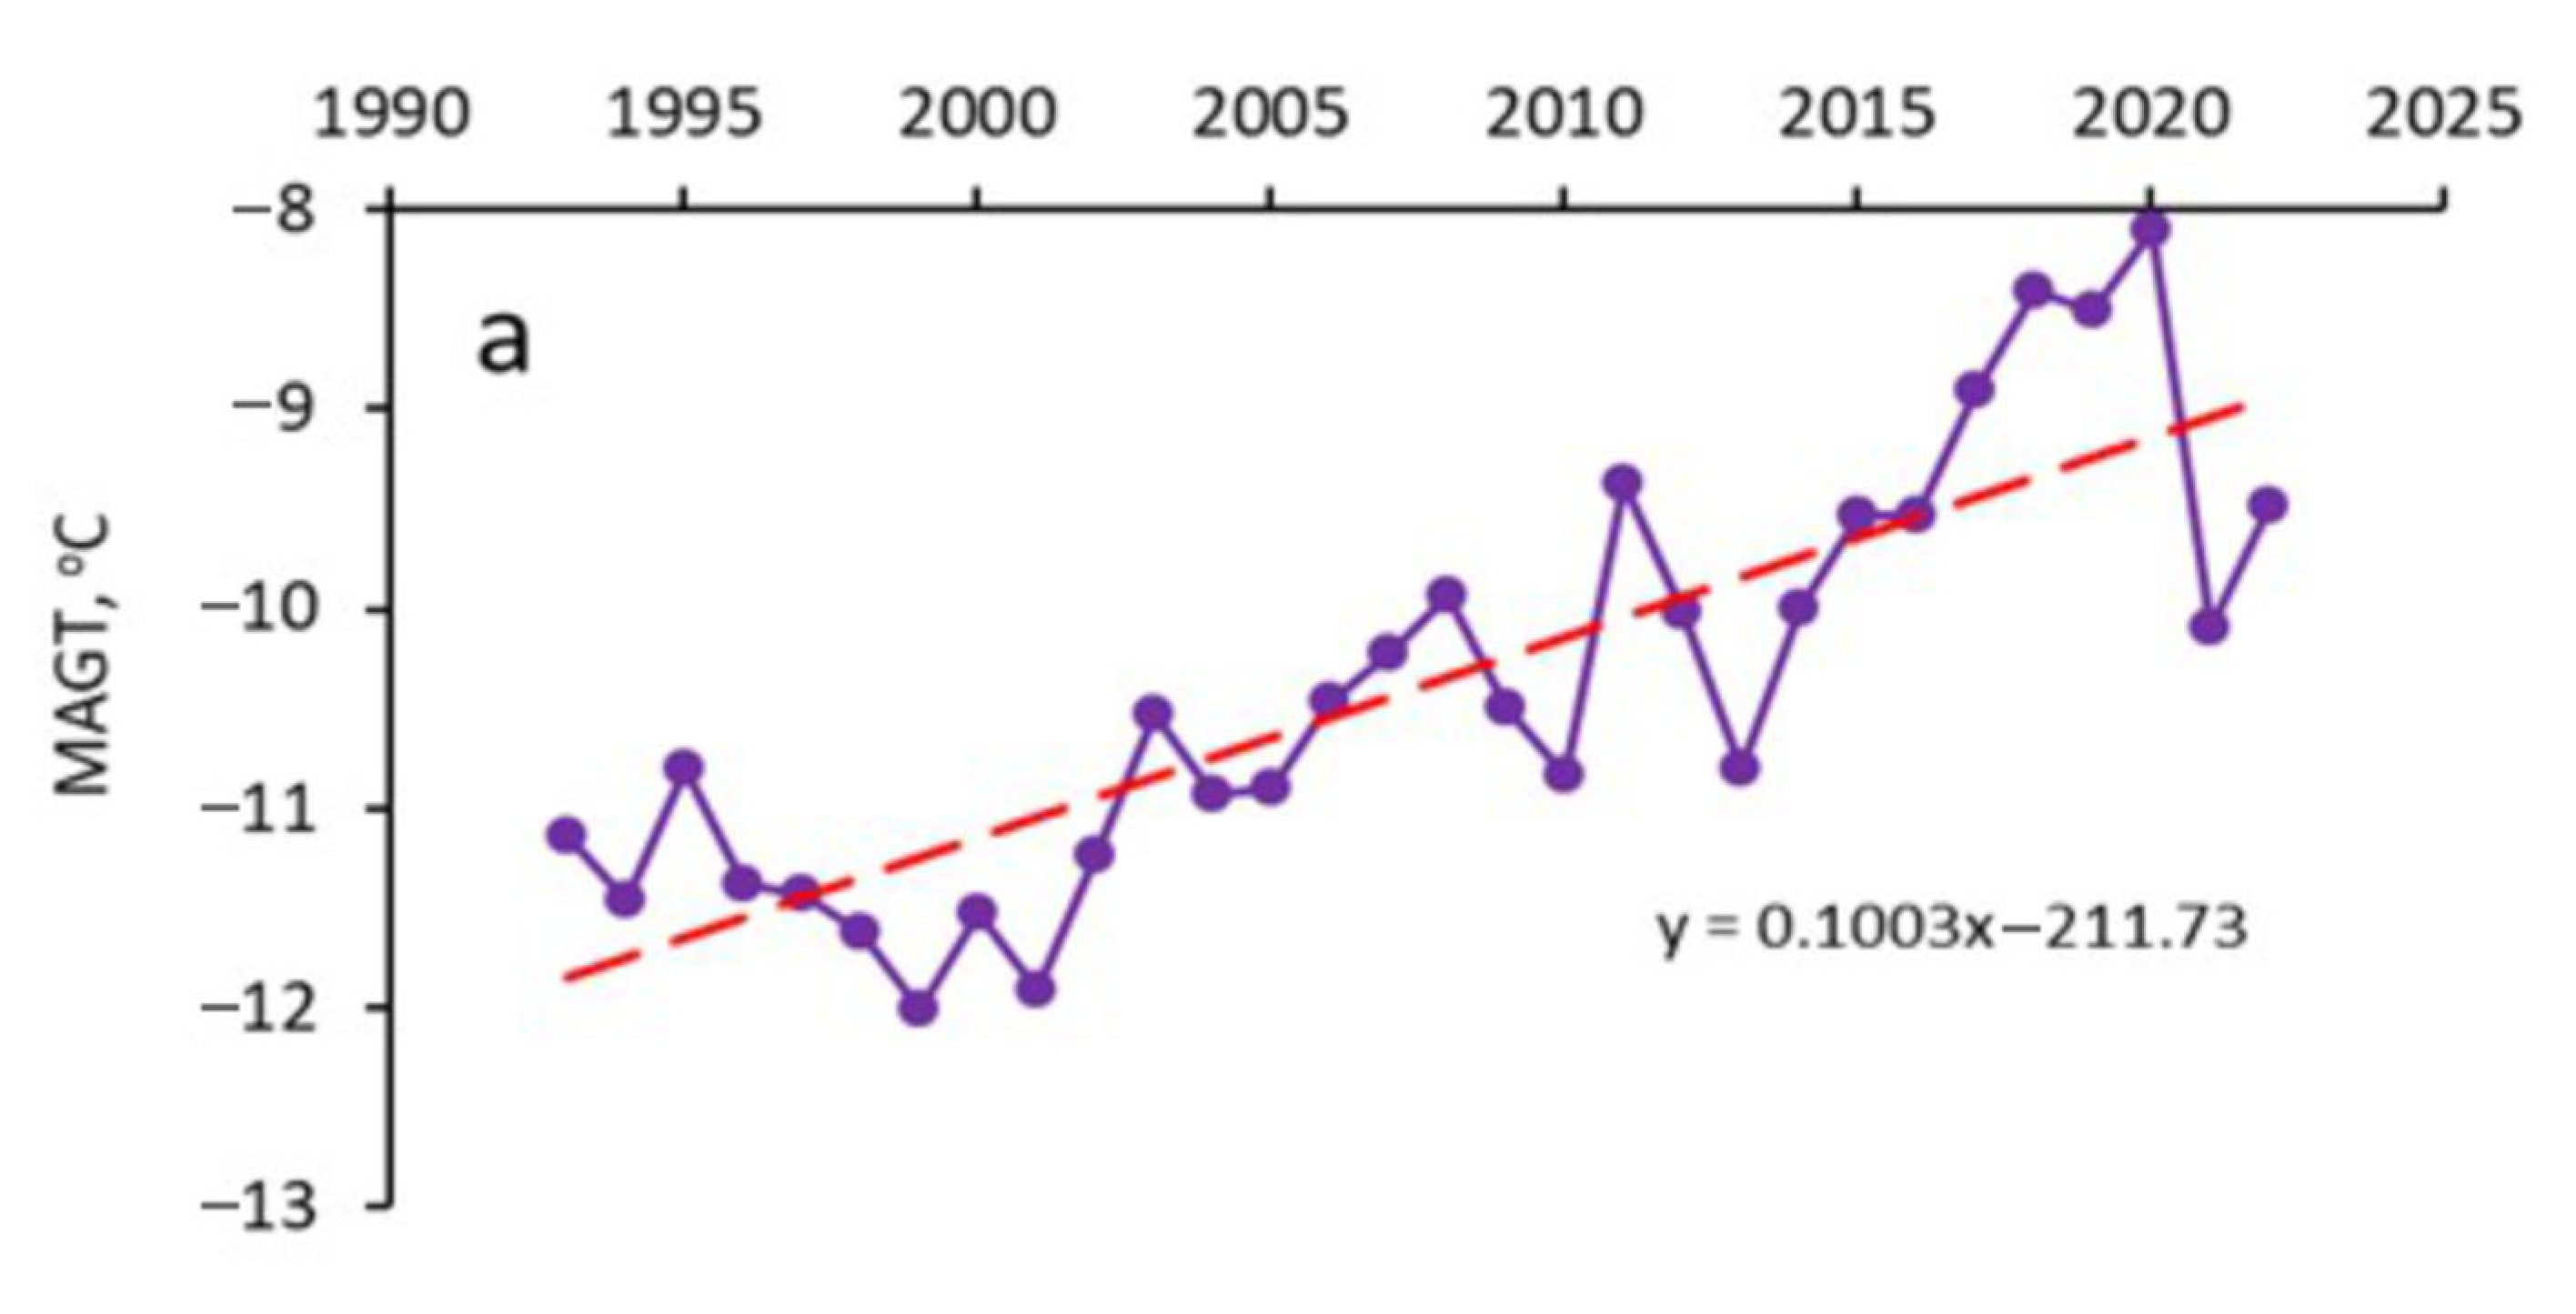
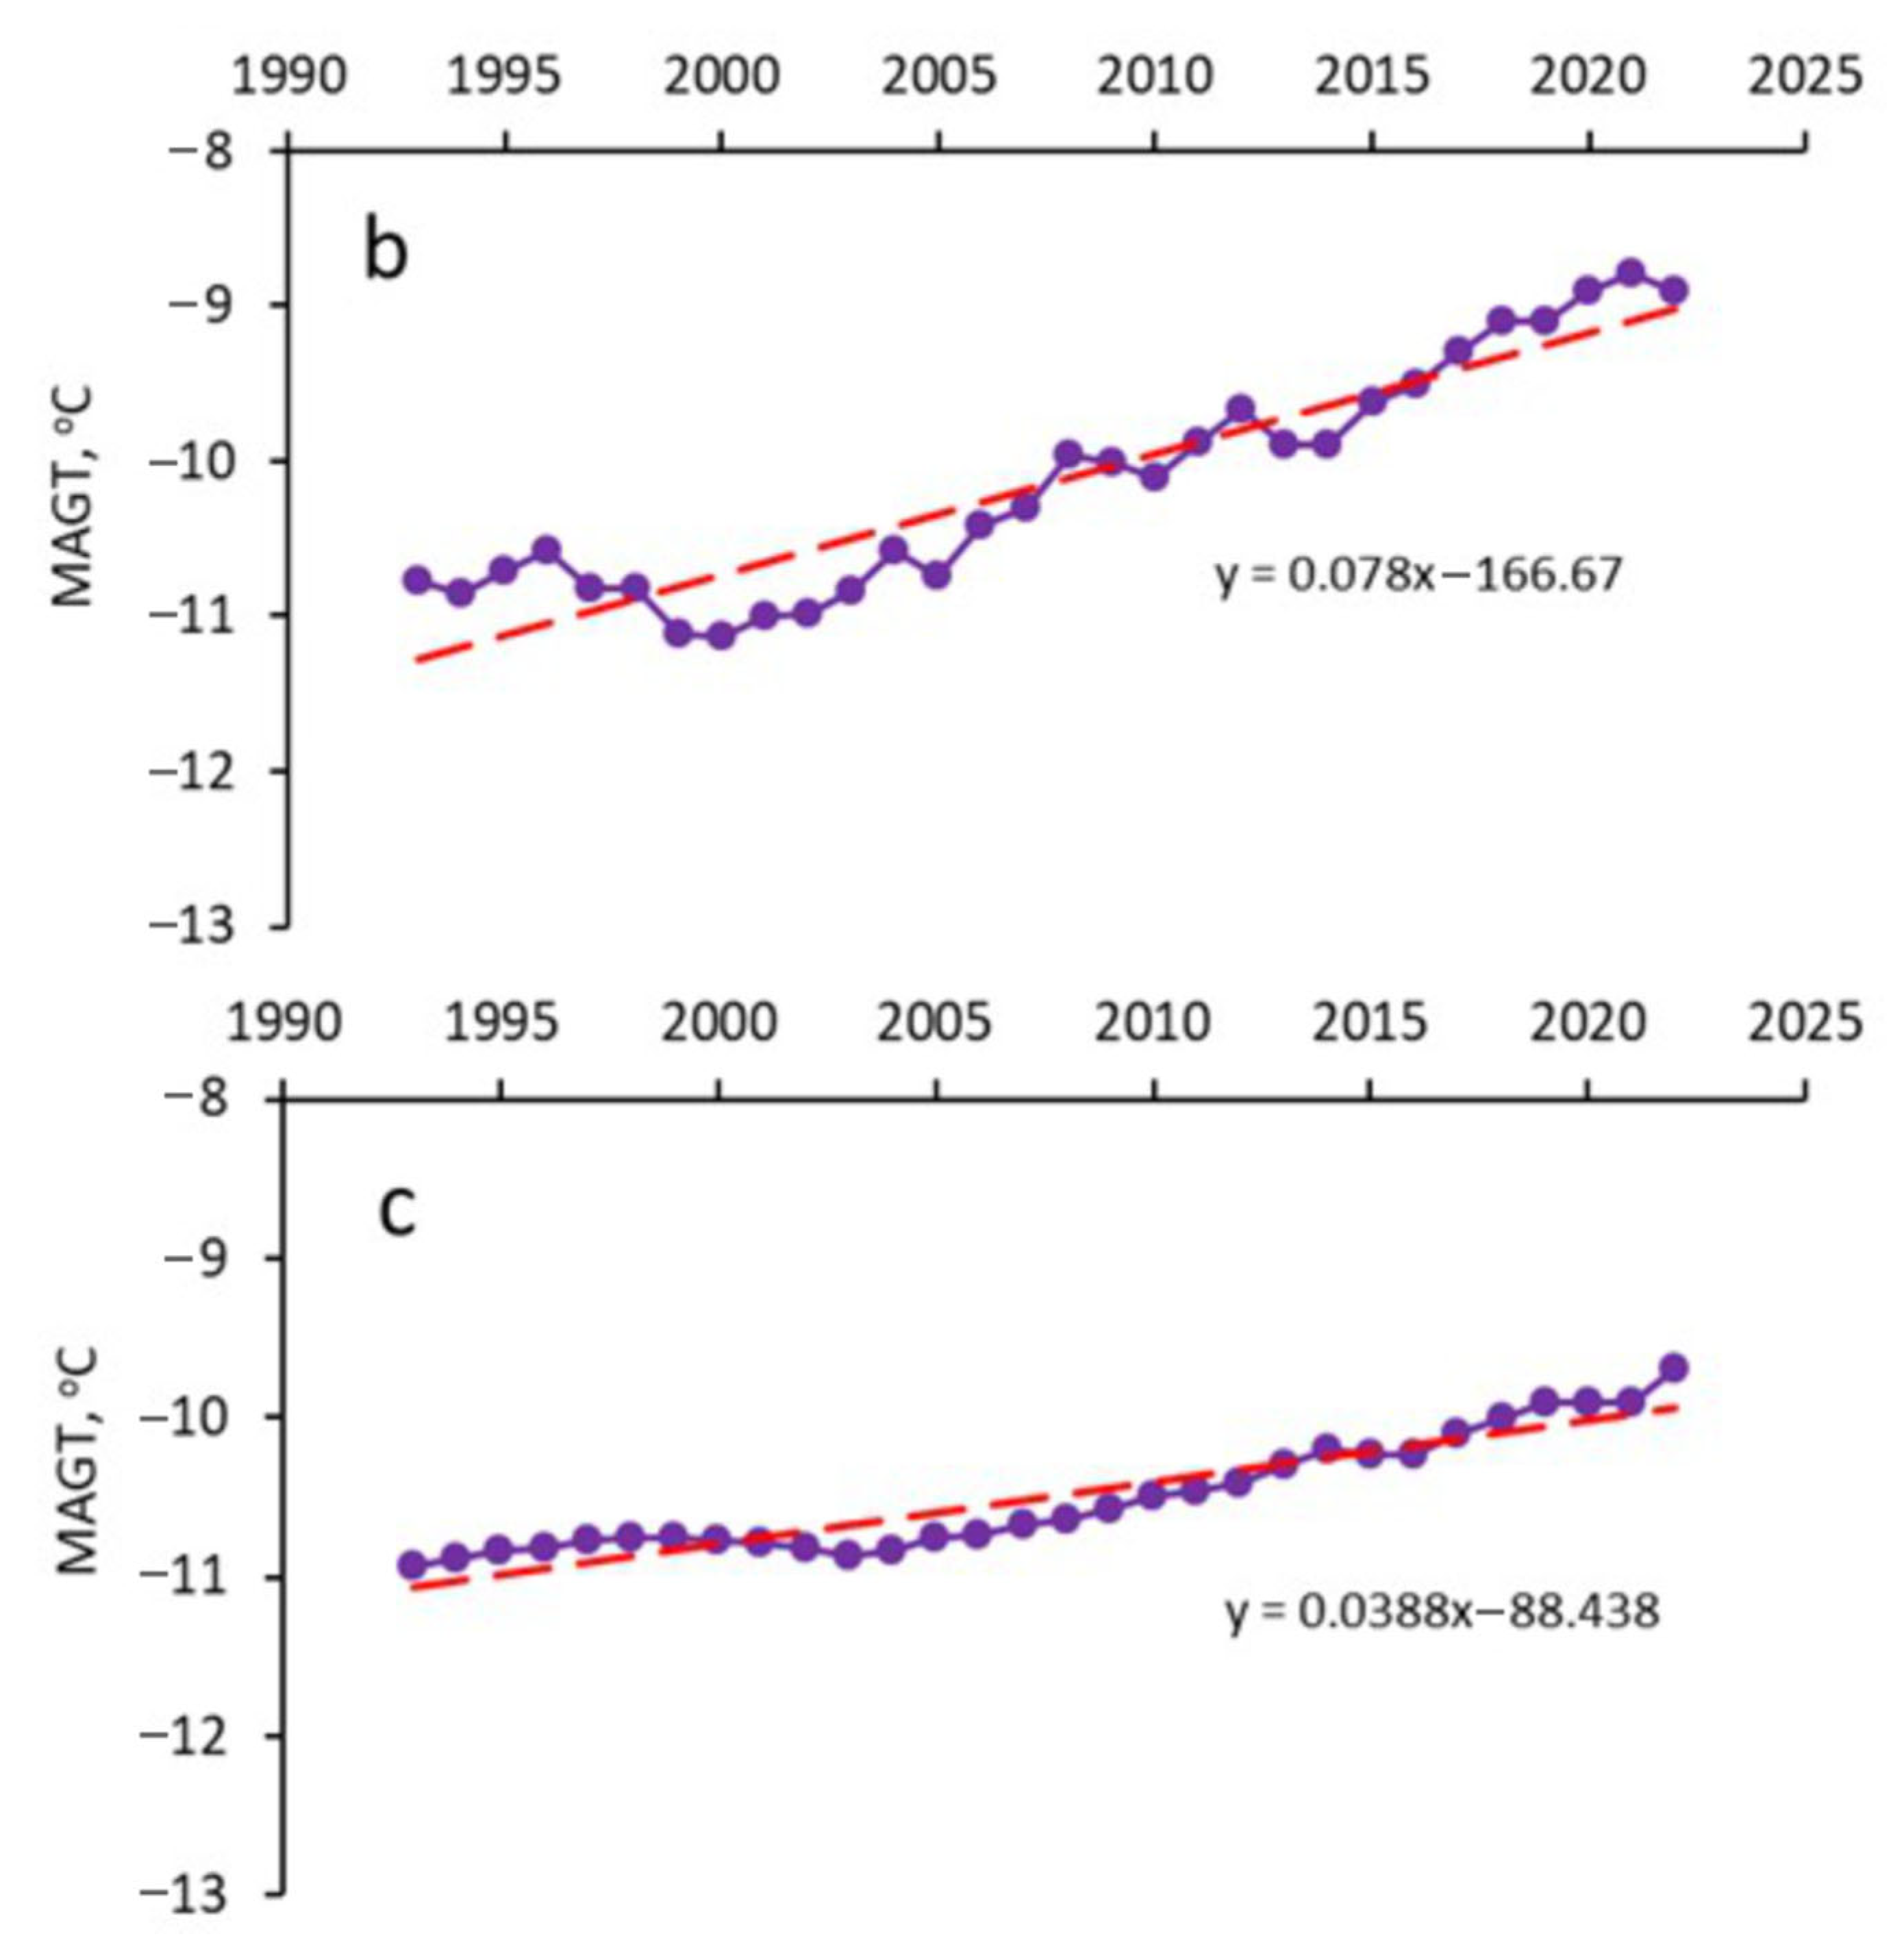
| 1993–2022 | 0.10 | 0.08 | 0.04 |
| 1993–2002 | −0.06 | −0.04 | 0.01 |
| 2003–2012 | 0.10 | 0.12 | 0.05 |
| 2013–2022 | 0.13 | 0.13 | 0.06 |
Disclaimer/Publisher’s Note: The statements, opinions and data contained in all publications are solely those of the individual author(s) and contributor(s) and not of MDPI and/or the editor(s). MDPI and/or the editor(s) disclaim responsibility for any injury to people or property resulting from any ideas, methods, instructions or products referred to in the content. |
© 2022 by the authors. Licensee MDPI, Basel, Switzerland. This article is an open access article distributed under the terms and conditions of the Creative Commons Attribution (CC BY) license (https://creativecommons.org/licenses/by/4.0/).
Share and Cite
Konstantinov, P.; Basharin, N.; Fedorov, A.; Iijima, Y.; Andreeva, V.; Semenov, V.; Vasiliev, N. Impact of Climate Change on the Ground Thermal Regime in the Lower Lena Region, Arctic Central Siberia. Land 2023, 12, 19. https://doi.org/10.3390/land12010019
Konstantinov P, Basharin N, Fedorov A, Iijima Y, Andreeva V, Semenov V, Vasiliev N. Impact of Climate Change on the Ground Thermal Regime in the Lower Lena Region, Arctic Central Siberia. Land. 2023; 12(1):19. https://doi.org/10.3390/land12010019
Chicago/Turabian StyleKonstantinov, Pavel, Nikolai Basharin, Alexander Fedorov, Yoshihiro Iijima, Varvara Andreeva, Valerii Semenov, and Nikolai Vasiliev. 2023. "Impact of Climate Change on the Ground Thermal Regime in the Lower Lena Region, Arctic Central Siberia" Land 12, no. 1: 19. https://doi.org/10.3390/land12010019