Article

Inventory and Spatial Distribution of Ancient Landslides in Hualong County, China

1
National Institute of Natural Hazards, Ministry of Emergency Management of China, Beijing 100085, China
2
Key Laboratory of Compound and Chained Natural Hazards Dynamics, Ministry of Emergency Management of China, Beijing 100085, China
3
School of Earth Sciences and Resources, China University of Geosciences (Beijing), Beijing 100083, China
*
Author to whom correspondence should be addressed.
Land 2023, 12(1), 136; https://doi.org/10.3390/land12010136
Submission received: 15 November 2022 / Revised: 21 December 2022 / Accepted: 28 December 2022 / Published: 31 December 2022

Abstract

:
The establishment of a regional historical landslide inventory plays an indispensable role in landslide assessment and prevention. In this study, based on the Google Earth platform, an inventory of ancient landslides in Hualong County, Qinghai Province was established. The inventory includes 3517 ancient landslides with individual areas ranging from 2354.6 m2 to 12.44 km2. The dominant characteristics include an elevation of 2600–2800 m, slope of 10–20°, aspects SW, W, and NW, mudstone and sandstone of Paleoproterozoic, Neoproterozoic and Quaternary loess, 8–10 km from faults, 0–1 km from rivers, cultivated and grassland types, NDVI of 0.25–0.3, and an average precipitation in the range of 480–500 mm. In addition, the geometric analysis of landslides shows that the average height and length of ancient landslides in the study area are 151.92 m and 429.52 m, respectively. The power law relationship between the two is L = 0.41 × H1.37. The ancient landslide inventory of this study exhibits an integrated pattern of the development characteristics and spatial distribution of landslides in the Tibetan Plateau and the upper Yellow River basin, as well as providing a significant reference for subsequent landslide susceptibility mapping in the area.

1. Introduction

Landslides are a common type of natural hazard and often lead to serious consequences on human lives. According to statistics, 4862 fatal landslides occurred worldwide from 2004 to 2016, killing a total of 55,997 people [1]. These data significantly demonstrate that landslides are extremely destructive and hazardous. Therefore, landslide-related research is an important element of disaster prevention and control [2]. Landslides have been thoroughly and comprehensively studied by researchers worldwide. For example, there are more than 20,000 articles on landslide research in the Web of Science core database. These studies include landslide event documentation, stability analysis, numerical simulation, regional risk assessment, and monitoring and warning [3,4]. These are certainly not all the research categories, but they do reflect current research trends. In most of these studies, the establishment of a landslide inventory is the primary and fundamental work [5]. A detailed and accurate landslide inventory is important in conducting a variety of relevant studies, including the spatial distribution of landslides [6,7], the impact on landscape evolution [8,9], and landslide susceptibility mapping [10,11].
Globally, regional inventories of historical landslides have been established in some countries or regions on different scales, including global, national, regional, or event-specific [12]. For example, the EM-DAT dataset (International Disaster Database) was compiled by KU Leuven in Belgium [13]. Pennington et al. (2015) established the national landslide database in the UK, which was subsequently improved by Taylor et al. (2015) [14,15]. Shao et al. (2020) established a regional landslide inventory in Baoshan City, China [16]. Li et al. (2022) analyzed ancient landslides around the Baihetan hydropower plant in China [17]. Tian et al. (2019) and Tsou et al. (2018) analyzed the coseismic landslides triggered by the 2017 Mw6.5 Jiuzhaigou Earthquake and the 2015 Gorkha earthquake [18,19].
Above, China is one of the most frequently mentioned countries with the severe landslide disasters. Relevant statistics show that 28,139 people were killed by fatal landslides in China from 1950–2016 [20]. The high frequency of landslides in the Qinghai province is attributed to the strong tectonic activity and dramatic topographic changes of the area since the eastern and western edges are adjacent to the Loess Plateau and the Tibetan Plateau, respectively [21]. Hualong County is located at the northeastern edge of the Qinghai province, bordering the Loess Plateau and sitting at the intersection of the South Qilian Block and the West Qinling Block. Futhermore, Hualong County is bordered by the upper reaches of the Yellow River, yielding a large topographic drop and interlaced tributaries. The above, in addition to climate, precipitation, stratigraphic lithology, and other environmental factors enormously facilitated the development of ancient landslides. Numerous studies have been conducted to investigate landslides occurring around Hualong County. One group of researchers found 243 landslides through field surveys and evaluated the susceptibility of landslides using an informative model [22]. Another group carried out a landslide survey in part of the areas of the upper Yellow River region [23].
However, with the development of technology, the limitations of the methodologies or techniques utilized in previous studies are gradually emerging. In detail, the selection of the study areas needs to be reconsidered, most of the interpretable images or platforms need to be updated, and the methods for building landslide databases require innovation. The distribution of ancient landslides was in urgent need of updating and improvement. Therefore, this study examines the visual interpretation of high-resolution satellite images of the study area based on Google Earth. Finally, it compiles a detailed ancient landslide inventory map and analyzes the landslide spatial distribution. The results of this study are important to supporting a subsequent landslide susceptibility analysis and to disaster prevention and control in the region.

2. Study Area Overview

The study area is located in the upper reaches of the Yellow River, which is also the transition zone between the Loess Plateau and the Tibetan Plateau, covering a total area of 2740 km2 (Figure 1). In terms of topography and geomorphology, the study area is adjacent to the Lajishan Mountains in the north and connected to the Yellow River in the south. The overall topography from north to south includes the Lajishan Mountain, the Intermountain Basin, and the Yellow River Valley, showing a stair-stepping pattern. The regional elevation is between 1824 and 4420 m. Influenced by the overall movement of the Tibetan Plateau, the tectonic activity in the study area is intense, with mainly NW-SE strikes. Typical structures are the Lajishan fault zone (DLNR), the Xunhua reverse fault (XHF), and the Wajiatan reverse fault (WJTF) [24]. In addition, multi-stage sub-mountains, the Yellow River gorge, and river valley terraces are also present.
The oldest chronological strata in the area are the Paleoproterozoic Hualong group and the Tuolai group, while the most widely distributed strata are the Neoproterozoic and Paleoproterozoic sedimentary rocks and the Quaternary sediments. The specific strata types are elaborated on in the subsequent analysis. With regards to the water system, the rivers in Hualong County belong to the Yellow River system and have many tributaries. Hualong County has a highland continental semi-arid climate, and thus receives heavy precipitation during summer and fall. The precipitation in this region gradually increases with altitude.
According to the statistics based on the data published by the China Earthquake Networks Center (https://data.earthquake.cn, accessed on 15 October 2022), the earthquake catalog in the study area is as follows (Table 1).

3. Data and Methodology

3.1. Remote Sensing Interpretation

Visual interpretation and automatic extraction based on artificial intelligence are two types of common methods for landslide interpretation at present. Undoubtedly, automatic extraction is the most rapidly developing research direction, but this method also requires improvement on certain points. For example, different remote sensing image types, regional geomorphological features, landslide types, and other factors may affect the accuracy of the results [25,26]. Therefore, at present, this type of method is more suitable for the rapid assessment of landslides in disaster events [27]. In the current study, visual interpretation is still the widely adopted method [28]. For this study, we used sufficient human and time resources to perform a visual interpretation of the study area. The obtained database can be enriched with sample sets for automatic extraction models. With the rapid development of remote sensing technology, the advantages of high resolution, multi-temporal phase, and high spatial coverage make remote sensing interpretation more convenient and accurate. On this basis, the workspace gradually shifts from 2D to 3D views, enabling the interpretation of some specific features. The Google Earth platform provides high- and ultra-high resolution optical satellite images on a global scale (and even multi-temporal images in some areas), and can observe landscapes from a 3D view, which is highly adaptable to landslide interpretations [29,30,31]. The satellite images display a 100% coverage of the study area and mainly date from August 2012 to December 2020.
Ancient landslide investigations suggested that these landslides reach a steady state after the initial sliding process and could remain visible for thousands of years. New geological events such as earthquakes or rainfalls can lead to the resurrection of ancient landslides or the occurrence of new landslides in their original locations [32]. Such situations can also be induced by the recovery of vegetation and human activities. As a result, different degrees of landslide modifications have been preserved over time. These modifications have reduced the degree of difference between the tonal texture and other features of the ancient landslide and its surroundings, but have had little effect on the contours formed by the ancient landslide, of which the outlines and forms are still clearly visible. Therefore, in this study, we referred to the relevant judgment criteria to determine the ancient landslides, mainly adopting the geomorphological and morphological characteristics of landslides as the basis for judgment [33,34,35]: (1) the back wall of the landslide is often chair-shaped, with obvious curved ridge-lines; (2) platform depressions are developed in the middle and rear of a landslide body, and fissures are distributed in the middle and front edge; (3) an irregular stair-stepping pattern is distributed on the landslide body; (4) in terms of plane morphology, the landslide shows curved images, namely, “two ditch troughs with the same origin”; (5) since the ancient landslides were formed early and often possess a large scale, groups of residents or cultivated lands may be seen on the landslide; (6) as there are many water systems in the study area, landslides close to water systems may have caused historical river-blocking events, and their leading edges may squeeze the rivers; (7) in the process of remote sensing interpretation, we superimposed multiple types of geographic elements (e.g., roads, water systems, and townships) in Google Earth, to make a comprehensively correct judgment and avoid interpretation errors as much as possible. Figure 2 shows four typical ancient landslide images.

3.2. Environmental Factors

Related research reported that in the Yellow River basin, geological hazards are generated by the interaction of multiple processes that include geology, geomorphology, and climate [36]. According to the characteristics of the study area and the purpose of the study, we selected elevation, slope, aspect, distance from faults, distance from rivers, NDVI index, precipitation, land type, and stratigraphic lithology as impact factors for detailed analyses. The DEM data were obtained from “ALOS PALSAR 12.5 m DEM” (https://search.asf.alaska.edu/) (accessed on 20 October 2022). The data for faults, rivers, and lithology were obtained from the “Spatial Database of China Land Area 1:250,000 Divisional Constructed Tectonic Map” (http://dcc.cgs.gov.cn/) (accessed on 15 October 2022), and were further spliced and cropped using GIS to obtain the relevant data in the study area. NDVI data were obtained from “The NDVI of the Qinghai Province at 500 m Resolution (2015–2019)” (http://www.geodata.cn/) (accessed on 21 October 2022). These data are a 16-day synthetic product: one raster was generated every 16 days. It was acquired by Moderate Resolution Imaging Spectroradiometer (MODIS) for the period 2015–2019 with a spatial resolution of 500 m. The original data were obtained from the NASA website (https://ladsweb.modaps.eosdis.nasa.gov/) (accessed on 21 October 2022). After format conversion, projection conversion, data mosaic, data cropping, and multi-period data processing using the python language for batch processing to average NDVI values, precipitation data were acquired from the “1 km resolution monthly precipitation dataset of China from 1901 to 2020” (http://www.geodata.cn/). We selected the precipitation data from 2012 to 2020 to calculate the mean values. Land type data were selected from the 30 m resolution 2020 land use data released by the Ministry of Natural Resources of the People’s Republic of China (http://www.globallandcover.com/) (accessed on 14 October 2022). Finally, we interpolated and resampled all the rasters to unify their spatial resolution to 12.5 m.
Based on the landslide polygon data, we extracted the attribute values of all the environmental factors through GIS. Thus, the environmental factor values corresponding to the landslide position were obtained and used for subsequent statistical analysis.

4. Results and Analysis

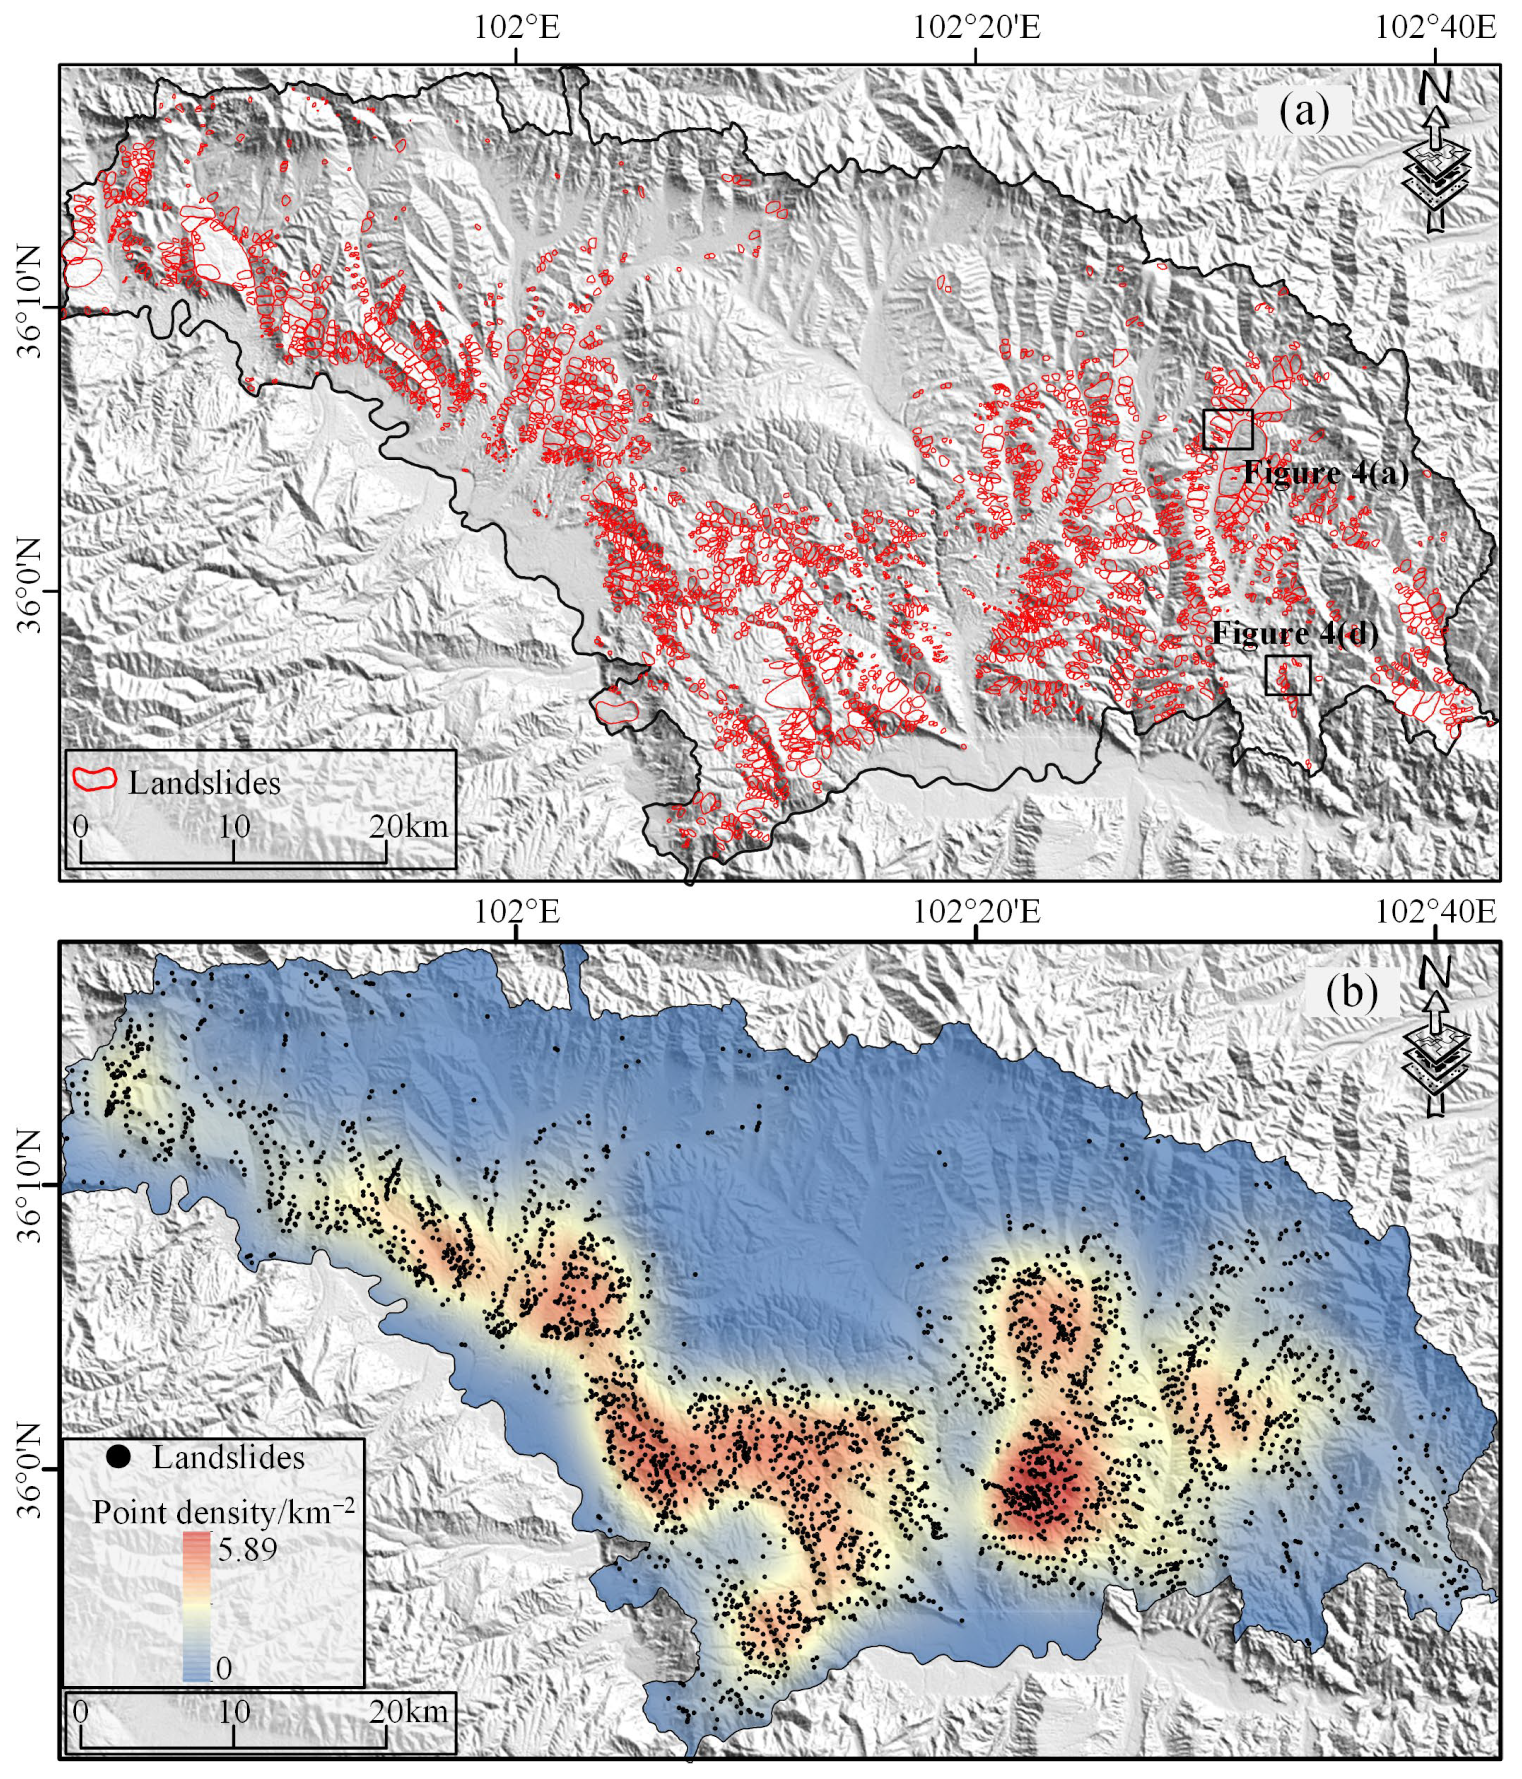
4.1. Landslide Inventory
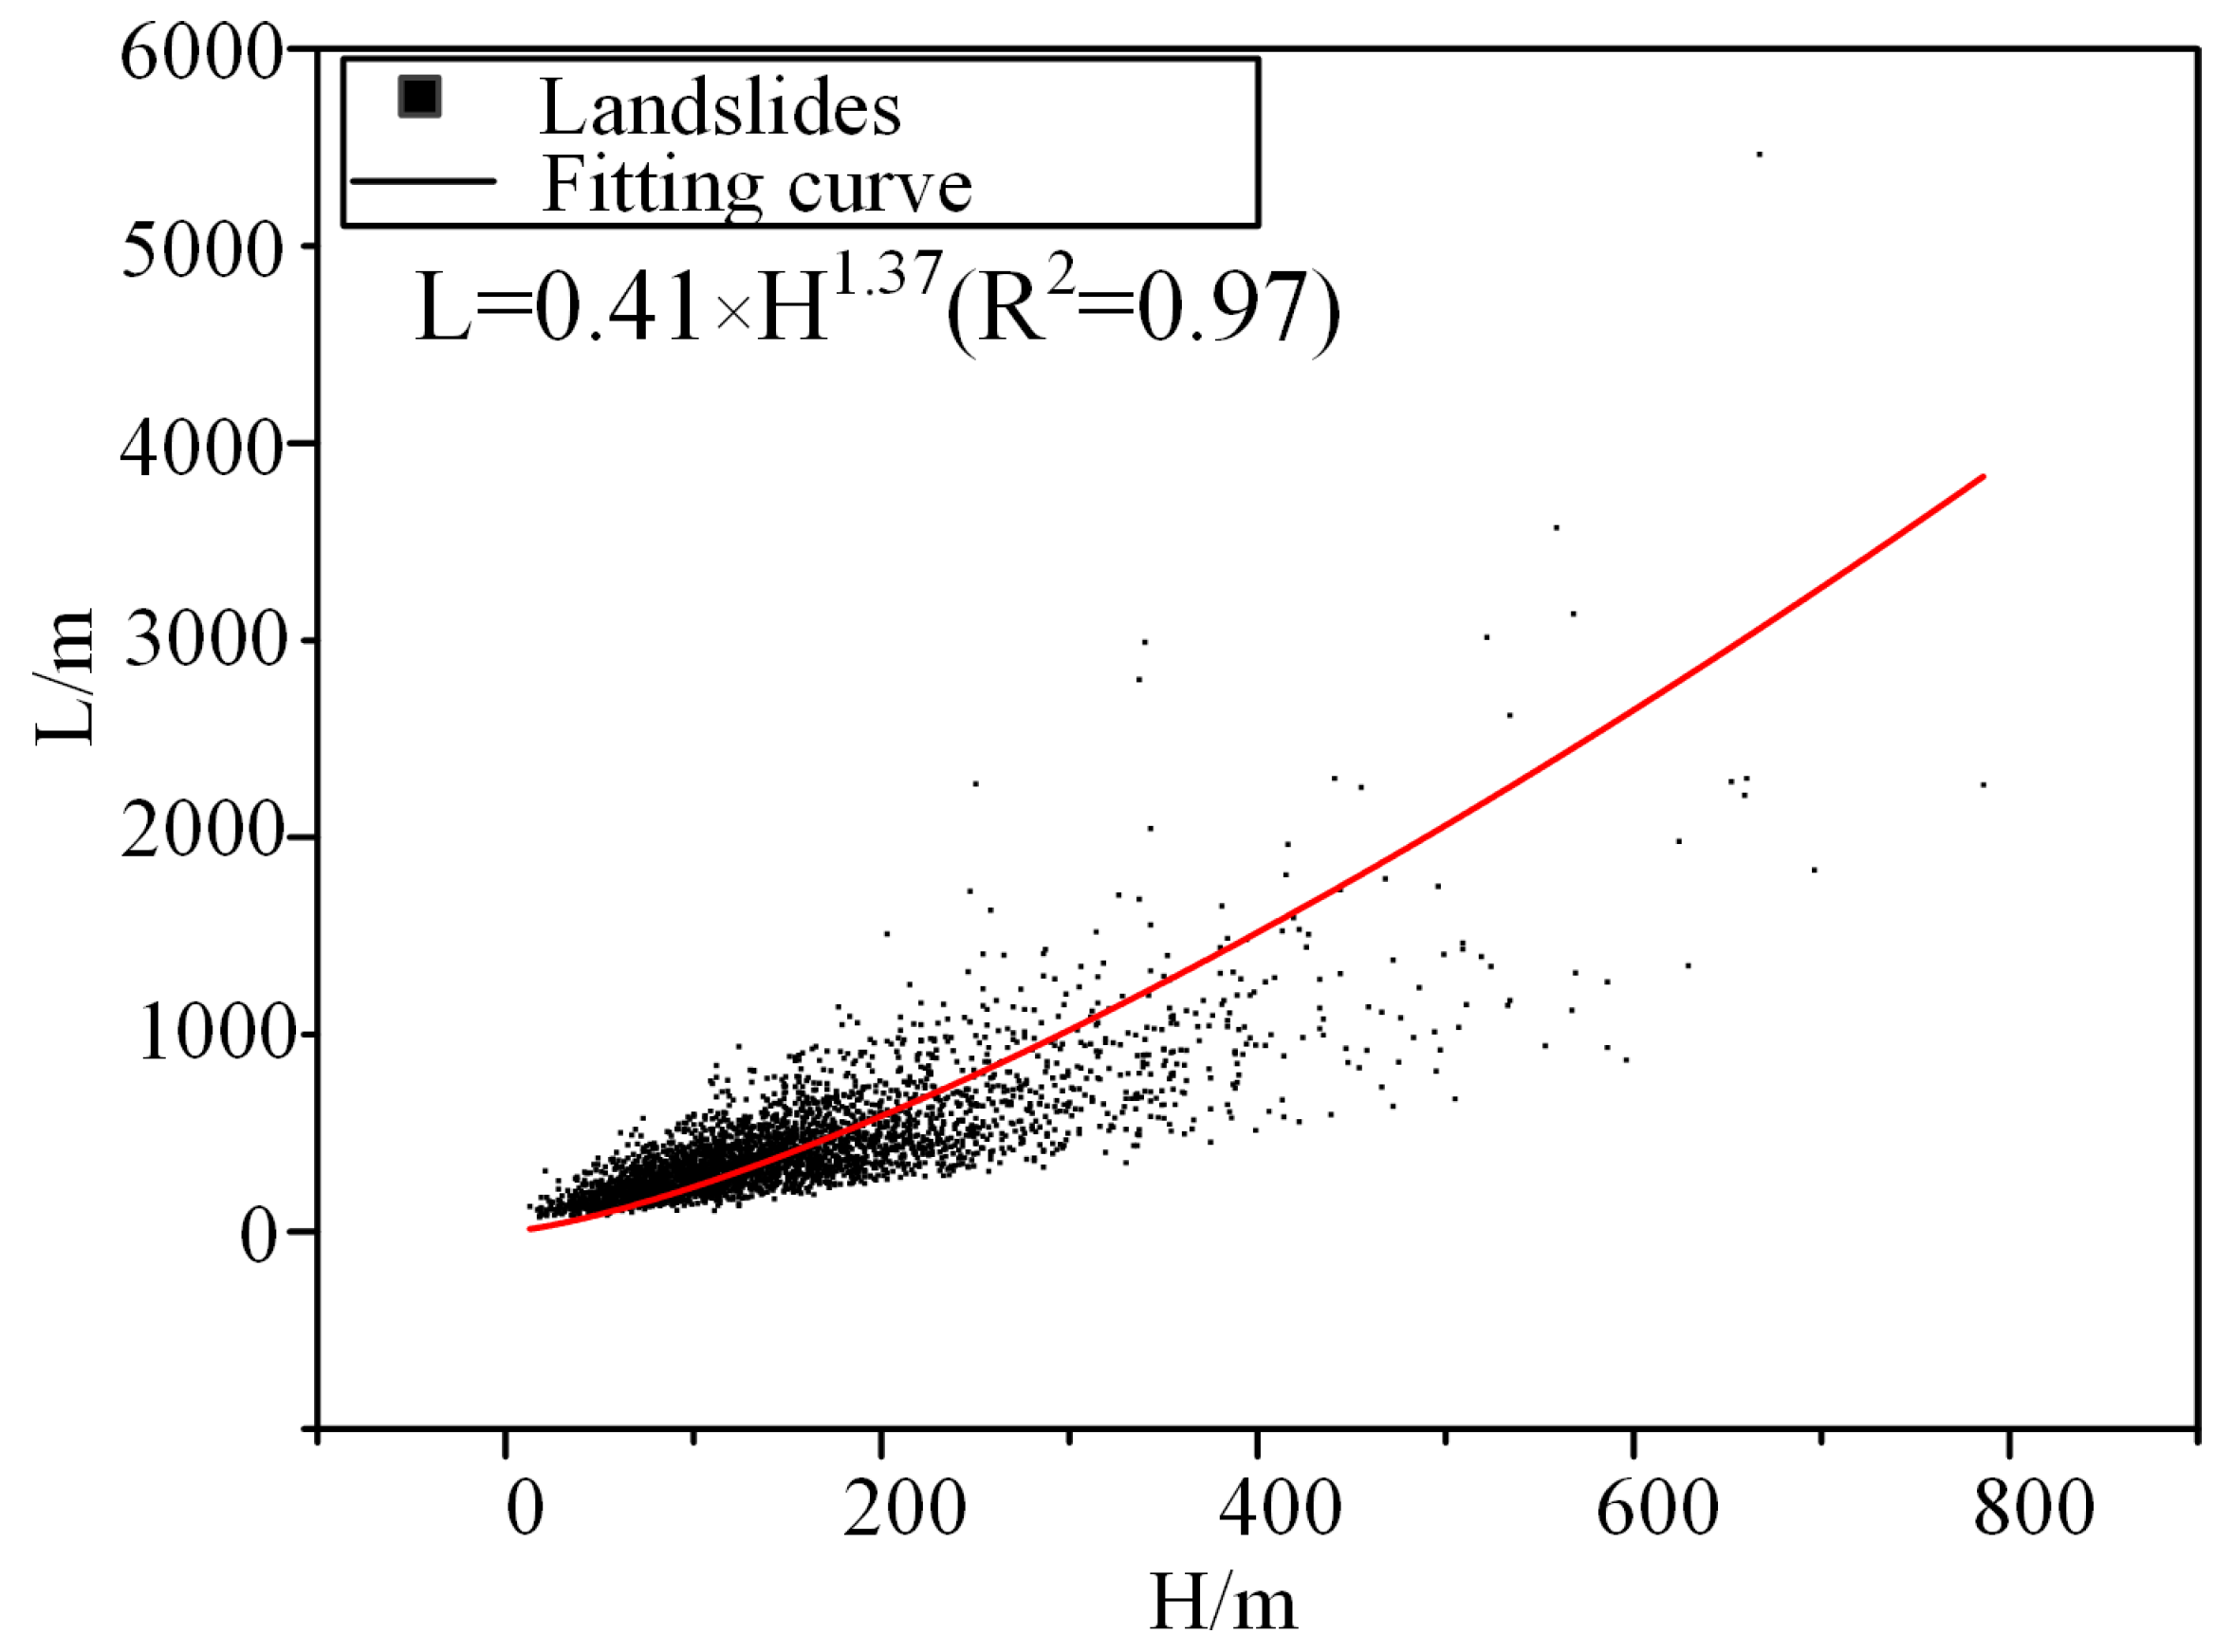
This study identified 3517 landslides with a total area of 419.52 km2. Landslide distribution data can be obtained from our Supplementary Material. The overall distribution of the landslides is shown in Figure 3a. Figure 4 indicates that the landslides are unevenly distributed with some obvious aggregations. We transferred the landslide polygons to point elements and conducted a kernel density analysis with a search radius of 10 km. The results are shown in Figure 3b. It is noticeable that the landslides are mainly clustered in the south and southeast of the study area. By contrast, in the central and northern areas, landslides are less prominent.
We conducted field surveys of typical landslides in the area, shot images using UAV photography, and finally compared them with the corresponding locations on the Google Earth platform. The significance of this work is two-fold: to adjust certain details of the interpreted signs we have established to accord better with the actual situation, and to validate the landslide data we initially obtained, mainly in dense areas. This includes removing the wrongly interpreted date and adding missing landslides. Figure 4 shows the field photos of typical landslides.
We measured the area of each landslide and the results are shown in Figure 5. The average area of the landslides is 119,283 m2, with the largest individual landslide reaching 12.44 km2 and the smallest 2354.6 m2. The frequency density refers to the ratio of the landslide area value frequency to the interval. The area under the curve represents the frequency distribution of landslide area values. The cumulative frequency curve reflects the trend of the relative frequency of landslide area values from 0 to 1. Both curves reflect that landslide area values between 104 and 105 m2 are the most prominent, consistent with previous statistical results.

4.2. H/L

In several large-scale landslide investigations, the equivalent friction coefficient of landslides is an essential index for analysis. Mathematically, it refers to the ratio of the landslide height (H) to the sliding distance (L). The related analysis of the dominant factors of landslides in the upper Yellow River has suggested that landslides dominated by earthquakes and rainfalls differ distinctly in both planform and movement patterns [37]. In related research regarding landslides in mountainous areas of southwest China, landslides were divided into three classes according to the formation mode [38]. The equivalent friction coefficient associated with rocky collapse is greater than 0.6, while that of high remote landslide-debris flow hazard is less than 0.33. In this study, we set the elevation difference of the landslide area as H and set the length of its planar geometry as L. Figure 6 shows the H-L scatter plot and fitted curve, in which the landslide height ranges from 13 to 786 m, with an average height of 151.92 m. In addition, the sliding distance of the landslide ranges from 75.64 to 5497.24 m, with an average of 429.52 m. Related studies have shown that H and L of landslides have a power function or linear relationship [39,40], the former of which was employed in this study for curve fitting. The obtained fitting results are expressed as Equation (1):
L = 0.41 × H 1 37
Figure 7 shows the probability distribution of H/L values. The values are concentrated between 0.3 and 0.4, illustrating that the ancient landslides in the study area were highly mobile, similar to the results obtained by Zhuang et al. (2022) [41], who studied all the non-seismically triggered landslides across the Loess Plateau. Related studies have shown that the equivalent friction coefficients of high-speed remote landslides range from 0.1 to 0.3 [42,43]. In terms of triggering factors, earthquake-triggered landslides or those greatly affected by earthquakes have higher H/L values than rainfall-triggered landslides at the same scale [44]. One group of researchers conducted a statistical analysis of ancient landslides in Lvliang, China [45]. This region has a typical Loess Plateau landscape with few historical earthquakes. Their results showed that the H/L values were concentrated in the range of 0.2–0.25, probably attributable to the high water content of the soil. Related studies analyzed the coseismic landslides triggered by the 2015 Nepal earthquake [46]. In their study, the mean value of H/L was 0.7. By studying the 2017 large landslide in Maoxian County, Sichuan Province, China, studies suggested that it took place in a strong seismic zone and and was affected by two large earthquakes. After calculation, they obtained an equivalent friction angle of 23° and a converted H/L value of 0.42 [47]. Studies on the morphology of coseismic landslides triggered by the 2018 Palu earthquake in Indonesia obtained a mean H/L value of 0.56 [48]. Following these previous studies, we tentatively concluded that most of the landslides in the study area are high-speed remote landslides, which are more strongly influenced by factors such as topography and geology. The H/L of landslides in the study area is closer in terms of numerical distribution to that of rainfall-triggered landslides. To accurately determine the main trigger of landslides, it would be necessary to consider additional factors such as the hydrogeological conditions of slopes, precipitation intensity, and seismic parameters in subsequent studies.

4.3. Spatial Distribution

In this step, we aimed to divide the impact factors into different sections. The total area of each section may demonstrate many differences, thus affecting the number and area of landslides within the section. For this purpose, we primarily chose landslide number density (LND) and landslide area percentage (LAP) as the two indicators to evaluate landslide abundance [49], and thereby evaluate the spatial distribution characteristics of ancient landslides in Hualong County.
L N D = L a n d s l i d e n u m b e r T h e c l a s s i f i c a t i o n a r e a o f t h e f a c t o r i n t e r v a l   ( C A )
L A P = L a n d s l i d e a r e a T h e c l a s s i f i c a t i o n a r e a o f t h e f a c t o r i n t e r v a l   ( C A )

4.3.1. Topographic Factors

The lowest elevation of the landslide site is 2040 m, while the highest is 3872 m. Therefore, to divide the elevation range into ten intervals, we set 2000 m as the starting point and 200 m as the interval. The statistical results are shown in Figure 8. From 2600 to 2800 m, both LND and LAP reach the maximum value of 2.42 km−2 and 28.16%, respectively, and the total area of this interval is 531.95 km2, indicating that the number and area of landslides in this interval are significantly larger than those in other intervals. According to statistics, 1289 landslides developed in this interval with an area of 149.8 km2, accounting for 36.65% and 35.71% of the total, respectively.
The slope of the study area ranges from 0–80.27°, but the highest slope angle of the landslide area reaches 48.77°. Thus, we only considered slopes within 0–50°, with a 10° interval. The corresponding results are shown in Figure 9. In the slope interval of 10–20°, both LAP and LND reach their peaks at 27.24% and 1.76 km−2, respectively. In addition, it is to be noted that landslides are dominantly developed in the interval of 20–30°. The LAP and LNP are 12.36% and 1.61 km−2, respectively, second only to the above-peak ones.
The due north direction is set as 0°, and 10° is used as an interval for statistical analysis. The results are shown in Figure 10. In the slope intervals of 0–10°, 40–50°, 90–100°, 130–140°, 220–230°, 270–280°, and 310–320°, the landslides are very developed compared with those in other intervals. Among them, the maximum LAP value is located within the interval of 270–280°, reaching 109.21%. This is due to the development of large individual landslides in the interval. Large individual landslides may cover multiple slopes rather than a single one, but in the statistics, we selected the slope with the largest proportional area as its property. The maximum LND value is 5.93 km−2, which occurs in the interval of 310–320°. In addition, landslide number and landslide area reach their maximums in the interval of 220–230° and 270–280°, peaking at 429 and 70 km2, respectively. After associating the slope to specific directions, we found that landslides developed predominantly in the SW, W, and NW directions.

4.3.2. Geological Factors

The earliest dated strata in the study area are the Paleo-Proterozoic Hualong group and the Tuolai group, while the most recent are the multi-type sediments of the Quaternary Holocene. Due to the complex lithology, we divided the interval by stratigraphic age. The detailed classification is shown in Table 2. The statistical results are shown in Figure 11. In the stratigraphic intervals of the Paleogene and Neogene strata, the LAP and LNP values are much higher than those in other intervals. In the Neogene strata, the maximum LAP value reaches 24.81%, while the maximum LND value (2.36 km−2) is observed in the Paleogene strata.
The farthest landslide from the faults occured at a distance of 15,040 m. Given that these distant faults only exert a limited impact on landslides, we combined the intervals above 10 km into a single interval, while the remaining intervals were set to 2 km. The statistical results are shown in Figure 12, in which the area in the region 0–2 km from the faults is very high, reaching 1094.1 km2. This is related to the widespread distribution of the fault, which to some extent causes the low LAP and LND values therein. The LND reaches its maximum (1.62 km−2) in the region that is 4–6 km from the faults, while the LAP reaches its maximum (24.52%) in the 8–10 km range.
The study area is characterized by multiple types of land, including cultivated land, forest land, grassland, shrubland, wetland, water bodies, tundra, artificial surface, bare land, and glacial snow. However, those occupied by landslides are only cultivated land, forest land, grassland, and shrubland. We categorized the four types of land into four sections and compiled the statistical results, as shown in Figure 13. It is noticeable that in the grassland section, both LND and LAP reach their maximum at 1.7 km−2 and 18.09%, respectively.

4.3.3. Hydrological and Ecological Factors

The maximum mean annual precipitation in the study area is 667.23 mm. Specifically, in the region occupied by landslides the maximum and minimum precipitation are 639.21 mm and 444.78 mm, respectively. Therefore, we selected 440 mm as the starting point and 20 mm as the interval, obtaining 10 intervals. The statistical results are shown in Figure 14, in which LND, LAP, and CA all initially increase and subsequently decrease. Both LND and LAP reach their maximum in the interval of 480–500 mm, being 2.6 km−2 and 33.93%, respectively.
As the study area is located in the Yellow River basin, rivers are widely distributed. The farthest landslide from the rivers occured at a distance of 5200.96 m. As there were only 42 landslides with a distance greater than 4 km, we set 1 km as the interval and combined the regions with distances larger than 4 km into one single interval. The statistical results are shown in Figure 15, in which the overall interval area gradually decreases with the increase of the distance from the rivers, but the variations of LAP and LNP are complicated. LAP reaches its maximum (16.82%) within 0–1 km from the rivers, while LND reaches its maximum (1.52 km−2) within 3–4 km.
In addition, vegetation is an important factor affecting the occurrence of landslides, and the NDVI index can effectively reflect the degree of vegetation. In the study area, the NDVI index ranges from −0.13 to 0.55, while the index in the landslide-distributed region ranges from 0.12 to 0.48. Therefore, we set 0.1 as the starting point and 0.05 as the interval. The statistical results are shown in Figure 16, where LND and LAP reach their maximum values at 2.49 km−2 and 34.89%, respectively, in the interval of 0.25–0.3.

5. Discussion

In terms of topographic factors, landslides were predominantly distributed in the elevation of 2600–2800 m. Other researchers obtained similar results [50], that is, landslide elevation values are mainly concentrated between 2000–2800 m, especially 2400–2800 m. This elevation range corresponds to a low mountainous hilly area, adjacent to the river valley alluvial plain. We suggest that the strong downcutting of the Yellow River and the anadromous erosion of the tributaries have an important influence on landslide development in this area. Additionally, the slope of the landslides in the study area is concentrated at 10–20°, partly consistent with the 15–20° obtained in previous research [50]. This small slope bias is common in ancient landslide studies. Since large ancient landslides are formed early, they may slide again or slowly migrate in the case of instability, thus decreasing the landslide slope. With regard to aspect, landslide development is most prominent in the SW, W, and NW directions, and most of the faults in the study area are oriented in the NW-SE direction. Thus, we suggest that landslides are controlled by a variety of environmental factors, in addition to fault activities.
In terms of stability, the surface of mudstone is strongly weathered and is prone to softening and disintegration when exposed to water. By contrast, the lower intact mudstone or sandstone is a relative water barrier, and a soft structural surface is easily formed above this layer [51]. Loess has large pores and vertical joints with good permeability, and thus is prone to softening and sliding when exposed to water [52]. All these properties provide favorable conditions for the development of landslides. Most of the land types in Hualong County are cultivated land, grassland, and forest land. Landslides mainly develop within the grassland and arable land categories, possibly related to agricultural irrigation. Due to long periods of agricultural irrigation, groundwater in the loess area is influenced by irrigation recharge, and the water level continues to rise, resulting in the gradual deformation of soil at the foot of the slope, causing slope instability. For this type of landslide, the most affected area is the Heifangtai area in Lanzhou City [53].
Precipitation is another important factor in triggering landslides [54]. In our study area, landslides were mainly concentrated in the average precipitation range of 480–500 mm. NDVI represents the degree of vegetation, and landslide development is dominant in the NDVI value range of 0.25–0.3. Related studies have shown that in Hualong County, the precipitation increases with the increase of vertical elevation. Therefore, a possible interpretation can be proposed: the vegetation in the low-elevation hilly area is sparse with strong soil erosion. The heavy precipitation from the high-altitude northern mountain range area inevitably converges to the southern hilly area, and the surface water flow results in strong erosion. As a result, the mountain slope forms a steep slope or free faces therein, which in turn leads to slope destabilization and eventually triggers landslides.
The regularity of landslide distribution is not obvious in the analysis of the fault and river factors. If we consider only the number and area, then we get a gradually decreasing trend, but this is not objective. We must admit that both LND and LAP have high values in intervals far from the factors. We consider this to be a reflection of the limited degree of influence of the factor, but also an indication of the complexity of landslide genesis in the region. This complexity will be the main object of future study.

6. Conclusions

Based on the Google Earth platform, an inventory of ancient landslides in Hualong County, Qinghai Province, China was deciphered and established. In total, 3517 landslides were identified in the study area, covering an area of 419.52 km2. The average area of the landslides was 119,283 m2, among which the largest individual landslide had an area of 12.44 km2, and the smallest 2354.6 m2.
This study showed that the 2600–2800 m elevation range is the landslide-prone zone, and the slope of the landslides is concentrated in the range of 10–20°. Furthermore, landslides with SW, W, and NW aspects are predominant. Mudstone and sandstone of the Paleoproterozoic and Neoproterozoic systems and Quaternary loess form the main strata in the landslide occurrence area. Landslides are concentrated within 8–10 km from the fault and 0–1 km from the rivers. Cultivated land and grassland are the main land types in landslide occurrence areas. Finally, landslides are predominantly concentrated in the areas with an NDVI from 0.25 to 0.3, average precipitation from 480 to 500 mm, and an elevation ranging from 2600 to 2800 m.
Geometric analysis of landslides showed that the average height and length of the ancient landslides in the study area were 151.92 m and 429.52 m, respectively. The regression relationship (L = 0.41 × H1.37) was obtained by fitting the heights (H) and lengths (L). The inventory of ancient landslides in Hualong County established in this study can provide a reference value for the mapping and hazard evaluation of landslide susceptibility in the area and is critical for understanding the long-term influence of landslides on geomorphic evolution.

Supplementary Materials

Landslide vector data interpreted in this study can be downloaded from https://www.mdpi.com/article/10.3390/land12010136/s1.

Author Contributions

Conceptualization, X.X.; Data curation, L.L., X.H., J.C. and J.L.; Writing—original draft, Y.H.; Writing—review & editing, C.X. and X.Z. All authors have read and agreed to the published version of the manuscript.

Funding

This study was supported by the National Institute of Natural Hazards, the Ministry of Emergency Management of China (ZDJ2020-14), and the Lhasa National Geophysical Observation and Research Station (NORSLS20-07).

Institutional Review Board Statement

Not applicable.

Informed Consent Statement

Not applicable.

Data Availability Statement

The supporting data of this study are available in the Supplementary Materials of this article.

Conflicts of Interest

The authors declare no conflict of interest.

References

  1. Froude, M.J.; Petley, D.N. Global fatal landslide occurrence from 2004 to 2016. Nat. Hazards Earth Syst. Sci. 2018, 18, 2161. [Google Scholar] [CrossRef] [Green Version]
  2. Xu, X.W.; Xu, C. Natural Hazards Research: An eternal subject of human survival and development. Nat. Hazards Res. 2021, 1, 1. [Google Scholar] [CrossRef]
  3. Gokceoglu, C.; Sezer, E. A statistical assessment on international landslide literature (1945–2008). Landslides 2009, 6, 345. [Google Scholar] [CrossRef]
  4. Huang, Y.D.; Xu, C.; Zhang, X.J.; Li, L. Bibliometric analysis of landslide research based on the WOS database. Nat. Hazards Res. 2022, 2, 49. [Google Scholar] [CrossRef]
  5. Xu, C.; Xu, X.W.; Yao, X.; Dai, F.C. Three (nearly) complete inventories of landslides triggered by the May 12, 2008 Wenchuan Mw 9 earthquake of China and their spatial distribution statistical analysis. Landslides 2014, 11, 441. [Google Scholar] [CrossRef] [Green Version]
  6. Basharat, M.; Rohn, J.; Baig, M.S.; Khan, M.R. Spatial distribution analysis of mass movements triggered by the 2005 Kashmir earthquake in the Northeast Himalayas of Pakistan. Geomorphology 2014, 206, 203. [Google Scholar] [CrossRef]
  7. Huang, Y.D.; Xu, C.; Zhang, X.L.; Xue, C.J.; Wang, S.Y. An updated database and spatial distribution of landslides triggered by the Milin, Tibet Mw4 earthquake of 18 November. J. Earth Sci. 2021, 32, 1069. [Google Scholar] [CrossRef]
  8. Hu, S.; Qiu, H.J.; Wang, N.L.; Cui, Y.F.; Wang, J.F.; Wang, X.G.; Ma, S.Y.; Yang, D.D.; Cao, M.M. The influence of loess cave development upon landslides and geomorphologic evolution: A case study from the northwest Loess Plateau, China. Geomorphology 2020, 359, 107167. [Google Scholar] [CrossRef]
  9. Mazzanti, P.; Caporossi, P.; Brunetti, A.; Mohammadi, F.I.; Bozzano, F. Short-term geomorphological evolution of the Poggio Baldi landslide upper scarp via 3D change detection. Landslides 2021, 18, 2367. [Google Scholar] [CrossRef]
  10. Xu, C.; Shen, L.L.; Wang, G.L. Soft computing in assessment of earthquake-triggered landslide susceptibility. Environ. Earth Sci. 2016, 75, 767. [Google Scholar] [CrossRef]
  11. Ma, S.Y.; Shao, X.Y.; Xu, C. Characterizing the Distribution Pattern and a Physically Based Susceptibility Assessment of Shallow Landslides Triggered by the 2019 Heavy Rainfall Event in Longchuan County, Guangdong Province, China. Remote Sens. 2022, 14, 4257. [Google Scholar] [CrossRef]
  12. Shao, X.Y.; Xu, C. Earthquake-induced landslides susceptibility assessment: A review of the state-of-the-art. Nat. Hazards Res. 2022, 2, 172. [Google Scholar] [CrossRef]
  13. Rosvold, E.L.; Buhaug, H. GDIS, a global dataset of geocoded disaster locations. Sci. Data 2021, 8, 61. [Google Scholar] [CrossRef]
  14. Pennington, C.; Freeborough, K.; Dashwood, C.; Dijkstra, T.; Lawrie, K. The National Landslide Database of Great Britain: Acquisition, communication and the role of social media. Geomorphology 2015, 249, 44. [Google Scholar] [CrossRef] [Green Version]
  15. Taylor, F.E.; Malamud, B.D.; Freeborough, K.; Demeritt, D. Enriching Great Britain’s National Landslide Database by searching newspaper archives. Geomorphology 2015, 249, 52. [Google Scholar] [CrossRef] [Green Version]
  16. Shao, X.Y.; Ma, S.Y.; Xu, C.; Shen, L.L.; Lu, Y.K. Inventory, Distribution and Geometric Characteristics of Landslides in Baoshan City, Yunnan Province, China. Sustainability 2020, 12, 2433. [Google Scholar] [CrossRef] [Green Version]
  17. Li, L.; Xu, C.; Yao, X.L.; Shao, B.; Ouyang, J.H.; Zhang, Z.J.; Huang, Y.D. Large-scale landslides around the reservoir area of Baihetan hydropower station in Southwest China: Analysis of the spatial distribution. Nat. Hazards Res. 2022, 2, 218. [Google Scholar] [CrossRef]
  18. Tsou, C.Y.; Chigira, M.; Higaki, D.; Sato, G.; Yagi, H.; Sato, H.P.; Wakai, A.; Dangol, V.; Amatya, S.C.; Yatagai, A. Topographic and geologic controls on landslides induced by the 2015 Gorkha earthquake and its aftershocks: An example from the Trishuli Valley, central Nepal. Landslides 2018, 15, 953. [Google Scholar] [CrossRef]
  19. Tian, Y.Y.; Xu, C.; Ma, S.Y.; Xu, X.W.; Wang, S.Y.; Zhang, H. Inventory and spatial distribution of landslides triggered by the 8th August 2017 Mw5 Jiuzhaigou Earthquake, China. J. Earth Sci. 2019, 30, 206. [Google Scholar] [CrossRef]
  20. Lin, Q.G.; Wang, Y. Spatial and temporal analysis of a fatal landslide inventory in China from 1950 to 2016. Landslides 2018, 15, 2357. [Google Scholar] [CrossRef]
  21. Wei, Z.F.; Cai, X.Y.; Zhang, J.C.; Ying, Z.M.; Yan, H.J.; Wei, S.J. Temporal and spatial characteristics of landslide, rockfall and debris flow disasters in Qinghai Province during the period. Chin. J. Geol. Hazard Control 2021, 32, 134. [Google Scholar] [CrossRef]
  22. Wei, G.; Yin, Z.Q.; Shi, L.Q.; Ma, W.L.; Cui, X.H. Zoning of geological disasters of Hualong county in Qinghai province. Chin. J. Geol. Hazard Control 2013, 24, 86. [Google Scholar] [CrossRef]
  23. Yin, Z.Q.; Qin, X.G.; Zhao, W.J.; Wei, G. Characteristics of landslides in upper reaches of Yellow River with multiple data of remote sensing. J. Eng. Geol. 2013, 21, 779. [Google Scholar] [CrossRef]
  24. Yuan, D.Y.; Zhang, P.Z.; Lei, Z.S.; Liu, B.C.; Liu, X.L. A preliminary study on the new activity features of the Lajishan mountain fault zone in Qinghai province. Earthq. Res. China 2005, 21, 93. [Google Scholar] [CrossRef]
  25. Meena, S.R.; Soares, L.P.; Grohmann, C.H.; van Westen, C.; Bhuyan, K.; Singh, R.P.; Floris, M.; Catani, F. Landslide detection in the Himalayas using machine learning algorithms and U-Net. Landslides 2022, 19, 1209. [Google Scholar] [CrossRef]
  26. Yang, Z.Q.; Xu, C.; Li, L. Landslide Detection Based on ResU-Net with Transformer and CBAM Embedded: Two Examples with Geologically Different Environments. Remote Sens. 2022, 14, 2885. [Google Scholar] [CrossRef]
  27. Hernandez, N.D.; Pastrana, A.A.; Garcia, L.C.; de Leon, J.C.V.; Alvarez, A.Z.; Morales, L.D.; Nemiga, X.A.; Posadas, G.D. Co-seismic landslide detection after M 4 earthquake on June 23, 2020, in Oaxaca, Mexico, based on rapid mapping method using high and medium resolution synthetic aperture radar (SAR) images. Landslides 2021, 18, 3833. [Google Scholar] [CrossRef]
  28. Sinčić, M.; Bernat Gazibara, S.; Krkač, M.; Lukačić, H.; Mihalić Arbanas, S. The Use of High-Resolution Remote Sensing Data in Preparation of Input Data for Large-Scale Landslide Hazard Assessments. Land 2022, 11, 1360. [Google Scholar] [CrossRef]
  29. Murillo-García, F.G.; Alcántara-Ayala, I.; Ardizzone, F.; Cardinali, M.; Fiourucci, F.; Guzzetti, F. Satellite stereoscopic pair images of very high resolution: A step forward for the development of landslide inventories. Landslides 2015, 12, 277. [Google Scholar] [CrossRef]
  30. Rabby, Y.W.; Li, Y. An integrated approach to map landslides in Chittagong Hilly Areas, Bangladesh, using Google Earth and field mapping. Landslides 2019, 16, 633. [Google Scholar] [CrossRef]
  31. Li, L.; Xu, C.; Xu, X.W.; Zhang, Z.J.; Cheng, J. Inventory and distribution characteristics of large-scale landslides in Baoji city, Shaanxi province, China. ISPRS Int. J. Geo-Inf. 2022, 11, 10. [Google Scholar] [CrossRef]
  32. Zhu, Y.X.; Dai, F.C.; Gao, J.X.; Yao, X. A recurrent composite loess landslide in southwestern China. Q. J. Eng. Geol. Hydrogeol. 2019, 52, 17. [Google Scholar] [CrossRef]
  33. Sato, H.P.; Harp, E.L. Interpretation of earthquake-induced landslides triggered by the 12 May 2008, M9 Wenchuan earthquake in the Beichuan area, Sichuan Province, China using satellite imagery and Google Earth. Landslides 2009, 6, 153. [Google Scholar] [CrossRef]
  34. Ding, H.; Zhang, M.S.; Li, L. Interpreting landslides in the northwestern loess plateau using remote sensing images. Quat. Sci. 2011, 31, 1077. [Google Scholar] [CrossRef]
  35. Guzzetti, F.; Mondini, A.C.; Cardinali, M.; Fiorucci, F.; Santangelo, M.; Chang, K.-T. Landslide inventory maps: New tools for an old problem. Earth-Sci. Rev. 2012, 112, 42. [Google Scholar] [CrossRef] [Green Version]
  36. Lan, H.X.; Zhu, Y.B.; Li, L.P.; Pan, B.T.; Hu, Z.B.; Peng, J.B. Research on multi process interaction of geology, geomorphology and climate in the Yellow River basin and its gestation mechanisms on major disasters. Bull. Natl. Nat. Sci. Found. China 2021, 35, 510. [Google Scholar] [CrossRef]
  37. Yin, Z.Q.; Wei, G.; Qin, X.G.; Li, W.J.; Zhao, W.J. Research progress on landslides and dammed lakes in the upper reaches of the Yellow River, northeastern Tibetan Plateau. Earth Sci. Front. 2021, 28, 46. [Google Scholar] [CrossRef]
  38. Gao, Y.; He, K.; Li, Z.; Gao, H.Y.; Wei, T.Y.; Xing, A.G.; Li, B. An analysis of disaster types and dynamics of landslides in the southwest karst mountain areas. Hydrogeol. Eng. Geol. 2020, 47, 14. [Google Scholar] [CrossRef]
  39. Hattanji, T.; Moriwaki, H. Morphometric analysis of relic landslides using detailed landslide distribution maps: Implications for forecasting travel distance of future landslides. Geomorphology 2009, 103, 447. [Google Scholar] [CrossRef] [Green Version]
  40. Guo, C.B.; Zhang, Y.S.; Montgomery, D.R.; Du, Y.B.; Zhang, G.Z.; Wang, S.F. How unusual is the long-runout of the earthquake-triggered giant Luanshibao landslide, Tibetan Plateau, China? Geomorphology 2016, 259, 145. [Google Scholar] [CrossRef]
  41. Zhuang, J.Q.; Ma, P.H.; Zhan, J.W.; Zhu, Y.; Kong, J.X.; Zhu, X.H.; Leng, Y.Q.; Peng, J.B. Empirical relationships of the landslides in the Chinese Loess Plateau and affect factors analysis. Geomat. Nat. Hazards Risk 2022, 13, 250. [Google Scholar] [CrossRef]
  42. Wang, Y.F.; Dong, J.J.; Cheng, Q.G. Velocity-dependent frictional weakening of large rock avalanche basal facies: Implications for rock avalanche hypermobility? J. Geophys. Res. Solid Earth 2017, 122, 1648. [Google Scholar] [CrossRef]
  43. Wang, Y.F.; Dong, J.J.; Cheng, Q.G. Normal Stress-Dependent Frictional Weakening of Large Rock Avalanche Basal Facies: Implications for the Rock Avalanche Volume Effect. J. Geophys. Res. Solid Earth 2018, 123, 3270. [Google Scholar] [CrossRef]
  44. Fan, X.Y.; Qiao, J.P.; Han, M.; Zeng, Y.X. Volumes and movement distances of earthquake and rainfall-induced catastrophic landslides. Rock Soil Mech. 2012, 33, 3051. [Google Scholar] [CrossRef]
  45. Zhang, X.L.; Lei, L.; Xu, C. Large-scale landslide inventory and their mobility in Lvliang City, Shanxi Province, China. Nat. Hazards Res. 2022, 2, 111. [Google Scholar] [CrossRef]
  46. Tian, Y.Y.; Owen, L.A.; Xu, C.; Shen, L.L.; Zhou, Q.; Figueiredo, P.M. Geomorphometry and Statistical Analyses of Landslides Triggered by the 2015 M w 8 Gorkha Earthquake and the M w 3 Aftershock, Nepal. Front. Earth Sci. 2020, 8, 572449. [Google Scholar] [CrossRef]
  47. Yin, Y.P.; Wang, W.P.; Zhang, N.; Yan, J.K.; Wei, Y.J.; Yang, L.W. Long runout geological disaster initiated by the ridge-top rockslide in a strong earthquake area:A case study of the Xinmo landslide in Maoxian County, Sichuan Province. Geol. China 2017, 44, 827. [Google Scholar] [CrossRef]
  48. Zhao, B. Landslides triggered by the 2018 Mw 5 Palu supershear earthquake in Indonesia. Eng. Geol. 2021, 294, 106406. [Google Scholar] [CrossRef]
  49. Cui, Y.L.; Hu, J.H.; Xu, C.; Miao, H.B.; Zheng, J. Landslides triggered by the 1970 Ms 7 Tonghai earthquake in Yunnan, China: An inventory, distribution characteristics, and tectonic significance. J. Mt. Sci. 2022, 19, 1633. [Google Scholar] [CrossRef]
  50. Yin, Z.Q.; Wei, G.; Qi, X.B.; Zhou, C.Q. Spatial and temporal characteristics of landslides and there response to climatic change from sigou to lagan gorges in upper reaches of Yellow River. J. Eng. Geol. 2013, 21, 129. [Google Scholar] [CrossRef]
  51. Ayalew, L.; Yamagishi, H.; Ugawa, N. Landslide susceptibility mapping using GIS-based weighted linear combination, the case in Tsugawa area of Agano River, Niigata Prefecture, Japan. Landslides 2004, 1, 73. [Google Scholar] [CrossRef]
  52. Wu, L.Z.; Zhou, Y.; Sun, P.; Shi, J.S.; Liu, G.G.; Bai, L.Y. Laboratory characterization of rainfall-induced loess slope failure. Catena 2017, 150, 1. [Google Scholar] [CrossRef]
  53. Xu, L.; Yan, D.D. The groundwater responses to loess flowslides in the Heifangtai platform. Bull. Eng. Geol. Environ. 2019, 78, 4931. [Google Scholar] [CrossRef]
  54. Troncone, A.; Pugliese, L.; Lamanna, G.; Conte, E. Prediction of rainfall-induced landslide movements in the presence of stabilizing piles. Eng. Geol. 2021, 288, 106143. [Google Scholar] [CrossRef]
Figure 1. Topographic map of the study area showing major faults and earthquakes. (a,b) Location map of the study area. (c) Regional tectonic map of the study area. The base map of (a) is derived from Google Earth. The base map of (b) is derived from https://www.webmap.cn/ (accessed on 15 October 2022). The water system data in (c) are derived from https://www.webmap.cn/ (accessed on 15 October 2022). Historical earthquake data were obtained from https://data.earthquake.cn (accessed on 15 October 2022). Faults data were obtained from http://dcc.cgs.gov.cn/ (accessed on 15 October 2022).
Land 12 00136 g001
Figure 2. Typical landslide images on Google Earth. (a) at 35.98° N, 102.39° E, (b) at 35.972° N, 102.383° E, (c) at 36.018° N, 102.5° E, (d) at 35.96° N, 102.42° E. The white arrows represent the general direction of the landslides sliding. The white dashed line is the boundary of the landslides.
Land 12 00136 g002
Figure 3. (a) Landslide distribution map and (b) density map.
Land 12 00136 g003
Figure 4. Typical landslide display map. (a) Enlarged map of the corresponding location in Figure 3. (b,c) Images of the field landslide at different angles, taken from the corresponding location in (a), located at 36°4′48″ E, 102°29′59″ N. (d) Enlarged map of the corresponding location in Figure 3. (e,f) Images of the field landslide at different angles, taken from the corresponding location in (a), located at 35°56′3″ E, 102°32′22″ N.
Land 12 00136 g004
Figure 5. Landslide scale analysis.
Land 12 00136 g005
Figure 6. H-L relationship of landslides.
Land 12 00136 g006
Figure 7. Probability distribution of H/L values.
Land 12 00136 g007
Figure 8. Relationship between elevation and landslide distribution. (a) Elevation distribution in the study area. (b) Statistics of landslide indicators in the elevation intervals.
Land 12 00136 g008
Figure 9. Relationship between slope and landslide distribution. (a) Slope distribution in the study area. (be) Statistics of landslide indicators in the slope intervals.
Land 12 00136 g009
Figure 10. Relationship between aspect and landslide distribution. (a) Aspect distribution in the study area. (be) Statistics of landslide indicators in the aspect intervals.
Land 12 00136 g010
Figure 11. Relationship between lithology and landslide distribution. (a) Lithology distribution in the study area. (b) Statistics of landslide indicators in the lithology intervals.
Land 12 00136 g011
Figure 12. Relationship between the distance from the faults and the landslide distribution. (a) The distribution of the distance from the faults in the study area. (b) Statistics of landslide indicators in the intervals of the distance from the faults.
Land 12 00136 g012
Figure 13. Relationship between land use type and landslide distribution. (a) Land use type distribution in the study area. (b) Statistics of landslide indicators in the land use type intervals.
Land 12 00136 g013
Figure 14. Relationship between average precipitation and landslide distribution. (a) Average precipitation distribution in the study area. (b) Statistics of landslide indicators in the average precipitation intervals.
Land 12 00136 g014
Figure 15. Relationship between the distance from rivers and the landslide distribution. (a) The distribution of the distance from rivers in the study area. (b) Statistics of landslide indicators in the intervals of the distance from rivers.
Land 12 00136 g015
Figure 16. Relationship between NDVI and landslide distribution. (a) NDVI distribution in the study area. (b) Statistics of landslide indicators in the NDVI intervals.
Land 12 00136 g016
Table 1. Catalog of historical earthquakes in the study area.
DateLongitudeLatitudeMs
24 February 1819102.336.15.75
22 December 1968101.936.25.4
1 June 1996101.7836.132.8
4 July 1998101.9136.12.6
5 May 2004101.9136.12.4
15 October 2017102.2236.272.8
Table 2. Descriptions of categorized lithology in the study area.
Lithology No.StratumMain Lithology Description
Pt1Paleo-ProterozoicGneiss, Marble Schist, Amphibolite
ЄCambrianAndesite, Basalt
OOrdovicianAndesite, Basalt, Slate, Sandstone
SSilurianShale, Sandstone, Conglomerate, Andesite, Basalt
DDevonianConglomerate, Sandstone, Breccia
TTriassicSlate, Limestone
KCretaceousMudstone, Sandstone
EPaleogeneSiltstone, Mudstone, Gypsum
NNeogeneMudstone, Siltstone, Sandstone, Conglomeratic sandstone
QQuaternaryQuaternary deposits, Loess
γPre-JurassicGranite, Amphibole
Disclaimer/Publisher’s Note: The statements, opinions and data contained in all publications are solely those of the individual author(s) and contributor(s) and not of MDPI and/or the editor(s). MDPI and/or the editor(s) disclaim responsibility for any injury to people or property resulting from any ideas, methods, instructions or products referred to in the content.

