Article

Phylogeny and Morphology Determine Vulnerability to Global Warming in Pristimantis Frogs

by
Pamela González-del-Pliego
1,2,*,
Robert P. Freckleton
1,
Brett R. Scheffers
3,
Edmund W. Basham
3,4,
Andrés R. Acosta-Galvis
5,6,
Claudia A. Medina Uribe
6,
Torbjørn Haugaasen
7 and
David P. Edwards
1
1
Ecology and Evolutionary Biology, School of Biosciences, University of Sheffield, Sheffield S10 2TN, UK
2
Rui Nabeiro Biodiversity Chair, MED Institute, Universidade de Évora, 7000 Évora, Portugal
3
Department of Wildlife Ecology & Conservation, Newins-Ziegler Hall, University of Florida/IFAS, Gainesville, FL 32611, USA
4
Department of Geography, University of Sheffield, Sheffield S10 2TN, UK
5
Batrachia Foundation, Carrera 58, 125B-29, Bogotá 111121, Colombia
6
Instituto de Investigación de Recursos Biológicos Alexander von Humboldt, Calle 28A # 15-09, Bogotá 111311, Colombia
7
Faculty of Environmental Sciences and Natural Resource Management, Norwegian University of Life Sciences, 1432 Ås, Norway
*
Author to whom correspondence should be addressed.
Land 2023, 12(1), 130; https://doi.org/10.3390/land12010130
Submission received: 25 November 2022 / Revised: 23 December 2022 / Accepted: 28 December 2022 / Published: 31 December 2022
(This article belongs to the Special Issue Climate Adaptation and Biodiversity Conservation)

Abstract

:
Global warming is a great threat to biodiversity with negative impacts spanning the entire biological hierarchy. One of the main species’ traits determining survival at higher temperature is the thermal point at which an animal loses its ability to escape from deadly conditions (critical thermal maximum—CTmax). Variation in CTmax across species is the outcome of environmental and evolutionary factors, but studies do not typically measure the degree to which environment or phylogeny influences the variation in trait values. Here, we aim to elucidate whether local environmental variables or phylogeny influence CTmax in highly climate change-threatened amphibians in the Tropical Andes. We measured CTmax from 204 individuals belonging to seven Pristimantis frog species encountered in primary and secondary forests, and cattle pastures. We recorded their habitat, elevation, and the range of environmental temperatures they experienced over one year. Using phylogenetic analyses, we demonstrate that physiological thermal tolerance is related to phylogeny, positively related to body length, but not affected by environmental factors. We suggest that both phylogeny and morphology determine vulnerability to global warming.

1. Introduction

The rate of global warming is accelerating and is severely threatening the entire hierarchy of biological organization [1]. The impacts of global warming on organisms will depend, among other factors (e.g., see [2]), on their level of exposure combined with their physiological sensitivity and tolerance to high temperatures [3,4]. Consequently, a species’ critical thermal maximum (CTmax), the thermal point at which an animal loses its ability to escape from deadly conditions [5], is a vital trait in understanding thermal stress and vulnerability to increasing temperatures [6] and can also improve our predictions of species’ vulnerability to global warming [7].
Variation in species’ traits, including CTmax, is a function of both environmental exposure and the evolutionary history of species [8,9]. In vertebrate ectotherms, for example, CTmax has been considered a stable evolutionary trait [10]. Yet, there are also strong environmental effects, where acclimation to extraordinarily hot and/or cold temperatures can move the thermal ceiling up and down, respectively [11,12]. However, in this nature versus nurture scenario, it is generally unknown whether environment or phylogeny is more important in determining trait variation across species [8].
A key question is whether upper thermal tolerances can adjust through plastic and/or evolutionary responses, which would aid in predicting species’ potential responses to global warming [4,7,13]. Phylogenetic comparative analyses may provide the best method [14] to test if the rate of evolution of a trait is too slow to match the rate of change in an external driver (e.g., environmental change) [15,16]. A strong phylogenetic signal might arise from selection or could suggest that CTmax is evolutionarily conserved across the phylogeny, thus making local adaptation to environmental factors challenging because changes in CTmax would not match changes in the environment. Alternatively, a weak phylogenetic signal could suggest strong phenotypic plasticity in CTmax to changing environmental conditions. Here, we aim to incorporate phylogenetic information into comparative analyses to reveal correlations between CTmax and environmental variables [8,17].
We chose amphibians as our study organism as they are a highly threatened taxon [18] and because ectotherms are especially dependent on environmental variables to perform their basic bodily activities (e.g., food intake, reproduction). Since impacts of habitat loss and degradation on local temperature [19] are likely to synergize with climate change, we chose a disturbance-climate gradient, including secondary forests. These are likely to become the most widespread habitat type in the future [20], and each of these habitats will exert different levels of thermal stress, which may define the capacity to evolve upper thermal limits [21]. Information on phylogenetic constraints in thermal limits will help further assess this threatened taxon.
The spatial scale (resolution) of environmental variables used can result in some variables not representing accurately the actual conditions experienced by species and/or a geographical or environmental bias, all of which can ultimately decrease the phylogenetic signal of CTmax [22,23]. In broad-scale studies, environmental variables that might influence a species’ phenotype tend to be averaged across the species’ broad geographic range. By contrast, phenotypic plasticity occurs within populations at local spatial scales [24]. Thus, studies that test for phenotypic responses across large spatial extents must overcome a scaling issue whereby environmental variables (e.g., averaged maximum temperature within a grid cell) occur at different scales than that at which selection for phenotypes occurs. This is one of few studies to use a small-scale approach to ask whether local environmental or phylogenetic factors shape the evolution and distribution of local physiology. We hypothesize that: (1) local environmental variables will influence CTmax variation, but not to a great degree because tropical species have small geographical ranges, occupy a narrow range of climatic conditions and experience low environmental variability [22]; (2) phylogeny will be strongly related to upper thermal limits, since they are a stable evolutionary trait in ectothermic vertebrates [10]; and (3) morphologically larger species will show higher CTmax as body size has been shown to influence species’ CTmax [25]. We tested these hypotheses in Pristimantis frogs in the Tropical Andes, which is a global hotspot of extinction risk and species endemism and found that both phylogeny and morphology determine vulnerability to global warming.

2. Materials and Methods

2.1. Study Site

Our study area is located on the western slope of the Western cordillera of the Colombian Andes, in the Reserva Mesenia-Paramillo, Antioquia (−75.8895 lon, 5.4950 lat). The study area covered an altitudinal range of 2100 m–2690 m above sea level and it encompassed primary forest, naturally regenerating secondary forests and cattle pasture.

2.2. Study Organisms

Between July and August 2014, we collected frogs from 12 species of the genus Pristimantis (Craugastoridae, Anura). Frogs were identified to species level by a regional expert (ARA-G), based in a reference collection housed in the Biological Collections of the Instituto de Investigación de Recursos Biológicos Alexander von Humboldt Colombia, Villa de Leyva, Boyacá, Colombia (IAvH-Am). Voucher specimens were collected under a permit issued by the Alexander von Humboldt Biological Resources Research Institute (IAvH) (Decree 1376 of 2013). These small frogs (range 10–37 mm) have the highest abundance in our study area [26]. Frogs were sampled in 25 m × 10 m transects, each separated by at least 200–300 m, in primary forest (24 transects), old secondary forest (7 transects), young secondary forest (16 transects), and cattle pasture (15 transects; Table S1).

2.3. Trait Variation–Critical Thermal Maximum (CTmax)

We follow the same methodology as [7] to measure CTmax. We used the loss of righting response (LRR) as an indicator of CTmax [27,28]. 222 frogs were kept in the field laboratory with a similar photoperiod regime 3 to 4 days before experiments [28] at 2200 m a.s.l. (15 individuals were kept for 5 days due to logistical difficulties, but CTmax did not differ between these and the individuals acclimated for fewer days). As von May (2019) explained, we performed our experiments in a field where fully controlled conditions are difficult to achieve, however, we strived to maintain similar ambient temperature conditions for all individuals (housed within 16.5–18.5 °C range). Frogs were placed in a plastic cup with a thin layer of water (1.5 mL) to prevent desiccation [27], and cups were positioned in a water bath. The temperature of the water started at 17 °C [28] and increased by 0.45 °C per minute on average [7].
We used the probe of a two-channel digital thermometer (K-type; resolution: 0.1 °C, accuracy: ±0.1 °C) to gently but often turn the frogs over on their backs. We incited individuals to righten by touching their inner thighs. After 5 s, if the frog was incapable of rightening, we registered its temperature by touching one flank with the probe [27,28]. We considered this temperature as the core body temperature since small-sized frogs have high heat transfer [28]. The frogs were immediately placed in a cool container [27], and observed for 24 h to verify they were ready to be released (there were no mortalities in our study). In addition, we recorded individuals’ body lengths by measuring the snout-vent length (SVL). Note that we measured CTmax at a loss of righting response rather than at the onset of spasms and, as such, our CTmax measurements could be considered conservative.

2.4. Measuring Environmental Exposure

We used habitat type, elevation, maximum empirical temperature, and climatic niche breadth as environmental variables that may be related to CTmax variation:

2.4.1. Habitat Type and Elevation

Habitat type and elevation can be important factors influencing variation in CTmax [29,30]. We categorized habitat type into 4 categories: primary forest (pristine forest), old secondary forest (≥19 years old), young secondary forest (<19 years old), and cattle pasture. As well as recording the habitat type per individual, we used a GPS to record the elevation where each individual was found.

2.4.2. Temperature

To determine if the temperature is shaping the evolution of CTmax, we monitored individuals’ temperature exposure. From March 2014 to February 2015, we recorded understorey ambient temperature, which is buffered by above-ground vegetation, using iButtons loggers (model: DS1921G-F5; accuracy: 0.5 °C). iButtons were placed ~1.5 m above the ground [31], recording the temperature ectotherms would experience at understorey level (individuals were found from ground level up to 2.70 m above the ground).
iButtons were placed in 18 transects spanning all habitats across the range of elevations (6 in primary forest, 4 in old secondary forest, 6 in young secondary forest, and 2 in cattle pasture). We then calculated two temperature variables for each individual: (1) Maximum temperature: the mean of daily maximum temperatures recorded as maximum air temperatures have proven to influence critical thermal traits in Pristimantis species [32]; and (2) Climatic niche breadth: the difference between the mean daily maximum and the mean daily minimum temperature. We used the temperature data from the closest temperature logger to where each individual was found accounting for habitat type and elevation.

2.5. Phylogeny

To account for phylogeny, we used one phylogenetic tree from [33] chosen at random using the function ‘sample’. This phylogeny is the most complete amphibian phylogeny up to date comprising 7238 amphibian species.

2.6. Statistical Analyses

Environment or Phylogeny Shapes Local CTmax?

To understand whether the environment will change more quickly than species’ thermal tolerances are able to evolve, we used a phylogenetic signal (V) to measure this trait evolution, as it represents the tendency of related species to resemble each other more than at random [34]. We tested the relationships between CTmax and habitat, elevation, temperature variables, and body size by fitting a linear mixed-effect model that allows phylogenetic covariance matrices. We used the function lmekin in the R package coxme [35] in the statistical software R (version 3.3.1 [36]). This model produces a z-value that represents the contribution of each environmental factor and of body size. Our model included residual variance associated with both the individual measurement (e.g., species-specific variation in CTmax) and with phylogeny. We specified the variance-covariance structure of the residual variance as a vector of errors I (following [37]). We estimated the errors assuming they follow a multivariate normal distribution with a variance-covariance matrix with three components. The first component is the phylogenetic signal, representing the variance among species means that results from phylogenetic dependence (V). This component shows the covariance between each pair of tips, calculated using the branch lengths of the phylogeny. Thus, it represents the phylogenetic contribution. The second describes variation in the species means that is independent of phylogeny (S). The final variance is that between replicate experimental units independent of phylogeny or species identity, i.e., the error variance (I) [37].
We also calculated Pagel’s lambda (λ) for ease of interpretation of a phylogenetic signal for both CTmax and SVL using phylosig function from the R package phytools [38]. Values of Pagel’s lambda range from 0 (phylogenetic independence) and 1 (strong phylogenetic signal, species’ traits covary in direct proportion to their shared evolutionary history). All analyses were performed with the full dataset (12 species; 222 individuals) and a reduced dataset (7 species; 204 individuals) represented by species with more than 10 individuals (Table S1). Although results were similar across our datasets (Table S2), results shown in this article belong to the reduced dataset.

3. Results

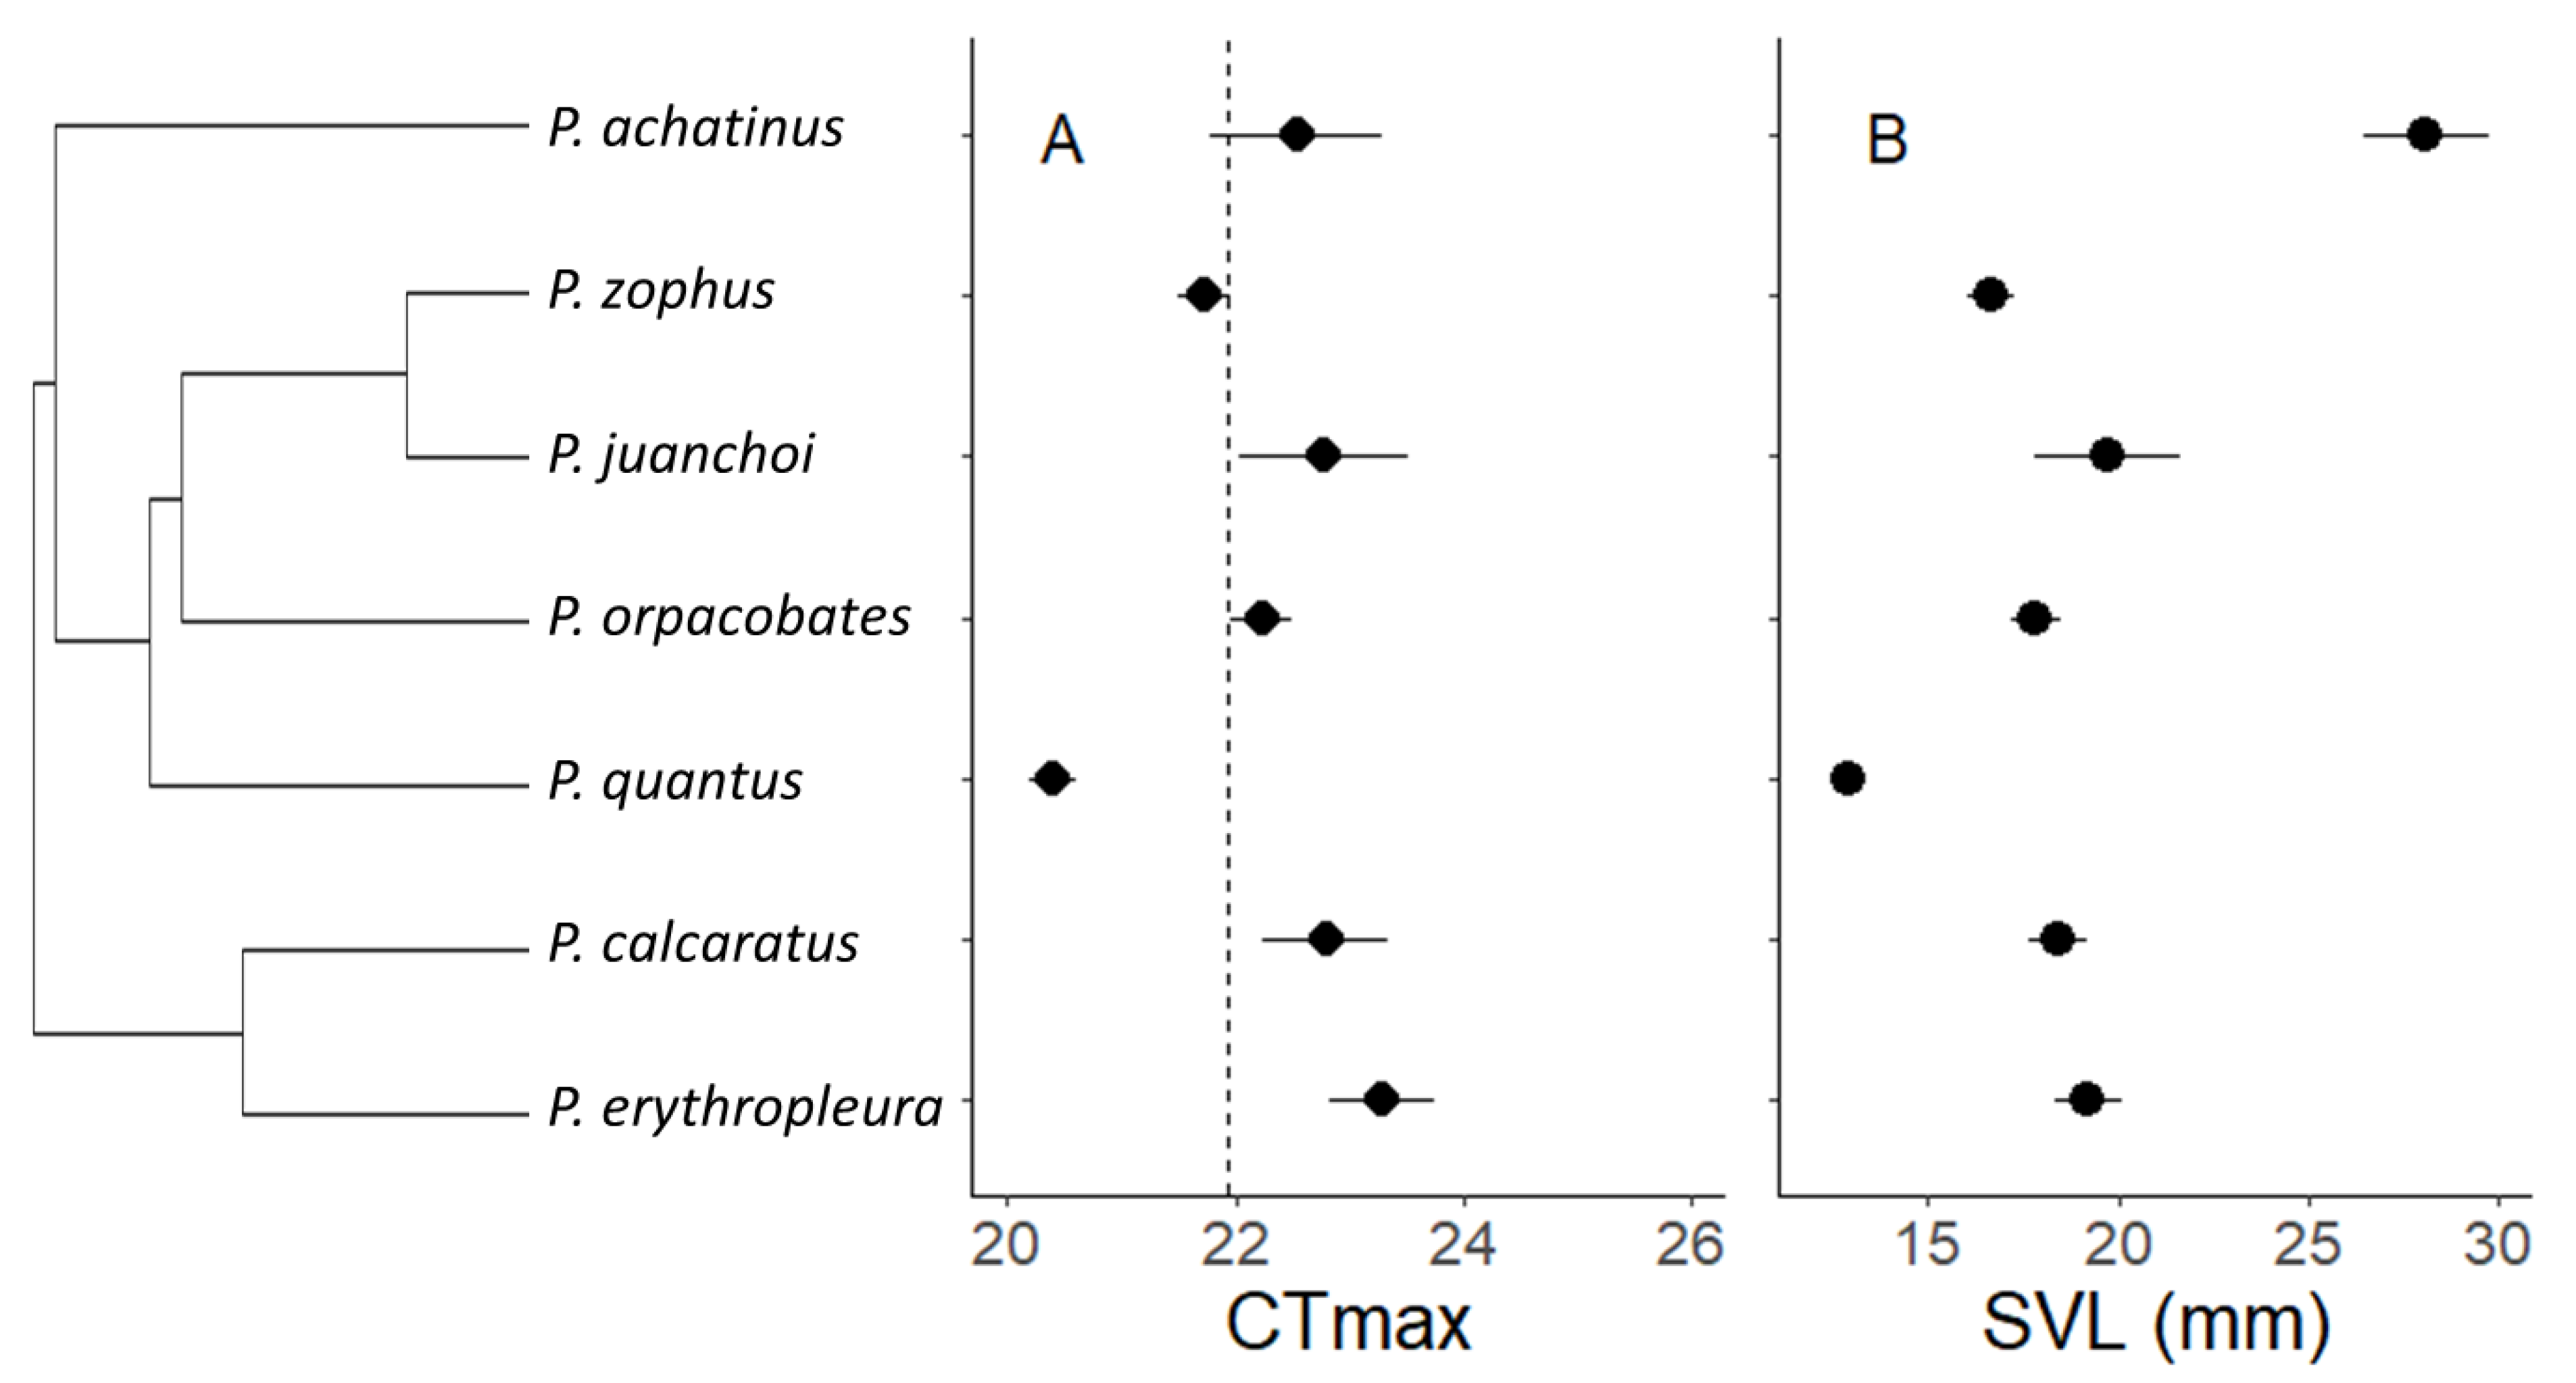
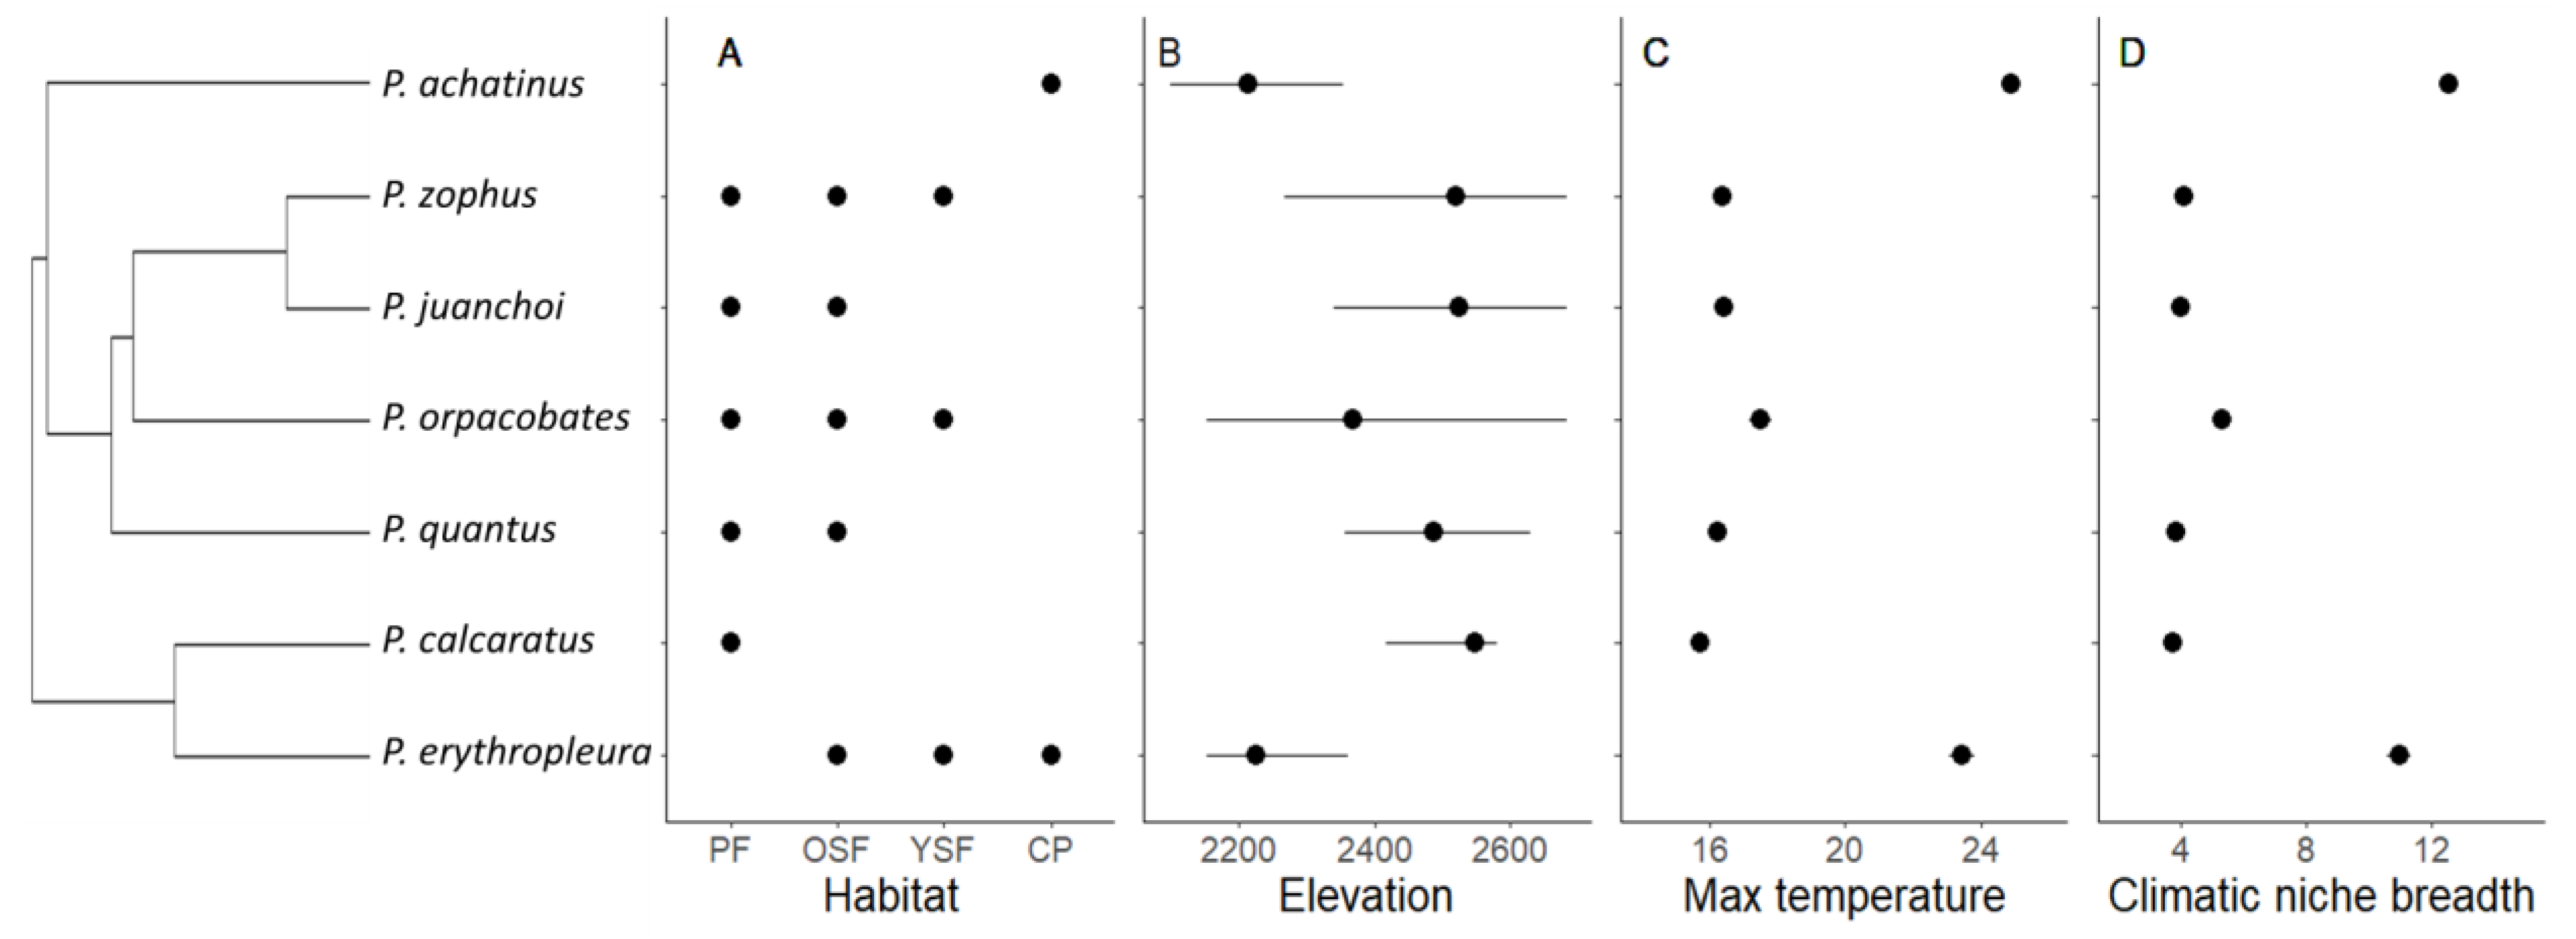
3.1. Critical Thermal Maximum (CTmax) and Environmental Exposure

The mean CTmax (±1SE) across all species was 21.94 °C ± 0.14. Species closer together in the phylogeny showed a slight pattern of CTmax similarity (Figure 1A). Our sampling encompassed different habitats (cattle pasture, young and old secondary and primary forests), elevational ranges (2100–2690 m) and temperature gradients. Maximum temperatures spanned from 15.30 °C to 24.95 °C, and temperature decreased by 1.5 °C for every 100 m increase in elevation, in part due to the confounding effect of habitat type: the lowest elevation belonged to cattle pasture, whereas the highest elevations were recorded in primary forests. The lowest temperature recorded was in primary forests, with a mean maximum temperature of 15.89 °C, followed by old secondary forest = 17.12 °C, young secondary forest = 21 °C, and the highest mean maximum temperature recorded was in cattle pasture = 24.87 °C. Since cattle pasture showed more extreme temperatures, the highest values of climatic niche breadth also belonged to species that are present in cattle pasture.

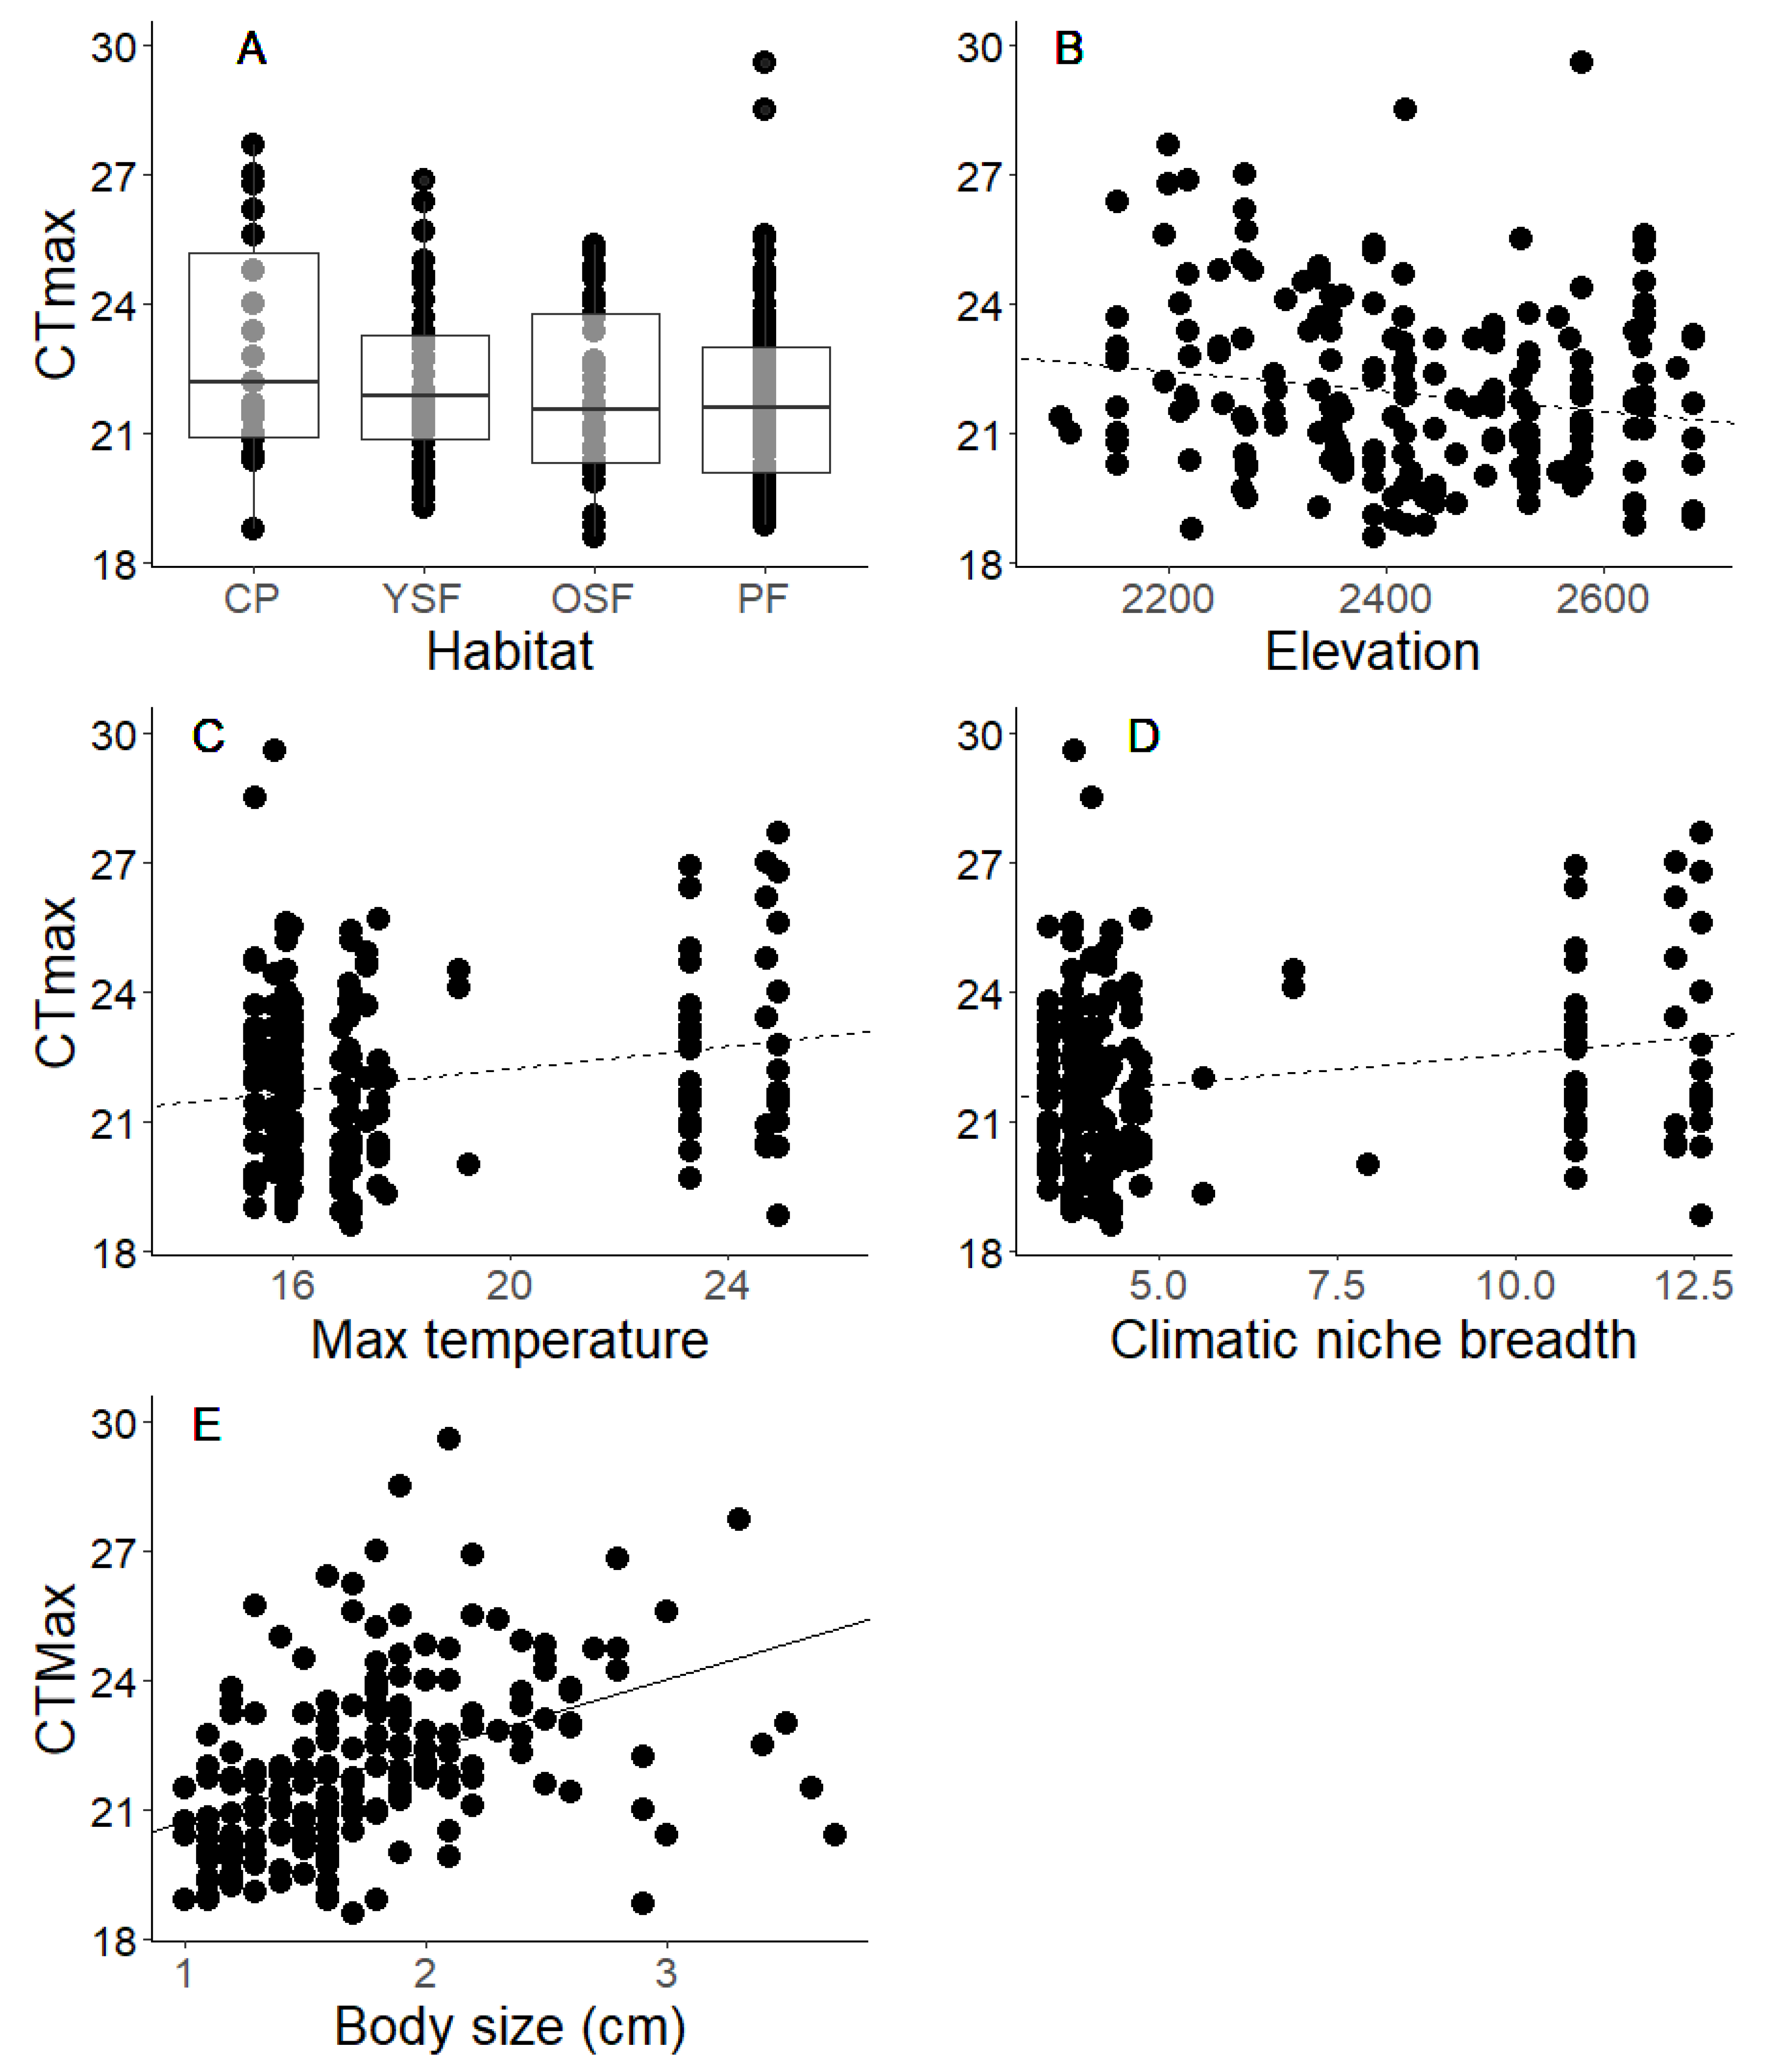
3.2. Environment or Phylogeny Determine Local CTmax?

We used the CTmax of 204 captured frog individuals in our model. Habitat type, elevation, maximum temperatures and climatic niche breadth showed similar patterns across the phylogeny (Figure 2).
Hypothesis 1.
Local environmental variables will influence CTmax variation.
We found no evidence suggesting that local environmental variables were influencing CTmax variation. There were no differences in CTmax across habitat types (Figure 3A), elevation (Figure 3B), maximum temperature (Figure 3C) or climatic niche breadth (Figure 3D) accounting for phylogeny (Table 1). These results were consistent when performing the analyses with the full dataset (Table S2).
Hypothesis 2.
Phylogeny will have a strong influence on CTmax variation.
Phylogeny was strongly related to species’ upper thermal limits. We found a strong phylogenetic signal (λ = 0.84) and the phylogenetic component of the model was high (V = 0.40; Table 1), and the second and third error components had low variances (S = 0.002; I = 0.002; Table 1), indicating a strong model since the error variance and the variance among species were very low.
Hypothesis 3.
Larger species will show higher CTmax.
Confirming our third hypothesis, body length was positively related to individuals’ CTmax (F = 48.81,202, r2 = 0.19, p < 0.001; Figure 3E) and showed a strong phylogenetic signal (λ = 0.91; Figure 1B).

4. Discussion

In this article, we studied evolutionary patterns of physiology, which may be relevant to understand the potential responses of amphibians to the dangers posed by climate change. This study uniquely uses a small spatial-scale approach, which guarantees that the environmental variables measured represent the real environment experienced by species, to assess local physiology combined with phylogenetic and local environmental factors. Importantly, considering the full dataset, our study encompasses 12 species, which represent a large portion (63%) of the known alpha diversity at our study site [26]. We found that local CTmax was not driven by any environmental factor assessed, whereas frog body length was positively related to CTmax. Moreover, we found a strong phylogenetic signal in species’ CTmax suggesting evolutionary constraints on this physiological trait. Thus, there is minimal potential for this group to locally adapt to keep pace with changes in temperature because such changes in CTmax would require evolutionary processes.

4.1. Local Environmental Variables Did Not Influence CTmax Variation

Our results did not support our first environmental selection hypothesis which is in accordance with other studies showing that environmental factors, such as temperature and elevation, have minimum influence on the local thermal tolerance of lizards [39], beetles [29], and Drosophila in wet environments [17]. Individuals were collected across the whole elevational range of our study site, yet examining a broader elevational range and hence including species at a lower elevation that experience higher temperatures, could result in elevation having an influence on CTmax [32]. As CTmax can play a role in the community composition of amphibians [40] (i.e., determining their preferred habitat), our results suggest that species are living in environments to which they are preadapted, rather than adapting their thermal tolerance to a new environment [17]. Thus, species might have limited potential for local adaptation or may not be able to use physiological plasticity to keep pace with temperature increases predicted under climate change [41,42], particularly in the tropics [43]. However, other factors such as humidity and microhabitat abundance could be influencing species distribution. For example, species living in three different habitat types, such as P. zophus and P. orpacobates, can live across a broader range of temperatures and forest characteristics, considering that young secondary forests have higher mean maximum temperatures and lower microhabitat complexity than primary forests [19].
The lack of correlation between CTmax and environmental variables at this regional level could be partially explained by the tendency of phylogenetically related amphibian species to live in similar combinations of climatic variables [44]. This is achieved due to the strong spatial autocorrelation existing in environmental variables and species’ low dispersal ability that creates spatial proximity of these closely related species [8]. Moreover, other factors could play a large role in driving species’ CTmax. For example, Kellerman et al. [17] found that in Drosophila CTmax increased as precipitation decreased. Thus, water-related environmental factors might be more important in driving CTmax than high temperatures alone, especially in very wet environments [17], such as the Tropical Andes. Nevertheless, an increase in temperature will not be the only effect of climate warming: lower humidity and reduced cloud cover could also stress ectotherms, especially water-dependent tropical amphibians [45].

4.2. Phylogeny Is Strongly Related to CTmax

Confirming our second phylogeny hypothesis, we observed a strong correlation between phylogeny and local CTmax, previously reported for other ectotherms [46,47], and suspect that with a larger number of species analysed we would have uncovered an even stronger phylogenetic signal [17]. For example, von May et al. [32] found no phylogenetic signal for CTmax in amphibians when examining 22 species, but the signal was strong when including 56 species [47]. Our results concur with several studies showing that CTmax is a stable evolutionary trait in ectothermic vertebrates rather than being determined by ecological filtering, dispersal, or local adaptation [10,16,39,46,47]. This suggests that the evolution of CTmax, even at a local spatial scale, is not free from phylogenetic associations. Moreover, evolutionary responses are slow, hence species might not be able to evolve higher CTmax rapidly enough to meet the pace of environmental warming [39,46].
Although there was some variation in CTmax among species, the strong phylogenetic signal of CTmax suggests that this physiological trait is evolutionarily conserved, and these species are unlikely to adapt their CTmax locally at the same rate as the change in environmental conditions. Therefore, evolution is likely to complement, rather than replace, projected ecological changes [48] and local evolutionary responses are unlikely to mitigate the negative impacts of future global warming, as has been suggested for marine environments [49]. This will be aggravated by the fact that many montane species living in these areas of high phylogenetic and species diversity may be particularly susceptible to rapid anthropogenic climate change [50].

4.3. Body Length Is Positively Related to CTmax

Supporting our third morphology hypothesis, we found that body size was positively correlated with CTmax, as has been recorded in other ectotherms [25]. Individual body length had a stronger effect than environmental factors and a strong phylogenetic signal. This means that body size had a stronger influence on species’ CTmax than any of the four environmental variables considered, and that there is an autocorrelation between body length and phylogeny, which has been previously shown in [8]. Moreover, the similar pattern that species’ CTmax and body size showed (Figure 1) suggests that lability in CTmax could be mediated by body size.
In ectotherms, many ecological and physiological processes (e.g., fecundity) are directly related to body temperature, and thus body size [51,52]. Achieving optimal body temperature through behavioural thermoregulation can play a key role in avoiding heat stress [17] and limit adaptation for elevated upper physiological limits [42,53]. Indeed, thermoregulation could explain the similar CTmax we found across environmental variables.

5. Conservation Implication

Here, we present a study that simultaneously compares physiology and local environmental conditions in an evolutionary framework. Our study captured high variation in CTmax because we focused on sampling across different habitats, elevational ranges and temperature gradients. The fact that we found a strong phylogenetic signal, despite our local scale approach, suggests that phylogenetic factors are indeed involved in shaping species’ thermal tolerances. We conclude that species are unlikely to increase their upper thermal limits via plastic responses and evolutionary responses may not be fast enough to keep pace with global warming. As such, strategies such as the translocation of microhabitats (e.g., bromeliads) into cattle pasture and secondary forests would provide thermally protected shelters and aid species to cope with temperatures that surpass their CTmax. Working with the most speciose genus of frogs globally could allow us to infer that species from this genus will show similar vulnerability to global warming, as the species from this study inhabit a wide range of habitat types that are increasingly found across the world. Indeed, frogs from the same family have been shown to be at higher risk of thermal stress compared to frogs from other families [47]. Global warming will be especially harmful to tropical species, since tropical organisms are highly sensitive to temperature change, and they can approach near-lethal temperatures much faster than species from temperate climates [54]. If species cannot adapt their CTmax to rising ambient temperatures, increasing their body size would result in a CTmax increase, which could aid them to survive under future global warming. We suggest that, wherever possible, species’ current and future vulnerability as well as microhabitat abundance and landscape connectivity are considered to inform conservation decision-making and to establish management objectives.

Supplementary Materials

The following supporting information can be downloaded at: https://www.mdpi.com/article/10.3390/land12010130/s1, Table S1: Total number of individuals collected per species and habitat type. Table S2. Summary of linear mixed effect model of environmental and phylogenetic factors on CTmax variation with full dataset.

Author Contributions

Conceptualization, P.G.-d.-P., R.P.F., B.R.S. and D.P.E.; Methodology P.G.-d.-P., R.P.F., B.R.S. and D.P.E.; Formal Analysis, P.G.-d.-P.; Writing—Original Draft Preparation, P.G.-d.-P.; Writing—Review and Editing, P.G.-d.-P., R.P.F., B.R.S., D.P.E., C.A.M.U., E.W.B., A.R.A.-G. and T.H.; Visualization, P.G.-d.-P.; Data Curation, P.G.-d.-P., E.W.B. and A.R.A.-G.; Supervision, R.P.F., B.R.S. and D.P.E. All authors have read and agreed to the published version of the manuscript.

Funding

Funding was provided to T.H. and D.P.E. by the Research Council of Norway, grant number 208836, and to D.P.E. and R.P.F. by the Natural Environment Research Council, grant number NE/R017441/1. P.G. was supported by CONACyT, Scholarship 359063 and by the FCT UNRAVEL project (PTDC/BIA-ECO/0207/2020).

Institutional Review Board Statement

Experimental protocols received ANLA (National Agency for Environmental Licences) approval (#1579).

Informed Consent Statement

Not applicable.

Data Availability Statement

CTmax data are available in [55].

Acknowledgments

Thanks to D. Zugai for comments. We thank the Humboldt Institute’s staff for logistical support, and Gustavo Suárez, Uriel and Luis Rendón for help with fieldwork. For field access permission, we thank Fundación Colibrí (Reserva Natural Mesenia-Paramillo). This is article #13 of the Biodiversity, Agriculture, and Conservation in Colombia (Biodiversidad, Agricultura, y Conservación en Colombia [BACC]) project. This article includes partial work developed in [56].

Conflicts of Interest

The authors declare no conflict of interest.

References

  1. Scheffers, B.R.; De Meester, L.; Bridge, T.C.L.; Hoffmann, A.A.; Pandolfi, J.M.; Corlett, R.T.; Butchart, S.H.M.; Pearce-Kelly, P.; Kovacs, K.M.; Dudgeon, D.; et al. The broad footprint of climate change from genes to biomes to people. Science 2016, 354, aaf7671. [Google Scholar] [CrossRef]
  2. Cahill, A.E.; Aiello-Lammens, M.E.; Fisher-Reid, M.C.; Hua, X.; Karanewsky, C.J.; Yeong Ryu, H.; Sbeglia, G.C.; Spagnolo, F.; Waldron, J.B.; Warsi, O.; et al. How does climate change cause extinction? Proc. R. Soc. B: Biol. Sci. 2013, 280, 20121890. [Google Scholar] [CrossRef] [PubMed]
  3. Scheffers, B.R.; Edwards, D.P.; Diesmos, A.; Williams, S.E.; Evans, T.A. Microhabitats reduce animal's exposure to climate extremes. Glob. Change Biol. 2014, 20, 495–503. [Google Scholar] [CrossRef]
  4. Williams, S.E.; Shoo, L.P.; Isaac, J.L.; Hoffman, A.A.; Langham, G. Towards an integrated framework for assessing the vulnerability of species to climate change. PLoS Biol. 2008, 6, e325. [Google Scholar] [CrossRef] [PubMed]
  5. Cowles, R.B.; Bogert, C.M. A preliminary study of the thermal requirements of desert reptiles. Bull. Am. Mus. Nat. Hist. 1944, 83, 263–296. [Google Scholar]
  6. Huey, R.B.; Kearney, M.R.; Krockenberger, A.; Holtum, J.A.M.; Jess, M.; Williams, S.E. Predicting organismal vulnerability to climate warming: Roles of behaviour, physiology and adaptation. Philos. Trans. R. Soc. B Biol. Sci. 2012, 367, 1665–1679. [Google Scholar] [CrossRef] [Green Version]
  7. González-del-Pliego, P.; Scheffers, B.R.; Freckleton, R.P.; Basham, E.W.; Araújo, M.B.; Acosta-Galvis, A.R.; Medina Uribe, C.A.; Haugaasen, T.; Edwards, D.P. Thermal tolerance and the importance of microhabitats for Andean frogs in the context of land use and climate change. J. Anim. Ecol. 2020, 89, 2451–2460. [Google Scholar] [CrossRef]
  8. Freckleton, R.P.; Jetz, W. Space versus phylogeny: Disentangling phylogenetic and spatial signals in comparative data. Proc. R. Soc. B: Biol. Sci. 2009, 276, 21–30. [Google Scholar] [CrossRef] [Green Version]
  9. Gutiérrez-Pesquera, L.M.; Tejedo, M.; Olalla-Tárraga, M.Á.; Duarte, H.; Nicieza, A.; Solé, M. Testing the climate variability hypothesis in thermal tolerance limits of tropical and temperate tadpoles. J. Biogeogr. 2016, 43, 1166–1178. [Google Scholar] [CrossRef]
  10. Araujo, M.B.; Ferri-Yanez, F.; Bozinovic, F.; Marquet, P.A.; Valladares, F.; Chown, S.L. Heat freezes niche evolution. Ecol. Lett. 2013, 16, 1206–1219. [Google Scholar] [CrossRef] [Green Version]
  11. Llewelyn, J.; Macdonald, S.; Hatcher, A.; Moritz, C.; Phillips, B.L. Thermoregulatory behaviour explains countergradient variation in the upper thermal limit of a rainforest skink. Oikos 2016, 126, 748–757. [Google Scholar] [CrossRef]
  12. Phillips, B.L.; Muñoz, M.M.; Hatcher, A.; Macdonald, S.L.; Llewelyn, J.; Lucy, V.; Moritz, C. Heat hardening in a tropical lizard: Geographic variation explained by the predictability and variance in environmental temperatures. Funct. Ecol. 2015, 30, 1161–1168. [Google Scholar] [CrossRef]
  13. Kellermann, V.; van Heerwaarden, B.; Sgrò, C.M.; Hoffmann, A.A. Fundamental evolutionary limits in ecological traits drive Drosophila species distributions. Science 2009, 325, 1244–1246. [Google Scholar] [CrossRef] [PubMed] [Green Version]
  14. Cooper, N.; Jetz, W.; Freckleton, R.P. Phylogenetic comparative approaches for studying niche conservatism. J. Evol. Biol. 2010, 23, 2529–2539. [Google Scholar] [CrossRef] [PubMed]
  15. Hansen, T.F. Stabilizing selection and the comparative analysis of adaptation. Evol. Int. J. Org. Evol. 1997, 51, 1341–1351. [Google Scholar] [CrossRef]
  16. Labra, A.; Pienaar, J.; Hansen, T.F. Evolution of thermal physiology in Liolaemus lizards: Adaptation, phylogenetic inertia, and niche tracking. Am. Nat. 2009, 174, 204–220. [Google Scholar] [CrossRef]
  17. Kellermann, V.; Loeschcke, V.; Hoffmann, A.A.; Kristensen, T.N.; Fløjgaard, C.; David, J.R.; Svenning, J.-C.; Overgaard, J. Phylogenetic constraints in key functional traits behind species’ climate niches: Patterns of desiccation and cold resistance across 95 Drosophila species. Evol. Int. J. Org. Evol. 2012, 66, 3377–3389. [Google Scholar] [CrossRef]
  18. González-Del-Pliego, P.; Freckleton, R.P.; Edwards, D.P.; Koo, M.S.; Scheffers, B.R.; Pyron, R.A.; Jetz, W. Phylogenetic and Trait-Based Prediction of Extinction Risk for Data-Deficient Amphibians. Curr. Biol. CB 2019, 29, 1557–1563.e1553. [Google Scholar] [CrossRef]
  19. González del Pliego, P.; Scheffers, B.R.; Basham, E.W.; Woodcock, P.; Wheeler, C.; Gilroy, J.J.; Medina Uribe, C.A.; Haugaasen, T.; Freckleton, R.P.; Edwards, D.P. Thermally buffered microhabitats recovery in tropical secondary forests following land abandonment. Biol. Conserv. 2016, 201, 385–395. [Google Scholar] [CrossRef] [Green Version]
  20. Hurtt, G.C.; Chini, L.P.; Frolking, S.; Betts, R.A.; Feddema, J.; Fischer, G.; Fisk, J.P.; Hibbard, K.; Houghton, R.A.; Janetos, A.; et al. Harmonization of land-use scenarios for the period 1500–2100: 600 years of global gridded annual land-use transitions, wood harvest, and resulting secondary lands. Clim. Change 2011, 109, 117. [Google Scholar] [CrossRef] [Green Version]
  21. Blackburn, S.; van Heerwaarden, B.; Kellermann, V.; Sgrò, C.M. Evolutionary capacity of upper thermal limits: Beyond single trait assessments. J. Exp. Biol. 2014, 217, 1918–1924. [Google Scholar] [CrossRef]
  22. Cooper, N.; Freckleton, R.P.; Jetz, W. Phylogenetic conservatism of environmental niches in mammals. Proc. R. Soc. B: Biol. Sci. 2011, 278, 2384–2391. [Google Scholar] [CrossRef]
  23. Menke, S.B.; Holway, D.A.; Fisher, R.N.; Jetz, W. Characterizing and predicting species distributions across environments and scales: Argentine ant occurrences in the eye of the beholder. Glob. Ecol. Biogeogr. 2009, 18, 50–63. [Google Scholar] [CrossRef]
  24. Llewelyn, J.; Macdonald, S.L.; Hatcher, A.; Moritz, C.; Phillips, B.L. Intraspecific variation in climate-relevant traits in a tropical rainforest lizard. Divers. Distrib. 2016, 22, 1000–1012. [Google Scholar] [CrossRef]
  25. Ribeiro, P.L.; Camacho, A.; Navas, C.A. Considerations for assessing maximum critical temperatures in small ectothermic animals: Insights from leaf-cutting ants. PLoS ONE 2012, 7, e32083. [Google Scholar] [CrossRef] [Green Version]
  26. Basham, E.W.; González del Pliego, P.; Acosta-Galvis, A.R.; Woodcock, P.; Medina Uribe, C.A.; Haugaasen, T.; Gilroy, J.J.; Edwards, D.P. Quantifying carbon and amphibian co-benefits from secondary forest regeneration in the Tropical Andes. Anim. Conserv. 2016, 19, 548–560. [Google Scholar] [CrossRef]
  27. Navas, C.A.; Antoniazzi, M.M.; Carvalho, J.E.; Suzuki, H.; Jared, C. Physiological basis for diurnal activity in dispersing juvenile Bufo granulosus in the Caatinga, a Brazilian semi-arid environment. Comp. Biochem. Physiol. A Mol. Integr. Physiol. 2007, 147, 647–657. [Google Scholar] [CrossRef]
  28. Catenazzi, A.; Lehr, E.; Vredenburg, V.T. Thermal physiology, disease, and amphibian declines on the eastern slopes of the Andes. Conserv. Biol. J. Soc. Conserv. Biol. 2014, 28, 509–517. [Google Scholar] [CrossRef] [PubMed]
  29. Garcia-Robledo, C.; Kuprewicz, E.K.; Staines, C.L.; Erwin, T.L.; Kress, W.J. Limited tolerance by insects to high temperatures across tropical elevational gradients and the implications of global warming for extinction. Proc. Natl. Acad. Sci. USA 2016, 113, 680–685. [Google Scholar] [CrossRef] [PubMed] [Green Version]
  30. Nowakowski, A.J.; Watling, J.I.; Whitfield, S.M.; Todd, B.D.; Kurz, D.J.; Donnelly, M.A. Tropical amphibians in shifting thermal landscapes under land use and climate change. Conserv. Biol. 2017, 31, 96–105. [Google Scholar] [CrossRef] [PubMed] [Green Version]
  31. Scheffers, B.R.; Brunner, R.M.; Ramirez, S.D.; Shoo, L.P.; Diesmos, A.; Williams, S.E. Thermal buffering of microhabitats is a critical factor mediating warming vulnerability of frogs in the Philippine biodiversity hotspot. Biotropica 2013, 45, 628–635. [Google Scholar] [CrossRef]
  32. von May, R.; Catenazzi, A.; Corl, A.; Santa-Cruz, R.; Carnaval, A.C.; Moritz, C. Divergence of thermal physiological traits in terrestrial breeding frogs along a tropical elevational gradient. Ecol. Evol. 2017, 7, 3257–3267. [Google Scholar] [CrossRef] [PubMed]
  33. Jetz, W.; Pyron, R.A. The interplay of past diversification and evolutionary isolation with present imperilment across the amphibian tree of life. Nat. Ecol. Evol. 2018, 2, 850–858. [Google Scholar] [CrossRef] [PubMed]
  34. Blomberg, S.P.; Garland, T. Tempo and mode in evolution: Phylogenetic inertia, adaptation and comparative methods. J. Evol. Biol. 2002, 15, 899–910. [Google Scholar] [CrossRef]
  35. Therneau, T.M. Coxme: Mixed Effects Cox Models. R Package Version 2.2-5. Available online: https://cran.r-project.org/web/packages/coxme/coxme.pdf (accessed on 24 November 2022).
  36. R Core Team. R: A Language and Environment for Statistical Computing. R Foundation for Statistical Computing, Vienna, Austria. Available online: https://www.R-project.org/ (accessed on 24 November 2022).
  37. Freckleton, R.P.; Rees, M. Comparative analysis of experimental data. Methods Ecol. Evol. 2019, 10, 1308–1321. [Google Scholar] [CrossRef] [Green Version]
  38. Revell, L.J. phytools: An R package for phylogenetic comparative biology (and other things). Methods Ecol. Evol. 2012, 3, 217–223. [Google Scholar] [CrossRef]
  39. Muñoz, M.M.; Langham, G.M.; Brandley, M.C.; Rosauer, D.F.; Williams, S.E.; Moritz, C. Basking behavior predicts the evolution of heat tolerance in Australian rainforest lizards. Evol. Int. J. Org. Evol. 2016, 70, 2537–2549. [Google Scholar] [CrossRef]
  40. Nowakowski, A.J.; Watling, J.I.; Thompson, M.E.; Brusch Iv, G.A.; Catenazzi, A.; Whitfield, S.M.; Kurz, D.J.; Suárez-Mayorga, Á.; Aponte-Gutiérrez, A.; Donnelly, M.A.; et al. Thermal biology mediates responses of amphibians and reptiles to habitat modification. Ecol. Lett. 2018, 21, 345–355. [Google Scholar] [CrossRef]
  41. van Heerwaarden, B.; Kellermann, V.; Sgrò, C.M. Limited scope for plasticity to increase upper thermal limits. Funct. Ecol. 2016, 21, 345–355. [Google Scholar] [CrossRef] [Green Version]
  42. Angilletta, M.J. Thermal Adaptation: A Theoretical and Empirical Synthesis; Oxford University Press: New York, NY, USA, 2009; pp. 1–290. [Google Scholar] [CrossRef]
  43. Tewksbury, J.J.; Huey, R.B.; Deutsch, C.A. Putting the heat on tropical animals. Science 2008, 320, 1296–1297. [Google Scholar] [CrossRef]
  44. Hof, C.; Rahbek, C.; Araújo, M.B. Phylogenetic signals in the climatic niches of the world's amphibians. Ecography 2010, 33, 242–250. [Google Scholar] [CrossRef]
  45. Pounds, J.A.; Fogden, M.P.L.; Campbell, J.H. Biological response to climate change on a tropical mountain. Nature 1999, 398, 611–615. [Google Scholar] [CrossRef]
  46. Grigg, J.W.; Buckley, L.B. Conservatism of lizard thermal tolerances and body temperatures across evolutionary history and geography. Biol. Lett. 2013, 9, 20121056. [Google Scholar] [CrossRef] [PubMed] [Green Version]
  47. von May, R.; Catenazzi, A.; Santa-Cruz, R.; Gutierrez, A.S.; Moritz, C.; Rabosky, D.L. Thermal physiological traits in tropical lowland amphibians: Vulnerability to climate warming and cooling. PLoS ONE 2019, 14, e02197592019. [Google Scholar] [CrossRef] [PubMed] [Green Version]
  48. Parmesan, C. Ecological and evolutionary responses to recent climate change. Annu. Rev. Ecol. Evol. Syst. 2006, 37, 637–669. [Google Scholar] [CrossRef] [Green Version]
  49. Donner, S.D.; Skirving, W.J.; Little, C.M.; Oppenheimer, M.; Hoegh-Guldberg, O.V.E. Global assessment of coral bleaching and required rates of adaptation under climate change. Glob. Change Biol. 2005, 11, 2251–2265. [Google Scholar] [CrossRef]
  50. Kozak, K.H.; Wiens, J.J. Niche conservatism drives elevational diversity patterns in Appalachian salamanders. Am. Nat. 2010, 176, 40–54. [Google Scholar] [CrossRef] [Green Version]
  51. Peters, R.H. The Ecological Implications of Body Size; Cambridge University Press: Cambridge, UK, 1983. [Google Scholar] [CrossRef] [Green Version]
  52. Hone, D.W.E.; Benton, M.J. The evolution of large size: How does Cope’s rule work? Trends Ecol. Evol. 2005, 20, 4–6. [Google Scholar] [CrossRef]
  53. Huey, R.B.; Hertz, P.E.; Sinervo, B. Behavioral drive versus behavioral inertia in evolution: A null model approach. Am. Nat. 2003, 161, 357–366. [Google Scholar] [CrossRef]
  54. Deutsch, C.A.; Tewksbury, J.J.; Huey, R.B.; Sheldon, K.S.; Ghalambor, C.K.; Haak, D.C.; Martin, P.R. Impacts of climate warming on terrestrial ectotherms across latitude. Proc. Natl. Acad. Sci. 2008, 105, 6668–6672. [Google Scholar] [CrossRef] [Green Version]
  55. González-del-Pliego, P.; Scheffers, B.R.; Freckleton, R.P.; Basham, E.W.; Araújo, M.B.; Acosta-Galvis, A.R.; Medina Uribe, C.A.; Haugaasen, T.; Edwards, D.P. Data from: Thermal tolerance and the importance of microhabitats for Andean frogs in the context of land-use and climate change. Dryad Digit. Repos. 2020. [Google Scholar] [CrossRef]
  56. González del Pliego, P. Amphibian Conservation in the Face of Land-Use Change and Global Warming; University of Sheffield: Sheffield, UK, 2017. [Google Scholar]
Figure 1. Pristimantis frog phylogeny. (A) Mean CTmax ± SE per species. Dash line represents mean CTmax across all seven species. (B) Mean SVL ± SE per species.
Land 12 00130 g001
Figure 2. Pristimantis frog phylogeny and (A) their habitat (PF: primary forests; OSF: old secondary forests; YSF: young secondary forests; CP: cattle pasture), (B) mean (point), minimum and maximum (black line) elevation where they were collected, (C) mean ± SE daily maximum temperature they experience, and (D) mean ± SE climatic niche (calculated as maximum ambient temperature minus minimum ambient temperature).
Land 12 00130 g002
Figure 3. Relationship between Pristimantis frogs’ CTmax and (A) habitat (CP: cattle pasture; YSF: Young secondary forests; OSF: Old secondary forests; PF: Primary forests), (B) elevation, (C) maximum temperature, (D) climatic niche breadth, and (E) body size (snout-vent length). Solid lines represent significant relationships (p < 0.05).
Land 12 00130 g003
Table 1. Summary of linear mixed effect model of environmental and phylogenetic factors on CTmax variation of 204 frog individuals.
Value (se)zp
FixedCattle pasture (Intercept)18.83 (6.31)2.98<0.001
Young secondary forest0.02 (0.77)0.030.97
Old secondary forest0.32 (1.05)0.310.76
Primary forest0.47 (1.14)0.420.68
Elevation−0.0004 (0.001)−0.300.77
Max temperature0.09 (0.34)−0.140.89
Climatic niche breadth−0.04 (0.34)−0.140.89
SVL (body size)1.49 (0.28)5.32<0.001
Random Std DevVariance
Phylogenetic signal (V) 0.630.40
Variation in species means (S) 0.040.002
Error variance (I) 0.040.002
Disclaimer/Publisher’s Note: The statements, opinions and data contained in all publications are solely those of the individual author(s) and contributor(s) and not of MDPI and/or the editor(s). MDPI and/or the editor(s) disclaim responsibility for any injury to people or property resulting from any ideas, methods, instructions or products referred to in the content.

