Article

Simulation and Analysis of Land-Use Change Based on the PLUS Model in the Fuxian Lake Basin (Yunnan–Guizhou Plateau, China)

1
College of Ecology, Lanzhou University, Lanzhou 730000, China
2
Southwest Investigation and Planning Institute of State Forestry and Grassland Administration, Kunming 650031, China
3
Power China Kunming Engneering Corporation Limted, Kunming 650051, China
4
School of Tourism, Henan Normal University, Xinxiang 453007, China
*
Authors to whom correspondence should be addressed.
Land 2023, 12(1), 120; https://doi.org/10.3390/land12010120
Submission received: 19 November 2022 / Revised: 26 December 2022 / Accepted: 27 December 2022 / Published: 30 December 2022
(This article belongs to the Special Issue Urban Land Development in the Process of Urbanization)

Abstract

:
It is essential to study the characteristics of land use change in the Fuxian Lake basin, a plateau lake in Yunnan Province, and to predict the basin’s future trend of land use change for sustaining the key carriers of current national major strategies such as ecological civilization, green development, and rural revitalization. This study used the Fuxian Lake basin as the subject and based on the seven periods of historical land use data, added six driving factors including human and natural factors, applied patches to generate the land-use simulation model (PLUS), and forecasted and analyzed the characteristics of land-use change in the basin in 2048 under the three scenarios of natural trend development, ecological protection, and production protection. The results showed that: (1) the overall simulation accuracy of the model was 79.14%, Kappa index was 0.73, FOM value was 0.29, and the model’s consistency was high. The model can be used to simulate future land-use changes in the Fuxian Lake basin. (2) In the natural development scenario, land-use development and the driving factors in the basin have the following relationship: rainfall and trunk road distance significantly impacted the types of land that emphasize ecological conservation and product development. Elevation and soil distribution characteristics had a significant impact on land types focused mainly on water zones and ecological protection. The land types mainly focused on urban construction were greatly affected by elevation, trunk road distance, GDP per capita, and other factors. (3) The main direction of land-use change in the watershed is the mutual conversion between farmland and forest land, with the continuous expansion of construction land. In the production protection scenario, the area of farmland increased by 44.79 hm2. In the ecological protection scenario, the area of arbor forest land increased by 37.85 hm2 and the area of shrub forest land decreased by 62.37 hm2. (4) From the perspective of spatial distribution patterns, the regional hotspot change blocks are mainly concentrated in the north of the basin, along the coast of the north of Fuxian Lake, and the southern land. In general, the PLUS model had good applicability in this study. The simulation results of the different scenarios were in line with the land development in the Fuxian Lake basin and can provide scientific reference for land-space planning, ecological and production land constraints, and coordination of development in the Fuxian Lake basin.

1. Introduction

Land-use/land-cover (LULC) changes are closely associated with the interaction of human production space, living space, and ecological space [1,2,3]. LULC change research focuses on simulating and exploring their spatial–temporal evolution at the regional or global scale, analyzing the dynamic mechanisms of its development, and modeling its dynamic trends [4]. In general, cities have production, living, and ecological functions in any area [5,6]. Among these, ecological functions are essential, and the optimization of urban ecological functions provides support for human production and life. Some researchers found that forest land, grassland, and water area account for a large proportion of ecological space, and the evolution of the ecological space is a dynamic evolutionary relationship between living space, ecological space, and production space, as well as the various land types within them [7]. Previous land-use simulation models were linear and numerical and all the processes of land-use change could not be integrated [8,9].
Cellular automata (CA) can represent the complex LULC system and is widely used in land-use simulations and predictions [10,11]. CA models have been applied to simulate land-use changes, and the results have the advantages of strong dynamic simulation ability, limited data, simple calibration, and can reproduce different land-cover and complicated patterns [12]. Among the various models, the CA model can dynamically reflect the complex structure of an urban system. An extended version of this model has been widely used in the simulation of urban growth, such as the SLEUTH model [13], CLUE-S model [14,15], CLUMondo model [16,17], and the Multi-Agent System (MAS) model [18,19]. However, in the conversion process of most models, the competition and mutual influence between the different land types are usually ignored. The PLUS model is derived from the CA model and proposes an adaptive, inertial competition mechanism in the random forest classification algorithm for bi-state decision making. The PLUS model is an improved cellular automata model, which focuses on the nonlinear relationship between land use and underlying cover, and can tap the driving factors of land expansion and landscape change with the ability to reflect the landscape evolution of patches and the use potential for policy formulation. Compared with other models, PLUS models can obtain higher simulation accuracy and more similar landscapes, and can further explore potential land-use conversion rules [20] to identify the drivers of land expansion and project landscape dynamics [21,22]. However, the cellular automata model for land-use change has insufficient accuracy [23]. In order to improve the accuracy of land-use simulation and reduce errors, scholars have improved the original cellular automata model from different perspectives. For example, Verburg et al. [24] proposed the CLUE-S model based on systems theory, and the FLUS model proposed by Liu et al. [25] transformed and upgraded the original cellular automata model by establishing self-adaptive inertia and a competition mechanism to process the complex competitions and interactions between the various land-use types. The PLUS model has been widely used to investigate the evolution of land-use spatial patterns and the driving factors affecting land-use change. The PLUS model simulated the land-use pattern of key mountain development areas [26]. The PLUS model explored the spatiotemporal change characteristics of land use in the Weihe River basin [27]. The PLUS, Future Land-Use Simulation (FLUS), and Markov models were used to simulate and predict the land-use status quo in the western Beijing ecological reserve in 2020 under two management scenarios [28]. The results showed that the PLUS model’s prediction accuracy was high. The PLUS model simulated future land-use changes in Xi’an [29]. The PLUS model forecasted and analyzed future land-use changes in the middle reaches of the Yangtze River basin [30]. The PLUS model simulated the land-use data of Nanjing in 2025 [31]. Under different land-use constraints, the development direction and the evolution of land-use spatial patterns are also different. The PLUS model simulates land-use change under different land-use application scenarios [32,33,34,35], such as natural tendency development, ecological land protection, ecological and economic balance, economic development scenarios, rural development, and commercial circumstances.
At present, land-use change scholars utilizing these models have mainly concentrated on urban areas [36,37,38] and rarely on Ecological Conservation Areas [39]. Moreover, as a newly proposed land-use model, there are few studies incorporating the PLUS model. The Fuxian Lake, as a typical large deep-water plateau lakes in China, has outstanding representativeness in facing regional ecological problems such as ecological environment and ecological space. While verifying the accuracy of the PLUS model in simulating the land-use of the basin in the future, this study sought to understand the evolution of the spatial pattern of land use in the basin through the comparison of multi-scenario simulations including predictions of ecological protection, production protection, and natural trend development of the basin, effectively highlighted the land hotspots and key areas in the basin. Our model also provides methods for future land-use simulation in the basin, and regional land-use planning, land conversion constraints, and a scientific reference for the layout of production space and living space. Cloud content and data accuracy were involved in the selection of remote sensing image data. The forecast period conformed to the domestic national economic planning guidelines and the period of land, forestry, and other relevant thematic planning. Due to the constraints of the actual situation, this study chose 2018 as the starting year of the prediction and selected 2048 as the forecast year, according to the planning habit of adopting integer years in most of China.

2. Materials and Methods
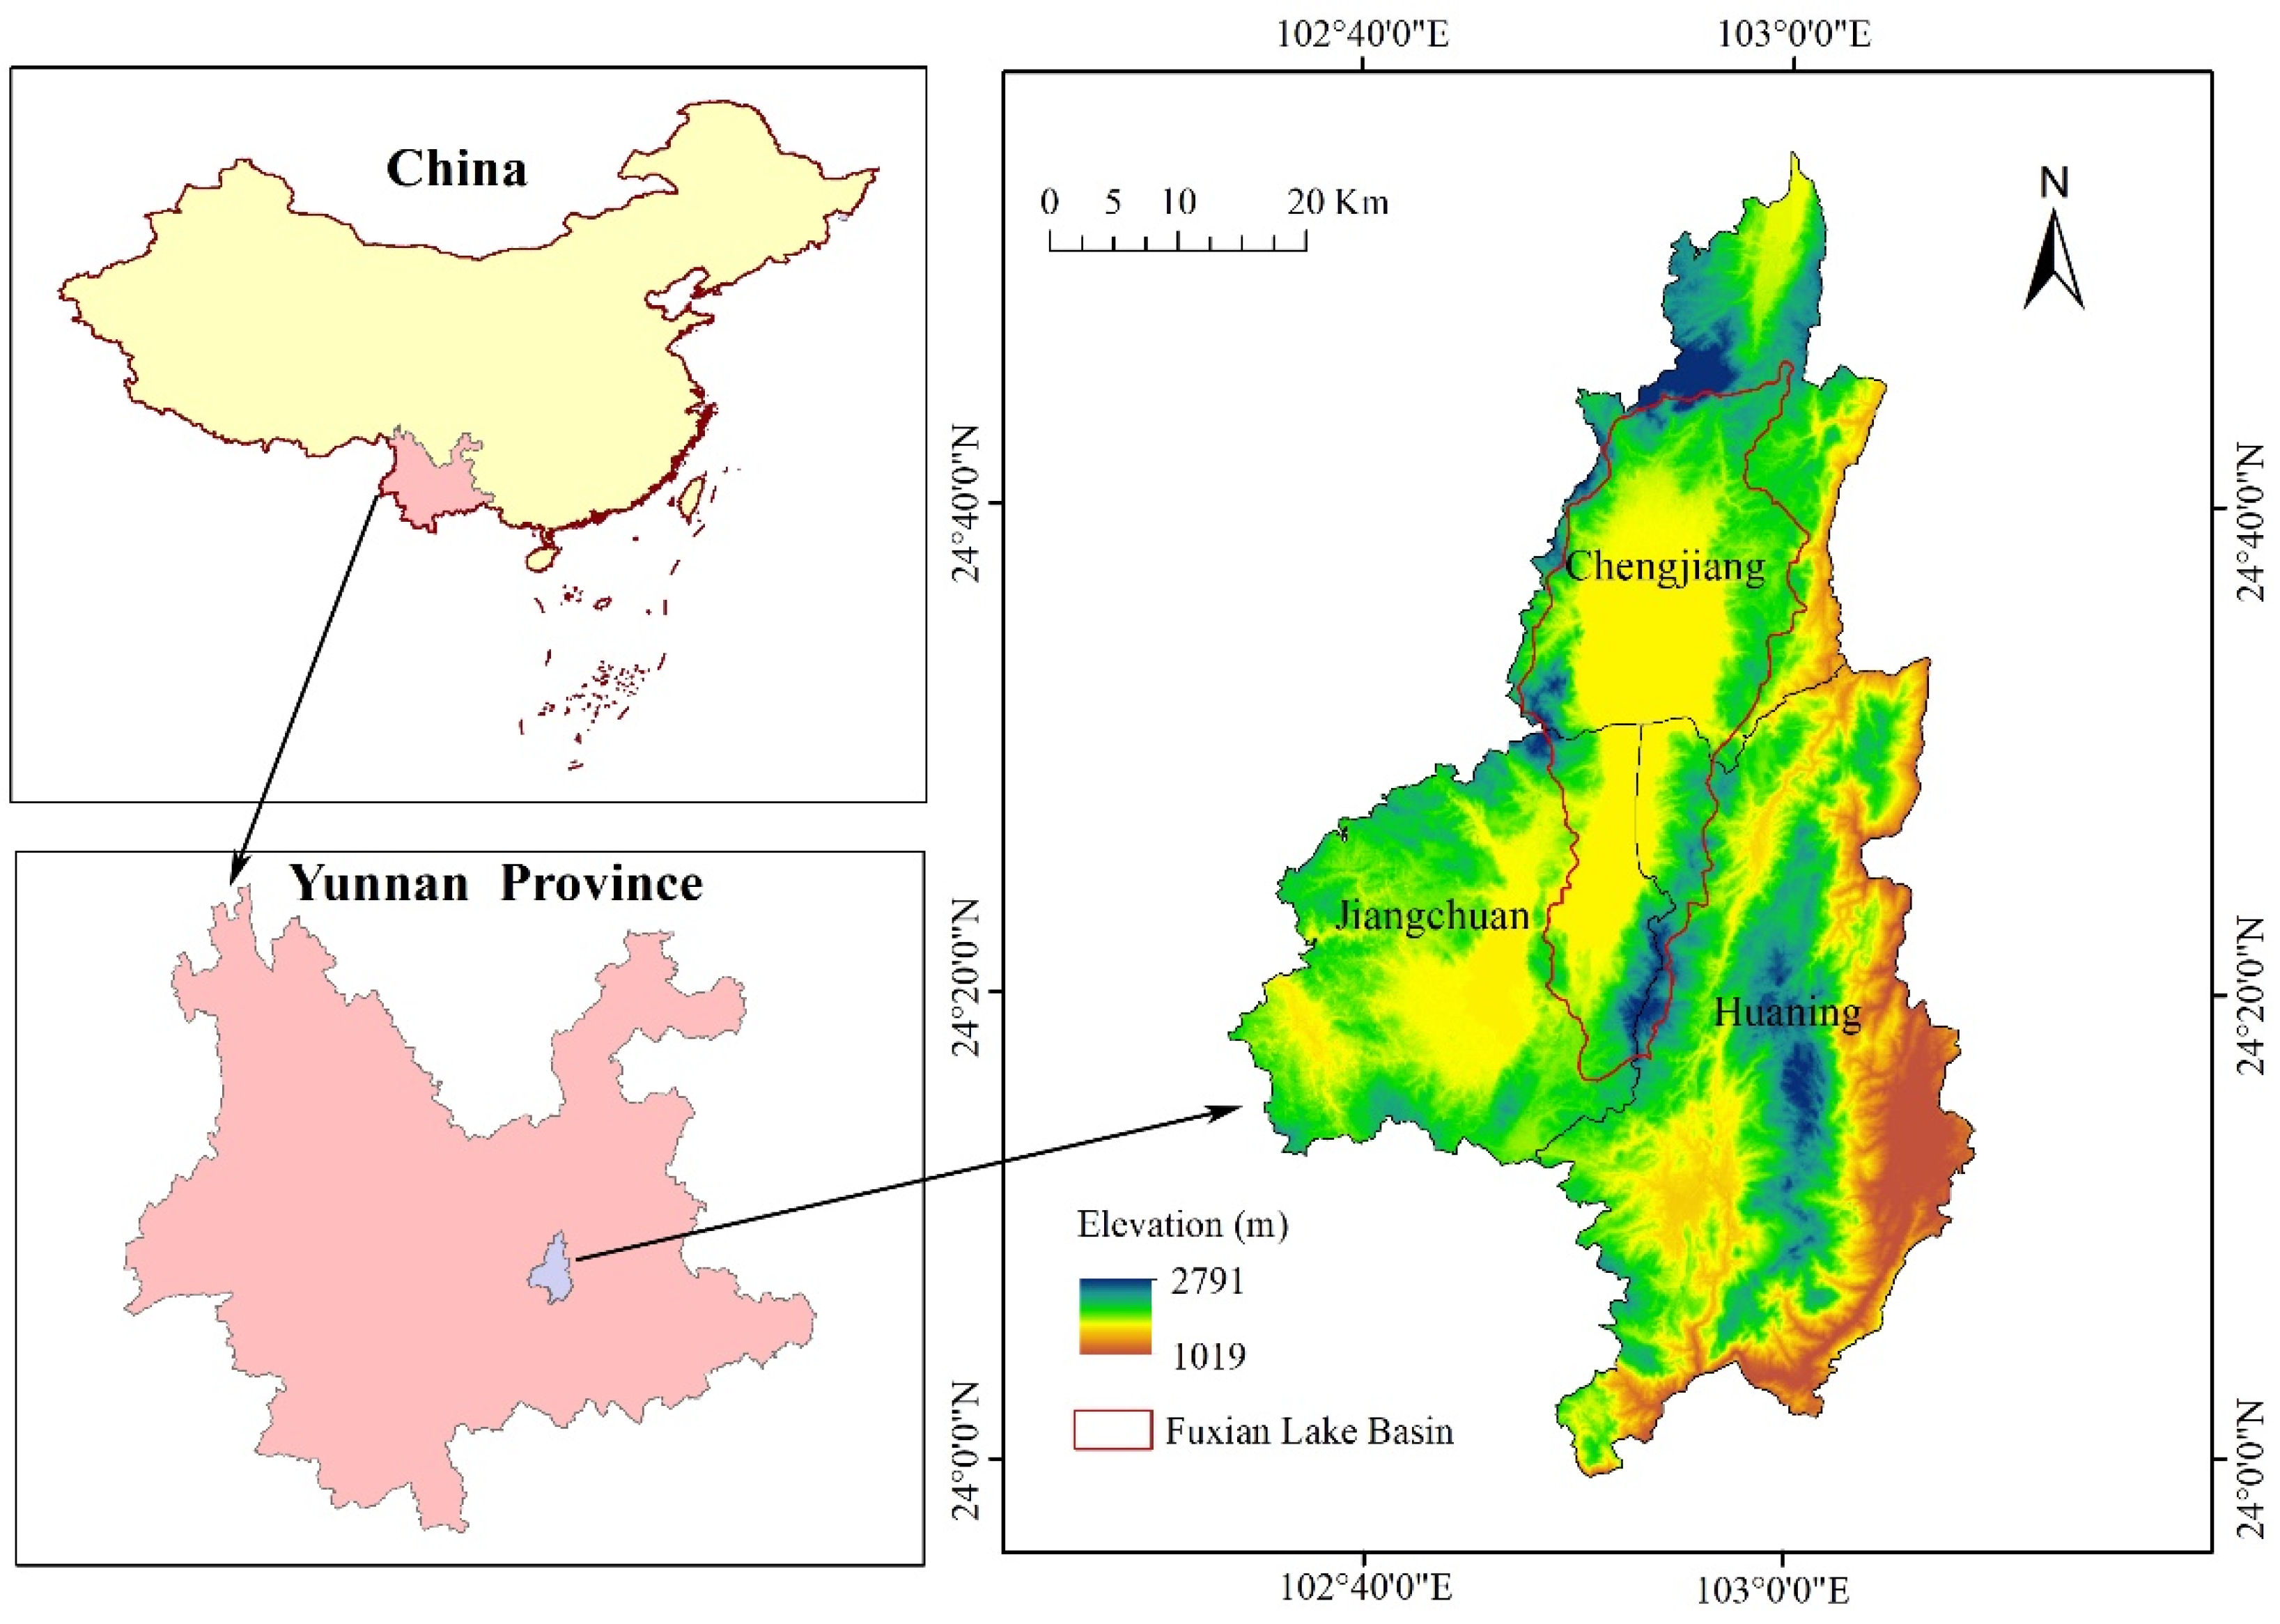
2.1. Study Area

The Fuxian Lake basin (24°21′–24°38′ N and 102°49′–102°57′ E) [40] with an area of 68,725 hm2, is located in Yuxi City, Yunnan province, in the central Yunnan basin. The Fuxian Lake basin has a typical subtropical subhumid monsoon climate, with an average annual temperature of 15.5 °C and spans across the Jiangchuan, Huaning, and Chengjiang counties/districts (Figure 1). It is dominated by plateaus and hilly landforms. In the basin, there are primarily four types of soil: red soil, brown soil, purple soil, and paddy soil. The rural economy in the basin is dominated by the planting industry and the tourism industry has developed rapidly. Fuxian Lake is a north–south tectonic depression belonging to Nanpanjiang River system and is the largest deep-water freshwater lake in China. The elevation of Fuxian Lake is about 1723.35 m a.s.l. with an area of 216.6 km2, average depth of 95.2 m, and capacity of 108 m3.

2.2. Data Source and Processing

The data classification in the Fuxian Lake basin are the Land-sat series data from 1990, 1995, 2000, 2005, 2010, 2015, and 2018 with a data resolution of 30 m × 30 m. The ENVI5.2 software was used to process the filtered images with multi-band synthesis, atmospheric correction, geometric correction, image mosaic, clipping, enhancement, etc. After radiation correction, the spectral curve of the sample point is relatively consistent with that of the standard ground objects [41,42]. Based on field investigation and the data collected, the interpretation signs of remote sensing were established. Visual interpretation and classification of remote sensing images were carried out on the basis of land resource classification, forest land classification, and other systems. Finally, combined with site verification, land-use types in the Fuxian Lake basin were classified into Fuxian Lake basin farmland, arbor forest land, shrubbery land, other forest land, urban and rural residential construction land, swamp wetland, other construction land, industrial and mining construction land, other grassland, artificial wetland, and lake and transportation land. Six factors, including per capita GDP, population density, average annual rainfall, distance from main trunk roads (referred to as “trunk road distance”), and soil distribution and elevation, were comprehensively selected as the driving factors affecting land-use change, based on the consideration of economic development, community coordination, natural protection, and other factors in the Fuxian Lake basin. The projection conversion, resampling, mask, and the other tools of ArcGIS 10.2 software were used to process the spatial accuracy of the data for consistent driving factors and land-use type data with a set resolution of 30 m × 30 m, projected as WGS_ 1984 grid data.

2.3. Research Method

2.3.1. PLUS Model and Operation Mechanism

(1) PLUS model mechanism
The PLUS model comprises the cellular automata (CA) module, the multi-type patch strategy, and the rule mining method based on the land expansion analysis strategy with a better interpretation of the influencing factors of various land-use changes and a higher precision for the simulation results [9]. By evaluating and selecting the parts of various types of land expansion in the previous and subsequent land data and combining the spatial characteristics of the driving factors, the PLUS model uses a random forest method to determine the probability of development of various types of land. The Markov chain estimates the quantity of future land use as the constraint condition of land use. Then, random patches are generated based on the CARS module and other relevant parameter settings. Finally, combined with the land transfer cost matrix and threshold decline mechanism, the spatial pattern of future land use in the Fuxian Lake basin was simulated and predicted.
(2) Prediction of land-use demand
In the PLUS model, the Markov chain and linear regression methods were integrated to determine future land-use demand, which was predicted based on historical data. The general linear regression method is a static model, that can be used to predict the land area that will be used in the future. It cannot be used for visual simulation of land-use spatial structure [43]. The Markov chain estimates the total amount of future land-use demand through highly efficient and effective predictions of the probability of conversion between land-use types [44]. In this study, the Markov chain method was mainly used to predict the land-use cover in 2048 and then used to analyze the land-use change in the Fuxian Lake basin. The land-use cover predicted by the linear regression method in 2048 was only used to assist the hotspot analysis of land-use changes in areas used by subsequent analyses.
(3) Land-use simulation process
The land-use simulation process of the Fuxian Lake basin was divided into three parts: (1) the PLUS model was used to simulate the land-use data in 2018, and the accuracy and consistency were compared with the real data of 2018, based on the land-use data and driving factors in 1990 and 2018; (2) on the premise that the overall accuracy and consistency of the model is satisfied, different rules were set for the transformation of land-use types, and the land-use data in 2048, generated by the Markov chain method and linear regression method as the constraint, were used to simulate the spatial pattern distribution of land use in the Fuxian Lake basin in 2048 based on the historical data and the land-use data in 2018 as the prediction starting point; and (3) we extracted the hotspots of land-use change in the watershed (e.g., the spots that change and change consistently in the future under the prediction of different methods).

2.3.2. Calculation of Land-Use Dynamic Degree

The dynamic degree of land use can be quantitatively calculated through the land quantity change model, which can directly reflect land resource changes [45]. In this study, the change degree of land-use types of different land types [46] and the dynamic degree of the comprehensive land use of the study area [47] in different change periods were calculated by using the land quantity change model to assist in exploring the characteristics of land-use change in the Fuxian Lake basin from 1990 to 2018. The formula is as follows:
L C = L U j L U i L U i × T × 100 %
Z L C = [ m n Δ L U m k 2 × m n L U m ] × 1 T × 100 %
In the above formula, LC is the dynamic degree of a single land-use type; T is the research period; LUi and LUj are the areas of a land type at the beginning and end of the research period, respectively; ZLC is the dynamic degree of comprehensive land use; n is the total number of land-use types in the Fuxian Lake basin; ∆LUm-k is the absolute value of the area of type m land-use converted to type k land-use type in the study period; and LUm is the area of type m land-use at the start of the study.

2.3.3. Rules for Conversion of Land-Use Types

The regional land development demands determine the development orientation of land space to a certain extent. Combining the current land-use situation in the Fuxian Lake basin with the requirements of national policies on land, the simulation of future land use should include land conversion constraints that meet the relevant planning criteria. These can provide certain decision-making references for sustainable economic development and ecological protection, and assist in the formulation of scientific and reasonable land-use planning and environmental protection planning to optimize the spatial layout of regional land use.
In this study, the land transfer matrix in the PLUS model was configured to define three different land-use type transformation rules and simulate the spatial layout of land use under three scenarios. In the transfer matrix, the “0” value indicates that conversion is not allowed, and the “1” value indicates that conversion is allowed. Under the natural trend development scenario, all the land transfer matrices were set as “1” values, indicating that all land types may be transferred out or transferred in from other land types. Under the production protection scenario, land-use transformation focuses on ensuring that farmland does not change excessively and limiting the quantity and direction of its transfer. Under the ecological protection scenario, land-use transformation mainly considers the protection of forests, waters, wetlands, and other ecologically sensitive areas in the Fuxian Lake basin.

2.4. Precision Inspection

In this study, the Kappa coefficient and FoM (Figure of Merit) value were applied to evaluate the accuracy of the PLUS model simulation results. The closer the Kappa coefficient value is to 1, the better the simulation accuracy is. When the Kappa coefficient is higher than 0.7, it indicates that the simulation accuracy of the model is statistically satisfactory [48]. The FoM value is generally small, ranging from 0 to 1. The higher the value, the higher the consistency between the model prediction results and the actual values [49]. It can be used to identify the accuracy of the area where changes occur between the whole land and the simulation results.

3. Results

3.1. Analysis of Land-Use Characteristics in the River Basin

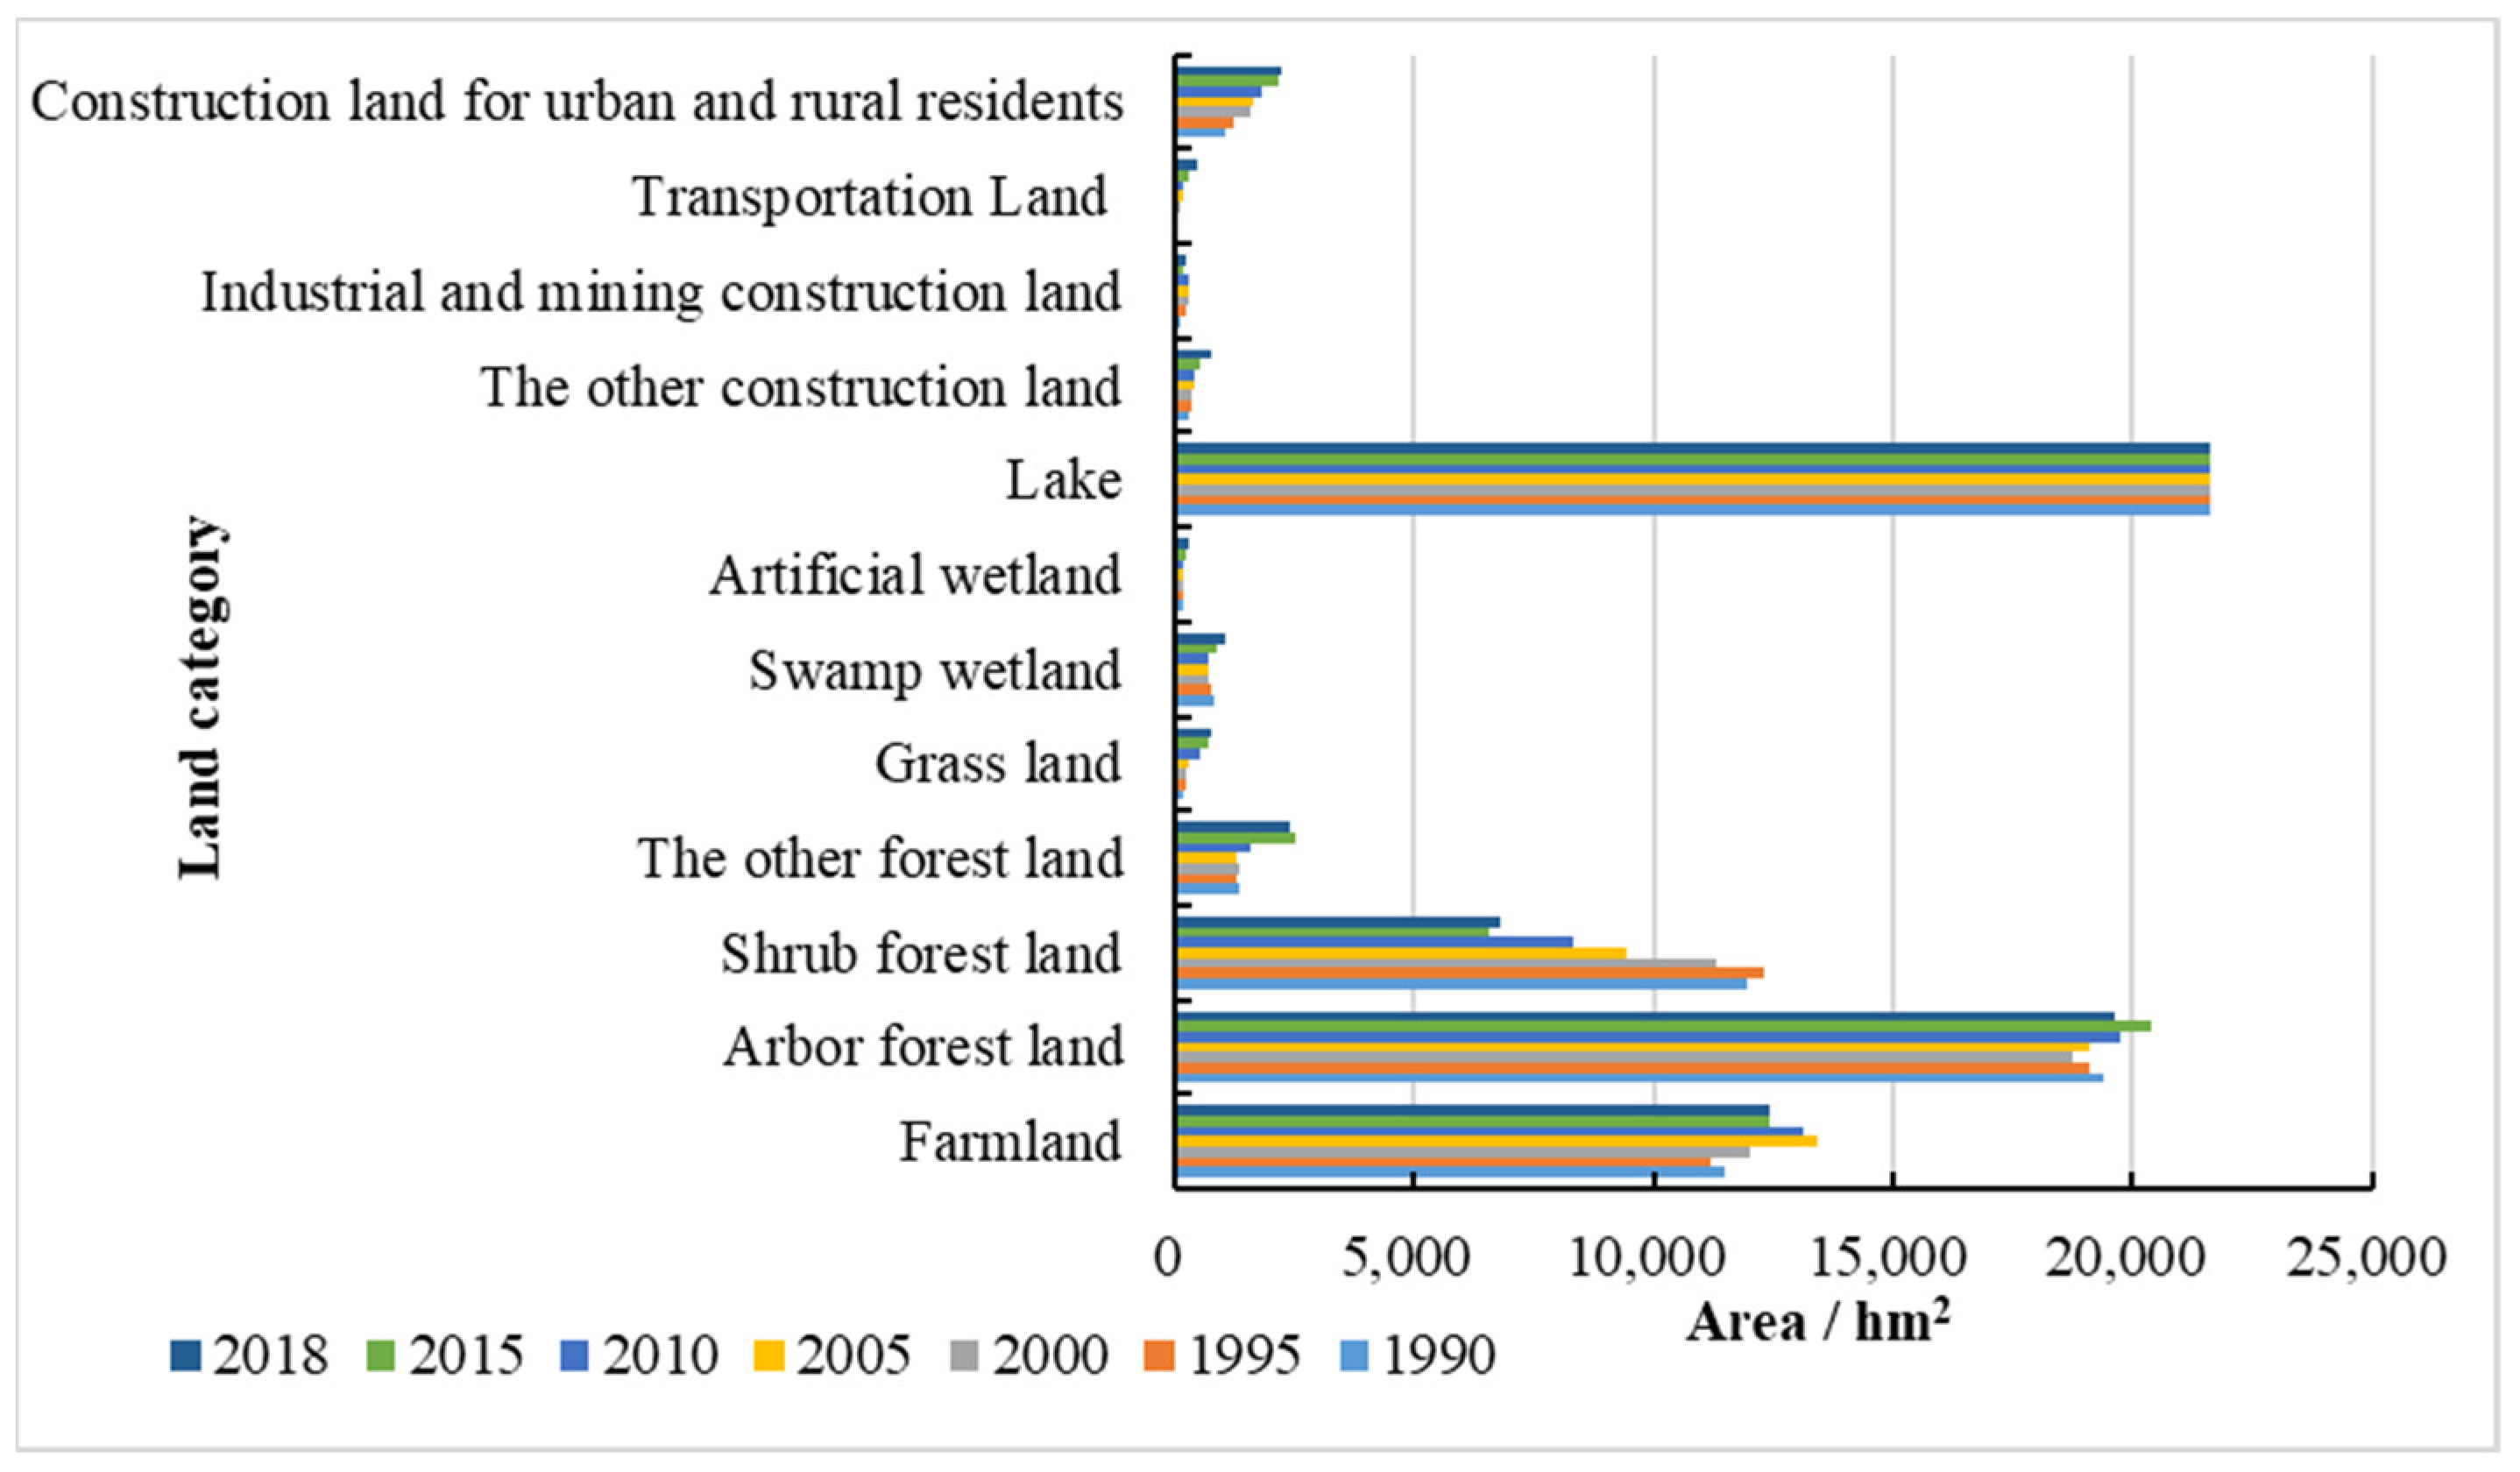
3.1.1. Analysis of Quantity and Structure Characteristics

In the Fuxian Lake basin, arbor forest land, farmland, shrub forest land, and other forest land were the dominant land types. Urban and rural residential construction land, swamp wetlands, grasslands, artificial wetlands, other construction land, industrial and mining construction land, and transportation land occupied a relatively low proportion in the Fuxian Lake basin. The area of lakes has not changed much over time. Arbor forest land, farmland, other forest land, grassland, urban and rural residential construction land, other construction land, and transportation land showed a significant growth trend, while shrub forest land area decreased annually, with the largest change range among all the land types. In summary, ecological and production protection are the main land-use development strategies in the studied region. With the continuous development of urban construction, the population in the basin is increasing, and the demand for food and construction land is increasing every year. The expansion of the majority of land types has occupied the original shrub forest land, leading to the continuous reduction of its area (Figure 2).

3.1.2. Analysis of the Dynamic Degree of Land Use

Using Formula (1), the dynamic degree of change of land use of the 12 land types in the Fuxian Lake basin in five periods from 1990 to 2018 was calculated. In the basin, the change rate of land for transportation was the fastest, and construction land reached the maximum growth rate from 1995 to 2000. The other construction land, industrial and mining construction land, urban and rural residents’ construction land, and artificial wetlands increased to a certain extent from 2010 to 2018 with the development of regional urban construction. Since the total amount of farmland and arbor forest land is large, the dynamic degree of land use is small compared with other land types in the historical period and Fuxian Lake has basically remained unchanged. During each study period, the shrub forest land showed a negative growth rate, indicating that the degradation of shrub forest in this region was relatively severe. However, the area of the other forest lands, grasslands and swamp wetlands were relatively small. The annual average change rate was relatively high, with noticeable changes from 2005 to 2018 (Table 1). According to Formula (2), the comprehensive land-use dynamic degree of change of the whole Fuxian Lake basin during the five study periods from 1990 to 1995, 1995 to 2000, 2000 to 2005, 2005 to 2010, and 2010 to 2018 were 0.22, 0.40, 0.57, 0.42, and 0.45, respectively. The land use in the basin has changed to different degrees at different times. The comprehensive land use dynamic showed a trend of increasing initially, then slowing down before increasing again. The degree of land change is more intense after 2005, which is consistent with a single type of land-use dynamic change.
Based on the comprehensive analysis of the single land type and the dynamic degree of extensive land use in the whole region, it can be seen that there are small land types in the Fuxian Lake basin with a large degree of change, such as land for transportation, other construction land, artificial wetlands and other human factors, which have a significant impact on the dynamic degree of land use in the whole region, reflecting that with the continuous improvement of urbanization level, human activities have a more significant impact on farmland and a potential large disturbance to forest land.

3.2. PLUS Model Accuracy Verification

Based on land-use data from 1990, the relevant parameters were inputted into the model to simulate the spatial distribution of land use in the Fuxian Lake basin in 2018, and the simulation results were tested using current land-use data from 2018. The results showed that the overall simulation accuracy of the model was 79.14%, the Kappa index was 0.73, and the FOM value was 0.29. These results show that the model has good applicability in this study. In addition, the PLUS model can be used to simulate the future land-use development of the Fuxian Lake basin.

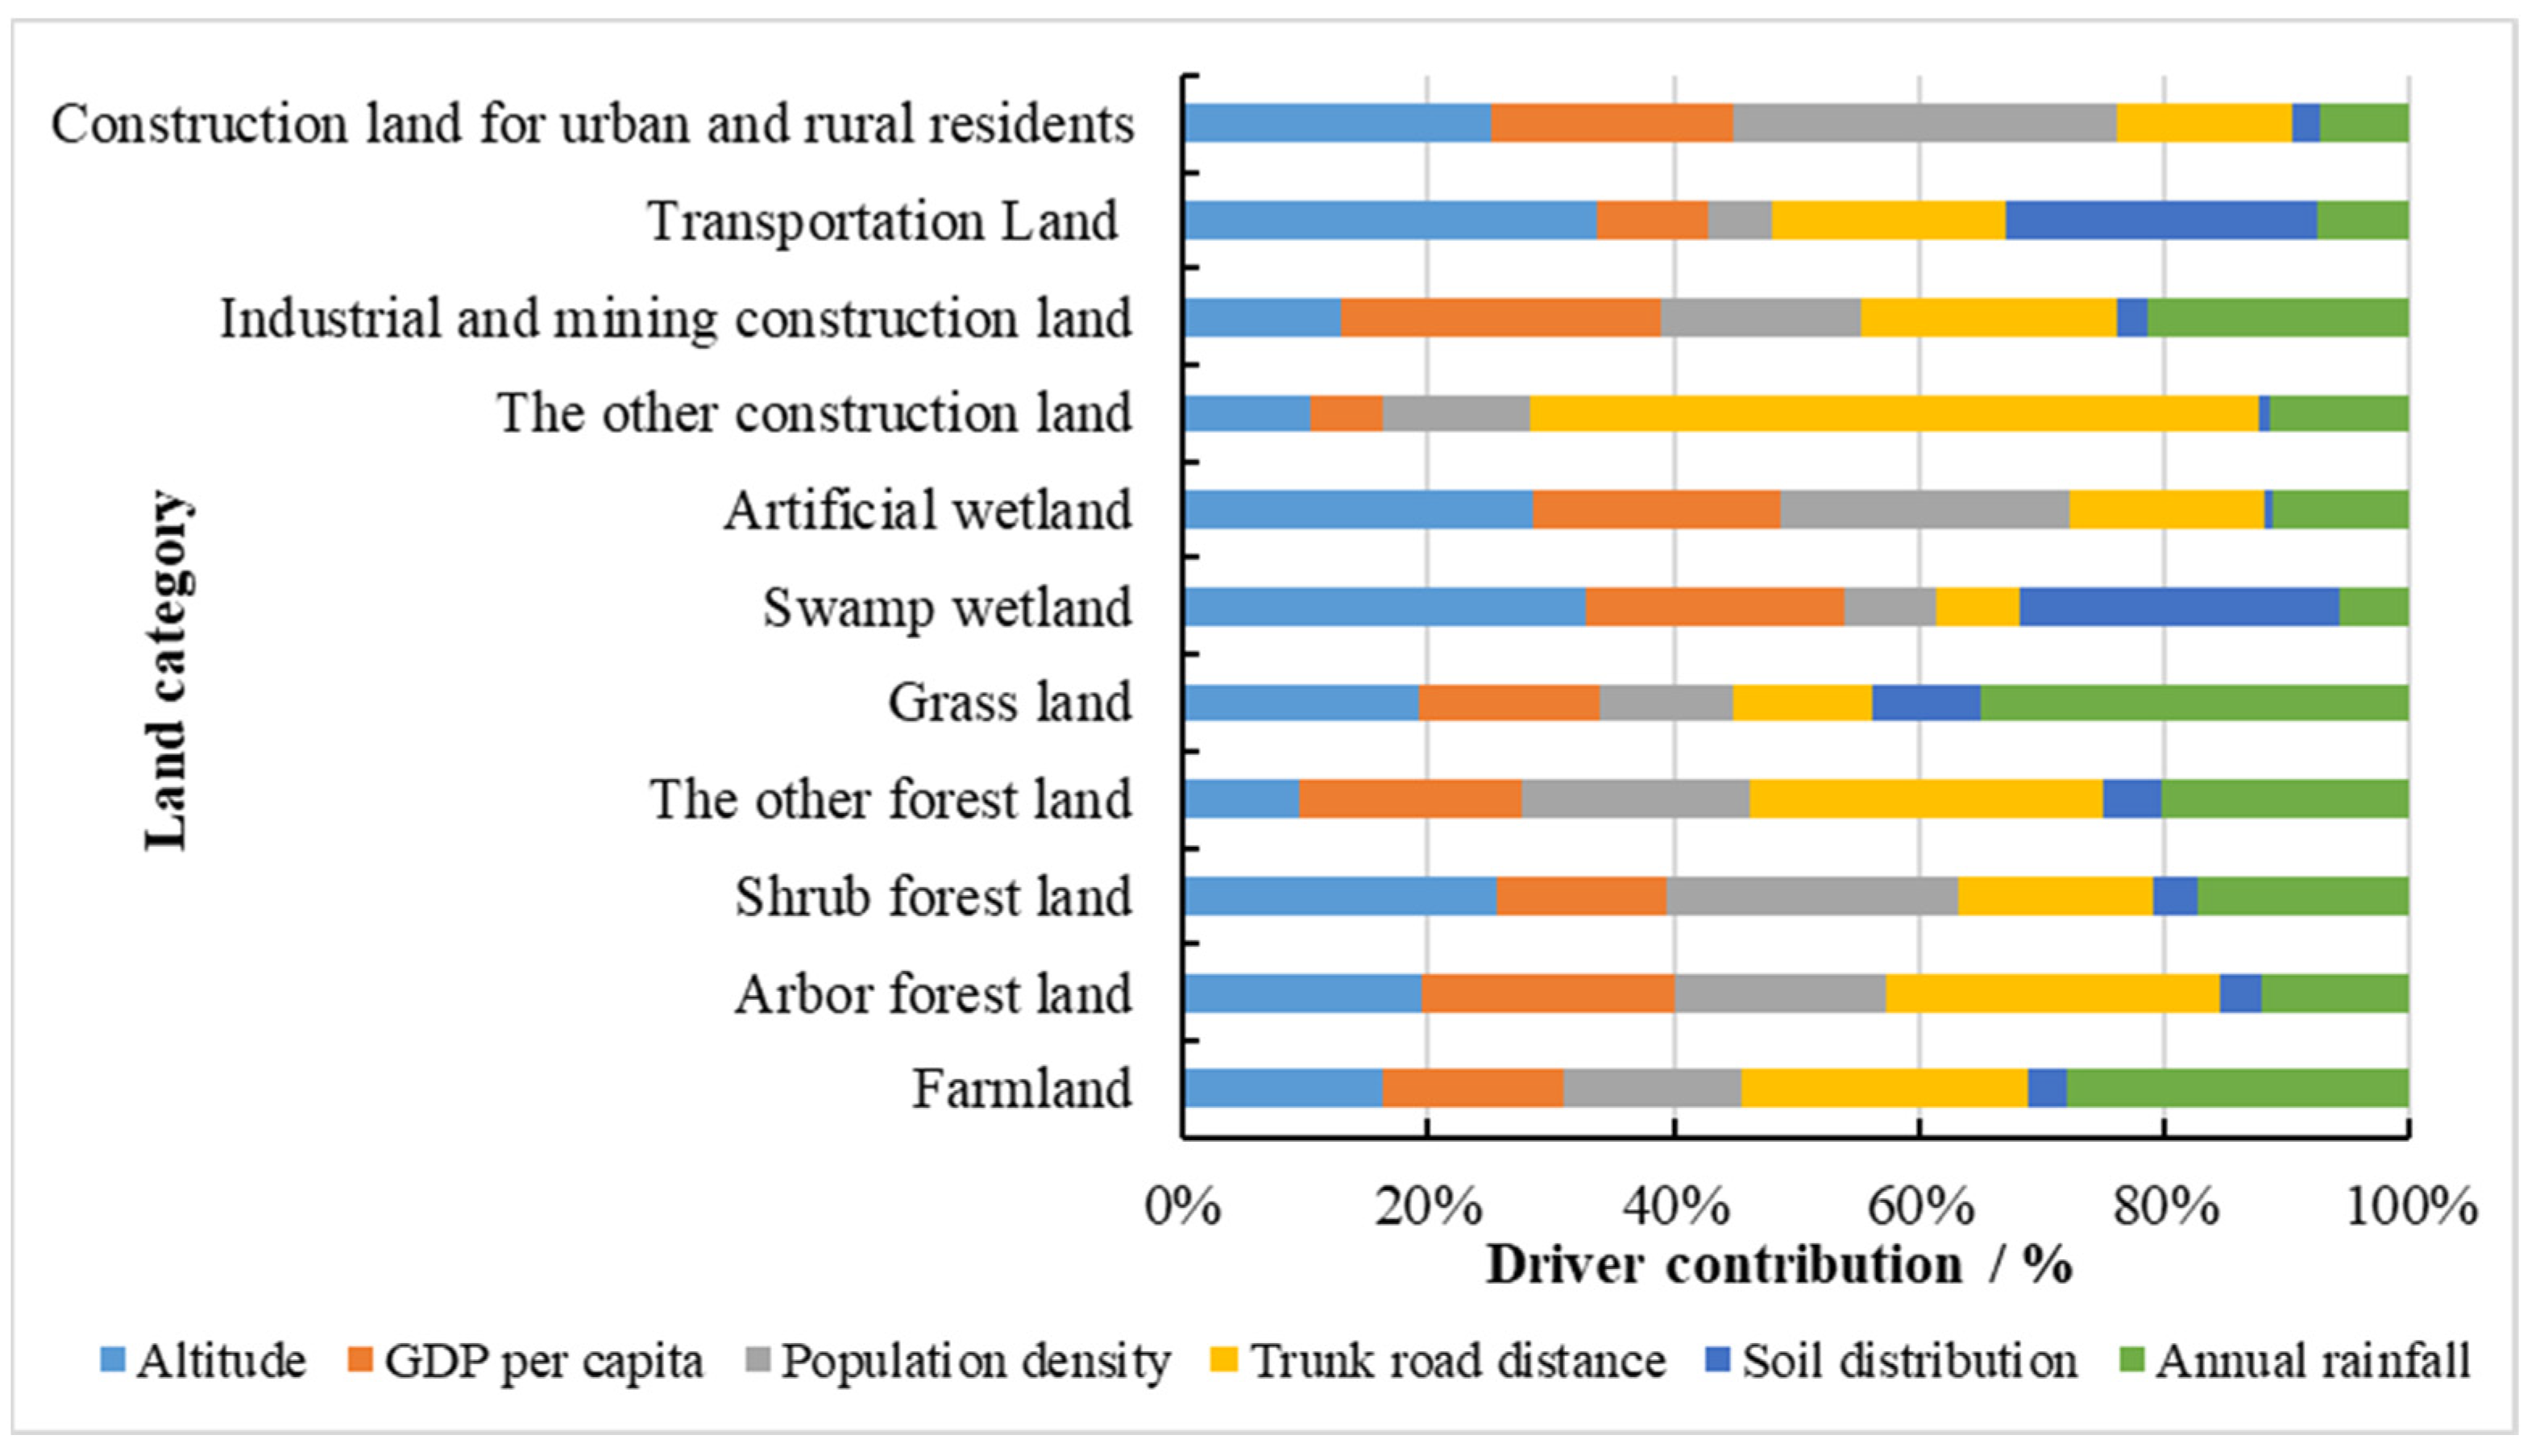
3.3. Driver Contribution Analysis

When investigating the relationship between the expansion of land-use types from 1990 to 2018 and the driving factors, the labels and the extracted values of multiple driving factors at exact locations were used to reconstruct the training dataset, so as to calculate the contribution of the driving factors to the development and change of each category (Figure 3). The analysis in Figure 3 shows that the influence of different driving factors on land-type changes was different. Farmland and the other forest land were mainly driven by rainfall and trunk road distance, with rainfall also being the main driving factor affecting grassland changes. Soil distribution was the main driving factor affecting the change in swamp wetlands and transportation land. The change in swamp wetlands, transportation land, and artificial wetlands was mainly driven by elevation. The change in industrial and mining construction land was primarily driven by per capita GDP. The change of the other construction land, arbor forest land, and industrial and mining construction land was mainly driven by the distance between main roads. The driving force of elevation and population density dramatically influenced the change in urban and rural residential construction land. The number of shrub forest land continued the trend of decreasing over time, which was greatly influenced by elevation and population density, indicating that the disturbance to this land type in the Fuxian Lake basin was sustainable and conformed to the actual situation of urban construction site selection and economic development occupation in the Fuxian Lake basin. However, the driving effect of the PLUS model on lake area changes cannot be simulated. The reason is that the net change of the lake was small, and the area change was less than 7 hm2 from 1990 to 2018, which is almost unchanged compared with other land types.

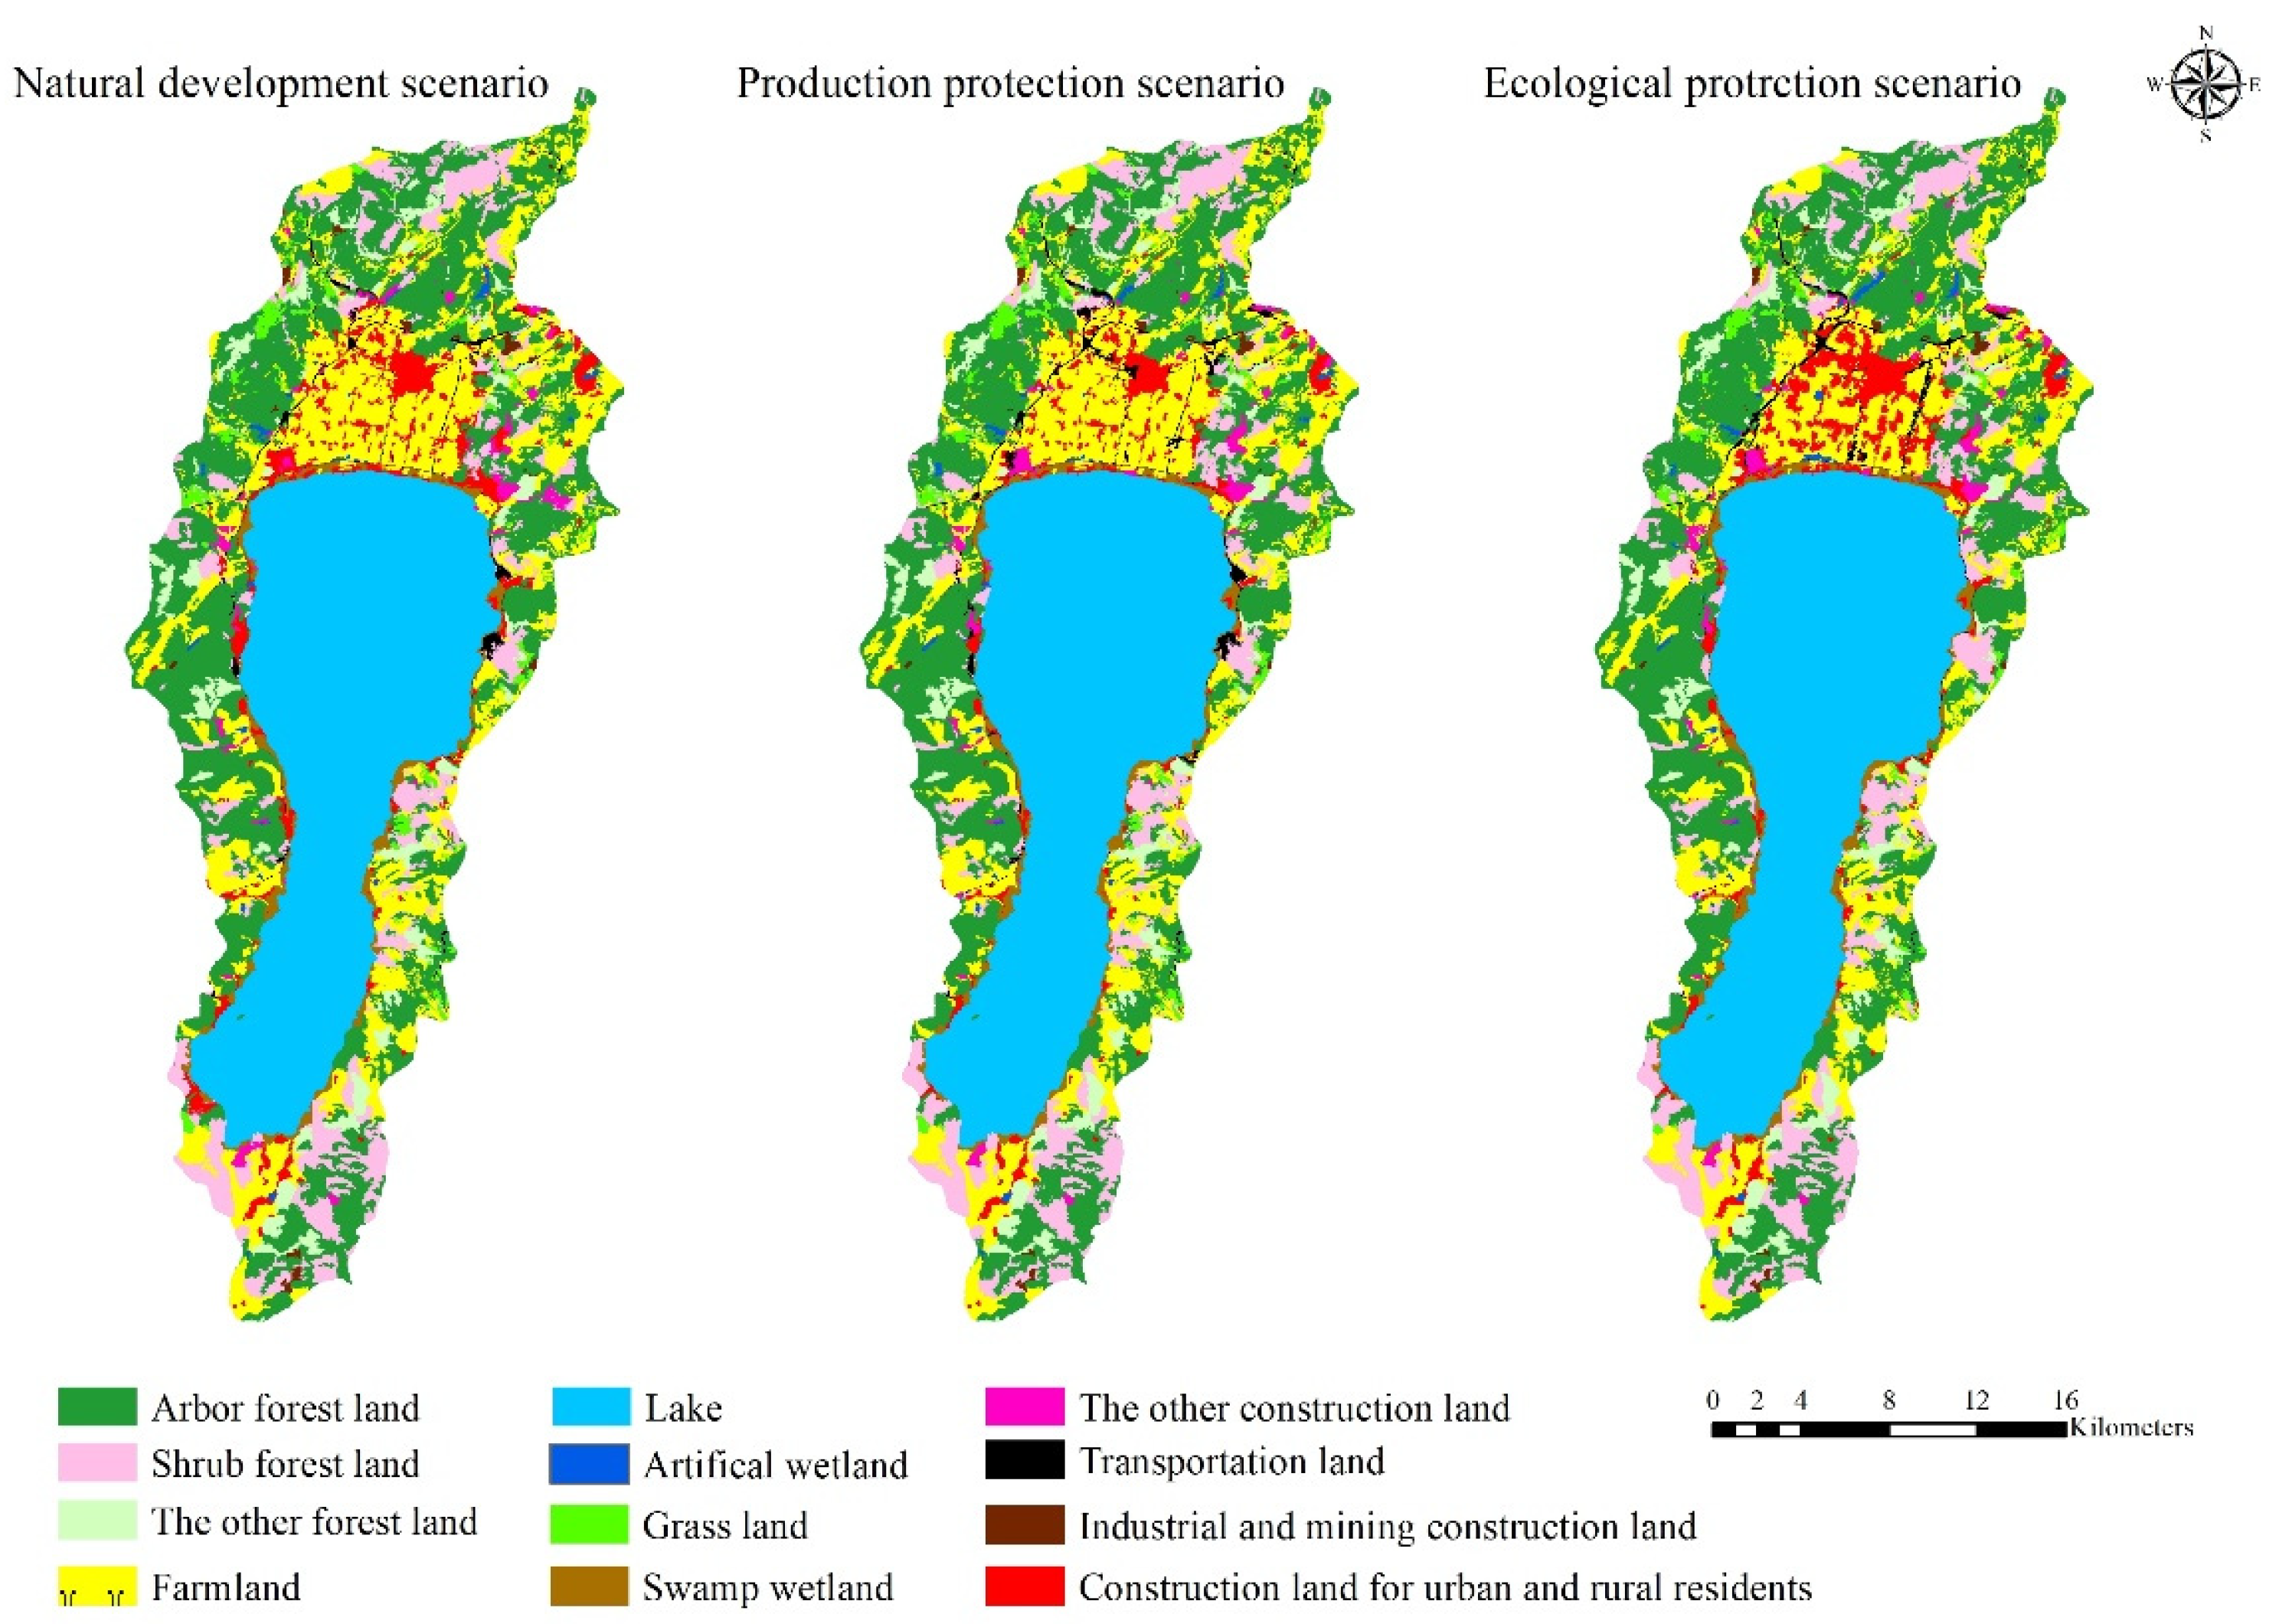
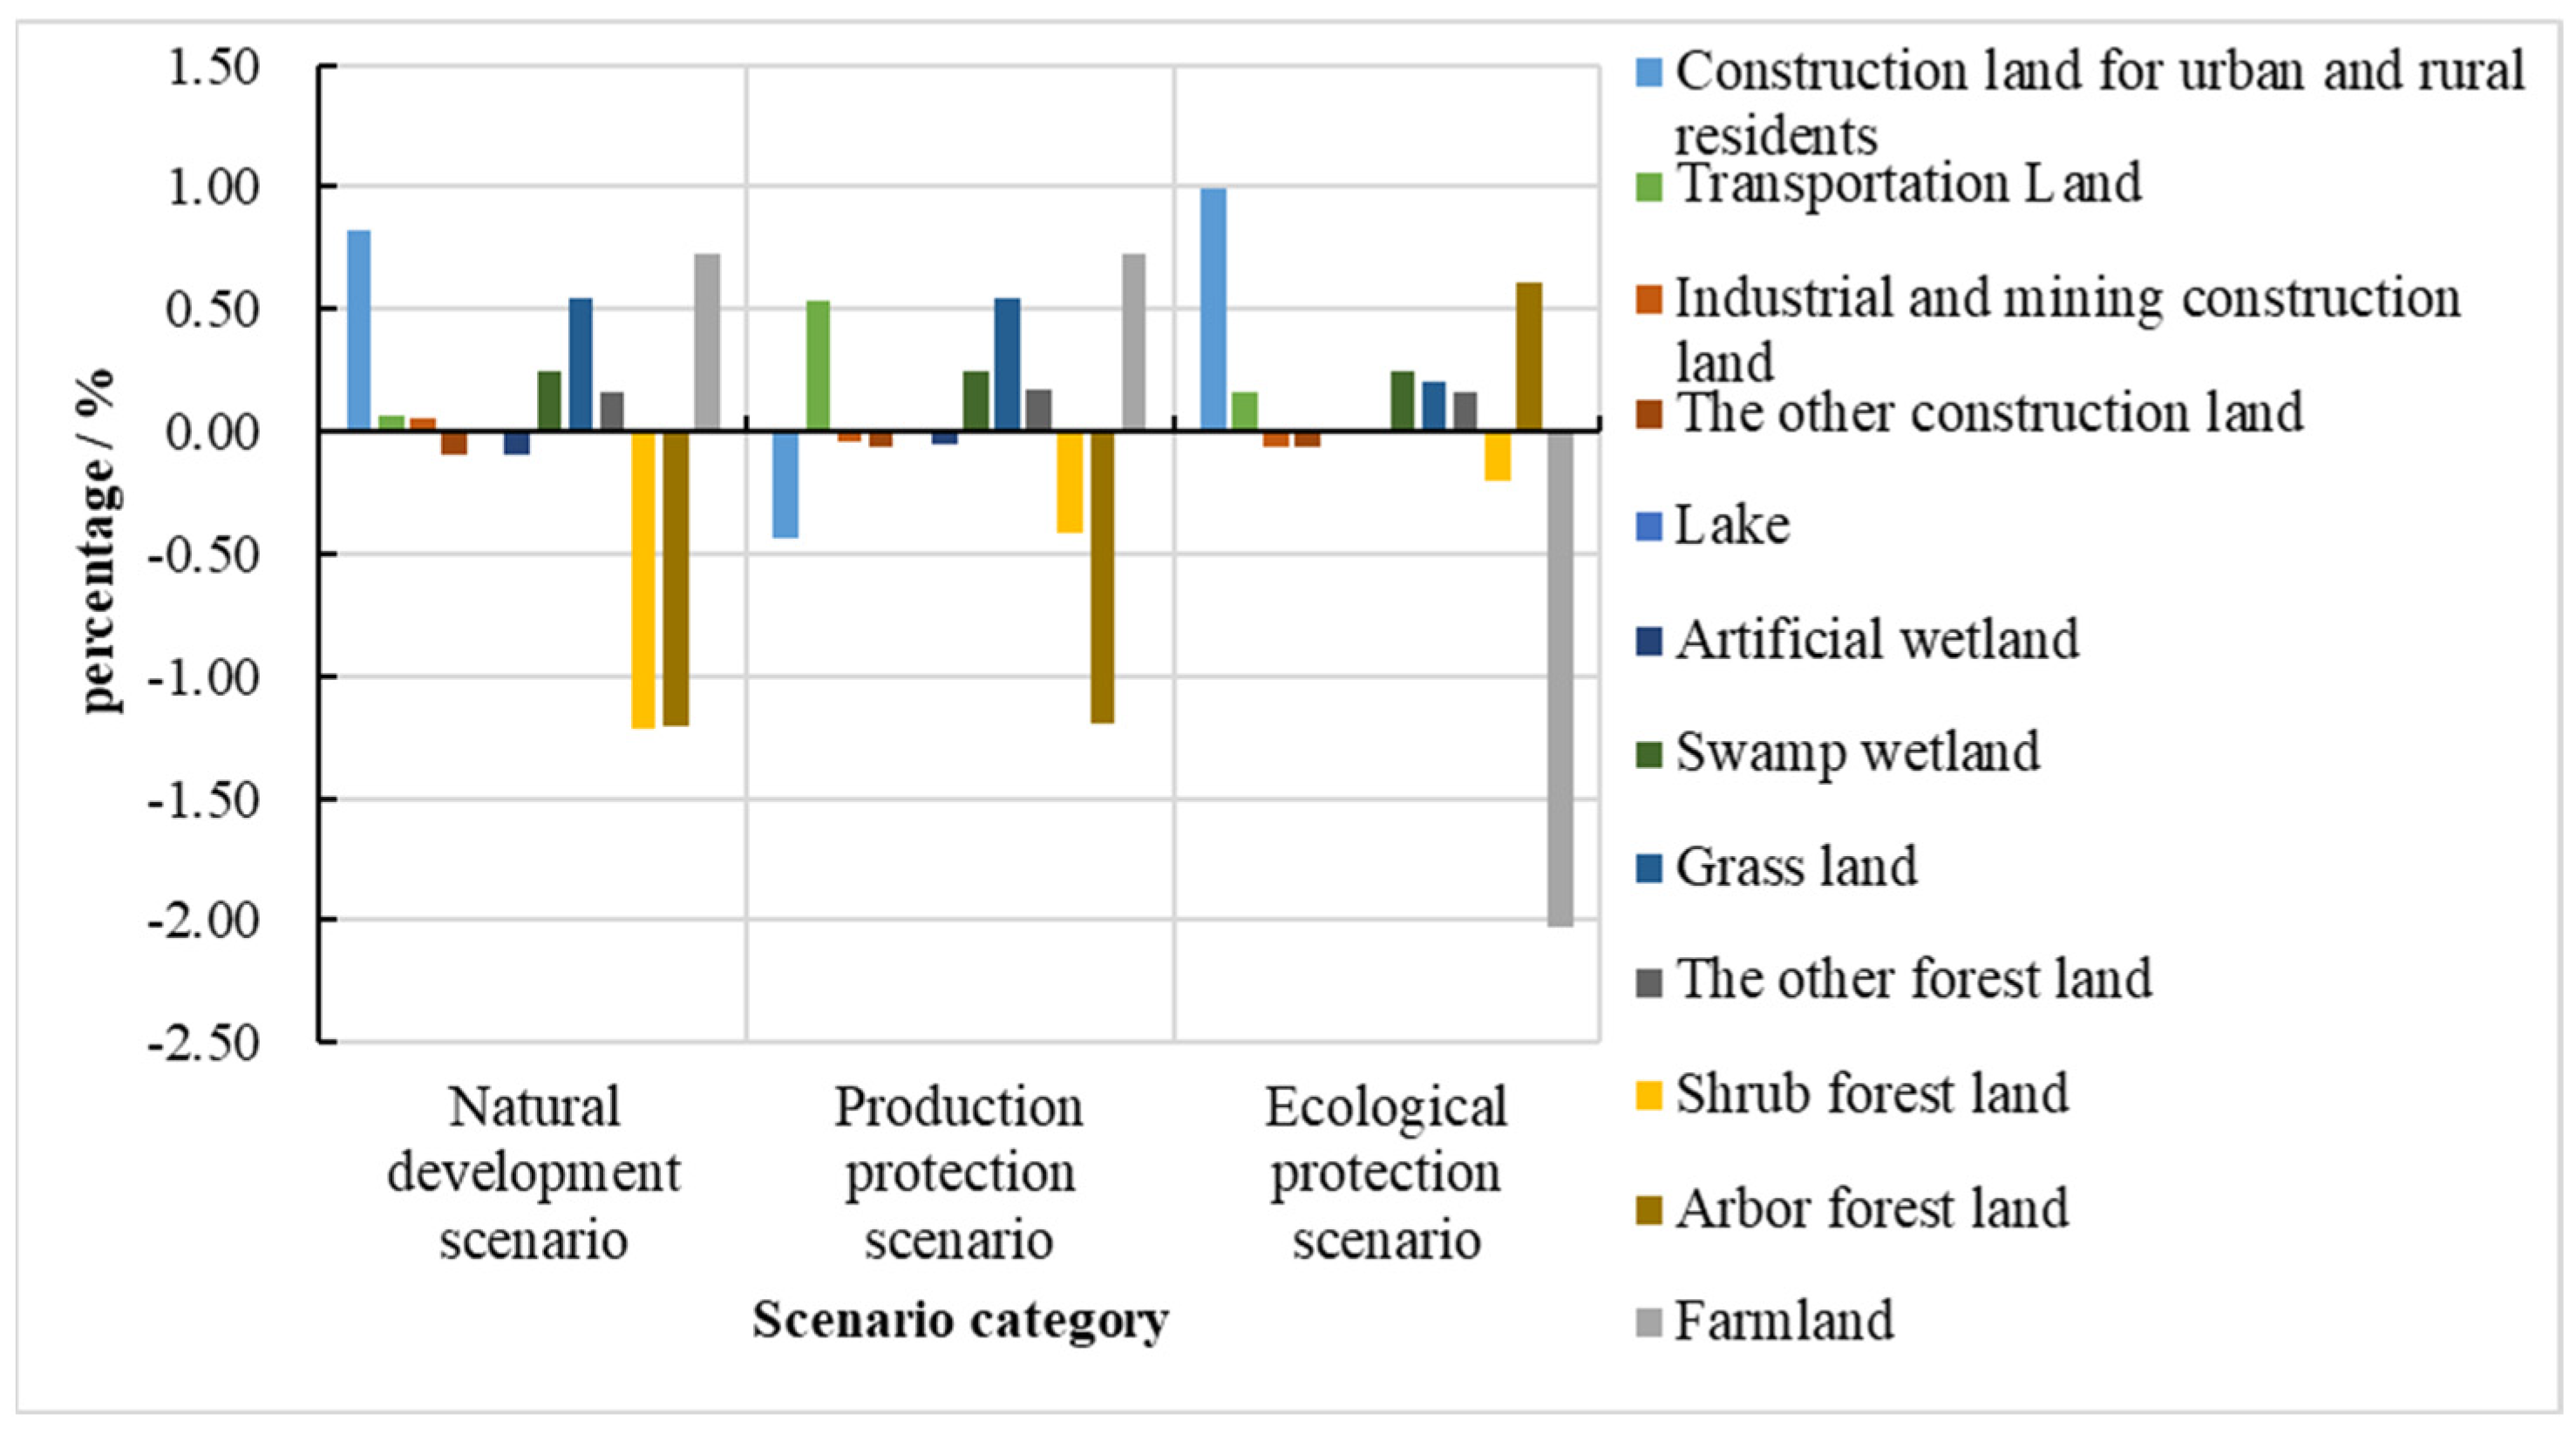
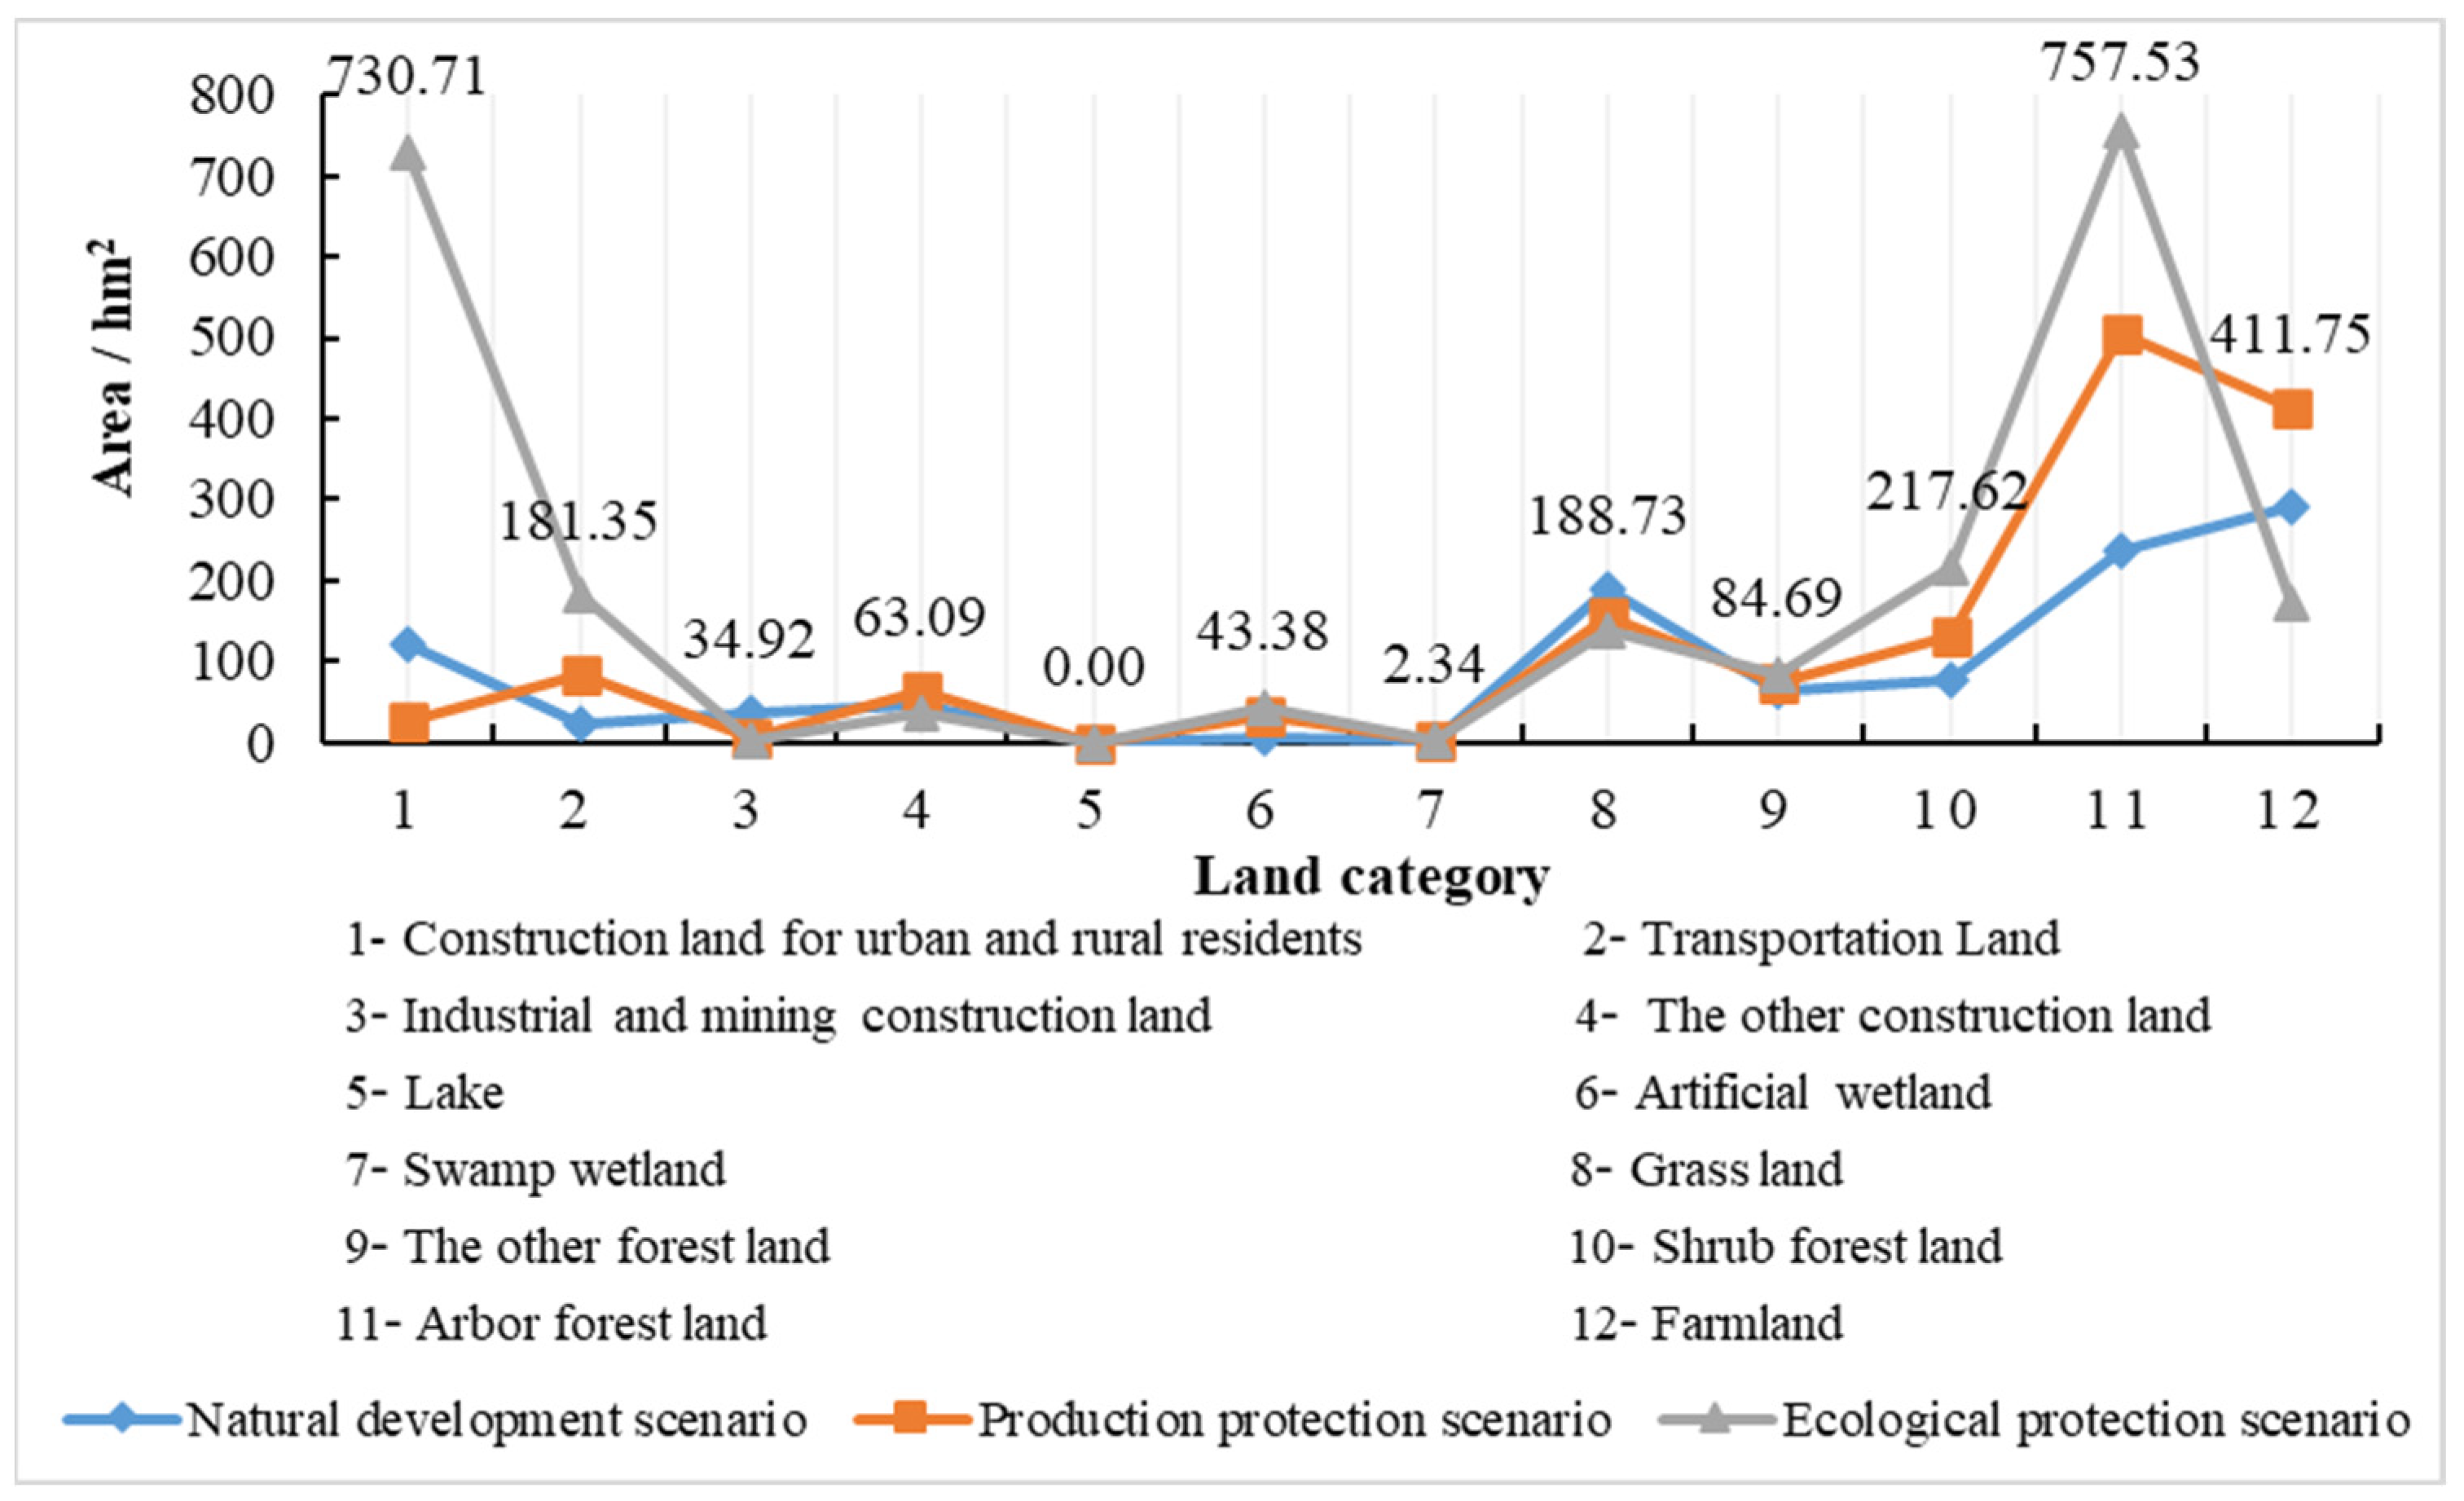
3.4. Land-Use Prediction Results under Multiple Scenarios

The PLUS model was used to simulate the changes in land use under three different scenarios, driven by the demand for future land use to obtain land-use predictions for the Fuxian Lake basin in 2048. According to the analysis of the land-use type transfer matrix table (Table 2), the spatial distribution of predicted land-use types in 2048 (Figure 4), and the percentage of predicted changes in land use under three scenarios (Figure 5), it can be concluded that in the natural trend development scenario, the demand for food from urban construction development and population growth occupied forest land by a large margin, whereas construction land, farmland, and grasslands increased by a large margin. Specifically, the area of arbor forest land that was converted to other construction land and farmland was 190.55 hm2, 474.23 hm2, and 2286.99 hm2, respectively. Shrub forest land was degraded to grassland. In the production protection scenario, less farmland was converted to other types of land. The traffic and transportation land used to assist agricultural production activities increased, while forest land was still decreased. The area of arbor forest land converted to farmland was 434.55 hm2, and the area of shrub forest land and urban and rural residential land converted to traffic and transportation land was 210.43 hm2 and 133.21 hm2, respectively. In the ecological protection scenario, the development of shrub forest land and arbor forest land increased compared with the natural trend. Urban construction and development were based on farmland expansion to reduce the occupation of arbor forest land and shrubbery forest land. Specifically, the area of farmland and grasslands that were converted to arbor forest were 383.04 hm2 and 102.19 hm2, respectively, while shrub forest land was rarely converted to other land types. The predicted land-type distribution of the lake surface of Fuxian Lake and the swamp wetland area distributed around it under the three scenarios was basically unchanged, which was consistent with the minimal changes of lake surface area and water volume in Fuxian Lake during the historical period. In general, the land-type changes in the Fuxian Lake basin had different land-use type transformation directions under different land-use management and control measures. Among them, farmland, arbor forest land, shrub forest land, urban and rural residential construction land, and transportation land were subject to frequent expansion and changes and were vulnerable to human control and management. The distribution law of production space was related to artificial land surface distribution space. At the same time, attention should be paid to the dynamic changes in ecological space types and structures caused by continuous urbanization.

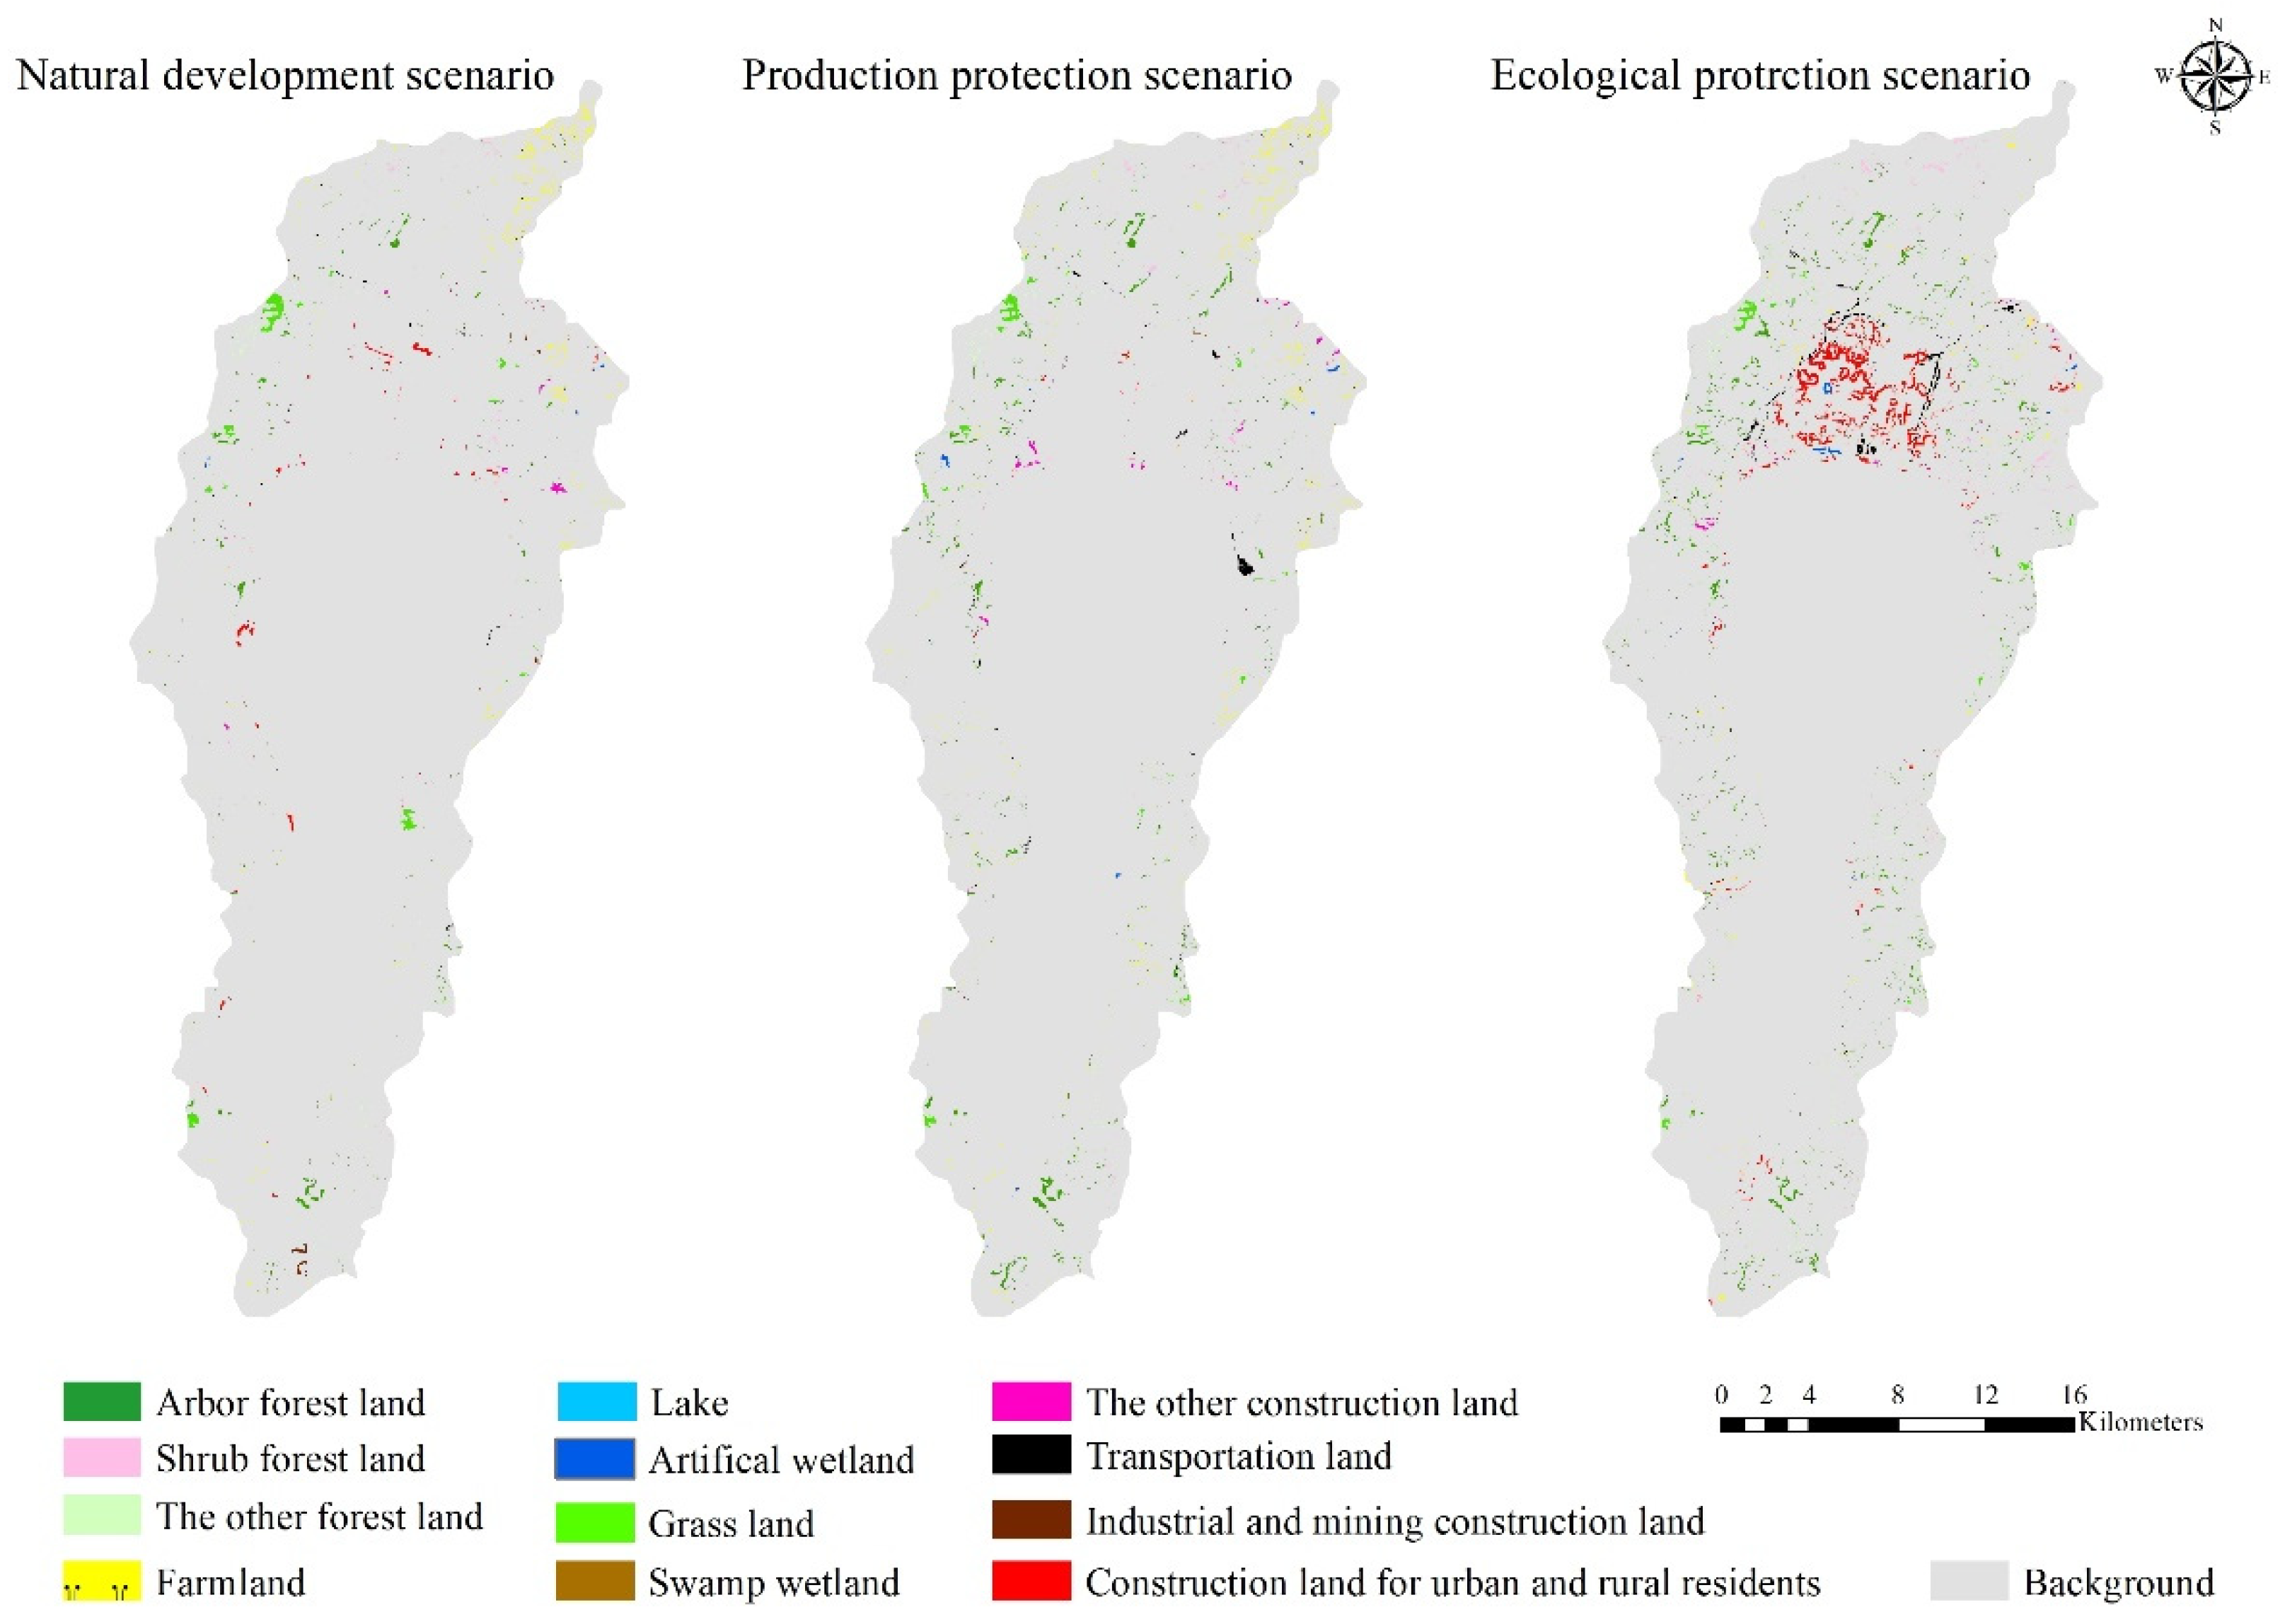
3.5. Analysis of Land-Use Change Hotspots in the Study Area

Figure 6 shows the comparison of land types in critical areas with respect to land-use changes under the three scenarios. Figure 7 shows the spatial distribution of hotspots of land-use changes. In terms of land use, the number of hotspots in the ecological protection scenario was the largest, with an area of 2369.34 hm2. The number of hotspots under the production protection scenario was second, with an area of 1498.41 hm2. Farmland and forest land were the hotspots in the Fuxian Lake basin. The growth of farmland space was mainly at the cost of reducing the spatial development of urban and rural residential construction land. The number of hotspots under the natural trend development scenario was the least, with an area of only 1086.21 hm2. Farmland, arbor forest land, urban and rural residential construction land, and grasslands were all hotspots in the Fuxian Lake basin. The development of farmland and forest land was relatively strong, and there was a contradiction between squeezing and occupying land space.
In geographical space, the northern part of the study area consisting of the coast of the north Fuxian Lake and the southern land, was the hotspot of land-use changes. Under the ecological protection scenario, compared with the other two scenarios, shrubland had the smallest reduction and east of the northern bank of Fuxian Lake, the area with an average elevation of about 1800 m showed expansion. On the land north of Fuxian Lake, a large number of contiguous forest land showed a large number of infiltration expansions around the road. The land for construction and transportation of urban and rural residents was only dispersed and expanded from the original area. The reason is that this area was originally residential land and farmland, with gentle terrain and surrounded by forest land on three sides. In this situation, the development of forest land restricted the conversion of construction land outside the ecological space under the natural trend development scenario. The other forest land showed simultaneous expansion with forest land and shrub forest land on the south bank of the study area and west of the northern bank of Fuxian Lake; grassland, which had a reciprocal transformation relationship with arbor forest, expanded the most in this scenario. These results indicate that the conversion potential of the other forest land is very large and flexible, which can be used as the first consideration for the construction and occupation of the forest lands. At the same time, attention should be paid to the grassland to prevent the potential degradation of forest land into grassland. In the production protection scenario, the farmland in the northern part of the region with the highest annual rainfall presented a large and concentrated development trend. At the same time, artificial wetlands such as reservoirs and ditches, which are helpful for irrigation and auxiliary uses, and transportation land have a certain growth distribution along with the expanded cultivated land. It shows that regional production development is closely related to transportation land and artificial wetland, and it is important to consider the development of such land in land planning in regards to the development of production.

4. Discussion

4.1. Driving Forces and Suggestions for Land-Use Change

In this study, the PLUS model was used to explain the influence of driving factors on land use and land cover from a qualitative perspective. In the Fuxian Lake basin, the land type mainly involved in terrestrial ecological protection, such as arbor forest land, other forest land, and grassland, and the land type most suitable for product development, such as farmland, were greatly affected by the human factor of the distance between the main roads and the natural factor of rainfall. Natural factors such as elevation and soil distribution had a great influence on the wetlands, such as swamp wetlands and artificial wetlands. The land types mainly used for urban construction, such as transportation land, urban and rural residents’ construction land, other construction land, and industrial and mining construction land, were greatly affected by natural factors such as elevation and soil distribution, and human factors such as trunk road distance, per capita GDP, and population density. Based on the driving effects of land-use changes, the conflict between production development and ecological protection should be fully considered in the Fuxian Lake Basin [50] so as to reasonably update the main driving factors of land-use changes. In the future process of land-use development and protection, we can refer to the main driving factors of land-use changes in this study, and give the driving factors greater influence in planning, project construction site selection, and ecological service improvement.

4.2. Land Change Trends and Benefits in Different Scenarios

The predicted land-use types in the Fuxian Lake basin have continued the historical change trend since 1990. Lakes, arbor forests, farmland, and shrub forests are still the dominant land types in the Fuxian Lake basin. The lake area is relatively stable, and the artificial surface area is slightly growing. The land-use development changes are still dominated by ecological protection and production protection measures. Three land-use scenarios were adopted for simulation and prediction based on the characteristics of land-use development in the Fuxian Lake basin. The results of the multi-scenario simulation showed that the forecast direction of land-use change is quite different in different land-use control scenarios. The results of the multi-scenario simulations showed that under the natural trend development scenario, farmland took over a lot of arbor forests, shrubbery turned into grassland, and the construction land of urban and rural residents developed on farmland, swamp wetlands, and other types of land; under the production protection scenario, farmland expanded. Under the ecological protection scenario, arbor forest land expanded. Under the production protection scenario, farmland expanded. By predicting future land-use changes, the direction of regional land-use development can be mastered, which is helpful for decision makers to evaluate and plan regional land-use development modes and optimize land-use structure in future constructions [51]. The results of our simulations and predictions are also consistent with the current regional development pattern. Our model is a valuable reference for policies for future land-use space control, governance, and even restoration in the Fuxian Lake basin.

4.3. Fuxian Lake Basin Hotspot Changes and Land-Use Suggestions

Our results can provide a theoretical basis and methodological support for land-use prediction and future ecosystem service value calculation under different development constraints. The main direction of land-use change in the Fuxian Lake basin is the conversion between farmland and forest land and the continuous expansion of construction land. From the perspective of spatial distribution patterns, the hotspot change plots are mainly concentrated in the northern part of the basin and along the northern coast of Fuxian Lake. The analysis of the development direction of the different land types and the hotspots of land types in different scenarios helps provide theoretical support for land-use planning, ecological governance and restoration, and agricultural development and protection in the Fuxian Lake basin. The reduction of cultivable land will have an impact on food security. The red line of cultivated land protection should be strictly observed, the production efficiency of cultivated land should be improved, and existing cultivated land should be intensively used. Shrub forest land and forest land are the main types of forest land transfer, so attention should be paid to the protection and restoration of forest land in key ecological areas [52], and the direction of land-use conversion between ecological space and production space should be adjusted. Considering the current characteristics of regional urbanization development, on the one hand, the transfer of cultivated land should be restricted, and on the other, the transfer of forest land should be controlled to ensure that there will be no drastic changes in the ecosystem in urbanized areas [42] and effectively mitigate the continuous crowding out of ecological and production space by artificial surface expansion.

4.4. Consideration of Simulation Accuracy of Land-Use Change Based on PLUS Model

The overall simulation accuracy of land-use prediction in this study is slightly lower than that simulated by other researchers using the PLUS model. On the one hand, the historical data used in the study spans about 30 years, and the data resolution is not high enough due to the impact of data quality and technological development, which is an inevitable objective factor. On the other hand, although the influence of climate change, human activities, and other factors were comprehensively considered in the process of formulating the simulation rules, six driving factors, including natural and human factors, were extracted to improve the accuracy of the model as much as possible. However, due to the limitations of acquisition of some data, there are still some factors (such as settlement distribution data [53], mean annual temperature data [54], and soil organic carbon data [55]) that cannot be fully considered. In future studies, efforts will be made to collect higher-resolution land classification data and incorporating more drivers that include both natural and human factors. To improve its accuracy, the simulation of land-use changes may be made more scientific, reasonable, and pertinent. Thus, it may more effectively encourage the preservation, repair, and enhancement of land resources and contribute to the region’s sustainable development.

5. Conclusions

This study used the PLUS model to analyze the spatiotemporal evolution of land use/land cover and the driving factors of land-type change in the Fuxian Lake basin from 1990 to 2018. The present study predicted land-use quantity, spatial distribution characteristics, and change trends in three scenarios in 2048. Specifically, this study showed:
1. The land types in the Fuxian Lake basin, which mainly focused on land ecological protection and production development, were greatly affected by the natural factor of rainfall and the human factor of the distance from the trunk road. The land type dominated by urban construction was greatly affected by the natural factors of elevation and soil distribution, and human factors of trunk road distance, per capita GDP, and population density.
2. The predicted land-use types in the Fuxian Lake basin have continued the historical change trend since 1990. Lakes, arbor forests, farmland, and shrub forests are still the dominant land types in the Fuxian Lake basin. The lake area is relatively stable, and the artificial surface area is slightly growing. The land-use development type is still dominated by ecological and production protections.
3. The results of a multi-scenario simulation showed that under the natural trend development scenario, farmland occupied a large number of arbor forests, the shrub forest land largely degenerated into grassland, and the urban and rural residents’ construction land expanded onto farmland, swamp wetlands, and other land types. Farmland showed an increasing trend under the production protection scenario. Under the ecological protection scenario, the arbor forest land showed positive growth, while the negative growth rate of shrub forest land decreased. In the Fuxian Lake basin, the main direction of land-use changes is the exchange of farmland and forest land, as well as the constant growth of construction land.

Author Contributions

Writing draft, G.M.; Data curation, G.M. and Q.L.; writing—review and editing, G.S. and L.Z.; methodology, G.M., Z.J. and J.Z.; Supervision, H.C.; G.S. and L.Z. All authors have read and agreed to the published version of the manuscript.

Funding

This research was supported by the Ecological Security Assessment of Yunnan Plateau Lake Basin—a case study of Fuxian Lake Basin (Grant No. 2022018) and the Henan Provincial Planning Office of Philosophy and Social Sciences (2022JC41).

Institutional Review Board Statement

Not applicable.

Informed Consent Statement

Not applicable.

Acknowledgments

We are very grateful to the researchers of the Fuxian Lake Administration for their data support and help in field surveys. We would like to thank J.Z., Z.J. and Q.L. for their help in developing the research method and data processing. We sincerely acknowledge the constructive comments of the anonymous reviewers.

Conflicts of Interest

The authors declare no conflict of interest.

References

  1. Wan, W.; Wei, W.; Qian, D.W.; Wei, X.X.; Feng, K. Research Progress on Environmental Effects of Land Use/Cover Change. J. Fujian Agric. For. Univ. 2017, 46, 361–372. [Google Scholar]
  2. Lawler, J.J.; Lewis, J.D.; Nelson, E.; Plantinga, A.J.; Polasky, S.; Withey, J.C.; Helmers, D.P.; Martinuzzi, S.; Pennington, D.; Radeloff, V.C. Projected land-use change impacts on ecosystem services in the United States. Proc. Natl. Acad. Sci. USA 2014, 111, 7492–7497. [Google Scholar] [CrossRef] [PubMed] [Green Version]
  3. Tang, H.J.; Wu, W.B.; Yang, P.; Chen, Y.Q.; Peter, V.H. Research progress of land use/land cover change (LUCC) model. J. Geogr. 2009, 64, 456–468. [Google Scholar]
  4. Islam, K.; Rahman, M.F.; Jashimuddin, M. Modeling land use change using cellular automata and artificial neural network: The case of Chunati Wildlife Sanctuary, Bangladesh. Ecol. Indic. 2018, 88, 439–453. [Google Scholar] [CrossRef]
  5. Yang, Y.; Bao, W.; Liu, Y. Coupling coordination analysis of rural productionliving-ecological space in the beijing-tianjin-hebei region. Ecol. Indic. 2020, 117, 106512. [Google Scholar] [CrossRef]
  6. Zou, L.; Liu, Y.; Wang, J.; Yang, Y. An analysis of land use conflict potentials based on ecological-production-living function in the southeast coastal area of China. Ecol. Indic. 2021, 122, 107297. [Google Scholar] [CrossRef]
  7. Chen, S.; Liu, Y.X.; Peng, L.H. Evolutionary law and regulation mechanism of urban ecological space: Taking Nanjing as an example. J. Ecol. 2008, 28, 2270–2278. [Google Scholar]
  8. Zhao, M.; He, Z.; Du, J.; Chen, L.; Lin, P.; Fang, S. Assessing the effects of ecological engineering on carbon storage by linking the CA-Markov and InVEST models. Ecol. Indic. 2019, 98, 29–38. [Google Scholar] [CrossRef]
  9. Zheng, H.W.; Shen, G.Q.; Wang, H.; Hong, J. Simulating land use change in urban renewal areas: A case study in Hong Kong. Habitat Int. 2015, 46, 23–34. [Google Scholar] [CrossRef] [Green Version]
  10. Li, X.; Yeh, A.G. Modelling sustainable urban development by the integration of constrained cellular automata and GIS. Int. J. Geogr. Inf. Syst. 2000, 14, 131–152. [Google Scholar] [CrossRef]
  11. Wu, F. Calibration of stochastic cellular automata: The application to rural-urban land conversions. Int. J. Geogr. Inf. Sci. 2002, 16, 795–818. [Google Scholar] [CrossRef] [Green Version]
  12. Baig, M.F.; Mustafa, M.R.U.; Baig, I.; Takaijudin, H.B.; Zeshan, M.T. Assessment of land use land cover changes and future predictions using CA-ANN simulation for selangor, Malaysia. Water 2022, 14, 402. [Google Scholar] [CrossRef]
  13. Clarke, K.C.; Hoppen, S.; Gaydos, L. A self-modifying cellular automaton model of historical urbanization in the San Francisco Bay area. Environ. Plan. B Plan. Des. 1997, 24, 247–261. [Google Scholar] [CrossRef]
  14. Huang, D.; Huang, J.; Liu, T. Delimiting urban growth boundaries using the CLUES model with village administrative boundaries. Land Use Policy 2019, 82, 422–435. [Google Scholar] [CrossRef]
  15. Liu, G.; Jin, Q.; Li, J.; Li, L.; He, C.; Huang, Y.; Yao, Y. Policy factors impact analysis based on remote sensing data and the CLUE-S model in the Lijiang River Basin, China. Catena 2017, 158, 286–297. [Google Scholar] [CrossRef]
  16. Verburg, P.H.; Veldkamp, A. Projecting land use transitions at forest fringes in the Philippines at two spatial scales. Landsc. Ecol. 2004, 19, 77–98. [Google Scholar] [CrossRef]
  17. Verburg, P.H.; de Koning, G.H.J.; Kok, K.; Veldkamp, A.; Bouma, J. A spatial explicit allocation procedure for modelling the pattern of land use change based upon actual land use. Ecol. Model 1999, 1, 45–61. [Google Scholar] [CrossRef]
  18. Chebeane, H.; Echalier, F. Towards the use of a multi-agents event based design to improve reactivity of production systems. Comput. Ind. Eng. 1999, 37, 9–13. [Google Scholar] [CrossRef]
  19. Huang, Q.; Song, W.A. land-use spatial optimum allocation model coupling a multi-agent system with the shuffled frog leaping algorithm. Comput. Environ. Urban Syst. 2019, 77, 101360. [Google Scholar] [CrossRef]
  20. Liang, X.; Guan, Q.; Clarke, K.C.; Liu, S.; Yao, Y. Understanding the drivers of sustainable land expansion using a patch-generating land use simulation (PLUS) model: A case study in Wuhan, China. Comput. Environ. Urban Syst. 2021, 85, 101569. [Google Scholar] [CrossRef]
  21. Yao, Y.; Liu, X.; Li, X.; Liu, P.; Hong, Y.; Zhang, Y.; Mai, K. Simulating urban land-use changes at a large scale by integrating dynamic land parcel subdivision and vector-based cellular automata. Int. J. Geogr. Inf. Sci. 2017, 31, 2452–2479. [Google Scholar] [CrossRef]
  22. Liu, S.; Su, H.; Cao, G.; Wang, S.; Guan, Q. Learning from data: A post classification method for annual land cover analysis in urban areas. ISPRS J. Photogramm. Remote Sens. 2019, 154, 202–215. [Google Scholar] [CrossRef]
  23. Gharaibeh, A.; Shaamala, A.; Obeidat, R.; Al-Kofahi, S. Improving land-use change modeling by integrating ANN with Cellular Automata-Markov Chain model. Heliyon 2020, 6, e05092. [Google Scholar] [CrossRef] [PubMed]
  24. Verburg, P.H.; Soepboer, W.; Veldkamp, A.; Limpiada, R.; Espaldon, V.; Mastura, S.S. Modeling the spatial dynamics of regional land use: The CLUE-S model. Environ. Manag. 2002, 30, 391–405. [Google Scholar] [CrossRef] [PubMed]
  25. Liu, X.P.; Liang, X.; Li, X.; Xu, X.; Ou, J.P.; Chen, Y.M.; Li, S.Y.; Wang, S.J.; Pei, F.S. A future land use simulation model (FLUS) for simulating multiple land use scenarios by coupling human and natural effects. Landsc. Urban Plan 2017, 168, 94–116. [Google Scholar] [CrossRef]
  26. Li, C.; Gao, B.B.; Wu, Y.M.; Zheng, K.J.; Wu, Y. Dynamic simulation of ecological risk of mountain town landscape based on PLUS model. J. Zhejiang Agric. For. Univ. 2022, 39, 84–94. [Google Scholar] [CrossRef]
  27. Hu, F.; Zhang, Y.; Guo, Y.; Zhang, P.P.; Lu, S.; Zhang, C.C. Spatial and temporal changes and prediction of land use and habitat quality in the Weihe River basin based on PLUS and InVEST models. Geogr. Arid. Areas 2022, 45, 1125–1136. [Google Scholar]
  28. Wang, J.; Zhang, J.; Xiong, N.; Liang, B.Y.; Wang, Z.; Cressey, E.L. Spatial and Temporal Variation, Simulation and Prediction of Land Use in Ecological Conservation Area of Western Beijing. Remote Sens. 2022, 14, 1452. [Google Scholar] [CrossRef]
  29. Yang, L.W.; Zhao, J.; Zhu, J.T.; Liu, L.; Zhang, P. Spatial and temporal variation and prediction of ecosystem carbon storage in Xian based on PLUS and InVEST model. Remote Sens. Nat. Resour. 2022, 19, 16059. [Google Scholar]
  30. Zhang, S.; Yang, P.; Xia, J.; Wang, W.; Cai, W.; Chen, N.; Zhan, C. Land use/land cover prediction and analysis of the middle reaches of the Yangtze River under different scenarios. Sci. Total Environ. 2022, 833, 155238. [Google Scholar] [CrossRef] [PubMed]
  31. Gao, L.; Tao, F.; Liu, R.R.; Wang, Z.L.; Leng, H.J.; Zhou, T. Multi-scenario simulation and ecological risk analysis of land use based on the PLUS model: A case study of Nanjing. Sustain. Cities Soc. 2022, 85, 104055. [Google Scholar] [CrossRef]
  32. Yang, S.; Su, H. Multi-Scenario simulation of ecosystem service values in the Guanzhong Plain Urban Agglomeration, China. Sustainability 2022, 14, 8812. [Google Scholar] [CrossRef]
  33. Du, Y.; Li, X.; He, X.; Li, X.P.; Yang, G.; Li, D.B.; Xu, W.B.; Qiao, X.; Li, C.; Sui, L. Multi-Scenario Simulation and Trade-Off Analysis of Ecological Service Value in the Manas River Basin Based on Land Use Optimization in China. Int. J. Environ. Res. Public Health 2022, 19, 6216. [Google Scholar] [CrossRef] [PubMed]
  34. Zhao, Z.; Fan, B.L.; Zhou, Q.B.; Xu, S.H. Simulating the Coupling of Rural Settlement Expansion and Population Growth in Deqing, Zhejiang Province, Based on MCCA Modeling. Land 2022, 11, 1975. [Google Scholar] [CrossRef]
  35. Du, J.F.; Thill, J.C.; Peiser, R.B.; Feng, C.; Chun, C.C. Urban land market and land-use changes in post-reform China: A case study of Beijing. Landsc. Urban Plan 2014, 124, 118–128. [Google Scholar] [CrossRef]
  36. Zheng, X.Q.; Zhao, L.; Xiang, W.N.; Li, N.; Lv, L.N.; Yang, X. A coupled model for simulating spatio-temporal dynamics of land-use change: A case study in Changqing, Jinan, China. Landsc. Urban Plan 2012, 106, 51–61. [Google Scholar] [CrossRef]
  37. Liu, T.; Yang, X.J. Monitoring land changes in an urban area using satellite imagery, GIS and landscape metrics. Appl. Geogr. 2015, 56, 42–54. [Google Scholar] [CrossRef]
  38. Gao, B.P.; Li, C.; Wu, Y.M.; Zheng, K.J.; Wu, Y. Landscape ecological risk assessment and influencing factors in ecological conservation area in Sichuan-Yunnan provinces, China. Ying Yong Sheng Tai Xue Bao 2021, 32, 1603–1613. [Google Scholar]
  39. China Academy of Building Sciences. Overall Planning of Fuxian Lake National Wetland Park in Yuxi, Yunnan (Overall Planning of Fuxian Lake National Wetland Park in 2016); China Academy of Building Sciences: Beijing, China, 2015. [Google Scholar]
  40. Chen, J.Z.; He, C.; Yue, C.R. Atmospheric correction of an advance land imager (ALI) image based on the FLAASH module. J. Zhejiang A F Univ. 2011, 28, 590–596. [Google Scholar]
  41. Liu, H.; Xiao, W.; Li, Q.; Tian, Y.; Zhu, J. Spatio-Temporal Change of Multiple Ecosystem Services and Their Driving Factors: A Case Study in Beijing, China. Forests 2022, 13, 260. [Google Scholar] [CrossRef]
  42. Jiang, X.F.; Duan, H.C.; Liao, J.; Song, X.; Xue, X. Multimodelbased Simulation of Different Landuse Scenarios in Gan-Lin-Gao Area in Middle Reaches of Heihe River. Trans. Chin. Soc. Agric. Mach. 2022, 53, 178–188. [Google Scholar]
  43. Sun, D.Z.; Liang, Y.J. Multi scenario simulation of land use on the Loess Plateau based on improved Markov CA model. J. Earth Inf. Sci. 2021, 23, 825–836. [Google Scholar]
  44. Tian, J.F.; Wang, B.Y.; Cheng, L.S.; Wang, S.J. The process and mechanism of regional land use transition guided by policy: A case study of Northeast China. Geogr. Res. 2020, 39, 805–821. [Google Scholar]
  45. Yang, H.R.; Wang, H.Y.; Peng, W.F.; Ren, G.Y. Study on the spatio-temporal dynamic change of regional land use/cover -- Taking Jintang County, Sichuan Province as an example. China Agric. Resour. Zoning 2016, 37, 37–46. [Google Scholar]
  46. Li, X.L.; Cheng, C.X.; Chen, C. Cross administrative region spatial integration method of land use dynamics -- Taking Fangshan District, Beijing as an example. Geogr. Geogr. Inf. Sci. 2014, 30, 56–58+72+127. [Google Scholar]
  47. Luo, G.P.; Yin, C.Y.; Chen, X.; Xu, W.Q.; Lu, L. Combining system dy-namic model and CLUE-S model to improve land use sce-nario analyses at regional scale: A case study of Sangong watershed in Xinjiang, China. Ecol. Complex. 2010, 7, 198–207. [Google Scholar] [CrossRef]
  48. Koomen, E.; Pontius, R.; Boersma, W.; Castella, J.C.; Clarke, K.; de Nijs, T.; Dietzel, C.; Duan, Z.Q.; Fotsing, E.; Goldstein, N.; et al. Comparing the in-put, output, and validation maps for several models of land change. Ann. Reg. Sci. 2008, 42, 11–37. [Google Scholar]
  49. Zhang, H.Q.; Ren, T. Study on Spatial Pattern Evolution Characteristics and Driving Forces Based on PLUS Model: Taking Beizhen City in Liaoning Province as an Example. J. Shenyang Jianzhu Univ. 2022, 24, 230–238. [Google Scholar]
  50. Yao, Z.; Jiang, C.; Shan-shan, F. Effects of urban growth boundaries on urban spatial structural and ecological functional optimization in the Jining Metropolitan Area, China. Land Use Policy 2022, 117, 106113. [Google Scholar] [CrossRef]
  51. Duan, Y.; Tang, J.; Li, Z.; Yang, Y.; Dai, C.; Qu, Y.K.; Lv, H. Optimal Planning and Management of Land Use in River Source Region: A Case Study of Songhua River Basin, China. Int. J. Environ. Res. Public Health 2022, 19, 6610. [Google Scholar] [CrossRef]
  52. Shen, Z.; Wu, W.; Chen, S.; Tian, S.Q.; Wang, J.; Li, L.J. A static and dynamic coupling approach for maintaining ecological networks connectivity in rapid urbanization contexts. J. Clean. Prod. 2022, 369, 133375. [Google Scholar] [CrossRef]
  53. Deng, Z.; Quan, B. Intensity Characteristics and Multi-Scenario Projection of Land Use and Land Cover Change in Hengyang, China. Int. J. Environ. Res. Public Health 2022, 19, 8491. [Google Scholar] [CrossRef] [PubMed]
  54. Li, C.D.; Yang, M.Y.; Li, Z.B.; Wang, B.Q. How will rwandan land use/land cover change under high population pressure and changing climate? Appl. Sci. 2021, 11, 5376. [Google Scholar] [CrossRef]
  55. Bao, S.; Yang, F. Spatio-Temporal Dynamic of the Land Use/Cover Change and Scenario Simulation in the Southeast Coastal Shelterbelt System Construction Project Region of China. Sustainability 2022, 14, 8952. [Google Scholar] [CrossRef]
Figure 1. The map of the Fuxian Lake watershed.
Land 12 00120 g001
Figure 2. Changes in the number of different categories in the Fuxian Lake basin from 1990 to 2018.
Land 12 00120 g002
Figure 3. Contribution of driving factors to changes in various categories of land use.
Land 12 00120 g003
Figure 4. Spatial distribution map of land-use types in 2048. The forecast performed according to the three scenarios.
Land 12 00120 g004
Figure 5. Percentage of predicted land−use changes under different scenarios.
Land 12 00120 g005
Figure 6. Comparison of land type area in hotspots.
Land 12 00120 g006
Figure 7. Spatial distribution map of land types in hotspots of land-use changes.
Land 12 00120 g007
Table 1. Relative annual change rate of various land-use types in the Fuxian Lake basin.
Study
Period
123456789101112
1990–19953.76−0.4913.470.540.003.943.163.68−0.94−0.352.13−1.35
1995–20005.151.475.37−1.560.0031.61−0.250.560.53−0.330.17−1.95
2000–20050.662.32−0.25−3.34−0.017.605.022.86−0.700.37−0.17−0.35
2005–20102.18−0.460.99−2.320.000.0516.63−0.294.770.69−2.770.40
2010–20182.90−0.69−2.62−2.320.0014.864.499.936.16−0.108.006.17
Note: 1—Construction land for urban and rural residents; 2—Farmland; 3—Industrial and mining construction land; 4—Shrub forest land; 5—Lake; 6—Transportation Land; 7—Grassland; 8—Other construction land; 9—Other forest land; 10—Arbor forest land; 11—Artificial wetland; 12—Swamp wetland.
Table 2. Land-use type transfer matrix from 2018 to 2048.
Scenario
Type
Land Category
in 2018
Land Category in 2048Total
123456789101112
Production protection scenarioConstruction land for urban and rural residents1892.389.80 25.211.72133.2111.8569.311.0320.9414.7964.642244.88
Farmland6.8112,352.940.447.30 8.133.091.150.8927.401.191.3512,410.69
Industrial and mining construction land 0.99200.474.39 7.218.05 0.3116.40 237.81
Shrub forest land0.8190.580.485808.310.56210.43203.880.5936.06390.395.3156.506803.90
Lake0.56 0.4121,623.800.65 0.19 0.250.0311.3621,637.26
Transportation Land25.937.286.082.330.99357.387.818.510.2416.392.3916.77452.09
Grassland0.035.430.1810.72 5.85654.160.090.9270.380.991.11749.85
Other construction land10.612.29 16.730.1162.001.60654.390.3225.752.907.73784.45
Other forest land0.641.860.123.19 0.131.230.132380.0812.110.020.142399.64
Arbor forest land3.24434.554.90610.730.1728.30222.133.1995.2418,162.9336.8127.9119,630.08
Artificial wetland0.041.78 28.86 0.248.840.13 60.03193.182.16295.25
Swamp wetland2.960.89 2.094.456.690.010.230.113.590.051058.011079.07
Total1944.0012,908.40212.666520.2621,631.80820.221122.63737.912515.2018,806.56257.661247.6768,724.96
Natural development scenarioConstruction land for urban and rural residents2071.9518.21 10.521.502.4115.827.680.809.3113.7692.932244.88
Farmland51.7612,280.731.498.10 11.584.833.243.8240.892.052.2112,410.69
Industrial and mining construction land 2.04225.360.49 0.450.180.070.548.67 237.81
Shrub forest land246.6298.0718.265546.920.83151.83286.99100.8935.12235.155.3477.876803.89
Lake2.28 0.6921,622.200.45 0.470.060.230.0310.9121,637.31
Transportation Land88.2914.530.372.341.07290.0211.6910.770.2614.072.1616.54452.09
Grassland1.949.754.627.96 5.06666.723.561.0947.001.151.00749.85
Other construction land190.554.08 10.580.4912.521.94528.630.4819.092.5013.59784.45
Other forest land1.033.470.163.41 0.091.450.302376.4713.120.000.142399.64
Arbor forest land87.91474.2322.07351.560.2621.15121.6331.4595.3118,381.6017.7925.1019,630.06
Artificial wetland10.662.54 24.74 0.9711.0230.08 27.06183.314.86295.25
Swamp wetland57.311.25 1.995.213.710.053.280.233.550.021002.481079.07
Total2810.2712,908.90272.345969.3121,631.55500.241122.32720.412514.1818,799.73228.121247.6268,724.99
Ecological protection scenarioConstruction land for urban and rural residents1999.61115.40 9.860.7619.103.9011.880.5328.292.1853.392244.88
Farmland850.9910,741.434.7757.810.13216.6251.8246.722.30383.0433.5921.4412,410.68
Industrial and mining construction land 23.43188.932.13 0.661.560.060.3520.69 237.81
Shrub forest land1.287.180.546163.200.411.0040.570.8335.52499.310.4653.606803.90
Lake0.320.20 0.3621,624.100.22 0.08 0.25 11.7421,637.27
Transportation Land45.4145.270.673.270.54306.392.076.960.0423.181.2717.01452.09
Grass land0.254.870.2114.50 0.83624.550.131.00102.190.600.70749.85
Other construction land21.5834.55 3.960.1415.230.17667.950.2733.810.716.08784.45
Other forest land0.511.420.102.97 0.001.000.072383.649.700.000.222399.64
Arbor forest land5.7439.680.96399.100.092.67159.132.9989.6818,884.6125.4519.9519,630.05
Artificial wetland0.200.85 3.01 0.042.050.31 61.32225.551.92295.25
Swamp wetland3.421.11 2.124.150.670.050.340.234.090.011062.881079.07
Total2929.3011,015.40196.196662.2821,630.34563.43886.88738.322513.5620,050.49289.821248.9268,724.94
Note: 1—Construction land for urban and rural residents; 2—Farmland; 3—Industrial and mining construction land; 4—Shrub forest land; 5—Lake; 6—Transportation Land; 7—Grassland; 8—Other construction land; 9—Other forest land; 10—Arbor forest land; 11—Artificial wetland; 12—Swamp wetland.
Disclaimer/Publisher’s Note: The statements, opinions and data contained in all publications are solely those of the individual author(s) and contributor(s) and not of MDPI and/or the editor(s). MDPI and/or the editor(s) disclaim responsibility for any injury to people or property resulting from any ideas, methods, instructions or products referred to in the content.

