Article

Weakening of Coastlines and Coastal Erosion in the Gulf of Guinea: The Case of the Kribi Coast in Cameroon

by
Philippes Mbevo Fendoung
1,
Mesmin Tchindjang
2,* and
Aurélia Hubert-Ferrari
3
1
Department of Forest Engineering, Advanced Teachers’ Training College for Technical Education, University of Douala, Douala P.O. Box 1872, Cameroon
2
Department of Geography, Faculty of Arts, Letters and Social Sciences, University of Yaoundé 1, Yaoundé P.O. Box 30464, Cameroon
3
SPHERES Research Unit, Department of Geography, Faculty of Science, University of Liege-Belgium, Quarter Village 4, Clos Mercator 3, Building 11 B, 4000 Liege, Belgium
*
Author to whom correspondence should be addressed.
Land 2022, 11(9), 1557; https://doi.org/10.3390/land11091557
Submission received: 11 July 2022 / Revised: 3 September 2022 / Accepted: 5 September 2022 / Published: 13 September 2022
(This article belongs to the Special Issue Land Modifications and Impacts on Coastal Areas)

Abstract

:
For more than four decades, the Gulf of Guinea’s coasts have been undergoing a significant phenomenon of erosion, resulting from the pressures of both anthropogenic and marine weather forcings. From the coasts of West Africa (Senegal, Ivory Coast, Ghana, Benin, Togo, and Nigeria) to those of Central Africa (Gabon, Equatorial Guinea, and Cameroon), the phenomenon has been growing for more than four decades. The southern Cameroonian coastline from Kribi to Campo has become the scene of significant environmental dynamics that render it vulnerable to coastal erosion, which appears to be the major hazard of this coastal territory and causes a gradual degradation of the vegetative cover, thereby leading to the degradation of the coast’s land/ground cover and human-made infrastructure. The objective of this work is to analyze the kinematics of the Kribian coastline between 1973 and 2020; to quantify the levels of retreat, accretion, and stability; and finally, to discuss the factors influencing the evolution of the coastline. The methodological approach is based on the large-scale processing of Landsat images with a spatial resolution of 30 m. Then, small-scale processing is carried out around the autonomous port of Kribi using Pléiades and Google Earth images from the years 2013, 2018, and 2020 with a 0.5 m spatial resolution. The Digital Shoreline Analysis System (DSAS) version 5 and ArcMap 10.5® tool are used to model coastal kinematics. In addition, the dynamics of the agro-industrial plantations are assessed via satellite images and landscape perception. Environmental degradation is measured with respect to the entire Cameroonian coastline through the supervised classification of Landsat images (1986–2020). The results show that erosion is in its initial phase in Kribi because significant retreats of the coastline are noticeable over the period from 2015–2020. Thus, between 1973 and 2020, the linear data present a certain stability. In total, +72.32% of the line remained stable, with values of +1.3% for accretion and +26.33% for erosion—obtained from Landsat images of 30 m resolution—with an average retreat of +1.3 m/year and an average accretion of 0.9 m/year between 1973–2020. Based on high-resolution images, between 2013 and 2019, the average retreat of the coastline on the Kribian coast was −8.5 m/year and the average accretion was about 7 m/year. Agro-industrial plantations are responsible for environmental degradation. Thus, at SOCAPALM in Apouh, there has been a clear growth in plantations, which has fallen from 53% in 1990 to 78% in 2020, i.e., an increase of 25% of its baseline area. This is linked to the fact that plantations are growing significantly, with increases of 16% in 1990, 28% in 2000, and 29% in 2020, for old plantations.

1. Introduction and Background of the Study

The African continent is currently experiencing galloping demographic growth. Coastal areas, especially urban centers, concentrate most of this population. The increase in the urban population in West Africa grew from 16% of the total population in 1961 to 47% in 2014 and it is expected to reach 66% in 2050 [1]. This significant growth of the urban population in Africa is linked to the migratory phenomenon as its main driver [2]. Population projections in Sub-Saharan Africa predict 1.8 billion inhabitants in 2050 and 2.6 billion in 2100 and do not envisage any stabilization before 2100 [3,4]. This population growth is dazzling in coastal areas, and it is accompanied by developments that contribute to the weakening (fragilization) of these areas [5,6,7]. In most cases, this worrying situation results in hazards including floods [8], pollution [9], and coastal erosion [10,11] with various consequences. Coastal erosion is the primary concern of the present study. It affects coasts around the world, with disproportionate repercussions, often dependent on the level of consideration of its management in the public policies of the related countries. Thus, it is shown that 70% of the coasts are experiencing coastal erosion, 20% are stable, and only 10% are enriching [12]. All the coasts of the world are concerned, and the entire international scientific community is being challenged.
The coasts of the Gulf of Guinea also experience various natural hazards, among which coastal erosion is the most important on African coasts [13,14,15,16,17]. From Mauritania to Nigeria, West African coasts are threatened [18,19]. In Central Africa, rapid erosion has been observed for the Pointe-Noire (Congo) and Libreville (Gabon) shorelines [20,21,22]. Issues directly affecting the African coastal zone include population growth and poverty and the loss of habitat and land through coastal erosion [22].
Throughout the world, several authors have dealt with the issue of coastal erosion using approaches specific to the geographical areas concerned. Thus, some of them have addressed this issue in the context of climate change [23]. In a mangrove context, authors have characterized coastal erosion and its impacts on this ecosystem in southern Thailand [24]. As an example of the role of human activities in exacerbating coastal erosion, one study reported the construction of the Akosombo dam in Ghana in West Africa, which led to the erosion of the Togolese coast [25]. The situation is similar on the coasts of Senegal and Benin [26]. The management of this hazard is complex. For over eight decades, the National Research Council [27] has presented some management strategies based on integrated approaches.
On the Cameroonian coasts, erosion significantly destroys the coast by depositing mudflats and sand along the coastline [28,29]. This mechanism is orchestrated by the rip currents or flood currents that strike the coastline, undermining the loose substrate. The deposited sediments (sand) are collected and marketed by the coastal populations. The effects of interior erosion on roads, houses, agricultural fields in ruins, and the destruction of landing sites for boats—and for canoes in the northern section of the Cameroonian coast, particularly in Isangele, Bamusso, Kombo Itindi, and Kombo Abedimo—can be observed. On the southern Cameroonian coast, from the Wouri estuary [11] to Campo, there are visible signs of coastal erosion around Cap Cameroun, Yoyo I and II, Kribi, and Campo. The markers of this erosion are, among others, the presence of falling trees, destroyed houses, and damaged dykes.
Additionally, the Kribi-Campo coastal section is currently experiencing a recent shoreline adjustment, resulting in a loss of sediment, fattening, and stability. Indeed, of the 135 km of the south Cameroon shoreline, 88% of this land is experiencing erosion and 22% is experiencing accretion, while 0.24% remains stable [30]. This explains the vulnerability of the Kribi coastline to natural hazards (erosion), and particularly this coastal area around the Kribi Sea Port and above Campo [31]. Recent data [8] show that these coastal areas around Kribi experienced sediment enrichment between 1973 and 2007 with an average surface area of 4,081,400 m2 representing 45% of the total dynamics, while the recorded regressive dynamic corresponding to the linear coastal retreat of the concave sectors of the coast represents 55% (i.e., 4,949,550 m2) of the total dynamics [8].
The causes mentioned above are likely related to a sediment deficit caused by both anthropogenic and meteo-marine forcings [32]. The breaking of the waves feeding the tides, the rise in the sea level, and the action of marine currents and waves [19] can also be conducive factors. The noted anthropogenic forcings involve the multiple impacts of man on the coastal environment. Indeed, the strong anthropogenic pressure on the mangrove ecosystems of Campo is the main factor of coastal erosion [33]. The construction of the Kribi Sea Port (between 2007 and 2018) has orchestrated a notorious thinning of this section of the southern Cameroonian coast that is likely to aggravate erosion. The population growth of Kribi city and the resulting needs are also the basis of the weakening of the coastline. Other anthropogenic factors are significant, such as the construction of dams as in the case of the Memve’ele hydroelectric dam (15 km from Kribi) built on the Ntem River, which traps a large part of the sediments in transit towards the Kribi coasts. However, additional factors include the port facilities, the cutting of mangroves, and the extraction of sand.
These observations allow us to address the main objective of this paper, which is to analyze the kinematics of the Kribian coastline between 1973 and 2020. This analysis includes the quantification of the levels of retreat, accretion, and stability and finally a discussion of the factors influencing the evolution of the coastline. Thus, the dynamic observed creates environmental upheavals at the coastal level, with repercussions on ecosystems and populations. To better study this phenomenon, the coastlines of the years 1973, 2000, 2015, and 2020 were analyzed using Landsat sensors since the objective is to quantify the rate of retreat of the coastline.

2. Geographical and Geomorphological Settings

2.1. Geographical and Administrative Situation of the Kribian Coast

The Kribi coast is located in the South Administrative Region and at the Head of the Ocean Division. The coastal section observed in this study extends over three municipalities: Kribi 1, Kribi 2, and Campo (which is the largest). It extends between 2°10′3″ N and 9°10′10″ E (Figure 1). Kribi is the second economic pole in Cameroon and is therefore booming. It is a seaside town with a cosmopolitan population of approximately 104,000 inhabitants [34]. Originally, Kribi was inhabited by the Pygmies from the Bagyeli tribe, later followed by the Batanga and Mabi tribes [35].

2.2. Geological Context of the Kribian Coast

Geologically, the Kribian coast is not only composed of sedimentary rocks but also of crystallophyllian rocks from the basic metamorphic complex composed of gneiss, mica-schists, quartzites, etc. [36]. The Kribian coastline spreads over a low-altitude coastal plain that is less than 100 m in elevation. This coast is sandy or rocky in places, with soils resulting from the weathering of rocks and that are suitable for agriculture.
Sandstone formations have also been recorded for this coastal section, which are linked to the phenomenon of progression both toward the north and the south of the ocean. These sandstones range from the Upper Aptian at Campo to the Albian with a thickness that varies from 500 to 600 m [37]. The presence of an Archean and Paleoproterozoic greenstone belt, Archean charnockites and granitoids, gneiss, a mobile granitic zone, a sedimentary basin, and an overlap zone can also be noticed (Figure 2) [38].
From a pedological point of view, the Kribian coast mainly presents: (1) yellow ferralitic soils showing a high level of acidity, with a degree of saturation that varies from 15 to 20% on the surface and less than 10% in depth [39]; (2) soils on gneiss and lateritic schists, composed of highly leached humus sand and red sandy clay on lateritic schists; (3) and hydromorphic soils rich in organic matter generally located near rivers, area swamps, and mangroves (mouth of the Ntem) (Figure 2) [40].
The 2014 Global Baseline for Soil Resources updated in 2015 ([41]) classifies tropical African countries, such as Kenya, the DR Congo, and Cameroon, as containing Nitisols, Plinthosols (soils with a high pisolite content up to 80%), and Andosols (derived from parent materials other than glass-rich volcanic products that are located in humid regions).
This physical setting influences the erosion of the Kribi coasts and needs to be analyzed to better understand the processes underway in this area.

2.3. Hydrogeomorphological Characterization of the Kribi-Campo Area

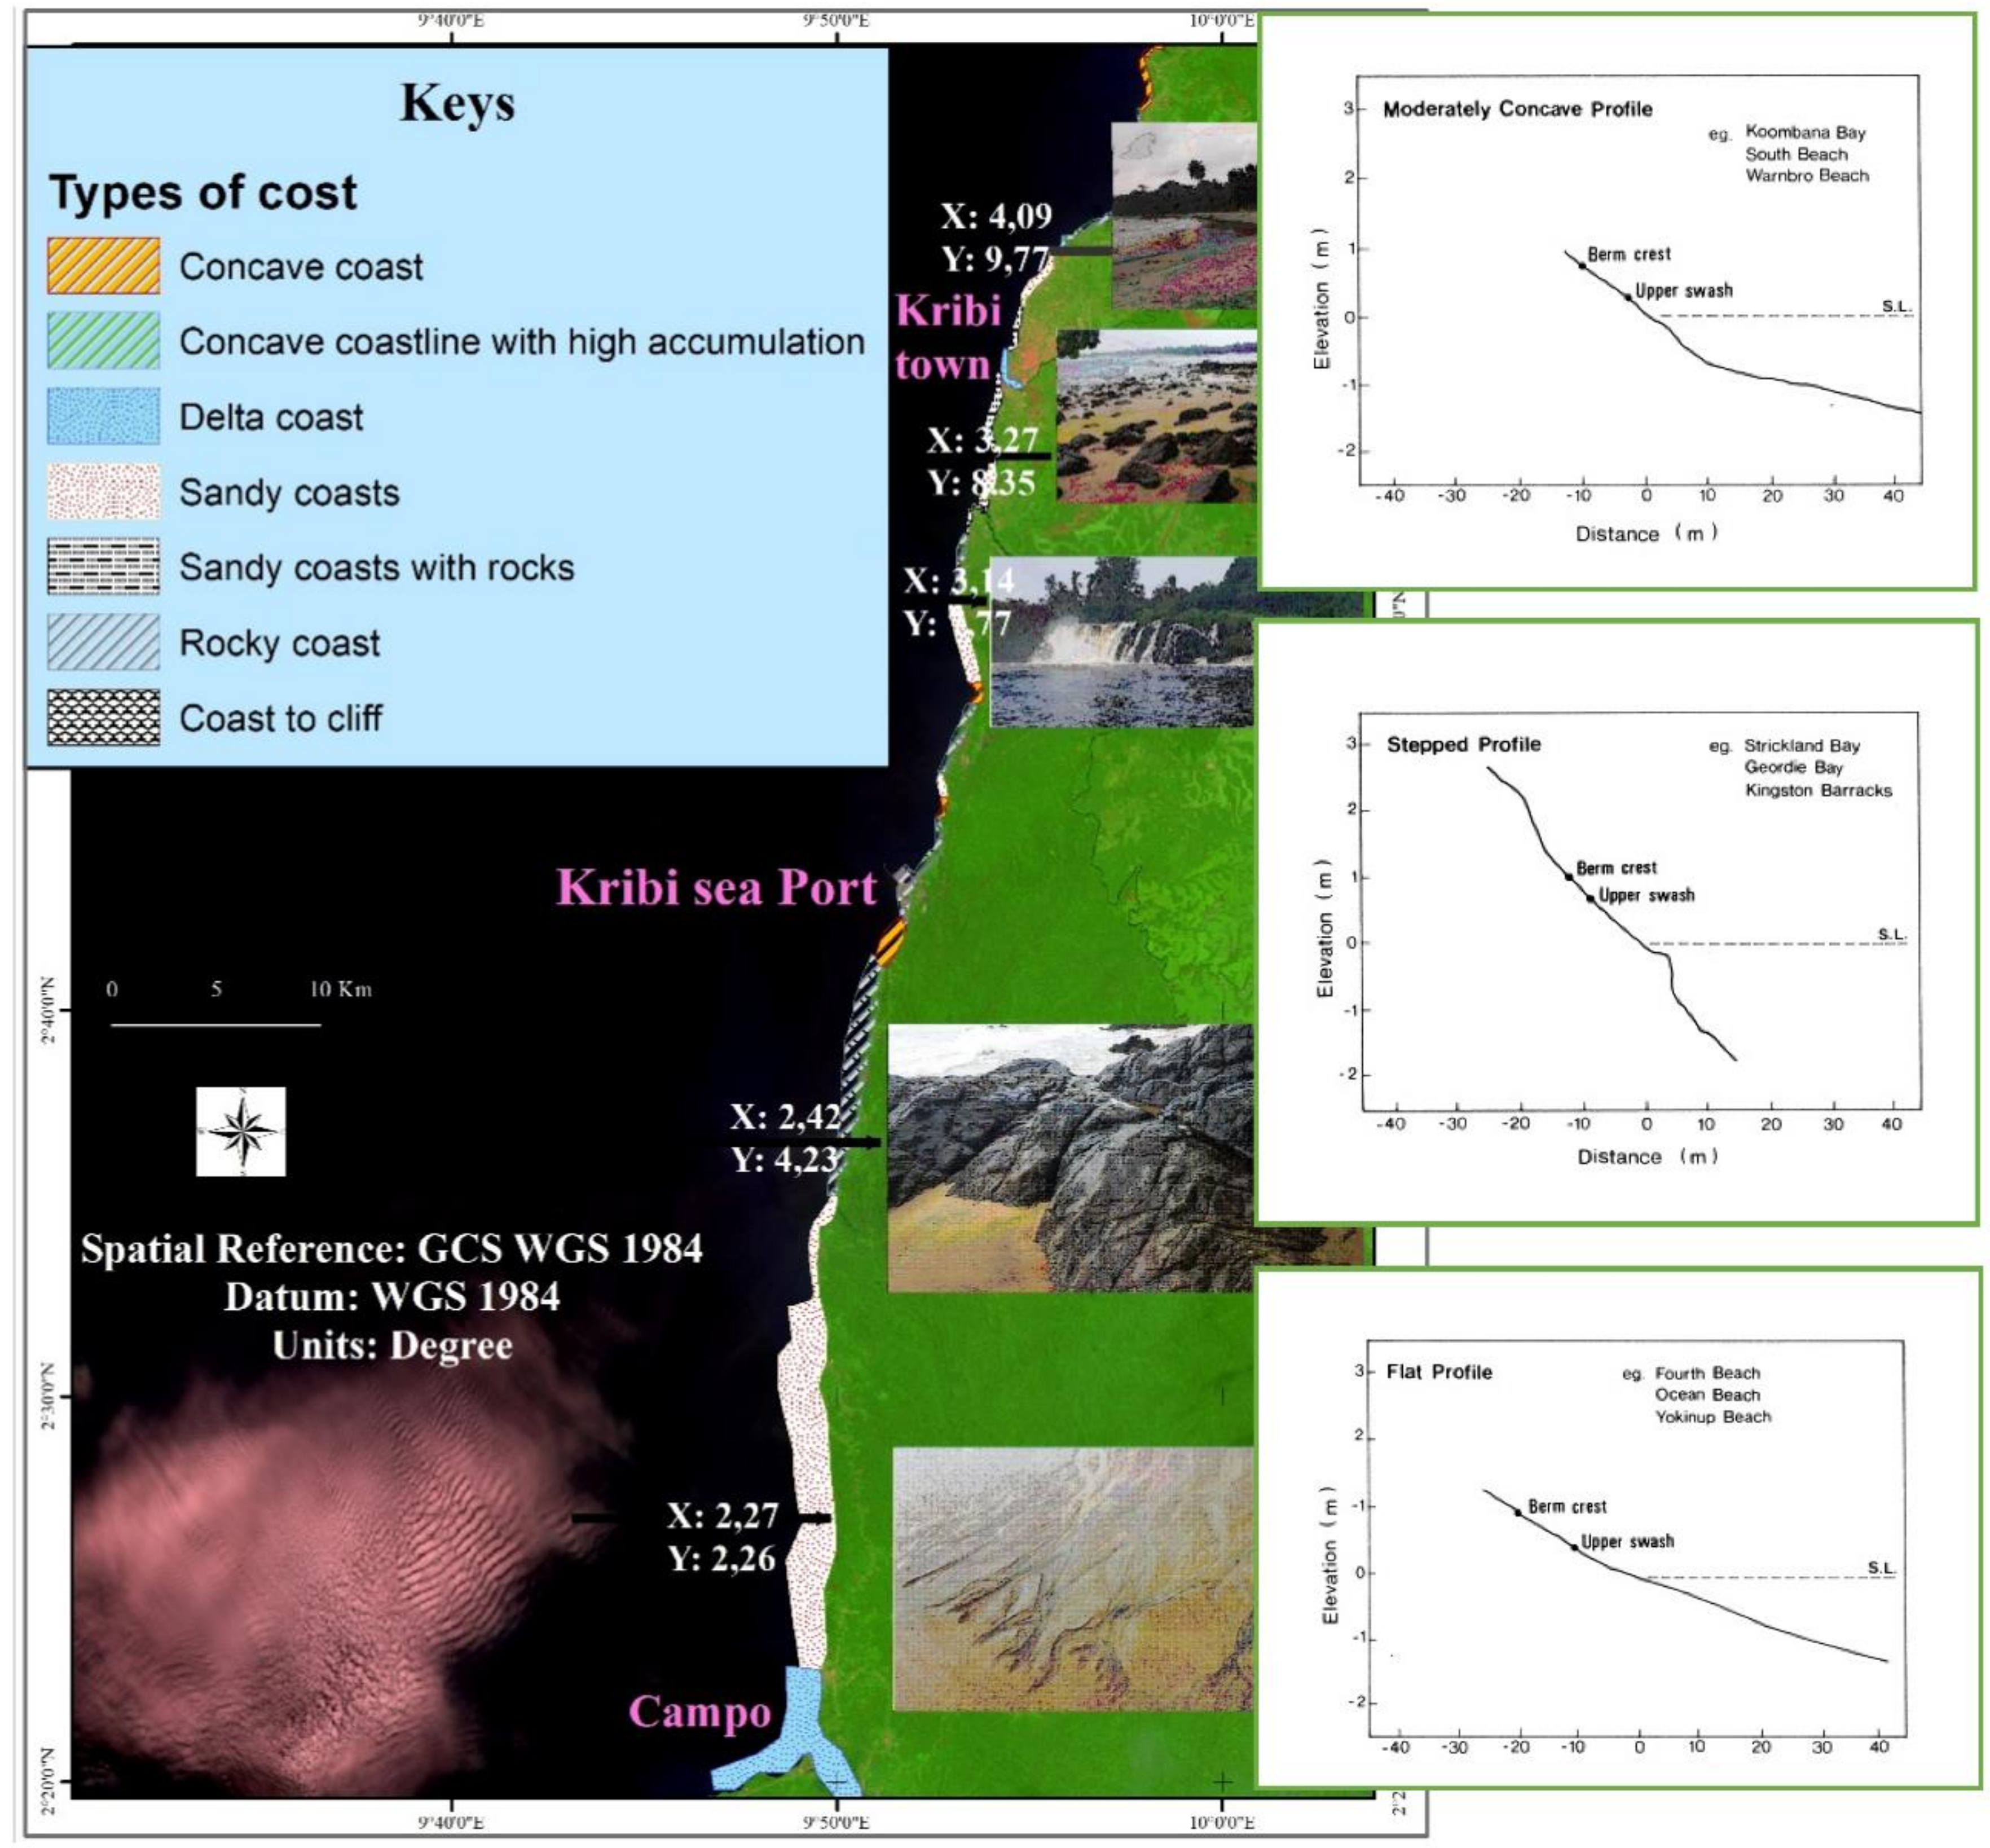
2.3.1. Geomorphology of the Kribian Coast

The Cameroonian coastal sedimentary basin, located on the edge of the Gulf of Guinea, covers an area of 7000 km2 [42]. It corresponds to a subsiding trench formed during the Cretaceous that is gradually deepening towards the ocean where it reaches thicknesses of 4000 m at 40 km and 8000 m further offshore. Globally, the Kribian coast is less than 5 m in altitude with respect to areas that are very close to the sea; however, after the coastline, the altitude can reach 15 to 50 m in some areas (Figure 3).
The Kribian coasts’ main geological formations are black marls and clays as well as sandstone sands. These formations develop on a varied typology of the coast, including—among other things—low loose coasts, rocky coasts, concave coasts, etc.
(1) A low coast
This is the most developed type of coastline, spanning from the Wouri estuary and extending to Kribi for more than 150 km, with an average altitude varying from 0 to 30 m. Its slopes are gently in contact with the ocean and vary from 0 to 6%. The low coast in the Campo area, for example, has a flat morphotype typical of large beaches [42], with a generally uniform profile with no break in the slope. These profiles are characterized by the area’s flattest swash and surf zones. In the area of the town of Kribi, there are some marine terraces corresponding to the moderately concave morphotype, presenting a moderate slope.
(2) The rocky coasts
These coasts are rough and made up of rocky areas with narrow beaches, which run from Kribi to Campo over nearly 80 km. These beaches were shaped on crystalline schist fragmenting into large blocks. These shales give a particular aspect to the coastal landscape of Kribi, which is renowned for its fine sandy beaches. According to Hegge’s [43] classification of coastal morphotypes, this rocky coast has a very narrow beach and a relatively steep intertidal zone, sometimes not exceeding 2 m. It is characterized by a strong step-like break in the subtidal zone. From north to south, the first break in the slope is located towards the Lobé Falls. It increases from almost 2% to almost 5%. Another break is present to the north of the Kribi seaport. The coastline profiles shown in Figure 4 illustrate the complex configuration of the Kribi coast.
Profile 1 characterizes these relatively small beaches, with a forebeach of less than 10 m and a swash zone of less than 5 m, and moderate slope breaks along the profile. Profile 2 corresponds to the staircase morphotype. This is a very narrow beach with a relatively steep intertidal zone. It is characterized by a strong break in the slope in the subtidal zone. This type of profile can be found at the Lobé Falls in Kribi. Finally, the third profile presents a flat morphotype characteristic of wide beaches, with a uniform profile with no break in the slope. These profiles are characterized by the flattest swash and surf zones. The flattening extends into the submerged area.

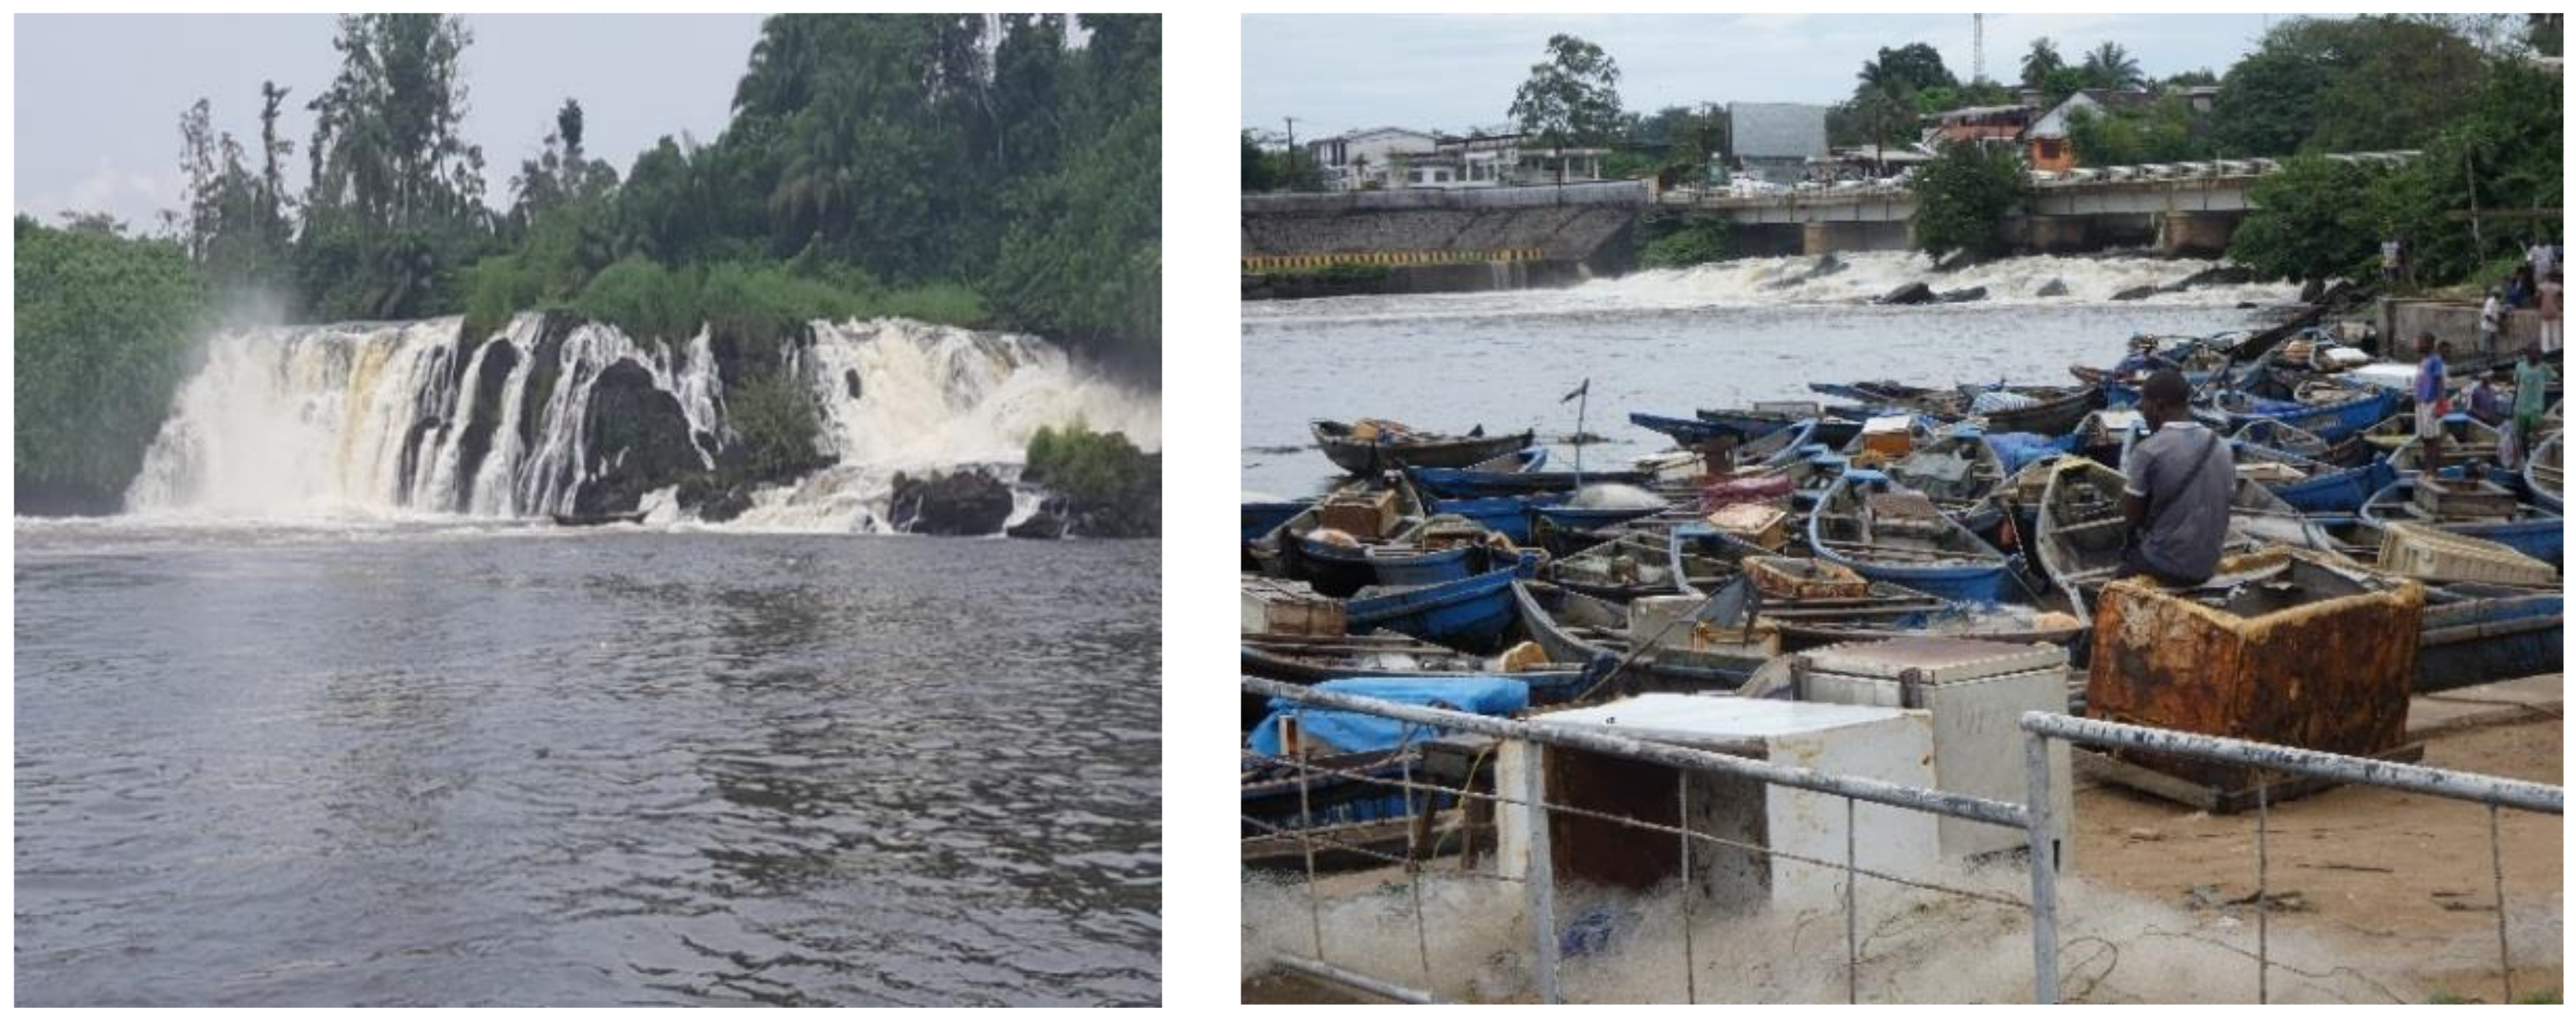
2.3.2. The Kienké River and Its Hydrogeomorphological Characteristics

The Kienké is a small river in southern Cameroon that flows into the Atlantic Ocean near Kribi. With a 190 km length, the Kienké River occupies a catchment area of more than 1435 km2 in Kribi, with a flow rate of around 40.5 m3/s [44]. A report [45] characterized the basins of several rivers on the Kribian coast (with respect to land use, slope, geology, etc.). It appears that the Kienké is divided into four geomorphological units: altitudes >176 m, between 177–361 m and 362–595 m, and a last high unit situated between 596–1172 m. Upstream, the waters of the Kienké flow over a unit with a fairly high average slope (1‰) and 1.6‰ upstream, which gradually decreases as the river approaches the ocean. The geology mainly consists of upper and lower gneiss. It is a watershed dominated by a vast Atlantic Forest, which degrades as one approaches the town of Kribi due to the presence of the rubber and palm agro-industries. The dominant tree species are Sterculiaceae and Ulmaceae [46]. The waters of the Kienké, as in the other catchments, have a diffuse flow upstream on the Kienké massif, with several tributaries, before forming a single channel at the outlet to the Atlantic Ocean. The flow of this river has a strong seasonal variation. The former and first Kribi Sea Port was built at its mouth. The city of Kribi spread towards its two eastern and western banks. There is no element to assess the solid inflows of sediments by the Kienké River, but the examination of the sounding plans of the Kribi Sea Port seems to show that the inflows of sand must be relatively low. By analogy with other rivers in Cameroon, notably the Wouri River in particular, the sand inputs should not exceed 10,000 to 20,000 t/year, i.e., 5000 to 10,000 m3 of the materials in place. On the other hand, the silt inputs could be much greater without having values in kind to quantify them (10 times more, perhaps). However, the current Kienké transport capacity has been estimated at 1200 m3/month [47], and this value is only reached during the rainy season.

2.3.3. The Lobé River and Its Hydrogeomorphological Characteristics

More than 130 km long, the Lobé River has its source in the Ntem massif in the center of the Campo-Ma’an National Park and joins the ocean through the equatorial forest. Its mouth, a few kilometers south of Kribi, forms a kind of delta with many small arms that spread out over 1 km before emerging into the Atlantic Ocean through a series of waterfalls, the highest of which measures around 15 m (Figure 5). Its watershed is 1940 km2 wide with an estimated flow of 105 m3/s [48], which varies from 20 m3/s (February) to 300 m3/s (October) [47]. Sediment transport for the Lobe River is estimated at 11.1 m3/year, with a strong seasonal variation [47]. The Lobé runs its course on a granite-gneissic base, which is more or less lateralized, with a maximum altitude of the catchment area of 500 m and regular forest cover [47].

2.3.4. The Ntem River and Its Hydrogeomorphological Characteristic

The Ntem is a river that serves as a natural border between three states of Central Africa, namely, Gabon, Equatorial Guinea, and Cameroon. It has its source in the Gabonese Province of Woleu-Ntem, and it then flows into the Atlantic Ocean in the extreme south of Cameroon at Campo. Its catchment area is 31,000 km2, with a length of 460 km. Its average flow rate is 195.3 m3/s [48]. The Ntem watershed has an altimetry that varies between 524–613 m, and the waters flow on an average slope unit of 0.5‰, with very small areas of breakage [49]. The Ntem sub-basin covers nearly 70% of the waters of the region that feeds the Atlantic basin, while that of the Lobé covers just 30% [50]. The Ntem River runs through an ancient crystalline basement whose formation is marked by a significant folding phase (Liberian orogeny), which led to the creation of the Ntem Complex. Today, its extension is limited to southern Cameroon and constitutes the northern borders of the Congo craton (Archean) [40]. There are granite deposits whose age refers to Precambrian D (2.7–3 billion years) or Precambrian C (2 to 2.3 Ma.) [50].

2.4. Vegetation on the Kribi Coast

The Kribi coast’s vegetation essentially consists of dense forest and is highly dependent on paleoclimatic variations. The botanist Letouzey [46] reports the omnipresence of the Lophira alata species that he linked to past anthropic clearings. There is a certain number of woody species of great importance such as Okoumé (Aukoumea klaineana) or Azobé (Lophira alata), which are highly dependent on ancient human occupations. The most beautiful stands of these two species are once again located around cleared areas or former occupations [48]. Finally, there are also small pockets of mangroves located in the mouths of the Kienké, Lobé, and Ntem rivers.
A supervised classification of Landsat images from the years 2000, 2015, and 2020 allowed us to see the evolution of the vegetation cover on the Kribian coast (Figure 6).
There is a clear degradation of the vegetation cover and an increase in agro-industrial plantations and built-up areas. Between 2000 and 2010, the Atlantic Forest declined. This decline will be consolidated between 2010 and 2020. Urbanization and agro-industrial activity are therefore the main factors of degradation affecting the Kribian coast (Figure 7).

2.5. Climate of the Kribi Coast

The Kribian climate is equatorial, humid, and subject to the typical monsoons of coastal areas [51]. The annual rainfall is about 2900 mm in Kribi. December, January, and February constitute the long dry season, with an average rainfall of 262 mm, while September, October, and November belong to the long rainy season, with a more than 1183 mm average rainfall [52]. The area’s temperatures are relatively high: the diurnal thermal amplitude is 2.42 in Kribi, the maximum temperatures are between 26 to 31 °C, and the peaks are generally observed in the dry season (December, January, February, and March). Minimum temperatures fluctuate between 23 and 25 °C) during the rainy season (April, May, September, and October) (Figure 8). On the Kribian coast, rainfall has little effect on soil erosion. Indeed, it is a forested area, and the soils are sufficiently protected. The only places where rainfall has an effect are the areas that have suffered from degradation/deforestation. With approximately 2900 mm of rain per year, the Kribi coastline remains one of the least watered, compared to Douala, which receives between 3500 and 4000 mm of rain per year, and Debunscha with approximately 13,000 mm per year. For this reason, the main factors that amplify coastal erosion on the Kribi coast are anthropogenic forcings.

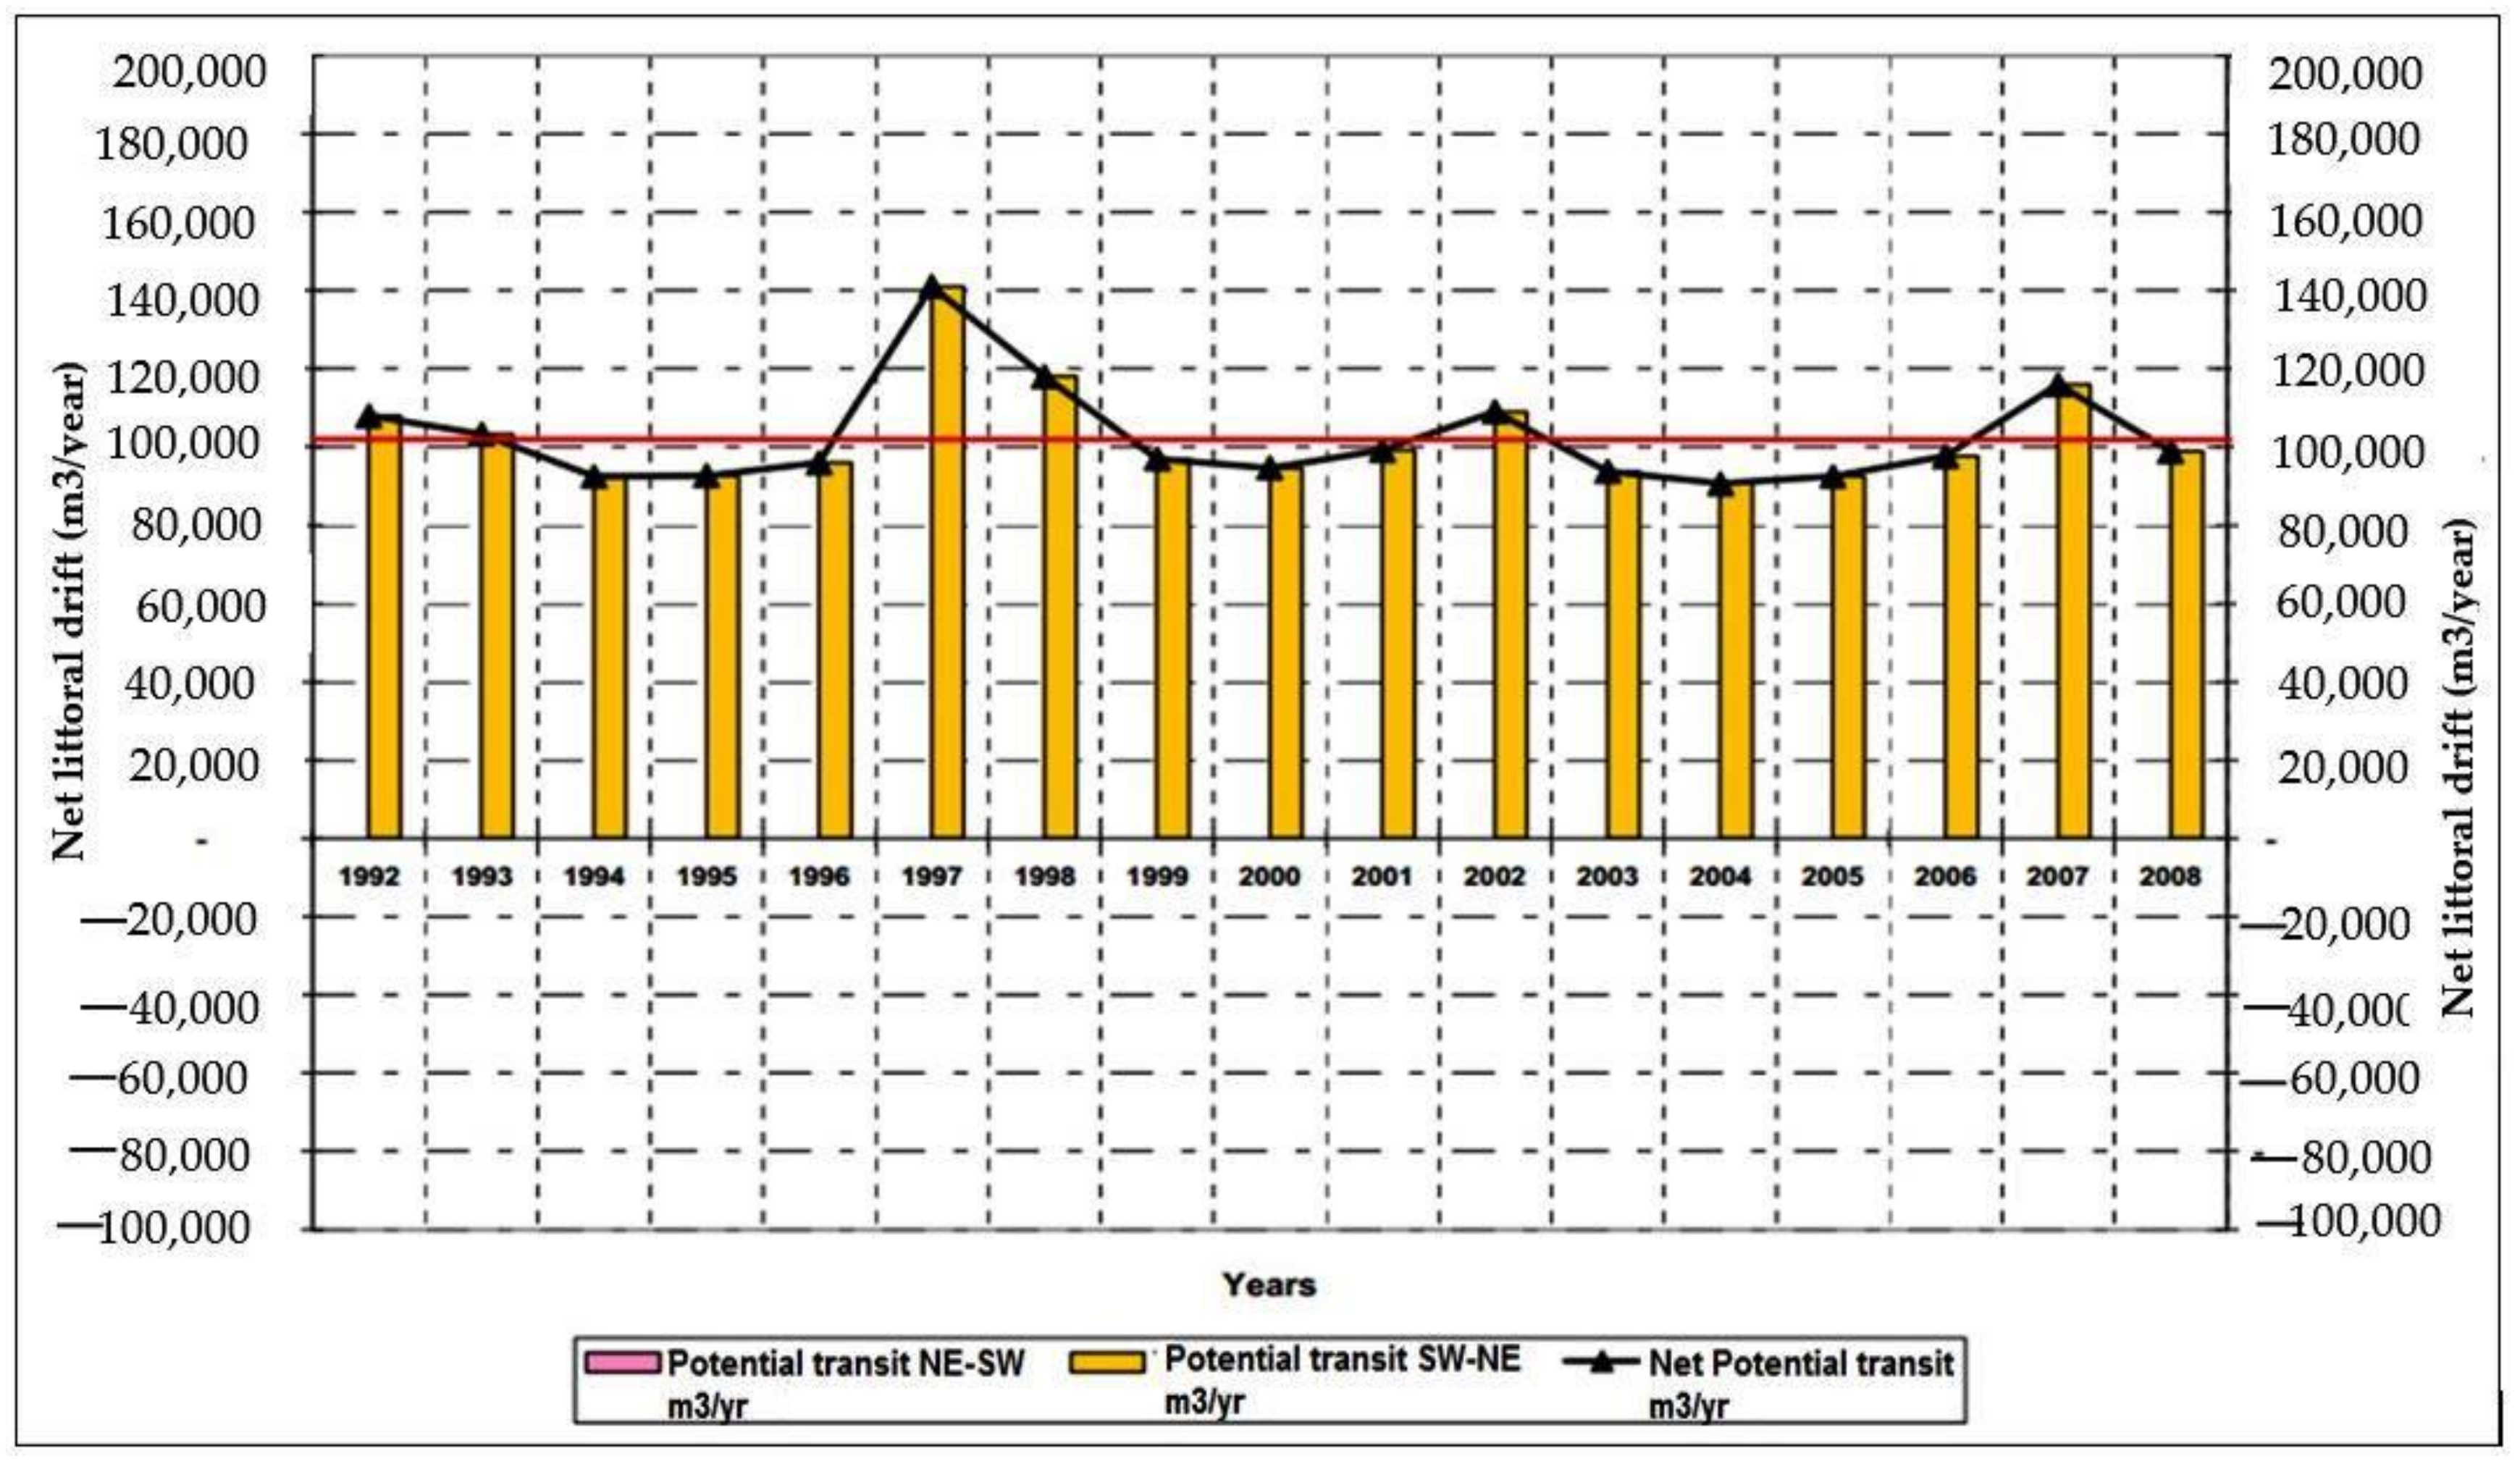
2.6. Tide and Sediment Transit on the Kribi Coast

There is evidence that waves and tides are significant factors with respect to the modeling and reshaping of the coastline. However, the Kribi coastline has one of the lowest tides compared to other areas such as the Wouri estuary. The average height is 1.2 m [52], with some variation between the Kribi Sea Port (Mboro) and Lolabé.
The sediment transit for the Kribi coast, according to the Kribi Sea Port data on four sections, presents a maximum of 140,000 m3/year north of the current Kribi Sea Port and a minimum of 80,000 m3/year to the south from this port. At the port site, the sediment transport is estimated at 50,000 m3/year (Figure 5).

2.7. Wind on the Kribian Coast

The analysis of the annual and seasonal boreal wind rose for the continental shelf region of the Cameroon coast (2–3° N & 5–10° E) from 1960 to 2001 [53], which made it possible to understand the directions and wind speeds of the Kribi coast. Old data (until 1978) on the winds (month, speed, and direction) around Kribi showed that the highest speeds are recorded in December, with a value of 20 m/s (Figure 9). The sediment transport is more influenced by winds blowing from the ocean to the coast, since winds blowing from the interior to the coast are blocked by the Atlantic Forest. These winds give speed to the littoral drift and the swell that affect the coast. In the soft coast, the erosion is more important than in the rocky one.
Recent wind data around Kribi [55] confirm this influence of seasonality. Between December, January, and February, the prevailing winds were from the SW direction (24 km/h), S (16 km/h), and SSW (14 km/h), respectively. The same trend continued in March, April, and May, with the only difference that the W winds (16 km/h) appeared and those from the S decreased in intensity (8 km/h). Between June and August, SW (24 km/h) and SSW (24 km/h) winds were dominant, followed by SWS and S winds. In September, October, and November, SW winds regained the upper hand, with a greater force of 24 km/h, followed by WSW (16 km/h) and SSW (16 km/h) winds. An annual summary shows that the SW winds are dominant [56].
These winds correspond to the trade winds (regular winds in the intertropical regions between 23–27° N and 23–27° S). They regularly blow from east to west, from the subtropical high pressures (subtropical ridge) to the equatorial low pressures (convergence zone intertropical), and they are very active in the Gulf of Guinea [55]. They mainly take place from December to March (dry season).

2.8. Marine Currents around the Kribi Coastline

The main current at work on the Cameroonian coast is the coastal drift. Its orientation is South–North for the entire Cameroonian coast and it is essentially conditioned by the waves generated by the local SW-oriented wind and by the swells of long periods, which affect the whole West African coast and originate in southern latitudes (45–60°) [56,57]. Two types of swells are identified [58]. The one oriented NNW is generated by the easterly winds in the region of western Namibia. The other is generated by the westerly winds in the southern Atlantic Ocean around latitudes 50° S [56]. The height of the swell varies significantly, with a maximum from June–August and a minimum from December–February [56]. On the Kribi coast specifically, these currents are relatively weak, with variations depending on the site. A series of three measurements was made around the Kribi port site (1st, 2nd, 3rd). The results obtained show little variation in the speed of the currents: from 0.3 m/s to 0.6 m/s. (Figure 10). It can be concluded from the third measurement that the shape of the Kribi coastline influences the direction and speed of the currents.
All in all, this coastal area is subject to the action of large swells, and the materials brought by the rivers (sands and kaolin clays, etc.) are taken up by the south–north coastal drift and by a west–west coastal current (swell) [55]. (Data from the Kribi Sea Port [54].) Sediment transport on the coastal section of Kribi was significant between 1992 and 2008 (Figure 11). From 1992–1993, the rate of sediment transit was around 100,000 m3/year, which fell slightly to about 90,000 m3/year between 1994–1996. A peak was observed in 1997, with a sediment transit of 140,000 m3/year (Figure 11).
The above data reveal that the sedimentation of the Kribi coast is taking place and is exacerbated by the implementation of the Kribi Sea Port (we will use the French acronym PAK). Indeed, sedimentation was generally present on the Kribian and Cameroonian coastline [53]. However, since the beginning of the port’s construction in 2007, this sedimentation seems to have increased, given the hydro-sedimentary disturbances observed in situ. Thus, there is a high accumulation of sediment to the south of the harbor due to the presence of the harbor’s protection dam. This should be confirmed through the analysis of the bathymetric configuration of the Cameroonian coast to understand its influence on marine processes.

2.9. Bathymetric Configuration in the Kribi Area

Characteristic of coasts with a straight profile and rocky structures, the Kribi coastline presents a consistent bathymetric variation from the open sea towards the coast. The lowest values can be recorded at the mouth of the Kienké River (Figure 12), which is more than 8 m in depth and about 3 km in width. The depths on the shore increase when moving longitudinally to the south. From the mouth of the Lobé to the PAK site, the dominant bathymetric values are between 10, 14, and 16 m, with a more than 2.5 km width at the mouth of the Lobé, 5 km at Mahale, 9 km at Eboundja II, and 3 km at the PAK site. These values increase when moving offshore to more than 30 m depth (Figure 12).
These natural forcing factors are determinants of the current observed dynamics of the Cameroonian coast and have a great influence on the sedimentary load and coastal erosion.

3. Materials and Methods

3.1. Land Cover Mapping

The land cover mapping was based on supervised classification of Landsat images from 2000, 2010, and 2020. After importing and assembling the bands in the Erdas Imagine® 2014 software (sold by Intergraph (Madison, AL, USA) in the United States), radiometric corrections were applied to the different images. Supervised classification was performed following the maximum likelihood algorithm. Table 1 shows the characteristics of the images used.

3.2. Mapping of the Coastal Kinematics of Kribi

The mapping of coastal kinematics was performed at large and small scales. The first mapping procedure one considered the entire Kribian coastline, from the north of the city of Kribi to the south at Campo, using Landsat images (Table 1). The second focused on the northern and southern parts of the Kribi seaport. Therefore, two sources of remote-sensing data were used. The first source consisted of Landsat images with an average spatial resolution of 30 m.
The latter used Google Earth aerial photos (0.5 m) and Pleiades very high-resolution images (0.5 m) (Table 2). Both data sources aided in detecting and mapping coastline variations and erosion on the Kribi coast—at different spatial resolutions—in order to more accurately compare and draw conclusions. The types of software used for these processing operations were Erdas Imagine v14, ARCMAP v10.5 under ARCGIS v10.5, and Digital Shoreline Analysis Systems (DSAS v5), made by ESRI (Redlands, CA, USA).

3.2.1. Pretreatments under Erdas Imagine

Preprocessing under Erdas Imagine v14
The preprocessing scheme under Erdas consisted in making radiometric corrections of the selected Landsat images. These corrections had several purposes: resampling, haze reduction, and periodic noise elimination.
Resampling (Resolution Merge)
This process was applied to the 1973 Landsat images to reduce the spatial resolution from 60 m to 30 m in order to make this image compatible with other images from different sensors.
Correction of Atmospheric Noise (Haze Reduction)
This operation made it possible to reduce atmospheric errors of Landsat images as much as possible, without degrading the pixels. Such errors include mist, clouds, etc. For multispectral images, this method was based on a transformation that produces a component correlated with the haze.
Periodic Noise Elimination
It is this form of correction that eliminates tide-related errors in an image. The input image is first divided into overlapping blocks of 128 by 128 pixels. The Fourier transform of each block is calculated and the logarithms of each block are averaged.

3.2.2. Processing under ArcMap/DSAS

Coastline Extraction under ArcMap 10.5
Coastline definition is not an easy task because confusion appears between this notion and the shoreline [59]. The coastline is simply defined as the dividing line between sea and land [60]. Depending on the type of coast considered and as soon as we seek to draw this “limit”, the notion of coastline becomes more complex and can be characterized in different ways, using several markers, and depending on the data available such as: (1) the limit of vegetation and (2) intersection line of the topographic surface with the level of the highest astronomical seas [61,62].
In the context of this study, it appears that the Kribi coast has a contrasting morphology as illustrated above (Figure 4). It alternates between rocky and soft coasts, with a straight profile; therefore, the coastline has varied in the linear analysis (Figure 4). We opted for the wet sand boundary, as did a similar study based on Landsat images by the authors of [63]. The rectilinear nature of the Kribi coastal profile allows for this boundary line to be remarkably visualized on the images, whether at high or low spatial resolutions.
Treatment Operations under DSAS v5
There are four main operations under DSAS v5 (made by United States Geological Survey, Reston, VA, USA) [64,65]: (1) Parameterization of the baseline and the shoreline, (2) Definition of transects, (3) Statistical analysis, and (4) Calculation of uncertainties and errors.
To succeed in these operations, we first defined transects’ length (1000 m) and spacing between them (200 m) and set the shoreline [64,65], which were generated automatically. These transects are equidistant and perpendicular to the baseline. A pixel error corresponding to the resolution of each image was defined (30 m for Landsat images and 0.5 for Pleiades and Google Earth images). Regarding statistical analysis, DSAS uses several statistical techniques known as end point rate (EPR) method to compare the positions of the coastline over time to estimate the evolution of the coastline [64,65]. As shown by Equation (1), it is the distance on the transect between the two most recent and oldest coastlines divided by the number of years separating these coastlines [64].
R = D / T e
R is the speed in meters per year (m/year), D is the distance in meters, and Te is the time elapsed between the oldest and the most recent coastline (years). The EPR still works even though only two coastlines are used to analyze the evolution [64].
Uncertainties and errors calculated can be grouped into four types: pixel errors (Ep), those related to the extraction of coastlines, digitizing (Ed), and planimetric (EP) [11]. These types of errors seem random and cannot appear automatically on all images. Their sum is determined by the total value of the errors (Et), which is equal to the square root of the different errors (Equation (2) from [64]).
E T = ± E p 2 + E R M s 2 + E d 2 + E P 2
The total error was estimated from three sources (Table 3): (i) the total shoreline position error was calculated for three periods; (ii) the measured transect error (Em) and annualized error (Ea) associated with the rate of shoreline change at a given transect, which was calculated over three time periods (1973–2000; 2000–2016; 2016–2020); and over a period, the annualized error was calculated using the following equation [66,67,68]:
E a = E t 1 2 + E t 2 2 + E t 3 2 Total   period   years
Figure 13 combines all the technical tools and methodological steps used to achieve the results that will be the subject of the following paragraphs.

4. Main Findings and Interpretations

4.1. Modeling Coastal Erosion on the Kribi Coast

4.1.1. Large-Scale Modeling Using Landsat Images from 1973–2020

This modeling revolves around three major moments: before, during, and after the installation of the Kribi Sea Port (KSP). Retreat and accretion values between −5 m and 5 m are considered stable for observing erosion [65]. Diagrams showing the coastline dynamics were designed and are associated with the different figures.
Coastline Dynamics before the Construction of the PAK (1973–2000, i.e., 27Years)
Prior to the establishment of the PAK, the analysis of the Landsat images from the period from 1973 to 2000 shows that the Kribi coastline had virtually no erosion sectors. It recorded an accretion on a significant slice of its linear dimension. Even the current PAK site was stable. The coastline is largely marked by stability (Figure 14).
An average accretion rate of +0.4 m/year and an accretion rate of 1.5 was determined. The accretion peak is situated in the area where the PAK is located, at about 5 m/year, followed by the Lolabé area (3.5 m/year) and Ebodjé (2.6 m/year). The erosion marks are disparate. At Etondéfon, we observe a decline rate of 2.1 m/year. In Eboundja, the retreat speeds are 1.8 m/year. Conclusively, all these values are less than −5, which implies the absence of real erosion. This coastline’s stability during this 27-year period may be due to several factors. Firstly, the lack of urbanization allows the area to maintain its natural character. Secondly, the presence of the forest constitutes a natural barrier to any erosion. Thirdly, the main rivers (Kienké and Lobé) feeding the littoral drift (from the South to the North) do not experience wide sedimentary hindrances such as dams.
Coastline Dynamics during the Construction of the PAK (2000–2015, i.e., 15 Years)
During the period from 2000–2015, there was a regressive coastline dynamic, unlike in previous years. This took place at three essential points: towards the Lobé falls, around the PAK, and towards the locality of Etondé Fang (Figure 15).
An average retreat of 0.9 m/year was calculated for this period with an accretion rate of 0.2. There was a decline of about 7 m/year at the level of the Lobé falls and a significant retreat of the coastline at the PAK site, with a regression of more than 35 m. Finally, the locality of Etondé Fang experienced a decline of −6 m/year (Figure 15). The other declines seem less significant: Doum Essimendjang (−3 m/year), Ebodjé (−1 m/year), south of Mboro (−4 m/year), and north of the urban center (−2 m/year). Accretion marks were also observed from the linear data, from North to South. A slight accretion was observed near Campo (13 m/year) and at Tondéfon (6 m/year). Other, less significant accretions were observed towards the South of Campo (approximately +2 m/year), Malabe (+2 m/year), Mboro (+4 m/year), and further north towards the town of Kribi (+3 m/year) and Ebomé (+4 m/year).
Coastline Dynamics under the PAK Implantation and Management (2015–2020)
An almost generalized erosion on the Kribi coast also marks this period, characterized by the beginning of the activities of the Kribi Sea Port. It is accentuated upstream and downstream of the PAK because of the second phase of Kribi Sea Port’s developments marked by deforestation in many areas such as Lolabé, Lohendje, and up to Ebodjé (Figure 16).
This output image shows that coastal erosion has intensified on the Kribi coastline. An average retreat of −2 m/year was quantified, against an average accretion of 1 m/year. The Campo area in the South records a decline of 15 m/year. The peak of regression is around the Lobé falls, with a decline of about −32 m/year. Indeed, in this area, there is a spit before the Lobé falls, which would trap sediments coming from the south. This probably explains why there is an accretion peak of +30 m/year in the same place. In addition, a significant accretion was visible south of Kribi city, with about +15 m/year. Between the PAK and Lolabé village, an accretion of more than 15 m/year was measured, corresponding to the coastal dyke protecting the seaport. This zone constitutes a place for the accumulation of the sediments trapped by the aforementioned dyke. Conclusively, the Kribian coastline evolved in a saw-toothed manner between 2015 and 2020. The sections of erosion succeed those of accretion and stability. This is due to the very nature of the Kribi coastline, which alternates between soft and rocky coasts.
These results obtained from Landsat images with a 30 m resolution show the effectiveness of coastal erosion on the Kribian coastline, with an average retreat of −1.3 m/year and an average accretion of +0.9 m/year between 1973 and 2020. These retreat and accretion values (+1.3 m/year and +0.9 m/year) obtained from the Landsat images’ processing are reliable insofar as they are above the total error value which is +0.65 (Table 3). A previous study [11] has used the same methods. Globally, 72.32% of the coastline remained stable, +1.3% is experiencing accretion, and −26.33% is experiencing erosion. However, the spatial resolution of the Landsat images is low; for this reason, we used very high-resolution images (the Pleiades and Google Earth) to refine these results. Given that these images are not available for the entire Kribi coastline, these in-depth analyses will focus on the northern and southern parts of the Kribi seaport.

4.1.2. Modeling of Small-Scale Coastal Erosion in Kribi, Using Pleiades Images and Google Earth Aerial Photos

Pleiades images and Google Earth aerial photos with a 0.5 m resolution have made it possible to refine the mapping of coastal erosion on the Kribi coast, specifically in the areas upstream and downstream of the PAK.
Coastline Dynamics in EPR (m/year) from Google Earth Aerial Photos (2015) and Pleiades Images (2013–2016, i.e., 3 Years)
This small-scale and very high-resolution processing confirms the ongoing erosion of the Kribi coast, previously highlighted by Landsat images. Between 2013 and 2016, the pockets of erosion remained concentrated in the southern part of the PAK and its northern end, towards the Lobé falls. Accreting and stable sections dominate the northern part of the PAK and a weak southern part. Overall, 61% of the linear data are experiencing accretion, 28% are experiencing erosion, and only 11% is stable (Figure 17).
In this three-year period, the erosion peak was about 6 km north of the PAK site, with a decline of −25 m/year. The average decline was estimated at ±4 m/year over the entire area, with an accretion rate of +3.16 m/year. In terms of accretion, the peak was south of the Lolabé village, with a value of about +17 m/year.
Thus, coastal erosion is active on the Kribi coast. It has intensified since the implementation of the Kribi industrial-port complex (CIPK) project, of which the PAK is a major component. High-spatial resolution mapping has made it possible to better visualize this erosion and to correct as much as possible the imperfections of the mapping carried out with low-resolution Landsat images.
Coastline Dynamics in EPR (m/year) from Google Earth Image (2017) and Pleiades Images (2016–2019, i.e.)
This temporal space, which saw the entry into the function of the PAK, is marked by a stabilization of the coastline in the southern part of the PAK, and an accentuation of coastal erosion in the northern part. From north to south, erosion is present but at a low rate of retreat. The accretion situations are isolated. They are located to the north before the Lobé falls and to the south around Lolabé and Lohendje. On the other hand, the stable zones are dominant (Figure 18). The output image shows that more than 71% of the Kribian coastline is stable, 25% is experiencing erosion, and only 4% is experiencing accretion.
From south to north, the greatest decline was estimated at −35 m/year and −75 m/year south of Lohendje village. An average retreat of −13.8 m/year was calculated for this period with an accretion rate of +11 m/an. To the south and north of Lolabé, the regression reaches −70 m/year and −45 m/year, respectively. This area corresponds to the first PAK extension site currently being developed. Close to the current site of the PAK, the erosion of a small spatial extent was evaluated at −10 m/year. This also corresponds to the site being developed for the phase two extension of the Kribi seaport. In the South of Nlendé Dibé, the decline is estimated at −10 m/year.
The accretion peak is located in the northern part of Nlendé Dibé village, just before the Lobé falls, with a record value of around +80 m/year. Such accretion is due to the presence of a small spit that has trapped sediments in transit towards the north. The Boussibélika village is experiencing a +10 m/year accretion corresponding to the accumulation site of rock fragments and other sediments linked to the development of the current PAK since 2007. The southern part of the PAK site also presents an accretion of +15 m/year downstream of the protection dyke and this can be explained by the deposit of sediments trapped by the protection of the PAK.
Based on very high-resolution images, between 2013 and 2019, the average retreat of the Kribian coastline is −8.5 m/year, and the average accretion is about 7 m/year. However, there is a wide disparity in terms of recession and accretion. The Landsat images, due to their spatial resolution, tend to minimize the values of recession and accretion although the spatial repair of accretion, erosion, and stability areas are almost similar between the two data sources.
For the entire coastline, three main areas present worrying levels of erosion and require priority intervention due to anthropogenic forcings.
  • Londji beach, because of coastal tourism and a high human population density up to the seafront, which is itself reduced, thereby implying a great exposure to human, societal, economic, and environmental issues.
  • The Kribi Plaza bridge facing the Kribi Bilingual High School, where erosion is linked to high-density housing and equipment (high school) as well as infrastructure (national road N°7). With a poor management system, the collapse of the national N°7 will impact the mobility of goods and people.
  • Bongadoué and Tara Beach are areas with extensive hotel facilities and an uncontrolled exploitation of sand.

4.2. Sustainable Management of Coastal Erosion on the Kribi Coast: Current Status and Prospects

The coastal erosion data show the weakening of the Kribian coastline since the construction and implementation of the Kribi Sea Port. The observations made raise the problems of the sustainable management of the coastal space for which there have been various initiatives taken by different actors to mitigate or solve this worrying situation.

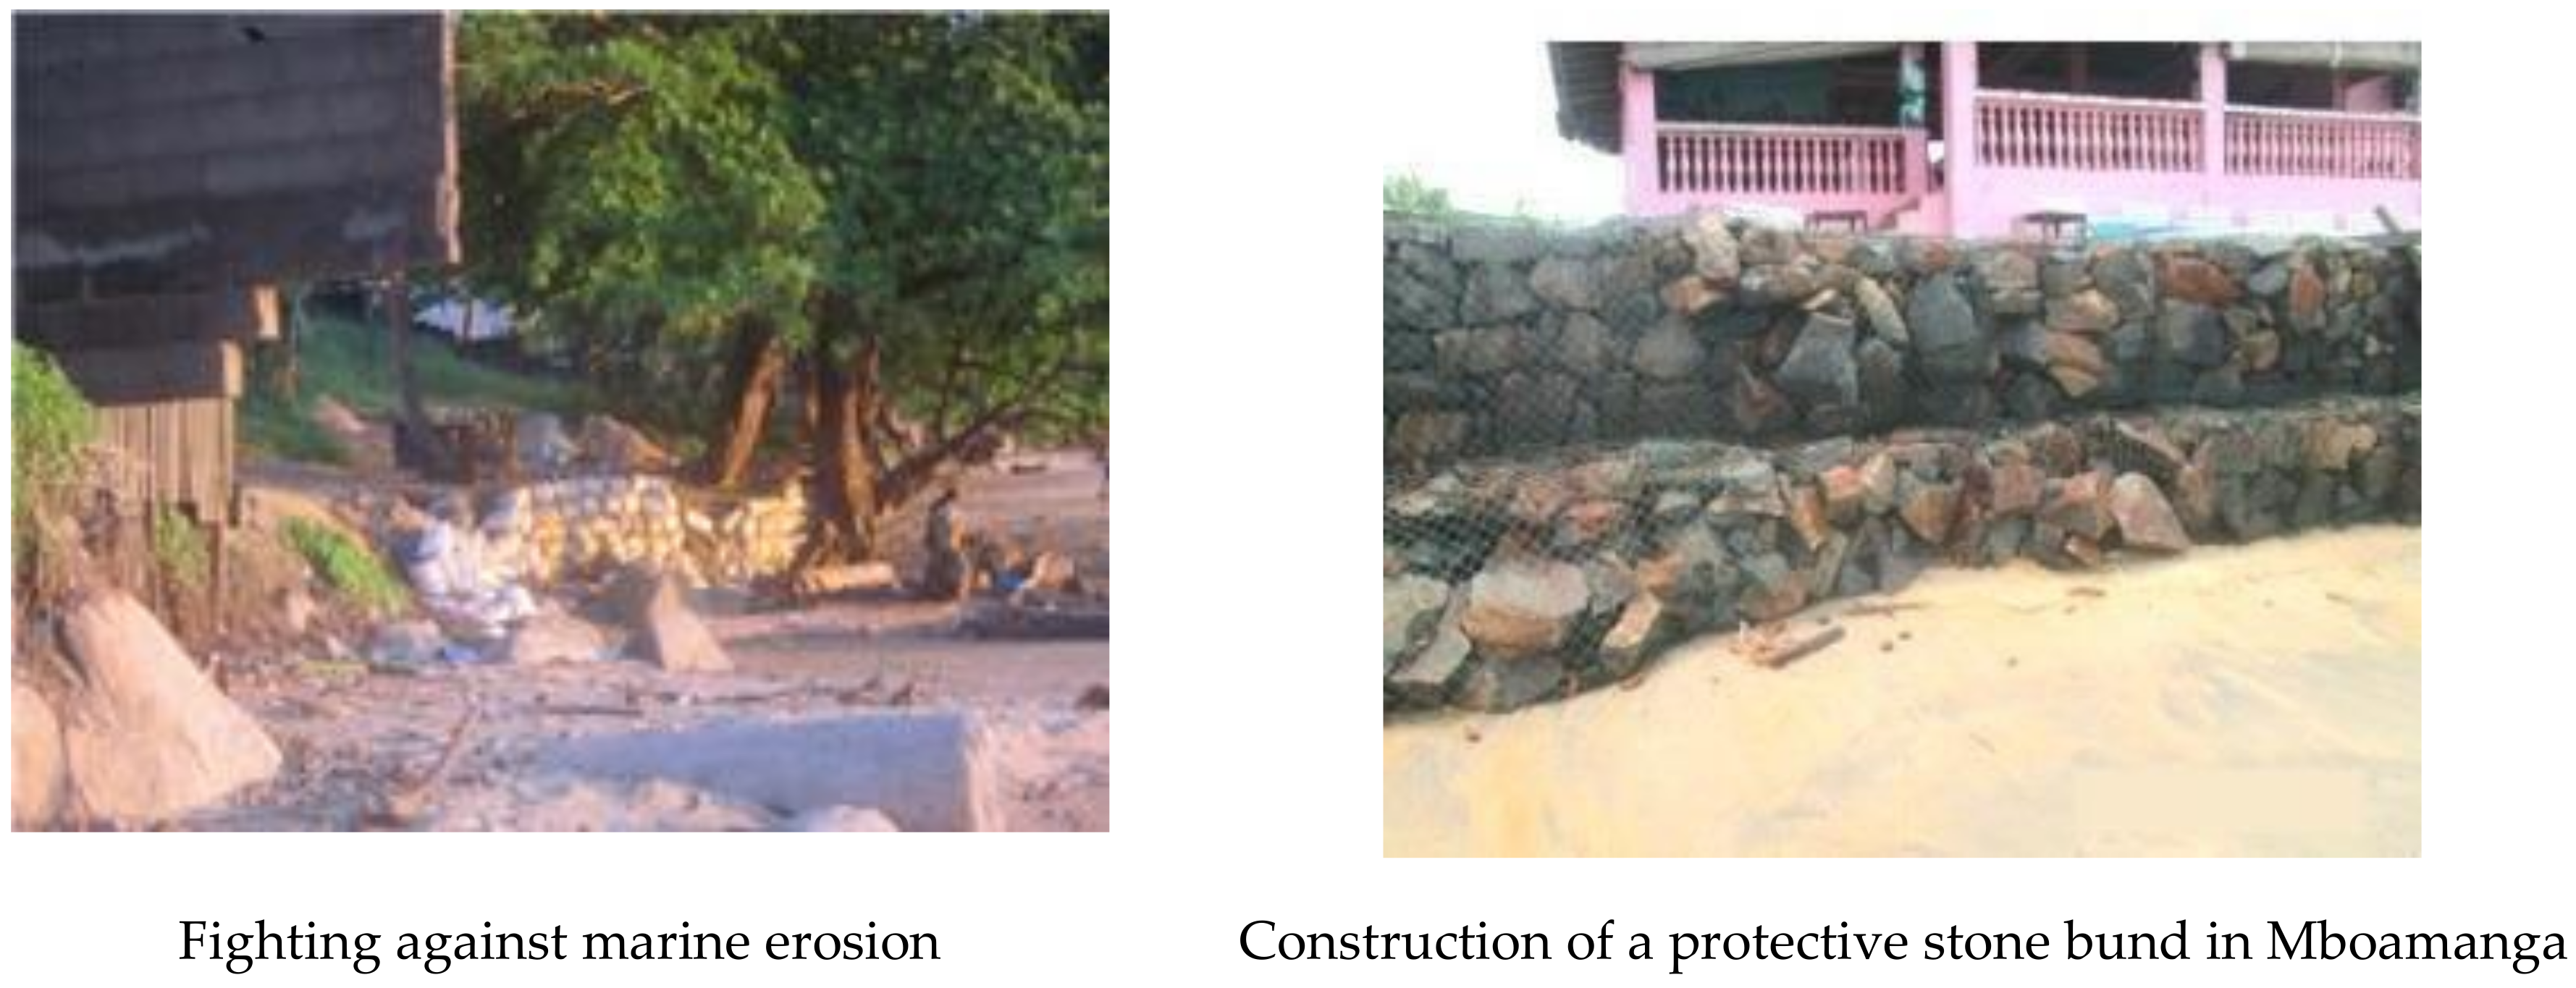
4.2.1. Current Status of Coastal Erosion Management on the Kribi Coastline

The Cameroonian government, non-governmental organizations (NGOs), and local populations have taken initiatives to combat coastal erosion on the Kribi coast.
Measures Undertaken by the State: Construction of Buildings to Protect Against Coastal Erosion in Kribi
Sustainably managing natural risks in Kribi city certainly entails considering measures likely to curb their harmful effects. These measures range from tested and approved accommodations to the operationalization of existing laws in the field. In 2012, a dyke was built to protect the Lobé Falls against coastal erosion (Figure 19). Indeed, the erosion at the level of the soft shore of the Lobé falls originates from the upwelling of sea currents resulting from the construction of the PAK. This initiative was salutary although limited given the interest in the Lobé Waterfalls coveted by UNESCO as a World Heritage site.
Unfortunately, the dyke did not resist erosion by upwelling currents. The dyke was dismantled in 2017 by the phenomenon it was supposed to fight against. Such a situation raised a question: why do protective measures and structures that are so expensive have such a short lifespan in Cameroon?
Pursue the Ngoye-Kribi Beach Development and Electrification Project
Kribi would benefit from promoting the sustainable city initiative. Tourist development will simultaneously preserve the natural assets of this city while promoting economic profitability. It could also increase the competitiveness of the tourism sector (seaside) in Cameroon through international-type attractions, which are very popular with Western tourists. In order to preserve the environment and the rights of local populations, a Regional Environmental assessment (REA) was developed in 2008 by Royal Haskoning and the Environmental and Social Impact Assessment (ESIA). Many more projects were realized later (between 2012 and 2016).
Local Response Strategies
The local populations of the Kribi coast, faced with the aggressive nature of the sea, have taken action to deal with the phenomenon. These initiatives, far from being the most appropriate and effective, at least make it possible to maintain security around their wealth and assets. They can be summarized by the arrangement of a stony cordon (Figure 20).
Non-Governmental Organizations (NGOs) Measures
In the Kribi-Campo area, the Organization for the Environment and Sustainable Development (OPED), funded by the African Development Bank (AfDB), has conducted studies on reducing the rate of mangrove degradation by improving fish-smoking technologies. This action led to a reduction of around 60% of cut mangrove wood, with the construction of 185 improved smokehouses [33]. In the Rio Ntem estuary (South Cameroon), the FAO launched a project called “sustainable community management and conservation of mangrove ecosystems”. This project has allowed for the reforestation of more than 1000 hectares of mangroves. Overall, these initiatives seem to be ineffective, hence the need to consider other more appropriate measures capable of significantly reducing the harmful impacts of coastal erosion on the Kribi coast.

4.2.2. What Measures Should Be Considered on the Coastline?

The Study Mission for Ocean Planning (MEAO) organized a brainstorming workshop on sustainable coastal erosion management strategies in Kribi, bringing together Cameroonian experts in the field, and the following measures have been adopted.
  • Limit the sand extraction from the beach. For this measure, it is necessary (i) to sensitize the mining actors and the consumers of sand with respect to the question of coastal erosion (its harmful effects); (ii) and to inform such actors and consumers of the nature of the sea sand, which is not suitable for construction. This sensitization needs to be accompanied by alternative activities, either through association or through technical, financial, and material support.
  • Promote a policy on the regeneration of coastal mangroves. There is already an experimental phase in Londji and Ebodje that has succeeded. It would be interesting to replicate it elsewhere in a participatory and integrated grassroots approach. Such an approach seems appropriate for areas of low vulnerability.
  • Execute the territorial restructuring and relocation of populations occupying the seafront.
  • Implement the rockfill approach, which requires the availability of supply points for rock material. This will promote the establishment of sediment accumulation zones.

5. Discussion

5.1. Coastline Dynamic

Finally, it should be noted that the recoil values put forward in this work remain to be put into perspective. The coastline extraction, which was based on a semi-automatic and manual method, based on Landsat images, took wet sand as the limit [66]. That assumes that the action of the tide constantly influences the coastal line. Consequently, to obtain a more plausible idea, the use of Pleiades images with a finer spatial resolution was beneficial, as confirmed by a recent report [69].
In Kribi, in addition to the results of the 2007 research [8], the measurements from studies commissioned by the PAK [70] also show very strong coastal dynamics, with migrations of the coastline of the order of several tens of meters (10–30 m on average) in 5–7 years (2003–2010), with accretion dominating the period from 2003–2010 and erosion dominating the period from 2010–2015/16. These studies, based on the analysis of Quicbird, Ikonos, Worldview, and GeoEye images (0.35 to 1 m spatial resolution), confirm our observations between 2003 and 2010. These erosions lead to significant sedimentary reworking, which can rapidly remodel (in less than 5 years) sandy forms in the estuaries.
In some African coastal countries, there are works dealing with the kinematics of the cost but performed with field measurements or at least low-resolution images.
Thus, in the southwest of the Ivory Coast, the coastal perimeter of San-Pédro and the beach segment of Assouindé Valtour are experiencing critical natural regressive evolutions of the shoreline and are subject to the impact of developments. Thus, they were subjected to a morpho-sedimentary study [71]. The assessment of the morpho-dynamic follow-up in the medium and long term (2008–2012 and 1985–2012) showed an estimated decline of 0.5–1 m/year over the long term and more than 4 m/year over the short term. The same phenomenon was observed in Senegal at the De Guédiawaye and Malika beaches in 2021, with an estimate of −0.15 m/year from 1942 to 2011 from Landsat images using DSAS [72].
Aerial photos (1979–1989) and field data (2007–2009) also show that the rate of erosion of the bay of Port-Bouet and the beaches of Assinie, which generally does not exceed 1.5 m/year [73], is exacerbated for short periods by violent swells that originate in the South Atlantic Ocean (2.3–18 m in a tidal cycle). In Mauritania, the coastline varied from −20.91 m/year to 22.95 m/year between 1978–1988 and 1988–1999 according to Landsat image processing [74].
In Libreville, the measurement of erosion phenomena on the northern coast and the monitoring of the morpho-sedimentary dynamics of intertidal sandy beaches has been the subject of a thesis carried out with in situ measurements [75]. The results show that between 1977 and 2013, the shoreline motion reveals variation rates from −2.07 m/year to +1.78 m/year. These rates correspond to 83% eroded beaches against 17% that are accreted. The results show declines between −2 and −12 m between 2012 and 2015, evidence of accelerated erosion due to anthropogenic forcing over short periods, as in San Pedro and Kribi.
Other authors [76] have analyzed the evolution of the Kribi shoreline and have been able to establish that this coastline is undergoing undeniable changes due to the phenomena of the fattening and thinning of the beach. This dynamic is manifested by changes in the coastal morphology, with the main consequence being “the shrinking of tourist recreational areas and the erosion of the coconut grove at the top of the beach”. The rate of erosion at these locations is estimated at 13.9 cm per year. The average displacement of the shoreline over all the zones is around 17 cm/year on the Kribi shore.
Unlike the Wouri estuary, which has benefited from earlier more detailed work, the Kribi coastline has not yet been the subject of an in-depth study on coastal erosion. Therefore, the results provided by this study constitute the current basis for observing erosion on this coastal strip in the midst of spatial change.
The erosion phenomenon on the Cameroonian coast can be explained by several factors. Each section of the coastline has its explanatory factors. Indeed, the hydro-sedimentary transit is disturbed by human installations and some physical parameters. The findings that emerge from the previous analyses concern the distribution of erosion on almost the entire Kribi coastline in 2020, although the rate of decline is low. Field observations made in 2014, 2015, and very recently in May 2019 during the internship carried out at the Study Mission for Ocean Planning (MEAO)—the testimony of people who have lived for a long time in the intertidal space—further support these findings.

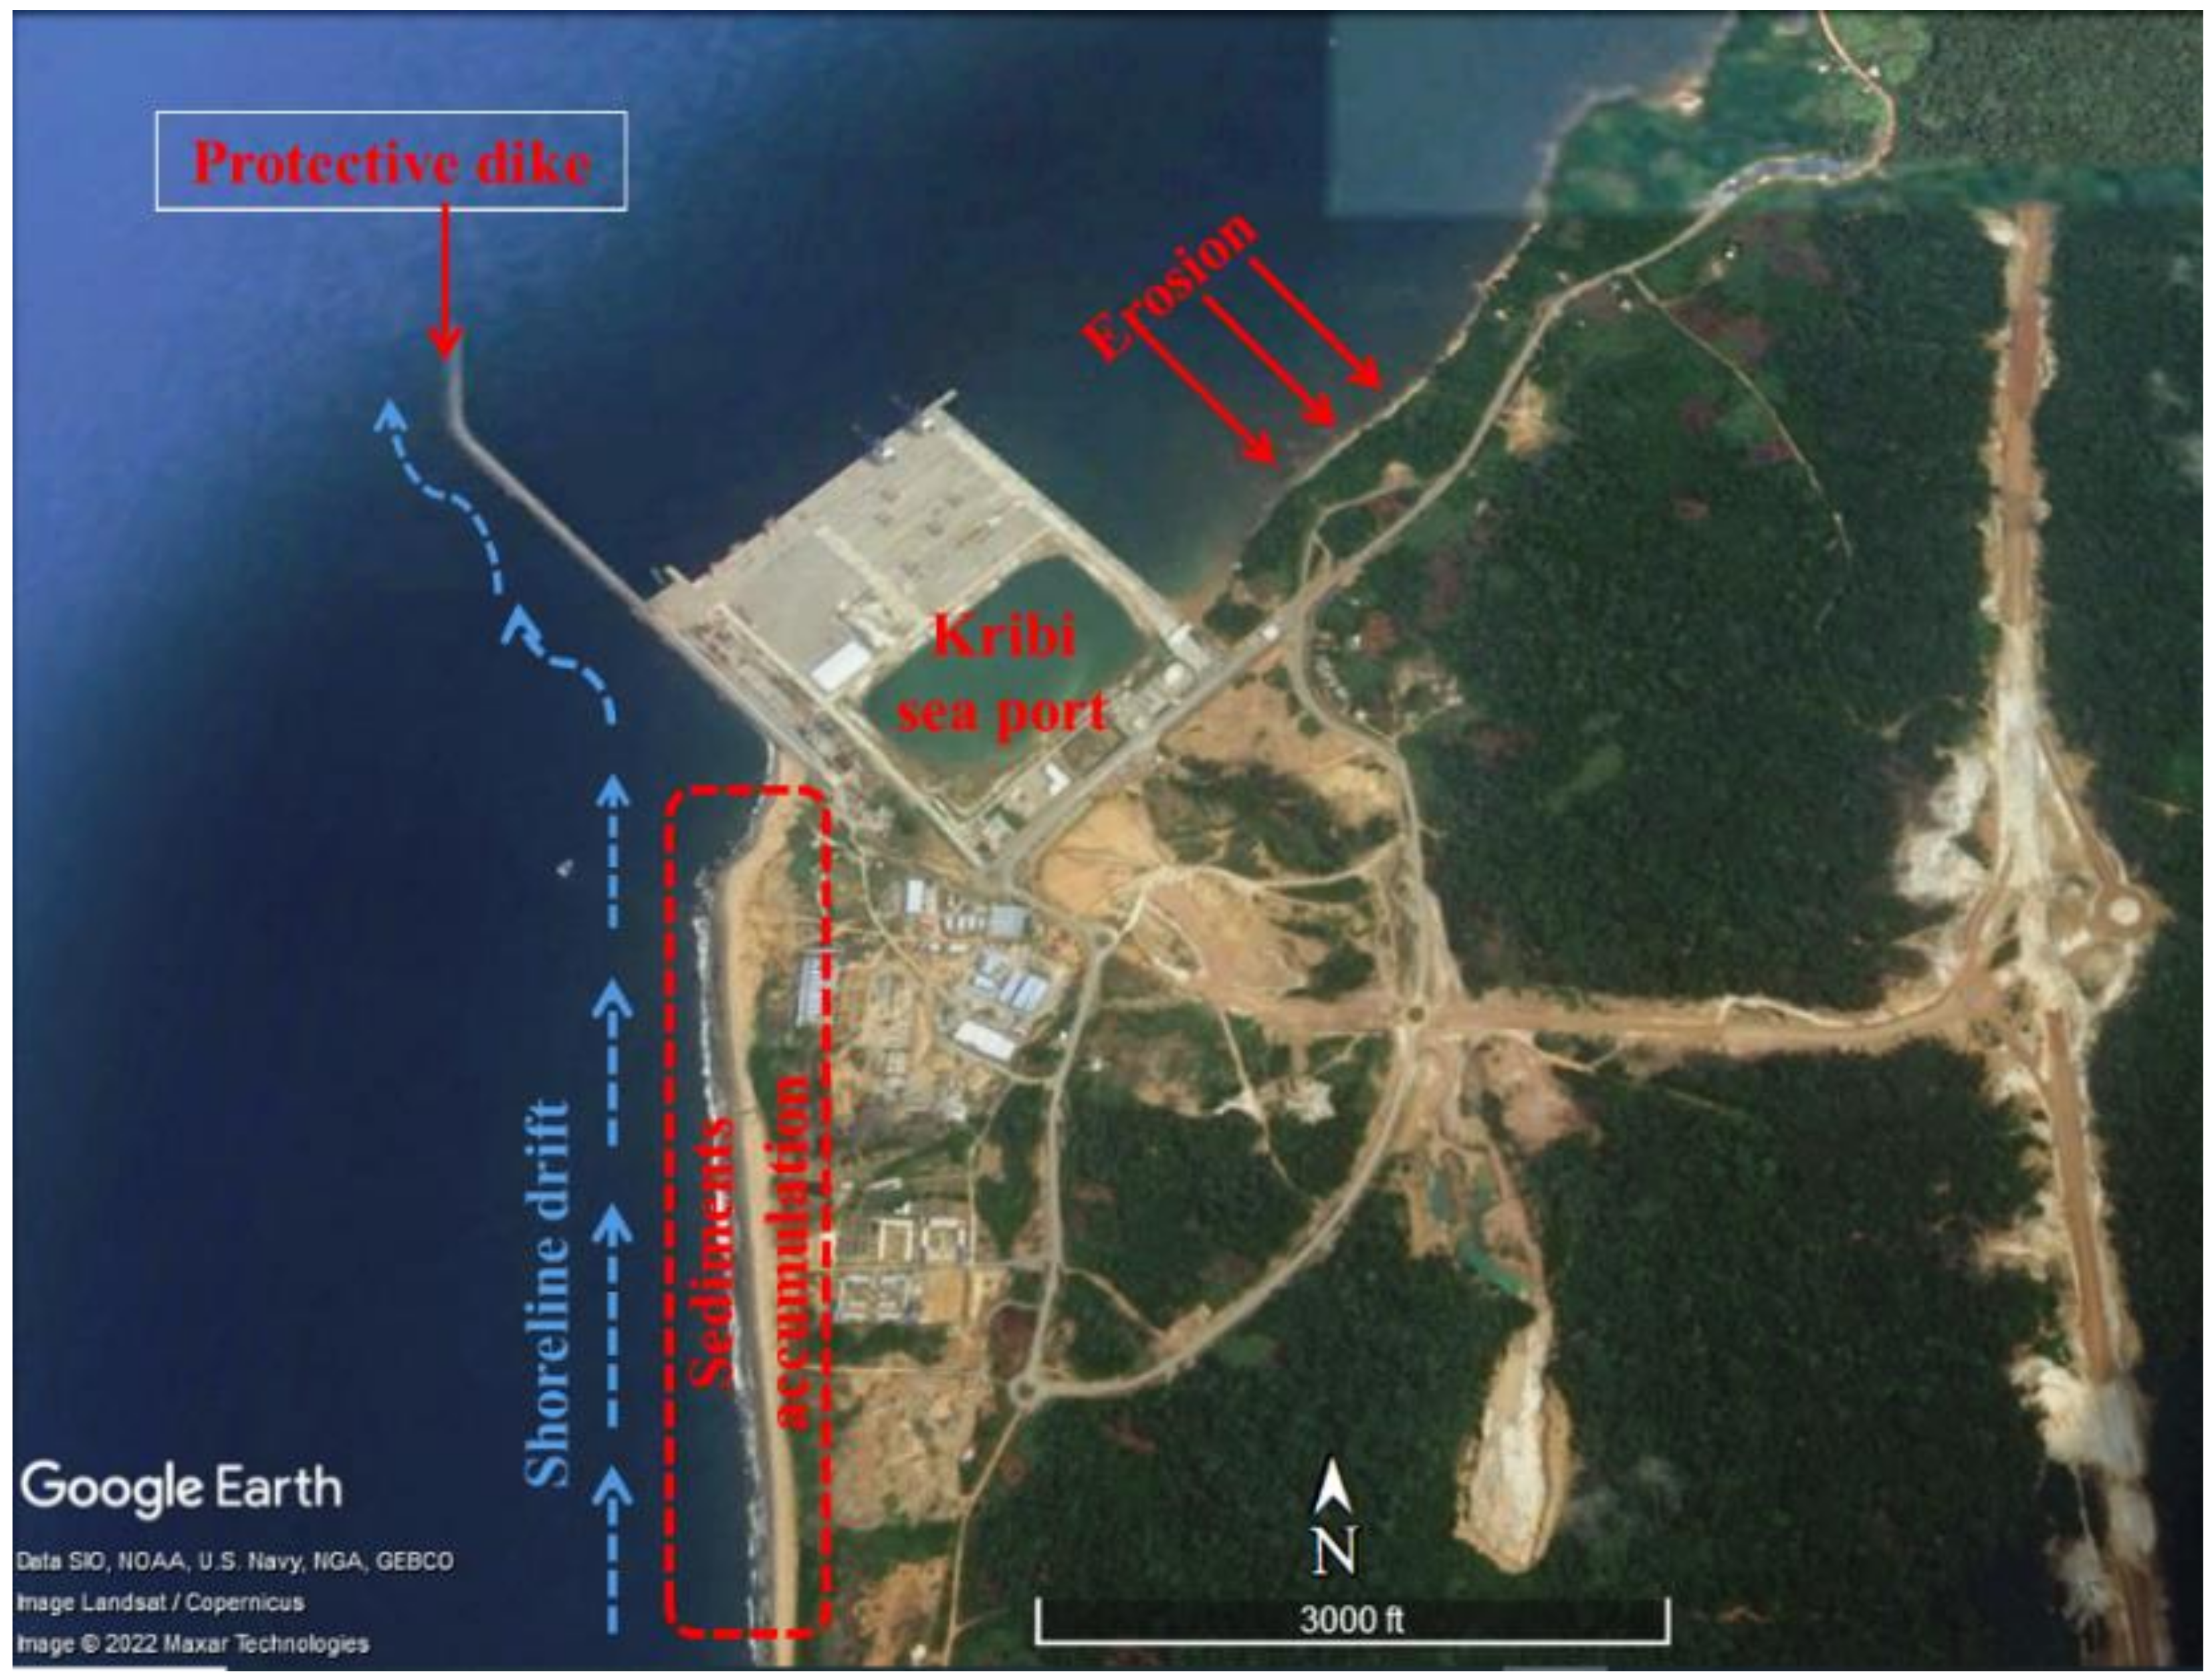
5.2. The Construction of Kribi Sea Port (PAK) and the Rise of Coastal Erosion

The Kribi Sea Port (PAK) project consists of the development of an Industrial-Port complex in Kribi (CIPK), including the construction of a seaport, the fitting out and development of industrial and logistics areas, and the new town, which could house more than 100,000 people when the commercial port has reached full activity. In this gigantic project, the portion of coastal land to be stripped is 26,000 ha. Similarly, the previous channel, which was 600 m long and 200 m wide with a coast 15 m deep, experienced an extension of the south dyke to the north with new characteristics: it was 1200 m long, 200 m wide, and 15 m deep, while maintaining the same orientation of 125° at the entrance and 305° at the exit [54]. In addition to this, the construction of the main protective dyke with a length of 1850 m constitutes a real sediment trap and is therefore an amplifying factor of coastal erosion.
The building of this dyke thus influences sediment transit. Indeed, the sediments mobilized by the coastal drift (in a south–north orientation) are trapped downstream of the PAK by its dyke. The visualization of aerial photos posted on Google Earth makes it possible to observe the phenomenon described (Figure 21).
Finally, the construction of the port of Kribi also generated changes in land use. Two Landsat images from 2004 and 2020 reflecting the state of the environment and the territorial dynamics induced by the construction of the PAK (Figure 22) have been shown. The destruction of the vegetation cover that serves as a natural barrier weakens the coastline and exposes it to coastal erosion.

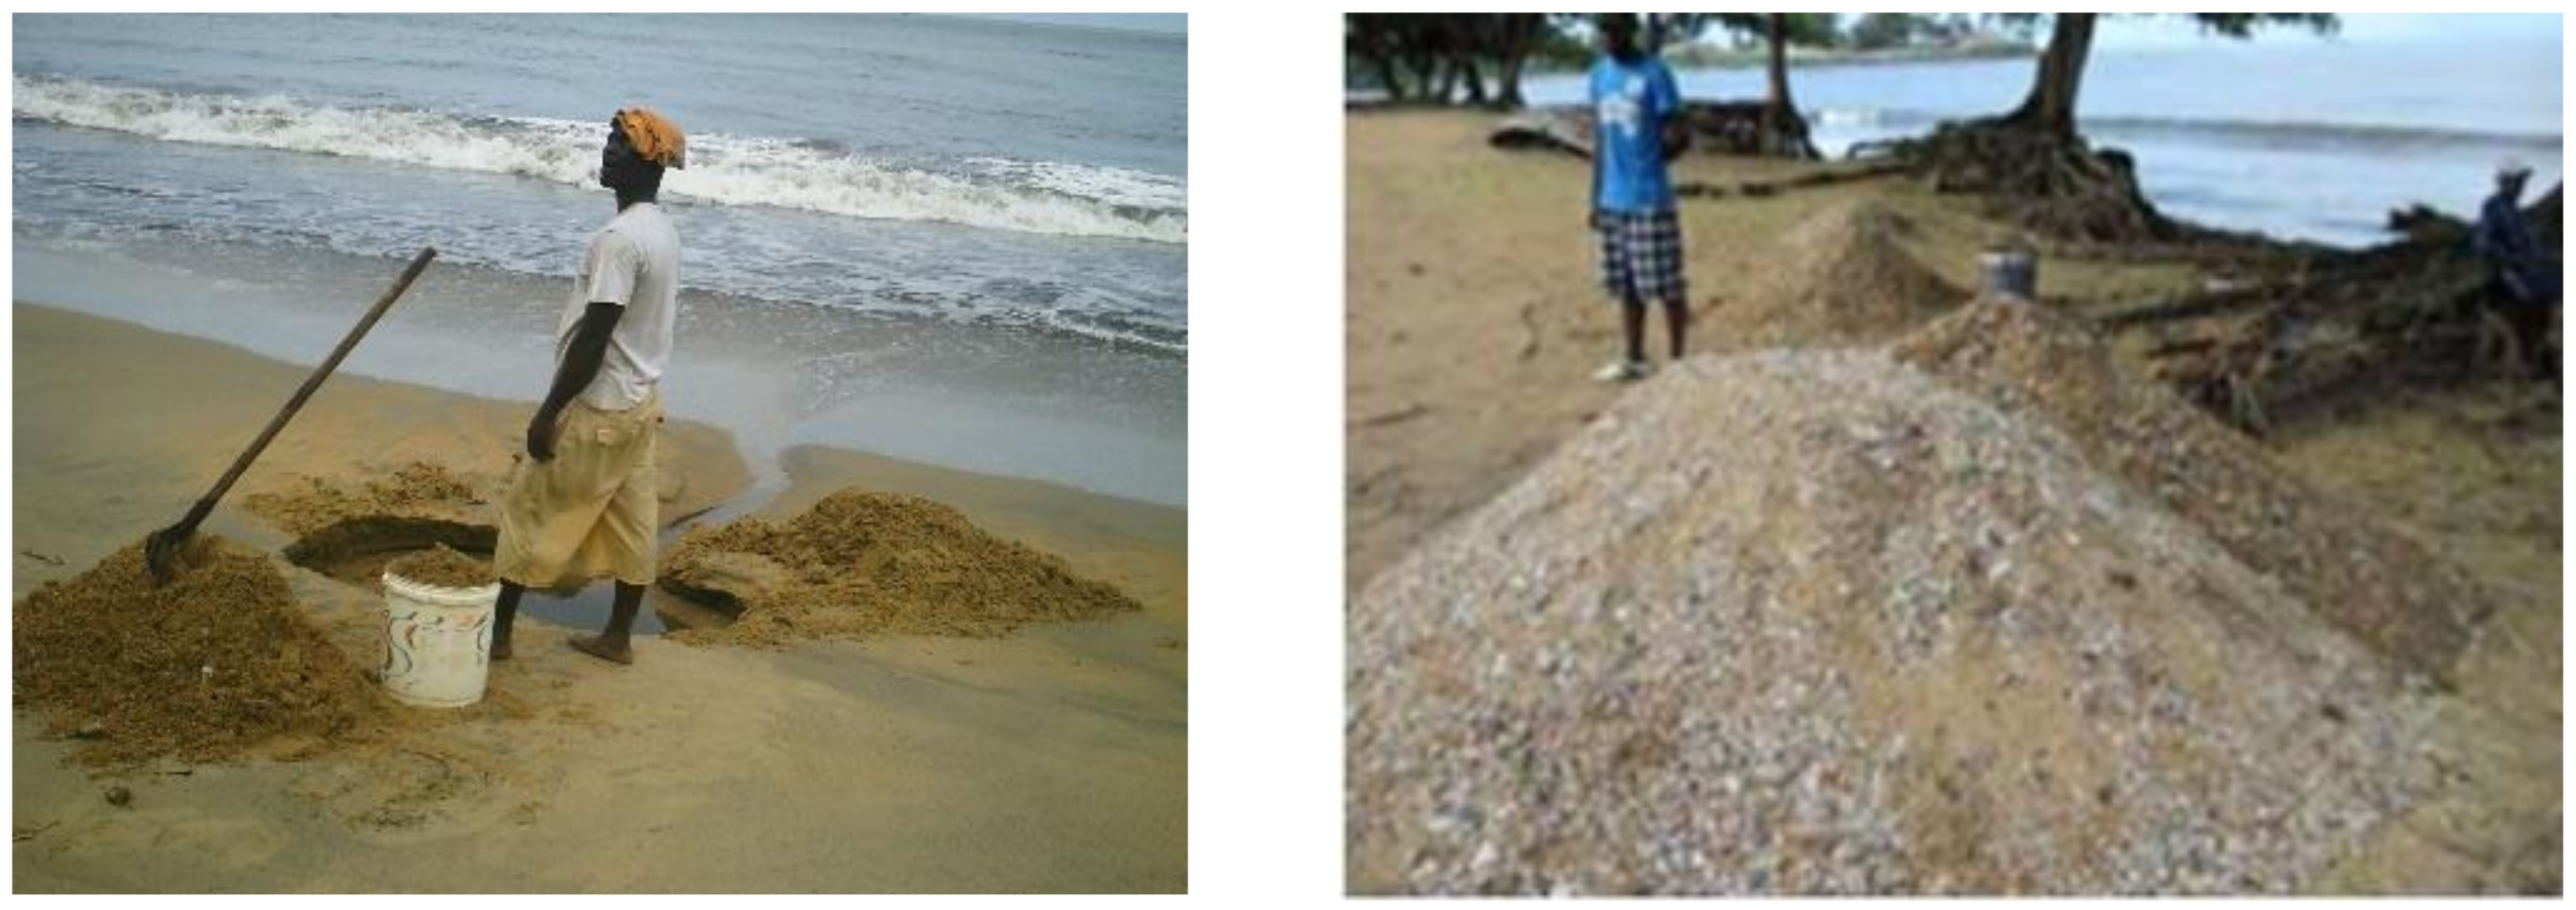
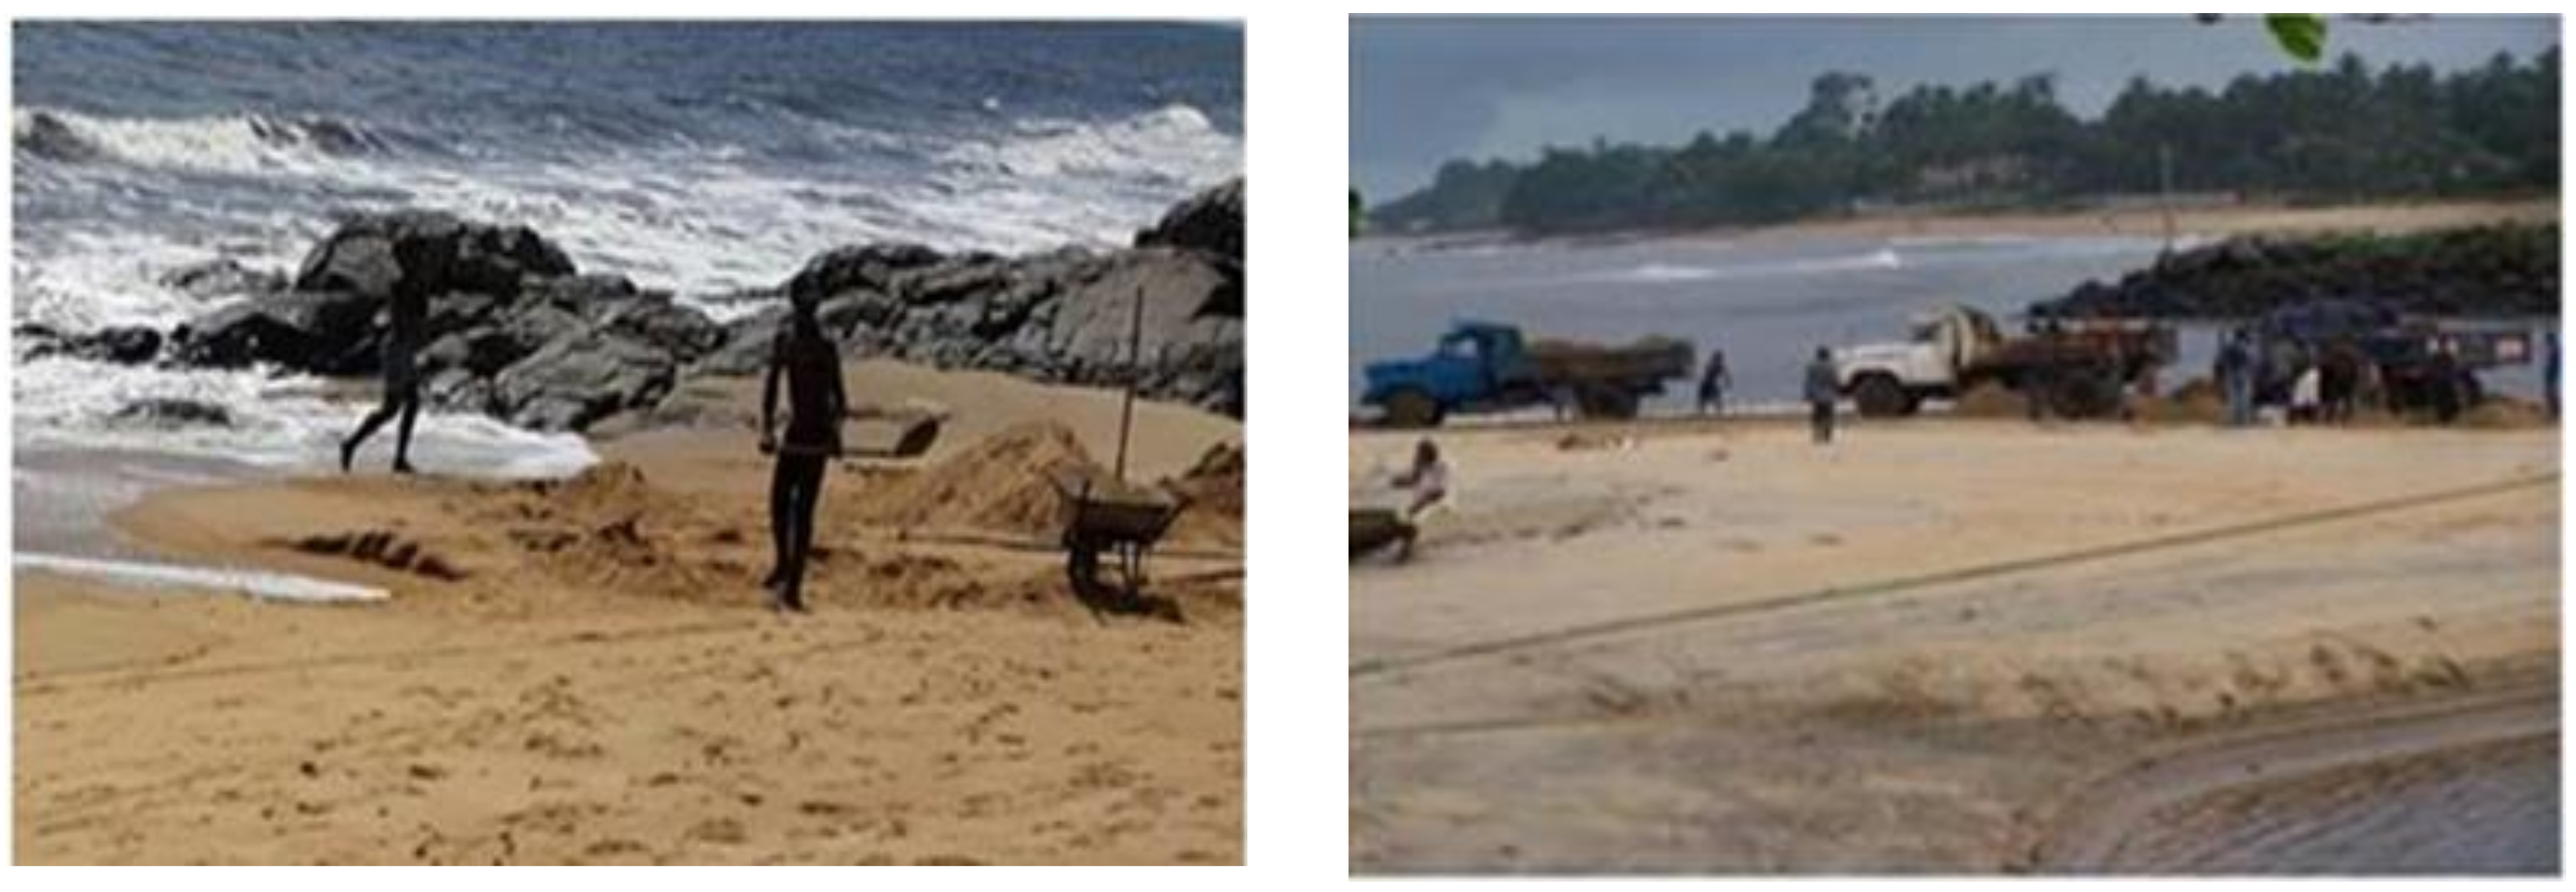
5.3. Sand Mining and Coastal Erosion

Despite the denunciations and catastrophic situations observed in the Caribbean [77]; in West Africa in Togo [13,78], Sierra Leone [79], and Senegal [80]; and in Central Africa/Cameroon [81,82], the extraction of sea sand continues to weigh on African and Cameroonian beaches in particular. The extraction of sand induces a thinning of the beaches, a deepening of the water column, and therefore the greater erosive action of the waves. This is the case on the Kribi coasts where the exploitation of sand beaches for economic purposes (Figure 23) contributes to the aggravation of erosion despite the prohibition of this activity [8,80].
Even if the erosion of the Cameroonian shore is largely due to the activities of the PAK, elsewhere in Senegal, on the other hand, the observations made in situ in recent years (1990–2003) by the owners of tourist camps show a withdrawal of the line of coast of the order of 15 m/year [83] (linked to sand mining), which was calculated in relation to the property limits or the position of the well. The establishment of sand mining at Pointe Sarène beach has therefore significantly modified the sediment balance of the area, causing an increase in erosion throughout the sector.

5.4. Deforestation and Coastal Erosion

Traditionally, it is thought that only mangroves protect these coasts [84,85]. However, the coastal forest also plays a decisive role [86,87]. On the Kribian coast, the reduction of small pockets of mangroves on the littoral zone has affected the stabilization of this zone. Similarly, the destruction of the littoral forest, linked to development projects, significantly exposes the Kribi littoral zone to erosion. This is particularly well demonstrated on the first site chosen for the establishment of the Douala Sea Port, where complete deforestation was carried out. Significant erosion is underway at this site. At the current site of the Kribi Sea Port, despite the construction of a dyke, erosion is still locally threatening. These inappropriate human interventions currently constitute a worrying and significant threat to the environment [82,88].

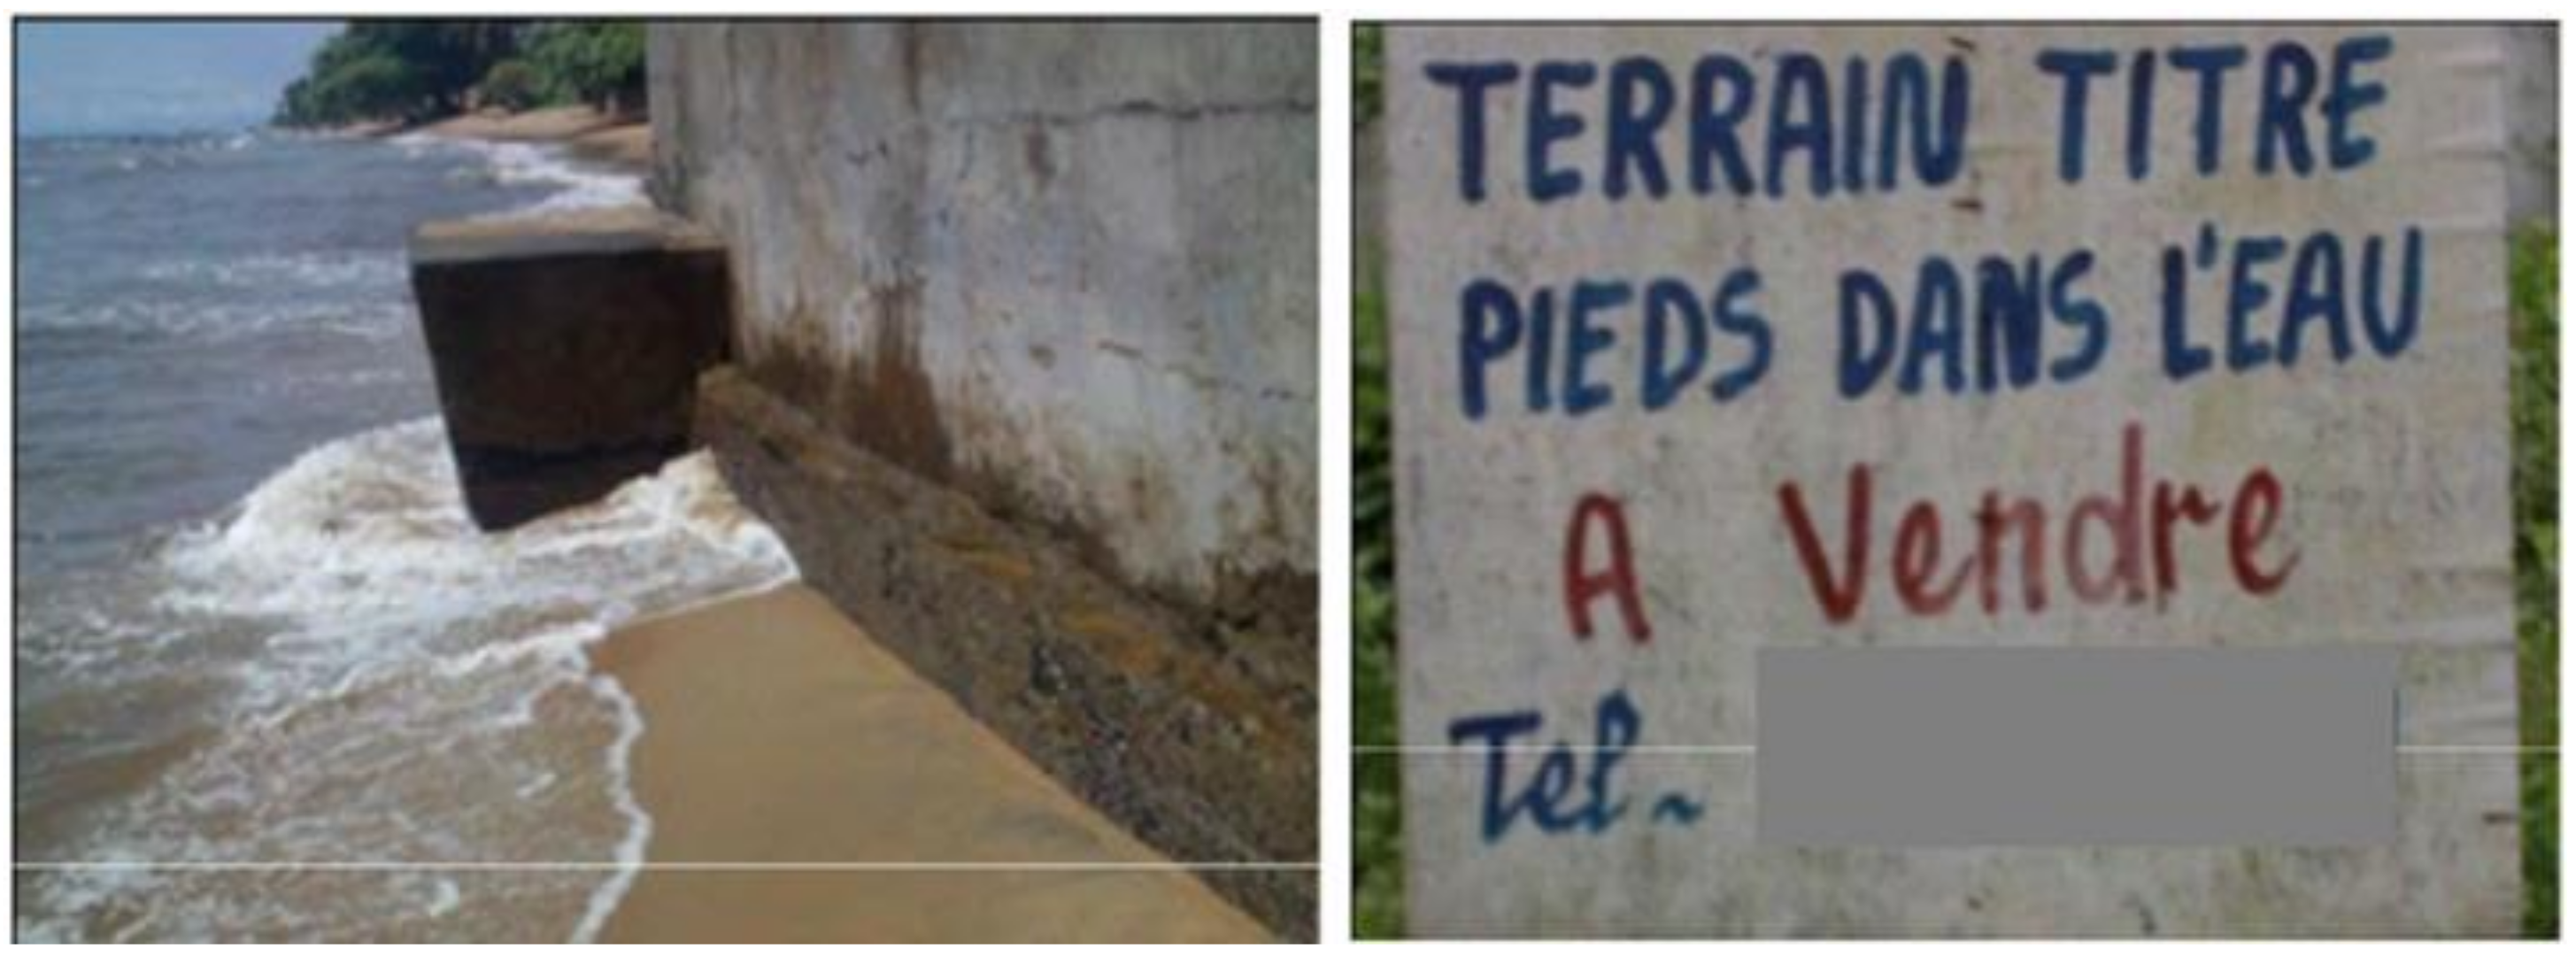
5.5. Urbanization, Population Growth, and Coastal Erosion

Kribi city is experiencing significant spatial and demographic growth, which impacts the dynamics of the environment. The high demand for housing leads to the extraction of sand, while the supply of river sediment is low on this coastal portion. This removal of sand from the beaches will induce an increase in their slope and therefore an increase in the erosive action of the waves during breaking, which leads to a reduction in the beaches’ area. This is amplified by the construction on the beach; the erosion by the waves increases, and the sediment transit between the back beach and the beach is reduced. Authors documenting the coast of Algiers [89,90] also mention that erosion related to urbanization will have consequences on the retreat of the coastline.

5.6. Hotel Activity Impact on the Sea and Coastal Erosion

Douala Metropolis, the largest coastal city in Cameroon, is experiencing accelerated urbanization. As Kribi (a medium-sized city) is concerned, its spatial extension has been developed to the detriment of the mangroves and another Atlantic Forest that constitutes a form of natural protection against erosion [91]. This urban development correlates with tourist activity, which is booming in this area as evidenced by the arrival of many national and international tourists. The walls and dams built to protect hotels—far from stopping it—accentuate erosion [85]. This situation will be amplified with the implementation of the project to electrify and develop Ngoye beach for tourist purposes [86]. Moreover, Kribi already occupies the second place on the chessboard regarding the stay of the customers [92]. The Lobé falls are the main point of attraction [93].
Hotel activities also lead to strong land speculation on the Kribi coast. Such a situation explains why the land belonging to the private domain of the state is sold and transformed into a hotel establishment. Foundation pillars can be observed hugging the shore and disturbing the hydro-sedimentary dynamics in situ (Figure 24).

5.7. Changes in Fluvial Inputs and Coastal Erosion

As said before, The Ntem is the largest river on the Kribian coast. Its watershed is 31,000 km2 wide and 460 km long. It has a relatively low sediment transport (10.6 t/km2) because its watershed is covered by forest [44,94,95,96]. The construction of the Memve’ele dam (2°24′09″ N, 10°23′37″ E) on the Ntem has a significant impact on the Kribi coast. This building traps a significant part of the sediment transport of this river, thereby reducing its sediment supply to the coast. This is the main explanatory factor. In addition, recent climate changes that have impacted the Sanaga River must also play a role and participate in the reduction of inputs on the coast.

5.8. Climate Change and Coastal Erosion

In both developed and developing countries, climate change is having an impact on coastal erosion [97]. Sea level rise, increased swell speeds, and rising sea surface temperatures are all climate drivers that exacerbate coastal erosion [98,99]. In Kribi, the relative effects of climate change are exacerbated by anthropogenic forcings because the climate seems more stable in Kribi than in Douala or the West Cameroonian coast (i.e., Limbe, Idenau, and Debunscha). In certain regions of the world, a radical change in the morphology of coastlines has been underlined by some authors [100].

6. Conclusions

The analysis and description of the physical framework in order to assess the coastal kinematics or even the weakening of the Kribi coast between 1973 and 2020 were the objectives of this work. The evaluation of the dynamics of the coastline was performed with Landsat images over three periods: 1973–2000, 2000–2015, and 2015–2020. Regarding the Pleiades images, two three-year periods, namely, 2013–2016 and 2016–2019, were analyzed using geostatistical methods implemented by the Digital Shoreline Analysis System (DSAS) software. The results obtained show an increase in time and space of the eroding areas on the Kribi coast. The period from 1973–2000 shows the clear stability of the coastline, with an average accretion rate of +0.4 m/year. The period from 2000–2015, which corresponds to the construction period of the Kribi Sea Port, coincided with limited erosion, with an average decline of −0.9 m/year. Finally, the period from 2015–2020, which marks the entry into service of the seaport, is also the period when erosion increased considerably, i.e., at an average decline of −2 m/year. The explanatory factors are linked—to the greatest extent possible—to marine weather forcings and to anthropogenic forcings, which appear to be more significant. Therefore, everything suggests that the installation of seaport equipment in Kribi constitutes the amplificatory element of coastal erosion in the area. As in most coasts in the Gulf of Guinea, unsuitable human interventions constitute internal weakening factors. Global climate change is not an exception. The kinematics dynamic that has been analyzed is influenced by the combined effects of the natural forcings and anthropogenic factors mainly linked to the Kribi seaport’s establishment (constituting great human influences on coastal processes) on the studied area. Finally, an improved knowledge of coastal dynamics provides policy makers with tools for integrated coastal management.

Author Contributions

P.M.F. was involved in the conceptualization, methodology, mapping, analysis, and drafting of the paper after field investigations. M.T. was involved in field investigation, the conceptualization of the figures and tables, validation, and drafting the paper. A.H.-F.’s role involved constructing the methodology, review, editing, and analysis. All authors have read and agreed to the published version of the manuscript.

Funding

This research received no external funding.

Data Availability Statement

The data supporting reported results can be provided by request.

Conflicts of Interest

The authors declare no conflict of interest.

References

  1. Gemenne, F.; Blocher, J.M.D.; De Longueville, F.; Vigil Diaz Telenti, S.; Zickgraf, C.; Gharbaoui, D.; Ozer, P. Changement climatique, catastrophes naturelles et déplacements de populations en Afrique de L’ouest. Geo Eco Trop Rev. Int. Géol. Géogr. D’écol. Trop. 2017, 41, 22. [Google Scholar]
  2. Bocquier, P.; Traoré, S. Urbanisation et Dynamique Migratoire en Afrique de L’ouest; La Croissance Urbaine en Panne. 2000. Available online: https://dial.uclouvain.be/pr/boreal/object/boreal:78555 (accessed on 2 June 2022).
  3. Dubresson, A.; Moreau, S.; Raison, J.P.; Steck, J.F. L’Afrique Subsaharienne: Une Géographie Du Changement; Armand Colin: Paris, France, 2011. [Google Scholar]
  4. Janssens, M. Lomé, 100 ans de Croissance Démographique. Presses de L’UB, Lomé. 1998. Available online: https://www.oceandocs.org/bitstream/handle/1834/1193/lome100.pdf?sequence=1 (accessed on 7 June 2022).
  5. Hénaff, A. Les Aménagements des Littoraux de la Région Bretagne en vue de Leur Défense Contre L’érosion Depuis 1949 (Protection of the Shoreline from Coastal Erosion Since 1949 in Britanny). Bull. L’assoc. Géogr. Fr. 2004, 81, 346–359. Available online: https://www.persee.fr/docAsPDF/bagf_0004-5322_2004_num_81_3_2397.pdf (accessed on 2 June 2022). [CrossRef]
  6. Tafani, C. Littoral Corse: Entre Préservation de la Nature et Urbanisation, Quelle Place Pour les Terres Agricoles ? Méditerr. Rev. Géogr Pays Méditerr. J. Mediterr. Geogr. 2010, 115, 79–91. Available online: https://journals.openedition.org/mediterranee/5216 (accessed on 23 May 2022). [CrossRef]
  7. Tiafack, O.; Chrétien, N.; Emmanuel, N.N. Development Polarisation in Limbe and Kribi (Littoral Cameroon): Growth Challenges, Lessons from Douala and Options. Curr. Urban Stud. 2014, 2, 361. Available online: https://www.scirp.org/html/6-1150105_52736.htm (accessed on 17 June 2022). [CrossRef]
  8. Tchindjang, M.; Mouliom, A.; Nzieyo Nombo, G. Evolution du rivage kribien depuis 1973. In Construire La Ville Portuaire De Demain En Afrique Atlantique; Tchindjang, M., Steck, B., Bopda, A., Eds.; Editions EMS: Paris, France, 2019; pp. 538–568. Available online: https://www.editionsems.fr/livres/collections/afrique-atlantique/ouvrage/525-construire-la-ville-portuaire-de-demain-enafrique-atlantique.html (accessed on 26 July 2022).
  9. Laimé, M. Le Dossier De L’eau. Pénurie, Pollution, Corruption; Média Diffusion: Paris, France, 2015. [Google Scholar]
  10. Ozer, P.; Hountondji, Y.C.; De Longueville, F. Évolution récente du trait de côte dans le golfe du Bénin; Exemples du Togo et du Bénin. Geo Eco Trop Rev. Int. Géol. Géogr. D’écol. Trop. 2017, 41. [Google Scholar]
  11. Fossi Fotsi, Y.; Pouvreau, N.; Brenon, I.; Onguene, R.; Etame, J. Temporal (1948–2012) and Dynamic Evolution of the Wouri Estuary Coastline within the Gulf of Guinea. J. Mar. Sci. Eng. 2020, 7, 343. [Google Scholar] [CrossRef]
  12. UGI. The Coastline Change: Annual Report; International Geographical Union: Washington, DC, USA, 2012. [Google Scholar]
  13. Blivi, A. Géomorphologie Et Dynamique Actuelle Du Littoral Du Golfe du Bénin (Afrique de L’ouest). Ph.D. Thesis, Université Michel de Montaigne, Bordeaux, France, 1993. [Google Scholar]
  14. Ndior, V. Les organisations internationales et l’érosion côtière. Rev. Jurid. L’environ. 2019, 44, 71–78. Available online: https://www.cairn.info/revue-revue-juridique-de-l-environnement-2019-1-page-71.htm (accessed on 25 March 2022).
  15. Valère, D.E.M.; Fatoumata, B.; Jeanne, K.M.; Jean-Baptiste, K.A.; Hervé, M.A.B.; Kouamé, A.K.; André, T.J.; Patricia, Y. Cartographie De La Dynamique Du Trait De Côte À Grand-Lahou: Utilisation De L’outil Digital Shoreline Analysis System (Dsas). Eur. Sci. J. 2016, 12, 327. [Google Scholar] [CrossRef]
  16. Aubié, S.; Mugica, J.; Mallet, C. Caractérisation De L’aléa Recul Du Trait De Côte Sur Le Littoral De La Côte Aquitaine Aux Horizons 2025 et 2050; Observatoire Côte Aquitaine: Paris, France, 2011. [Google Scholar]
  17. Degbe, C.G.E. Evolution du trait de côte du littoral béninois de 2011 à 2014. Sci. Vie Terre Agron. 2017, 5. [Google Scholar]
  18. Tomety, S.F. Analyse des statistiques de vagues au Nord du Golfe de Guinée (Côte d’Ivoire, Ghana, Bénin, Nigéria) dans le cadre du suivi de l’érosion côtière; Mémoire de. Master of Science En Océanographie Physique Et Applications (CIPMA-Chaire UNESCO). Master’s Thesis, Université d’Abomey-Calavi, Abomey, Benin, 2013. [Google Scholar]
  19. Rey, T.; Defossez, S. Retours D’expériences Post-Catastrophes Naturelles. 2019. Available online: https://www.researchgate.net/profile/Pottier_Nathalie/publication/336882202.pdf (accessed on 12 July 2021).
  20. Mounganga, M.-D. Érosion côtière et risques littoraux face aux changements climatiques; essai d’analyses comparatives des indicateurs de vulnérabilité à Libreville (Gabon) et Pointe-Noire (Congo). In Proceedings of the Communication Du Colloque Du SIFEE, Niamey, Niger, 26–29 May 2009. [Google Scholar]
  21. Ovono, Z.M. Effet des changements climatiques en Afrique Centrale: Le cas de l’érosion côtière sur le littoral du Gabon. In Revue Territoires D’Afrique; N°9; Les Impacts Du Changement Climatique Sur Les Littoraux D’Afrique; Territoire D’Afrique: Paris, France, 2017; pp. 17–27. [Google Scholar]
  22. Tweneboah, E. The Role of Environmental Values and Attitudes of Ghanaian Coastal Women in Natural Resource Management. Ph.D. Thesis, Faculty of Environmental Sciences and Process Engineering, Brandenburg University of Technology, Cottbus, Germany, 2009. [Google Scholar]
  23. Zhang, K.; Douglas, B.C.; Leatherman, S.P. Global warming and coastal erosion. Clim. Chang. 2004, 64, 41–58. [Google Scholar] [CrossRef]
  24. Thampanya, U.; Vermaat, J.E.; Sinsakul, S.; Panapitukkul, N. Coastal erosion and mangrove progradation of Southern Thailand. Estuar. Coast. Shelf Sci. 2006, 68, 75–85. [Google Scholar] [CrossRef]
  25. Ly, C.K. The role of the Akosombo Dam on the Volta River in causing coastal erosion in central and eastern Ghana (West Africa). Mar. Geol. 1980, 37, 323–332. [Google Scholar] [CrossRef]
  26. Ndour, A.; Laïbi, R.A.; Sadio, M.; Degbe, C.G.E.; Diaw, A.T.; Oyédé, L.M.; Anthony, E.J.; Dussouillez, P.; Sambou, H. Management strategies for coastal erosion problems in West Africa: Analysis, issues, and constraints drawn from the examples of Senegal and Benin. Ocean. Coast. Manag. 2018, 156, 92–106. [Google Scholar] [CrossRef]
  27. National Research Council. Managing Coastal Erosion; National Academy of Science: Washington, DC, USA, 1930. [Google Scholar]
  28. Kengapet Kouekam, A.; Fowe, P.G.; Togue Kamga, F.; Ngueguim, J.R.; Tsague, J.S. Modélisation de la Dynamique du Trait de Côte sur une Portion de la côte Ouest Cameroun allant de Batoke à Seme Beach par Imagerie Landsat de 1979 à 2018. Eur. Sci. J. 2019, 15, 1857–7881. [Google Scholar]
  29. ENVIREP CAMEROUN, Plan D’action National de Gestion des Zones Marine et Côtière Valide. 2010. Available online: https://aquadocs.org/bitstream/handle/1834/5227/VERSION%20DU%20PAN%20VALIDEE.pdf?sequence=1&isAllowed=y (accessed on 22 June 2022).
  30. Ouabo, R.E.; Tchoffo, R.S.; Ngatcha, B.R. Utilisation de la Géomatique Pour L’analyse des Risques Liés à la Dynamique du Trait de Côte à Kribi. J. Cameroon Acad. Sci. 2018, 14, 121–136. Available online: https://www.ajol.info/index.php/jcas/article/view/174682/164073 (accessed on 20 September 2021). [CrossRef]
  31. Mfombam Nsangou, G.C. Contribution De La Modélisation A L’évaluation Du Trait De Côte, Mémoire De Master Professionnel En Cartographie, Télédétection Et SIG Appliqués A La Gestion Durable Des Territoires; Université de Yaoundé 1: Yaoundé, Cameroon, 2016. [Google Scholar]
  32. Mangor, K.; Drønen, N.K.; Kærgaard, K.H.; Kristensen, S.E. Shoreline Management Guidelines; DHI Water and Environment: Copehnagen, Denmark, 2004. [Google Scholar]
  33. Ajanino, G.; Tchikangwa, B.; Chuyong, G.; Tchamba, M. Les défis et perspectives de la formulation d’une méthodologie communautaire généralisable pour évaluer la vulnérabilité et l’adaptation des écosystèmes de mangrove aux impacts du changement climatique: Expérience du Cameroun. Nat. Faune 1999, 24. [Google Scholar]
  34. Mbaha, J.P.; Etoundi, M.L.B.A. Et demain Kribi: Construire une Ville Portuaire Stratégique et Émergente à L’horizon 2035. Espace Géograph. Soc. Maroc. 2021, 43–44. Available online: https://revues.imist.ma/index.php/EGSM/article/download/24572/13011 (accessed on 12 November 2021).
  35. MINHDU. Plan Directeur D’Urbanisme De La Ville De Kribi. Rapport Justificatif; Communauté Urbaine de Kribi: Kribi, Cameroon, 2014; 152p. [Google Scholar]
  36. MINEPDED/PNUD. Révision /Opérationnalisation Du PNGE Vers Un Programme Environnemental (PE), Volume I: Diagnostic De La Situation De L’Environnement Au Cameroun; Ministère de L’environnement et de la Protection de la Nature: Yaoundé, Cameroon, 2009; 203p. [Google Scholar]
  37. Vicat, J.P.; Pouclet, A.; Nsifa, E. Les Dolérites du Groupe du Ntem (Sud Cameroun) et des Régions Voisines (Centrafrique, Gabon, Congo, Bas Zaïre): Caractéristiques Géochimiques et Place dans L’évolution du Craton du Congo au Protérozoïque. Géologie Environ. Cameroun Collect. GEOCAM 1998, 305–324. [Google Scholar]
  38. Oslisly, R. The history of human settlement in the middle Ogooué valley (Gabon): Implications for the environment. Afr. Rain For. Ecol. Conserv. 2001, 101–118. [Google Scholar]
  39. Segalen, P. Les Sols et la Géomorphologie du Cameroun. Cahiers ORSTOM, Série Pédologie. 1967. pp. 137–187. Available online: https://www.thesisonafrica.com/wp-content/uploads/2018/06/Sols_geomorphologie_Cameroun_Segalen.pdf (accessed on 12 April 2022).
  40. Nlend Nlend, P. Les Traditions Céramiques dans leur Contexte Archéologique sur le Littoral Camerounais (Kribi-Campo) de 3000 à 500 BP. Ph.D. Thesis, Université Libre De Bruxelles, Brussels, Belgium, 2013. Available online: https://dipot.ulb.ac.be/dspace/bitstream/2013/209563/3/3698de3f-8bfe-4eab-8c30-6bcf7eef2042.txt (accessed on 11 October 2021).
  41. IUSS Working Group WRB. World Reference Base for Soil Resources 2014, Update 2015 International Soil Classification System for Naming Soils and Creating Legends for Soil Maps; World Soil Resources Reports, No. 106; FAO: Rome, Italy, 2015. [Google Scholar]
  42. Sighomnou, D. Analyse Et Redéfinition Des Régimes Climatiques Et Hydrologiques Du Cameroun: Perspectives D’Evolution Des Ressources En Eau. Ph.D. Thesis, University of Yaoundé I, Yaoundé, Cameroon, 2004. [Google Scholar]
  43. Hegge, B.J. Low Energy Sandy Beaches of Southwestern Australia: Twodimensional Morphology, Sediments and Dynamics. Ph.D. Thesis, Department of Geography, Western Australia University, Perth, Australia, 1994. [Google Scholar]
  44. Liénou, G.; Mahé, G.; Paturel, J.E.; Servat, E.; Sighomnou, D.; Sigha-Nkamdjou, L.; Dieulin, C. Impact de la variabilité climatique en zone équatoriale: Exemple de modification de cycle hydrologique des rivières du sud-Cameroun. Hydrol. Sci. J. Sci. Hydrol. 2008, 53, 789–801. Available online: https://www.iwra.org/member/congress/resource/abs127_article.pdf (accessed on 25 July 2022). [CrossRef]
  45. SOGREAH. Recensement, Analyse Et Evaluation Des Données Existantes Eventuelles Et Acquises (Lot n°5) Pour Le Projet De Port En Eau Profonde De Kribi, Rapport n°2 Final; Port Autonome de Kribi: Kribi, Cameroon, 2010. [Google Scholar]
  46. Letouzey, R. Étude Phytogéographique du Cameroun; Paris, P., Ed.; Le Chevalier: Paris, France, 1968. [Google Scholar]
  47. Olivry, J.C. Fleuves Et Rivières Du Cameroun, Monographies Hydrologiques ORSTOM. 1986. Available online: https://horizon.documentation.ird.fr/exl-doc/pleins_textes/pleins_textes_6/Mon_hydr/25393.pdf (accessed on 19 November 2021).
  48. De Chautagne, L. Fiche Descriptive Sur Les Zones Humides Ramsar (FDR). 2007. Available online: https://rsis.ramsar.org/RISapp/files/RISrep/TN1707RIS.pdf (accessed on 2 June 2022).
  49. Ebodé, V.B. Variabilité Hydropluviométrique en Afrique Centrale Occidentale Forestière: Entre Analyse des Fluctuations Observées, Modélisation Hydrologique Prédictive et Recherche des Facteurs Explicatifs. Ph.D. Thesis, University of Yaounde 1, Yaoundé, Cameroon, 2020. [Google Scholar]
  50. Oslisly, R. Les traditions culturelles de l’Holocène sur le littoral du Cameroun entre Kribi et Campo. Grundlegungen. Beiträge Zur Eur. Afr. Arch. Manfred KH Eggert 2006, 303–317. Available online: https://horizon.documentation.ird.fr/exl-doc/pleins_textes/divers17-01/010059679.pdf (accessed on 10 April 2022).
  51. Suchel, J.B. Rainfall patterns and regimes rainfall in Cameroon. Doc. Geogr. Trop. 1987, 5, 287. [Google Scholar]
  52. Mena, M.S.; Tchawa, P.; Amougou, J.A.; Tchotsoua, M. Les changements climatiques à travers la modification du régime pluviométrique dans la région de Kribi (1935–2006). Rev. Ivoire. Sci. Technol. 2016, 28, 389–407. Available online: https://revist.net/REVIST_28/REVIST_28_23.pdf (accessed on 24 May 2022).
  53. Lienou, G. Impacts de la Variabilité Climatique sur les Ressources en eau et les Transports de Matières en Suspension de Quelques Bassins Versants Représentatifs au Cameroun. Ph.D. Thesis, Université De Yaoundé I, Yaoundé, Cameroon, 2007. [Google Scholar]
  54. PAK. Projet De Port En Eau Profonde De Kribi: Études Hydro-Sédimentaires (Lot n°7), Rapport N°4–V1; Kribi Sea Port: Kribi, Cameroon, 2015. [Google Scholar]
  55. Keugne Signe, E.R. Gestion de L’érosion Côtière sur le Littoral Sud du Cameroun. Master’s Thesis, Département De Géographie, Université De Liège, Liege, Belgium, 2018. [Google Scholar]
  56. BIRD, E.C.F. Coastal Geomorphology: An Introduction; John Wiley and Sons Ltd: Chichester, UK, 2007. [Google Scholar]
  57. Morin, S.; Kuété, M. Le littoral camerounais: Problèmes morphologiques. In Travaux De Laboratoire De Géographie Physique Appliquée; Institut de Géographie–Bordeaux III: Bordeaux, France, 1988. [Google Scholar]
  58. Almar, R.; Kestenare, E.; Reyns, J.; Jouanno, J.; Anthony, E.J.; Laibi, R.; Ranasinghe, R. Response of the Bight of Benin (Gulf of Guinea, West Africa) coastline to anthropogenic and natural forcing, Part1: Wave climate variability and impacts on the longshore sediment transport. Cont. Shelf Res. 2015, 110, 48–59. [Google Scholar] [CrossRef]
  59. Ondoa, G.A.; Onguéné, R.; Eyango, M.T.; Duhaut, T.; Mama, C.; Angnuureng, D.B.; Almar, R. Assessment of the Evolution of Cameroon Coastline: An Overview from 1986 to 2015. J. Coast. Res. 2018, 81, 122–129. [Google Scholar] [CrossRef]
  60. Parker, B. Where is the shoreline? The answer is not as simple as one might expect. Hydrointernational 2001, 5, 6–9. [Google Scholar]
  61. Baulig, H. Vocabulaire Franco-Anglo-Allemand De Géomorphologie; Fascicule 130; Société D’édition Les Belles Lettres: Paris, France, 1956. [Google Scholar]
  62. Shom. Available online: http://observatoires-littoral.developpement-durable.gouv.fr/qu-est-ce-que-le-trait-de-cote-r25.html (accessed on 25 July 2021).
  63. Bird, E.C.F.; Schwartz, M.L. (Eds.) The World’s Coastline; Van Nostrand Reinhold: New York, NY, USA, 1985; p. 1071. [Google Scholar]
  64. Thieler, E.R.; Himmelstoss, E.A.; Miller, T. Digital Shoreline Analysis System (DSAS) Version 3.0: An ArcGIS Extension for Calculating Shoreline Change; U.S. Geological Survey Open-File Report; USGS: Reston, VA, USA, 2005; p. 1304. [Google Scholar]
  65. Himmelstoss, E.A.; Rachel, E.H.; Meredith, G.K.; Amy, S.F. Digital Shoreline Analysis System (DSAS) Version 5.0 User Guide; No. 2018–1179; US Geological Survey: Reston, VA, USA, 2018. [Google Scholar]
  66. Addo, K.; Appeaning, P.N.; Quashigah, J.; Kufogbe, K.S. Quantitative analysis of shorelinchange using medium resolution satellite imagery in Keta, Ghana. Mar. Sci. 2011, 1, 1–9. [Google Scholar] [CrossRef]
  67. Bird, E.C. Coastal erosion and rising sea-level. In Sea-Level Rise and Coastal Subsidence; Springer: Dordrecht, The Netherlands, 1996; pp. 87–103. [Google Scholar]
  68. Jamont, M.F. Etude Des Aléas Naturels Sur Le Sud Vendée Et Marais Poitevin; Rapport De Phase 2 Caractérisation Des Aléas De Référence. 2014. Available online: www.vendee.gouv.fr/IMG/pdf/Rapport_Phase_2.pdf (accessed on 10 September 2021).
  69. Fletcher, C.H.; Romine, B.M.; Genz, A.S.; Barbee, M.M.; Dyer, M.; Anderson, T.R.; Lim, S.C.; Vitousek, S.; Bochicchio, C.; Richmond, B.M. National Assessment of Shoreline Change: Historical Shoreline Change in the Hawaiian Islands; U.S. Geological Survey OpenFile Report; USGS: Reston, VA, USA, 2011; p. 1051. [Google Scholar]
  70. Port Autonome de Kribi. Etudes Environnementales (Dont Étude Hydro-Sédimentaire) et Élaboration des Plans de Préservation du Port Autonome de Kribi; R2–Scénarios D’évolution des Écosystèmes en Fonction des Facteurs Externes N° 47267, Activité 2, Rapport D’étude; Port Autonome de Kribi: Kribi, Cameroon, 2021. [Google Scholar]
  71. Koffi Koffi, P.; Yao Kouadio, S.; Abe, J.; Hauhouot, C.; Bamba Siaka, B. Quelles perspectives face à la dynamique préoccupante des plages d’assouindé valtour et du club nautique, respectivement au sud-est et au sud-ouest de la Côte d’Ivoire. In Proceedings of the XIIIèmes Journées Nationales Génie Côtier–Génie Civil, Dunkerque, France, 2–4 July 2014; Available online: http://www.paralia.fr (accessed on 20 July 2022). [CrossRef]
  72. Sagne, P.; Ba, K.; Fall, B.; Youm, J.P.M.; Faye, G.; Sarr, J.P.G.; Sow, E.H. Cartographie De La Dynamique Historique Du Trait De Côte Des Plages De Guédiawaye Et Malika (Dakar, Sénégal). Eur. Sci. J. 2021, 17, 214. [Google Scholar] [CrossRef]
  73. Konan, E.K.; Jacques, A.; Kouamé, A.; Urs, N.; Jan, N.; André, O. Impacts des houles exceptionnelles sur le littoral ivoirien du Golfe de Guinée. Géomorphol. Relief Process. Environ. 2016, 22, 11241. [Google Scholar] [CrossRef]
  74. Faye, I. Dynamique Du Trait De Côte Sur Les Littoraux Sableux De La Mauritanie A La Guinée-Bissau (Afrique De L’Ouest): Approches Régionale Et Locale Par Photo-Interprétation, Traitement D’images Et Analyse De Cartes Anciennes. Ph.D. Thesis, Université De Bretagne Occidentale, Brest, France, 2010. [Google Scholar]
  75. Mouyalou, V.M.T. Morphosedimentary Dynamic of a Sandy Beach: From Lycee Léon Mba (Libreville) to La Sablière (Akouango Bay). Ph.D. Thesis, Université Omar Bongo, Libreville, Gabon, 2017. [Google Scholar]
  76. Fangue, N.H.; Tonye, E.; Akono, A.; Ozer, A. Estimation de la vitesse de recul de la ligne du rivage par télédétection sur le rivage Kribien. In Proceedings of the IXèmes Journées Scientifiques du Réseau Télédétection de l’AUF, Yaoundé, Cameroun, 29 November–2 December 2001. [Google Scholar]
  77. Cambers, G. Caribbean beach changes and climate change adaptation. Aquat. Ecosyst. Health Manag. 2009, 12, 168–176. [Google Scholar] [CrossRef]
  78. Kwassi, A.L. Contribution A L’étude Des Populations Rurales De La Zone Côtière Du Togo. Master’s Thesis, University of Lomé, Togo, 2000. [Google Scholar]
  79. PNUE. Érosion Cor/Ere En Afrique De Ouest Et Du Centre; Collaboration des Nations Unies et de UNESCO: Paris, France, 1985. [Google Scholar]
  80. Diop, E.; Soumare, A.; Diallo, N.; Guissé, A. Dynamique De La Mangrove Des Iles Du Gandoul Occidental (Du Nord De L’île De Guissanor Au Sud Du Bôlon De Niodior, Saloum/Sénégal); Rapport Final De l’EPEEC-8; Cyber Geo: Brussels, Belgium, 1996. [Google Scholar]
  81. Kouekam Kengap, A.; Fowe Kwetche, P.G.; Togue Kamga, F.; Ngueguim, J.R.; Dingong Atoukoh, T.G. Importance Des Paramètres Hydrodynamiques Dans La Répartition Spatiale Des Sédiments Superficiels Des Plages De Limbe (Sud-Ouest Cameroun). 2019. Available online: https://core.ac.uk/reader/236411710 (accessed on 5 March 2022).
  82. Kuété, M.; Assongmo, T. Développement contre Environnement sous les Tropiques: L’exemple du littoral de la région de Kribi (Cameroun). Cah. D’outre Mer. 2002, 55, 279–306. [Google Scholar] [CrossRef]
  83. Cesaraccio, M.; Thomas, Y.-F.; Diaw, A.-T.; Ouegnimaoua, L. Impact des activités humaines sur la dynamique littorale: Prélèvements de sables sur le site de Pointe Sarène, Sénégal/Impact of sand extractions on coastal dynamics (Sarène Point beach, Senegal). Géomorph. Relief Process. Environ. 2004, 10, 55–63. [Google Scholar] [CrossRef]
  84. Ndour, N.; Dieng, S.; Fall, M. Rôles des mangroves, modes et perspectives de gestion au Delta du Saloum (Sénégal). Vertigo Rev. Électron. Sci. L’environ. 2012, 11. [Google Scholar] [CrossRef]
  85. Ackermann, G.; Alexandre, F.; Andrieu, J.; Mering, C.; Ollivier, C. Dynamique des paysages et perspectives de développement durable sur la petite côte et dans le delta du Sine–Saloum (Sénégal). Vertigo Rev. Électron. Sci. L’environ. 2006, 7. [Google Scholar]
  86. Sangne, C.; Barima, Y.; Bamba, I.; N’Doumé, C.T. Dynamique forestière post-conflits armés de la Forêt classée du Haut-Sassandra (Côte d’Ivoire). Vertigo Rev. Électron. Sci. L’environ. 2015, 15. [Google Scholar] [CrossRef]
  87. Merckelbagh, A. Et Si Le Littoral Allait Jusqu’à La Mer: La Politique Du Littoral Sous La Ve République; Éditions Quae: Paris, France, 2009. [Google Scholar]
  88. Fongnzossié, F.E.; Sonwa, D.J.; Kemeuze, V.; Mengelt, C.; Nkongmeneck, B. Assessing Climate Change Vulnerability And Local Adaptation Strategies in the Kribi-Campo Coastal Ecosystems, South Cameroon; Urban Climate: Amsterdam, The Netherlands, 2018. [Google Scholar]
  89. Otmani, H.; Belkessa, R.; Rabehi, W.; Guerfi, M.; Boukhdiche, W. Dégradation des dunes côtières algéroises entre pression de l’urbanisation et conséquences sur l’évolution de la ligne de rivage. GeoEcoMarina 2019, 25, 131–145. [Google Scholar]
  90. Tarik, G.; Bouziane, S. Urbanisation côtière en Algérie, Processus et impacts sur l’environnement: Le cas de la baie d’Aïn el Turck. Études Caribéennes 2010, 15, 4431. [Google Scholar] [CrossRef]
  91. Saha, F.; Tchindjang, M. Dynamique spatiale de la ville de Kribi: Facteurs et conséquences. In Construire La Ville Portuaire De Demain En Afrique Atlantique; Tchindjang, M., Steck, B., Bouopda, A., Eds.; Edition EM: Paris, France, 2019; pp. 148–164. Available online: https://www.researchgate.net/profile/Frederic_Saha/publication/332445874_Chapitre_6_Dynamique_spatiale_de_la_ville_de_Kribi_facteurs_et_consequences/links/5f34e53ea6fdcccc43c5b101/Chapitre-6-Dynamique-spatiale-de-la-ville-de-Kribi-facteurs-et-consequences.pdf (accessed on 10 May 2019).
  92. Guyomarc’h, J.P.; Le Foll, F. Milieux Côtiers, Ressources Marines Et Société; Ceser Bretagne. 2011. Available online: https://www.bretagne.bzh/upload/docs/application/pdf/201112/milieux_cotiers_ressources_marines_et_societe_internet_light_2011-12-07_10-15-49_709.pdf (accessed on 14 July 2022).
  93. MINEPAT; PCFC. Rapport Final De L’étude D’impact Environnemental Et Social Sommaire Du Projet D’aménagement Et D’électrification De La Plage De Ngoye-Kribi A Des Fins Touristiques; Ministère de la L’économie, de la Planification et de L’aménagement du Territoire: Yaoundé, Cameroon, 2016. [Google Scholar]
  94. Tchindjang, M.; Éwolo Onana, Z.; Mahend, E.; Mbohou, S. Tourisme et création d’emplois au Cameroun: Mythe, utopie, panacée ou réalité. In Repenser La Promotion Du Tourisme Au Cameroun: Approches Pour Une Redynamisation Stratégique; Kamdem, P., Tchindjang, M., Eds.; Linx: Paris, France, 2011; pp. 315–358. [Google Scholar]
  95. Tchindjang, M.; Etoga, M.H. The Lobé Waterfall, an exceptional geocultural heritage on the coast of Cameroon between sustainable tourism and the conservation of cultural identities. Via. Tour. Rev. 2014, 5, 964. Available online: https://journals.openedition.org/viatourism/951 (accessed on 29 March 2022). [CrossRef]
  96. Sigha-Nkamdjou, L.; Sighomnou, D.; Liénou, G.; Ndam Ngoupayou, J.R.; Bello, M.; Kamgang, G.R.; Servat, E. Impacts des modifications climatiques et anthropiques sur les flux de matières de quelques bassins fluviaux du Cameroun. Sediment Budg. 2005, 2, 291–298. [Google Scholar]
  97. Masselink, G.; Russell, P. Impacts of climate change on coastal erosion. MCCIP Sci. Rev. 2013, 71–86. [Google Scholar]
  98. Toimil, A.; Camus, P.; Losada, I.J.; Cozannet, G.L.; Nicholls, R.J.; Idier, D.; Maspataud, A. Climate change-driven coastal erosion modelling in temperate sandy beaches: Methods and uncertainty treatment. Earth Sci. Rev. 2020, 202, 103110. [Google Scholar] [CrossRef]
  99. Cai, F.; Su, X.; Liu, J.; Li, B.; Lei, G. Coastal erosion in China under the condition of global climate change and measures for its prevention. Prog. Nat. Sci. 2009, 19, 415–426. [Google Scholar] [CrossRef]
  100. Masselink, G.; Russell, P.; Rennie, A.; Brooks, S.; Spencer, T. Impacts of climate change on coastal geomorphology and coastal erosion relevant to the coastal and marine environment around the UK. MCCIP Sci. Rev. 2020, 2020, 158–189. [Google Scholar]
Figure 1. Location map of the study area.
Land 11 01557 g001
Figure 2. Geological structure of the Kribian coast (Source: adapted from Oslisly [38]). Caption: (1) yellow ferralitic soils showing a high level of acidity, with a degree of saturation varying from 15 to 20% at the surface and less than 10% at depth. (2) Soils on gneiss and lateritic schists, composed of highly leached humus sand and red sandy clay on lateritic schists. (3) Hydromorphic soils rich in organic matter, which generally lie alongside the banks of rivers and marshy and mangrove areas (mouth of the Ntem). (4) Mobile granite zones; (5) sedimentary basin; (C) overlaps; (D) dolerites; (F) main faults.
Land 11 01557 g002
Figure 3. Kribi elevation profile, generated from the Digital Terrain Model (DTM).
Land 11 01557 g003
Figure 4. Kribian types and morphotypes of the coast. These figures show an alternation between sandy low coast (flat and concave morphotype profiles) and rocky coast (stepped profile).
Land 11 01557 g004
Figure 5. The Lobé waterfalls, Kribi coast, and the Kienké flowing to the sea by small waterfalls under the bridge at the Kribi landing stage (Credit: Mbevo, August 2018 and Tchindjang, July 2017).
Land 11 01557 g005
Figure 6. Evolution of land use on the Kribi-Campo coast between 2000 and 2020.
Land 11 01557 g006
Figure 7. Dynamics of the different land use classes between 2000–2020.
Land 11 01557 g007
Figure 8. Onbrothermal diagram of Kribi.
Land 11 01557 g008
Figure 9. Coastal drift and sediment transport on a portion of the Kribi coast (Source: [54]).
Land 11 01557 g009
Figure 10. Speed of currents affecting the Kribi coastline (Source: [54]).
Land 11 01557 g010
Figure 11. Sediment transport by littoral drift on the Kribi coast (Source: Kribi sea port [54]).
Land 11 01557 g011
Figure 12. Bathymetric configuration of the Kribi coastline (Source: DEM and digitized navionic bathymetric map).
Land 11 01557 g012
Figure 13. Flow Chart of tools and techniques used in assessing the Kribian coastal dynamic.
Land 11 01557 g013
Figure 14. Rate of change (meters per year) in Kribi coastal erosion between 1973–2000. The figure was obtained with DSAS, from the linear extracted from Landsat images. The coastlines are divided into 1909 transects separated by 50 m. The cartographic representation is on the left. The graphic representation is on the right, with the number of transects on the ordinate axis, and the EPR in m/year on the abscissa axis.
Land 11 01557 g014
Figure 15. Coastal erosion on the Kribi coast in EPR (m/year) between 2000 and 2015 obtained with DSAS, through linear data extracted from Landsat images.
Land 11 01557 g015
Figure 16. Coastal erosion on the Kribi coast with respect to speed (meters per year) between 2015 and 2020 obtained with DSAS, from linear data extracted from Landsat images.
Land 11 01557 g016
Figure 17. Coastline dynamics in Kribi between 2013 and 2016, obtained with DSAS from linear extracts of Pleiades images. Coastlines were divided into 463 transects separated by 50 m each; on the left, there is a cartographic representation, and a graphic representation is on the right, with the number of transects on the ordinate and the EPR in m/year on the abscissa.
Land 11 01557 g017
Figure 18. Coastline dynamics in Kribi between 2016 and 2019 from Pleiades images (2016–2019) and a Google Earth aerial photo (2017) (the Southern part corresponds to transect 1).
Land 11 01557 g018
Figure 19. Construction of a protective dyke at the Lobé waterfalls in Kribi. (Credit: Mbevo, 2017; Tchindjang, 2013).
Land 11 01557 g019
Figure 20. Coastal Erosion at work on the Kribi coastline and ineffective local response measures (Source: CUK 2015).
Land 11 01557 g020aLand 11 01557 g020b
Figure 21. Google Earth aerial photo of the PAK in 2017 showing fattening south of the port and thinning to the north, where the beach has disappeared, and the forest has begun to be attacked by waves at high tide. The littoral drift runs from south to north and is interrupted by the dyke, generating this situation.
Land 11 01557 g021
Figure 22. Landsat satellite images from 2004 on the left and from 2020 on the right show the deforestation induced by the construction of the PAK on the Kribi coastal environment.
Land 11 01557 g022
Figure 23. Artisanal and industrial sand extraction on the Kribi coast. (Credit: Mbevo, May 2019, Tchindjang, March 2013). This photo board confirms the significant extraction of sand on the Kribi coast.
Land 11 01557 g023aLand 11 01557 g023b
Figure 24. Land pressure on the coast in Kribi. The photo on the left shows the foundation of a private hotel in Kribi, directly built on the coastline (titled land—feet in the water—for sale). The photo on the right was taken −10 m from the shoreline. Indeed, since the entry into office of the PAK, there has been a major land race in this city, which has become the new growth pole of Cameroon. Land sales are multiplying, even in the private domain of the state, and advertisements are multiplying on the internet. The 2008 state law prohibiting the occupation of land 50 m from the coastline has thus been flouted.
Land 11 01557 g024
Table 1. Characteristics of processed Landsat images.
DatePath and RowResolution RadiometrySensorSeasonPurpose
1973/11/27LM03_L1TP_201 05730 m8 bitsMssDryExtraction of the coastline
2000/11/6LE7 186 05730 m8 bitsETMDryExtraction of the coastline and Land use classification
2015/02/01LE7 186 05630 m8 bitsETMDryExtraction of the coastline and Land use classification
2020/02/21LC08 187 05730/15 m16 bitsL8/OLIDryExtraction of the coastline and Land use classification
Table 2. Characteristics of the processed Pleiades images.
PropertiesCharacteristics
AreaKribi Pleiades Images 1
Image capture date15 June 2013
Spatial Resolution0.5 m
SensorPleiades
IDDS_PHR1B_201306150956399_SE1_PX_E009N02_1118_01728
AreaKribi Pleiades Images 2
Image capture date12 March 2016
Spatial Resolution0.5 m
SensorPleiades
IDDS_PHR1A_201603120955019_FR1_PX_E009N02_1120_03618
AreaKribi Pleiades Images 3
Image capture date23 February 2019
Spatial Resolution0.5 m
Sensor Pleiades
IDDS_PHR1A_201902231003214_FR1_PX_E009N02_1015_03204
KribiGoogle Earth Images 1 and 2
Image capture date23/11/2015 and 03/05/2017
Spatial Resolution 0.5 m
Table 3. Errors related to the erosion model on the Kribi coast.
Years1973–20002000–20152015–20201973–2020
Pixel error (Ep) 25//
RMS ortho-rectification (ERMs) 15221211
Digitalization error (Ed) 715//
Planimetric error (EP) /2323/
Total error (Et) 15381014
Measured errors (Em) (m) 42563029
Annual error (Ea) (m/45 years) /0.65/0.65
Uncertainties in Calculations (ECI) (m/year) 27.20.520.43
Source: Statistical calculations in DSAS.
Publisher’s Note: MDPI stays neutral with regard to jurisdictional claims in published maps and institutional affiliations.

