Article

Modelling of Water and Nitrogen Flow in a Rain-Fed Ridge-Furrow Maize System with Plastic Mulch

1
Key Laboratory of Plant Nutrition and the Agri-Environment in Northwest China, Ministry of Agriculture, College of Resources and Environment, Northwest A&F University, Yangling 712100, China
2
College of Civil and Architecture Engineering, Chuzhou University, Chuzhou 239000, China
*
Author to whom correspondence should be addressed.
Land 2022, 11(9), 1514; https://doi.org/10.3390/land11091514
Submission received: 30 July 2022 / Revised: 3 September 2022 / Accepted: 7 September 2022 / Published: 8 September 2022
(This article belongs to the Special Issue Status in Agricultural Soil Pollution and Its Controls)

Abstract

:
Soil water and nitrogen are two important factors in the agro-ecosystem of the Loess Plateau, China. The ridge-furrow maize system with plastic mulch (RFPM) is a widely used measure to increase crop yield in the Loess Plateau area. The purpose of this study was to investigate the effect of the RFPM on soil water and inorganic nitrogen (N) distribution, especially with regard to the risk and dynamic of nitrogen losses, by using Hydrus-2D. The study was conducted over two consecutive years and consisted of two treatments: (i) the RFPM with the split application of nitrogen in 2013 (160 + 60 kg N ha−1, sowing and jointing stage) and (ii) the RFPM with a one-time fertilizer in 2014 (220 kg N ha−1, sowing stage). The results showed that the dynamic of soil water and nitrogen was clearly illustrated by Hydrus-2D, especially with regard to the nitrogen losses and utilization. The RFPM improved soil water consumption in both the ridge and the furrow; the soil water content was obviously fluctuating during the maize growing season, and the degree of fluctuation decreased as the depth increased. The soil N H 4 + -N concentration was mainly accumulated in the surface soil layer +15–10 cm; the highest N H 4 + -N concentrations were 69.12 and 104.62 mg·kg−1 in 2013 and 2014, respectively. The highest N O 3 -N concentrations were 130.86 and 198.20 mg·kg−1 in 2013 and 2014, respectively. There was an exchange of N O 3 -N between the ridge and the furrow when urea was applied in the furrow. The one-time fertilizer caused a high risk of NH3 volatilization; they were 20.40 and 27.41 kg N ha−1 in 2013 and 2014, respectively, which accounted for 9.27% and 12.46% of the N fertilizer inputs in 2013 and 2014, respectively. The rate of nitrite leaching was higher in the furrow than the ridge. However, a proper ratio of the split application of nitrogen would contribute to the N O 3 -N leaching reduction; the N O 3 -N leaching amounts were 18.13 and 31.26 kg N ha−1, which accounted for 8.24% and 14.21% of the N fertilizer inputs in 2013 and 2014, respectively. Our study indicates, therefore, that the RFPM with a split application of nitrogen would be more effective for the nitrogen losses; the RFPM is a suitable system for agriculture in the rain-fed area of the Loess Plateau, with the benefits of water-use efficiency and non-point source pollution reduction.

1. Introduction

Soil water and nitrogen movement in the agro-ecosystem is always a hot research area; it is known that crop yield is mainly affected by the availability of soil water and nitrogen, especially in arid and semi-arid areas [1]. With the development of rain-fed agriculture in the Loess Plateau, China, the soil water and nitrogen dynamic under different land use, tillage, and mulching measures are strongly affecting the agricultural production in this area [2]; it was found that water and nitrogen are the most important inputs for high grain yields in maize production in this area. Specifically, it is noted that high soil evaporation, limited and variable precipitation, and single excessive fertilization are three important factors which can result in low crop yields [3]. Knowledge of soil water and nitrogen contents and their distribution in the soil profile during the growing seasons is necessary in order to improve fertilizer management in agricultural fields and decrease environmental pollution [4], as well as to gain a better understanding of climate change and its feedback [5]; thus, a reasonable performance evaluation of the tillage and mulching measures can be provided.
Soil water content was always considered as a main factor in the work on the nitrogen losses and initial soil moisture conditions that could cause a high risk of NH3 volatilization in north China [6]. Precipitation is limited for the agricultural production; as the main water source for agriculture in this region [7], it determines the distribution of soil water content [8] and affects the NH3 volatilization and nitrite leaching [9]. Soil water stress would affect the NH3 volatilization; this was related to the evaporation; the soil water decreased with the increasing soil evaporation, which then enhanced the rate of diffusion of NH3 from the soil solution to the atmosphere [10]. N O 3 -N movement in the soil profile is mainly affected by the fertilization method and soil water infiltration. There are many other factors, such as soil structure, tillage measure, and amount and intensity of precipitation; these all have an effect on it [6]. In fact, a high risk of nitrate leaching was found under the effect of heavy rainfall as the soil water infiltration was the main driver of the nitrate leaching [11]. In order to improve water and nitrogenous fertilizer use efficiency, film mulch was developed and applied in the Loess Plateau, China [1,2,3]. It was found that mulching could improve the soil’s physical properties and protect the topsoil stability [12], resulting in increased absorption of N O 3 -N [13]; in addition, the mulching limits the vertical infiltration of precipitation, reducing the N O 3 -N leaching to the deeper layers [14]. The former study indicated that nitrate leaching in this area has been underestimated for many years with regard to the limited precipitation and thick soil layer [15]. A study has already found N O 3 -N accumulation in the vadose zone and groundwater in this area [6,16]. Therefore, nitrate leaching in north China cannot be ignored, and it could account for about 11% of the applied N, which results in a high risk of pollution of the deep soil layer and groundwater.
In the Loess Plateau, China, plastic film mulching is a common practice that is widely used in maize production [8]. Many studies have confirmed its’ effect on soil water retention [17], soil temperature increase, and crop growth enhancement [18], especially in arid and semi-arid areas. Theoretically, as film mulch increases crop growth, nitrogen-use efficiency is improved by the film mulch system. However, only film mulch was not sufficient due to its limited effect on soil water conversation and yield increase [3]. The ridge-furrow system with plastic mulch could increase soil water content and effective rainfall residence time; there is an appreciable effect on rain collection, and the degree increases with the amount of rainfall [3], thereby increasing crop yield and water-use efficiency, especially in arid and semi-arid areas [19]. So, it was highly recommended for maize cultivation in the Loess Plateau, China [2], but we should note that a full account needs to be taken of the environmental impact relating to nitrogen losses, in order to evaluate the sustainability of the ridge-furrow system with plastic mulch in this area.
In this study, a two-year experiment was conducted to study the soil water dynamic, the soil nitrogen transport, the transformation, and the losses under the ridge-furrow system with plastic film mulch. The modeling method was used for its benefit on the detailed information demonstration. Hydrus-2D was chosen due to its adaptability to various atmospheric boundary conditions, which were caused by the ridge-furrow system and film mulch. Soil water and nitrogen can be accurately simulate by this model, and there were successful application cases which were conducted in the Loess Plateau, China [20]. The objective was to assess the dynamic of the soil water and nitrogen and quantify the risk of nitrogen losses under the ridge-furrow system with plastic film mulch.

2. Materials and Methods

2.1. Study Area

Field experiments were conducted from 2013–2014 at the Changwu Agricultural and Ecological Experimental Station (35°12′ N, 107°40′ E, 940–1220 m asl) on the Loess Plateau of northwestern, China. It is a warm, temperate, semi-humid, continental monsoon climate. The average annual precipitation and temperature are 582 mm and 9.7 °C, respectively [20], and almost 73% of precipitation is concentrated from May to October. The rainfall levels during the maize growing season were 400.40 and 333.20 mm in 2013 and 2014, respectively (Figure 1).

2.2. Field Experiment and Monitoring

The recommended fertilizer rate was as follows: nitrogen fertilizer, 220 kg N ha−1. In 2013, 160 kg N ha−1 was applied in the ridge at the sowing stage; 60 kg N ha−1 was applied in the furrow at the jointing stage. In 2014, there was only a one-time fertilizing with urea, which was applied in both the ridge and the furrow. A total of 60 kg P ha−1 as calcium superphosphate (12% P2O5) and 75 kg K ha−1 as potassium sulfate (45% K2O) were applied simultaneously with the basal N fertilizer. A high-yielding maize hybrid (Pioneer 335) was selected for this study. The maize was planted at the end of April and harvested at the end of September. There was no irrigation during the maize growing season.
In 2013, the soil water content was measured at 1-day intervals using an ECH2O system (Decagon Devices); the sensors were installed at soil depths of 10, 30, 60, 100, and 160 cm. In 2014, the neutron moisture meter (CNC503DR) was used to measure the soil water content (for the accidental damage to the ECH2O system) every 20 days. Soil N O 3 -N and N H 4 + -N concentrations were determined by sampling from depths of 10, 30, 60, 100, and 160 cm. Nitrogen concentrations were measured using a Cleverchem Anna random access analyser (DeChem-Tech. GmbH Hamburg, Germany) after KCl extraction.
The partial soil hydraulic parameters were measured before the experiment, and there were five typical layers with +15–10, 10–30, 30–60, 60–100, and 100–160 cm. Soil bulk density, texture, and saturated hydraulic conductivity (Ks) were measured by the oven drying method, the pipette sampling method [21], and the falling-head method [22], respectively. The saturated water content (qs) was calculated by multiplying the saturated mass-based soil water content by the bulk density, and the saturated mass-based soil water content was measured by the oven drying method. Root depth and leaf area index were measured at the different maize growing stages; root depth was measured by dig methods from up to down; leaf area index was measured using an ACCUPAR LP-80 ceptometer (METER Group, Pullman, WA, USA); crop yields were calculated after the harvest stage.

2.3. Soil Water, Nitrogen Transport, Transformation and Loss Calculations

The Hydrus-2D was applied to calculate soil water, nitrogen transport, and transformation. Root water uptake and evapotranspiration were also considered in the calculation of the model as they could affect N leaching and NH3 volatilization. The N leaching and NH3 volatilization were calculated by using the boundary flux of the model. More information about the model follows.

2.3.1. Water Flow

The flow equation is given by the following modified form of the Richards’ equation:
θ t = x [ K ( h ) h x ] + z [ K ( h ) h z ] + K ( h ) x S
where θ is the volumetric water content (cm3·cm−3), t is the time (d), x is the horizontal axis (cm), K(h) is the hydraulic conductivity (cm·d−1), h is the pressure head (cm), and z is the vertical coordinate (cm).
S is the sink term of the water uptake by the maize roots; it was introduced by Feddes et al. [23]:
S = α ( h ) β ( z , t ) T p
α ( h ) is water stress, which was described by Feddes et al. [23]:
α ( h ) = { 0   h h 1   o r   h h 4   h h 1 h 2 h 1   h 2 h h 1 1       h 3 h h 2 h h 4 h 3 h 4   h 4 h h 3
where hi is the threshold parameters; they were adjusted from the model internal database (i.e., h1 = −10 cm, h2 = −25 cm, h3 = −200 cm, and h4 = −10,000 cm).
β ( z , t ) is the root density distribution function:
β ( z , t ) = [ 1 z Z m ] [ 1 x X m ] e ( P z Z m | z * z | + P x x m | x * x | )
where Xm is the maximum horizontal distance of the root distribution, Zm is the maximum depth of the root distribution which is set according to field observations, x* is the horizontal coordinates of the maximum root density (30 cm in this study), z* is the vertical coordinate of the maximum root density (25 cm in this study), and Pz and Px are empirical parameters of the root asymmetry, which are normally set to 1.0.
T p is the potential transpiration rate (cm·d−1), which is given below:
E T p = 1 λ [ Δ ( R n G ) Δ + γ ( 1 + r s / r α ) + ρ c p   ( e α e d ) / r α Δ + γ ( 1 + r s / r α ) ]
T p = E T p ( 1 e k · L A I )
E p = E T p · e k · L A I
where E T p is potential evapotranspiration, cm·d−1; λ is the vaporization heat from steam, MJ·kg−1; R n is net radiation, MJ·m−2·d−1; G is the soil heat flux, MJ·m−2·d−1; ρ is atmospheric density, kg·m−3; cp is air specific heat capacity at constant pressure, J·kg−1·°C−1; ea and ed are saturated vapor pressure and the actual water vapor pressure, kPa; rs is surface impedance; it is the impedance when the steam overcomes the evaporation from the soil surface and vegetation transpiration, s·m−1; ra is the aero-dynamic impedance; it is the impedance when the steam from the evaporation interfaces to the top air of the canopy, s·m−1; ∆ is the gradient of the function between saturation vapor pressure and temperature, kPa·°C−1; and γ is the moisture meter constant, kPa·°C−1. E p is the potential evaporation fluxes, mm·d−1; LAI is the leaf area index, and k is a constant governing the radiation extinction (0.6 in this study).
T a is the actual transpiration rate, which is related to the root domain.
T a = L r S d z = T p L r α ( h ) β ( z , t ) d z
where Lr is the root depth, which is set according to the field observations.

2.3.2. Nitrogen Transport and Transformations

The partial differential equations governing the two-dimensional non-equilibrium chemical transport of solutes involved in a sequential first-order decay chain during transient water flow in a variably saturated rigid porous medium are taken as:
Urea:
θ c w , 1 t = x ( θ D 1 c w , 1 z ) q c w , 1 z μ w , 1 θ c w , 1
N H 4 + -N (ammonium nitrogen):
β θ c w , 2 t + ρ c s , 2 t = z ( θ D 2 c w , 2 z ) q c w , 2 z + μ w , 1 θ c w , 1 ( μ w , 2 + μ w , 2 ) θ c w , 2 ( μ s , 2 + μ s , 2 ) ρ c s , 2 + γ w , 2 θ + γ s , 2 ρ S ( Z , t ) c w r , 2
N O 3 -N (nitrate nitrogen):
θ c w , 3 t = z ( θ D 3 c w , 3 z ) q c w , 3 z + μ w , 2 θ c w , 2 + μ s , 2 ρ c s , 2 ( μ w , 3 + μ s , 3 ) ρ c w , 3 S ( Z , t ) c w r , 3
where subscript number 1, 2, and 3 represent urea, ammonium nitrogen and nitrate nitrogen, respectively; w is the liquid, s is the solid phase, c is the nitrogen concentration (μg·cm−3), ρ is the soil bulk density (g·cm−3), D is the nitrogen dispersion coefficient (cm2·d−1), q is the volumetric water flux (cm·d−1), μ and μ′ represent the first-order nitrogen transformation rate constant, γ is the zero-order nitrogen transformation rate constant (μg·cm−3·d−1).
cwr is the nitrogen concentration taken up by maize roots, which is associated with root water uptake:
c w r ( z , t ) = min [ c ( z , t ) , c m a x ]
where c m a x is the defined maximum concentration of the root uptake. Considering only the passive uptake will likely underestimate the total nitrogen uptake. By integrating the passive nutrient uptake over the root domain, Pa, the passive root nitrogen uptake (μg·cm−2·d−1) is given as [24]:
P a ( t ) = T p L r α ( h ) β ( z , t ) min [ c ( z , t ) , c m a x ] d z

2.3.3. Model Parameters

The soil hydraulic parameters (θs, θr, Alpha, n) were optimized through inverse solutions by using the measured data of 2013. The original soil hydraulic parameters used in Hydrus-2D were measured or estimated from the soil texture and bulk density before sowing. The calibrated parameters are shown in Table 1.
The nitrogen transport and transformation parameters are shown in Table 2. They refer to those formerly studied [25,26,27], which confirms their accuracy and reliability. The observed data of 2014 were used to validate the model performance without changing the calibrated parameters.

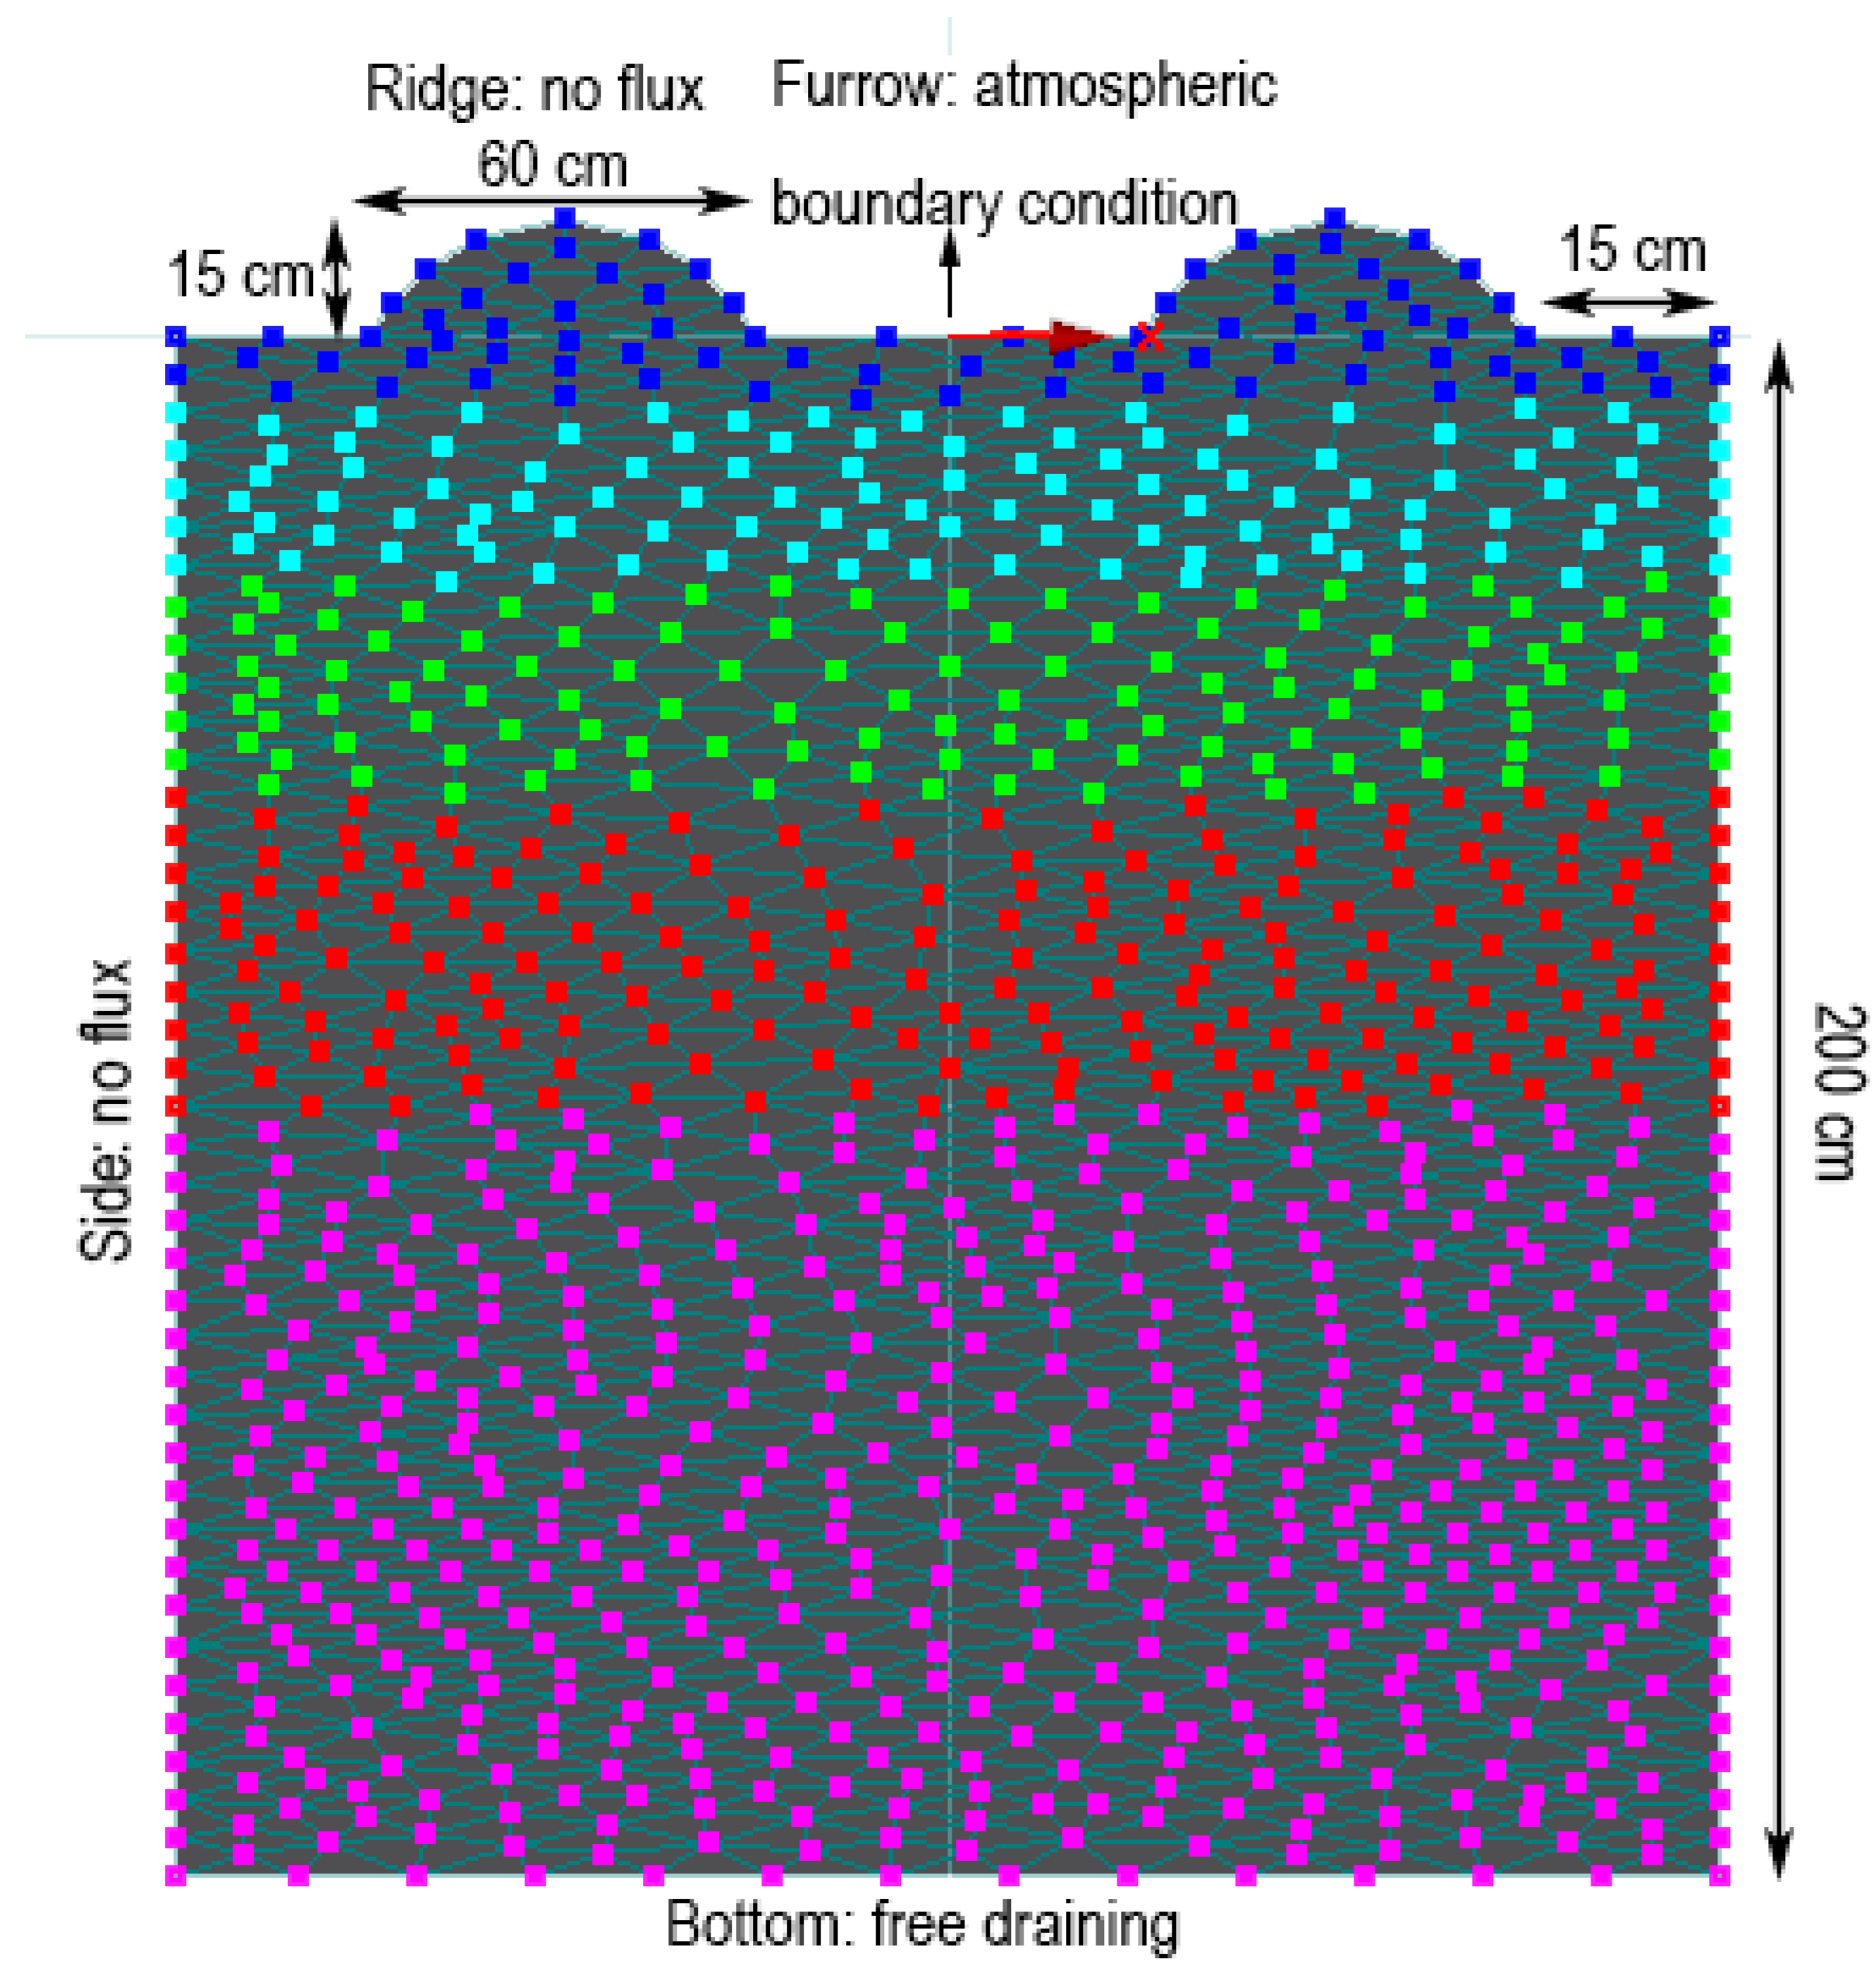
2.4. Initial Conditions and Time-Variable Boundary Conditions

A two-dimension symmetric vertical soil profile was simulated in this study, and it was classified into five layers according to soil characteristics. The initial soil water content and nitrogen concentration of the soil profile were determined before maize planting in every growing season. At the furrow soil surface, the upper boundary condition was imposed using the atmospheric data of precipitation, soil evaporation, and plant transpiration; the ridge soil surface was set as no flux for the ridge-furrow system with plastic mulch. At the bottom of the domain, a free drainage condition was used at the bottom of the domain as the groundwater level (>60 m depth) was located far below the simulated soil profile. Figure 1 demonstrates the model domain for the simulation of soil water and nitrogen flow in the ridge-furrow maize system with plastic mulch.

2.5. Statistical Analysis

The data were analyzed using Microsoft Excel 2019. Origin (Version 9.0; Origin Lab Corporation, Northampton, MA, USA) was used to generate the graphs.
The available measured data were used in the calibration and evaluation processes, and Hydrus-2D was conducted for the entire of the two growing seasons. Optimizing efficiency or model efficiency was evaluated by the root mean square errors (RMSEs) and Nash–Sutcliffe modeling efficiency (NSE):
R M S E = 1 n i = 1 n ( S i M i ) 2
N S E = 1 i = 1 n ( M i S i ) 2 / i = 1 n ( M i M ) 2
where n is the number of measured data; Si and Mi are simulated and measured values, respectively; and M is the average value of the measured data. The closer the RMSE is to 0 and the closer the NSE is to 1, the more accurate the simulations.

3. Results

3.1. Dynamic Change of Soil Water Content under the Effect of Film Mulch

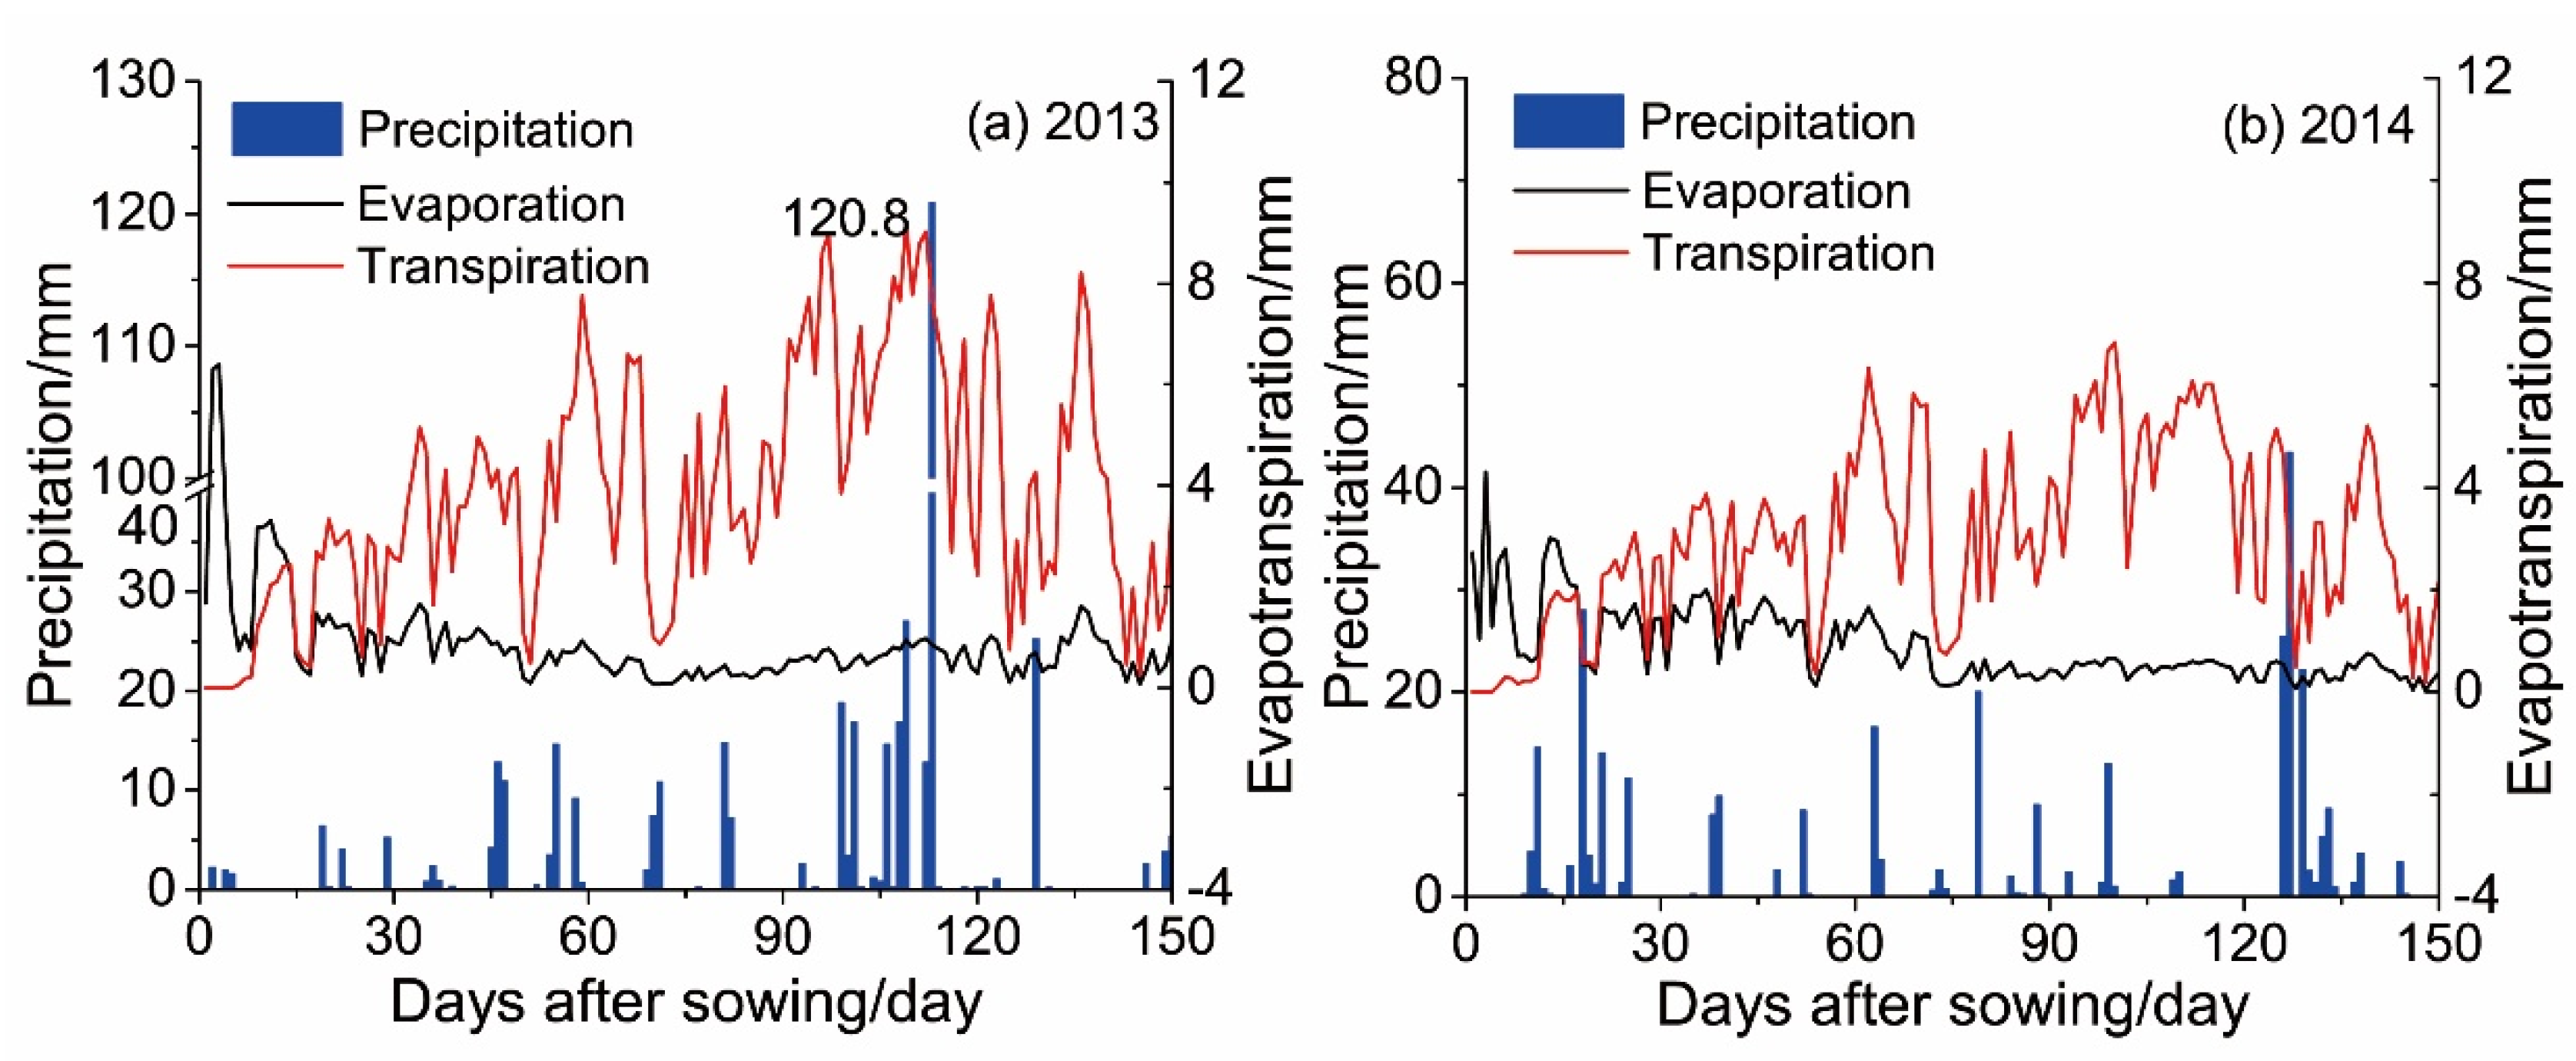
3.1.1. Precipitation and Evapotranspiration during the Two Growing Seasons

Precipitation and evapotranspiration are highly related to soil water and nitrogen flux in this area (Figure 2); these data indicated that the soil water and plant growth conditions were different in the two growing seasons. In this study, the precipitation levels were 400.40 and 333.20 mm in 2013 and 2014, respectively, and there was an obvious heavy rainfall in 2013 with 120.80 mm (Figure 2). The precipitation can be divided into three different stages according to its characteristics in both 2013 and 2014. The first stage was 0 to 30 days after sowing; the rainfall in 2014 was higher than that in 2013 during this period; then, 30 days to 90 days after sowing, the precipitation increased and was stable in 2013. The effective rainfall frequency decreased in 2014. The last stage was 90 days to harvest; the precipitation was obviously higher in 2013 than in 2014, especially in the early days during this stage. The filling stage also happened in this period, when the maize consumed large amounts of water.
The evapotranspiration was also separated into three stages according to the precipitation characteristics. In the first stage, it consisted by soil evaporation and plant transpiration; they were 54.10 and 46.17 mm in 2013, respectively (Figure 2a); they were 49.29 and 37.33 mm in 2014, respectively (Figure 1). In the second period, it mainly consisted of plant transpiration; the plant transpiration was higher in 2013 than in 2014; the plant transpirations were 229.17 and 186.08 mm in 2013 and 2014, respectively; the soil evaporation levels were 34.25 and 56.34 mm, respectively (Figure 2). Similarly, in the last stage, the higher plant transpiration, the lower the soil evaporation; the plant transpirations were 305.07 and 230.05 mm in 2013 and 2014, respectively; the soil evaporations were 38.98 and 25.73 mm, respectively (Figure 2).

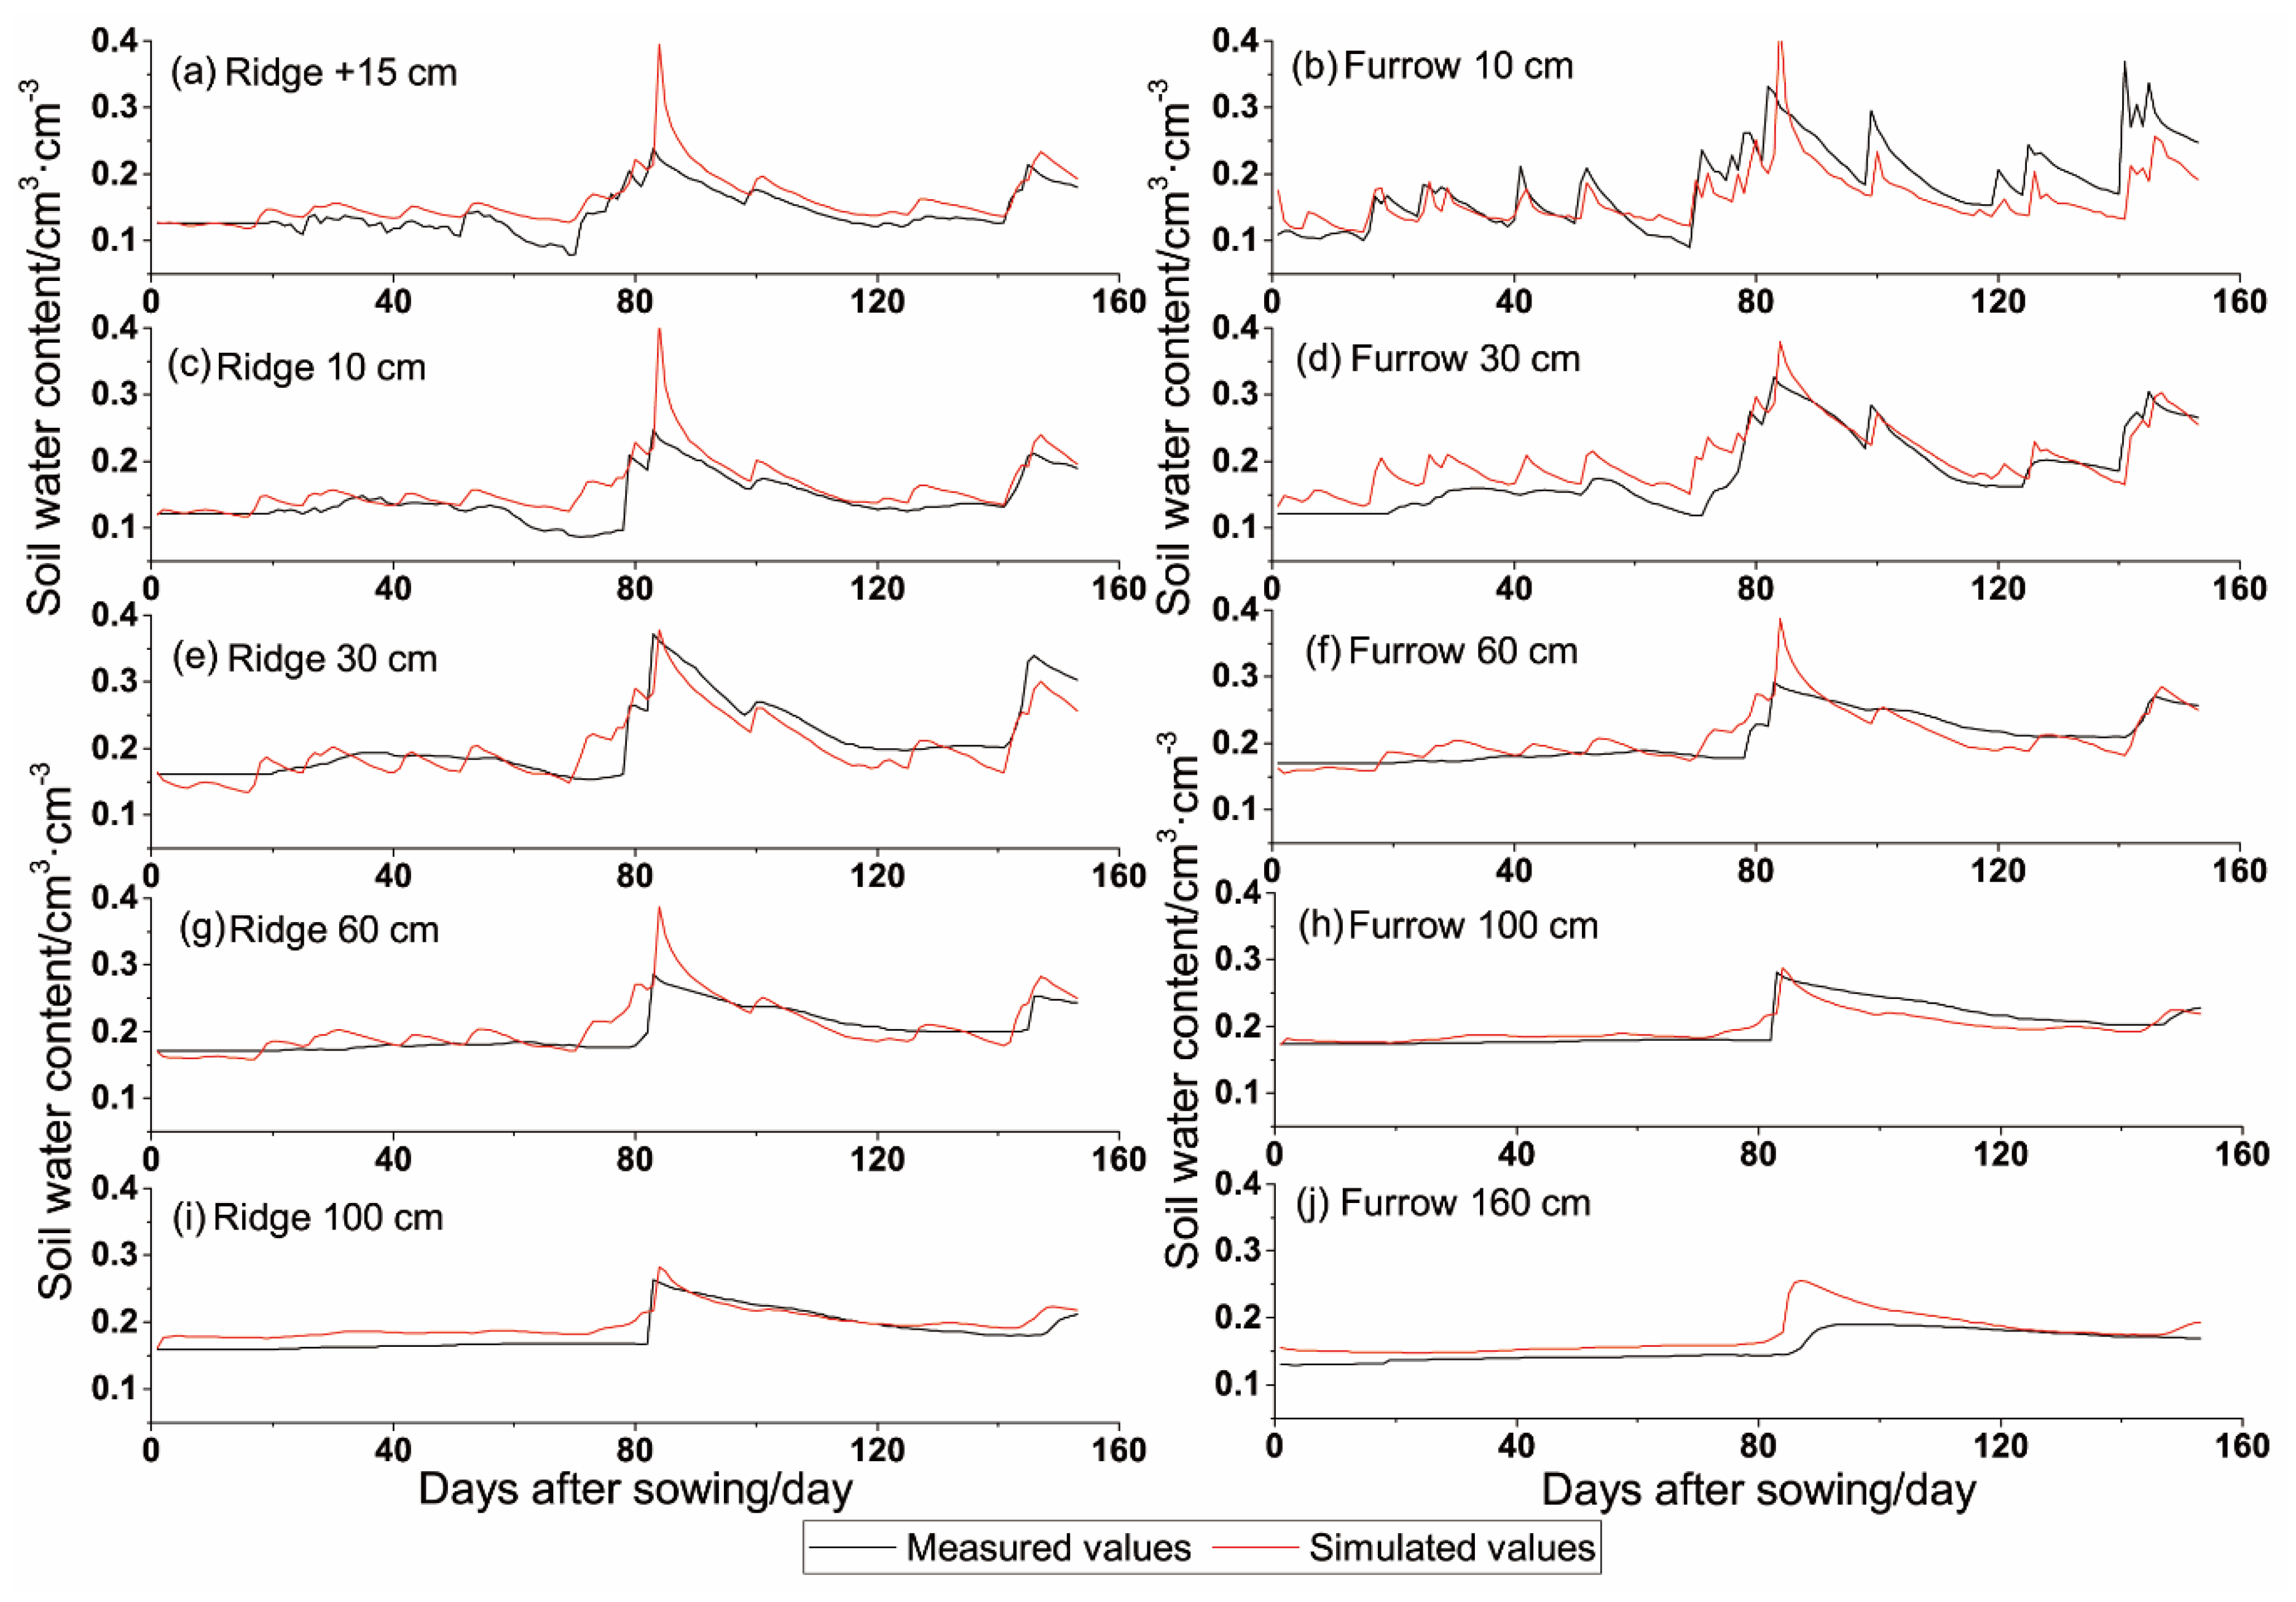
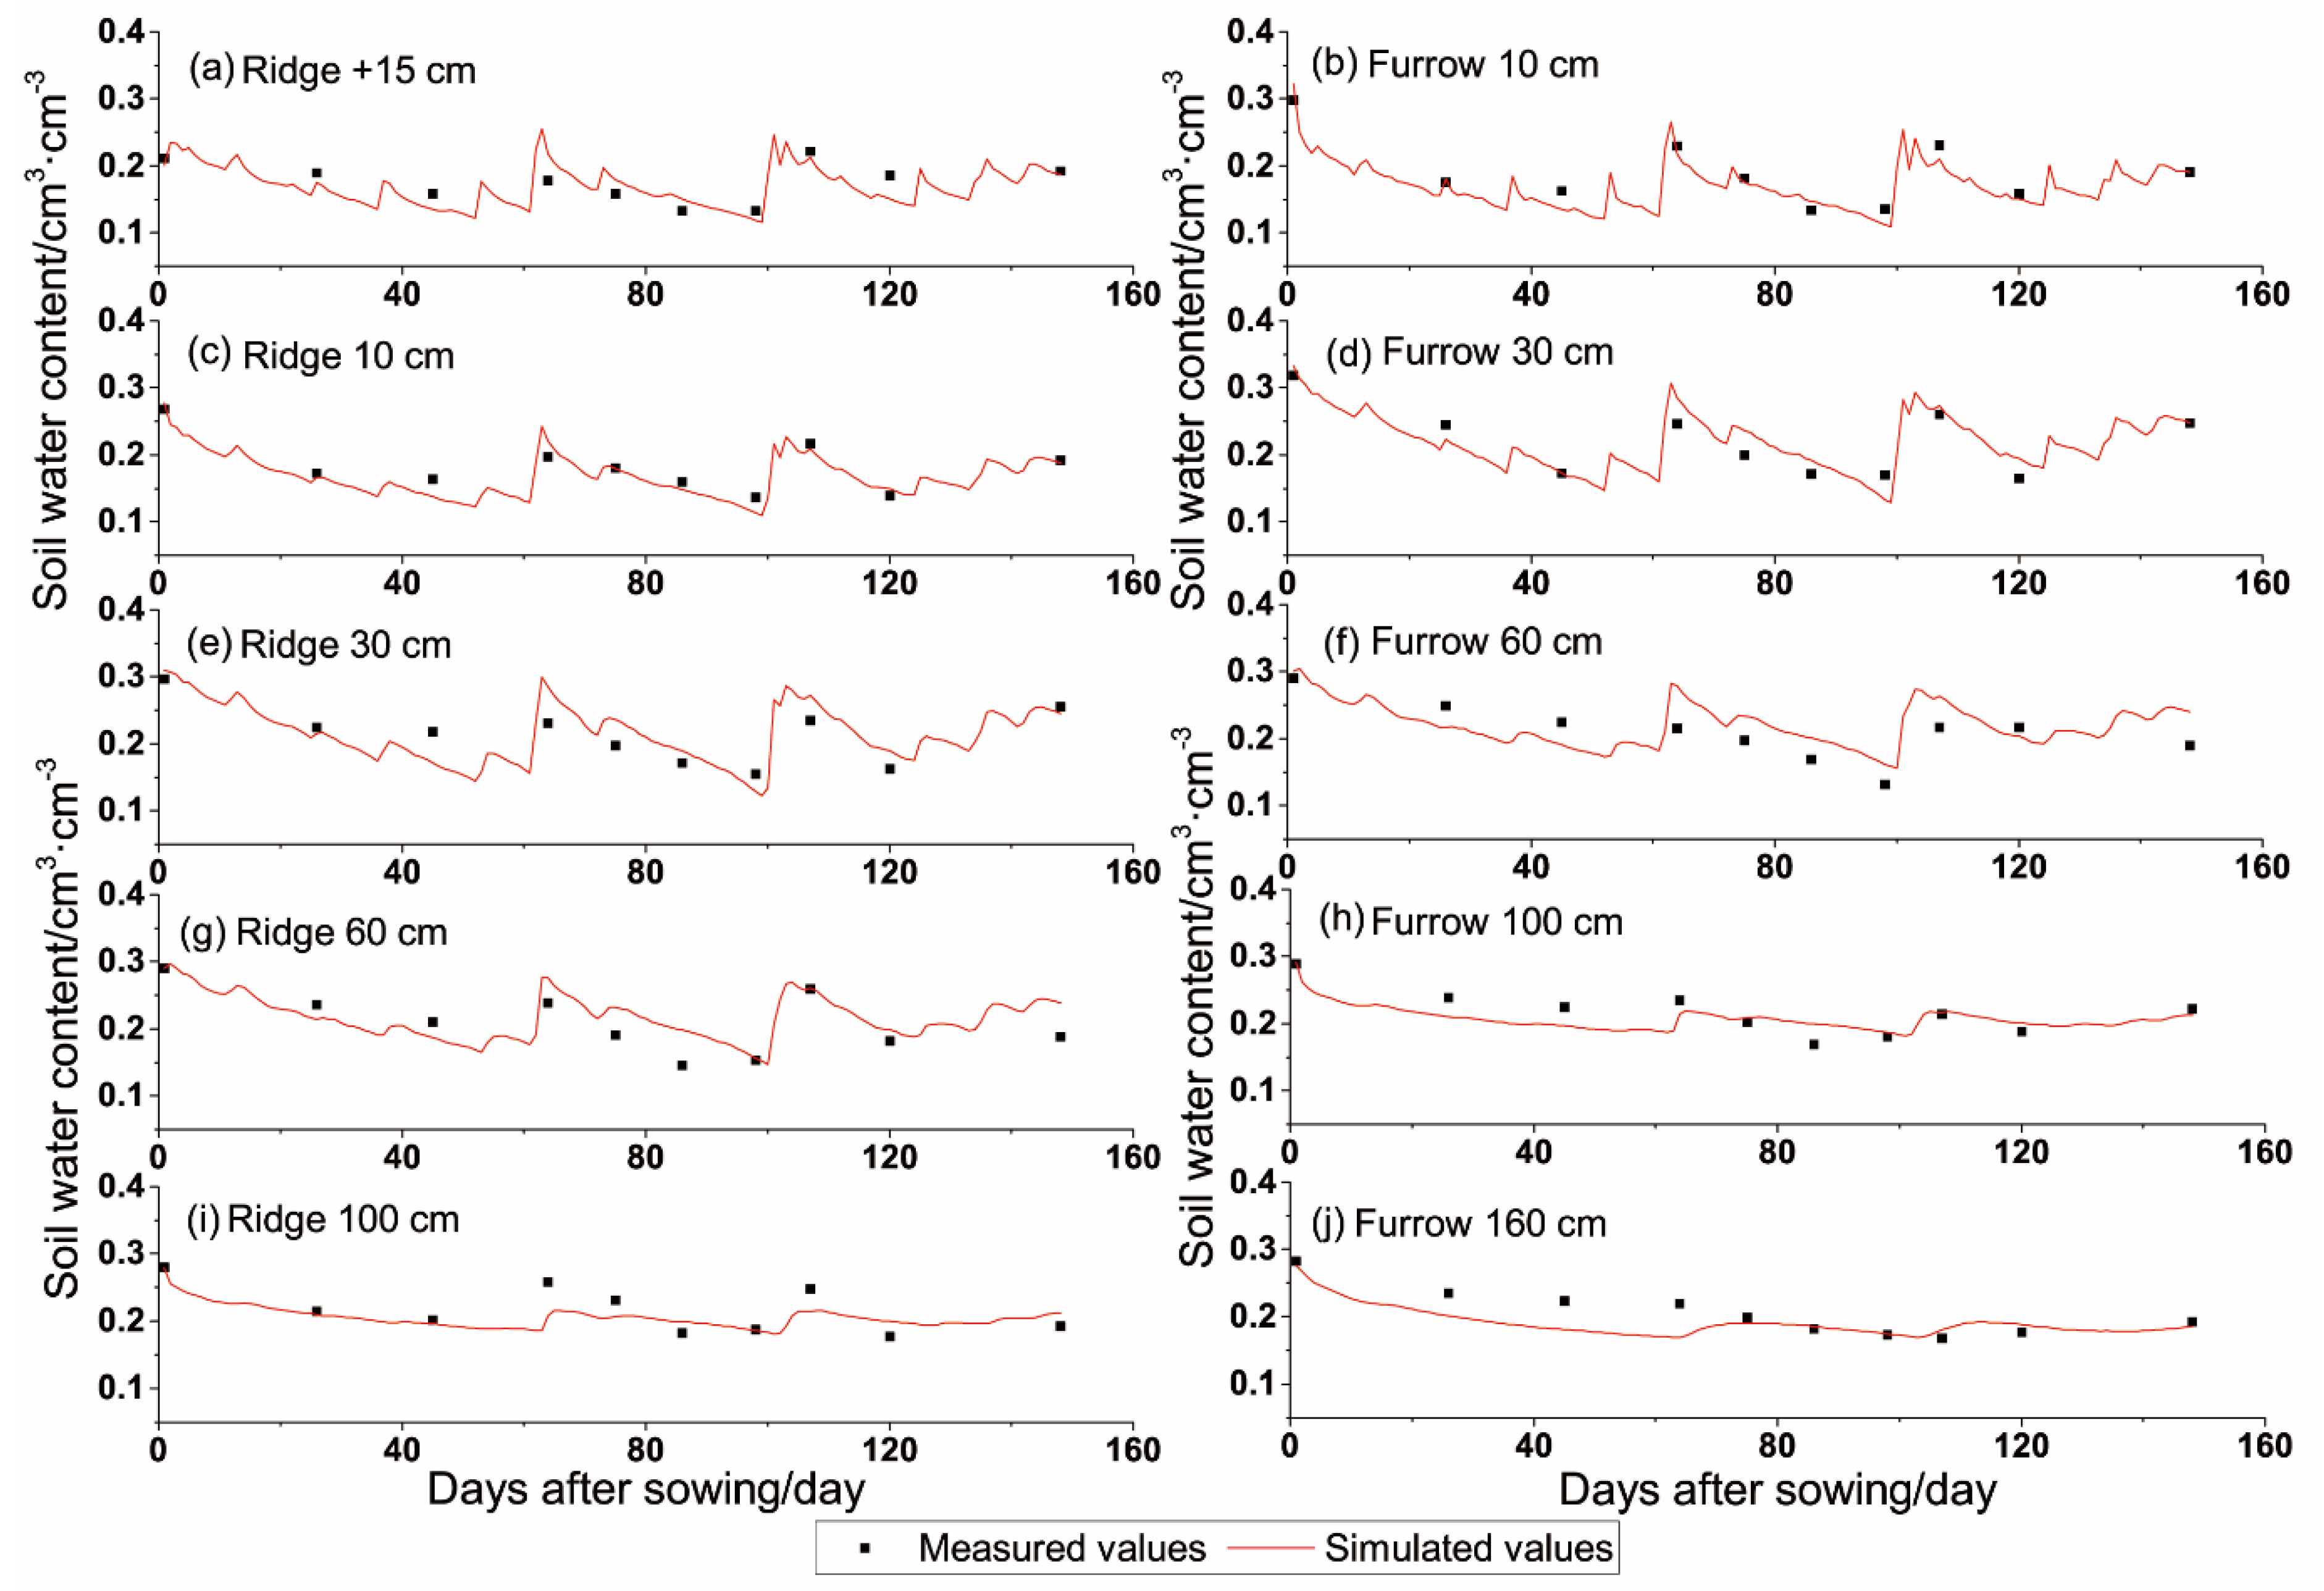
3.1.2. Soil Water Content in Soil Profile

Figure 3 and Figure 4 show the comparison of the measured water contents and the water content derived from Hydrus-2D. The results show that soil water content was not constant and obviously fluctuated, and the degree of fluctuation decreased as the depth increased. The dynamics of the soil water within a +15–160 cm soil layer depth differed during the two growing seasons.
In 2013, the fluctuation was more obviously presented in the furrow than the ridge, this was caused by film mulch. There was also a significant soil water peak in both the ridge and the furrow, and the simulated highest soil water content in the top layer was higher than the measured value; the simulated highest soil water contents were 0.3954, 0.4075, and 0.3782 cm3·cm−3 in the ridge at +15, 10, and 30 cm, respectively, and they were 0.4350 and 0.3798 cm3·cm−3 in the furrow at 10 and 30 cm, respectively (Figure 3a–e). However, there was no significant difference in the soil water content between the ridge and the furrow in the same soil layer. This may indicate that soil water consumption was occurring in both the ridge and the furrow.
In 2014, there was no significant increment of soil water content compared with 2013, and the peak value of the soil water content was lower than that in 2013. However, the soil water increment also happened under the effect of rainfall, and the simulated highest soil water contents were 0.2557, 0.2777, and 0.3091 cm3·cm−3 in the ridge at +15, 10, and 30 cm, respectively; they were 0.3223 and 0.3325 cm3·cm−3 in the furrow at 10 and 30 cm, respectively, and there was also no significant difference between the ridge and the furrow in the same soil layer (Figure 4a–e). The soil water content consumption was obviously in whole layer, especially in the early period, and this phenomenon occurred after every soil water supply.

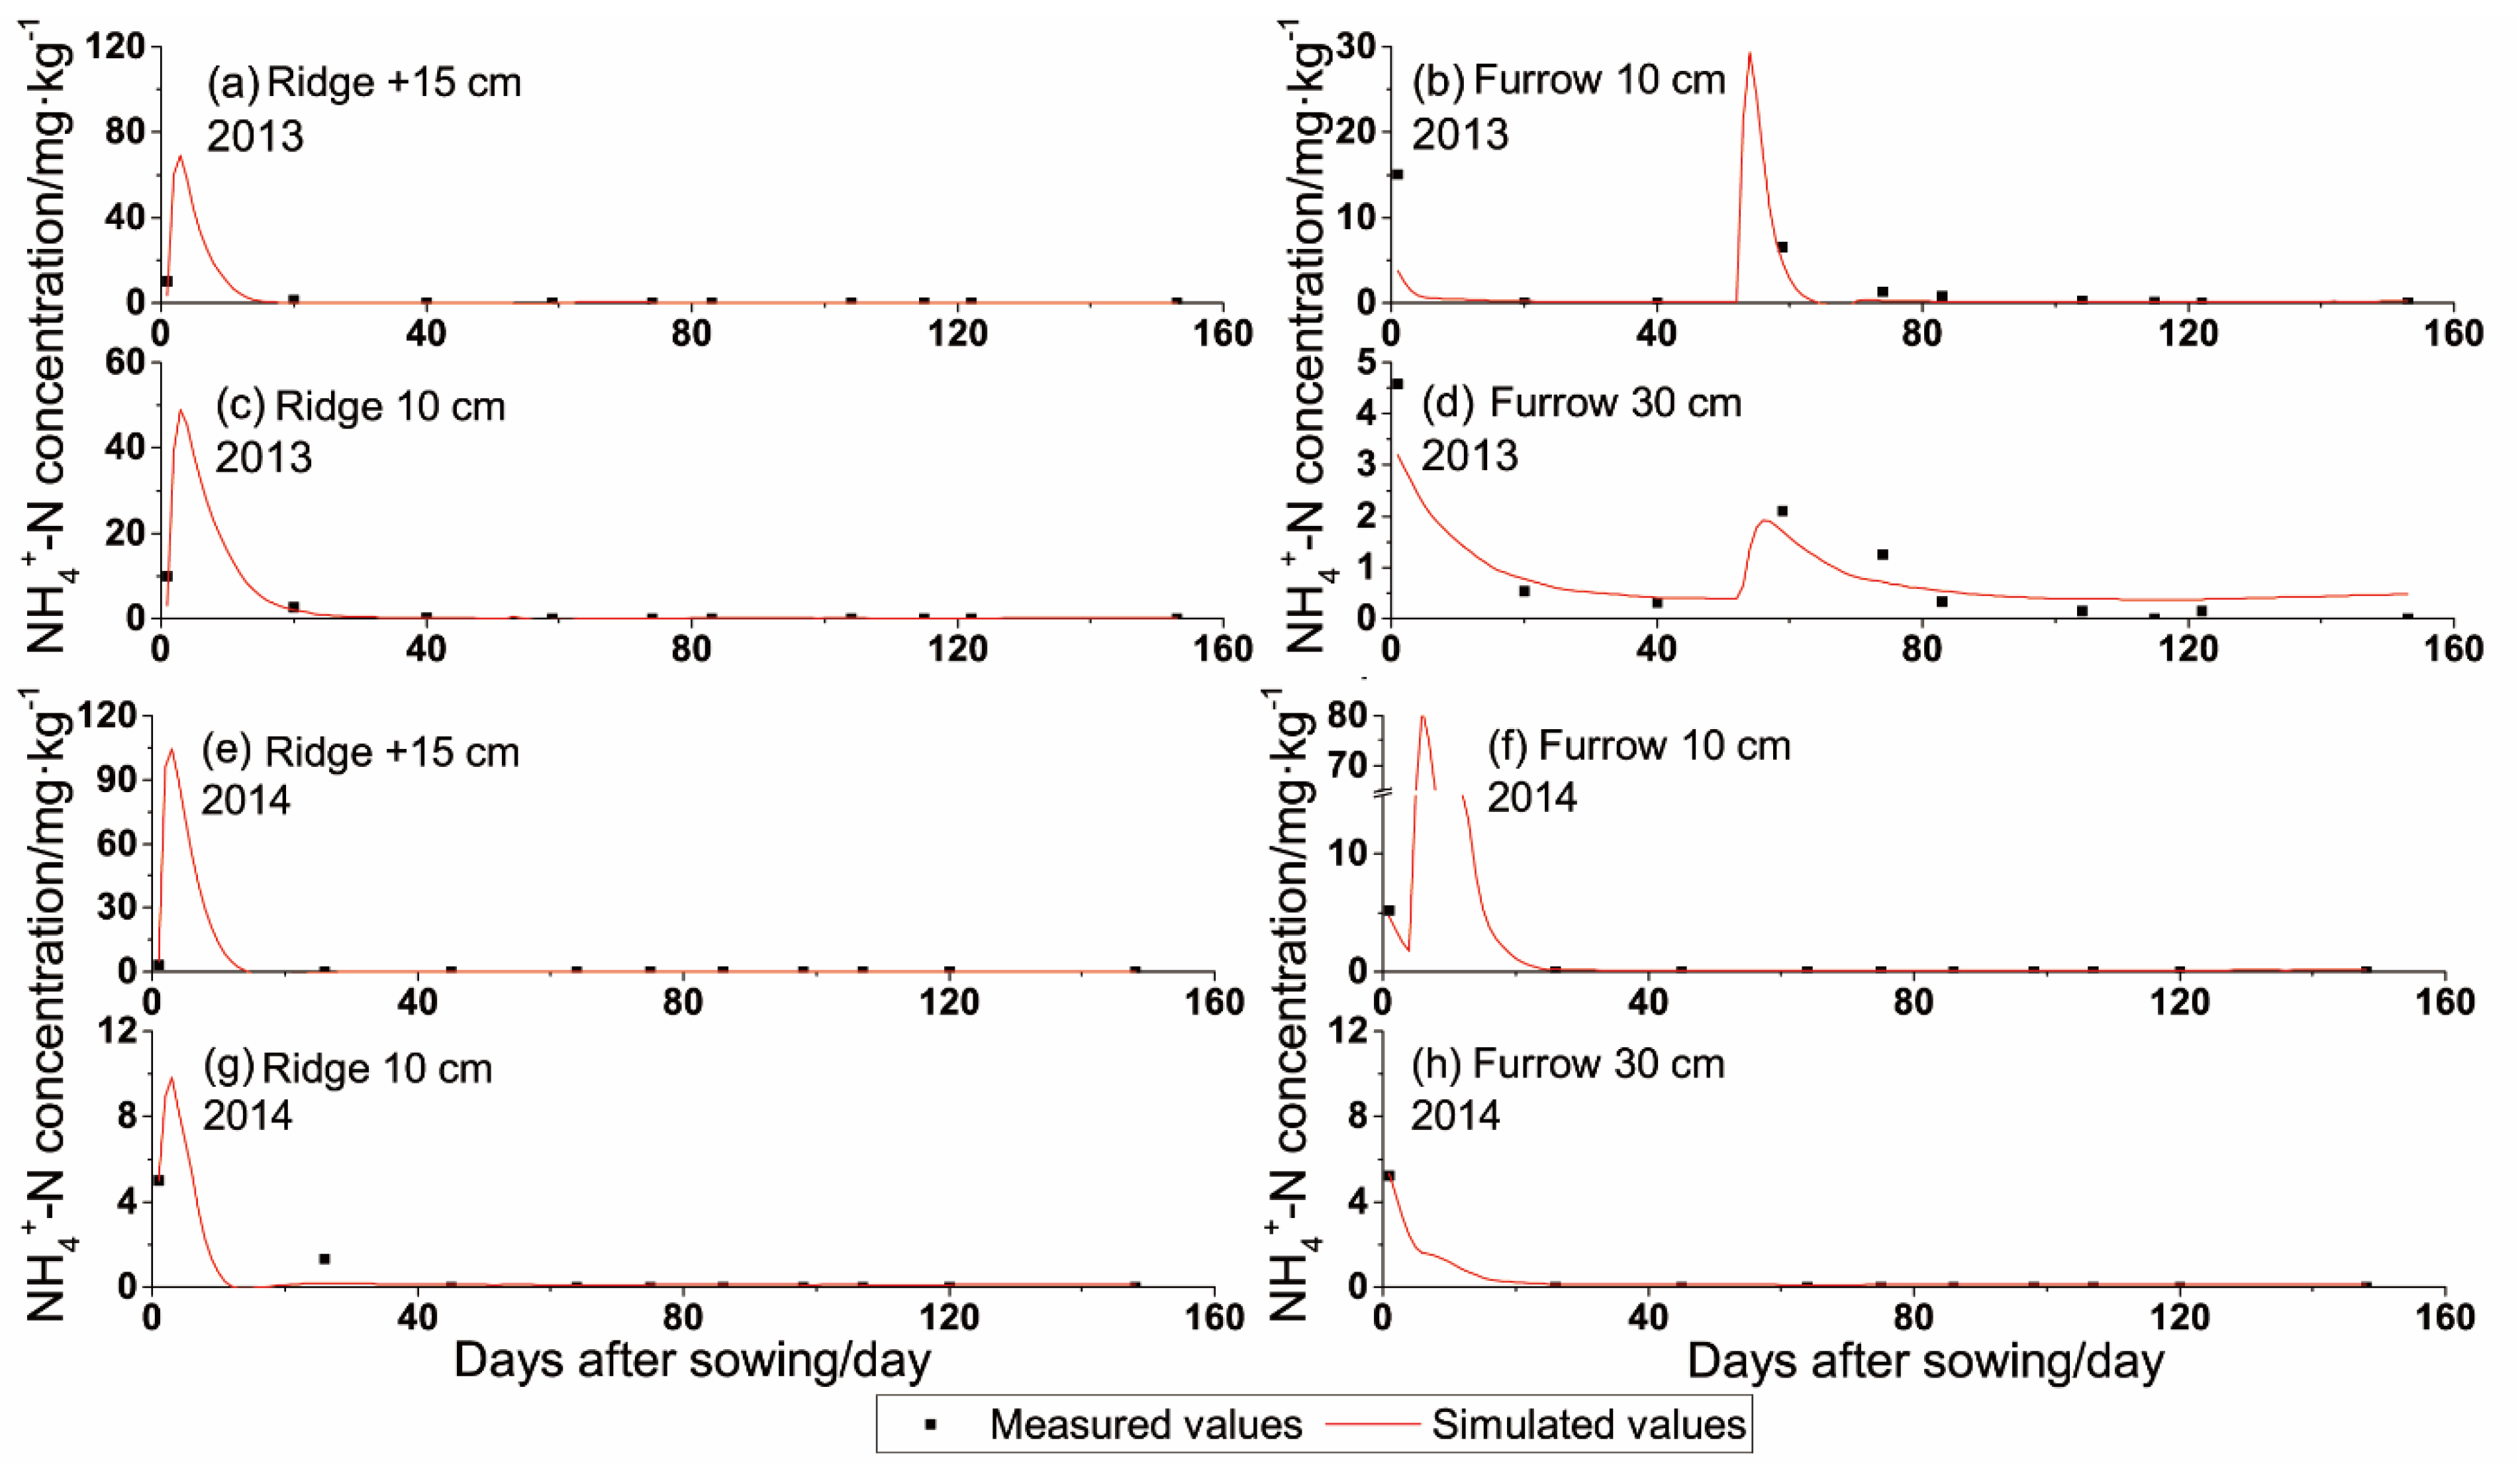
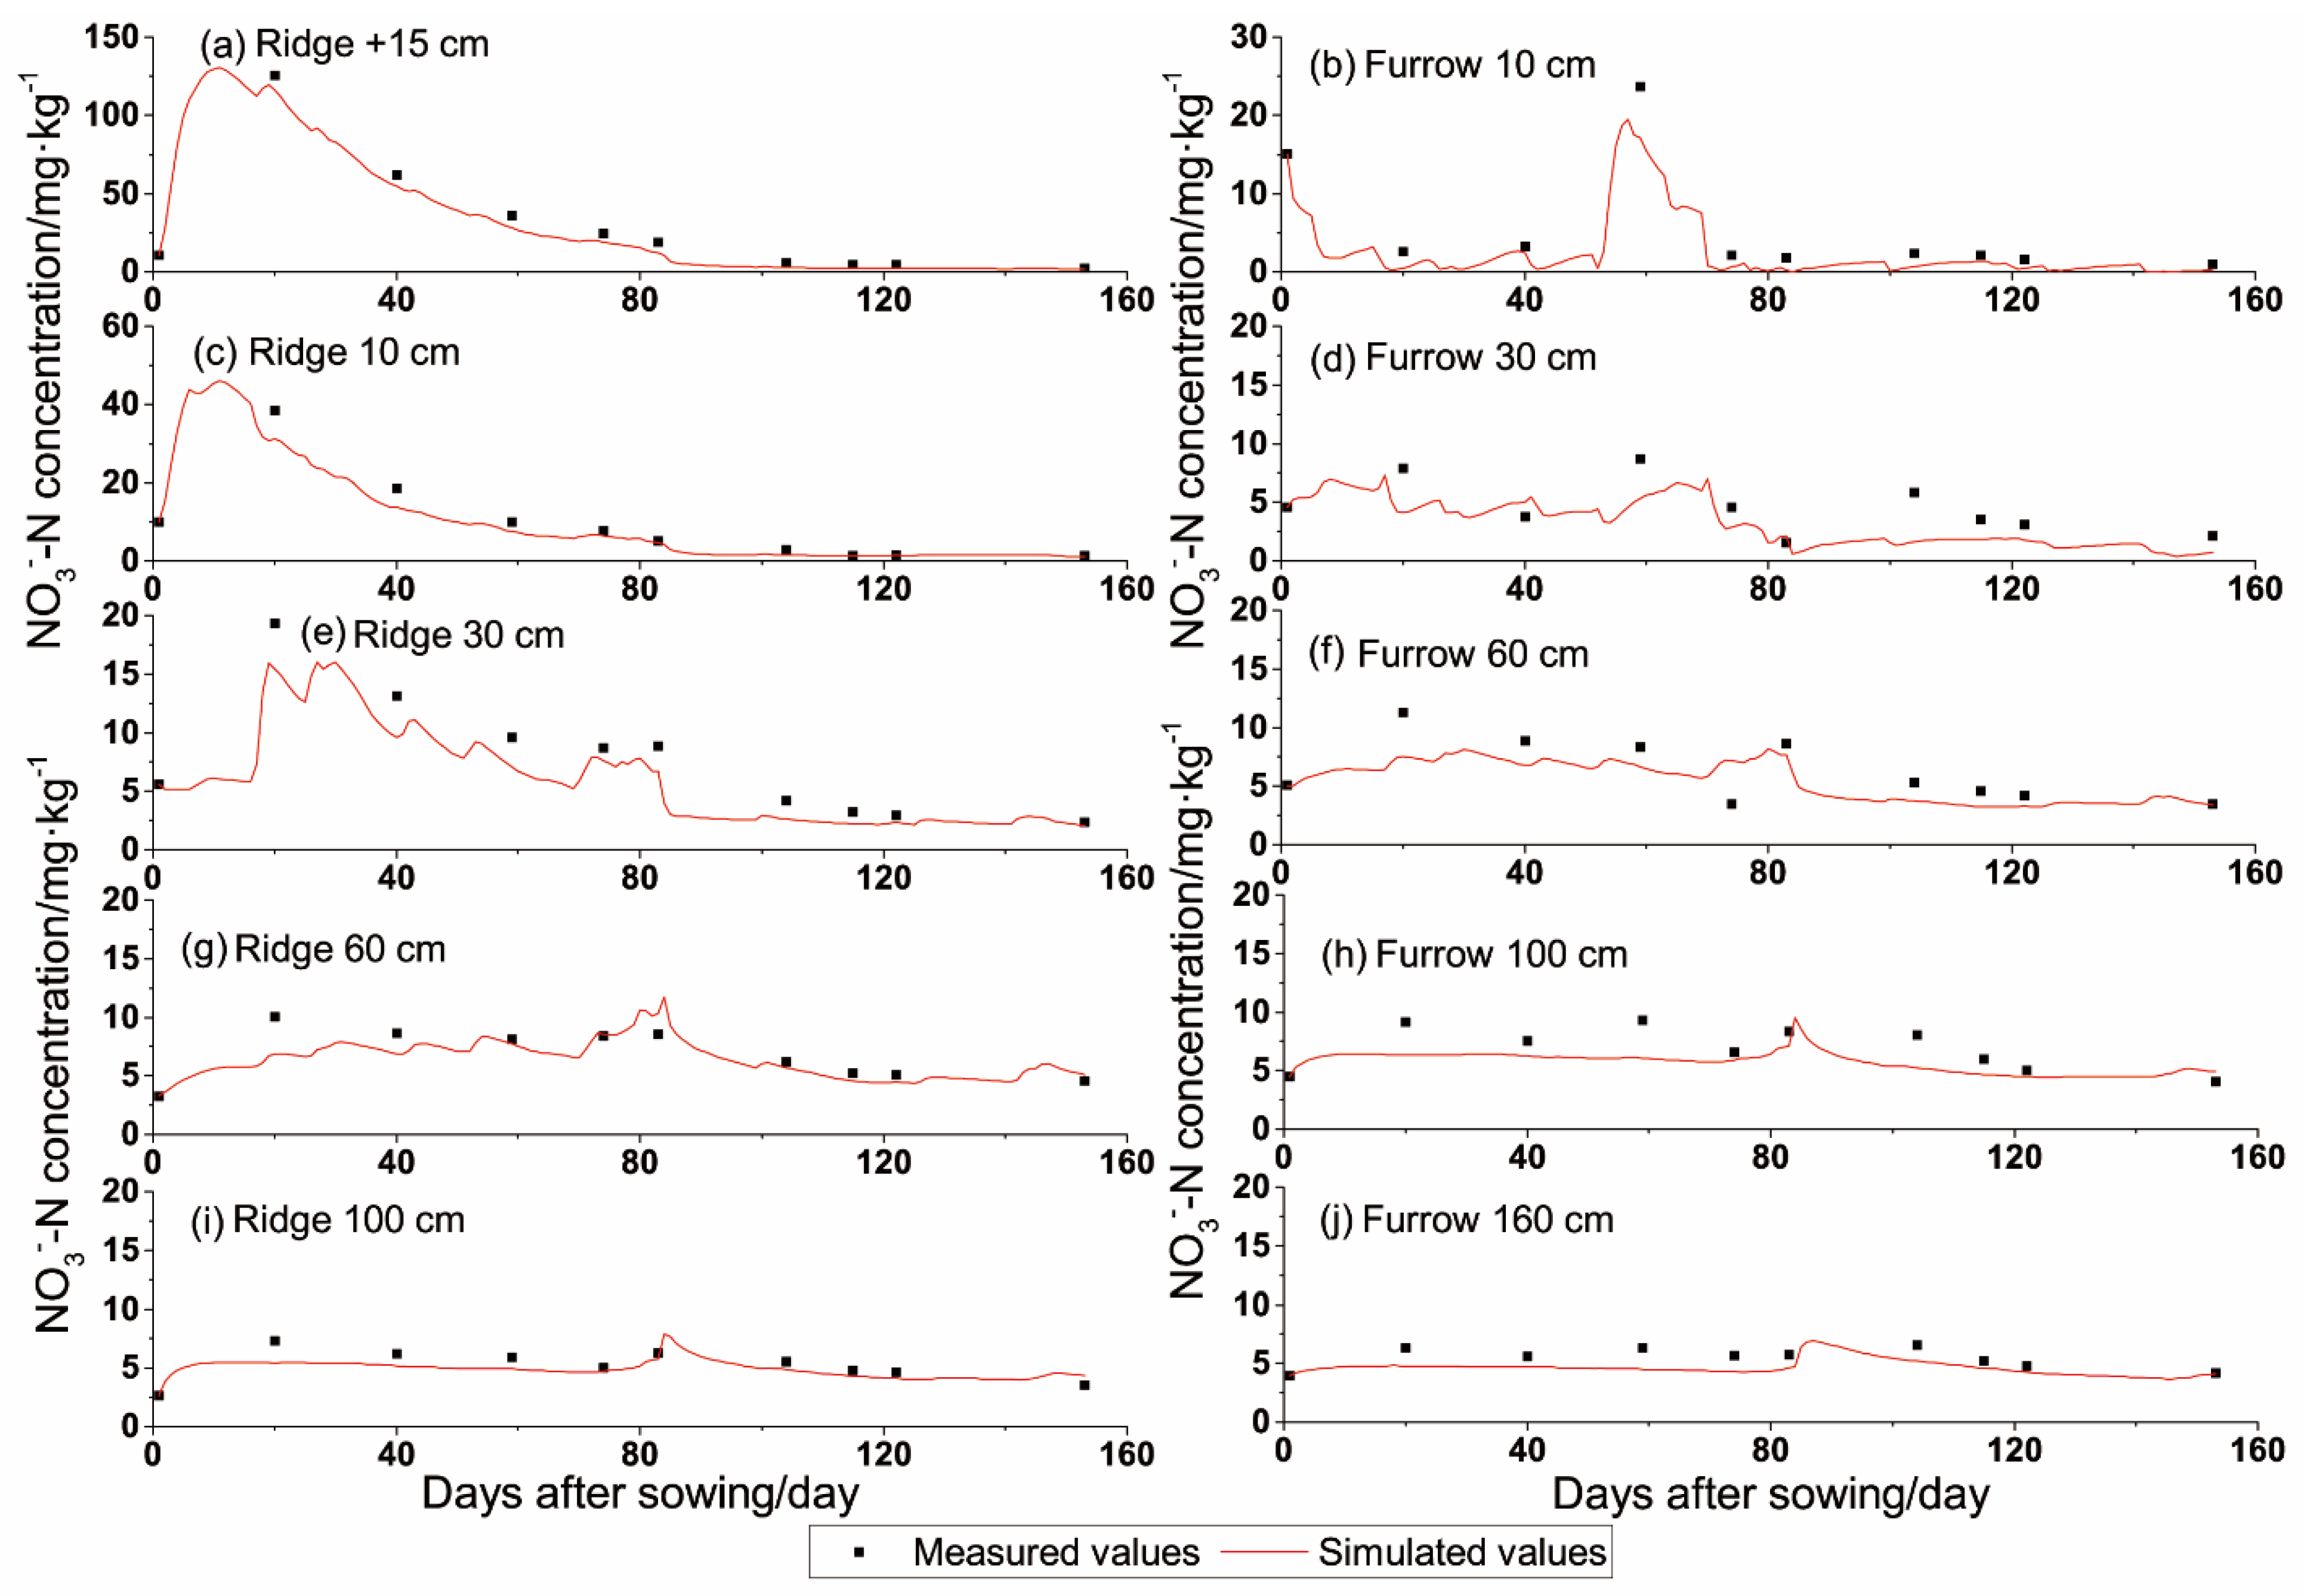
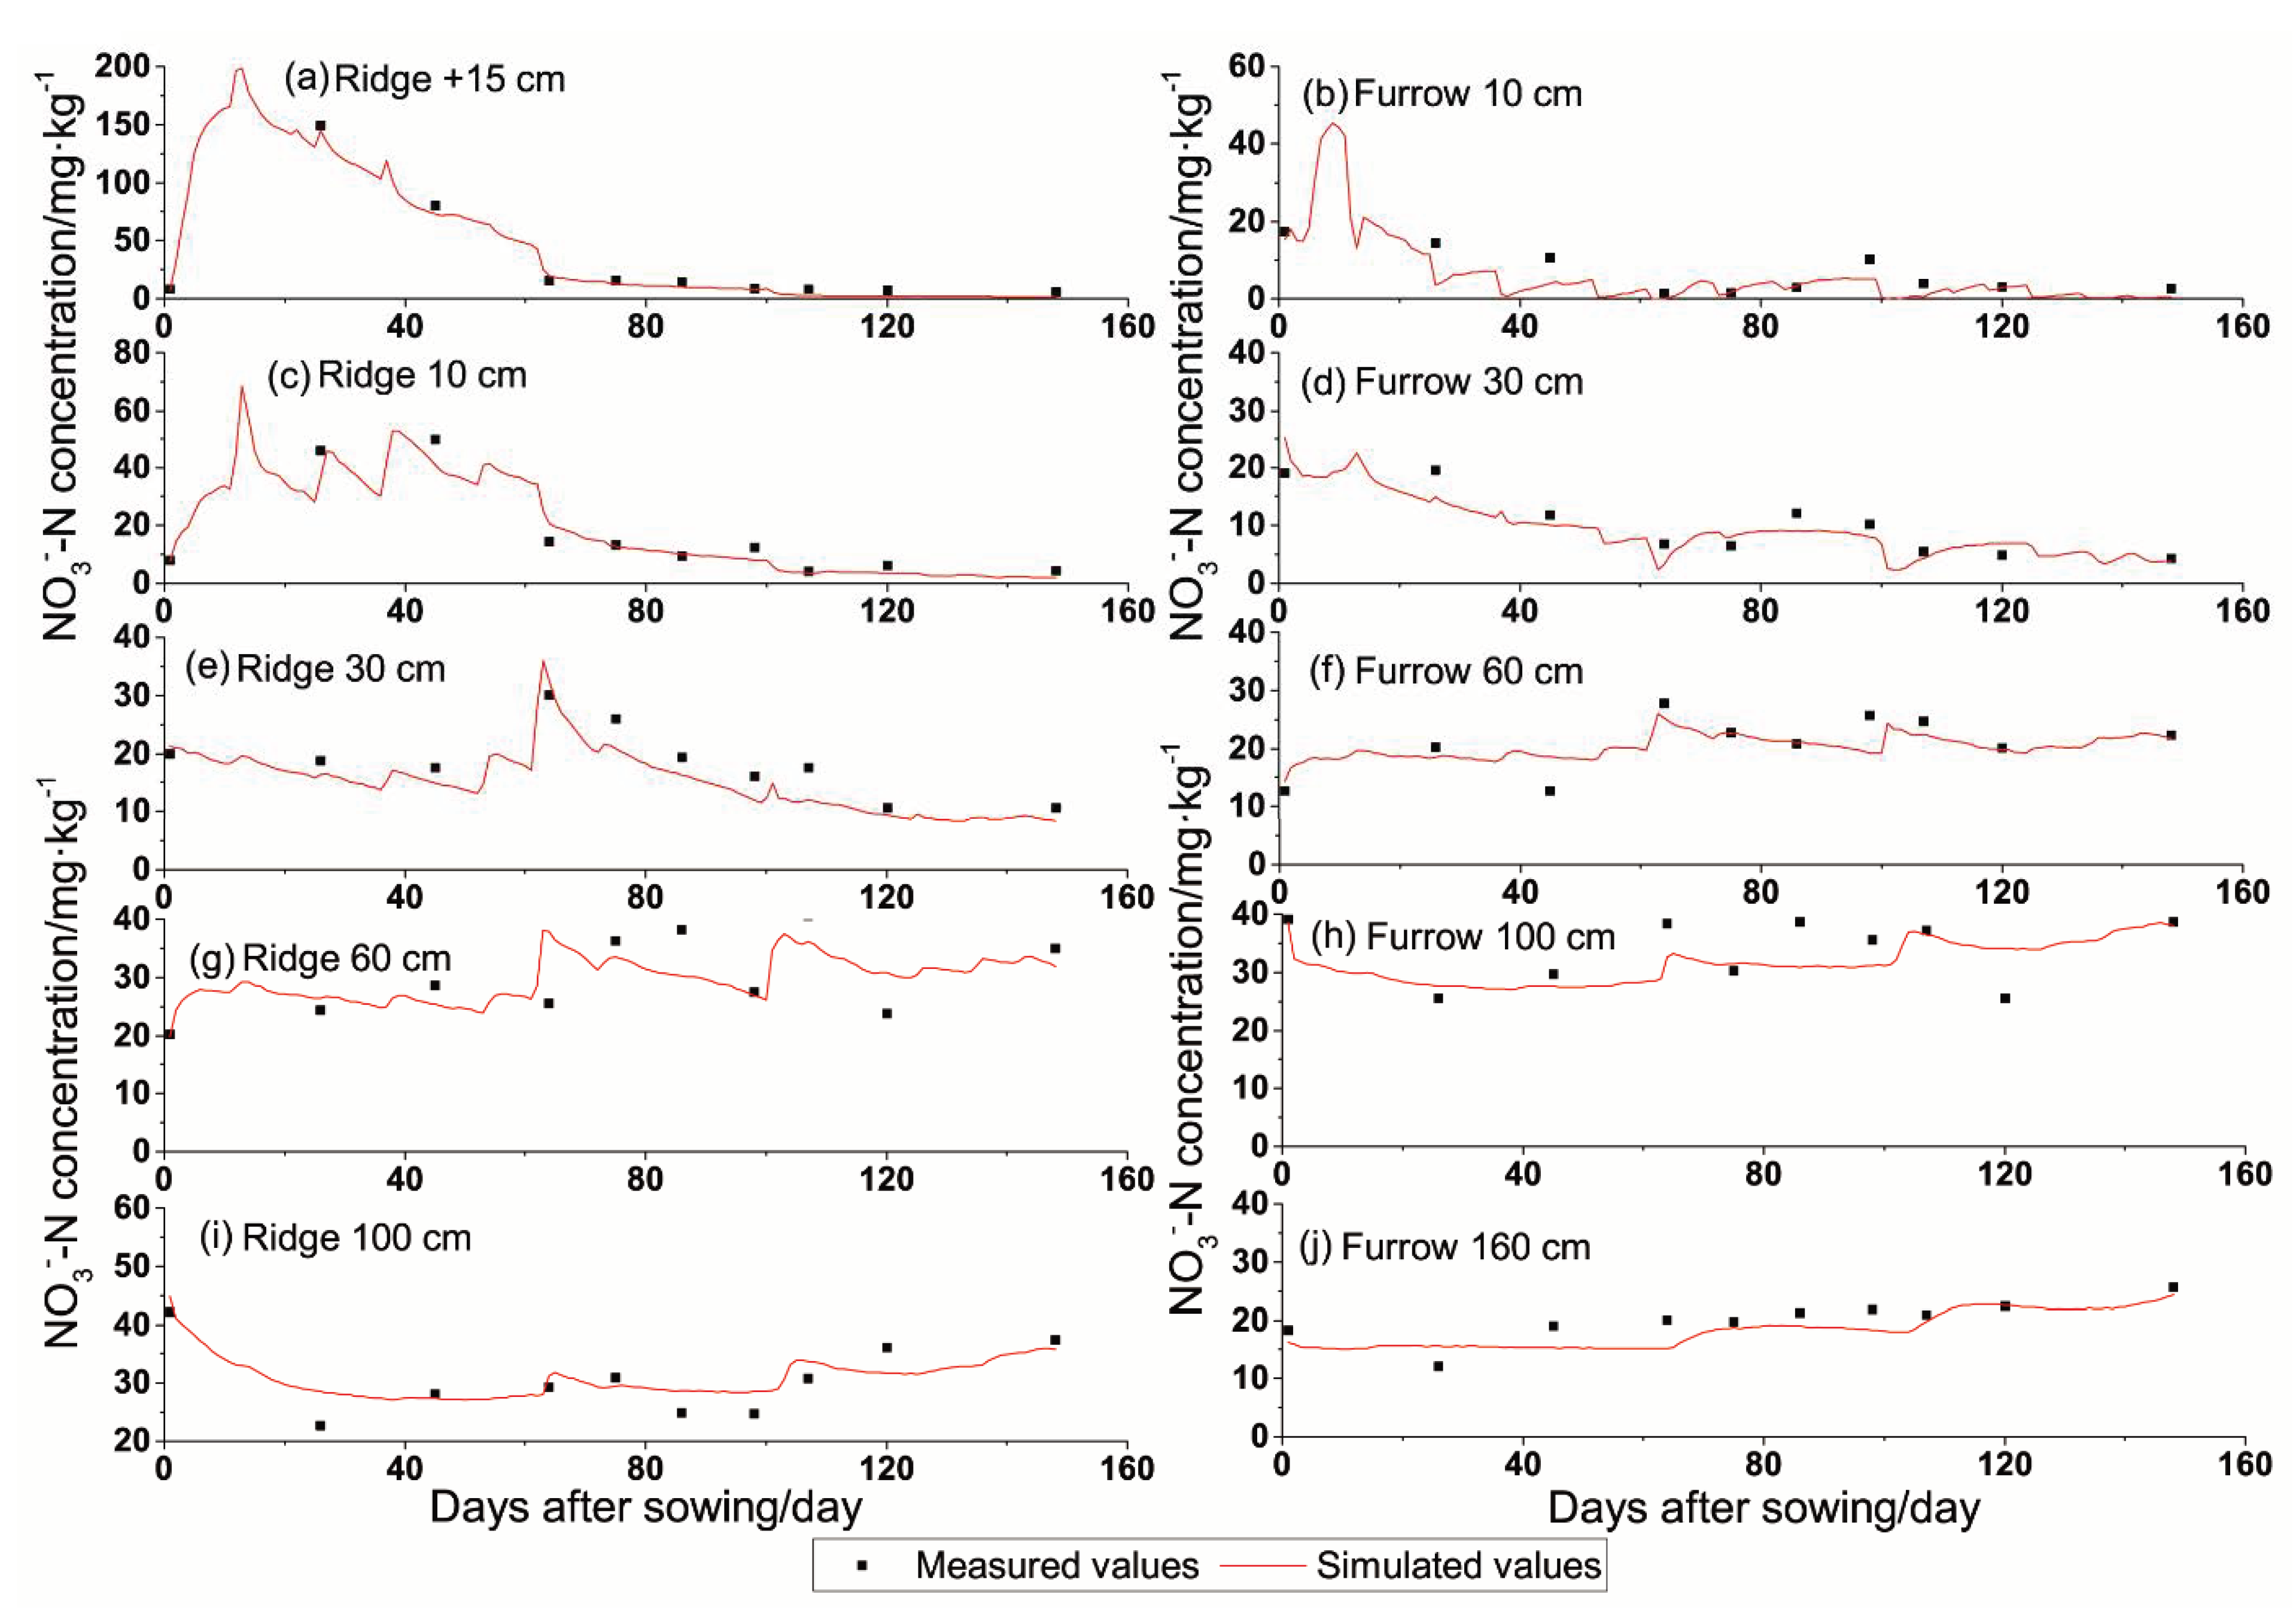
3.2. Dynamic Change of Soil Nitrogen Concentration under the Effect of Film Mulch
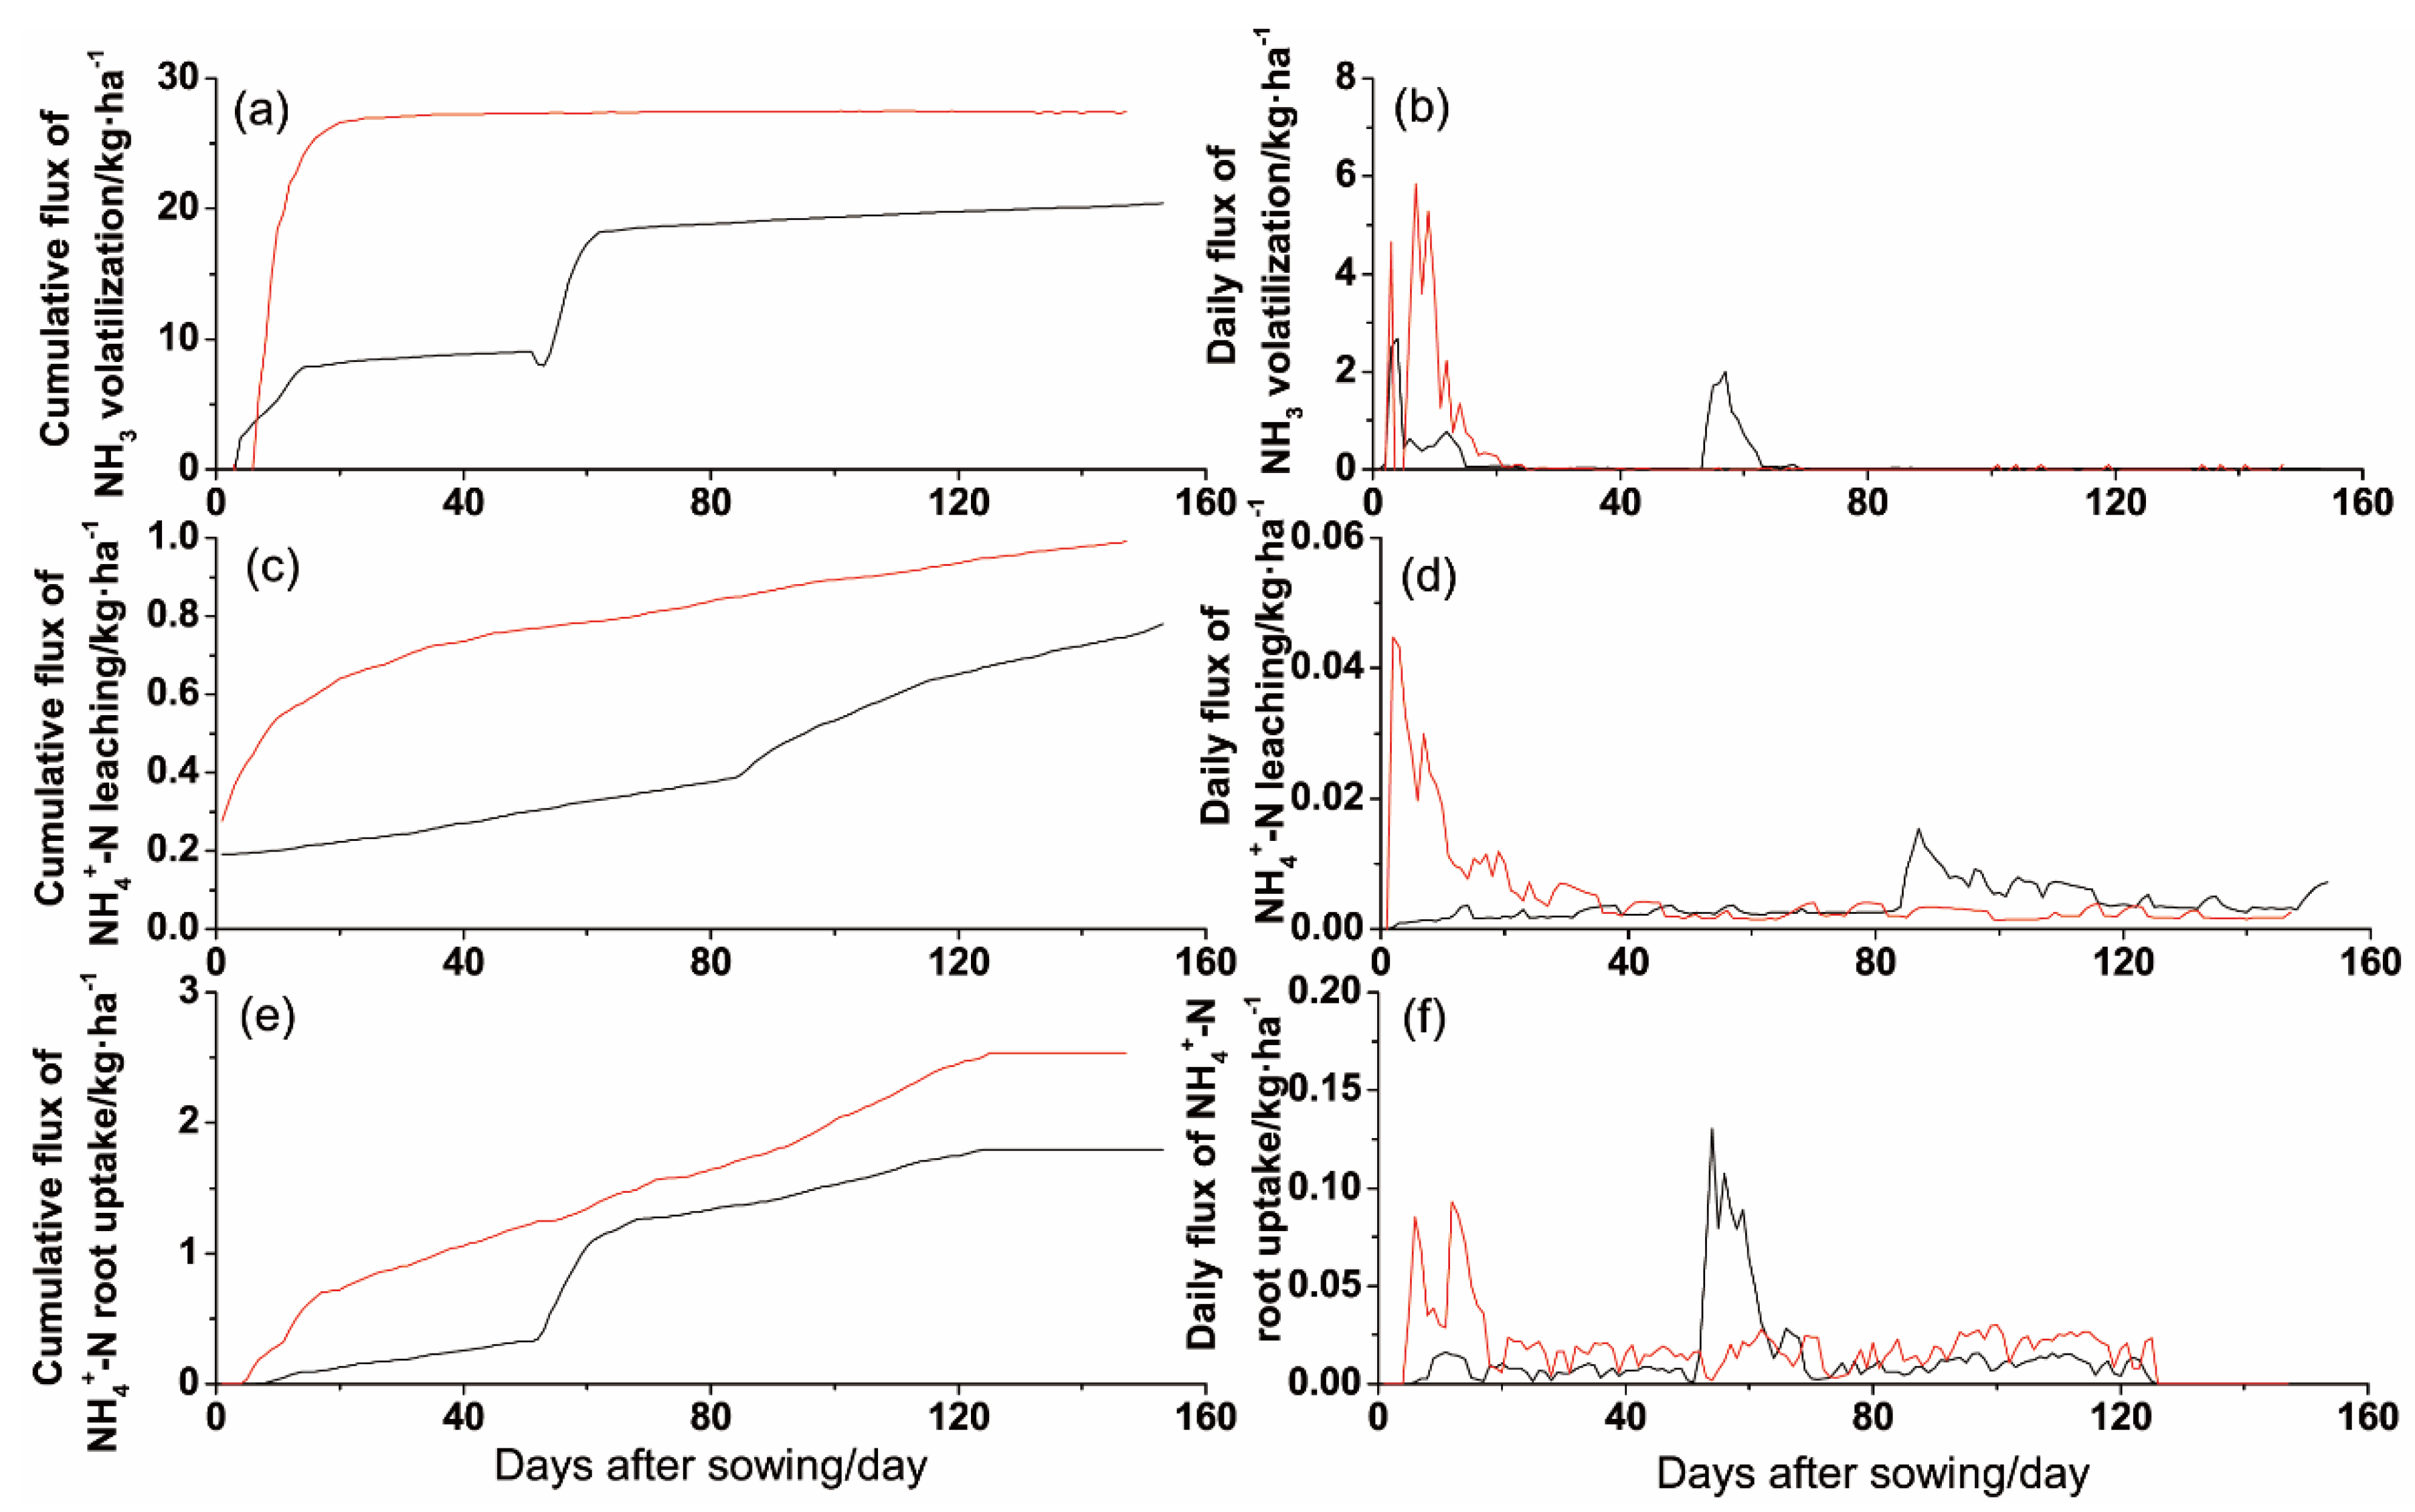
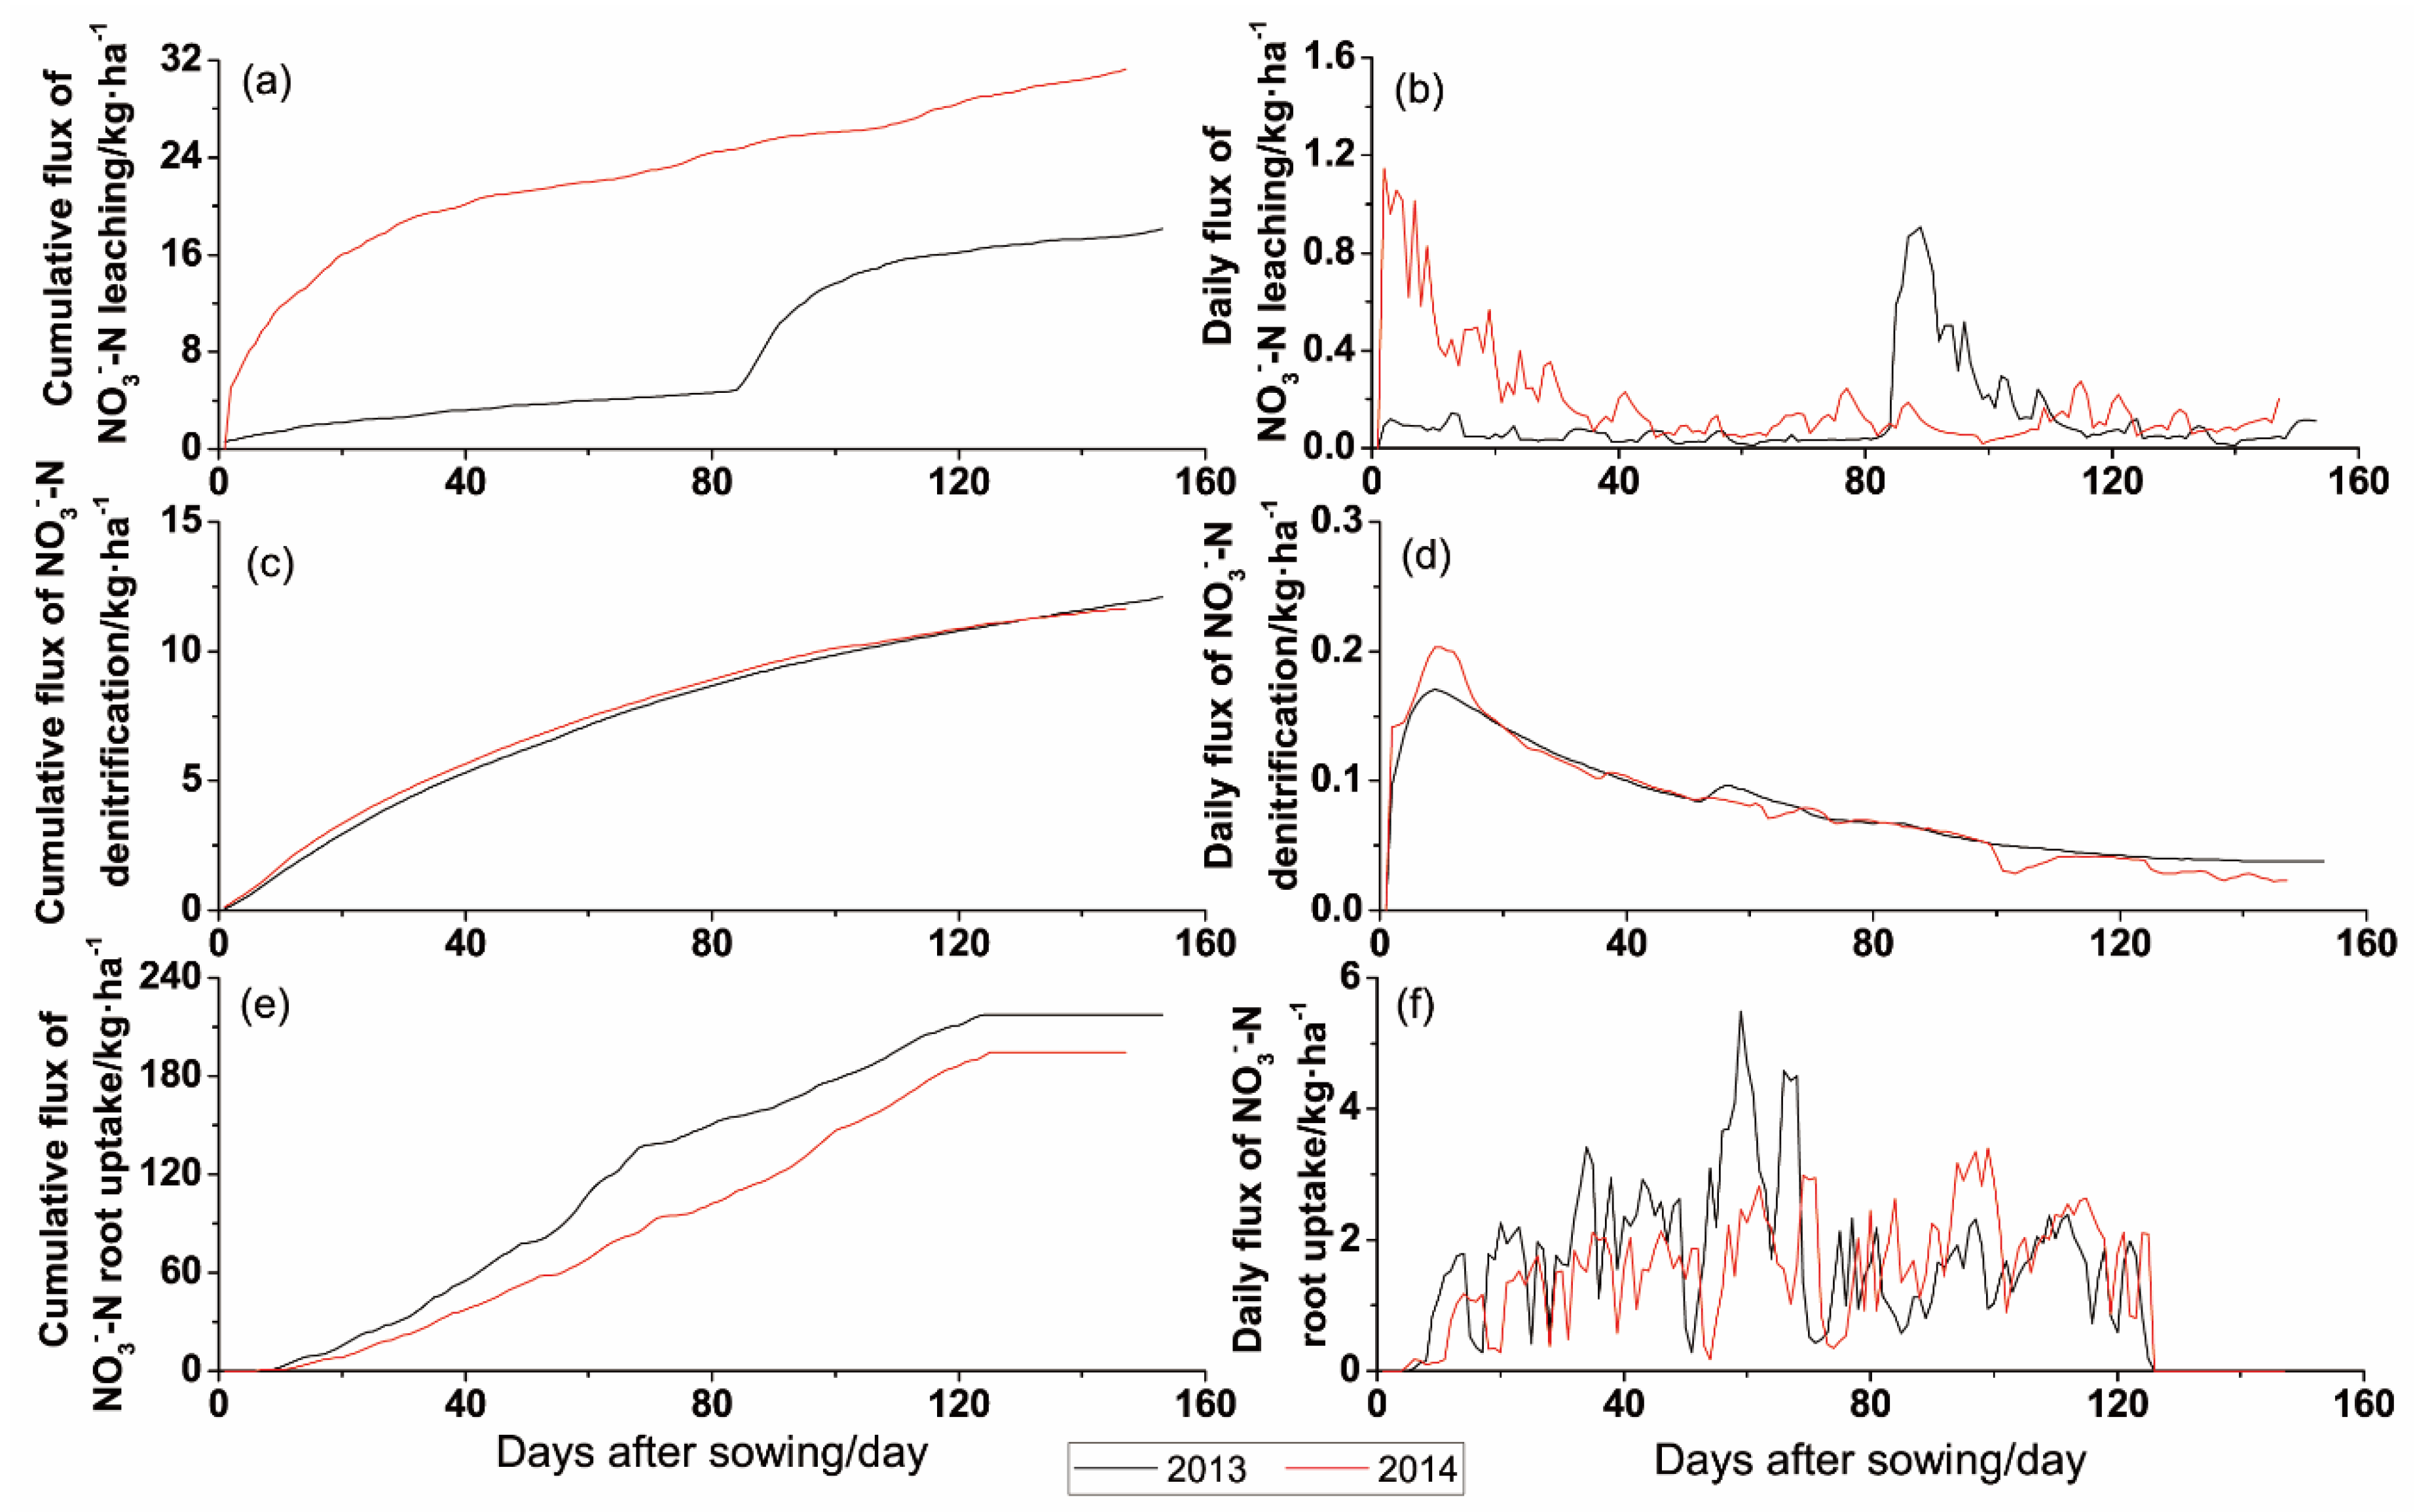
Figure 5, Figure 6 and Figure 7 show the comparison of the simulated and the measured nitrogen concentrations derived from Hydrus-2D. Figure 5 shows the spatial and temporal distribution of the soil N H 4 + -N concentration. The change of N H 4 + -N mainly happened after the N fertilizer application, and it mainly accumulated in the surface soil layer. In 2013, four peaks occurred in the ridge and furrow, respectively; this was caused by the divided N fertilizer application, and it could not affect the change of N H 4 + -N in the ridge when the N fertilizer was applied in the furrow. The maximum soil N H 4 + -N concentrations were 69.12, 49.01 mg·kg−1 in the ridge at +15 cm and 10 cm, respectively (Figure 5a,c), and they were 29.37, 3.20 mg·kg−1 in the furrow at 10 cm and 30 cm, respectively (Figure 5b,d). In 2014, the change of N H 4 + -N was accumulated in the +15–10 cm soil depth. Three peaks occurred in the ridge and furrow, and there was only one peak in the furrow, which lagged behind the peak in the ridge. The peak values were 104.62 and 9.85 mg·kg−1 in the ridge at +15 cm and 10 cm, respectively (Figure 5e,g), and the peak value was 81.25 mg·kg−1 in the furrow at 10 cm (Figure 5f); it happened about three days later than in the ridge.
Figure 6 and Figure 7 were the spatial and temporal heterogeneity of N O 3 -N retention in the soil profile, which occurred in 2013 and 2014, respectively. In 2013, the N O 3 -N concentration peaked quickly, within ten days after fertilizer application, with 130.86 and 46.03 mg·kg−1 in the ridge at +15 cm and 10 cm, respectively (Figure 6a,c). The peak value was 19.51 mg·kg−1 in the furrow at 10 cm (Figure 6b), which occurred after the topdressing. The peak of the deep soil obviously lagged behind the surface soil; they depended on the transport of N O 3 -N, and it decreased with soil depth. In 2014, fertilization occurred only once at the beginning of sowing, as in previous growing season; the N O 3 -N concentration peaked quickly within thirteen days after the fertilizer application, with 198.20 and 68.63 mg·kg−1 in the ridge at +15 cm and 10 cm, respectively (Figure 7a,c), and then, it decreased under the effects of the root uptake and leaching. The peak values also decreased with soil depth; however, the average N O 3 -N concentration in the 60–160 cm layer was higher than in 2013; this reflected a higher risk of N O 3 -N leaching in 2014 than in 2013.

3.3. Dynamic Change of N H 4 + -N Processes

Ammonia volatilization, N H 4 + -N leaching, and root uptake were the main considerations of the N H 4 + -N processes, which are showed in Figure 8 with the cumulative and daily flux. The ammonia volatilization was one of the main N H 4 + -N losses, and it occurred after the topdressing in 2013; however, it was concentrated in the first 20 days after the fertilizer in 2014 (Figure 8a,b). The cumulative flux of ammonia volatilization in 2014 was obviously higher than that in 2013; however, there were two increments of ammonia volatilization in 2013, which was different to that in 2014 as there were two fertilizations during the growing season in 2013. The cumulative fluxes of ammonia volatilization were 20.40 and 27.41 kg·N·ha−1 in 2013 and 2014, respectively (Figure 8a); the maximum daily fluxes of ammonia volatilization were 2.67 and 5.85 kg·N·ha−1 in 2013 and 2014, respectively (Figure 8b).
The N H 4 + -N leaching and the N H 4 + -N root uptake flux occupied a small part of the proportion of the N H 4 + -N processes. In 2013, the N H 4 + -N leaching mainly occurred during the topdressing in the furrow; however, in 2014, it was mainly concentrated in the first 20 days after the fertilizer. The cumulative fluxes of N H 4 + -N leaching were 0.78 and 0.99 kg·N·ha−1 in 2013 and 2014, respectively (Figure 8c); the maximum daily fluxes of N H 4 + -N leaching were 0.02 and 0.04 kg·N·ha−1 in 2013 and 2014, respectively (Figure 8d). As with the N H 4 + -N leaching process, the N H 4 + -N root uptake occurred after topdressing in 2013, and it was concentrated in the first 20 days in 2014; however, the maximum daily flux was higher in 2013 than in 2014. The cumulative fluxes of N H 4 + -N root uptake were 1.79 and 2.53 kg·N·ha−1 in 2013 and 2014, respectively (Figure 8e); the maximum daily fluxes of N H 4 + -N root uptake were 0.13 and 0.09 kg·N·ha−1 in 2013 and 2014, respectively (Figure 8f).

3.4. Dynamic Change of N O 3 -N Processes

N O 3 -N leaching, denitrification, and root uptake were the main considerations of the N O 3 -N processes, which are shown in Figure 9 with the cumulative and daily flux. N O 3 -N leaching was the most important part of the nitrate losses, and it happened during the whole growing season, especially in the first days after the fertilizer; it mainly occurred after the topdressing in 2013 and the first 20 days after fertilizer in 2014 (Figure 9a,b). The cumulative flux of N O 3 -N leaching in 2014 was obviously higher than that in 2013; they were 18.13 and 31.26 kg·N·ha−1 in 2013 and 2014, respectively (Figure 9a), and the maximum daily fluxes of N O 3 -N leaching were 0.91 and 1.15 kg·N·ha−1 in 2013 and 2014, respectively (Figure 9b).
N O 3 -N denitrification was another means of nitrate loss, which was different to the change of N O 3 -N leaching. There was no significant difference in the N O 3 -N denitrification between 2013 and 2014, and the cumulative fluxes of N O 3 -N denitrification were 12.08 and 11.65 kg·N·ha−1 in 2013 and 2014, respectively (Figure 9c); the maximum daily fluxes of N O 3 -N leaching were 0.17 and 0.20 kg·N·ha−1 in 2013 and 2014, respectively (Figure 9d).
The N O 3 -N root uptake flux occupied a large part of the proportion of the N O 3 -N processes. It increased with the crop growth, and it was different to the N O 3 -N leaching and denitrification. The cumulative flux of the N O 3 -N root uptake was higher in 2013 than in 2014. The cumulative fluxes of the N O 3 -N root uptake were 217.52 and 194.46 kg·N·ha−1 in 2013 and 2014, respectively (Figure 9e); the maximum daily fluxes of the N O 3 -N root uptake were 3.40 and 5.49 kg·N·ha−1 in 2013 and 2014, respectively (Figure 9f).

4. Discussion

4.1. Simulation of Soil Moisture and Solute Transport

Adequate agreement was achieved between the measured and the simulated soil water contents during the two growing seasons (Table 3). Similarly, many studies have confirmed the precision of Hydrus-2D on the soil water and nitrogen dynamic [28,29,30,31], and it was confirmed that Hydurs-2D could be effectively used in the Loess Plateau. Soil water and heat flow were simulated in the ridge cultivation with plastic mulching [20]. The soil water content fluctuated regularly with the precipitation, the evaporation, and the root water uptake [32]; evaporation and transpiration were two important soil water sink items. Soil water in the deep soil layer could move up to the upper layer under the effect of evaporation and transpiration (Figure 2); this would result in soil water change in the surface layer (Figure 3 and Figure 4). The results showed that there was obvious deep soil water consumption in 2014 (Figure 4h–j) as there was higher evaporation in 2014 from 30 days to the harvest days after sowing (Figure 2b), which could be explained by the lower leaf area index and longer root depth (Figure 10). However, there were no differences between the ridge and the furrow in the two growing seasons as the water consumption happened in both the ridge and the furrow [3], which was caused by the film mulch system. Comparing the soil water dynamic in 2013 and 2014, the soil water content kept stable in general in 2013, except for the noticeable rise in the middle stage about 90 days after sowing (Figure 3). However, there were three soil water decrease stages in 2014; the first stage lasted about 60 days; the second stage happened from 60 days to 100 days after sowing; and the third stage was 100 days to 120 days after sowing (Figure 4). They indicated water stress during these decrease stages, especially in the first one, which would result in inhibited crop growth; therefore, this influenced the nutrient utilization and yield (Table 4). In fact, the soil evaporation was higher than in 2013 during this period (Figure 2) due to the lower leaf area index in 2014 (Figure 10a). It was found that film mulch could improve soil water content and raise deep soil water to the crop available [33], which was similar to that which happened in 2014 (Figure 3). It reflected the surface soil water stress that occurred in three stages. Thus, it was not obvious in 2013 for the different rainfall events (Figure 3). On the whole, Hydrus-2D is an acceptable model for soil water dynamic simulation in a rain-fed ridge-furrow maize system with plastic mulch, and film mulch may lead to sustainable improvements in the efficient use of water in the ridge, furrow, and deep soil layer.
Thus, the simulation of the spatial and temporal changes of N H 4 + -N is fairly acceptable. The variations of the surface soil N H 4 + -N concentrations mainly changed with the fertilizer application, and they were largely concentrated in the soil upper layer, where the fertilizer application and the detailed information were caught by the calibrated model, whether it was on the ridge or the furrow. The N H 4 + -N concentration was mainly changed in the place where the fertilizer was applied; as for the immobility behavior of ammonium in soil [4], it was also properly simulated. Urea was enzymatically hydrolyzed to N H 4 + -N within the first days after the application [34]; the change of soil N H 4 + -N concentration was well simulated under the urea application, as shown in Figure 5. In this study, it was found that the N H 4 + -N concentration increased quickly three days after fertilization, and then, it decreased within about 10 days due to the nitrification process [4]. It was also found that the N H 4 + -N concentration was increased about 5 days after fertilization [35], which was different in this study, and it could be explained by the difference in the soil enzyme activities [36]. Spatial and temporal changes of N O 3 -N under furrows and ridges were also logically simulated by Hydrus-2D. The N O 3 -N concentrations of surface soil were increased quickly after fertilization within 10 days (Figure 6 and Figure 7), then they gradually declined for the root uptake and leaching [37]; the soil water actually mobilized the N O 3 -N in the soil [4]. The distribution of N O 3 -N in the deep soil was mainly caused by the water infiltration [38]. The increment of N O 3 -N was explained by the nitrification process [39], and it was mainly accumulated in the layer where the urea was applied. However, there was a rise in the ridge after the urea was applied in the furrow during 2013 (Figure 6b,e,g,i). There was an exchange of N O 3 -N between the ridge and the furrow, which was different to 2014, and this would contribute to the nitrite leaching reduction as the soil water infiltration was limited by the film mulch [40]. The N O 3 -N concentrations in the deep soil layer were higher in 2014 than in 2013; it also reflected a high risk of nitrite leaching in 2014. This may be related to the higher rainfall in the first 30 days after sowing (Figure 2). One-time fertilization caused the retention of N O 3 -N in the soil, which was then transported to the deep soil.

4.2. Dynamic of Nitrogen Losses

Based on the above contents, plastic film mulch improved the soil water retention and reduced the water losses by evaporation restraining [1], thus improving nutrient balances and their availability [4]; however, NH3 volatilization and nitrate leaching also occurred during the crop growing season (Figure 8 and Figure 9). Different water management and different amounts and models of fertilizer would contribute to different nitrogen losses.
NH3 volatilization was an important means of nitrogen losses [41]; it was also a major part of the N H 4 + -N processes. NH3 volatilization accounted for 9.27% and 12.46% of the N fertilizer inputs in 2013 and 2014, respectively (Table 4). There was little correlation between the soil water change and the NH3 volatilization (Figure 3, Figure 4 and Figure 8a,b), but the soil water content would affect the flux of the NH3 volatilization [9]. The cumulative fluxes of N H 4 + -N leaching and root uptake were less than 1 and 3 kg·N·ha−1, respectively (Figure 8c,e). It was found that the ammonia volatilization fluxes peaked during the first 10 days after fertilization, and they were mainly concentrated in the soil upper layer, where there was fertilizer application in this area [42]. In this study, it was six days earlier than in 2013 and three days earlier than in 2014. The conservation tillage practices in their study were the main reason for the difference, which caused different soil aeration, different soil water content, urea hydrolysis, and nitrification, and the soil microbial biological activities may also cause this difference. There were two stages of NH3 volatilization in 2013 (Figure 8a,b). The first one was happened after the first fertilization; however, the daily flux of NH3 volatilization was obviously lower than in 2014. The second increment occurred at the second fertilization, and the amount of fertilizer was lower than in the first period, but the second cumulative flux of NH3 volatilization was similar to the first period (Figure 8a). The changed weather conditions [42] and soil water content [9] would result in a similar flux of ammonia volatilization during the two periods. In 2014, there was a significant ammonia volatilization for the one-time fertilizer, although the soil water content was high during the ammonia volatilization process (Figure 4 and Figure 8); urea is a key driving force in soil ammonia volatilization [42]. These findings indicated that the risk of ammonia loss may increase in conjunction with a higher air temperature, low precipitation, and low soil water content following fertilizer.
The base values of N O 3 -N in the soil and the quantity of N fertilization determined the cumulative flux of N O 3 -N leaching [43]; in this study, the cumulative fluxes of N O 3 -N leaching were 18.13 and 31.26 kg·N·ha−1 in 2013 and 2014, respectively (Table 4). It has already been found that water stress and soil water infiltration were the main drivers of NH3 volatilization and nitrogen leaching [11]. In this study, higher soil evaporation and lower plant transpiration in 2014 than in 2013 (Figure 2) resulted in higher nitrogen leaching in 2014 than in 2013 (Table 4). There were two stages of N O 3 -N leaching in 2013 (Figure 9a,b). The first one was happened after the first fertilization; however, the flux of N O 3 -N leaching was limited under the film mulch on the ridge. Then, a rapid increment occurred after the second fertilization, which was caused by the preferential flow that happened in the furrow [44], where the urea was applied. Even so, the highest daily flux of N O 3 -N in 2013 was lower than that in 2014. This could be explained by the developed root system and a small amount of urea application in 2013 (Figure 10b) and low soil evaporation (Figure 2). The ratio of root N O 3 -N uptake rate and soil N O 3 -N concentration caused a different flux of nitrogen leaching (Figure 9f), and the different soil water condition in 2013 and 2014 also contributed to the difference in N O 3 -N leaching, which was previously discussed (Figure 3 and Figure 4). A high risk of nitrite leaching was found in 2014 (Figure 9a); for the one-time fertilization and water stress that happened during the three soil water decrease stages, especially the early stage of the growth (Figure 4), a low daily flux of N O 3 -N root uptake would also contribute to the high N O 3 -N leaching (Figure 9f). In conclusion, film mulch contributed to the reduction in N O 3 -N leaching; the urea application site would also affect N O 3 -N leaching. The N O 3 -N leaching was improved in the furrow; water stress would also affect N O 3 -N leaching.
N O 3 -N denitrification was another important means of N losses; the maximum flux of N O 3 -N denitrification in 2014 was higher than that in 2013 (Figure 9d) due to the high rate of fertilizer application in 2014. However, there was no significant difference between 2013 and 2014 in the cumulative flux of N O 3 -N denitrification (Figure 9c), and they mainly occurred at the early stage of growth. It was found that N O 3 -N denitrification was closely related to below-ground microbial processes [45]. It only worked within limits; there was no or low gaseous nitrogen emission when the substrate concentration was lower or higher than a qualified value [46]. According to the result, we further report that within the limits of concentration, the denitrification rate in related to the substrate concentration.

5. Conclusions

Soil water and nitrogen are two important contributing factors in the agricultural ecological system of the Loess Plateau, China. Their dynamic characters were clearly explained by Hydrus-2D, especially the losses and utilization of nitrogen. The ridge-furrow system with plastic mulch effectively improved the water consumption of the ridge and the furrow, indicating an improvement in the soil water lateral transfer under this system. It led to sustainable improvement in the efficient use of water in the ridge, furrow, and deep soil layer. The N H 4 + -N and N O 3 -N concentrations were mainly affected by the amount of fertilizer; N H 4 + -N was accumulated in the surface layer where there was the fertilizer application. There was an exchange of N O 3 -N between the ridge and the furrow when the fertilizer was applied in the furrow, and this process made a relative contribution to the nitrite leaching reduction.
One-time fertilizer could significantly aggrandize the cumulative and daily fluxes of NH3 volatilization. The amount of one-time fertilizer is the determining factor of the NH3 volatilization in this study. A higher soil evaporation, low precipitation, and low soil water content would also contribute to the cumulative flux of ammonia volatilization. Similarly, the cumulative flux of the N O 3 -N leaching was consistent with the amount of one-time fertilizer. However, when the fertilizer was applied in the furrow, the rate of nitrite leaching was higher than that applied in the ridge; film mulch and fertilizer on the ridge could contribute to the reduction in N O 3 -N leaching. The denitrification rate corresponded with the substrate concentration, within the limits of consistency. There would be no or low gaseous nitrogen emission, when the substrate concentration was beyond a certain range.

Author Contributions

Conceptualization, development, and design of the methodology, W.Z. and R.J.; writing—original draft, specifically visualization, W.Z.; supervision, R.Q.; funding acquisition, R.J. All authors have read and agreed to the published version of the manuscript.

Funding

This research was funded by the National Natural Science Foundation of China (grant number 41877086, 51879224) and the Natural Science Basic Research Plan in Shaanxi Province of China (grant number 2020JZ-16).

Data Availability Statement

Not applicable.

Acknowledgments

The authors would like to thank the financial support provided by the National Natural Science Foundation of China and the Changwu Agricultural and Ecological Experimental Station.

Conflicts of Interest

The authors declare no conflict of interest.

References

  1. Chen, Y.L.; Liu, T.; Tian, X.H.; Wang, X.F.; Li, M.; Wang, S.X.; Wang, Z.H. Effects of plastic film combined with straw mulch on grain yield and water use efficiency of winter wheat in loess plateau. Field Crops Res. 2015, 172, 53–58. [Google Scholar] [CrossRef]
  2. Ma, D.D.; Chen, L.; Qu, H.C.; Wang, Y.L.; Misselbrook, T.; Jiang, R. Impacts of plastic film mulching on crop yields, soil water, nitrate, and organic carbon in northwestern China: A meta-analysis. Agric. Water Manag. 2018, 202, 166–173. [Google Scholar] [CrossRef] [PubMed]
  3. Jiang, R.; Li, X.; Zhou, M.H.; Li, H.J.; Zhao, Y.; Yi, J.; Cui, L.L.; Li, M.; Zhang, J.G.; Qu, D. Plastic film mulching on soil water and maize (Zea mays L.) yield in a ridge cultivation system on Loess Plateau of China. Soil Sci. Plant Nutr. 2016, 62, 1–12. [Google Scholar] [CrossRef]
  4. Ranjbar, A.; Rahimikhoob, A.; Ebrahimian, H.; Varavipour, M. Simulation of nitrogen uptake and distribution under furrows and ridges during the maize growth period using Hydrus-2D. Irrig. Sci. 2019, 37, 495–509. [Google Scholar] [CrossRef]
  5. Jennings, E.; Allott, N.; Pierson, D.C.; Schneiderman, E.M.; Lenihan, D.; Samuelsson, P.; Taylor, D. Impact of climate change on phosphorus loading from a grassland catchment: Implication for future management. Water Res. 2009, 43, 4316–4326. [Google Scholar] [CrossRef]
  6. Ju, X.T.; Zhang, C. Nitrogen cycling and environmental impacts in upland agricultural soils in North China: A review. J. Integr. Agric. 2017, 16, 2848–2862. [Google Scholar] [CrossRef]
  7. Liu, W.Z.; Zhang, X.C.; Dang, T.H.; Ouyang, Z.; Li, Z.; Wang, J.; Wang, R.; Gao, C.Q. Soil water dynamics and deep soil recharge in a record wet year in the southern loess plateau of China. Agric. Water Manag. 2010, 97, 1133–1138. [Google Scholar] [CrossRef]
  8. Lin, W.; Liu, W.Z.; Xue, Q.W. Spring maize yield, soil water use and water use efficiency under plastic film and straw mulches in the Loess Plateau. Sci. Rep. 2017, 7, 42455. [Google Scholar] [CrossRef]
  9. Gu, L.M.; Liu, T.N.; Wang, J.F.; Liu, P.; Dong, S.T.; Zhao, B.Q.; So, H.B.; Zhang, J.W.; Zhao, B.; Li, J. Lysimeter study of nitrogen losses and nitrogen use efficiency of Northern Chinese wheat. Field Crops Res. 2016, 188, 82–95. [Google Scholar] [CrossRef]
  10. Guo, Y.; Ji, Y.; Zhang, J.; Liu, Q.; Han, J.; Zhang, L. Effects of water and nitrogen management on N2O emissions and NH3 volatilization from a vineyard in north China. Agric. Water Manag. 2022, 266, 107601. [Google Scholar] [CrossRef]
  11. Dong, Q.; Dang, T.H.; Guo, S.L.; Hao, M.D. Effects of mulching measures on soil moisture and N leaching potential in a spring maize planting system in the southern loess plateau. Agric. Water Manag. 2019, 213, 803–808. [Google Scholar] [CrossRef]
  12. De Silva, S.H.; Cook, H.F. Soil physical conditions and performance of cowpea following organic matter amelioration of sand. Commun. Soil Sci. Plant Anal. 2003, 34, 1039–1058. [Google Scholar] [CrossRef]
  13. Clark, L.J.; Whalley, W.R.; Barraclough, P.B. How do roots penetrate strong soil? Plant Soil 2003, 255, 93–104. [Google Scholar] [CrossRef]
  14. Zhang, H.Y.; Liu, Q.J.; Yu, X.X.; Lu, G.A.; Wu, Y.Z. Effects of plastic mulch duration on nitrogen mineralization and leaching in peanut (Arachis hypogaea) cultivated land in the Yimeng Mountainous Area, China. Agric. Ecosyst. Environ. 2012, 158, 164–171. [Google Scholar] [CrossRef]
  15. Huang, T.; Ju, X.T.; Yang, H. Nitrate leaching in a winter wheat-summer maize rotation on a calcareous soil as affected by nitrogen and straw management. Sci. Rep. 2017, 7, 42247. [Google Scholar] [CrossRef]
  16. Gao, J.B.; Wang, S.M.; Li, Z.Q.; Wang, L.; Chen, Z.J.; Zhou, J.B. High nitrate accumulation in the vadose zone after land-use change from croplands to orchards. Environ. Sci. Technol. 2021, 55, 5782–5790. [Google Scholar] [CrossRef]
  17. Li, S.X.; Wang, Z.H.; Li, S.Q.; Gao, Y.J.; Tian, X.H. Effect of plastic sheet mulch, wheat straw mulch, and maize growth on water loss by evaporation in dryland areas of China. Agric. Water Manag. 2013, 116, 39–49. [Google Scholar] [CrossRef]
  18. Wu, Y.; Huang, F.Y.; Zhang, C.; Jia, Z.K. Effects of different mulching patterns on soil moisture, temperature, and maize yield in a semi-arid region of the Loess Plateau. China. Arid Land Res. Manag. 2016, 30, 490–504. [Google Scholar] [CrossRef]
  19. Yu, Y.Y.; Turner, N.C.; Gong, Y.H.; Li, F.M.; Chao, F.; Ge, L.J.; Ye, J.S. Benefits and limitations to straw- and plastic-film mulch on maize yield and water use efficiency: A meta-analysis across hydrothermal gradients. Eur. J. Agron. 2018, 99, 138–147. [Google Scholar] [CrossRef]
  20. Zhao, Y.; Zhai, X.F.; Wang, Z.H.; Li, H.J.; Jiang, R.; Robert, L.H.; Si, B.; Feng, H. Simulation of soil water and heat flow in ridge cultivation with plastic film mulching system on the Chinese Loess Plateau. Agric. Water Manag. 2018, 202, 99–112. [Google Scholar] [CrossRef]
  21. Gee, G.W.; Or, D. Particle-size analysis. In Methods of Soil Analysis; Part 4; SSSA Book Ser. 5; Dane, J.H., Topp, G.C., Eds.; Soil Science Society of America: Madison, WI, USA, 2002; pp. 255–293. [Google Scholar]
  22. Klute, A.; Dirksen, C. Hydraulic conductivity and diffusivity: Laboratory methods. In Methods of Soil Analysis, 2nd ed.; Part 1; SSSA Book Ser. 5; Klute, A., Ed.; Soil Science Society of America: Madison, WI, USA, 1986; pp. 687–734. [Google Scholar]
  23. Feddes, R.A.; Kowalik, P.J.; Zaradny, H. Simulation of Field Water Use and Crop Yield; John Willey and Sons: New York, NY, USA, 1978. [Google Scholar]
  24. Šimůnek, J.; Hopmans, J.W. Modeling compensated root water and nutrient uptake. Ecol. Model. 2009, 220, 505–521. [Google Scholar] [CrossRef]
  25. Chowdary, V.M.; Rao, N.H.; Sarma, P.B.S. A coupled soil water and nitrogen balance model for flooded rice fields in India. Agric. Ecosyst. Environ. 2004, 103, 425–441. [Google Scholar] [CrossRef]
  26. Iqbal, S.; Guber, A.K.; Khan, H.Z. Estimating nitrogen leaching losses after compost application in furrow irrigated soils of pakistan using Hydrus-2d software. Agric. Water Manag. 2016, 168, 85–95. [Google Scholar] [CrossRef]
  27. Karandisha, F.; Šimůnek, J. Two-dimensional modeling of nitrogen and water dynamics for various N-managed water-saving irrigation strategies using HYDRUS. Agric. Water Manag. 2017, 193, 174–190. [Google Scholar] [CrossRef]
  28. Siyal, A.A.; Skaggs, T.H. Measured and simulated soil wetting patterns under porous clay pipe sub-surface irrigation. Agric. Water Manag. 2009, 96, 893–904. [Google Scholar] [CrossRef]
  29. Wang, Y.; Zhang, B.; Lin, L.; Hazald, Z. Agroforestry system reduces subsurface lateral flow and nitrate loss in Jiangxi Province, China. Agric. Ecosyst. Environ. 2011, 140, 441–453. [Google Scholar] [CrossRef]
  30. Kandelous, M.M.; Kamai, T.; Vrugt, J.A.; Šimůnek, J.; Hanson, B.; Hopmans, J.W. Evaluation of subsurface drip irrigation design and management parameters for alfalfa. Agric. Water Manag. 2012, 109, 81–93. [Google Scholar] [CrossRef]
  31. Karandish, F.; Šimůnek, J. A comparison of numerical and machine-learning modeling of soil water content with limited input data. J. Hydrol. 2016, 543, 892–909. [Google Scholar] [CrossRef]
  32. Qin, W.; Chi, B.L.; Oenema, O. Long term monitoring of rain-fed wheat yield and soil water on the loess plateau reveals low water use efficiency. PLoS ONE 2013, 8, e78828. [Google Scholar] [CrossRef]
  33. Zribi, W.; Aragüés, R.; Medina, E.; Faci, J.M. Efficiency of inorganic and organic mulching materials for soil evaporation control. Soil Till. Res. 2015, 148, 40–45. [Google Scholar] [CrossRef] [Green Version]
  34. Nkrumah, M.; Griffith, S.M.; Ahmad, N. Lysimeter and field studies on 15N in a tropical soil: II. Transformation of (NH2)2CO-15N in a tropical loam in lysimeter and field plots. Plant Soil 1989, 114, 13–18. [Google Scholar] [CrossRef]
  35. Zhou, J.B.; Xi, J.G.; Chen, Z.J.; Li, S.X. Leaching and transformation of nitrogen fertilizer in soil after application of N with irrigation: A soil column method. Pedosphere 2006, 16, 245–252. [Google Scholar] [CrossRef]
  36. Wang, R.Z.; Filley, T.R.; Xu, Z.W.; Wang, X.; Li, M.H.; Zhang, Y.G.; Luo, W.T.; Jiang, Y. Coupled response of soil carbon and nitrogen pools and enzyme activities to nitrogen and water addition in a semi-arid grassland of Inner Mongolia. Plant Soil 2014, 381, 323–336. [Google Scholar] [CrossRef]
  37. Zhu, W.; Yang, J.S.; Yao, R.J.; Wang, X.P.; Xie, W.P.; Li, P.G. Nitrate leaching and NH3 volatilization during soil reclamation in the Yellow River Delta, China. Environ. Pollut. 2021, 286, 117330. [Google Scholar] [CrossRef]
  38. Shamrukh, M.; Corapcioglu, M.Y.; Hassona, F. Modeling the effect of chemical fertilizers on ground water quality in the Nile Valley Aquifer, Egypt. Groundwater 2001, 39, 59–67. [Google Scholar] [CrossRef]
  39. Li, Z.L.; Zeng, Z.Q.; Tian, D.S.; Wang, J.S.; Fu, Z.; Zhang, F.Y.; Zhang, R.Y.; Chen, W.N.; Luo, Y.Q.; Niu, S.L. Global patterns and controlling factors of soil nitrification rate. Glob. Chang. Biol. 2020, 26, 4147–4157. [Google Scholar] [CrossRef]
  40. Dong, Q.G.; Yang, Y.C.; Yu, K.; Feng, H. Effects of straw mulching and plastic film mulching on improving soil organic carbon and nitrogen fractions, crop yield and water use efficiency in the Loess Plateau, China. Agric. Water Manag. 2018, 201, 133–143. [Google Scholar] [CrossRef]
  41. Sommer, S.G.; Schjoerring, J.K.; Denmead, O.T. Ammonia emission from mineral fertilizers and fertilized crops. Adv. Agron. 2004, 82, 557–622. [Google Scholar]
  42. Yang, Y.; Zhou, C.J.; Li, N.; Han, K.; Meng, Y.; Tian, X.X.; Wang, L.Q. Effects of conservation tillage practices on ammonia emissions from Loess Plateau rain-fed winter wheat fields. Atmos. Environ. 2015, 104, 59–68. [Google Scholar] [CrossRef]
  43. Libutti, A.; Monteleone, M. Soil vs groundwater: The quality dilemma. Managing nitrogen leaching and salinity control under irrigated agriculture in Mediterranean conditions. Agric. Water Manag. 2017, 186, 40–50. [Google Scholar] [CrossRef]
  44. Jiang, X.J.; Liu, W.J.; Chen, C.F.; Liu, J.Q.; Yuan, Z.Q.; Jin, B.C.; Yu, X.Y. Effects of three morphometric features of roots on soil water flow behavior in three sites in China. Geoderma 2018, 320, 167–171. [Google Scholar] [CrossRef]
  45. Braker, G.; Conrad, R. Diversity, structure, and size of N2O-producing microbial communities in soils-what matters for their functioning? Adv. Appl. Microbiol. 2011, 75, 33–70. [Google Scholar] [PubMed]
  46. Wrage, N.; Velthof, G.L.; Beusichem, M.; Oenema, O. Role of nitrifier denitrification in the production of nitrous oxide. Soil Biol. Biochem. 2001, 33, 1723–1732. [Google Scholar] [CrossRef]
Figure 1. Demonstration of model domain for simulation of soil water and heat flow in ridge cultivation system with plastic film mulching. (Different colors refer to different soil layers).
Land 11 01514 g001
Figure 2. Precipitation and evapotranspiration distribution during two growing seasons.
Land 11 01514 g002
Figure 3. Spatial and temporal distribution of soil water content in 2013.
Land 11 01514 g003
Figure 4. Spatial and temporal distribution of soil water content in 2014.
Land 11 01514 g004
Figure 5. Spatial and temporal distribution of soil N H 4 + -N concentration.
Land 11 01514 g005
Figure 6. Spatial and temporal distribution of soil N O 3 -N content in 2013.
Land 11 01514 g006
Figure 7. Spatial and temporal distribution of soil N O 3 -N content in 2014.
Land 11 01514 g007
Figure 8. Dynamic change of N H 4 + -N processes.
Land 11 01514 g008
Figure 9. Dynamic change of N O 3 -N processes.
Land 11 01514 g009
Figure 10. Leaf area index and root depth during two growing seasons.
Land 11 01514 g010
Table 1. Soil hydraulic parameters of different soil layers.
Soil Layerθr (cm3·cm−3)θs (cm3·cm−3)Alpha (cm−1)nKs (cm·d−1)l
+15–10 cm0.08910.49330.006282.50460.5
10–30 cm0.07590.39320.003412.50220.5
30–60 cm0.08260.43950.005951.96760.5
60–100 cm0.09340.510.016341.622500.5
100–160 cm0.06850.40420.005342.02700.5
Note: θr is residual water content, θs is saturated water content, Alpha is reciprocal value of air-entry pressure, n is the smoothness of pore size distribution, Ks is saturated hydraulic conductivity, l is the tortuosity parameter in the conductivity function.
Table 2. Nitrogen transport and transformation parameters for different layers.
Soil Layer D L D T K d μ w , 1 μ w , 2 μ w , 2 μ s , 2 μ w , 3 μ s , 3 γ w , 2 γ s , 2
+15–10 cm1073.50.700.050.350.350.020.020.040.04
10–30 cm533.50.700.050.350.350.020.020.040.04
30–60 cm6.243.50.500.050.250.250.010.010.040.04
60–100 cm1173.50.400.050.420.420.010.010.040.04
100–160 cm6.553.50.400.050.140.140.010.010.040.04
Note: Kd is ammonium distribution coefficient, μ w , 1 is hydrolysis coefficient, μ w , 2 is volatilization coefficient, μ w , 2 and μ s , 2 are nitrification coefficients, μ w , 3 and μ s , 3 are denitrification coefficients, γ w , 2 and γ s , 2 are comprehensive production rate of mineralization and immobilization, w and s are liquid phase and solid phase, respectively, D L and D T are longitudinal dispersivity and transverse dispersivity, respectively.
Table 3. Comparison between the simulated and measured values at different depths.
RidgeFurrow
Depth/cm+15103060100103060100160
Soil water content (cm3·cm−3)
2013RMSE0.0260.0300.0260.0240.0180.0450.0320.0210.0150.024
NSE0.2430.2380.7710.3830.5960.4350.6800.6330.755−0.295
2014RMSE0.0220.0150.0320.0310.0230.0170.0250.0380.0180.025
NSE0.4300.8340.4240.5010.5350.8800.7300.1420.6900.482
N H 4 + -N (mg·kg−1)
2013RMSE2.1292.182——————3.6310.545——————
NSE0.5190.473——————0.3820.841——————
2014RMSE0.6041.642——————1.6371.651——————
NSE1.0000.990——————0.9360.971——————
N O 3 -N (mg·kg−1)
2013RMSE5.7463.0542.0481.3370.8872.5022.3732.0271.8091.086
NSE0.9750.9220.8380.5990.5350.879−0.1630.3850.009−0.697
2014RMSE4.4694.8553.3205.6453.2834.6003.1133.0334.4442.795
NSE0.9900.9060.8800.2790.8260.6050.6550.5910.2880.290
Table 4. Nitrogen flux during two growing seasons.
Unit (kg·N·ha−1)20132014
Input160 + 60220
N mineralization91.6784.82
N denitrification12.0811.65
Ammonia volatilization20.4027.41
Nitrate leaching18.1331.26
Plant uptake N ( N O 3 -N/ N H 4 + -N)219.31 (217.52/1.79)196.99 (194.46/2.53)
Yield (kg·ha−1)13,80012,116
Publisher’s Note: MDPI stays neutral with regard to jurisdictional claims in published maps and institutional affiliations.

