Article

Understanding Sustainable Livelihoods with a Framework Linking Livelihood Vulnerability and Resilience in the Semiarid Loess Plateau of China

1
Shaanxi Key Laboratory of Earth Surface System and Environmental Carrying Capacity, Northwest University, Xi’an 710127, China
2
College of Urban and Environmental Sciences, Northwest University, Xi’an 710127, China
*
Author to whom correspondence should be addressed.
Land 2022, 11(9), 1500; https://doi.org/10.3390/land11091500
Submission received: 13 August 2022 / Revised: 27 August 2022 / Accepted: 2 September 2022 / Published: 7 September 2022

Abstract

:
Regional climate is complicated and unpredictable in the context of global climate change. Farmers on the Loess Plateau, who rely on agriculture and natural resources for subsistence, are one of the groups feeling the early effects of climate change. Their vulnerability is determined by their degree of connection with the natural environment. Frequent droughts on the Loess Plateau have severely challenged farmers’ livelihoods, although some actions have been taken to adapt to these changes. To enable farmers to find sustainable livelihood strategies in challenging natural conditions, we established a research framework to link livelihood vulnerability and resilience and applied it to Jiaxian County, a specific research area in the Loess Plateau of China. To validate previous research, we studied the fluctuation trends of farmers’ livelihood vulnerability and livelihood resilience in the past 30 years and the interrelationships between these two trends and their influencing factors. The results are as follows: since 1990, livelihood vulnerability has been polarized; however, moderate vulnerability has always been dominant. Livelihood resilience shows a trend of continuous enhancement. The relationship between livelihood vulnerability and resilience is complex, and the direction of change between the two can be both similar and different. The topography, arable land conditions, soil quality, and irrigation conditions in different areas impact vulnerability and resilience, and the degree of impact is different in different periods. Farmers’ livelihood strategies depend on their cognitive decision making and livelihood assets, which are critical vulnerability and resilience factors. Most farmers in the study area have undergone significant livelihood strategy changes, while some maintain their original livelihood strategies. These findings provide policy implications for reducing vulnerability, enhancing resilience, and helping smallholder farmers find sustainable livelihood strategies to avoid poverty traps.

1. Introduction

In its Fifth Assessment Report, the Intergovernmental Panel on Climate Change (IPCC) concluded that climate change would significantly impact many regions, especially low-income developing countries. It may accelerate urbanization, exposing farmers who relocate to cities and towns to severe risks of infectious diseases and rising food prices [1]. The most noticeable effect is that all countries face significant risks of rising temperatures and drought under climate change [2], and droughts will likely become more common in presently dry regions, as will the problems associated with water availability, food security, and farmer’s livelihoods in rural areas by the end of the 21st century.
Drought is one of the main factors among climatic events affecting the livelihood of more than two billion people in arid regions, covering 41% of the world’s land area [3]. Since the second half of the 20th century, increased droughts due to global warming have caused unprecedented hardships and challenges for countless farming populations that depend on soil and water for their agriculture-related activities. In other words, increased drought poses a significant threat to the sustainability of rural livelihoods; other studies have shown that drought hinders national GDP growth [4]. Relatively fragile ecology and long-term high-intensity exploitation of the Loess Plateau in China have led to the degradation of the ecosystem, which was once one of the most devastated areas of soil erosion in the world [5]. In addition, evaporation is often greater than precipitation, and drought severely restricts agricultural development; farmers’ livelihood is more difficult in the Loess Plateau than in other regions. The scarcity of natural resources, ecological degradation, and drought worsened by climate change make it difficult for farmers to meet their basic needs through agriculture. To achieve the goal of a sustainable livelihood on the Loess Plateau, farmers need to respond to and recover from stresses and shocks, maintain or enhance their capabilities and assets, and provide sustainable livelihood opportunities for the next generation, resulting in net benefits for other livelihoods at the local and global levels and in the short and long term [6]. Therefore, the following issues need to be clarified: What is farmers’ livelihood vulnerability? What is the primary manifestation of this vulnerability? What is resilience? What is the primary manifestation? What is the relationship between vulnerability and resilience?
The concepts of vulnerability and resilience are increasingly crucial for understanding the relationship between human activities and natural environments. The concept of vulnerability stems from research on natural disasters and poverty, resulting in different definitions from different perspectives, but a common attribute is the ability to respond to disturbances. Existing research has largely focused on case studies of natural disasters and climate change [7]. An actor-oriented approach is often preferred, seeking the root causes, scale and relevant actors of vulnerability to identify pathways to respond [8]. Resilience originated from the study of ecosystems, flora and fauna by ecologists. It is a measure of the ability of the systems to absorb disturbances and continue to maintain their functions, which then determines the persistence of relationships within the system [9]. Existing research focuses on the theoretical model in ecology and mathematics, taking a systematic approach to emphasize interactions across time and scales [10]. Vulnerability and resilience are two interconnected concepts. Vulnerability is concerned with the degree of exposure, susceptibility and adaptability of a system to external shocks, and resilience considers the dynamics of families or communities and how they respond to and recover from external shocks. Much research has focused on qualitative and quantitative vulnerability assessments [11,12,13,14,15,16,17], and few studies have simultaneously focused on resilience [18], which often relies on aggregating static vulnerability. Resilience facilitates a comprehensive analysis of vulnerability, and its forward-looking nature contributes to exploring and dealing with uncertainty [19]. The separate concepts and approaches of vulnerability and resilience are disconnected from reality and do not meet the needs of sustainable development. Thus, this initiative brings together a concern for vulnerability and resilience [8]. We use quantitative analysis to link vulnerability to resilience through adaptive capacity and apply it to livelihood systems to explore the relationship between them, and then we analyze the influencing factors that support sustainable livelihoods for farmers on the Loess Plateau.
This study’s objectives are twofold. The first is to develop a framework for estimating farmers’ livelihood vulnerability and resilience in the ecologically fragile region of the Loess Plateau. The second is to investigate the connection between livelihood vulnerability and resilience. Studying farmers’ livelihoods on a microscale is essential for improving their ability to cope with, respond to, and recover from the impact of perturbations, as well as to capitalize on opportunities. This objective is particularly conducive to policy formulation and implementation. This paper is structured in the following way. Section 2 provides a brief introduction to the data. Section 3 develops the analytical framework, Section 4 presents the findings, and the final section concludes with a discussion. The above research takes Jiaxian County, northern Shaanxi Province as the research area, and the temporal scope is from 1990 to 2020.

2. Materials and Methods

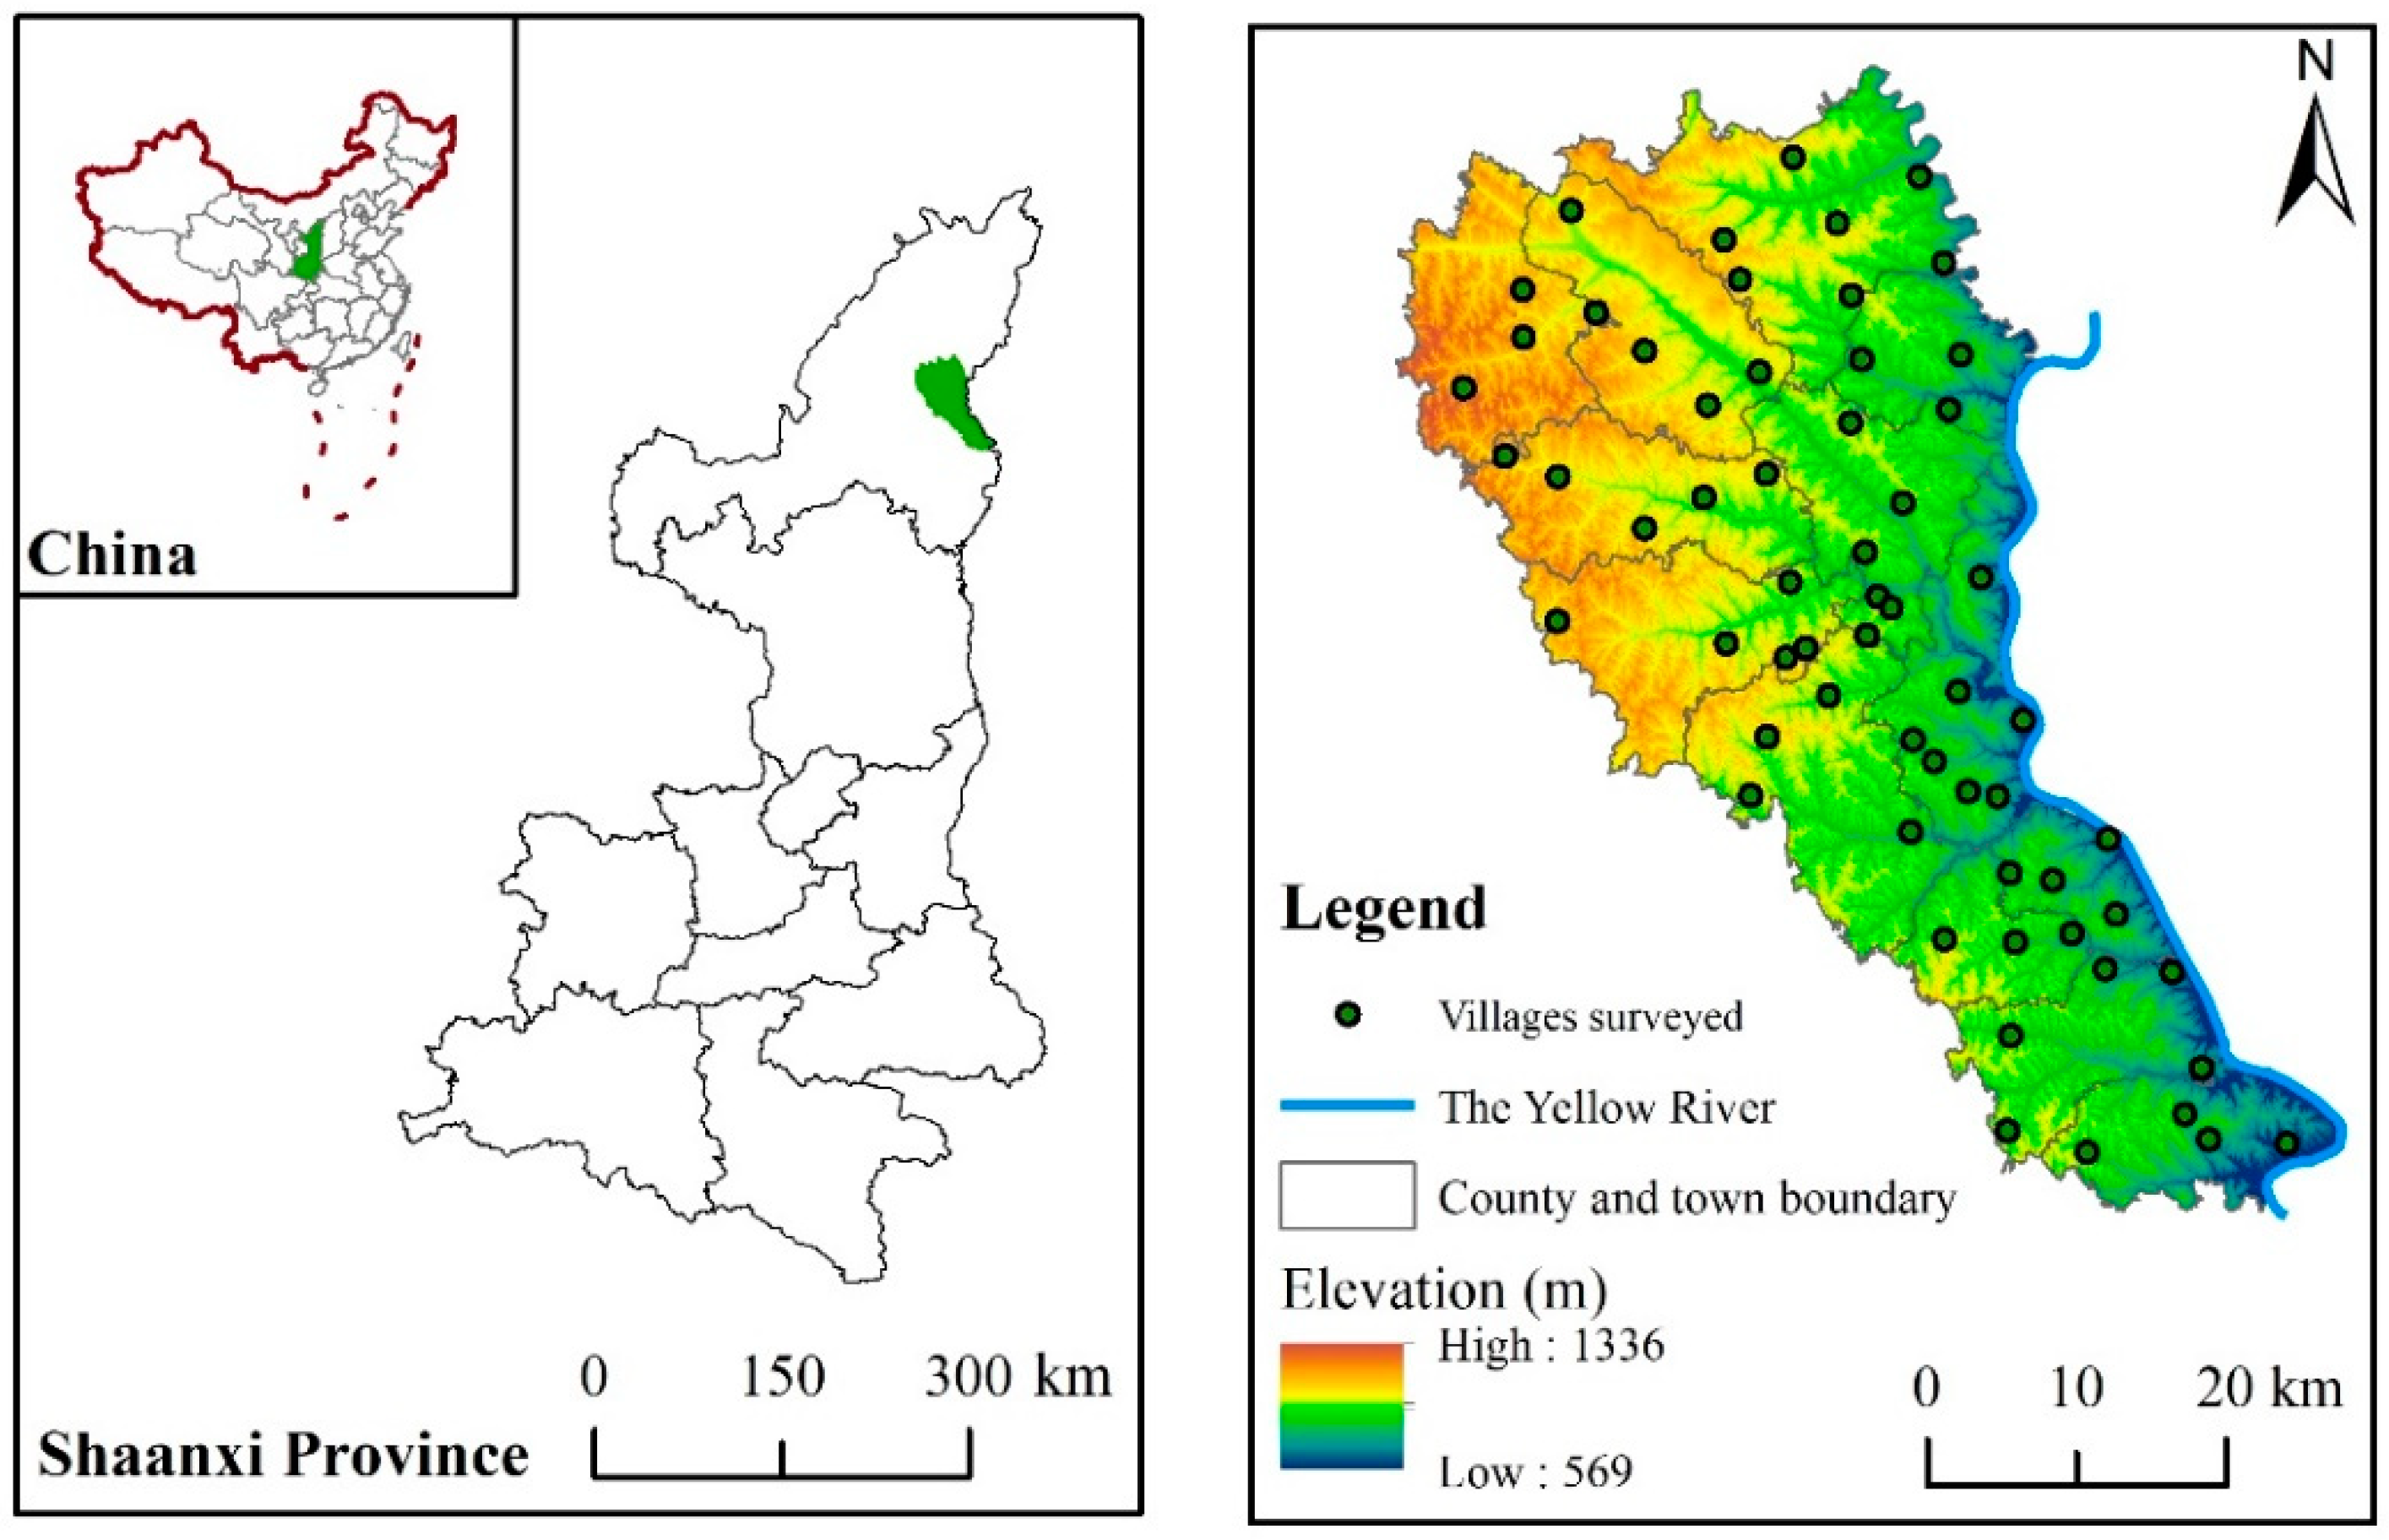
2.1. Study Area and Data Collection

This study was undertaken in Jiaxian County, northern Shaanxi Province (Figure 1). The region has a continental dry monsoon climate, with 386~451.1 mm of annual precipitation. Due to severe soil erosion in the study area, the Mu Us Desert has gradually invaded southward, forming three distinct geomorphological subregions: the hilly and sandy area in the north, the hilly and gully area in the southwest, and the hilly and rocky area along the Yellow River in the southeast. The desert covers the ground in flaky shapes with varying thickness, high terrain, and lighter water erosion in the sandy area. The landform is rounded, with a long beam-shaped landform, endless sand dunes, large hills with gentle slopes, and alternating ditch beams. The gully area is fragmented, and the terrain slopes northwest to southeast; the deeper the gully is, the steeper the slope. The low-lying rocky area has high mountains, deep gullies, and steep cliffs. The administrative region has a total area of 2029.82 km2, with the sandy area accounting for 30.4% of the total area, the gully area accounting for 52.2%, and the rocky area accounting for 17.4%. The area along the Yellow River is the most suitable for growing dates in Northern China and has a long planting history. The date, industry has become an important economic pillar of the county, with a planting area of 51,880 hm2 and an annual output of 271,500 tons.
This study used microlevel survey data collected from rural households in Jiaxian County from 2017 to 2021. In October 2017, we conducted a preliminary investigation and visited the statistics bureau and county annals office, bureau of natural resources, weather department, date industry management office, and other government departments to obtain data and information. We extracted three towns using stratified random sampling per the three geomorphological areas. We randomly selected three villages from each town, and we interviewed two households from each village for approximately 30 min. A total of 52 effective recordings of key figures’ interviews (village cadres, household heads, etc.) were obtained. A total of 61 villages were chosen, and each of these villages had 5–7 households chosen randomly. We eventually collected 381 effective questionnaires from these 61 villages, with 84 in the sandy area, 223 in the gully area, and 74 in the rocky area; the rate of efficiency was 99.5%. The subjects of the questionnaire ranged in age from 40 to 70 years old, and each questionnaire took 40–60 min to complete. Interviews were conducted, and questionnaires were distributed to village cadres and other key figures, from whom 42 questionnaires were obtained. The questionnaire includes six parts: basic household information, natural capital, material capital, financial capital, social capital, and household perceptions since 1990.

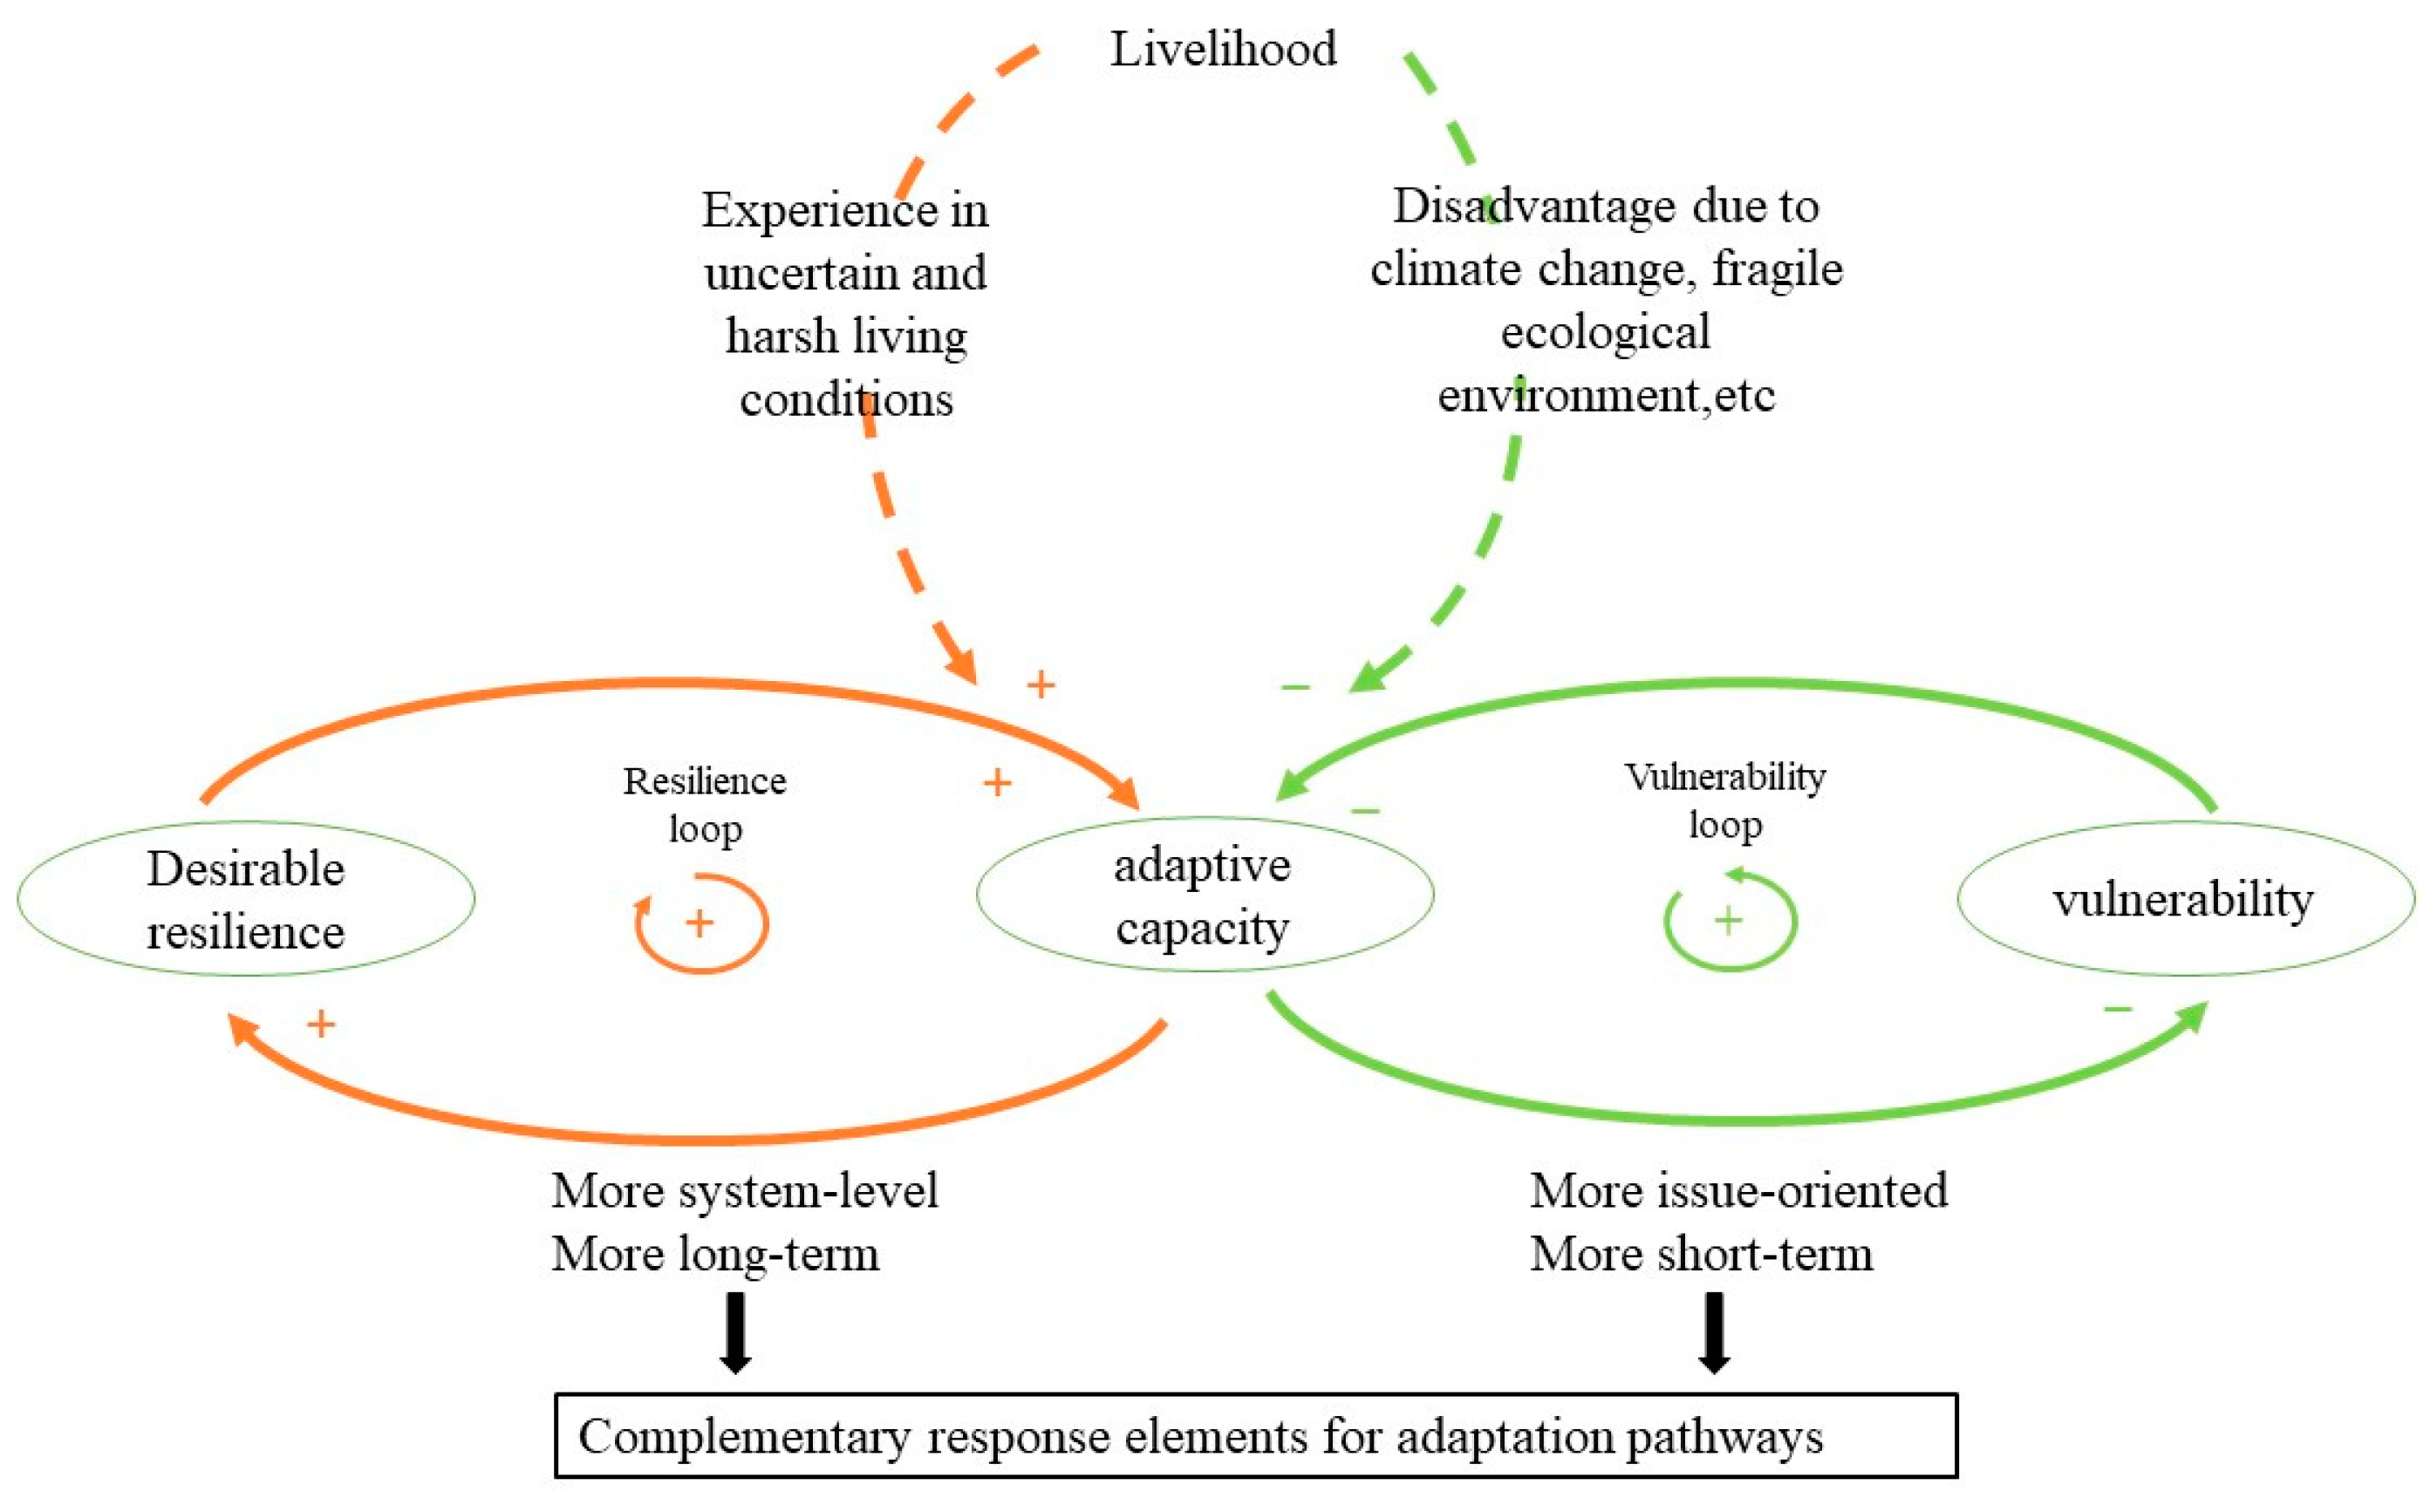
2.2. A Framework Linking Livelihood Vulnerability and Resilience

The IPCC incorporated vulnerability as an essential concept into the sustainable livelihood (SL) framework (2001), defining it as the degree to which a system is susceptible to, or unable to cope with, adverse effects such as climate change variability and extremes. The IPCC also stated that the systems’ vulnerability is determined by three factors: exposure, sensitivity, and adaptive capacity. Exposure is the degree of nature and significant climate variations; sensitivity is the degree affected, either adversely or beneficially; adaptive capacity is defined as the ability to adjust to the potential threat, take advantage of the opportunity, or deal with the consequences [20]. Livelihood vulnerability can be understood as an outcome of biophysical and social factors, and biophysical vulnerability refers to the degree of exposure from the physical impacts of climate change, such as drought intensification [21]. In this paper, livelihood vulnerability means that rural households’ livelihoods are vulnerable to drought and the barren geographical environment on the Loess Plateau.
Incorporating the concept of resilience into livelihood research helps frame livelihood in terms of sustainability [22]; furthermore, using resilience as a method can help clarify the dynamics of how people make a living and the complexity of the adaptive system [23]. Connecting livelihood approaches to resilience thinking can help us better understand livelihood dynamics and how households maintain and improve their livelihoods in the face of stress and shocks. In this paper, we chose to use Chamber and Conway’s widely accepted definition of livelihood vulnerability and resilience [6]. They believed a resilient livelihood would have little stress on primary productivity and could create new economic and social development opportunities. Livelihood resilience is characterized by actors’ assets and strategies for maintaining and increasing assets, self-organizing, and learning. Thus, livelihood resilience is determined by the effectiveness of livelihood, the capacity and agency of actors, and the social, institutional, and natural conditions.
Only a few researchers have attempted to build a connection between vulnerability and resilience [24]. As we will analyze below, almost none of these has been carried out in China’s context of the Loess Plateau. Examining the trade-offs between vulnerability and resilience perspectives in livelihood theory can help supplement academic research in this field. Resilience approaches typically emphasize the interaction of long-term, slowly changing and short-term, rapidly changing variables, as well as how they affect scales in time and space [25]. Vulnerability, on the other hand, focuses on human agency and hazards in much shorter time frames [26]. A framework that combines resilience and vulnerability can provide a perspective that considers both long-term and short-term time and space. Thus, we employ Mura’s framework and incorporate it into the livelihood system [27] (Figure 2).
We consider livelihood vulnerability and resilience as overlapping concepts connected by adaptive capacity. In this framework, vulnerability and resilience become feedback loops, and the strength of two feedback loops when facing different perturbations at different times is different. In general, multiple stresses may cause the vulnerability loop to temporarily dominate, while the resilience loop may be latent. The fragile ecological environment in the Loess Plateau has negative and positive impacts on farmers’ adaptive capacity, thereby determining vulnerability and resilience. The adverse effects are mainly reflected in the drought worsened by climate change and its natural conditions (such as natural resources, agricultural production conditions, and infrastructure), weakening the adaptive capacity of the vulnerability loop and thereby leading to increased vulnerability. At the same time, this vulnerability is most visible in short-term feedback and undesirable long-term forms of resilience, such as poverty traps. The positive effects are mainly reflected in the unfavorable living environment, which may enable farmers to be more adaptable than farmers in other regions and reinforce desirable resilience sequentially in the resilience loop.

2.3. Approaches to Measuring Livelihood Vulnerability

The vulnerability analysis framework has matured and has been widely used over time [28,29,30,31], scholars typically assess it for three key dimensions of vulnerability: (1) exposure; (2) sensitivity; and (3) adaptive capacity [29,32,33,34,35,36]. Based on the preceding discussions, we identified the following livelihood vulnerability index (LVI) measures as proxies for livelihood vulnerability (Table 1). The ecological environment and the arid climate have a significant impact on the livelihood of farmers on the Loess Plateau, and the impact of these two factors is continuous and cannot be defined at a specific time as Kumar did [18], so we used drought perceptions among farmers in this paper.
The type and magnitude determine vulnerability, and rate of climate change and variation to which a system is subjected, as well as the system’s sensitivity and adaptive capacity. Hahn provided a reference for calculating LVI [37], which considered LVI to be a function of exposure sensitivity to adaptive capacity and calculated it using Equation (1):
L V I = e x p o s u r e s e n s i t i v i t y / a d a p t i v e   c a p a c i t y
where e x p o s u r e s e n s i t i v i t y = i = 1 n w i x i , a d a p t i v e   c a p a c i t y = i = 1 n w i x i , w i represents the weight of the indicator, and x i represents the standardization value of the indicator.
Data standardization was performed using the following equations:
x i = x x m i n x m a x x m i n ( x   is   a   positive   indicator )
x i = x m a x x x m a x x m i n ( x   is   a   negative   indicator )
where x is an observed value in an array of observed values for a given variable; x m a x is the highest value in the same array; and x m i n is the lowest value in the same array.

2.4. Approaches to Measuring Livelihood Resilience

Linking livelihood approaches to resilience is beneficial for understanding livelihood dynamics and improving their ability to deal with various stresses and shocks [22]. In essence, livelihood resilience can be defined as the capacity of livelihoods to protect against stresses and disturbances while maintaining or improving their essential properties and functions. Livelihood resilience is characterized by actors’ assets and strategies for maintaining and increasing their assets, self-organizing, and learning [38]. The following authors established various research frameworks and indicators for various research backgrounds. Quandt measured resilience using the SL approach and its five capital assets [39,40]; Sallu used a livelihood trajectory approach to investigate the shocks and stresses that affect livelihoods and build resilience [41]. Individual livelihood coping ability, individual well-being, access to livelihood resources, and the sociophysical robustness of the local community are the four indicators used to assess livelihood resilience by Sina [42]; Saker measured livelihood resilience based on riverine island dwellers’ adaptive capacity, absorptive capacity, and transformative capacity in the face of natural disasters [43]. We used three major attributes from the definition of resilience in this paper; these are buffer capacity, self-organization, and learning capacity, which can be further deconstructed into various indicators based on the literature, expert consultation, and field experience [38] (Table 2). Buffer capacity has been defined as the amount of change (disturbance) a system can absorb while retaining the same structure, function, identity, and feedback on function and structure [44]. Self-organization emphasizes how human agency, adaptive capacities, power, and social interactions shape social resilience [45]. Adaptive capacity refers to the ability to learn, which is essential for developing resilience in an individual’s livelihood.
We used the composite index model as follows:
L R I = i = 1 18 w i x i
where LRI represents livelihood resilience index, w i represents the weight of the i indicator, and x i represents the standardization value of the i indicator. The data standardization method is the same as Equations (2) and (3).

3. Results

3.1. LVI

We divided the LVI results into three categories: low vulnerability, moderate vulnerability, and high vulnerability. Table 3 depicts the detailed distribution for the three categories. According to the table, the proportion of low- and high-vulnerability households has gradually increased, while moderate-vulnerability households have decreased since 1990. In particular, the number of low-vulnerability households increased from 9% to 14%, the number of high-vulnerability households increased from 2% to 18%, and the number of moderate-vulnerability households decreased from 87% to 66%. This demonstrates that the LVI of Jiaxian County has gradually become polarized; however, moderate vulnerability has always prevailed. According to Table 4, the proportion of households with weakened vulnerability is 12.3%, the proportion with the same category of vulnerability is 65.1%, and the strengthened vulnerability is 22.6%. The majority of them are weakened from moderate to low vulnerability, the vast majority of the remaining households are vulnerable from moderate to high vulnerability, and moderate to high vulnerability dominates among the strengthened households.

3.2. LRI

The LRI results were divided into three categories: low resilience, moderate resilience, and high resilience. Table 5 depicts the detailed distribution for the three categories. As shown in the table, the proportion of households with low resilience decreased steadily from 34% to 0.3%, the proportion of households with moderate resilience increased and then decreased, the overall trend decreased from 64% to 49%, and the proportion of households with high resilience increased steadily to 47%. As a result, the LRI in Jiaxian County is improving steadily. In terms of quantity fluctuations in Table 6 categories, there were only three households with weakened resilience, 32.5% of households with changeless resilience, and 66.7% of households with enhanced resilience. Among them, the weakened households all decreased from moderate to low. The weakened households all dropped from moderate to low. Moderate resilience predominated among households that remained unchanged, while moderate to high resilience predominated among strengthened households.

3.3. The Relationship between Livelihood Vulnerability and Resilience

We analyzed the vulnerability and resilience calculation results to summarize the vulnerability and resilience relationship, as well as the level changes between the two, to reveal their relationship. After 1990, resilience among low-vulnerability households gradually increased from low to medium to high. The proportion of low resilience decreased from 34% to 4%, while moderate resilience increased from 63% to 83% and then decreased to 56%. The proportion of people with high resilience increased steadily from 2% to 40%. Among moderately vulnerable households, resilience gradually increased from low to moderate to high, with the proportion of low resilience dropping from 34% to 3%, the proportion of moderate resilience increasing from 64% to 72% and then decreasing to 49%, and the proportion of high resilience increasing from 1% to 48%. Among high-vulnerability households, moderate resilience gradually shifted to medium-high resilience, low resilience decreased from 11% to 3%, moderate resilience decreased from 88% to 46%, and the proportion of high resilience increased from 0 to 51%. This shows that low, moderate, and high vulnerability dominance correspond to the resilience grades, all of which are moderate and high. The relationship between vulnerability and resilience is complex and dynamic, and there is no linear relationship.
In terms of changes in vulnerability and resilience (Table 7), among the 47 households with weakened vulnerability, the resilience of 16 households was maintained at its original level, the resilience of 29 households increased by one level, and the resilience of 2 households increased by two levels. The vulnerability of 248 households remained unchanged. Only two households saw their resilience level reduced, while 80 remained at their original level, 138 increased by one level, and 28 increased by two levels. Only 1 of the 83 households whose vulnerability increased by one level had resilience weakened by one level, 28 maintained their original level, 42 increased by one level, and 12 increased by two levels. Three households’ vulnerability increased by two levels, two by one level, and one by two levels. We conclude that the change direction between vulnerability and resilience varies over time. Not only does vulnerability sometimes weaken while resilience grows, but vulnerability also can remain constant while resilience grows, and both can even increase at the same time.

4. Discussion

4.1. The Impact of Topography on Livelihood Vulnerability

From 1990 to 2020, the study area generally accounted for the majority of moderately vulnerable households, and moderately vulnerable households evolved into low or high vulnerability, and most of them evolved into high vulnerability. According to the three major geomorphological zones, the proportion of high vulnerability households in the sandy area increased and then decreased, while those in the gully and rocky areas increased. The proportions were higher in the sandy and gully areas than in the rocky area along the Yellow River (Table 8).
Households with high vulnerability were mainly concentrated in the northern sandy area and the southwestern gully area. Most of these households were traditional agricultural households that primarily planted corn and had only one source of income since 1990. The northern sandy area is a grain-grazing area with a large woodland area and some breeding grounds, a large arable land area, and plentiful water resources, but the soil is desertified and low in fertility. Farmers used extensive management techniques, such as extensive planting and thin harvesting. The southwest gully area is a grain area with good soil texture where farmers grow primarily traditional grains, but the area has sparse vegetation, severe soil erosion, and a lack of water resources. The rocky area along the Yellow River’s southeastern bank is part of the date–grain intercropping area, which is suitable for planting various fruit trees. Farmers have planted a large area of red dates with high yields and quality since the 1950s.
The vulnerability of livelihoods depends on the ratio of household exposure sensitivity to adaptive capacity. Many households have cultivated land that is primarily sloping and unsuitable for large-scale planting and is greatly affected by natural disasters such as drought. Drought is the most serious natural disaster in Jiaxian County, and the average annual precipitation over many years can meet only half of the crop’s water demand. Precipitation is concentrated in July, August, and September, with a very low utilization rate. Furthermore, hail and frost that occur during crop growth and maturity cause significant damage to agricultural production. For a long time, since the reform and opening up, rural households’ income has been primarily based on agricultural income, and climatic conditions and natural capital status primarily determine the livelihood status of these families. Furthermore, if family members suffer from chronic diseases or the core labor force suffers from emergencies such as illness or accidents that necessitate significant household economic expenditures, the impact on livelihood vulnerability can be profound. Persistence is one of the spectacular characteristics of drought in the Loess Plateau; however, farmers may be more vulnerable to impending drought before fully recovering from a previous drought.

4.2. The Impact of Topography on Livelihood Resilience

The LRI of Jiaxian County households increased from 1990 to 2020, with the proportion of low- and moderate-resilience households decreasing and the proportion of high-resilience households increasing. In terms of the three major geomorphological divisions, households with low and moderate resilience continued to decline in the sandy area, while those with high resilience increased and occupied the majority and the highest proportion of the three types of landforms. In the gully area, households with low and moderate resilience originally accounted for the majority but have predominantly evolved into moderate and high resilience, and the differences between these proportions are slight. In the rocky area, the proportion of households with low resilience has always been the lowest and eventually dropped to 0, while the proportion of households with moderate resilience has always been the highest, although it has dropped from 70% to 51%. The proportion of those with high resilience rose from 0 to 49% (Table 9).
Farmers made a living primarily through stock breeding and traditional grain cultivation in the 1990s, but the arid climate, severe land desertification, mostly sloping land, and lack of irrigation water sources seriously hampered their livelihood. With the advancement of China’s urbanization process and changes in the agricultural structure, livelihoods have undergone tremendous changes, and household income has increased significantly. Following the relocation of a large number of rural laborers to cities and towns, the number of laborers in most families engaged in nonagricultural activities increased, as did nonagricultural income. When family members choose to engage in nonagricultural work in urbans, they will obtain more opportunities to diversify their income sources; family material capital, such as housing conditions and the number of household daily necessities, has greatly improved. Furthermore, implementing the targeted poverty alleviation policy has allowed farmers to obtain more community support, such as free loans, and learn more skills through training opportunities, allowing those with lower levels of education to learn livelihood skills in addition to farming. At the institutional level, government and social institutions help smallholder farmers further build adaptive capacity through publicity and education; specific measures include providing job skills training, more job opportunities, and lending opportunities. In addition, social activities should be organized to broaden their social trust and organizational management skills.

4.3. Determinants of Vulnerability and Resilience

The external conditions in which a farmer lives and the family’s internal decision making collectively determine a family’s mode of livelihood. The mode of livelihood determines the household’s livelihood status, vulnerability, and resilience. The external conditions where farmers live include the geographic location of the place of residence, climatic conditions, and other objective facts that are difficult to change. These external conditions have a notable impact on farmers’ livelihoods. Landforms, for example, determine farmland quality, and climate conditions determine whether there is a superior and appropriate agricultural foundation. The Loess Plateau’s delicate ecological environment is difficult to alter in a short period. For a long time, farmers engaged in agricultural production have been exposed to the fragile ecological environment due to desertification, frequent droughts, soil erosion, and other issues. Furthermore, farmers’ adaptability is generally low, which is the primary reason for their livelihoods’ vulnerability.
Farmers’ livelihoods in Jiaxian County have changed dramatically since the 1990s. Approximately 10% of the surveyed households’ livelihoods have always been traditional grain cultivation, while approximately 20% have switched from grain cultivation to date cultivation. As a result of market fluctuations, many family members moved to cities and towns to engage in nonagricultural activities, and the proportion of households engaged in nonagricultural activities increased from 30% to 88%. Their livelihoods shifted from traditional agriculture to nonagricultural modes to meet ever-increasing living requirements. Their livelihoods gradually diversified under the nonagricultural mode, and their reliance on agriculture diminished or even vanished. Without taking into account other external factors, the livelihood status of rural households is determined by their means of living. According to the traditional agricultural livelihood model, livelihood status is primarily determined by natural conditions and the quantity and quality of natural capital, with natural capital determining physical and financial capital. Market fluctuations are an essential factor in the new agricultural model, in addition to the effects of natural conditions and natural capital. Compared with the traditional agricultural model, household livelihoods have gradually improved, but market prices seriously affect farmers’ income and are extremely unstable. Farmers have more employment opportunities and sources of income in the nonagricultural model, and their livelihoods are no longer influenced by multiple external factors, such as geographic location, natural conditions, and market fluctuations. The primary constraints are one’s educational level and vocational skills.

4.4. The Relationship between Vulnerability and Resilience

In this paper, we concluded that the relationship between vulnerability and resilience is complicated and dynamic, and there is no linear relationship. In particular, there is no clear pattern in their direction of fluctuation, and there are scenarios where vulnerability decreases and resilience increases, and the consistent finding is that resilience is the flip side of vulnerability [19]. Additionally, Folke argues that vulnerability is the antonym of resilience [46], and a vulnerable system has lost resilience [47]. However, there are situations in which vulnerabilities remain the same while resilience grows, or both at the same time; similar findings have been observed by Turner et al. Their research shows resilience is not considered the flipside of vulnerability; they do not have a simple linear relationship [48]. Therefore, we can merely draw the conclusion that the relationship between vulnerability and resilience is complex and difficult to generalize with simple laws in livelihood systems, and the specific situation of different regions needs to be analyzed in detail. Additionally, we need to further explore the sequence of farm household adaptive-capacity enhancement for resilience enhancement and vulnerability reduction when farmers suffer from external disturbances such as natural disasters. Finally, this study is the result of our research on the framework of the vulnerability and resilience of farmers’ livelihoods applied to ecologically fragile areas of the Loess Plateau. It remains to be seen whether these findings can be applied to other areas. Furthermore, in-depth investigations and further studies on more and different typical cases are required to arrive at a generalizable framework suitable for most regions.

5. Conclusions

Farmers are the most basic unit of production and consumption in rural areas, and their livelihoods are extremely vulnerable to external factors, especially in ecologically fragile areas in developing countries. Understanding the changing trends in vulnerability and resilience and the relationship between them in terms of sustainable livelihood is critical. In this study, we aimed to determine how certain rules have changed and hope to supplement the research on the relationship between vulnerability and resilience and provide practical enlightenment for improving the livelihoods of farmers in ecologically fragile areas. We established a research framework that linked vulnerability and resilience through adaptive capacity; utilized Jiaxian County, a typical Loess Plateau area, as a case study; and established an index system to quantify and analyze changing trends and the dynamic relationship between the two over 30 years.
The results show that most households’ LVI was in the moderate category over the 30 years, presenting the trend of the development for the two levels of differentiation. The proportion of low- and high-vulnerability households increased, and the LRI continued to increase, so we conclude that in the complex nonlinear dynamic relationship between vulnerability and resilience, high vulnerability and high resilience coexist. According to the findings of the study, the livelihood system of rural households in Jiaxian County has entered a long-term resilience loop. Following the emergence of the short-term vulnerability loop caused by climatic conditions and the ecological environment, various adaptive strategies were used to enhance resilience. The fragile ecological environment of the Loess Plateau poses risks and obstacles to the livelihoods of farmers who have lived in the area for a long time and rely heavily on the natural environment. The livelihood vulnerability caused by this difficulty cannot be easily or quickly reduced and may even worsen in the future. As the findings show, the LVI of some households has continued to rise. However, because they have been living in this environment for a long time, they may be more adaptable to the vulnerable environment than farmers in other regions, and this adaptability will gradually increase. Adaptation can reduce the risks of climate change impacts, but it has limitations, particularly as the magnitudes and rates of climate change increase. Longer-term, in the context of sustainable development, there is a greater likelihood that more immediate adaptation actions will also improve future options and preparedness. Due to the limitations of this study area, the results of this paper still need to be further verified; in addition, the understanding of the causes of vulnerability and resilience, and the direction and possibility of the livelihood transformation of farmers under the sustainable development goals should be strengthened, so as to provide guidance for formulating effective policies.

Author Contributions

Investigation, K.W., Y.W. and X.Y.; writing—original draft preparation, W.Y.; writing—review and editing, W.Y.; visualization, W.Y.; supervision, X.Y.; funding acquisition, X.Y. All authors have read and agreed to the published version of the manuscript.

Funding

This research was funded by the National Natural Science Foundation of China, grant number 41771574.

Institutional Review Board Statement

Not applicable.

Informed Consent Statement

Not applicable.

Data Availability Statement

The data presented in this study are available on request from the corresponding author.

Acknowledgments

We would like to thank Wu Kongsen, Wang Yin, Min Dian, and Tang Honglin for contributing to the household survey and data collection. Furthermore, the authors would like to express their appreciation to anonymous reviewers for the insightful comments that improved this manuscript.

Conflicts of Interest

The authors declare no conflict of interest.

References

  1. Serdeczny, O.; Adams, S.; Baarsch, F.; Coumou, D.; Robinson, A.; Hare, W.; Schaeffer, M.; Perrette, M.; Reinhardt, J. Climate change impacts in Sub-Saharan Africa: From physical changes to their social repercussions. Reg. Environ. Chang. 2016, 17, 1585–1600. [Google Scholar] [CrossRef]
  2. Schilling, J.; Hertig, E.; Tramblay, Y.; Scheffran, J. Climate change vulnerability, water resources and social implications in North Africa. Reg. Environ. Chang. 2020, 20, 15. [Google Scholar] [CrossRef]
  3. Solh, M.; van Ginkel, M. Drought preparedness and drought mitigation in the developing world’s drylands. Weather Clim. Extrem. 2014, 3, 62–66. [Google Scholar] [CrossRef]
  4. Conway, D.; Schipper, E.L.F. Adaptation to climate change in Africa: Challenges and opportunities identified from Ethiopia. Glob. Environ. Chang. 2011, 21, 227–237. [Google Scholar] [CrossRef]
  5. Wang, S.; Fu, B.J.; Wu, X.T.; Wang, Y. Dynamics and sustainability of social-ecological systems in the Loess Plateau. Resour. Sci. 2020, 42, 96–103. [Google Scholar] [CrossRef]
  6. Chambers, R.; Conway, G.R. Sustainable Rural Livelihoods: Practical Concepts for the 21st Century; IDS Discussion Paper No. 296; Institute of Development Studies: Brighton, UK, 1992; p. 296. [Google Scholar]
  7. Janssen, M.A.; Ostrom, E. Resilience, vulnerability, and adaptation: A cross-cutting theme of the International Human Dimensions Programme on Global Environmental Change. Glob. Environ. Chang. 2006, 16, 237–239. [Google Scholar] [CrossRef]
  8. Miller, F.; Osbahr, H.; Boyd, E.; Thomalla, F.; Bharwani, S.; Ziervogel, G.; Walker, B.; Birkmann, J.; van der Leeuw, S.; Rockström, J.; et al. Resilience and Vulnerability: Complementary or Conflicting Concepts? Ecol. Soc. 2010, 15, 11. [Google Scholar] [CrossRef]
  9. Holling, C.S. Resilience and stability of ecological systems. Annu. Rev. Ecol. Syst. 1973, 4, 1–23. [Google Scholar] [CrossRef]
  10. Janssen, M.A.; Schoon, M.L.; Ke, W.; Börner, K. Scholarly networks on resilience, vulnerability, and adaptation within the human dimensions of global environmental change. Glob. Environ. Chang. 2006, 16, 240–252. [Google Scholar] [CrossRef]
  11. Cinner, J.E.; McClanahan, T.R.; Graham, N.A.J.; Daw, T.; Maina, J.; Stead, S.; Wamukota, A.; Brown, K.; Bodin, Ö. Vulnerability of coastal communities to key impacts of climate change on coral reef fisheries. Glob. Environ. Chang. 2012, 22, 12–20. [Google Scholar] [CrossRef]
  12. Ribot, J. Cause and response: Vulnerability and climate in the Anthropocene. J. Peasant Stud. 2014, 41, 667–705. [Google Scholar] [CrossRef]
  13. McCubbin, S.M.; Smit, B.; Pearce, T. Where does climate fit? Vulnerability to climate change in the context of multiple stressors in Funafuti, Tuvalu. Glob. Environ. Chang. 2015, 30, 43–55. [Google Scholar] [CrossRef]
  14. Zhao, X.; Liu, C.; Wang, X.; Xue, B. Assessment of the vulnerability of farmers’ livelihoods to ecological degradation in arid regions of a continental river basin: A case study of the middle-lower reaches of the Shiyang River in China. Acta Ecol. Sin. 2016, 36, 4141–4151. [Google Scholar]
  15. Li, P.; Xu, D.; Wang, X. Vulnerability of rural household livelihood to climate variability and adaptive strategies in landslide-threatened western mountainous regions of the Three Gorges Reservoir Area, China. Clim. Dev. 2018, 11, 469–484. [Google Scholar]
  16. Uddin, M.N.; Saiful Islam, A.K.M.; Bala, S.K.; Islam, G.T.; Adhikary, S.; Saha, D.; Haque, S.; Fahad, G.R.; Akter, R. Mapping of climate vulnerability of the coastal region of Bangladesh using principal component analysis. Appl. Geogr. 2019, 102, 47–57. [Google Scholar] [CrossRef]
  17. Das, M.; Das, A.; Momin, S.; Pandey, R. Mapping the effect of climate change on community livelihood vulnerability in the riparian region of Gangatic Plain, India. Ecol. Indic. 2020, 119, 106815. [Google Scholar] [CrossRef]
  18. Kumar, S.; Mishra, A.K.; Pramanik, S.; Mamidanna, S.; Whitbread, A. Climate risk, vulnerability and resilience: Supporting livelihood of smallholders in semiarid India. Land Use Policy 2020, 97, 104729. [Google Scholar] [CrossRef]
  19. Berkes, F. Understanding uncertainty and reducing vulnerability: Lessons from resilience thinking. Nat. Hazards 2007, 41, 283–295. [Google Scholar] [CrossRef]
  20. Gerlitz, J.; Macchi, M.; Brooks, N.; Pandey, R.; Banerjee, S.; Jha, S.K. The Multidimensional Livelihood Vulnerability Index—An instrument to measure livelihood vulnerability to change in the Hindu Kush Himalayas. Clim. Dev. 2016, 9, 124–140. [Google Scholar] [CrossRef]
  21. Shah, K.U.; Dulal, H.B.; Johnson, C.; Baptiste, A. Understanding livelihood vulnerability to climate change: Applying the livelihood vulnerability index in Trinidad and Tobago. Geoforum 2013, 47, 125–137. [Google Scholar] [CrossRef]
  22. Scoones, I. Livelihoods perspectives and rural development. J. Peasant Stud. 2009, 36, 171–196. [Google Scholar] [CrossRef]
  23. Marschke, M.J.; Berkes, F. Exploring Strategies that Build Livelihood Resilience: A Case from Cambodia. Ecol. Soc. 2006, 11, 42. [Google Scholar] [CrossRef] [Green Version]
  24. Cutter, S.L.; Barnes, L.; Berry, M.; Burton, C.; Evans, E.; Tate, E.; Webb, J. A place-based model for understanding community resilience to natural disasters. Glob. Environ. Chang. 2008, 18, 598–606. [Google Scholar] [CrossRef]
  25. Folke, C.; Carpenter, S.R.; Walker, B.; Scheffer, M.; Chapin, T.; Rockström, J. Resilience Thinking: Integrating Resilience, Adaptability and Transformability. Ecol. Soc. 2010, 15, 20. [Google Scholar] [CrossRef]
  26. Nelson, D.R.; Adger, W.N.; Brown, K. Adaptation to Environmental Change: Contributions of a Resilience Framework. Annu. Rev. Environ. Resour. 2007, 32, 395–419. [Google Scholar] [CrossRef]
  27. Maru, Y.T.; Smith, M.S.; Sparrow, A.; Pinho, P.F.; Dube, O.P. A linked vulnerability and resilience framework for adaptation pathways in remote disadvantaged communities. Glob. Environ. Chang. 2014, 28, 337–350. [Google Scholar] [CrossRef]
  28. Yohe, G.; Tol, R.S.J. Indicators for social and economic coping capacity—Moving toward a working definition of adaptive capacity. Glob. Environ. Chang. 2002, 12, 25–40. [Google Scholar] [CrossRef]
  29. Adger, W.N.; Vincent, K. Uncertainty in adaptive capacity. Comptes Rendus Geosci. 2005, 337, 399–410. [Google Scholar] [CrossRef]
  30. Brooks, N.; Adger, W.N.; Kelly, P.M. The determinants of vulnerability and adaptive capacity at the national level and the implications for adaptation. Glob. Environ. Chang. 2005, 15, 151–163. [Google Scholar] [CrossRef]
  31. Béné, C. Are Fishers Poor or Vulnerable? Assessing Economic Vulnerability in Small-Scale Fishing Communities. J. Dev. Stud. 2009, 45, 911–933. [Google Scholar] [CrossRef]
  32. Kelly, P.M.; Adger, W.N. Theory and Practice in Assessing Vulnerability to Climate Change and Facilitating Adaptation. Clim. Chang. 2000, 47, 325–352. [Google Scholar] [CrossRef]
  33. Adger, W.N. Social and ecological resilience: Are they related? Prog. Hum. Geogr. 2000, 24, 347–364. [Google Scholar] [CrossRef]
  34. Gallopín, G.C. Linkages between vulnerability, resilience, and adaptive capacity. Glob. Environ. Chang. 2006, 16, 293–303. [Google Scholar] [CrossRef]
  35. Smit, B.; Wandel, J. Adaptation, adaptive capacity and vulnerability. Glob. Environ. Chang. 2006, 16, 282–292. [Google Scholar] [CrossRef]
  36. Grafton, R.Q. Adaptation to climate change in marine capture fisheries. Mar. Policy 2010, 34, 606–615. [Google Scholar] [CrossRef]
  37. Hahn, M.B.; Riederer, A.M.; Foster, S.O. The Livelihood Vulnerability Index: A pramatic approach to assessing risks from climate variability and change—A case study in Mozambique. Trans. R. Soc. B Biol. Sci. 2009, 360, 2169–2182. [Google Scholar] [CrossRef]
  38. Speranza, C.I.; Rist, U.W. An indicator framework for assessing livelihood resilience in the context of social–ecological dynamics. Glob. Environ. Chang. 2014, 28, 109–119. [Google Scholar] [CrossRef]
  39. Quandt, A.; Neufeldt, H.; McCabe, J.T. The role of agroforestry in building livelihood resilience to floods and drought in semiarid Kenya. Ecol. Soc. 2017, 22, 10. [Google Scholar] [CrossRef]
  40. Quandt, A. Measuring livelihood resilience: The Household Livelihood Resilience Approach (HLRA). World Dev. 2018, 107, 253–263. [Google Scholar] [CrossRef]
  41. Sallu, S.M.; Twyman, C.; Stringer, L.C. Resilient or Vulnerable Livelihoods? Assessing Livelihood Dynamics and Trajectories in Rural Botswana. Ecol. Soc. 2010, 15, 3. [Google Scholar] [CrossRef]
  42. Sina, D.; Chang-Richards, A.Y.; Wilkinson, S.; Potangaroa, R. A conceptual framework for measuring livelihood resilience: Relocation experience from Aceh, Indonesia. World Dev. 2019, 117, 253–265. [Google Scholar] [CrossRef]
  43. Sarker, M.N.I.; Wu, M.; Alam, G.M.M.; Shouse, R.C. Life in riverine islands in Bangladesh: Local adaptation strategies of climate vulnerable riverine island dwellers for livelihood resilience. Land Use Policy 2020, 94, 104574. [Google Scholar] [CrossRef]
  44. Resilience Alliance. Assessing and Managing Resilience in Social-Ecological Systems: A Practitioners Workbook; Resilience Alliance: Decatur, GA, USA, 2007. [Google Scholar]
  45. Obrist, B. Multi-layered social resilience: A new approach in mitigation research. Prog. Dev. Stud. 2010, 10, 283–293. [Google Scholar] [CrossRef]
  46. Folke, C.; Carpenter, S.; Elmqvist, T.; Gunderson, L.; Holling, C.S.; Walker, B. Resilience and sustainable development: Building adaptive capacity in a world of transformations. Ambio 2002, 31, 437–440. [Google Scholar] [CrossRef]
  47. Folke, C. Resilience: The emergence of a perspective for social-ecological systems analyses. Glob. Environ. Chang. 2006, 16, 253–267. [Google Scholar] [CrossRef]
  48. Turner, B.L.; Kasperson, R.E.; Matson, P.A.; McCarthy, J.J.; Corell, R.W.; Christensen, L.; Eckley, N.; Kasperson, J.X.; Luers, A.; Martello, M.L.; et al. A framework for vulnerability analysis in sustainability science. Proc. Natl. Acad. Sci. USA 2003, 100, 8074–8079. [Google Scholar] [CrossRef] [PubMed] [Green Version]
Figure 1. The location of the sample county and villages.
Land 11 01500 g001
Figure 2. The framework of linking vulnerability and resilience.
Land 11 01500 g002
Table 1. An assessment framework for evaluating the livelihood vulnerability.
DimensionIndicatorsDescriptionWeight *
exposure-sensitivitythe ratio of a family bringing upthe proportion of the population without the ability to work (such as children, the disabled, the elderly, etc.)0.12
healththe proportion of family medical expenditure in total expenditure0.11
quality of arable land landthe proportion of slope arable land in total household arable land0.07
proportion of reduced production caused by natural disastersthe proportion of agricultural output lost due to natural disasters (1: 0–20%; 2: 20–40%; 3: 40–60%; 4: 60–80%; 5: 80–100%)0.06
agricultural income dependencethe proportion of agricultural income in total income0.08
drinking condition and qualitydrinking water sources and water quality. the water source (1: rainwater; 2: river or lake; 3: storage water; 4: well water; 5: tap water), quality rated on a 5-point Likert Scale0.06
adaptive capacitythe proportion of non-farm incomethe proportion of nonagricultural income in total income0.13
loan opportunitiesthe opportunity to obtain a loan from the bank (yes: 1; no: 0)0.03
amount of participation in skill trainingparticipation in technical training such as date planting0.03
neighbors’ communicationthe degree of communication between neighbors rated on a 5-point Likert scale0.06
Information-capturing abilitydiversity of access to information0.08
policy awarenessthe degree of policy known is rated on a 5-point Likert scale0.05
average education years of laborersthe ratio of the number of schooling years of laborers to the number of laborers in a household0.12
* The weight is calculated by Analytic Hierarchy Process (AHP).
Table 2. An assessment framework for evaluating the livelihood resilience.
DimensionIndicatorsDescriptionWeight *
buffer capacitynumber of laborsthe number of people able to work0.10
household incomes per capitathe ratio of total income to population0.09
income diversity indextypes of household income sources0.05
housing conditionshousing type and per capita housing area (1: earth kiln; 2: civil house; 3: stone kiln; 4: concrete house; 5: storied building)0.02
per arable land areathe ratio of total arable land area to population0.02
household fixed assetstotal household fixed assets0.02
livestock capitalthe sum of large livestock such as cattle, horses, pigs, etc.0.02
self-organization capacitycommunity supporttypes of community support the family receives0.07
neighborhood trustproportion of trustworthy neighbors (1: 0–20%; 2: 20–40%; 3: 40–60%; 4: 60–80%; 5: 80–100%)0.03
organization and management abilityorganization and management ability of village leaders rated on a 5-point Likert scale0.16
social networkthe number of people who have access to unpaid loans0.07
adaptive capacityshare of non-farm incomenonagricultural income as a proportion of total income0.08
loan opportunitiesthe opportunity to obtain a loan from the bank (yes: 1; no: 0)0.02
amount of participation in skill trainingparticipation in technical training such as date planting0.01
neighbors’ communicationthe degree of communication between neighbors rated on a 5-point Likert scale0.04
information-capturing abilitydiversity of access to information0.04
policy awarenessthe degree of policy known is rated on a 5-point Likert Scale0.04
the average education years of family laborsthe ratio of the number of schooling years of labors to the number of labors in a household0.10
* The weight is calculated by AHP.
Table 3. Distribution of households’ LVI percentage from 1990 to 2020.
Categories1990200020102020
L 10.09 (38 4)0.10 (41)0.12 (49)0.14 (57)
M 20.87 (334)0.83 (319)0.75 (287)0.66 (254)
H 30.02 (9)0.05 (21)0.11 (45)0.18 (70)
1 L—Low, 2 M—Moderate, 3 H—High, 4 Values in the parentheses indicates the number of households.
Table 4. LVI categories in quantity changes of households from 1990 to 2020.
Type and QuantityWeakenMaintainStrengthen
M-LH-MH-LL-LM-MH-HL-ML-HM-H
430414229521362
total47 (12.3%)248 (65.1%)86 (22.6%)
Table 5. Distribution of households LRI percentage from 1990 to 2020.
Categories1990200020102020
L 10.34 (130 4)0.20 (77)0.07 (29)0.03 (12)
M 20.64 (246)0.73 (281)0.72 (275)0.49 (188)
H 30.01 (5)0.06 (23)0.20 (77)0.47 (181)
1 L—Low, 2 M—Moderate, 3 H—High, 4 Values in the parenthesis indicates the number of households.
Table 6. LRI categories in quantity changes of households from 1990 to 2020.
Type and QuantityWeakenMaintainStrengthen
M-LH-MH-LL-LM-MH-HL-ML-HM-H
300911057843133
total3 (0.8%)124 (32.5%)254 (66.7%)
Table 7. LVI and LVR categories in quantity changes of households from 1990 to 2020.
LVI− * (47)0 (248)+ (83)++ (3)
LRI0 (16)− 2− (1)+ (2)
+ (29)0 (180)0 (28)++ (1)
++ (2)+ (138)+ (42)
++ (28)++ (12)
* “−” indicates the level is weakened, “0” indicates the level remains unchanged, “+” indicates the level increased by one, “++” indicates the level increased by two, values in the parenthesis indicate the number of households.
Table 8. Distribution of households’ LVI percentage in different terrain areas from 1990 to 2020.
1990200020102020
LMHLMHLMHLMH
The sand area0.12
(10 *)
0.86
(72)
0.02
(2)
0.12
(10)
0.83
(70)
0.05
(4)
0.15
(13)
0.60
(50)
0.25
(21)
0.17
(14)
0.63
(53)
0.20
(17)
The gully area0.08
(18)
0.89
(198)
0.03
(7)
0.11
(25)
0.83
(184)
0.06
(14)
0.14
(31)
0.74
(165)
0.12
(27)
0.14
(32)
0.67
(149)
0.19
(42)
The rocky area0.14
(10)
0.86
(64)
00.08
(6)
0.88
(65)
0.04
(3)
0.07
(5)
0.82
(61)
0.11
(8)
0.15
(11)
0.70
(52)
0.15
(11)
* Values in the parenthesis indicates the number of households.
Table 9. Distribution of households’ LRI percentage in different terrain areas from 1990 to 2020.
1990200020102020
LMHLMHLMHLMH
The sand areas0.33 (28 *)0.65 (55)0.01 (1)0.20 (17)0.71 (60)0.08 (7)0.06 (5)0.69 (58)0.25 (21)0.04 (3)0.43 (36)0.54 (45)
The gully areas0.36 (80)0.62 (139)0.02 (4)0.21 (46)0.73 (163)0.06 (14)0.08 (18)0.73 (163)0.25 (42)0.04 (9)0.51 (114)0.45 (100)
The rocky areas0.14 (22)0.70 (52)00.19 (14)0.78 (58)0.03 (2)0.08 (6)54 (0.73)0.19 (14)00.51 (38)0.49 (36)
* Values in the parenthesis indicate the number of households.
Publisher’s Note: MDPI stays neutral with regard to jurisdictional claims in published maps and institutional affiliations.

