Article

Research on Spatio-Temporal Pattern Evolution and the Coupling Coordination Relationship of Land-Use Benefit from a Low-Carbon Perspective: A Case Study of Fujian Province

The Academy of Digital China (Fujian), Fuzhou University, Fuzhou 350116, China
*
Author to whom correspondence should be addressed.
Land 2022, 11(9), 1498; https://doi.org/10.3390/land11091498
Submission received: 8 August 2022 / Revised: 31 August 2022 / Accepted: 31 August 2022 / Published: 7 September 2022
(This article belongs to the Special Issue The Eco-Environmental Effects of Urban Land Use)

Abstract

:
To accelerate the ecological civilization in the new era and coordinate the region’s ecological economic growth, land-use benefit pre-evaluations and coordination analyses must be carried out. These should be based on a land-use structure layout that is low-carbon oriented to ensure the land is utilized efficiently and sustainably. This paper studies Fujian Province, the national ecological civilization test area, and constructs a framework for land-use benefit evaluation and coupling coordination relationship analysis based on land-use structure from the low-carbon perspective. Based on land-use status data from 2000 to 2020, land-use simulation data under two development scenarios in 2030, and accounting for the different types of main functional areas, this paper establishes the land-use benefit evaluation model. The model uses aspects of carbon emission benefit, economic benefit, and ecological benefit to calculate the land-use benefit of counties (cities and districts) in Fujian Province from 2000 to 2030 by combining with the grey prediction model. The coupling coordination degree model is used to explore the coordination relationship between the above three types of benefits in different districts and counties in 2030 and to identify the main factors restricting the improvement of coupling coordination relationships in different regions in the future. The following results are found: (1) From the perspective of land-use efficiency, the coupling and coordination of land-use efficiency and benefits of counties (cities and districts) in Fujian Province continued to rise from 2000 to 2030 under the low-carbon development scenario, and the spatial agglomeration characteristics were obvious. By 2030, the coupling and coordination relationship of regional land-use efficiency was gradually optimized, and the development pattern with the Fuzhou metropolitan area and Xiamen-Zhangquan metropolitan area as the core was formed. (2) From the perspective of restrictive factors of land-use efficiency coupling coordination, the improvement of land-use efficiency coupling coordination relationship in each county (city and district) is affected by multiple factors. The influence degree is economic benefit > ecological benefit > carbon emissions. These results will help to promote the efficient and sustainable use of land resources and realize the comprehensive and coordinated development of a low-carbon economy and society.

1. Introduction

Land space is the basic unit of natural resources and social and economic activities [1]. The development and utilization of land space is a key measure for China to accelerate the formation of green production methods and lifestyles, promote the construction of ecological civilization, and guide regional low-carbon and green development [2]. The development and change of land space is a complex system. Changes in land-use patterns not only reflect the utilization of regional land resources, but also directly affect regional carbon emissions, social and economic development, and ecological environment construction, to a certain extent. This not only reflects the comprehensive level of regional land-use efficiency, but also guarantees our food security from the perspective of arable land. Recent years have seen rapid economic development and an increase in land demand. Along with the transitional development and extensive utilization of resources, the contradiction between land resource development and ecological environmental protection has become increasingly prominent. The concept of sustainable development is receiving more and more attention from countries around the world, and the efficient use of land resources is the key to realizing the maximization of regional land-use efficiency and green sustainable development [3]. Major cities around the world are already exploring low-carbon land-use models [4] and healthy city construction [5]. The implementation of the low-carbon sustainable city plan will enhance the livability and health of the city and promote the construction of a healthy city [6]. Therefore, in the context of low-carbon development, land use structures should be adjusted to optimize the allocation and rational use of land resources. Coordinating the relationship in this way requires the scientific evaluation of carbon emissions, economic and ecological benefits of regional land use. Reducing carbon emissions and improving the effectiveness of land use and the level of coupled and coordinated development are hot issues in the field of national land space and land use [7].
The study of coordination characteristics and spatial evolution of land-use efficiency is one important way to address the regional structure and optimal allocation of natural conditions, resources, and socio-economic development in a region. These are significant when promoting the low-carbon utilization of regional land resources and achieving high-quality sustainable development [8]. At present, scholars at home and abroad have carried out various research on land-use benefit evaluation and achieved rich results. The relevant research perspective has expanded from the single economic, social, and ecological benefit evaluation [9,10,11] to the comprehensive land-use benefit evaluation. As the construction of low-carbon cities and ecological civilization continues to advance, reducing carbon emissions and improving land-use efficiency has gradually become an important guide for sustainable regional development. The current research focus is on the analysis of the temporal and spatial pattern evolution of land-use benefits [12,13,14,15,16] and coupling and coordination relationship between benefits of land use and urban expansion [17], land development intensity [18,19], ecological environment [20,21], urbanization [22,23], urbanization [24,25], and new urbanization [26,27], ignoring the significant impact of land-use changes on carbon emission benefits, resulting in a relative lack of research on the coupling and coordination relationship between land-use carbon emission effects and its economic and ecological benefits under low-carbon orientation. The research path mostly adopts the analytic hierarchy process [28], entropy weight method [29], mean square error decision method [30], coefficient of variation method [31], and TOPSIS method [32] for index determination, and analyzes the spatial and temporal evolution process and coupled coordination relationship of land-use benefits by establishing a land-use benefit evaluation index system and combining with a coupled coordination degree model [33]. The land-use efficiency evaluation index system has limitations in constructing perspectives and selecting evaluation indicators, without considering the differences in the land-use efficiency of different land-use modes in terms of quantity, quality, space, time and development patterns. Quantitative research on the land-use benefits of different land-use types based on the dynamic changes of spatial patterns of land use is more in line with the development planning of different main functional areas of cities. In summary, existing studies mostly use the evaluation index system to evaluate the land-use benefits, which is more subjective and ignores the impact of land-use changes on land-use benefits; in addition, for the issue of land-use benefits, scholars have not considered the coupled and coordinated relationship between land-use carbon-emission benefits and economic and ecological benefits. Therefore, to support a low-carbon economy, studying the relationship between land type, distribution, and land-use benefits, and evaluating the land-use benefits and coupling coordination relationships based on land-use patterns can provide a new theoretical basis for low-carbon land-use patterns and ecological civilization construction in Fujian Province [7].
This paper takes Fujian Province, the country’s first national ecological civilization pilot area, as the research area. Based on systematically analyzing its land-use structure and layout, this paper constructs an analysis framework of land-use benefit evaluation and coupling coordination relationship based on land-use structure from the low-carbon perspective. It analyzes and studies the spatial evolution process and coupling coordination relationship of the land-use benefits of counties (cities and districts). These are calculated for the past, present, and two future development scenarios for Fujian Province. The constraints of the efficient and sustainable use of land resources in the future are identified, and the influential relationship between low-carbon economic development, land-use change, and land-use benefits is revealed. The research results provide a reference for the optimization of the spatial pattern of land in Fujian Province, the coordinated regional development strategy, and the realization of the high-quality use of land resources oriented to a low-carbon economy.

2. Materials and Methods
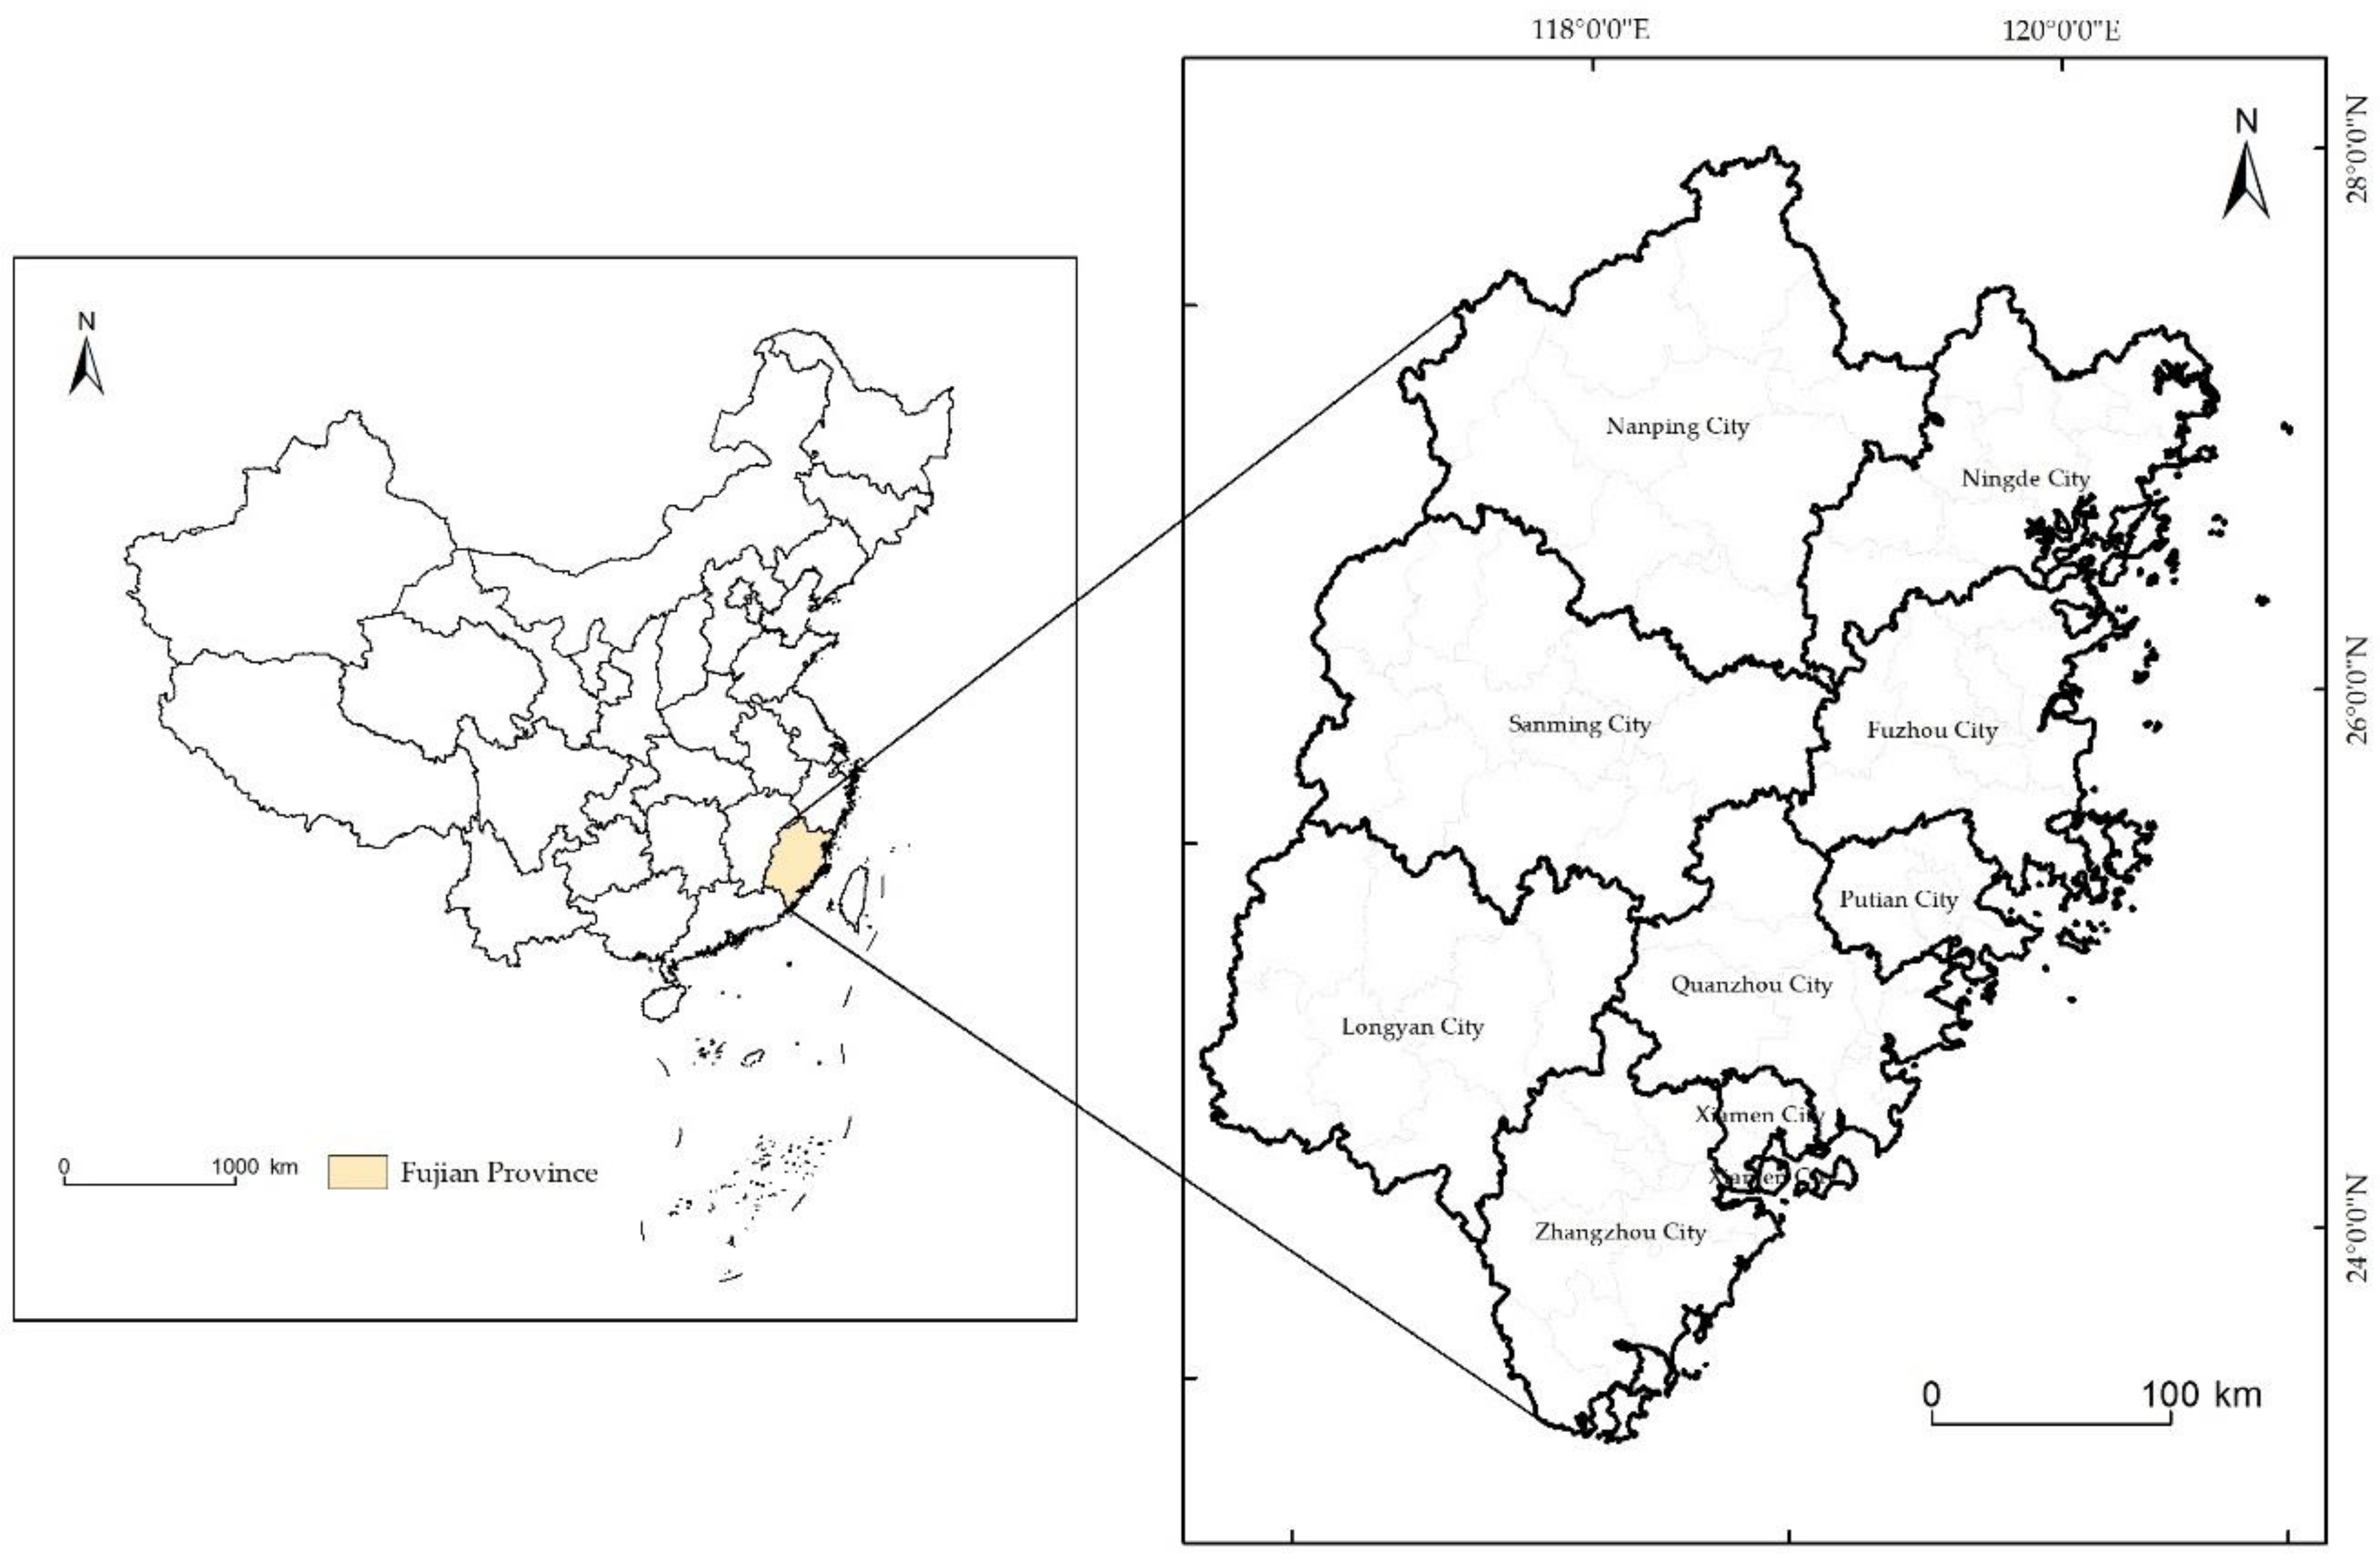
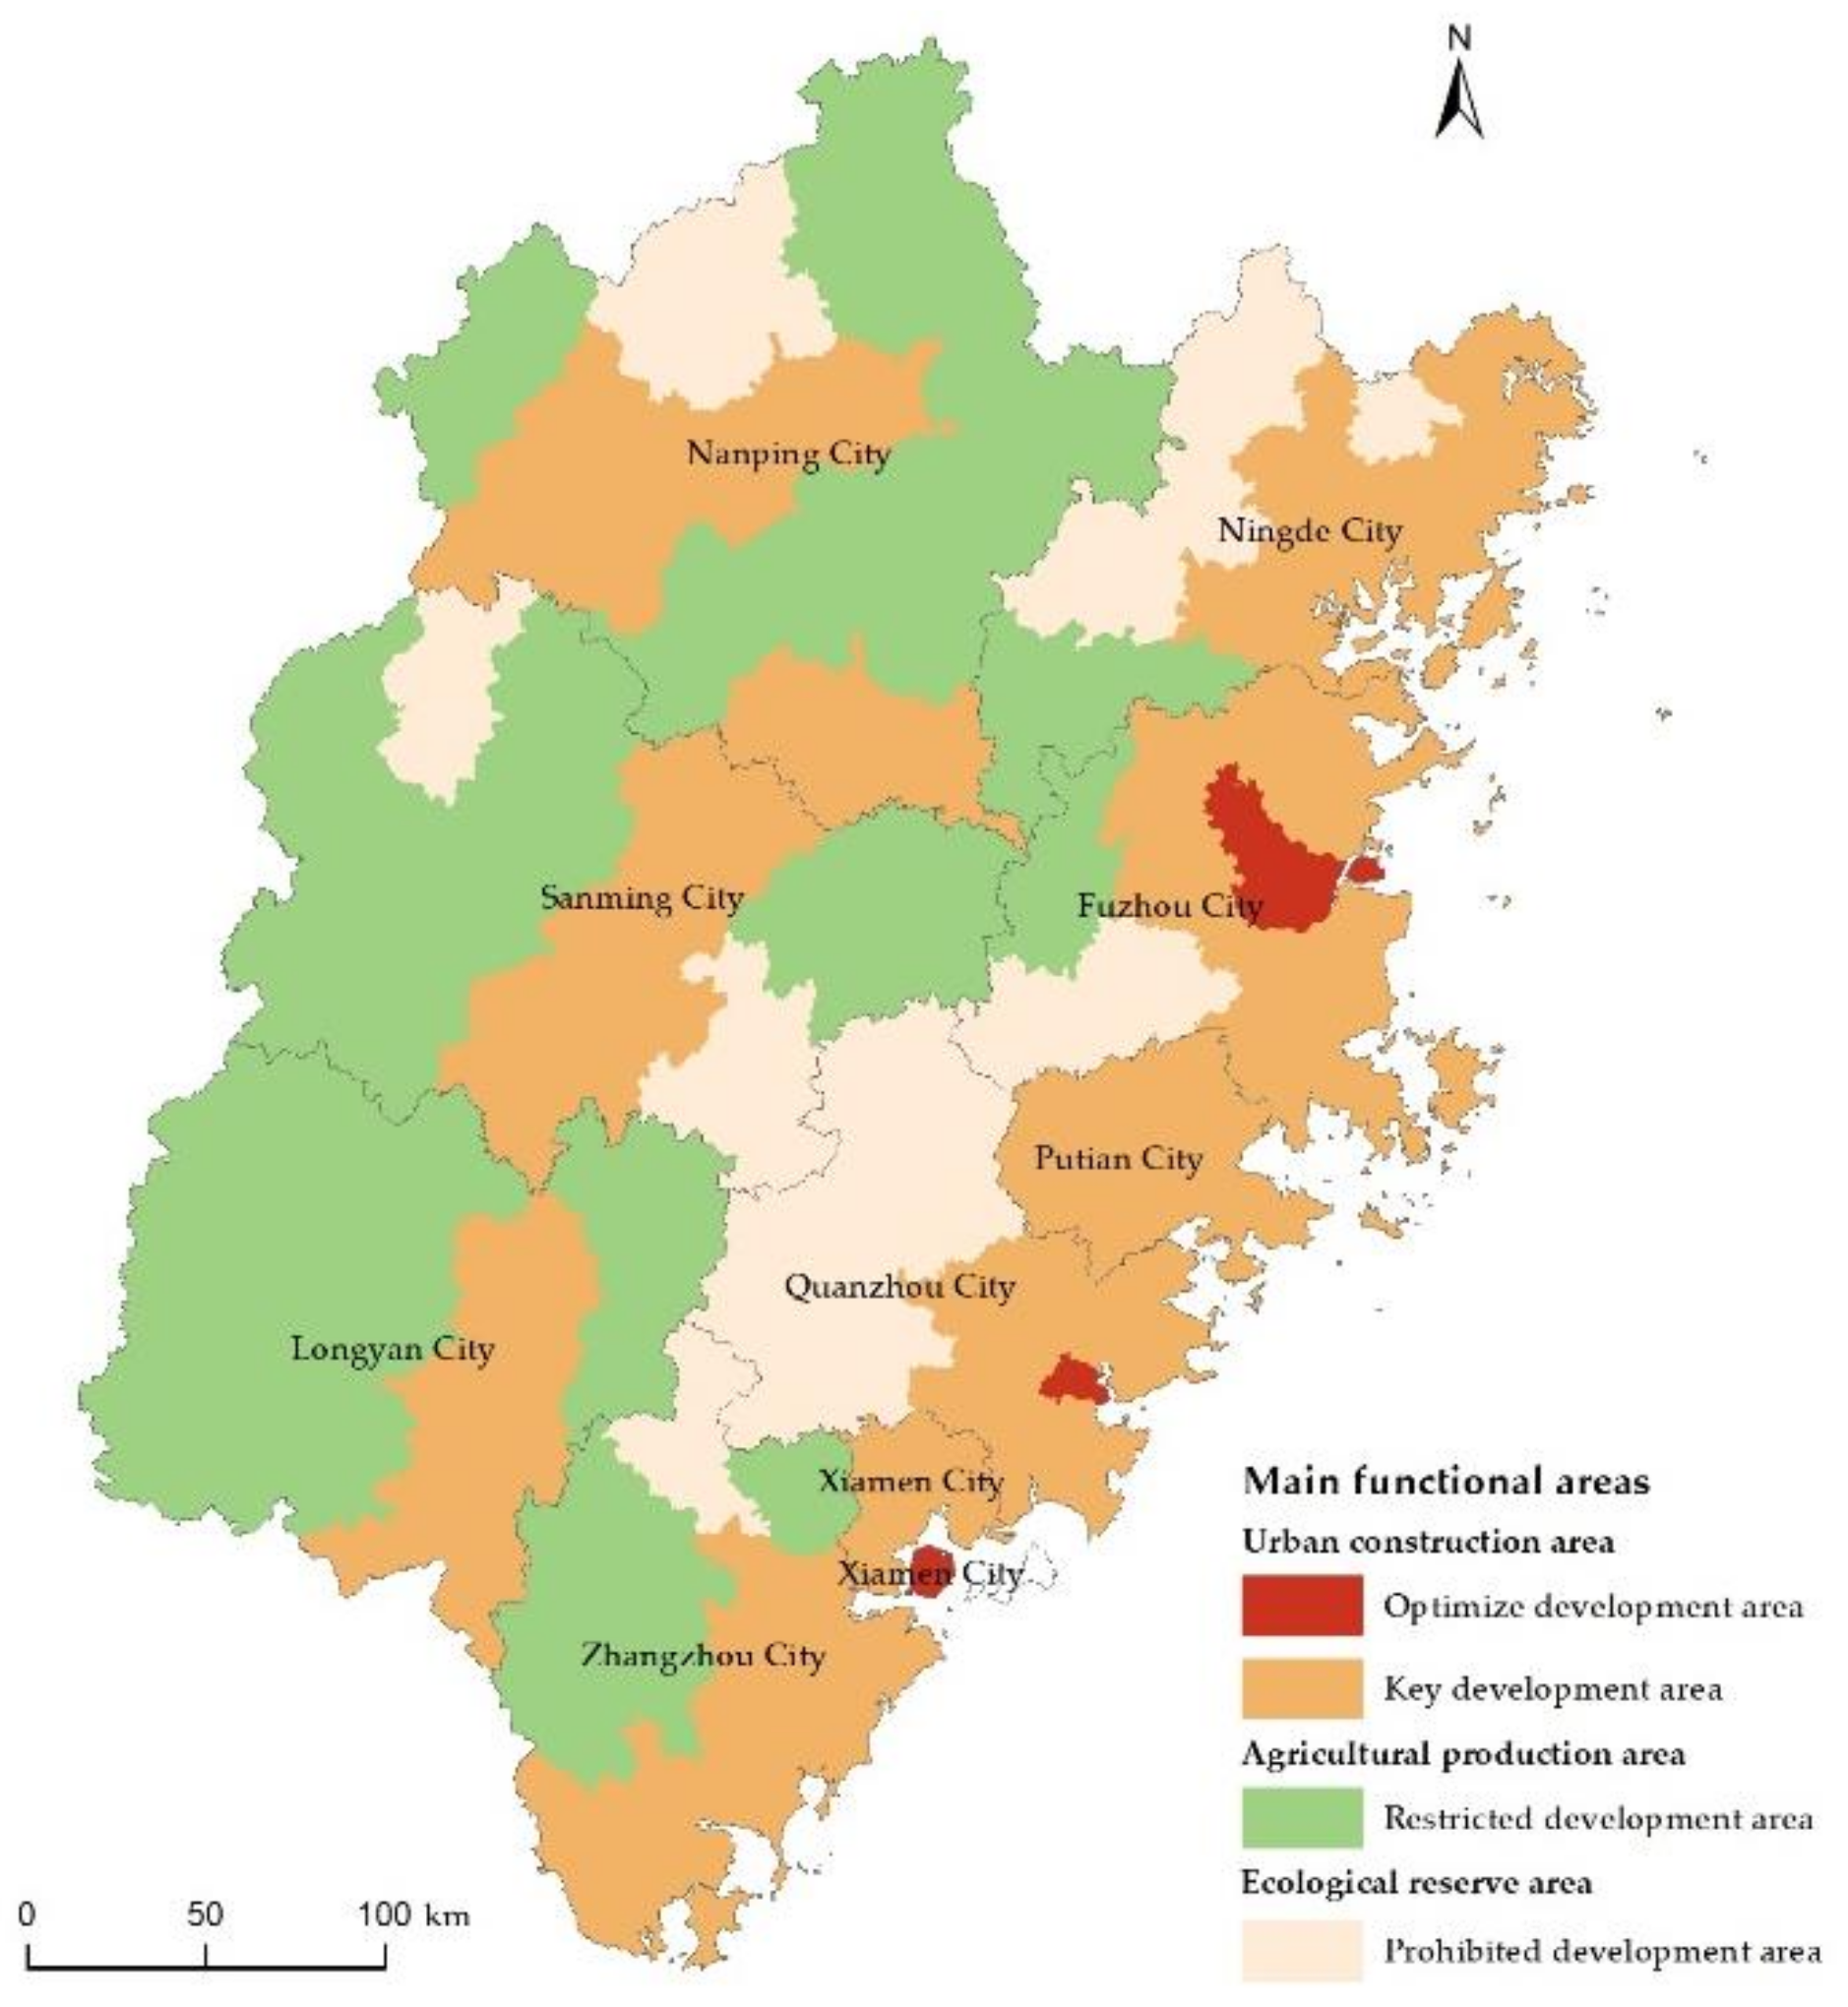
2.1. Study Area

Fujian Province is located on the southeast coast of China. Its land area is between 23°33′~28°20′ N and 115°50′~120°40′ E, with 11 county-level cities, 42 counties, and 31 municipal districts under its jurisdiction (Figure 1). For years, Fujian Province has persistently promoted the construction of ecological civilization. To achieve green, circular, and low-carbon development, it has focused on building a spatial pattern of saving resources and protecting the environment and is the first national ecological civilization pilot zone. The land type of Fujian Province is mainly woodland with a forest coverage rate is 66.8%. This ranks first in the country for 42 consecutive years, and it is an important carbon sink space in Southeast China.

2.2. Introduction to Data Sources

This study takes Fujian Province as the research area and includes statistical and spatial distribution data. The specific data sources are as follows:
Statistical data include socio-economic data, ecological environment data, and energy consumption data related to carbon emissions. Data are mainly from the Fujian Statistical Yearbook, National Compilation of Agricultural Product Cost and Benefits Data, and Chen [34].
The spatial distribution data include administrative boundary, main functional zoning, a three-phase land-use status map for 2000, 2010, and 2020, and land-use simulation data for 2030 under both natural and low-carbon development options [35]. The administrative boundary data and the main functional zoning of Fujian Province were obtained from the National Geographic Information Resource Catalog Service System (https://www.webmap.cn (accessed on 28 April 2021)) and the Fujian Provincial Main Functional Zone. The development method divides the counties (cities and districts) into four categories: optimized development, key development, restricted development, and prohibited open zones (Figure 2). At the same time, according to the development orientation of different regional main functions, the counties (cities and districts) in Fujian Province are divided into three types of land and space functions. These are urban construction, agricultural production, and ecological protection. The land-use data for the three phases of 2000, 2010, and 2020 are from GlobeLand30 (http://www.globallandcover.com (accessed on 26 May 2021)), with a spatial resolution of 100 m × 100 m. The land-use data of Fujian Province in 2030 under both natural and low-carbon development orientations were obtained from the research results of the same group. This research is based on two different scenarios of natural development and low-carbon development. Based on the development plans of different main functional areas, the trends of land-use types are obtained, and the predicted values for 2030 are obtained by using a gray prediction model. Coupled with a “top-down” multi-objective programming model, a “bottom-up” PLUS model is also used to obtain land-use data in Fujian Province in 2030 with a spatial resolution of 100 m × 100 m as shown in Figure 3 and Figure 4.

2.3. Research Process and Methods

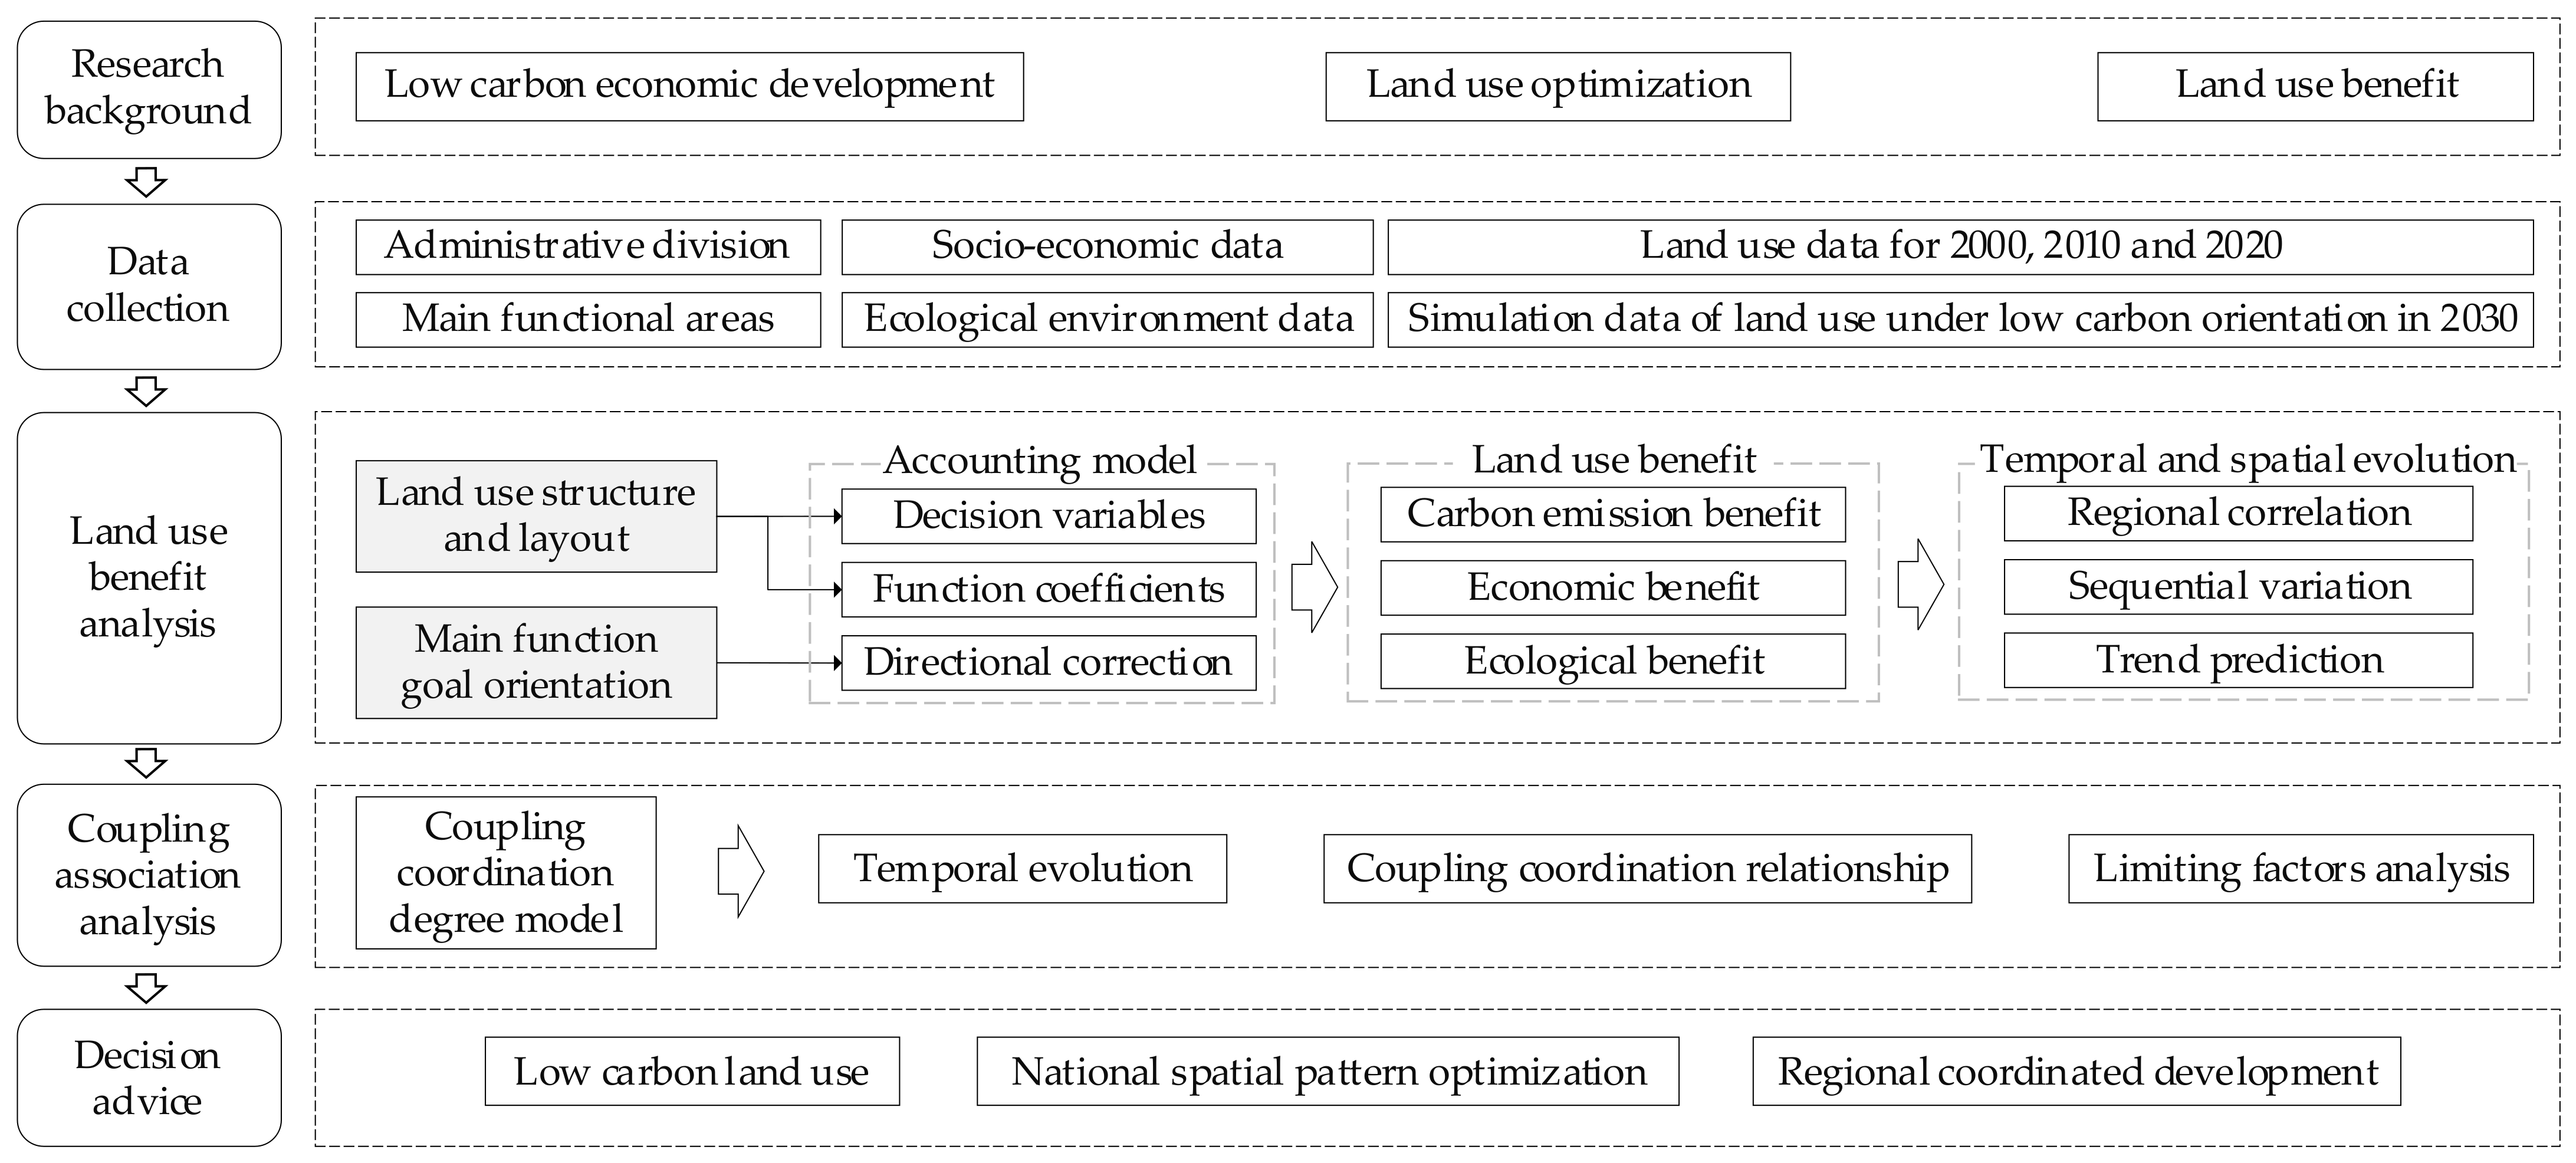
2.3.1. Research Process

This study is based on the province’s natural environment, socio-economic and energy consumption data, and the actual land use from 2000 to 2020. The 2030 land-use simulation data under the two development scenarios, low-carbon and natural, also consider the relationship between land-use structure, layout, and efficiency. A land-use efficiency evaluation model is constructed from three aspects: carbon emissions, economic efficiency, and ecological efficiency. The land-use benefit coefficient is corrected according to the development orientation of different main functional areas. Under different development orientations in the past, present, and future, the temporal and spatial evolution process of land-use benefit is dynamically analyzed. The carbon emission benefits, economic benefits, and ecological benefits of each county (city, district) are considered from 2000 to 2030. Then, a coupling coordination degree model of “carbon emission-economy-ecology” is constructed to explore the spatial and temporal evolution of the coupling coordination relationship between land-use efficiency in different regions from these three aspects. Finally, the coupling coordination level of land-use benefit in each county (city, district) is divided, and the main factors that restrict the improvement of the coupling coordination degree of each region under the low-carbon scenario in 2030 are identified. This provides a reference for optimizing the spatial pattern of national land, promoting regional coordinated development, and realizing the high-quality utilization of regional land resources. It also supports regional green, coordinated, and sustainable development in Fujian Province from a low-carbon perspective. The technical roadmap is shown in Figure 5.

2.3.2. Land-Use Benefit Evaluation Model

Based on the simulation idea of land-use space optimization for comprehensive benefits, the objective function is introduced as the evaluation function of land-use benefit. Based on the analysis of the mutual promotion and constraint relationship between land-use types and land-use benefit, the model simulates and predicts the land-use benefit coefficient in 2030, and constructs an evaluation model of a historical, current, and future 2030 land-use benefit from three aspects of land-use carbon emission benefit, economic benefit, and ecological benefit. It includes model variables, the land-use benefit coefficient, and development orientation correction.
  • Variables
This paper uses the land-use benefit evaluation model to analyze the land-use benefits of Fujian Province in 2000, 2010, 2020, and 2030. Based on the classification of land use status, seven variables are set according to the characteristics of land resources in Fujian Province: cultivated land ( x 1 ), woodland ( x 2 ), grassland ( x 3 ), wetland ( x 4 ), water ( x 5 ), man-made surface ( x 6 ), and naked land ( x 7 ).
2.
Evaluation Function
The efficient and sustainable use of land resources under the guidance of low-carbon cannot blindly sacrifice economic and ecological benefits. Various factors must be comprehensively considered to achieve the organic unity of carbon emission benefits, economic benefits, and ecological benefits. Based on the analysis of the current situation of land use in the study area and the social and economic development of Fujian Province, this paper constructs the evaluation function of carbon emission benefits, economic benefits, and ecological benefits. Calculations for carbon emissions, economic benefits, and ecological benefits of each region are shown in Equation (1).
F 1 x = max j = 1 n c j x j ;
F 2 x = min j = 1 n d j x j ;
F 3 x = max j = 1 n e j x j
In Equation (1), x j corresponds to the variables of j land-use types ( j   = 1, 2, …, 7); F 1 x , F 2 x , and F 3 x are the evaluation functions of land-use benefits, representing carbon emissions, economic benefits, and ecological benefits, respectively; c j , d j , and e j are the carbon emission coefficient, economic benefit coefficient, and ecological benefit coefficient of land types per unit area, respectively.
3.
Benefit Coefficient
(a)
Carbon Emissions Evaluation Function Coefficient
According to the existing research, the carbon emissions of cultivated land, woodland, grassland, wetland, water, and naked land have little change in the long term [36,37]. Carbon emission coefficients are 0.464, −5.052, −0.947, −0.41, −0.25, and −0.005 hm−2·a−1 [38]. The carbon emissions of man-made surfaces are calculated based on the energy consumption and land-use data of Fujian Province from 2000 to 2020, and the carbon emissions per unit area of the man-made surface in 2030 are predicted by the grey prediction model. The carbon emissions of the man-made surface are mainly obtained indirectly by calculating the total carbon emissions generated by energy consumption in the process of utilization [39]. The calculation formula is as follows:
E b = i = 1 n m i n i φ i 44 / 12
In Equation (2), E b   represents the total carbon emissions from all kinds of fossil energy consumption; n represents energy types; m i is the consumption of energy I; n i is the converted standard coal coefficient of energy I; φ i is the carbon emission factor, which is equal to the product of the average low calorific value of various energy sources, carbon content, and oxidation rate; and 44/12 represents the ratio of the molecular weight of CO2 to carbon. The calculation of the carbon emission coefficient and the converted standard coal coefficient of each energy type is based on the methods and coefficients in the IPCC Guidelines for the National Greenhouse Gas Inventory, General Principles for Calculation of Comprehensive Energy Consumption (GB/T2589-2020), and Guidelines for Compilation of Provincial Greenhouse Gas Inventories. The calculated carbon emission coefficient and converted standard coal coefficient value of each energy source are shown in Table 1 below.
(b)
Economic Benefit Evaluation Function Coefficient
Based on the economic output data of various land types per unit area from 2000 to 2020, the grey prediction model was used to calculate the economic benefits coefficient of each land type in 2030. Among them, cultivated land, woodland, grassland, water, and man-made surfaces are represented by agricultural output value, forestry output value, output value of animal husbandry, fishery output value, secondary industry output value, and tertiary industry output value. Wetland and unused land are not calculated.
(c)
Ecological Benefit Evaluation Function Coefficient
Separate from the economic benefits generated in the process of territory development, ecological benefits focus on the evaluation of products and services directly or indirectly provided by different ecosystems that meet human needs. Their value is usually based on their market price or substitution. The price of goods and services is quantified in economic terms [40,41]. This study quantifies the ecosystem service value based on the research of Xie Gaodi et al. [42], Dai Wenyuan et al. [43], and Wang Peijun et al. [44]. Their work is applied to the relevant areas in Fujian Province to establish the equivalent factor table of the ecosystem service value per unit area in Fujian Province (Table 2). The economic value of the annual natural grain output is calculated as a standard equivalent to calculating the ecological benefits per unit area of each category. The grey prediction model is used to obtain the ecological benefit coefficient of each land use in 2030 based on historical data.
An equivalent factor can be defined as the economic value of the annual natural grain yield of farmland with an average national yield of 1 hm2. This is calculated using the sown area, yield, and average price of major grain crops:
E = 1 n i = 1 n m i p i q i M
In Equation (3): E is the economic value of food production services provided by the unit cultivated land ecosystem (CNY 10,000); m represents the sown area of i grain crops (hm2); p i   represents the national average price of i grain crops in that year (CNY 10,000 t−1); q i   represents the yield per unit of grain   i (t hm−2); M represents the total area sown with grain crops (hm2); and   n   represents grain type.
Through calculation, the carbon emissions per unit area, economic benefit, and ecological benefit coefficient of each land use in Fujian Province from 2000 to 2030 are shown in Table 3.
(d)
Correction of Evaluation Function Coefficients Based on Development Orientation Constraints of Main Functional Areas
The differences in the development orientation of various main functional areas are considered. To implement the main function classification constraints and align the calculation results with the development priorities of each functional area, the carbon emissions, economic benefits, and ecological benefits of various functional areas and different types of areas are calculated separately. The ratio of the average value of the whole province is used as the correction coefficient for each evaluation function in various functional areas. Among them, the economic benefit correction coefficient is calculated by the ratio of the land-average economic benefits of various functional areas and different land types to the average value of the whole province. According to the existing research [45], the correction coefficient of carbon emissions for the total amount of carbon emissions in various functional areas over the years is obtained by calculating the ratio of unit area emissions of artificial land in various functional areas to the provincial average. The correction coefficient of the ecological benefit evaluation function is the ratio of the grain crop yield of each functional area to the average value of the whole province. The correction coefficients and calculation methods of various functional areas are shown in Table 4.
For 2030 calculations, the revised economic benefits, ecological benefits, and carbon emission evaluation function coefficients of different land types for each functional area in Fujian Province are shown in Table 5 below.
Among these calculations, the correction coefficient quantitatively reflects the difference in the development orientation of each functional area. The economic benefit coefficient of the urban construction area is comparatively higher, indicating that the economic foundation of the area is better. The carbon emission coefficient reflects the high pressure of low-carbon transformation in the region. The carbon emission coefficient of agricultural production areas is low, and the potential for carbon emission reduction in the process of land use and development is high. Additionally, ecological protection areas are key functional areas. Due to restrictions on large-scale industrialization and urbanization development, the coefficient of economic benefit here is low, and the development pressure is relatively high.
(e)
Land-Use Benefit Evaluation Function
Predictions of land-use benefits for each sub-region oriented toward low-carbon development need to take into account the comprehensive benefits. The coefficient setting of the evaluation function for each functional zone will be different to some extent. The evaluation function in this study is calculated by multiplying the evaluation function coefficients of different land use by the land area. The calculation content includes economic benefits, carbon emissions, and ecological benefits. The evaluation function setting is shown in Table 6.
4.
Coupling Coordination Degree Model
The coupling coordination degree model uses a coupling degree and a coordinated development degree to comprehensively evaluate and study the whole system. Its formula is
C = i = 1 n u i 1 n i = 1 n u i n 1 n
In Equation (4), C is the coupling degree value, n is the number of subsystems, and u i is the value of each subsystem.
The formula for calculating the degree of coordinated development D is
D = C × T = i = 1 n u i 1 n i = 1 n u i n 1 n × i = 1 n α i u i
In Equation (5), u i is the standardized value for the i subsystem, a is the weight of the i subsystem. In most studies, it is assumed that the importance of each subsystem is the same. To account for this, the same value is assigned to α i , and i = 1 n α i = 1 . Standardization for the division of coordination grades and coordinated development degrees is shown in Table 7 below.
Each indicator is standardized before calculation to eliminate the magnitude and direction differences between the original data:
u i j = U i j m i n U i j m a x U i j m i n U , u i j   is   a   positive   indicator
u i j = U i j m i n U i j m a x U i j m i n U , u i j   is   a   negative   indicator
In Equation (6), u i j is the standardized value of index i , U i j is the original value, and m a x U i j and m i n U i j are the maximum and minimum values of the index, respectively. Among them, economic benefits and ecological benefits are positive indicators, and carbon emissions are negative indicators.

3. Results

3.1. Spatial–Temporal Evolution Characteristics of Land-Use Benefit

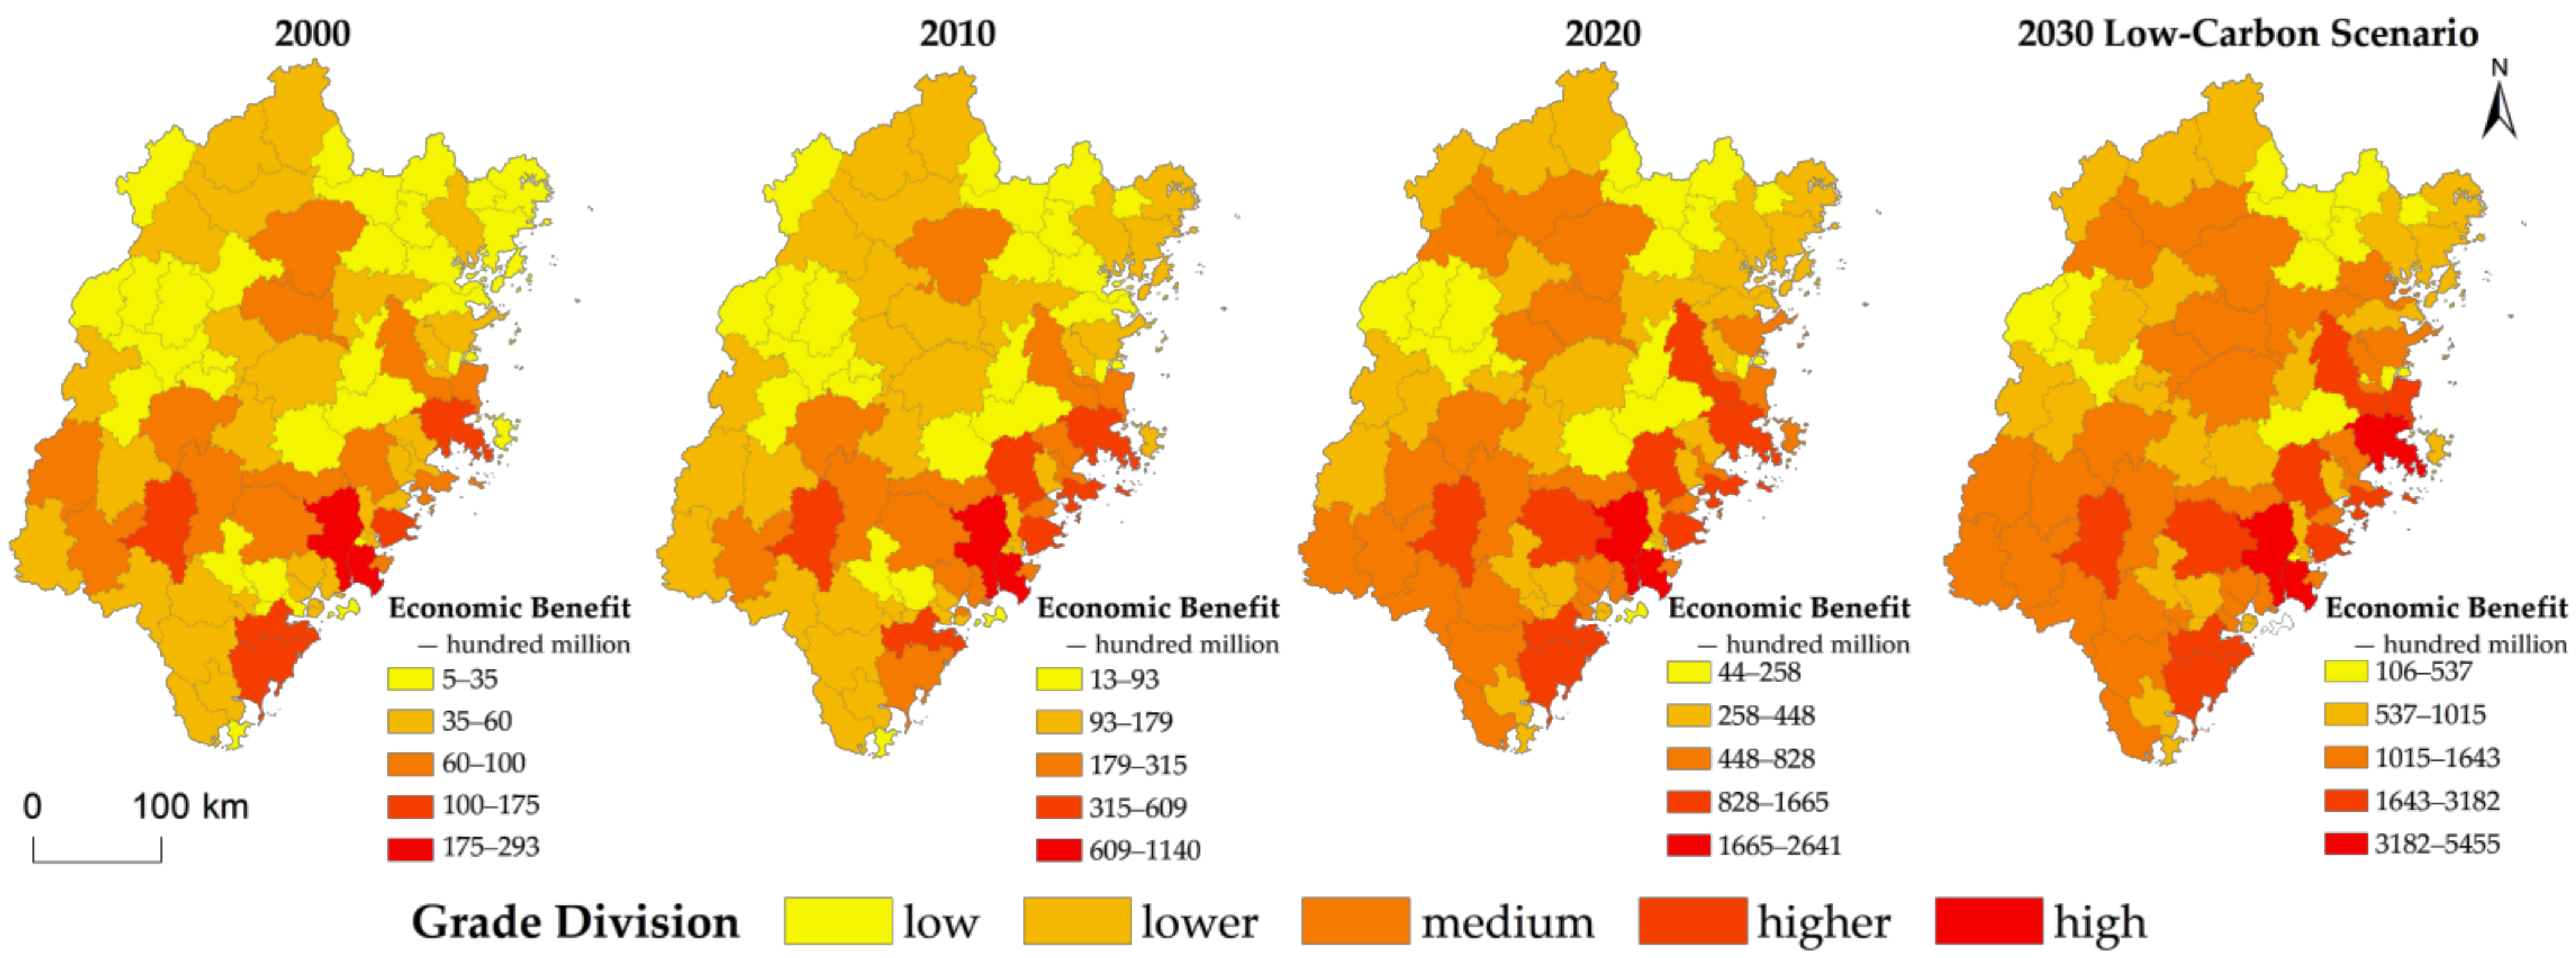
3.1.1. Economic Benefit

From 2000 to 2020, the overall economic benefits of land use in Fujian Province increased. From the historical development trend (Table 8) under the natural development scenario, the economic benefits of land use in counties (cities, districts) in Fujian Province increased rapidly. The economic benefits of each functional interval were significantly different. Under the 2030 low-carbon development scenario, to achieve the goal of carbon emission reduction, the artificial surface area is limited. This is the main carbon source and inhibits the economic benefits of land use, resulting in slightly lower economic benefits than the natural development scenario. However, the overall economic benefits of each functional area are still growing rapidly. From the perspective of spatial evolution (Figure 6), the differences in economic benefits among regions are obvious. In the past 20 years, the high-value areas of economic benefits are mainly distributed in the central areas of coastal cities and counties, such as Fuzhou, Quanzhou, Zhangzhou, and inland cities. The low-value areas of economic benefits are mainly distributed in the western and northern regions. On the whole, the spatial distribution characteristics follow a “high in the east and low in the west” trend. From 2000 to 2030, the number of low economic benefit areas decreased, and the number of high economic benefit areas increased significantly compared with previous years. The difference in economic development between regions is narrowing. Under the low-carbon development scenario in Fujian Province in 2030, assuming continuous economic development, the intensity of land development increases. The coastal economic development zone is formed with Fuzhou and Xiamen-Zhangquan metropolitan areas as the core. Middle- and high-value areas of economic benefit will appear. These will mainly rely on the core economic zones of Longyan, Sanming, and Nanping and spread to the surrounding cities and key counties, gradually narrowing the scope of the low-value areas of economic benefits. Meanwhile, a larger range of middle- and high-value areas will be formed and concentrated. The distribution of the low-benefit areas is relatively higher in Ningde City.
Comparing the economic benefits of the natural development scenario with the low-carbon development scenario in 2030 shows that the economic benefits of land use in each county (city, district) of Fujian Province have rapidly grown. The urban construction zone is aimed at economic construction, and we studied its economic benefits in 2030, and found that the urban construction zone contributes more than 80% to the economic benefits of Fujian Province in 2030 and achieves the target of 6.3% annual growth of GDP in the 14th Five-Year Plan, which meets the development needs of the 14th Five-Year Plan and matches the development orientation of the main functional area. Under the low-carbon development-oriented land-use structure adjustment, the economic benefits are slightly lower than those under the natural development scenario. However, the average annual growth rate of the economic benefits of the province after adjustment still reaches 7.3%. This is higher than the target value of 6.3% annual growth of regional GDP proposed by Fujian Province by 2030 to promote economic development and reduce carbon emissions. In the future, low-carbon economic land-use patterns should continue to be carried out along with an adjusted land use layout on demand and rational use of land resources. This will help achieve coordinated regional development, improve land economic benefits, and narrow the gap between regions.

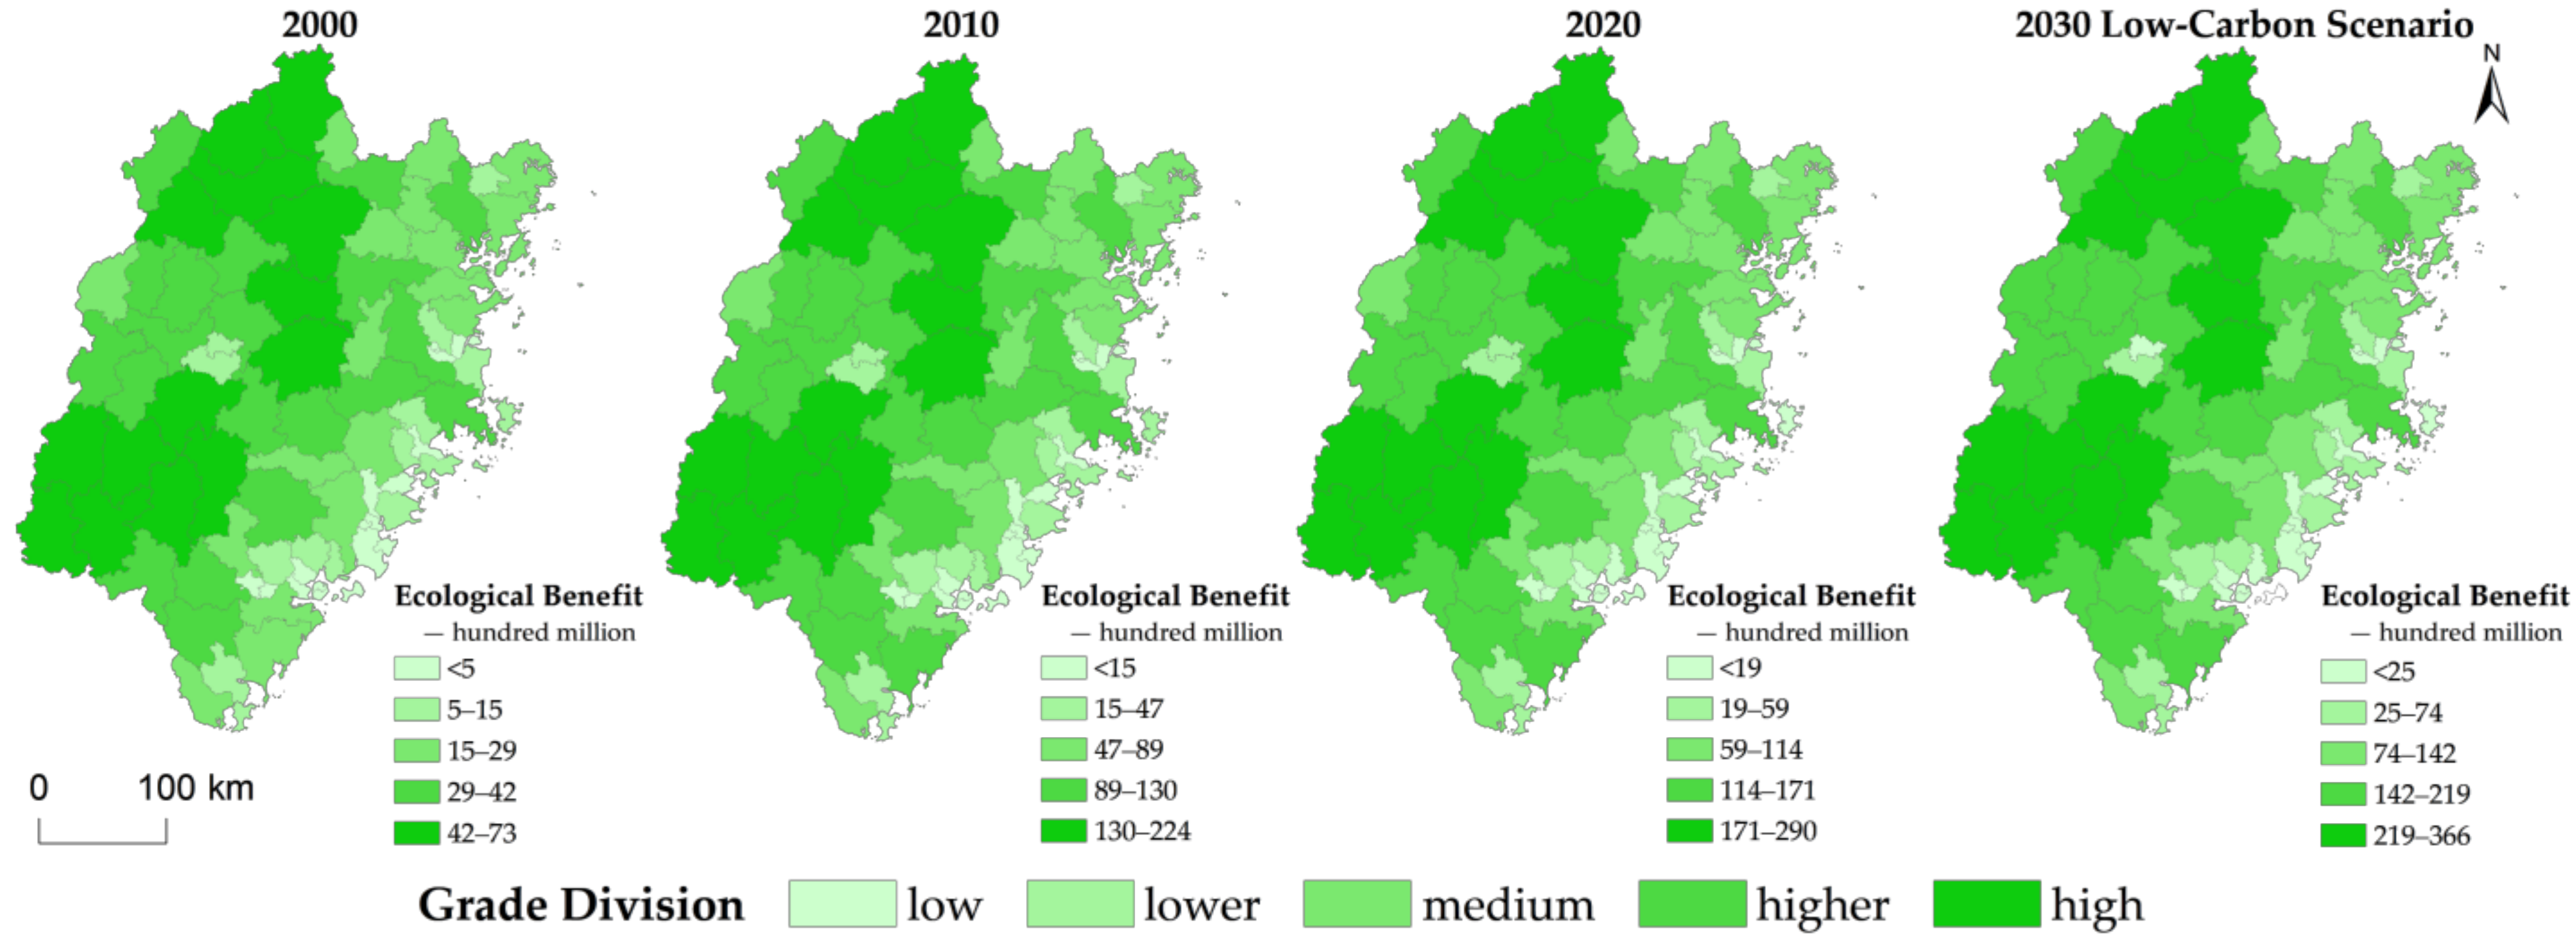
3.1.2. Ecological Benefit

From 2000 to 2020, the ecological benefits of land use in each functional area of Fujian Province fluctuated slightly. From the historical development perspective (Table 9), the overall trend of ecological benefits of land use in Fujian Province was stable. Compared with the natural development scenario, the ecological benefits of agricultural production areas and ecological protection areas were 0.87% and 0.28% lower, respectively, under the low-carbon development scenario, but the total difference was small. The ecological benefits of urban construction areas were 2.48% higher than those under the natural development scenario. Overall, the ecological benefits under the low-carbon development scenario were higher than those under the natural development scenario. From the perspective of spatial evolution (Figure 7), the overall ecological benefits of land use in Fujian Province increased steadily from 2000 to 2020. The general pattern was stable, and the difference between low-carbon development and natural development was small. Under the scenario of low-carbon development in Fujian Province in 2030, the ecological benefits continue along the historical trend. The middle-, high-, and low-value areas are concentrated, and carbon emissions decrease from inland to coastal areas. This is characterized by the distribution of the “high in the east and low in the west” trend. The middle- and high-value areas are still distributed in inland cities because the forest coverage rate is high, and the biodiversity is rich in this region. Among them, Wuyishan National Park in the north and Daimaoshan Ecological Barrier in the west are key ecological areas in Fujian Province due to their relatively high ecological benefits. The eastern coastal region is still a low-value area with ecological benefits. The region is flat and concentrated with good conditions for urbanization. Therefore, with continuous economic development and urbanization, ecological lands around the city, such as forests and grassland, will become occupied. This will continuously affect the ecological function of the region and keep the ecological benefits at a low level for a long time.
Comparing the ecological benefits of the natural development scenario with the low-carbon development scenario informs how to further implement the ecological strategy in Fujian Province and accelerate the construction of ecological civilization. The ecological benefits of land use in each county (city, district) steadily improve, and the relative economic benefits are less affected by the land use structure. We selected agricultural production areas and ecological reserves that restrict development and construction for the study. The agricultural production area is mainly to provide agricultural products, ensuring that the quality of arable land is not reduced. The increase in arable land enhances the function of agricultural production, and the contribution of ecological benefits reaches 37%, which provides a guarantee for national food security. The ecological reserve, on the other hand, is a key ecological function area, and the main function land types are woodland, grassland, wetland and water bodies, and large-scale and high-intensity development is restricted in the area, so the ecological benefit contribution is not high, reaching 16%. The predicted results of both are in line with the development plan of the main functional area. In the future, assuming a sustainable ecological environment, the ecological advantages of inland cities should be transformed into development advantages. The concept of green development should also be integrated into all aspects of economic and social development. This will promote the formation of green development and lifestyles and achieve a win–win situation of ecological and economic benefits.

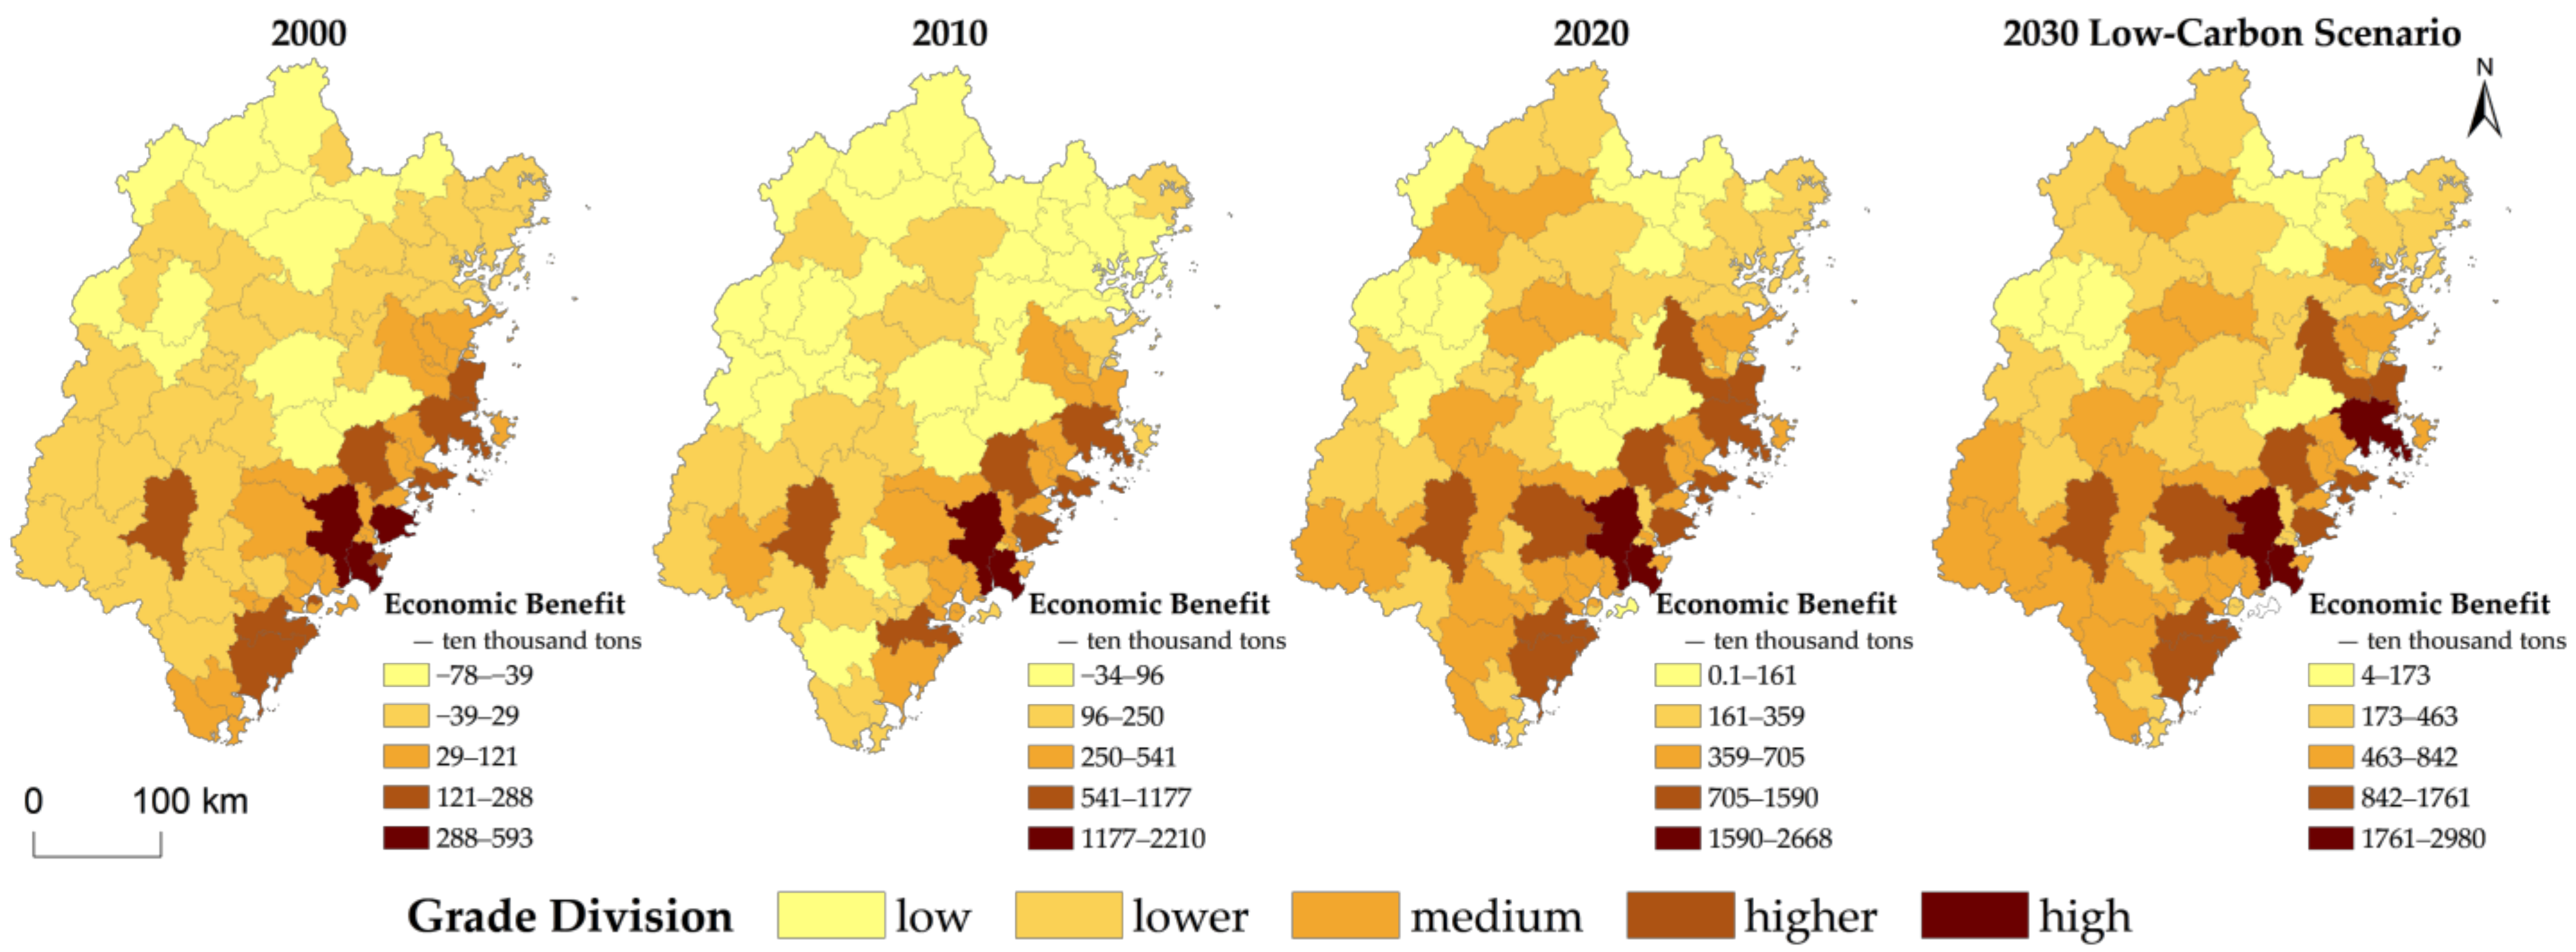
3.1.3. Carbon Emission Benefit

From 2000 to 2020, the carbon emissions from each functional area in Fujian Province showed a continuous upward trend as a whole. From the perspective of the historical development trend (Table 10) and Fujian Province’s economic development, the original grade of the low-carbon emission area inevitably increased gradually from negative to positive. National policies play a compulsory constraint role on regional land use and its changes, by guiding land-use changes, forming a reasonable, efficient and intensive land-use structure and improving land-use efficiency so as to achieve the purpose of improving overall land-use efficiency and reducing carbon emissions. For example, the food policy strictly protects arable land and basic farmland, controls the conversion of non-arable land to arable land to improve land-use efficiency, increases the effective arable land area, and meets the demand for arable land for social and economic development while reducing carbon emissions. In the natural development scenario, 2030, with economic growth as the primary goal, without considering the guidance and restrictions of national policies on land-use changes, the man-made surface is in a disorderly expansion trend, crowding out ecological space. Through the transformation of surrounding arable land and forest and grassland to complete the scattered to contiguous, with the background of urbanization process and industrialization, construction continues to accelerate, resulting in carbon emissions also beginning to grow. Under the low-carbon development scenario in 2030, the goal is to guarantee national food security, strictly control the inefficient and excessive expansion of carbon source land, ensure that arable land is not reduced, and avoid the occupation of ecological land, carbon emissions for the urban construction area, agricultural production area, and ecological protection area are 9.91%, 11.14%, and 9.54% lower than those under the natural development scenario, respectively. The average growth rate of counties (cities and districts) is 38.67%, which is 71.67% lower than in 2020. This shows that under the national policy, the optimization and adjustment of the land-use structure and layout can effectively reduce carbon emissions and resource loss caused by economic activities. In the process of reducing the negative effect of land-use development on the environment, the land-use mode can be changed from high-carbon extensive to low-carbon intensive. Considering spatial evolution (Figure 8), Fujian Province was dominated by low-carbon emission areas from 2000 to 2020. The number of high-carbon emission areas remained stable, the number of medium-carbon emission areas increased gradually, and the difference between carbon emission levels among regions was gradually narrowed. Under the low-carbon scenario in 2030, the agglomeration characteristics of high-value areas of carbon emissions are obvious. These are mainly concentrated in the southeast coastal areas of Fuzhou and Quanzhou. Other land-use ecological benefits are weak, and economic benefits are relatively high. The low-value areas of carbon emissions are mainly distributed in the northern and western regions of the inland, such as Nanping, Ningde, and Sanming. The overall suggestion is that the more developed the economy, the higher the carbon emissions, and the lower the environmental benefits.
Comparing the economic benefits of the natural development scenario with the low-carbon development scenario in 2030 shows that different land use layouts have a great impact on carbon emissions. Additionally, carbon emissions from counties (cities, districts) in the natural development scenario have increased sharply. Under the low-carbon development scenario from 2020 to 2030, the expansion trend of high-carbon regions in Fujian Province is effectively controlled. Compared with the natural development scenario, the land structure of each functional area under the low-carbon development scenario is more in line with the requirements of low-carbon economic development. This not only reduces the carbon emissions caused by land use, but also ensures that the land-use needs of social and economic development are consistent with the requirements of low-carbon green development in Fujian Province. In the future, the low-carbon economic land-use pattern should be the goal when finally realizing an efficient, intensive, and sustainable land-use pattern with adjusted land-use structures.

3.2. Coupling and Coordination of Relationships between Economic Benefits, Ecological Benefits, and Benefits of Carbon Emissions

Based on the land-use efficiency data of counties (cities, districts) in Fujian Province in 2000, 2010, 2020, and 2030, the temporal and spatial evolution was comprehensively analyzed. According to the prediction results from the 2030 low-carbon development scenario, Fujian Province can reduce carbon emissions and achieve economic growth goals while ensuring ecological benefits. Therefore, the coupling and coordination relationship between land-use benefits under the 2030 low-carbon development scenario is focused on below.

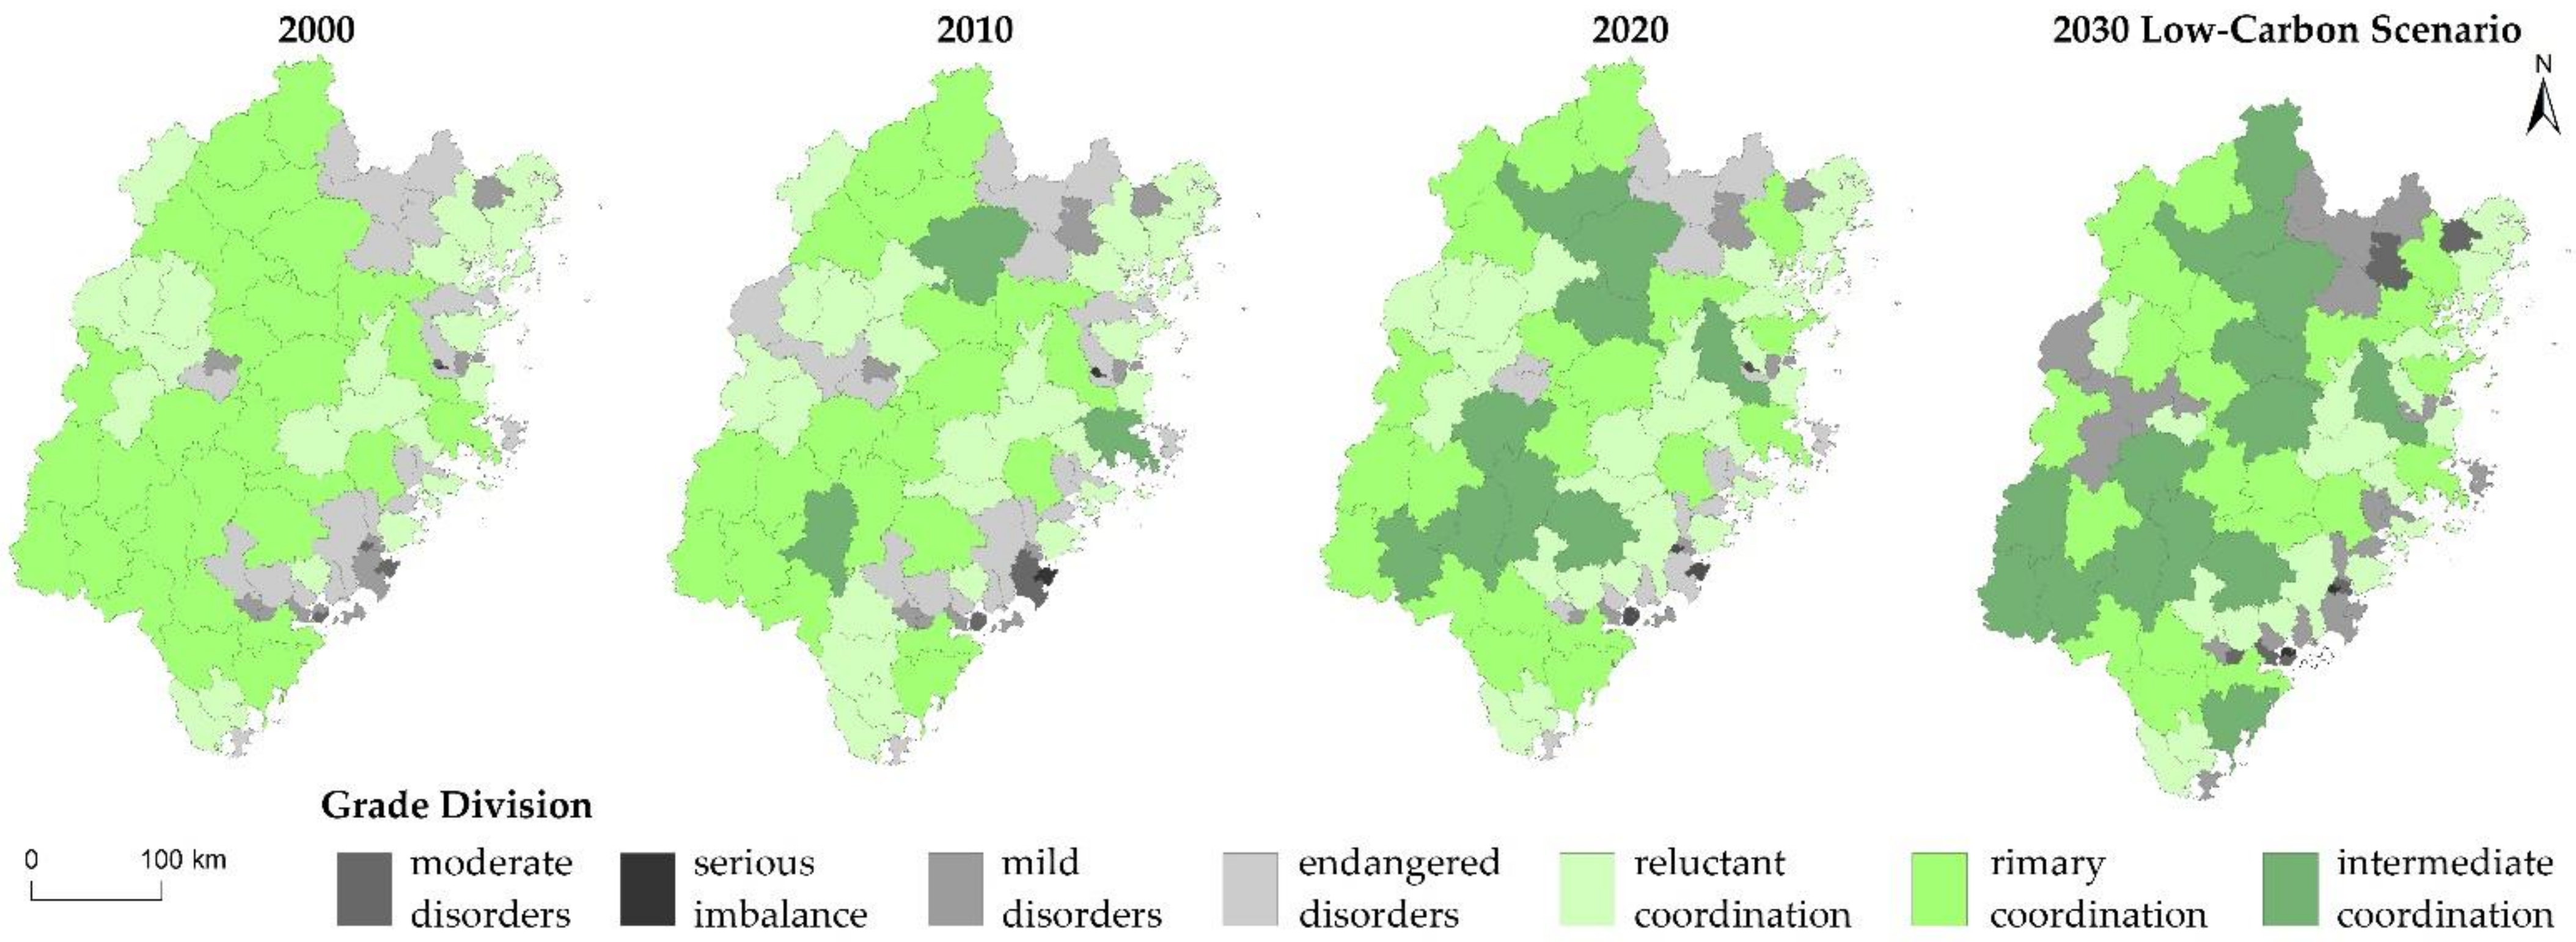
3.2.1. Temporal Variation and Spatial Differentiation of Coupling Coordination

From 2000 to 2020, the coupling coordination relationship of the “carbon emission-economy-ecology” model of land-use efficiency in Fujian Province showed an overall upward trend (Figure 9). In 2000 and 2010, the coupling coordination relationship was mainly dominated by reluctant coordination, primary coordination, and endangered imbalance, and the intermediate coordination level was lower. After 2020, the coordination level gradually increased, and some primary coordination areas were upgraded to intermediate coordination. This shows that the regional coupling coordination relationship has improved, to a certain extent, in the past 20 years. By 2030, the regional coordination relationship is gradually optimized, the number of intermediate coordination areas increases, and some barely coordinated regional levels are upgraded to primary coordination.
From the perspective of spatial distribution, the coupling coordination degree of land-use efficiency in Fujian Province has obvious spatial differences. Disordered areas are mainly scattered in small parts throughout the north and the core urban areas of coastal gateway cities. There is a small-scale disorder in the west of Fujian Province and a local westward spread in 2010, but this rises to the coordination zone by 2020. The coordination areas are mainly distributed in the inland areas. Between 2000 and 2010, these show mainly reluctant coordination and low-level coordination. The number of middle-level coordination areas is relatively small. After 2020, the coupling coordination relationship of some regions begins to show trends of agglomeration and upgrading from primary coordination to middle-level coordination. Under the low-carbon development scenario in 2030, the spatial distribution pattern of the coupling coordination relationship of land-use efficiency in the middle area is higher than in the surrounding areas. The middle-level coordination areas are mainly distributed in Nanping, Longyan, and Sanming.

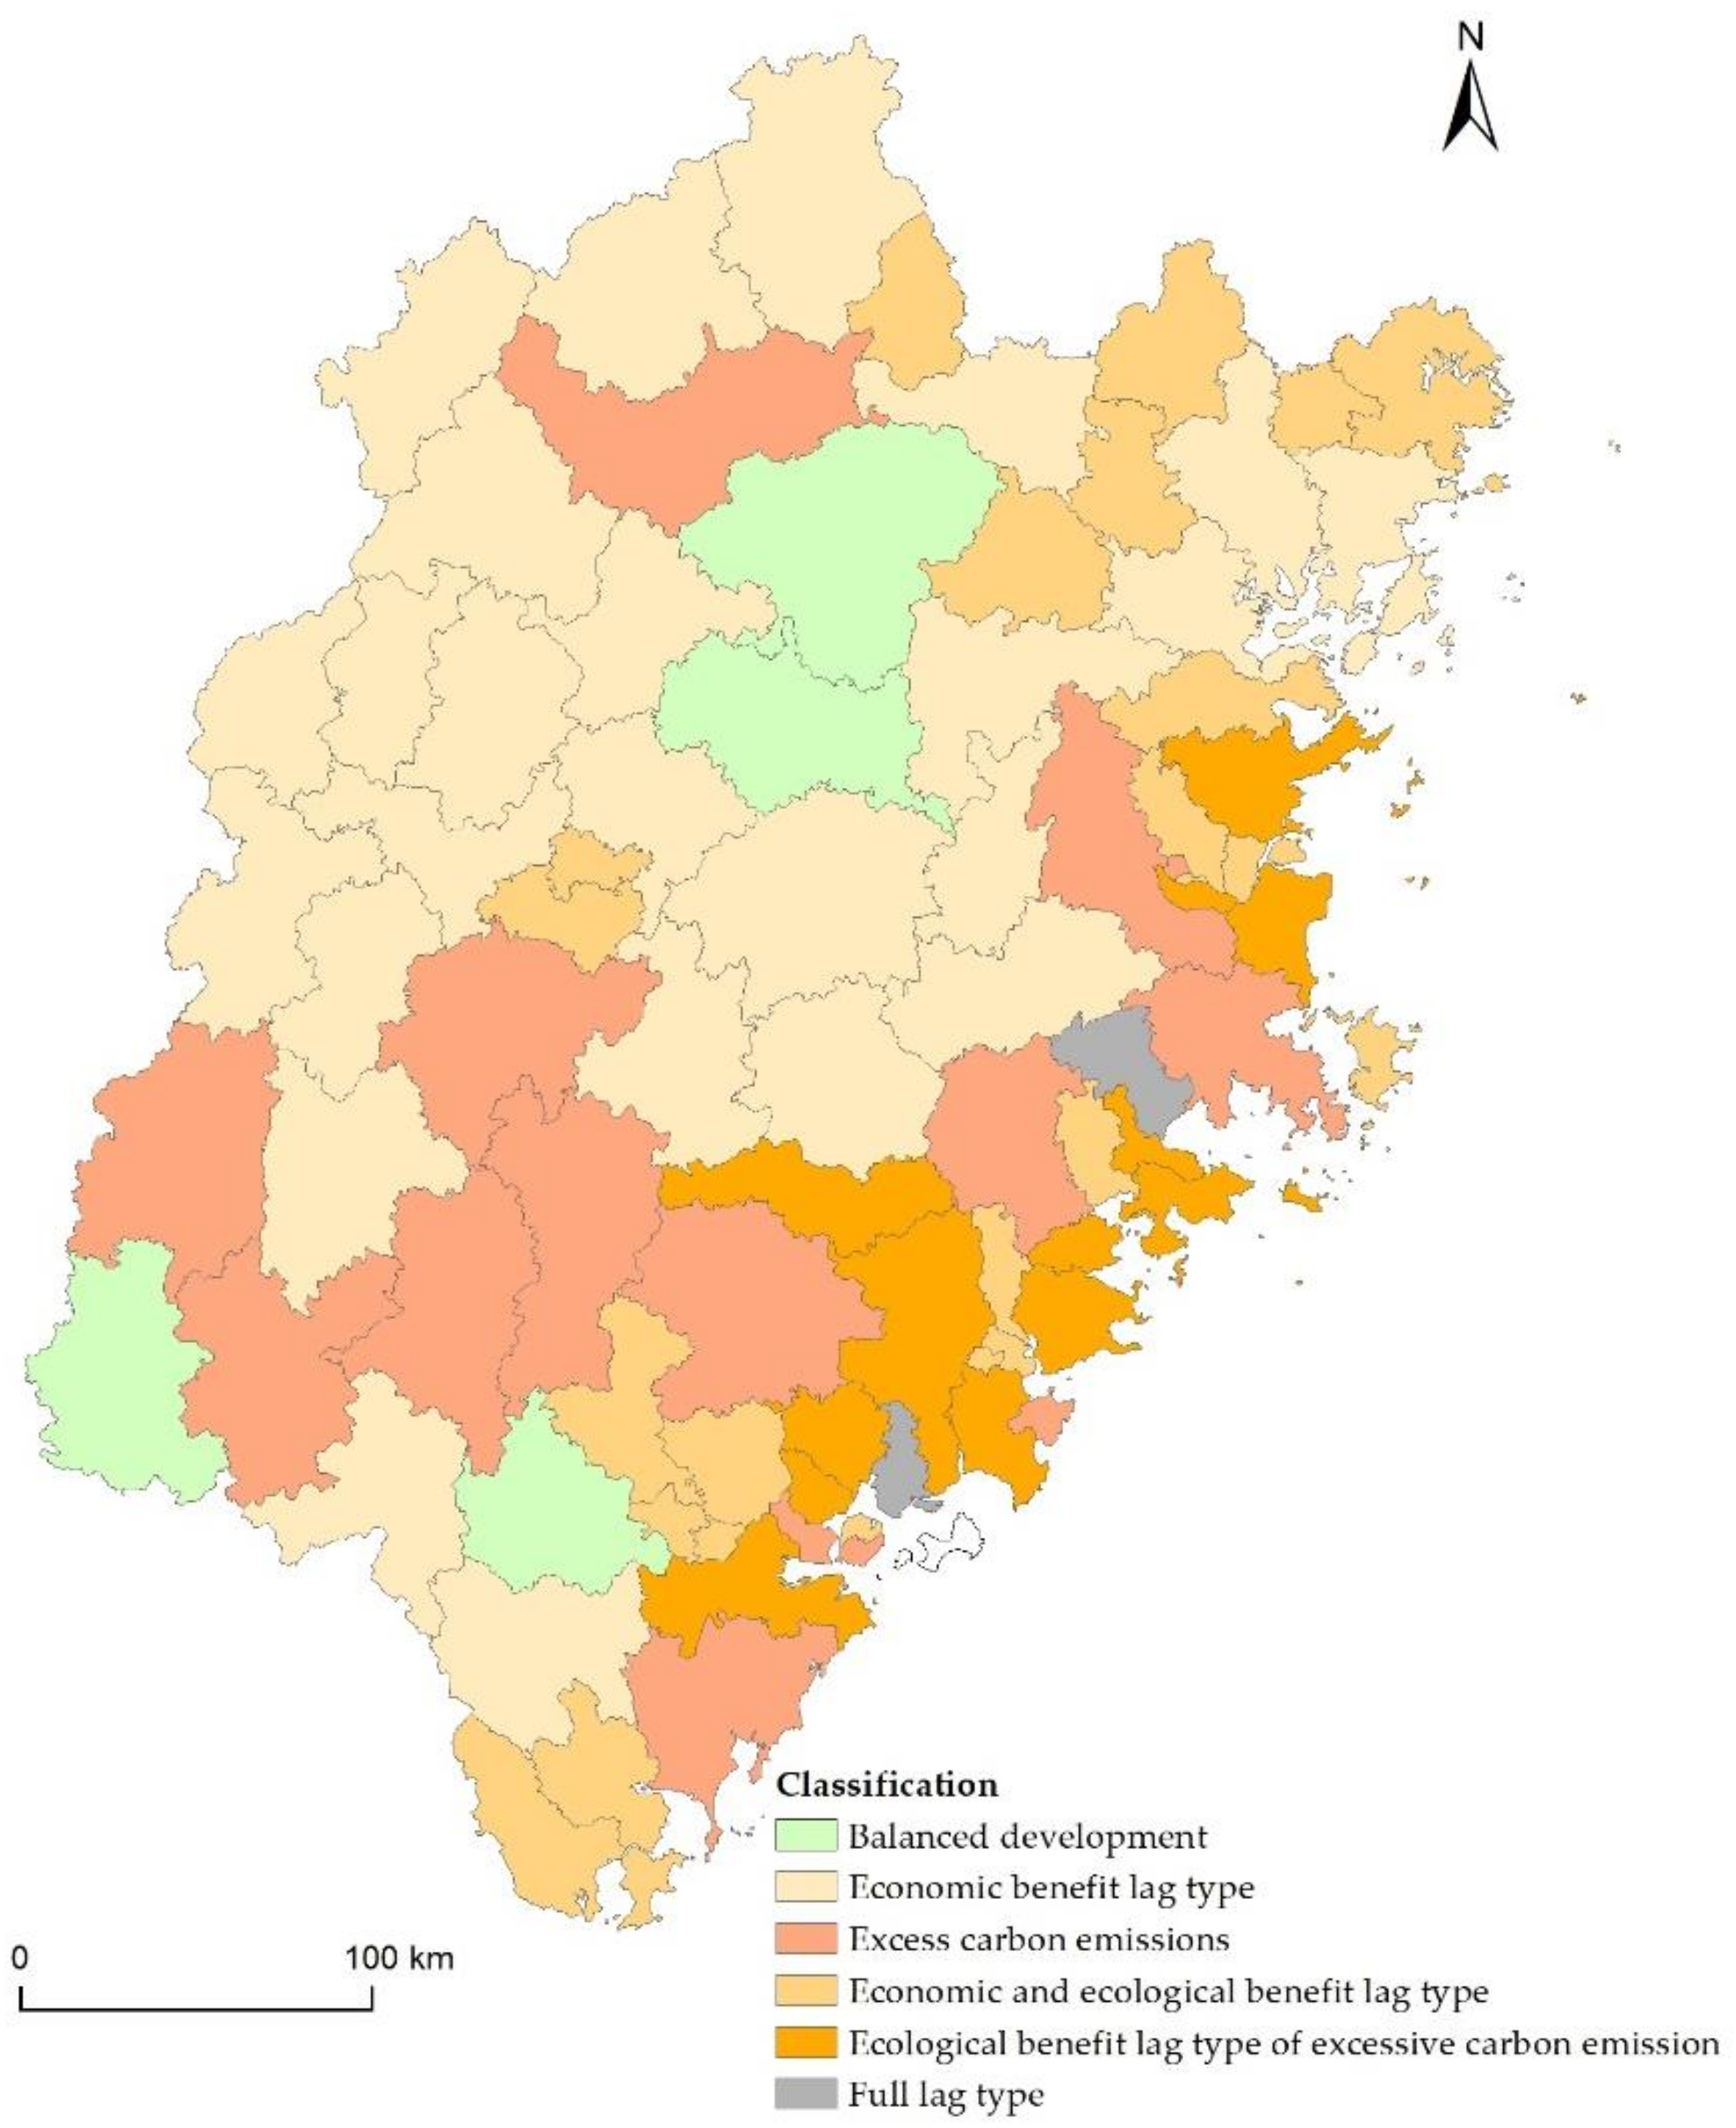
3.2.2. Analysis of the Restricted Factors for the Improvement of Coupling Coordination

Based on the assessed value of economic benefits, ecological benefits, and carbon emissions of counties (cities, districts) in Fujian Province under the low-carbon development scenario in 2030, eight types of restrictions (Table 11) are further identified. These are factors that limit the coupling and coordination degree of land-use benefits in different regions. U 1 , U 2 , and U 3 represent the land-use economic benefits, carbon emissions, and ecological benefits of counties (cities, districts) in the corresponding years, respectively. U 1 ¯ , U 2 ¯ , and U 3 ¯ represent the average values of economic benefits, carbon emissions, and ecological benefits of regional land use in the corresponding years, respectively. These can be divided into the single-factor influence type and compound-factor influence type. The single-factor influence is due to the lag or excess of economic, ecological, and carbon emissions. These affect the improvement of coupling coordination, including economic benefit lag, carbon emission excess, and ecological benefit lag. The influence of composite factors, that is, the improvement of the coupling relationship is restricted by two or three factors. These include the excessive carbon emission of economic lag, the lagging economic benefits, the lagging ecological benefits of excessive carbon emission, and comprehensive lagging.
The following table shows that under the low-carbon development scenario in 2030, 40 units affect the coupling coordination relationship of each county (city, district) in Fujian Province. This is due to the lag or excess of one factor in economic benefits, ecological benefits, and carbon emissions. Here, 45 units are affected by multiple factors. This shows that the coupling coordination relationship of land-use efficiency in Fujian Province is affected by the combination of single factors and multiple factors. Among them, 52 units restrict the improvement of coupling coordination through the combination of economic benefits and other factors as indicated under the low-carbon scenario in 2030. The lag of economic benefits caused by the slowdown of economic growth is the main reason for restricting the improvement of land-use coupling coordination relationships in some regions. The number of units that affect the coupling relationship of land-use benefit solely due to the lag of ecological benefit is 0. The number of units that are affected by the combination of ecological benefit and other factors is 40, indicating that the lag of ecological benefit is not the main factor affecting the coupling coordination of the region. The number of regions where the coupling coordination improvement is limited due to the combined influence of economic lag and excessive carbon emissions is 0. Additionally, 30 units affect the coupling coordination relationship through excessive carbon emissions and their interaction with other factors. This indicates that excessive carbon emissions have a modest limitation on the improvement of regional coupling coordination.
Figure 10 shows that the distribution of restrictive factors in the coupling coordination relationship of low-carbon land-use efficiency in Fujian Province in 2030 has certain spatial differences. From the spatial distribution and development characteristics of different land types, the following results can be seen.
Economic lagging areas are mainly distributed in Central, Northern, and Western Fujian Province. These include 25 counties (cities, districts), 6 urban construction areas, 14 agricultural production areas, and 5 ecological protection areas. Since most of them are concentrated in inland mountainous and hilly areas, there is still a gap compared with the economic development trend of coastal areas. Although the ecological benefits are good and the carbon emissions are low, the economic benefits are not prominent. This restricts further improvement of the coordination level. The coupling coordination is mostly in the barely and primary coordination levels. In the process of land-space development during the next stage, this part of the region should follow the advantages of the regional ecological environment. Doing so will improve economic benefits while avoiding wasted land resources by building a green and high-quality layout and supporting system.
The regions with excessive carbon emissions are mainly distributed in the southern and eastern parts of Fujian Province, including 15 counties (cities, districts). Among them, 11 are urban construction areas, 3 are agricultural production areas, and 1 is an ecological protection area. They belong to the areas with good economic development trends and low ecological benefits. Although the carbon emission intensity generated in the process of production activities is relatively higher than in other regions, there is no serious imbalance in the coordination of land-use efficiency. The coordination level is mostly intermediate coordination, which accompanies areas with relatively high coordination levels in Fujian Province. In the next development process, full play should be given to the advantages of regional original economic development. This will improve the proportion of green and low-carbon industries in the total economy. By integrating the original industries and reducing the negative impact on the ecological environment from improper development of land space, sustainable development and a low-carbon economy can be achieved smoothly.
The economic and ecological benefit lag area is mainly distributed in the eastern coastal cities and their surrounding areas. This includes 25 counties (cities, districts) with 18 urban construction areas, 2 agricultural production areas, and 5 ecological protection areas. The ecological environment of this kind of region is relatively fragile. Although some regions are located in coastal cities, due to the small urban scale and economic volume, they fail to show their economic benefits in the development process. The counties and cities in non-municipal areas have limited their economic and social development due to the “siphon effect” of the surrounding economically developed regions. The level of land-use coupling coordination here is also low. Most areas show moderate imbalance to imminent coordination, and a small part shows primary coordination. In the future development process, this kind of region should fully tap into and integrate the existing available land resources. This will improve the economic benefits of land use by optimizing the allocation of resources and promote the further improvement of economic benefits through linked development with the surrounding economically developed regions. At the same time, ecological environmental protection measures should be actively implemented to ensure that they meet the requirements of ecological environment development and facilitate the high-quality development of land space.
The regions with lagging ecological benefits of excessive carbon emissions are mainly distributed in the southeast coastal area of Fujian Province. This includes 13 counties (cities, districts), 12 urban construction areas, and 1 ecological protection area. Regional economic development has great advantages, but it also produces large carbon emissions and harms the ecological environment. The result is low ecological benefits of land use. The coupling coordination level here is mostly on the verge of imbalance and primary coordination. For such regions, the next focus of development should be to strengthen the construction of continuous resource-based industries and reduce the impact of urbanization on the ecological environment. This will help achieve a smooth transition in the process of regional economic transformation and promote green, low-carbon, and healthy development of regional land space.
The overall lagging area mainly includes Xiang’an District and Hanjiang District, both of which are urban construction areas. The economic and ecological benefits of this type of region are lower than the average level, and the total carbon emissions are relatively high. The negative impact on the ecological environment also restricts economic development to a certain extent, and the relative coordination level of land use benefit is mostly imbalanced. Therefore, the future development of such areas should first enhance the economic benefits of land use. This will help promote ecological benefits, improved land-use efficiency, and reduced carbon emissions to further ensure that economic and social development needs are met.
Balanced development areas are scattered throughout the inland areas of Fujian Province, including 4 counties (cities, districts), 1 urban construction area, and 3 agricultural production areas. Although this kind of area is limited by the natural geographical environment and location, the overall performance has good economic and ecological benefits. Carbon emissions are also lower than average. At the same time, the land-use efficiency coordination level is high and mostly intermediate coordination. In the next stage of development, this part of the region should use its advantages to further improve the economic benefits, avoid a greater burden on the ecological environment, and maintain resilience.

4. Discussion

4.1. Changes in Land-Use Benefits

Fujian Province is located on the southeast coast of China and is an important economic zone on both sides of the straits. With the development of the social economy, the demand for land resources is increasing. This has a significant impact on the economic and ecological environment of the province. Fujian Province is the first national ecological civilization pilot area. It plays a key role in exploring new models of ecological civilization construction, optimizing land-space layout, promoting the construction of beautiful China, and realizing green and sustainable development of a social economy [46,47]. Results show that the change in land-use structure has a great influence on land-use efficiency from the perspective of the spatial evolution effect of different land-use types. The overall efficiency of land use in Fujian Province continued to improve from 2000 to 2020, and the economic benefits showed the spatial distribution characteristics of a “high in the east and low in the west” trend.
Under the 2030 low-carbon development scenario, carbon emissions are effectively constrained, and land-use types and spatial patterns directly affect these levels [48]. Due to the limited expansion of artificial land, although the economic benefits of land use are relatively low compared with natural development scenarios, the goal of GDP growth in Fujian Province is reached by 2030. Using an in-depth implementation of ecological strategies in Fujian Province, the ecological benefits maintain an upward trend with an average growth rate of 26%. The spatial distribution pattern is stable, showing a “high in the west and low in the east” trend and a decreasing trend from inland to coastal areas. The average growth rate of carbon emissions in 2030 dropped to 39% from 136% in 2020. The high-value areas are mainly distributed in the southeast coastal areas with convenient transportation and superior location conditions. The low-value areas of carbon emissions are mainly distributed in the northern and western inland areas. The level of land use efficiency is directly related to the spatial pattern of sustainable land utilization and future urban development [49]. Therefore, the evaluation of land-use efficiency based on land-use patterns and spatial distribution is conducive to the low-carbon utilization of resources and high-quality sustainable development in Fujian Province.

4.2. Coupling Coordination of Land Use Benefits

From 2000 to 2030, the coupling coordination of carbon emissions, economic, and ecological benefits of land use in all counties (cities and districts) in Fujian Province showed an overall upward trend. The coupling coordination of land-use benefits between regions was significantly different. From 2000 to 2020, the coupling coordination relationship in Fujian Province took Jian’ou City and Zhangping City as the center and expanded around them. By 2030, the coupling coordination relationship of land-use benefits is gradually optimized under the low-carbon development scenario. The spatial distribution pattern of the two high sides of the mountain urban development zone is initially formed, and the intermediate coordination areas are mainly distributed in Nanping, Longyan, and Sanming. Considering factors that limit the improvement of coupling coordination under the low-carbon development scenario in 2030, the improvement of the coupling relationship of land-use efficiency in each county (city and district) is affected by multiple factors. Among them, economic benefits develop relatively slowly compared with ecological benefits and carbon control benefits. This is the main reason for restricting the improvement of the coupling coordination relationship of land use efficiency. Excessive carbon emissions have less limitation on the improvement of regional coupling coordination, and the influence degree is economic benefit > ecological benefit > carbon emission. For successful land space development, the advancement of ecological civilization construction and the comprehensive green transformation of economic and social development are considered. The inevitable choice is for the coordinated development of carbon emissions, economic, and ecological environmental benefits of land use in Fujian Province to promote benefits in different areas of various land types. For future development, each region should form a targeted improvement path according to its advantages and disadvantages to reduce carbon emissions in the process of urbanization and improve the ecological environment and land-use efficiency.

5. Conclusions

Taking Fujian Province as an example, the first national ecological civilization pilot area in China, this paper evaluates the historical, current, and future land-use benefits. Herein, the land-use benefit evaluation model, grey prediction model, and coupling coordination degree model are used to analyze the relationship between the carbon emission, economic benefit, and ecological benefit of land use. This study identifies the main factors that restrict the improvement of coupling coordination relationships in different regions and provides a reference for the scientific preparation of future land-space planning to improve efficiency and achieve regional, green, and low-carbon sustainable development. Results show that the optimization of the land-use structure and spatial layout based on low-carbon development orientation can effectively achieve carbon emission reduction while ensuring steady economic growth and accounting for improved land-use ecological benefits.
Therefore, through the optimization of land-use structures for low-carbon results, Fujian Province needs to promote the coupling and coordinated development of land use, carbon emissions, and economic and ecological benefits. This study still has some limitations. First, the selection of land-use benefit evaluation variables only considers some land types. This is due to the relatively immature land-use benefit evaluation under the low-carbon development scenario and the limitation of land-use data acquisition. Subsequent research can establish the evaluation model according to the land-use classification of land space planning. Second, only carbon emissions, economic benefits, and ecological benefits of land use are selected as evaluation functions in the model, and the social benefits of land use are not considered. This is due to the difficulty in obtaining statistical data of counties (cities, districts). Third, when evaluating the forecast results, it is possible to assess whether the proposed forecasts are realistic from the economic and food security perspectives. Therefore, when the results of the study are consistent with the timing of relevant government planning documents, the analysis of economic and arable land security indicators for cities can be considered to optimize the prediction of land-use benefits in future studies. Finally, due to the lack of relevant comparable data caused by the inconsistency of research perspectives and time scales, the research results could not be compared and analyzed with the carbon emission prediction results of other regions in the world, and subsequent studies could compare the prediction results of key cities in China with those of developed cities in the world, which would be beneficial for major cities to carry out experiments to improve land-use efficiency, reduce carbon emissions, and accelerate the realization of carbon peak carbon neutrality. In the future, the evaluation of land-use efficiency for low-carbon results needs to be further analyzed. Additionally, the evaluation model of land-use efficiency should be further improved to make the coupling results more scientific and effective. As the spatial and temporal evolution characteristics of land-use efficiency are studied through simulated land-space layouts in low-carbon scenarios, the main factors that restrict the improvement of coupling and coordination relations in different regions are identified. To promote the efficient use of land resources and the coupling coordination of land-use efficiency, more targeted suggestions are needed.

Author Contributions

Conceptualization, D.L., K.F. and J.L.; methodology, D.L., K.F. and J.L.; validation, D.L. and K.F.; formal analysis, J.L., X.X. and K.F.; data curation, X.X. and J.L.; writing—original draft preparation, D.L. and K.F.; writing—review and editing, D.L. and K.F.; supervision, D.L. and S.W.; project administration, D.L. and S.W. All authors have read and agreed to the published version of the manuscript.

Funding

This research was supported by the Strategic Priority Research Program of the Chinese Academy of Sciences, funder Sheng Wu, funding number XDA23100502.

Data Availability Statement

The data of this work can be shared to the readers depending on the request.

Acknowledgments

We thank the editors of the Land reviewers for their valuable suggestions.

Conflicts of Interest

The authors declare no conflict of interest.

References

  1. Yue, W.; Zhong, P.; Wang, T.; Xia, H. Theoretical Thinking on Allocation of Land Development Rights from the Perspective of Territorial Space Planning. China Land Sci. 2021, 35, 1–8. [Google Scholar]
  2. Zhang, J.; Xia, T. The change and reconstruction of spatial planning system under the goal of modern national governance. J. Nat. Resour. 2019, 34, 2040–2050. [Google Scholar] [CrossRef]
  3. Zhu, W.; Sun, H. Study on Spatio-Temporal Evolution and Driving Forces of Urban Land Use Benefits in Jiangsu Province. China Land Sci. 2019, 33, 103–112. [Google Scholar]
  4. Gao, S.; Zhang, H. Urban planning for low-carbon sustainable development. Sustain. Comput. Inform. Syst. 2020, 28, 100398. [Google Scholar]
  5. Fabris, L.M.F.; Camerin, F.; Semprebon, G.; Balzarotti, R. New healthy settlements responding to pandemic outbreaks. Approaches from and for the Global City. Plan J. 2020, 5, 358–406. [Google Scholar] [CrossRef]
  6. Sepe, M. Designing Healthy and Liveable Cities: Creating Sustainable Urban Regeneration (Routledge Studies in Urbanism and the City), 1st ed.; Routledge: London, UK, 2022; pp. 1–20. [Google Scholar]
  7. Cheng, R.; Wang, F. Land Use Benefit Evaluation and Barrier Diagnosis of Pearl River Delta from the Perspective of Low-Carbon Ecological City. Res. Soil Water Conserv. 2021, 28, 351–359. [Google Scholar]
  8. Liao, J.; Peng, X.; Wang, Q.; Jian, P.; Wu, Q. Study on the coupling and coordination relationship of urban land use benefit in urban agglomeration on the west coast of Taiwan Strait. World Reg. Stud. 2021, 30, 556–566. [Google Scholar]
  9. Zhou, K.; Wang, F. Study onevaluation of social benefit of land use system: A case study of Banan District in Chongqing City. China Popul. Resour. Environ. 2017, 27, 166–169. [Google Scholar]
  10. Yang, L.; Xia, H.; Yuan, S. Spatial Analysis on Economic Benefit of Land Utilization based on Coupling Coordination Degree: A Case Study of Zhejiang Province. China Land Sci. 2015, 29, 83–88. [Google Scholar]
  11. Hu, M.; Zhang, J.; Xu, L.; Tang, X.; Wang, L. Eco-efficiency of Land Use Based on Ecological Green Equivalent in the Manas River Basin. Arid. Zone Res. 2016, 33, 996–1002. [Google Scholar]
  12. Zhang, R.; Jiao, H. Urban Land Use Efficiency Evaluation and Pattern Evolution Mechanism in Pan-Yangtze River Delta. Geogr. Geo-Inf. Sci. 2014, 30, 75–81. [Google Scholar]
  13. Hu, Y.; Qiao, W.; Wan, Y.; He, T.; Chai, Y.; Bi, Y. Comprehensive Evaluation and Spatial Distinction of Land Use Efficiency in County Area of Jiangsu Province. Econ. Geogr. 2020, 40, 186–195. [Google Scholar]
  14. Wang, Y.; Song, G. The Benefits Evaluation Method and Application of Urban Land Use. Sci. Geogr. Sin. 2006, 26, 743–748. [Google Scholar]
  15. Wang, G.; Liu, Y.; Fang, F. Comprehensive evaluation and spatial distinction of land use efficiency around Bohai Rim in China. Prog. Geogr. 2013, 32, 649–656. [Google Scholar]
  16. Qiu, J.; Zhao, M.; Wu, J. Measurement on the Benefits of Regional Land Use in China Based on Coupling Relationship. China Popul. Resour. Environ. 2012, 22, 103–110. [Google Scholar]
  17. Tang, Y.; Wang, C.; Wang, R.; Xue, M.; Dou, W. Coupling Resrarch on Urban Expansion and Land Use Efficiency Based on Smart Development: A case of jinan’s core area. Hum. Geogr. 2020, 35, 91–98. [Google Scholar]
  18. Liu, Y.; Zhu, X.; Liu, K.; Zhang, B. Spatiotemporal coupling and coordination research on land development degree and land use benefit in Shandong Province. J. Xi’an Univ. Technol. 2021, 37, 165–175. [Google Scholar]
  19. Wu, R.; Wu, Q.; Bu, R.; Xiang, B.; Zha, N. Study on coupling and coordination method of land use degree and benefits: A case study of Ar Khorqin Banner. J. Environ. Eng. Technol. 2019, 9, 286–293. [Google Scholar]
  20. Liang, H.; Liu, W.; Liu, H.; Ling, Y.; Liu, Y. Coupling Relationship between Socio-economy Benefits and Eco-environment Benefits of Land Use in Shenzhen City. Sci. Geogr. Sin. 2008, 28, 636–641. [Google Scholar]
  21. Zhou, Z.; Chen, F.; Zhang, H.; Chen, L. Analysis on Coordinated Development between Socio-economy Benefits and Eco-environmental Effectiveness of Land Use in Guangdong Province in 2009. Areal Res. Dev. 2011, 20, 116–120+135. [Google Scholar]
  22. Zhang, M.; Mo, D. Coupling Coordination Degree of Urban Land Use Benefit and Urbanization. Resour. Sci. 2014, 36, 8–16. [Google Scholar]
  23. Shi, K.; Yang, Y.; Zhang, W.; Song, M.; Bai, S.; Li, B. Coupling Mechanism between Urban Land Use Benefits and Urbanization in the Shiyang River Basin: A Case Study in Liangzhou, Wuwei. Arid. Zone Res. 2016, 33, 655–663. [Google Scholar]
  24. Zhang, Z.; Zhu, J.; Xie, J.; Zhang, Y.; Ma, Z. Coupling Coordination Between Land Use Benefits and Urbanization in Xi’an City. Res. Soil Water Conserv. 2020, 27, 308–316. [Google Scholar]
  25. Liu, C.; Luo, J.; Huo, Y.; Cheng, L. Exploring Spatial-Temporal Variation and Coordination of Land Use Benefits and Urbanization at County Level in Shaanxi Province. Res. Soil Water Conserv. 2020, 27, 320–327+335. [Google Scholar]
  26. Zhang, X. Analysis and Evaluation of Coordition Degree between Land Use Efficiency and New Urbanization---An Empirical Analysis based On Middle Reaches of Yangtze River. Chin. J. Agric. Resour. Reg. Plan. 2017, 38, 62–68. [Google Scholar]
  27. Wang, F.; Shi, Y.; Yao, B.; Qu, L.; Xu, L.; Ma, C.; Zhang, C.; Li, L.; Zhou, H. Coupling and Coordination Development Between Urban Land Use Benefits and New Urbanization in Xi’ning City. Res. Soil Water Conserv. 2016, 23, 253–259. [Google Scholar]
  28. Yang, J.; Wang, Z.; Jin, G.; Cheng, B.; Hou, X. Post Benefit Evaluation of Land Consolidation Project Implementation based on Ahp and Fuzzy Comprehensive Evaluation. Resour. Environ. Yangtze Basin 2013, 22, 1036–1042. [Google Scholar]
  29. Zheng, L.; Zhang, Z.; Ma, Y.; Dong, J. Evaluation of land use benefit and analysis of the coupling coordination degree in Gansu Province. J. Lanzhou Univ. (Nat. Sci.) 2022, 58, 11–19. [Google Scholar]
  30. Tian, J.; Wang, B.; Wang, S. Urban Land Use Efficiency and Its Coupling Relationship in the Three Provinces of Northeast China. Sci. Geogr. Sin. 2019, 39, 305–315. [Google Scholar]
  31. Yang, X.; Tang, X. The coupling and coordinating relationship between land use benefit and ecological environment in Chengdu-Chongqing city cluster. Hubei Agric. Sci. 2020, 59, 177–181. [Google Scholar]
  32. Zhao, H.; Zhao, Y.; Ning, J.; Gao, T.; Sun, Z. Evaluation of Land Use Benefit of Urban Agglomeration in the Yangtze River Delta Based on TOPSIS Method. Res. Soil Water Conserv. 2021, 28, 355–361. [Google Scholar]
  33. Zhang, W.; Shi, P.; Yin, J. Spatio-temporal evolution and coupling coordination relationship of land use benefits in Lanzhou-Xining urban agglomeration. Chin. J. Ecol. 2022, 1–13, (accepted; in press). [Google Scholar]
  34. Chen, Z.; Yu, B.; Yang, C.; Zhou, Y.; Yao, S.; Qian, X.; Wang, C.; Wu, B.; Wu, J. An extended time series (2000–2018) of global NPP-VIIRS-like nighttime light data from a cross-sensor calibration. Earth Syst. Sci. Data 2021, 13, 889–906. [Google Scholar] [CrossRef]
  35. Li, D.C.; Lu, J.Q.; Xie, X.W.; Yu, H.; Li, Y.; Wu, S. Optimization simulation of land space zoning based on the classification constraints of main functional zones from the perspective of carbon neutrality: A case study of Fujian Province. Acta Ecol. Sin. 2022, 24, 1–16, (accepted; in press). [Google Scholar]
  36. Lai, L. Carbon Emission Effect of Land Use in China. Ph.D. Thesis, Nanjing University, Nanjing, China, 2010. [Google Scholar]
  37. Wang, F.; Hong, Z.; Kang, Z.; Lan., S.; Chen, S.; Ye, Y. Spatial-temporal Variations and Driving Forces of Agricultural Carbon Emissions in Fujian. Fujian J. Agric. Sci. 2019, 34, 124–134. [Google Scholar]
  38. Wei, Y.; Chen, S. Spatial correlation and carbon balance zoning of land use carbon emissions in Fujian Province. Acta Ecol. Sin. 2021, 41, 5814–5824. [Google Scholar]
  39. Su, K.; Chen, Y.; Fan, S.; Zhang, M. Influencing factors and reduction mechanism of carbon emissions at the city-range: An empirical study on Fujian province. China Environ. Sci. 2019, 39, 859–867. [Google Scholar]
  40. Hasan, S.S.; Zhen, L.; Miah, M.G.; Ahamed, T.; Samie, A. Impact of land use change on ecosystem services: A review. Environ. Dev. 2020, 34, 100527. [Google Scholar] [CrossRef]
  41. Costanza, R.; D’Arge, R.; de Groot, R.; Farber, S.; Grasso, M.; Hannon, B.; Limburg, K.; Naeem, S.; O’Neill, R.V.; Paruelo, J.; et al. The value of the world’s ecosystem services and natural capital. Nature 1997, 387, 253–260. [Google Scholar] [CrossRef]
  42. Xie, G.; Zhang, C.; Zhang, L.; Chen, W.; Li, S. Improvement of the Evaluation Method for Ecosystem Service Value Based on Per Unit Area. J. Nat. Resour. 2015, 30, 1243–1254. [Google Scholar]
  43. Dai, W.; Jiang, F.; Huang, W.; Liao, L.; Jiang, K. Study on Transition of Land Use Function and Ecosystem Service Value Based on the Conception of Production, Living and Ecological Space: A Case Study of the Fuzhou New Area. J. Nat. Resour. 2018, 33, 2098–2109. [Google Scholar]
  44. Wang, P.; Sun, H.; Hua, B.; Fan, S. Evaluation and Dynamic Simulation of Ecosystem Service Value in Coastal Area of Fuzhou City. Trans. Chin. Soc. Agric. Mach. 2020, 51, 249–257. [Google Scholar]
  45. Chen, J.; Gao, M.; Hou, W.; Cheng, S.; Song, M.; Liu, X.; Liu, Y.; Shan, Y. County-level CO2 emissions and sequestration in China during 1997–2017. Sci. Data 2020, 7, 391. [Google Scholar] [CrossRef] [PubMed]
  46. Liang, C.; Zeng, J.; Ding, S. Research on Coupling Coordination Development Between Regional Ecological Civilization Construction and Urbanization: A Case Study on Fujian Province. J. Hum. Settl. West China 2022, 37, 112–118. [Google Scholar]
  47. Lin, C. Thoughts and Countermeasures to Accelerate the First Exploration of Fujian’s Ecological Civilization. Soc. Sci. Rev. 2017, 32, 83–86. [Google Scholar]
  48. Zhang, C.; Luo, L. Optimization approach of urban land use model based on low-carbon ecological concept. Product. Res. 2012, 7, 135–136+159. [Google Scholar]
  49. Wu, J.; Tu, J.; Yan, X.; Zhou, Y. Study on the Coupling Mechanism between Urban Land Use Benefits and Urbanization in China. Urban Dev. Stud. 2011, 18, 42–45+63. [Google Scholar]
Figure 1. Location of the study area.
Land 11 01498 g001
Figure 2. The main functional zoning of Fujian Province.
Land 11 01498 g002
Figure 3. Land-use simulation map of Fujian Province under natural development scenario in 2030.
Land 11 01498 g003
Figure 4. Land-use simulation map of Fujian Province under low-carbon development scenario in 2030.
Land 11 01498 g004
Figure 5. Technical roadmap.
Land 11 01498 g005
Figure 6. Spatial pattern evolution of land economic benefit in Fujian Province.
Land 11 01498 g006
Figure 7. Evolution of spatial pattern of the ecological benefit of land use in Fujian Province.
Land 11 01498 g007
Figure 8. Spatial pattern evolution of land carbon emissions in Fujian Province.
Land 11 01498 g008
Figure 9. Spatial pattern evolution of coupling coordination relationship among land economy, ecology, and carbon emissions in Fujian Province.
Land 11 01498 g009
Figure 10. The distribution map of restrictive factors of land use efficiency coupling coordination relationship in Fujian Province in 2030.
Land 11 01498 g010
Table 1. Energy carbon emission coefficient and converted standard coal coefficient.
Energy NameAverage Low Calorific Value (kJ/kg)The Carbon Content Per Unit Calorific Value (tC/TJ)Carbon Oxidation RateCarbon Emission FactorStandard Coal
Coefficient (kgce/kg)
Raw Coal20,90826.370.940.51830.7143
Coke28,43529.50.930.78010.9714
Crude Oil41,81620.10.980.82371.4286
Gasoline43,07018.90.980.79781.4714
Diesel Oil42,65220.20.980.84431.4571
Fuel Oil41,81621.10.980.86471.4286
Liquefied Petroleum Gas50,17917.20.980.84581.7143
Oil Field Natural Gas38,93115.30.990.58971.33
Electric Power 0.9280.1229
Table 2. Fujian Province ecological service value equivalent factor table.
Cultivated LandWoodlandGrasslandWetlandWaterMan-Made SurfaceNaked Land
3.4423.0919.6952.02125.610.11−14.27
Table 3. Carbon emissions per unit area, economic benefit, and ecological benefit coefficient in each region of Fujian Province from 2000 to 2030.
Evaluation FunctionYearCultivated LandWoodlandGrasslandWetlandWaterMan-Made SurfaceNaked Land
Carbon Emission Factor
(t hm−2 a−1)
20000.4640−5.0520−0.9470−0.4100−0.2530250.5977−0.0050
20100.4640−5.0520−0.9470−0.4100−0.2530695.2271−0.0050
20200.4640−5.0520−0.9470−0.4100−0.2530713.2116−0.0050
20300.4640−5.0520−0.9470−0.4100−0.2530731.6190−0.0050
Economic Benefit Factor
(million CNY/hm2)
20001.67100.09942.25561.000016.7463106.12131.0000
20103.64290.23014.44151.000032.4517336.81591.0000
20207.39450.510110.55791.000065.3300668.72621.0000
203013.41120.971020.77111.0000117.90711196.83551.0000
Ecological Benefit Factor
(million CNY/hm2)
20000.30382.03901.73884.593811.0924−1.26020.0097
20100.93116.24995.329614.080433.9993−3.86250.0298
20201.20718.10256.909418.254344.0776−5.00740.0386
Table 4. Correction coefficient and calculation method of each main functional area.
Correction TargetUrban Construction AreaAgricultural Production AreaEcological Reserve AreaCalculation Method
Carbon Emission1.060.711.12The ratio of carbon emissions per unit area of the man-made surface in various functional areas to the average value of the whole province.
Economic Benefit1.110.590.88The ratio of the average secondary and tertiary output values of various functional areas over the years to the average value of the whole province is used to correct the economic output per unit area of the man-made surface.
1.500.690.67The ratio of the average agriculture, forestry, animal husbandry, or fishery output value in various functional areas over the years to the average value of the whole province is used to correct the economic output per unit area of cultivated land, woodland, grassland, and water.
Ecological Benefit0.991.030.96The ratio of grain crop yield per unit of various functional areas to the provincial average over the years.
Table 5. Evaluation function coefficients of each district after revision in 2030.
Evaluation FunctionFunctional AreaCultivated LandWoodlandGrasslandWetlandWaterMan-Made SurfaceNaked Land
Carbon Emission Factor
(t)
Urban construction area0.4640−5.0520−0.9470−0.4100−0.2530773.2273−0.0050
Agricultural production area0.4640−5.0520−0.9470−0.4100−0.2530516.4567−0.0050
Ecological reserve area0.4640−5.0520−0.9470−0.4100−0.2530817.3405−0.0050
Economic Benefit Factor
(million CNY)
Urban construction area20.07651.453631.09421.0000176.50601324.24861.0000
Agricultural production area9.20320.666414.25381.000080.9114702.78761.0000
Ecological reserve area8.99700.651413.93441.000079.09841049.75401.0000
Ecological Benefit Factor
(million CNY)
Urban construction area1.529010.26308.751823.121855.8311−6.34270.0489
Agricultural production area1.595810.71139.134024.131758.2696−6.61970.0510
Ecological reserve area1.48389.95938.492822.437554.1787−6.15500.0474
Table 6. Evaluation function setting.
YearExpression
2000Economic benefit: F 1 x = 1.671 × x 1 + 0.0994 × x 2 + 2.2556 × x 3 + x 4 + 16.7463 × x 5 + 106.1213 × x 6 + x 7
Carbon emission: F 2 x = 0.464 × x 1 5.052 × x 2 0.947 × x 3 0.41 × x 4 0.253 × x 5 + 250.5977 × x 6 0.005 × x 7
Ecological benefit: F 3 x = 0.3038 × x 1 + 2.039 × x 2 + 1.7388 × x 3 + 4.5938 × x 4 + 11.0924 × x 5 1.2602 × x 6 + 0.0097 × x 7
2010Economic benefit: F 1 x = 3.6429 × x 1 + 0.2301 × x 2 + 4.4415 × x 3 + x 4 + 32.4517 × x 5 + 336.8159 × x 6 + x 7
Carbon emission: F 2 x = 0.464 × x 1 5.052 × x 2 0.947 × x 3 0.41 × x 4 0.253 × x 5 + 695.2271 × x 6 0.005 × x 7
Ecological benefit: F 3 x = 0.9311 × x 1 + 6.2499 × x 2 + 5.3296 × x 3 + 14.0804 × x 4 + 33.9993 × x 5 3.8625 × x 6 + 0.0298 × x 7
2020Economic benefit: F 1 x = 7.3945 × x 1 + 0.5101 × x 2 + 10.5579 × x 3 + x 4 + 65.3300 × x 5 + 668.7262 × x 6 + x 7
Carbon emission: F 2 x = 0.464 × x 1 5.052 × x 2 0.947 × x 3 0.41 × x 4 0.253 × x 5 + 713.2116 × x 6 0.005 × x 7
Ecological benefit: F 3 x = 1.2071 × x 1 + 8.1025 × x 2 + 6.9094 × x 3 + 18.2543 × x 4 + 44.0776 × x 5 5.0074 × x 6 + 0.0386 × x 7
2030Urban Construction AreaEconomic benefit: F 1 x = 20.0765 × x 1 + 1.4536 × x 2 + 31.0942 × x 3 + x 4 + 176.506 × x 5 + 1324.2486 × x 6 + x 7
Carbon emission: Carbon   emission :   F 2 x = 0.464 × x 1 5.052 × x 2 0.947 × x 3 0.41 × x 4 0.253 × x 5 + 773.2273 × x 6 0.005 × x 7
Ecological benefit: F 3 x = 1.529 × x 1 + 10.263 × x 2 + 8.7518 × x 3 + 23.1218 × x 4 + 55.8311 × x 5 6.3427 × x 6 + 0.0489 × x 7
Agricultural Production AreaEconomic benefit: F 1 x = 9.2032 × x 1 + 0.6664 × x 2 + 14.2538 × x 3 + x 4 + 80.9114 × x 5 + 702.7876 × x 6 + x 7
Carbon emission: Carbon   emission :   F 2 x = 0.464 × x 1 5.052 × x 2 0.947 × x 3 0.41 × x 4 0.253 × x 5 + 516.4567 × x 6 0.005 × x 7
Ecological benefit: F 3 x = 1.5958 × x 1 + 10.7113 × x 2 + 9.1340 × x 3 + 24.1317 × x 4 + 58.2696 × x 5 6.6197 × x 6 + 0.051 × x 7
Ecological Reserve AreaEconomic benefit: F 1 x = 8.997 × x 1 + 0.6514 × x 2 + 13.9344 × x 3 + x 4 + 79.0984 × x 5 + 1049.754 × x 6 + x 7
Carbon emission: F 2 x = 0.464 × x 1 5.052 × x 2 0.947 × x 3 0.41 × x 4 0.253 × x 5 + 817.3405 × x 6 0.005 × x 7
Ecological benefit: F 3 x = 1.4838 × x 1 + 9.9593 × x 2 + 8.4928 × x 3 + 22.4375 × x 4 + 54.1787 × x 5 6.155 × x 6 + 0.0474 × x 7
Table 7. Criteria for the division of coordination grades and coordinated development degrees.
Interval[0,0.1)[0.1,0.2)[0.2,0.3)[0.3,0.4)[0.4,0.5)[0.5,0.6)[0.6,0.7)[0.7,0.8)[0.8,0.9)[0.9,1)
D Coordinated DevelopmentExtreme imbalanceSerious imbalanceModerate disordersMild disordersEndangered disordersReluctant coordinationPrimary coordinationIntermediate coordinationGood coordinationQuality coordination
ClassDysfunctional recessionTransitional developmentCoordinated development
Table 8. Comparison of economic benefits in different development scenarios.
Land-Use BenefitArea200020102020Development ScenariosScenarios Comparison
Natural ScenarioLow-Carbon ScenarioDifferenceDifference Ratio/%
Economic Benefit
(billion CNY)
Urban construction area3256.3511,505.2932,383.9982,025.1174,987.87−7037.24−8.58
Agricultural production area925.672577.958410.0912,190.6911,258.52−932.18−7.65
Ecological reserve area379.961145.253518.006997.446481.65−515.79−7.37
Difference = (low-carbon development target value)—(natural development target value); difference ratio = [(low-carbon development target value)—natural development target value)]/natural development target value.
Table 9. Comparison of ecological benefits in different development scenarios.
Land-Use BenefitArea200020102020Development ScenariosScenarios Comparison
Natural ScenarioLow-Carbon ScenarioDifferenceDifference Ratio/%
Economic Benefit
(billion CNY)
Urban construction area838.242556.473160.973827.333922.1694.832.48
Agricultural production area914.282792.233601.944737.614696.24−41.37−0.87
Ecological reserve area358.971097.781421.021744.751739.84−4.91−0.28
Difference = (low-carbon development target value)—(natural development target value); difference ratio = [(low-carbon development target value)—(natural development target value)]/natural development target value.
Table 10. Comparison of carbon emissions in different development scenarios.
Land-Use BenefitArea200020102020Development ScenariosScenarios Comparison
Natural ScenarioLow-Carbon ScenarioDifferenceDifference Ratio/%
Carbon Emissions (million tons)Urban construction area4864.0519,826.9630,608.1342,914.4738,660.11−4254.36−9.91
Agricultural production area−516.072021.595471.425612.224986.82−625.40−11.14
Ecological reserve area−196.90989.742296.984040.693655.35−385.34−9.54
Difference = (low-carbon development target value)—(natural development target value); difference ratio = [(low-carbon development target value)—(natural development target value)]/natural development target value.
Table 11. Classification of restrictive factors of land use efficiency coupling coordination relationship in Fujian Province.
TypeInfluencing FactorClassification BasisCounty (City, District) Covered by Main Functional Areas in 2030
Single FactorEconomic benefit lag type U 1 < U 1 ¯ , U 2 < U 2 ¯ , U 3 > U 3 ¯ Urban construction area: Sha County, Shaowu City, Yongding District, Jiaocheng District, Xiapu County, Fu‘an City;
Agricultural production area: Minqing County, Mingxi County, Qingliu County, Ninghua county, Youxi County, Jiangle County, Jianning County, Pinghe County, Shunchang County, Pucheng County, Guangze County, Zhenghe County, Liancheng County, Gutian County;
Ecological reserve area: Yongtai County, Datian County, Taining County, Dehua County, Wuyishan City.
Excess carbon emissions U 1 > U 1 ¯ , U 2 > U 2 ¯ , U 3 > U 3 ¯ Urban construction area: Minhou County, Fuqing City, Xianyou County, Yongan City, Zhangpu County, Jianyang District, Xinluo District, Haicang District, Shishi City, Gulou District, Siming District;
Agricultural production area: Changting County, Shanghang County, Zhangping City;
Ecological reserve area: Anxi County.
Ecological benefit lag type U 1 > U 1 ¯ , U 2 < U 2 ¯ , U 3 > U 3 ¯ Null
Compound FactorExcess type of economic lag carbon emissions U 1 < U 1 ¯ , U 2 > U 2 ¯ , U 3 > U 3 ¯ Null
Economic and ecological benefit lag type U 1 < U 1 ¯ , U 2 < U 2 ¯ , U 3 < U 3 ¯ Urban construction area: Taijiang District, Mawei District, Jin‘an District, Luoyuan County, Pingtan County, Huli District, Chengxiang District, Meilie District, Sanyuan District, Licheng District, Fengze District, Luojiang District, Xiangcheng District, Longwen District, Yunxiao County, Zhao‘an County, Dongshan County, Fuding City;
Agricultural production area: Changtai County, Songxi County;
Ecological reserve area: Hua ’ an County, Pingnan County, Shouning County, Zhouning County, Zherong County.
Ecological benefit lag type of excessive carbon emission U 1 > U 1 ¯ , U 2 > U 2 ¯ , U 3 < U 3 ¯ Urban construction area: Cangshan District, Lianjiang County, Changle City, Jimei District, Tongan District, Licheng District, Xiuyu District, Quangang District, Huian County, Jinjiang City, Nanan City, Longhai City;
Ecological reserve area: Yongchun County.
Full lag type U 1 < U 1 ¯ , U 2 < U 2 ¯ , U 3 < U 3 ¯ Urban construction area: Xiang ’ an District, Hanjiang District.
Balanced development U 1 > U 1 ¯ , U 2 < U 2 ¯ , U 3 > U 3 ¯ Urban construction area: Yanping District;
Agricultural production area: Nanjing County, Jianou City, Wuping County.
Publisher’s Note: MDPI stays neutral with regard to jurisdictional claims in published maps and institutional affiliations.

