Article

Mismatched Relationship between Urban Industrial Land Consumption and Growth of Manufacturing: Evidence from the Yangtze River Delta

1
Spatial Planning Center, Yangtze Delta Region Institute of Tsinghua University, Jiaxing 314006, China
2
School of Architecture, Southeast University, Nanjing 210096, China
3
College of Landscape and Architectural Engineering, Guangxi Agricultural Vocational University, Nanning 530007, China
4
Graduate Institute of Building and Planning, National Taiwan University, Taipei 10617, China
*
Author to whom correspondence should be addressed.
Land 2022, 11(9), 1390; https://doi.org/10.3390/land11091390
Submission received: 18 July 2022 / Revised: 18 August 2022 / Accepted: 19 August 2022 / Published: 24 August 2022

Abstract

:
Background: The precise allocation and efficient use of industrial land are necessary for the development and optimization of urban production space; however, the mismatches between urban industrial land consumption and the growth of manufacturing are becoming more serious and has become the primary obstacle to sustainable urban development. Methods: Based on a combination of the Boston Consulting Group matrix, spatial mismatch model, decoupling index, GIS, and Geodetector tools, this paper conducts an empirical study on the Yangtze River Delta region in an attempt to reveal the spatio-temporal evolution of the mismatch between urban industrial land changes and the growth of manufacturing and provide a basis for spatial planning and land management in the new era. Results: The distribution of urban industrial land is characterized by high heterogeneity and agglomeration, the coexistence of expansion and contraction, and increasingly complex and diversified changes. Gross domestic product, government revenue, the added value of tertiary industry, and government investment in science and technology indicate that the goal orientation and scale effect of economic growth play a decisive role in the allocation of urban industrial land and that the influence of industrial structures and technological innovation is rapidly increasing. The interaction between the different factors is a bifactor enhancement, for example, land used for logistics and storage, utilities, commercial and other services, and the import and export trade, which have a strong synergistic enhancement effect. The mismatches between urban industrial land changes and the growth of manufacturing are still within a reasonable degree but there is an increasing number of cities with negative mismatches, making it necessary to implement a differentiated spatial adjustment and management policy. Conclusions: Compared with the mismatches of mobile resources such as labor, finance, and capital, the mismatches of immovable land resources have an increasing impact with more serious consequences and it is harder to make optimizations and corrections. However, the academic community has limited knowledge about land resource mismatches. By quantitatively assessing the mismatches between industrial land consumption and the growth of manufacturing in YRD cities, this paper argues that the mismatches can be rectified through spatial and land use planning and suggests the establishment of a zoning management and governance system to achieve the optimal allocation of urban industrial land resources through the implementation of a “standard land + commitment system” and industrial land protection lines.

1. Introduction

Industrialization is at the core of modernization and countries around the world attach great importance to their development. Even developed countries such as the United States, the United Kingdom, France, Spain, Belgium, and Japan have changed their strategic objectives from deindustrialization to reindustrialization following the financial crisis to promote the return and revival of manufacturing development [1,2]. Urban industrial land acts as a significant resource to support the development of the manufacturing industry and its quantity, structure, distribution characteristics, and evolution pattern have received wide attention around the world. Industry plays a driving role in both services and emerging technologies, which are the main reasons for urban economic development, construction land expansion, and spatial sprawl [3]. The precise allocation and efficient use of industrial land are related to the development and optimization of urban production space and are important for ensuring the high-quality development of the industrial economy and the protection of cultivated land resources [4,5]. As urban industrial land is a scarce element and the physical foundation for the economic activities of manufacturing, its efficient and rational allocation is key to enhancing productivity and promoting economic development. However, due to many factors, such as national conditions, systems, and development stages, mismatches in the allocation of land resources are common and have become a major challenge for governments in the process of achieving sustainable development. Therefore, it is of important significance to analyze the mismatches between urban industrial land changes and the growth of manufacturing to reveal their spatio-temporal evolution patterns, not only to provide a basis for the government to develop land use and spatial planning, manufacturing, and economic development policies but also to achieve the coordinated development of urban industrial land and manufacturing.
Since the reform and opening-up to the West, China has transformed itself from a rural agricultural country into an industrial nation, and is gradually becoming known as the “factory of the world”. China has huge areas of urban industrial land. According to data from the 2020 China Statistical Yearbook and China Urban Construction Statistical Yearbook, China’s industrial added value exceeded USD 4.5 trillion (CNY 31,307.11 billion, with an average exchange rate of 6.8974) and the total urban industrial land area was close to 12,000 km2. At the same time, industrial land in Chinese cities accounted for about 19% of the total urban construction land area, which is much higher than in other countries (15%). In addition, the floor area ratio of industrial land projects in China was only 0.3~0.6 compared to 1.0 in developed countries. It should be noted that although the expansion of industrial land has created a booming manufacturing economy, the spread and mismatch of industrial land has brought about increasingly serious negative effects including a reduction in cultivated land and ecological land, which threatens food security and ecological health, and low land use efficiency. The Chinese government regards the manufacturing industry as the foundation of the country, the source of the country’s prosperity, and the basis for building a strong country and attaches great importance to the management of urban industrial land and the economic development of manufacturing. The central government has been vigorously implementing strategies for a strong manufacturing industry in recent years and has asked local governments to promote the synergistic development of new industrialization and urbanization projects and proposed new requirements for the design of industrial land use and conservation policies for Chinese cities. At a time when China’s economy has shifted from high-speed growth to high-quality development, it is urgent to improve the overall resource allocation efficiency, and it is of great value to analyze the degree of the mismatches between economic development and industrial land resources and study the response strategies.
The Yangtze River Delta (YRD) is the most developed and active growth area in China with a strong industrial base and is currently in a stage of transition from industrialization to post-industrialization. The change in urban industrial land in the YRD is typical in China and the rest of the world. In 2020, the value added of industry in the YRD was nearly USD 1.2 trillion, accounting for 26.12% of the country’s total, and the area of urban industrial land was 2618.21 km2, accounting for 23.32%. During the same period, the area of urban industrial land accounted for 22.54% of urban construction land, which was more than the national average. The industrial development of the Yangtze River Delta is not only constrained by the increasing pressure on resources and the environment but also faces competition from the return of manufacturing industries in Europe and the United States and is up against the dual challenges of enhancing the competitiveness and rootedness of manufacturing industries. The YRD urgently needs to further strengthen the management of industrial land consumption in this new era, lead and create new demands with high-quality supplies, and improve the adaptability of land use and spatial planning to the needs of industrial economic development. Therefore, there is an urgent need to analyze the changes, spatial patterns, and performance characteristics of industrial land in YRD cities to reveal the evolution of land requirements. This could reduce losses in manufacturing caused by mismatches in the allocation of industrial land resources and provide a basis for management policies and spatial planning, which is of great significance for enhancing the competitiveness of the YRD and leading the high-quality development of China’s industrial economy [6].
Based on GIS tools as well as the Boston matrix, spatial mismatch index, and decoupling model, this paper conducts an empirical study of the YRD in China with a focus on the following objectives: (1) to find the regular characteristics of the spatial patterns and changes in industrial land in YRD cities using spatial econometric analysis methods and the Boston matrix; (2) to analyze the factors that have a strong direct influence on the allocation of urban industrial land using the Geodetector tool and further measure the interaction effects between the different factors and the type of interaction relationships; (3) to quantitatively measure the degree of the mismatches between industrial land changes and economic growth in YRD cities, and identify the type of relationship between them based on the spatial mismatch index and decoupling model; and (4) identify the strategies that governments and regulators should use in scientific planning and policy making. The rest of this paper includes a literature review, study design, analysis of results, discussion, and conclusion. First, by reviewing and analyzing the papers available, we attempt to find their shortcomings and this forms the starting point of this study. Second, the research methods and steps are presented to explain the process of variable selection and its data sources. Third, the spatio-temporal characteristics of the evolution of industrial land use in the YRD and the spatial mismatch/decoupling relationship between industrial land use changes and economic growth are analyzed in detail, and the core views are compared with the related literature to find out their differences and possible reasons. Fourth, this paper proposes management methods for the high-quality utilization and protection of urban industrial land; attempts to analyze the innovations, internationality, and limitations of the research in this paper; and proposes future research directions.

2. Literature Review

2.1. Rationality of Urban Industrial Land Consumption

The relationship between urban industrial land changes and economic growth, spatial expansion, and sprawl has long been a hot academic topic. In terms of research areas, the available papers have focused on the contribution of urban industrial land expansion to economic growth, industrial economic growth as an influence on urban land expansion, the long- and short-term effects of the interaction between urban industrial land expansion and economic growth, fairness and consensuality on the urban industrial land scale, and the evaluation and comparison of the efficiency of urban industrial land. In terms of research methods, abundant technical methods were found in the available papers, including analysis and simulation methods for urban industrial land changes, impact factor measurement methods, utilization efficiency evaluation methods, and policy performance assessment methods. For example, Park [7] analyzed the impact of industrial land expansion on land productivity in Korea using a panel regression model and a sprawl index. Ustaoglu [8] found lag effects between the consumption of urban industrial land use and regional economic development, with GDP, employed population, and real estate prices being the most significant influencing factors. Lin [9] and Zhao [10] found that the land pricing mechanism was an important way to control the expansion of urban industrial land. Yang [11] further pointed out that implementing local industrial land price policies could improve the efficiency of industrial land use. Chen [12,13] suggested that the government should guide the optimization of manufacturing spatial layouts through the reasonable control of land prices. Zheng [14] found that the implementation of urban industrial land policies had contributed prominently to economic development, with both the industrial land system and control system playing a strong positive role. Silva [15] and Ustaoglu [16] constructed models to predict the area of industrial land based on the level of economic development of the city. Aghmashhadi [17] analyzed the conflict resolution in an industrial land development policy in Markazi province, Iran, using the game theory and graph model. Hu [18] analyzed the effect of industrial land prices and environmental regulations on the spatio-temporal variations in pollution-intensive industries (PIEs) between regions in China using a geographically weighted regression model. Aragones-Beltran [19] applied the analytic network process method to the asset valuation process of urban industrial land and selected the industrial park of Valencia, Spain, for an empirical test.
In summary, the papers available on the relationship between urban industrial land changes and economic growth covered both quantitative and structural dimensions with increasingly diversified and complex research methods, mathematization and empirical evidence becoming mainstream research trends, and increasing technical complexity. However, it should be noted that there were still some shortcomings in the existing studies. First, most of the papers focused on process studies with little attention paid to the analysis of spatial dimensions. Industrial development was geographically clustered and the spatial correlation effects should not be ignored, otherwise, the accuracy of the conclusions could be affected. Therefore, there is an urgent need to develop new methods that can perform dynamic analyses of the spatio-temporal evolution of urban industrial land. Second, multidisciplinary and multi-method cross-research has become a trend; however, the analysis results of different papers varied greatly, the comparison and integration of conclusions became increasingly difficult, and the disconnect between academic research and practical work became more apparent. The increasing technical complexities and difficulties of the research methodologies have resulted in lay people, especially government land administration officials, often having difficulty reading academic papers and using the specialized software or tools developed during the research process, further affecting the level of application of the research methods and their results in practical applications.

2.2. Land Resources Spatial Mismatches and Analysis of Their Influencing Factors

Spatial mismatch was originally introduced to study the spatial allocation of labor [20] and to analyze the paradoxical relationship between residential suburbanization and the concentration of employment opportunities in urban centers [21,22]. In terms of research objects, land types include agricultural land, industrial land, recreational and service land, and residential and ecological land, and land is considered a holistic resource element in most of the current papers. For example, Yue [23] pointed out that in the process of urban morphological polycentricity, there is often a spatial mismatch between the functional and morphological centers, and the development of functional polycentricity generally lags behind that of morphological advancement. Most scholars focus more on mismatches related to agricultural [24,25], educational [26], and ecological [27,28] land and less on mismatches related to industrial land. In terms of the mismatch effect, most papers have mentioned the adverse consequences of land resource mismatches and their influencing factors, but there is no in-depth analysis of the solutions and coping strategies. Le [29] estimated that the elimination of spatial mismatches related to agricultural land could contribute to a per capita GDP growth of about 8% in Vietnam. He [30] believed that urban land resource mismatches hinder the efficiency of inclusive green growth in cities. Li [31] found that China’s industrial development is characterized by “high mismatch-high growth”, and Zhao found that spatial mismatches related to urban industrial land allocation are spatially clustered and that the spatial pattern is highly variable [32]. Deng [33] concluded that land resource mismatches contribute more than 10% to the green total factor productivity loss of Chinese urban industries not only as a key factor after capital and energy but also with high spatial agglomeration. Li [34,35] argued that there is a temporal hysteresis and persistence in the impact of industrial land mismatches on regional green development and that the imbalance in the scale of the industrial land supply inhibits green technological innovation and hinders the upgrade of industrial structures, thus hampering regional sustainable development. An empirical study by Liu [36] using a spatial Durbin model and urban panel data showed that land resource mismatches constrain the upgrading of urban industrial structures and have a significant inhibitory effect on the air quality of the local and surrounding cities. Du [37] found that land resource mismatches increase firms’ pollutant emissions. Ma [38] and Li [39] pointed out that land resource mismatches amplify carbon emissions. Chari [40] analyzed the impact of land mismatches on agricultural land output effectiveness and productivity. Zhang [41] and Gao [42] concluded that land resource mismatches show a hindering effect and threshold effect on technological innovation and entrepreneurial activity. Qu [43] analyzed the changes in the spatial mismatches of capital and labor in China from 2003 to 2017 and stated that land finance exacerbates the spatial mismatches of land resources. Huang [44] analyzed the mechanisms of government intervention in land mismatches between industrial and service industries and argued that local government revenue and political incentives contribute to land resource mismatches and that political cycles further enhance the impact of land price distortions on land resource mismatches.
To sum up, the use of the spatial mismatch method to analyze the relationship between land use changes and economic growth, identify the key areas causing the mismatches and reveal the mechanisms behind them, and propose solutions has become a popular research topic that is receiving more attention from scholars. However, there are also shortcomings in the existing studies mainly in three areas. First, most of the studies focus on static analyses without the involvement of dynamic characteristics research. The papers available mainly focus on mismatch analyses of cross-sectional data from a certain year or conduct comparative mismatch analyses using cross-sectional data from two or more years, which is still static in nature. Second, most papers focus on spatial mismatch analyses between land resources and agricultural land, paying little attention to industrial land. Different land types are used in different ways and their degree of mismatch varies. Industrial and service land is the most important component of urban construction land, but academic research is still scarce and there is a gap between theoretical research and practical needs. Third, most of the papers focus on the analysis of mismatches and evaluations of their degrees, with insufficient research on the solutions and spatial correction strategies, thus making it difficult to apply the research results to land use and spatial planning, and industrial development policies.

3. Materials and Methods
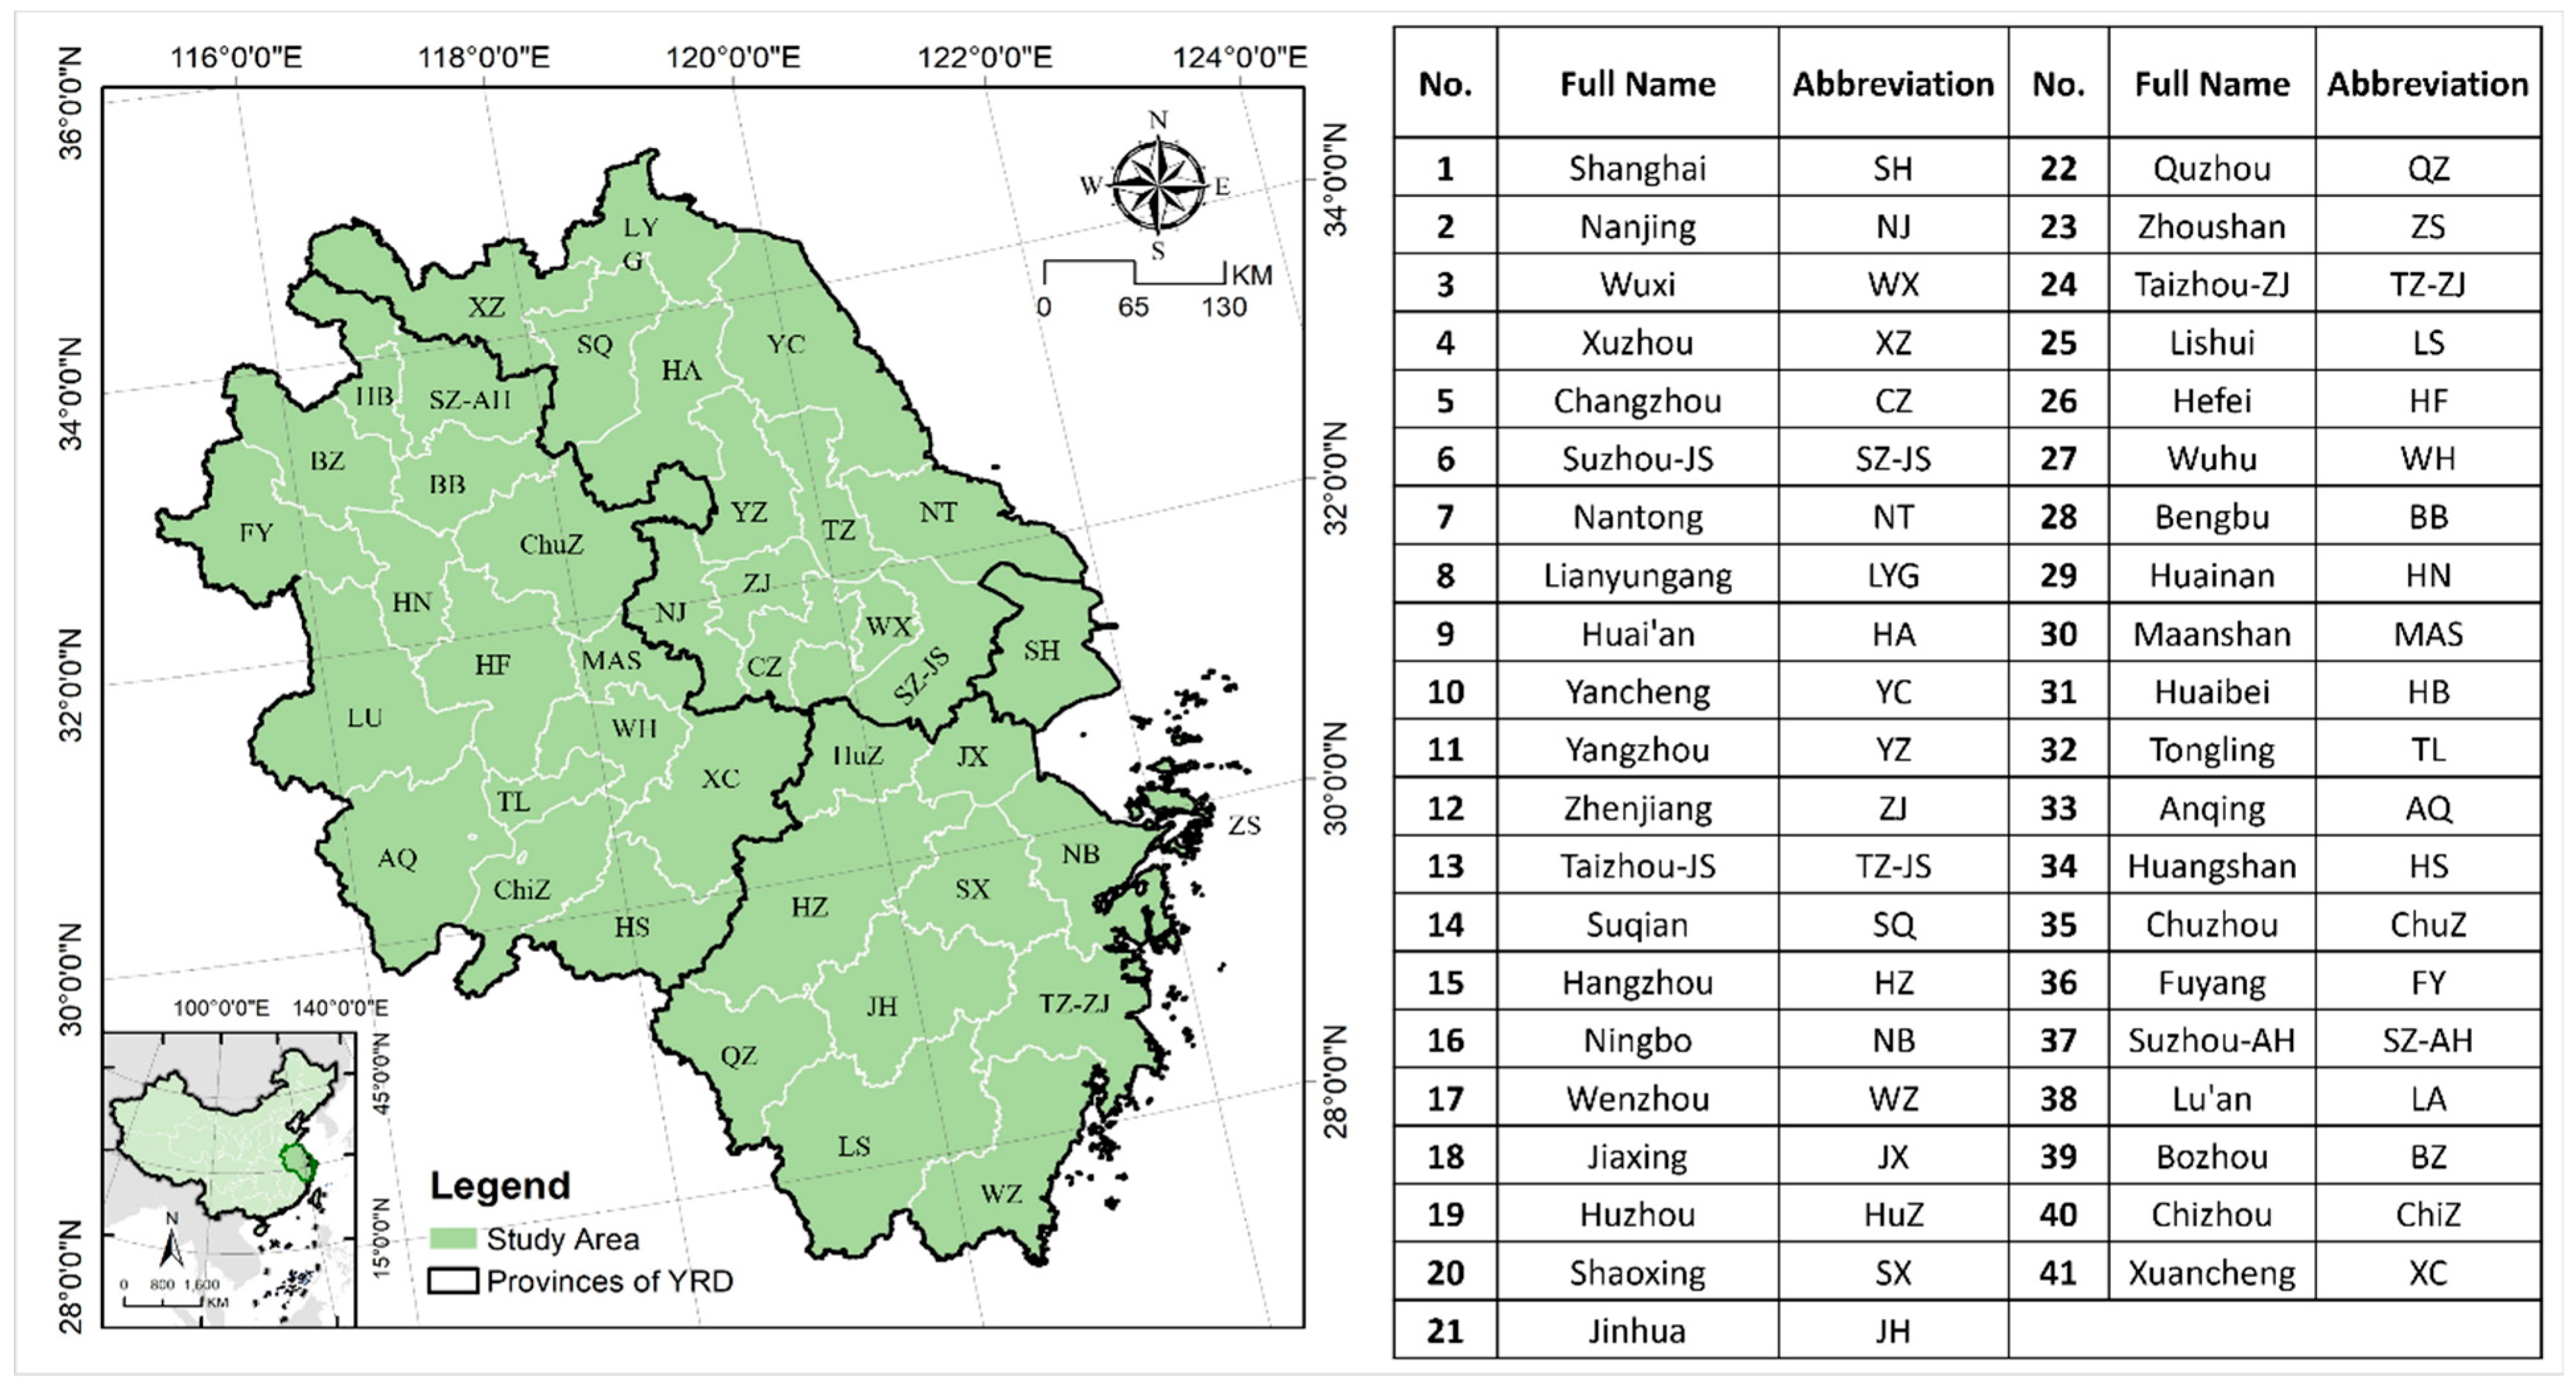
3.1. Study Area

The Yangtze River Delta region is an alluvial plain formed before the Yangtze River entered the sea and located in the lower reaches of the Yangtze River in China, bordering the Yellow Sea and the East China Sea at the confluence of rivers and seas, with many coastal ports along the river. The Chinese government has not defined the geographical scope of the Yangtze River Delta in the same way at the different stages of development. The biggest change was found in the cities of Anhui, which was first invited to attend the Yangtze River Delta Key Leaders Symposium in 2008 but failed to become a real member of the Yangtze River Delta. Hefei and Maanshan attended the 2010 plenary meeting of the Yangtze River Delta Urban Economic Coordination Committee as regular members. In 2013, Wuhu, Chuzhou, and Huainan attended the plenary meeting, but Anhui’s application to be integrated into the Yangtze River Delta was not officially approved by the state at the time. In 2014, the central government issued the Guidance on Promoting the Development of Yangtze River Economic Belt by Relying on the Golden Waterway, which clarified at the national level that Anhui is an important part of the Yangtze River Delta. The central government released the City Cluster Development Plan in the Yangtze River Delta Region in 2016, bringing Hefei, Wuhu, Maanshan, Tongling, Anqing, Chuzhou, Chizhou, and Xuancheng in Anhui into the plan. In 2019, the central government published the Outline for the Regional Integrated Development of the Yangtze River Delta, which covered all cities in Shanghai, Jiangsu, Zhejiang, and Anhui. This paper studies the regional scope of the official plan for 2019, including 41 cities such as Shanghai, Nanjing, Hangzhou, and Hefei (Figure 1). In this paper, Taizhou in Zhejiang province is abbreviated as Taizhou-ZJ, Taizhou in Jiangsu province is Taizhou-JS, Suzhou in Jiangsu province is Suzhou-JS, and Suzhou in Anhui province is Suzhou-AH to avoid confusion.
YRD is now facing increasingly serious problems with land resources and the ecological environment after a long period of high-intensity development. In particular, urban industrial land resources act as the core engine and physical foundation of urban economic growth so the protection and utilization of urban industrial land are of great importance in the context of high-quality development. Following the “manufacturing giant” construction strategy of the state and enhancing the efficiency and protection of industrial land use to support and guarantee the development of the economy are the targets of the preparation and implementation of territorial spatial planning and industrial planning in the new era. Therefore, analyzing industrial land consumption in YRD cities and revealing the interactions between them and economic and social growth can not only provide a basis for decision making in formulating urban industrial land planning and management policies but also help improve the quality of urban manufacturing economic development and effectively protect land natural resources.

3.2. Variable Selection and Data Source Description

The study period in this paper is 2010–2019. The indicators of the mismatch analysis include urban industrial land, added value [45], employed population [46], total assets [47], and gross profit [48,49]. The urban industrial land in this paper uses the Codes for Classification of Urban Land Use and Planning Standards of Development Land (GB50137-2011). Industrial land specifically refers to land that manufacturing enterprises take up for business, including the land for production workshops, warehouses, and their ancillary facilities (such as special railroads, docks, ancillary roads, and parking lots). In China, industrial land is divided into three classes by the degree of pollution, disturbance, and security threats to the environment, with Class I industrial land having the least impact and Class III having the greatest impact. The understanding of the manufacturing industry is consistent with the Industrial Classification for National Economic Activities (GB/T 4754-2017) and covers the processing and manufacturing of agricultural products and food, liquor and beverages, textiles, tobacco, paper, oil and energy, chemicals, medicine, plastics, metallurgy, apparatuses and equipment, computers, electrical appliances, and automobiles.
The added value and employed population represent the economic and social benefits created by urban industrial land, respectively, whereas the total assets and gross profit reflect the impact of the changes in and consumption of urban industrial land on the business performance of manufacturing enterprises (Table 1).
Affected by the fiscal decentralization system and the orientation of economic growth, the allocation of urban industrial land must not only meet employment needs but also create high economic output and government revenue and population, GDP, and government revenue are commonly used indicators to measure them [50]. Industrialization is the core driving force of urbanization, and industrial land is the physical foundation of industrialization [51]. This paper uses the per capita GDP and urbanization rates to characterize the impact of industrialization and urbanization on industrial land allocation. The effective use of industrial land requires better supporting facilities so this paper selects the land used for utilities, road length, land used for logistics and storage, land used for commercial and other services, and the added value of tertiary industry to characterize them [52,53]. As the core area of the “world factory”, the impact of the import and export trade and foreign direct investment on the development of manufacturing and industrial land in the Yangtze River Delta cannot be ignored [54]. Finally, the intensity of industrial land use is limited by science and technology so this paper chooses the authorized patent, higher education institutions, and government investment in science and technology to characterize them [55].
The data of X 1 ~ X 5 , X 10 ~ X 15 , and Z 1 ~ Z 5 are mainly collected from official information released by the Chinese government including the China City Statistical Yearbook and Province and City Statistical Yearbooks. The data of X 6 ~ X 9 and Y collected from China Urban Construction Statistical Yearbook. It should be noted that in order to eliminate the impact of the adjustment of administrative divisions during the study period, the data of other years are backdated or corrected in this paper based on the administrative division map of 2019. Given that Chaohu City in Anhui was split up in 2011, this paper processes the data based on the adjusted administrative divisions in the ratio of 2/5 for Hefei, 2/5 for Maanshan, and 1/5 for Wuhu.

3.3. Research Methods

3.3.1. Boston Consulting Group Matrix (BCGM)

The Boston matrix is one of the most common business management analysis tools. Based on the development and growth of companies, they are classified into four types: star, cow, question, and dog, and the corresponding implementation of investment, maintenance, harvest, and abandonment strategies helps to enhance the sustainability of the company [56]. Using the Boston matrix to analyze the industrial land in YRD cities, this paper can accurately analyze its spatio-temporal evolution (because it can simultaneously analyze the changing trends and geographical distribution patterns of industrial land). According to Equations (1) and (2), the competitive state of each city is calculated using the average value of C S and R S as the threshold to reveal the spatio-temporal evolution trends in urban industrial land use, and the 41 cities of the YRD are grouped into 4 categories (Figure 2) [57].
With R S and G R representing the relative share and growth rate, respectively, to reflect the relative position and degree of change in urban industrial land in a city in the region; Y i representing the urban industrial land area of city i ; Y i m a x representing the maximum urban industrial land area among the 41 cities; Y i b a s e and Y i e n d representing the urban industrial land area of city i in the beginning and end periods, respectively; and t and n representing the time of the study and number of cities, R S and G R are calculated as follows:
R S = Y i Y i m a x × 100 %
G R = ( Y i e n d Y i b a s e t 1 ) × 100 %

3.3.2. Spatial Mismatch Model

The spatial mismatch theory was proposed by Kain in 1968 as a hypothesis reflecting the mismatches between residential and employment spaces of disadvantaged groups in the context of rapid spatial reconfiguration in the inner city [58]. With the enrichment of the connotation of the theory, the spatial mismatch model is widely used in geography, sociology, and tourism to describe and evaluate imperfect matches in the spatial distribution of elements with interrelated relationships within or between cities. With the help of a spatial mismatch model to analyze the mismatch between urban industrial land allocation and manufacturing development, this paper can quantitatively measure the degree and type of the spatial mismatches between the two. Notably, this method is used to calculate the spatial mismatches or synchronization characteristics of the absolute values of urban industrial land area and manufacturing, meaning it is still essentially a static study.
S M I i = Y i Z i i = 1 n Z i i = 1 n Y i 2 i = 1 n Z i × 100 %
S M I = i = 1 n | Y i Z i i = 1 n Z i i = 1 n Y i | 2 i = 1 n Z i
M C R i = | Y i Z i i = 1 n Z i i = 1 n Y i 2 i = 1 n Z i | S M I × 100 %
where S M I i and S M I represent the spatial mismatch indexes of city i and the YRD; Z i represents the development level of the manufacturing economy of city i including the added value, employed population, total assets, and gross profit; M C R i represents the mismatch index contribution rate, and the other parameters are as mentioned above. A larger spatial mismatch index indicates a worse spatial mismatch between urban industrial land and manufacturing.
What should be noted is that there is a temporal hysteresis in the industrial land input to manufacturing output, and spatial mismatches in regional development are also difficult to completely avoid. Therefore, spatial mismatches have a limited and tolerable impact on the high-quality development of urban manufacturing, provided that they are kept within a certain range; however, if the spatial mismatches go beyond the maximum level that the region can bear, they will become an obstacle in the development of urban manufacturing and will have a greater negative effect on sustainable development. In this paper, cities with a positive spatial mismatch index are defined as positive mismatching, whereas those with a negative spatial mismatch index are defined as negative mismatching. The mean values of positive and negative S M I i are calculated, respectively, and are used as the thresholds for classifying the YRD into four types of zonings: negative inefficiency, negative matching, positive matching, and positive efficiency. Negative and positive matching indicates that the level of the spatial mismatch is still within a reasonable range and still has a small impact on the development of urban manufacturing. Negative inefficiency shows that the consumption of industrial land for the development of urban manufacturing is much higher than the national average, with extensive and even wasteful land use, meaning it is in the worst possible state. On the contrary, positive efficiency indicates that the land consumption is much lower than the national average, with intensive and efficient land use, meaning it is already in an optimal state.

3.3.3. Decoupling Index

The elastic decoupling model proposed by Tapio [59] is widely used in ecological, economics, environmental, transportation, and geographical studies. The decoupling model has been used to analyze the relationship between land use changes and economic growth in recent years but this has mainly focused on land used for urban construction, services, and agriculture, with less attention paid to urban industrial land [60]. With D I representing the decoupling index; G R representing the growth rate of urban industrial land; E R representing the growth rate of the industrial economy including the added value, employed population, total assets, and gross profit; and Z i b a s e and Z i e n d representing the development level of manufacturing in city i at the beginning and end of the period, respectively, D I and G R are calculated as
D I = G R E R
E R = ( Z i e n d Z i b a s e t 1 ) × 100 %
This paper uses a decoupling model to analyze the relationship between urban industrial land changes and manufacturing growth in the YRD to reveal the degree of the dynamic mismatch between the two. The decoupling is classified into 3 types and 8 sub-types based on whether G R and E R are positive or negative, with 0.8 and 1.2 as the thresholds for D I (Figure 3) [61,62]. Coupling stands for synchronous development, whereas decoupling and negative decoupling stand for asynchronous development, where the former represents efficient positive mismatching and the latter represents inefficient negative mismatching. SD represents a reduction in urban industrial land while manufacturing is growing, achieving reduced and efficient intensive use. On the contrary, SND represents expanding industrial land but shrinking manufacturing, indicating that land inputs are not creating the corresponding economic output and are in an inefficient negative mismatch. WD, RC, and END indicate that both urban industrial land and manufacturing are experiencing positive growth but that land use intensification is decreasing, and the relationship between them is gradually changing from positive mismatching to positive synchronization and negative mismatching. WND, EC, and RD indicate that urban industrial land and manufacturing are in a state of negative growth but that the land use intensity is increasing, and the two gradually shift from negative mismatching to negative synchronization and positive mismatching. It should be noted that EC and RD have not achieved sustainable development although they are in negative synchronization and positive mismatching with high land use efficiency.

3.3.4. Spatial Autocorrelation and Geodetector
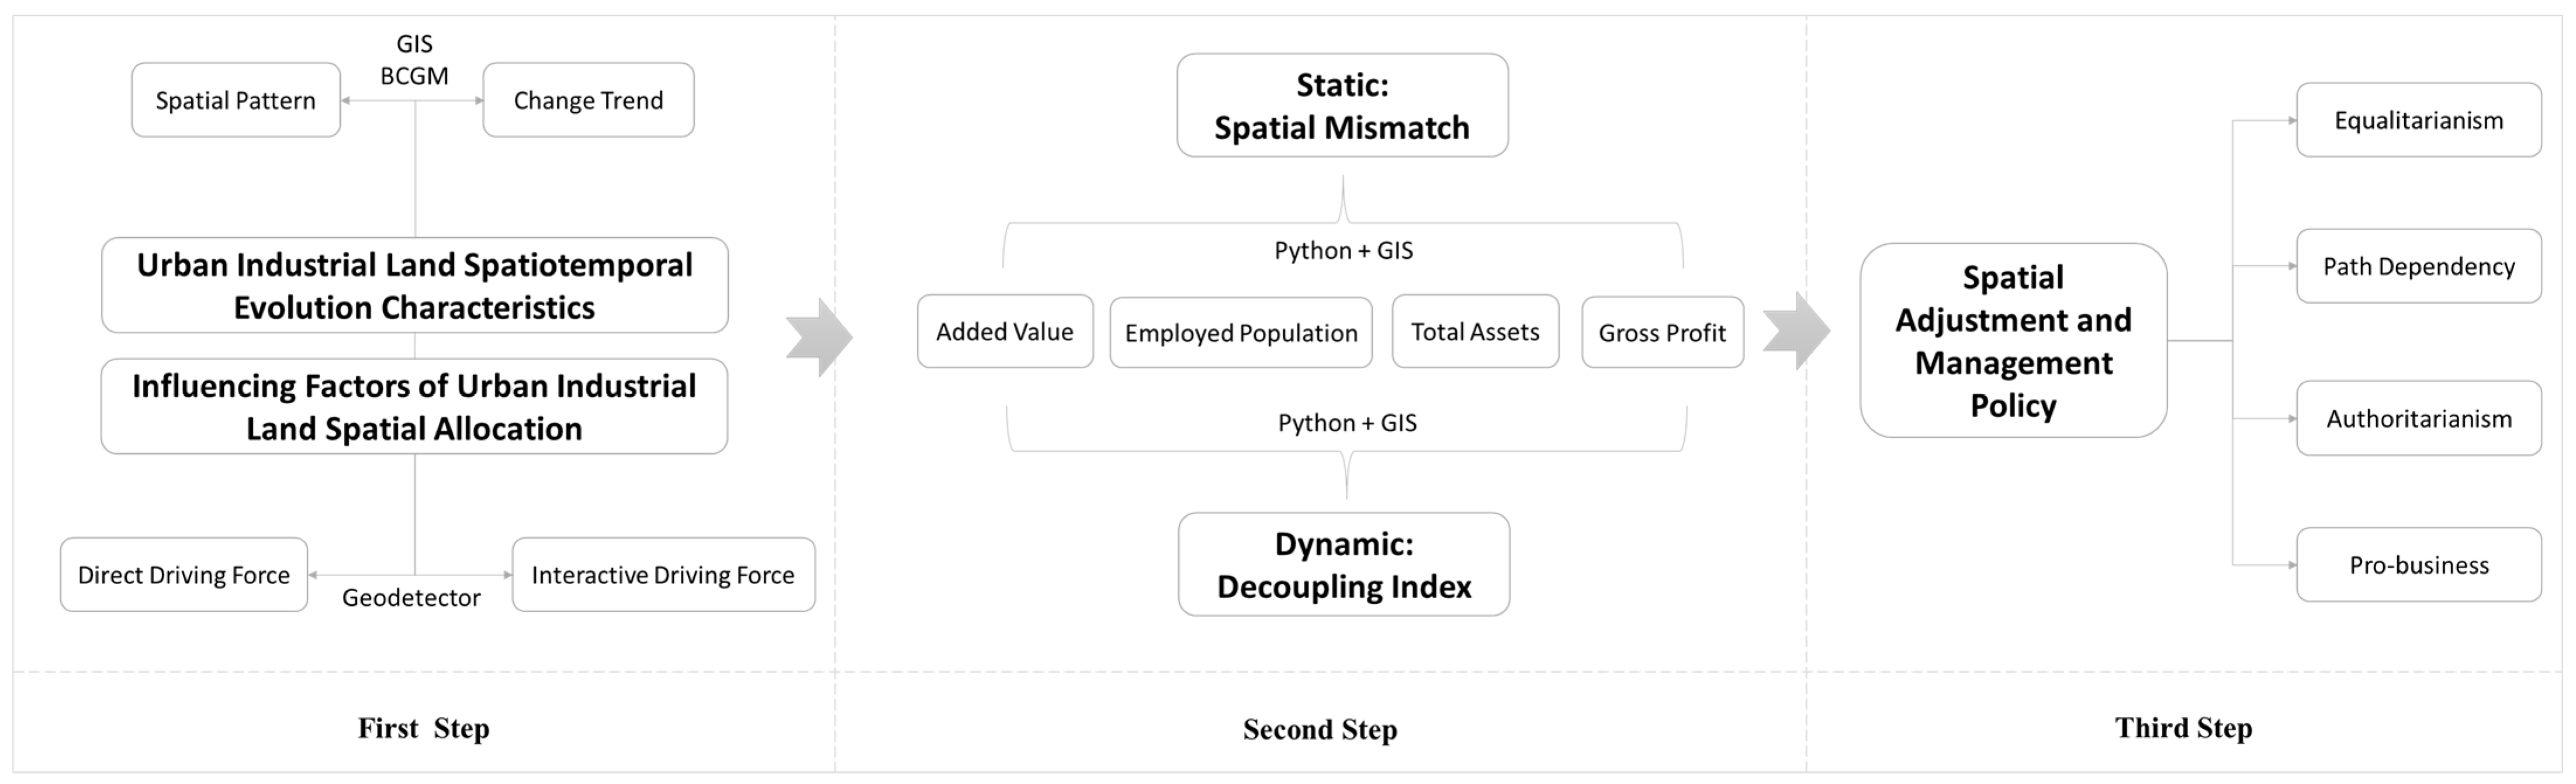
When the geographical distribution of the research objects has spatial heterogeneity, correlation, and agglomeration, the research on the driving mechanism needs to use the spatial econometric analysis method instead of the traditional regression model. This paper uses the coefficient of variation, Gini index, and Moran’s I index to test whether there is spatial heterogeneity and autocorrelation in the distribution of urban industrial land, and uses Geodetector to quantitatively measure the influence of different factors on the spatial patterns of urban industrial land, as well as the interactions between the factors. The Gini coefficient is a ratio value ranging between 0 and 1. A larger value indicates a larger difference and vice versa. Miyamoto [63], Ruan [64], Zhao [65], She [66], Li [67,68], and other scholars have suggested that a coefficient of variation greater than 0.36 indicates a huge spatial difference. In addition, consistent with studies by the United Nations Development Programme and the research proposal of Li [69], a Gini coefficient greater than 0.4 in this paper indicates a large gap and is used to characterize spatial inequality in urban industrial land; a Gini coefficient greater than 0.6 indicates a huge gap and is used to characterize serious spatial inequality in urban industrial land. When the global Moran’s I is greater than zero, it represents positive spatial correlation; if it is less than zero, it represents negative spatial correlation; and if it is equal to zero, it represents random distribution. A local Moran’s I subdivide the spatial correlation patterns into four types, specifically, HH and LL for a positive spatial correlation, and HL and LH for a negative spatial correlation [70,71]. Wang Jinfeng of the Chinese Academy of Sciences created the Geodetector, which is seen as an emerging statistical analysis method that is mainly used to study the mechanisms of spatial effects [72,73]. If the spatial patterns of the independent and dependent variables are similar or even the same, the Geodetector will determine that the independent variable has an important influence on the geographic distribution of the dependent variable. The factor detection function of the Geodetector measures the similarity of the spatial pattern of the independent variable and dependent variable by calculating the value of the q index and characterizes the direct influence of the factor on industrial land. The value of q in a range of [0, 1] is used to represent the strength of influence and a larger value implies a greater influence. With h representing the number of strata or classifications of the independent variables, N h and N representing the number of cities in stratum h and the study area, σ h 2 and σ 2 representing the variance of the dependent variable in stratum h and the study area, respectively, SSW representing the within sum of squares, and SST representing the total sum of squares in the study area, the calculation equation for q is
Global   Moran s   I = n S 0 × i = 1 n j = 1 n W i j ( Y i Y ¯ ) ( Y j Y ¯ ) i = 1 n ( Y i Y ¯ ) 2 ,   S 0 = i = 1 n j = 1 n = W i j
Local   Moran s   I i = K i i = 1 n W i j K j
q = 1 h = 1 l N h σ h 2 N σ 2 = 1 S S W S S T ,   S S W = h = 1 l N h σ h 2 ,   S S T = N σ 2
Notably, through the interactive detection function, Geodetector can further measure the interactive influence of the two factors when they act on urban industrial land together. q ( X i ) and q ( X j ) represent the direct influence of i and j under independent conditions, q ( X i X j ) represents the interactive influence, and Max (q ( X i )), q ( X j )), Min (q ( X i ), q ( X j )), q ( X i ) + q ( X j ) represents the maximum, minimum, and sum of the direct influence. According to the relationship between the above parameters, the factor interactions are divided into five categories. When q ( X i X j ) < Min (q ( X i ), q ( X j )), it shows that the i and j factors have a mutual inhibitory effect and are in an antagonistic state, which is defined as nonlinear weak. When Min (q ( X i ), q ( X j )) < q ( X i X j ) < Max (q ( X i )), q ( X j )), it means that the interactive influence is between the maximum and minimum of the direct influence, which is defined as single nonlinear weak. When Min q ( X i ) + q ( X j ) > q ( X i X j ) > Max (q ( X i ), q ( X j )), it means that the interactive influence is greater than the maximum value of the direct influence in the independent case but less than the sum of the two, which is defined as a bifactor enhancement. When q ( X i X j ) = q ( X i ) + q ( X j ), it means that the influence of the two factors is independent, which is defined as independent. When q ( X i X j ) > q ( X i ) + q ( X j ), it shows that the I and j factors have a synergistic enhancement effect, which is defined as a nonlinear enhancement [74].

3.4. Research Steps

The first step is to analyze the evolution characteristics of urban industrial land. Firstly, GIS tools are employed to analyze the spatial patterns of industrial land in YRD cities. Secondly, the BCG matrix is used to analyze the trends in the spatio-temporal evolution of the land. Thirdly, Geodetector is used to analyze the influencing factors and their interactive effects on the allocation of urban industrial land in the YRD. The second step is based on the spatial mismatch model and decoupling index to analyze the degree of the mismatch between urban industrial land changes and the growth of manufacturing in four dimensions: added value, employed population, total assets, and gross profit, and includes static and dynamic studies. Notably, different weight combination schemes can be adopted depending on the differences in the values and goal orientations in the process of the overlay analysis of the different indicators. The third step is to develop spatial administration and management policies. Based on the results of the dynamic mismatch analysis, the solution and correction strategies for the spatial mismatches are proposed in combination with the values and goal orientations (Figure 4).

4. Results

4.1. Urban Industrial Land Spatio-Temporal Evolution Characteristics

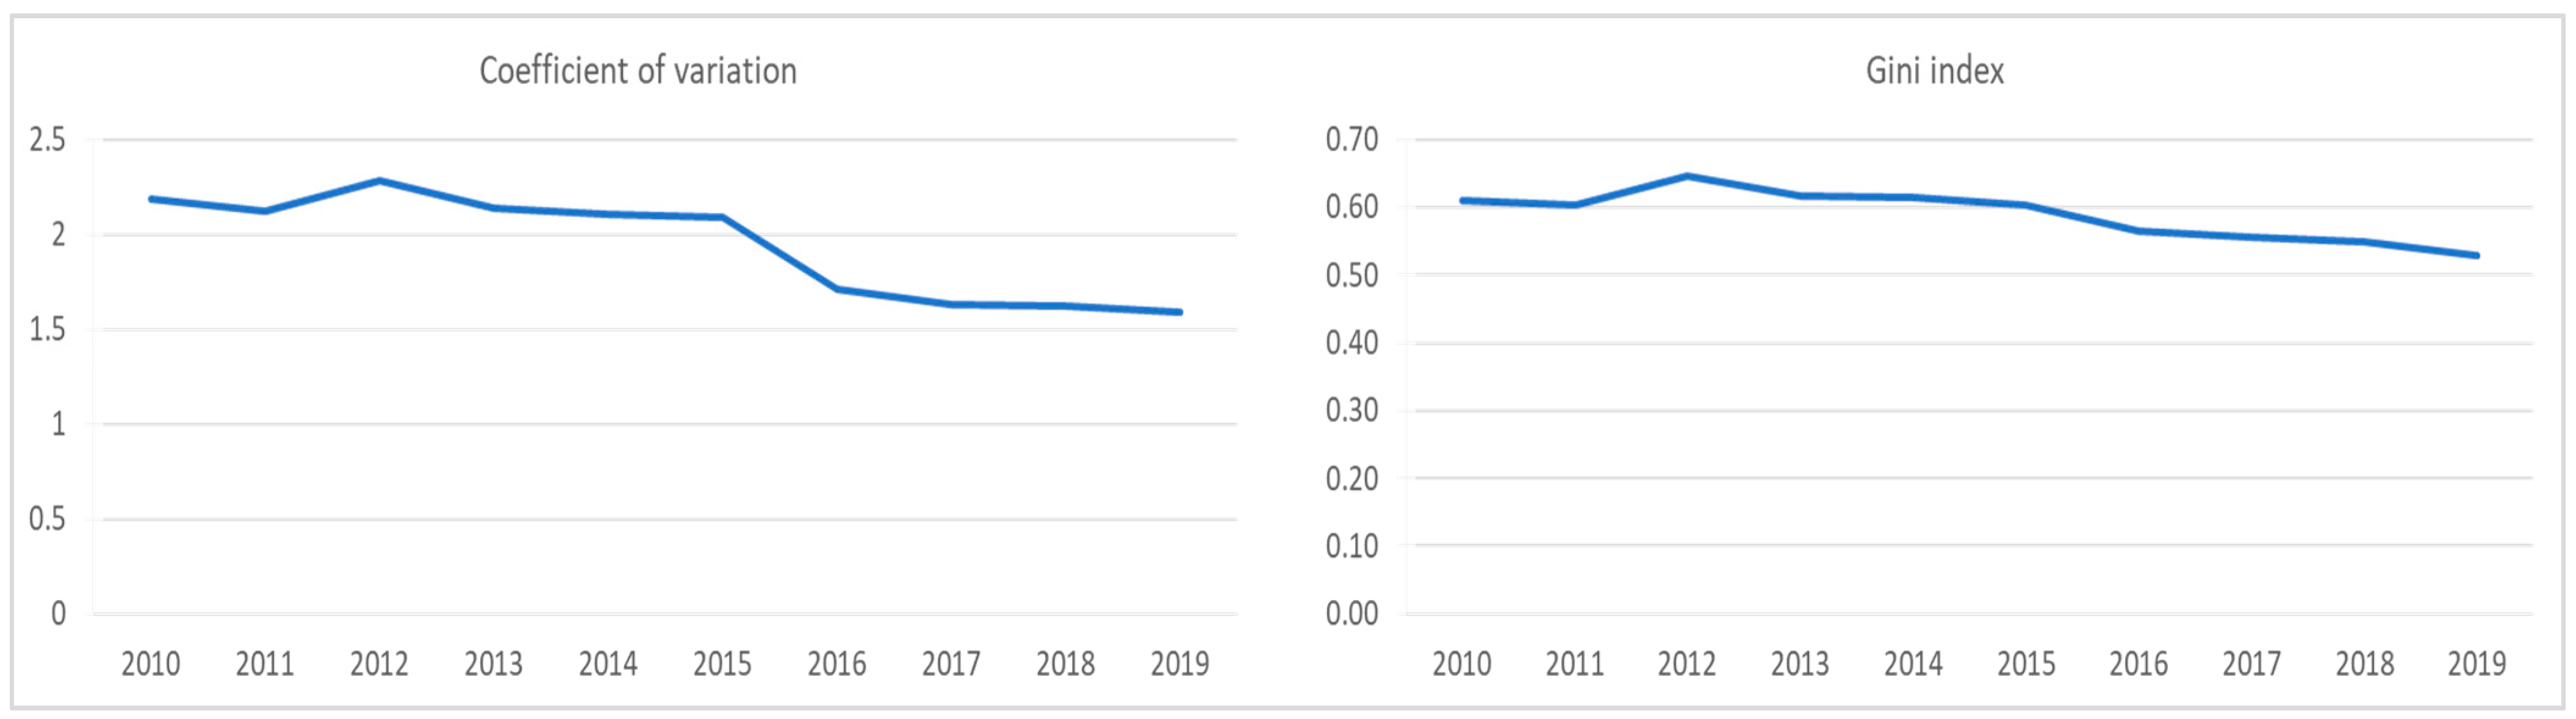
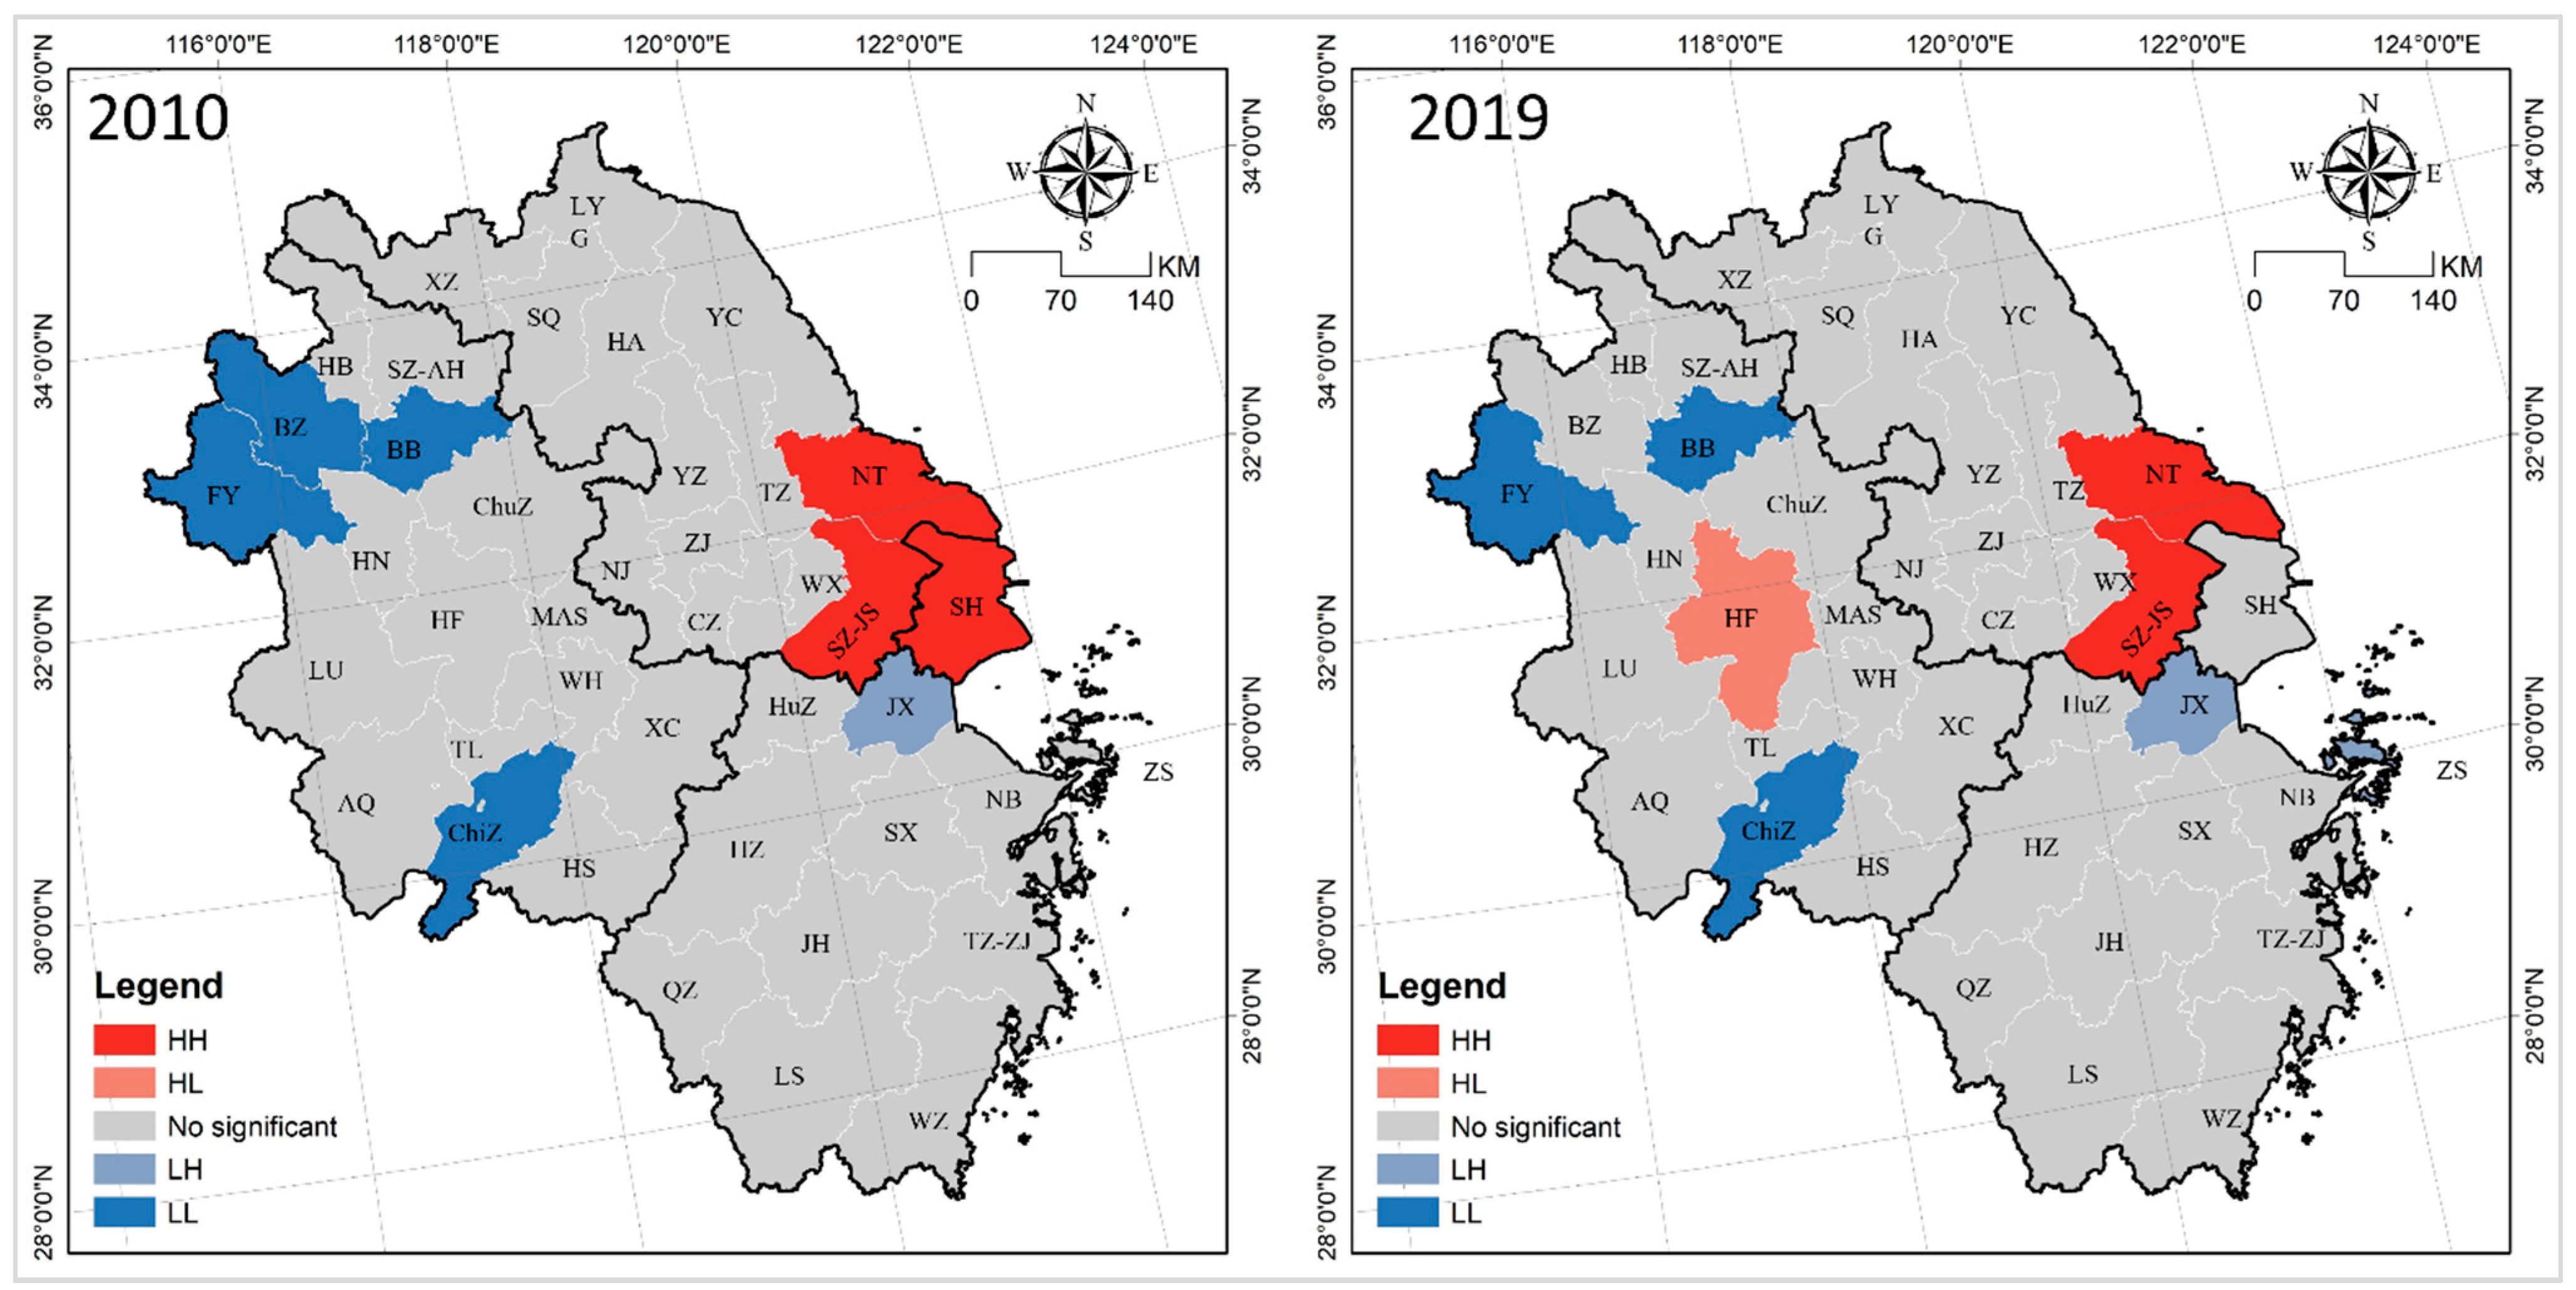
4.1.1. Changes and Spatial Effects

There was high spatial heterogeneity but low convergence. There was a huge disparity in urban industrial land area between the different cities from 2010 to 2019, with Shanghai leading the way and staying on top for a long time. Nanjing, Suzhou-JS, Changzhou, Hangzhou, Ningbo, and Hefei were in the second echelon, whereas Wuxi, Lianyungang, Huai’an, Yangzhou, Taizhou-JS, Shaoxing, Taizhou-ZJ, and Ma’anshan were in the third echelon, and were significantly different from the other cities. Wenzhou, Lishui, Zhoushan, Lu’an, Chizhou, and other cities had a small amount of industrial land, with Lishui having the smallest (Figure 5). Although the coefficient of variation and Gini index showed a downward trend from 2010 to 2019, they were still high, remaining above 1.55 and 0.53, which was far higher than the threshold values (0.36 and 0.4), indicating that the spatial heterogeneity of industrial land in YRD cities was high with weak convergence (Figure 6).
The spatial structure of the “center-periphery” gradient has remained stable for a long time with a shift from central agglomeration to banded agglomeration. The 41 cities were grouped into six classes: highest, higher, high, low, lower, and lowest using the spatial cluster analysis of the GIS. In 2010, it showed a polycentric agglomeration, with Shanghai–Suzhou-JS, Nanjing, Hangzhou, Ningbo, and Hefei as the center and the neighboring cities as the periphery, forming five cluster-like agglomerations. The peripheral hinterlands of Shanghai–Suzhou-JS, Nanjing, and Hangzhou were intertwined and shared, with a contiguous and overlapping geographical distribution, laying the foundation for the formation of the agglomeration zones. Two large central agglomerations of Shanghai–Hefei and Hangzhou–Ningbo took shape in 2019. The regional scope of the Shanghai–Hefei agglomeration belt covers three provincial administrative regions, Shanghai, Jiangsu, and Anhui, and demonstrates that with the integration of the YRD, the connected development among them is gradually improving. The Hangzhou–Ningbo cluster belt is still confined to the provincial scope of Zhejiang and the Hangzhou and Ningbo clusters are integrated in both directions, but the spatial isolation effect they have with both Shanghai and Jiangsu goes against YRD integration. It is noteworthy that the rapid rise of cities in Jiangsu, the declining position of cities in Anhui, especially in the north, and the long-term low status of cities in western and southern Anhui and southern Zhejiang have led to a large gap between the actual effects of industrial transfer and the planned assumptions (Figure 7).
The global Moran’s I index in 2010 and 2019 was 0.07 and 0.08, respectively, which indicated that the distribution of urban industrial land had a positive spatial correlation and agglomeration. From the geographical distribution of HH cities, it was concentrated in the Shanghai metropolitan area in 2010 and then in only Suzhou-JS and Nantong in 2019. From the geographical distribution of LL cities, they have long been concentrated in Anhui province including Fuyang, Bozhou, Bengbu, Chizhou, etc. In 2010, there were no HL cities but Hefei was an HL city in 2019. Jiaxing was an LH city in 2010 and Zhoushan became an LH city in 2019. Overall, the geographical distribution of HH and LL cities had a local agglomeration, with Shanghai and its neighbors more likely to have high indices, whereas cities in Anhui province and its neighbors tended to have low values (Figure 8).
The data of value added, jobs, assets, and profits created per unit area of land help to better analyze the concrete implications of the allocation of urban industrial land on manufacturing and economic growth. The cities with the highest and lowest industrial added value per unit of area in 2010 were Guangzhou (33.74) and Lu’an (4.34) and in 2019 this changed to Wenzhou (146.09) and Xuancheng (9.33), with the average value increasing from CNY 1.421 billion in 2010 to CNY 2.803 billion in 2019. More than 90% of the cities experienced positive growth and some, including Wenzhou, Nanjing, and Wuhu, showed the biggest percentage jump. However, Huainan, Huaibei, and Tongling saw declines, especially Tongling, which declined by nearly half. The cities with the largest employed population per unit area in 2010 and 2019 were Hangzhou (1.71) and Wenzhou (2.12), whereas Xuancheng (0.02 and 0.08) was always at the lowest level. About 60 percent of the cities registered positive growth and the average value increased from 0.43 in 2010 to 0.52 in 2019. However, a decline was found in about 40% of the cities, especially Xuzhou, Hangzhou, Lishui, and Jinhua, indicating that their dependence on the population was decreasing along with the rapid transformation of mechanized and intelligent manufacturing. The cities with the highest and lowest manufacturing assets per unit area in 2010 were Guangzhou (107.47) and Anqing (10.04), respectively, and this changed to Wenzhou (210.94) and Huangshan (17.95) in 2019, with the average value increasing from CNY 3.866 billion in 2010 to CNY 6.321 billion in 2019. Positive growth was recorded in 82.93% of the cities, including Wenzhou, Nanjing, Hefei, Suzhou-JS, Hefei, and Wuhu, which saw the sharpest increases. However, 17.07% of the cities showed different degrees of decline, with large declines in Changzhou, Huainan, Maanshan, Huaibei, and Tongling, indicating that the positive effect of industrial land allocation on the accumulation of manufacturing assets was decreasing (Table 2).

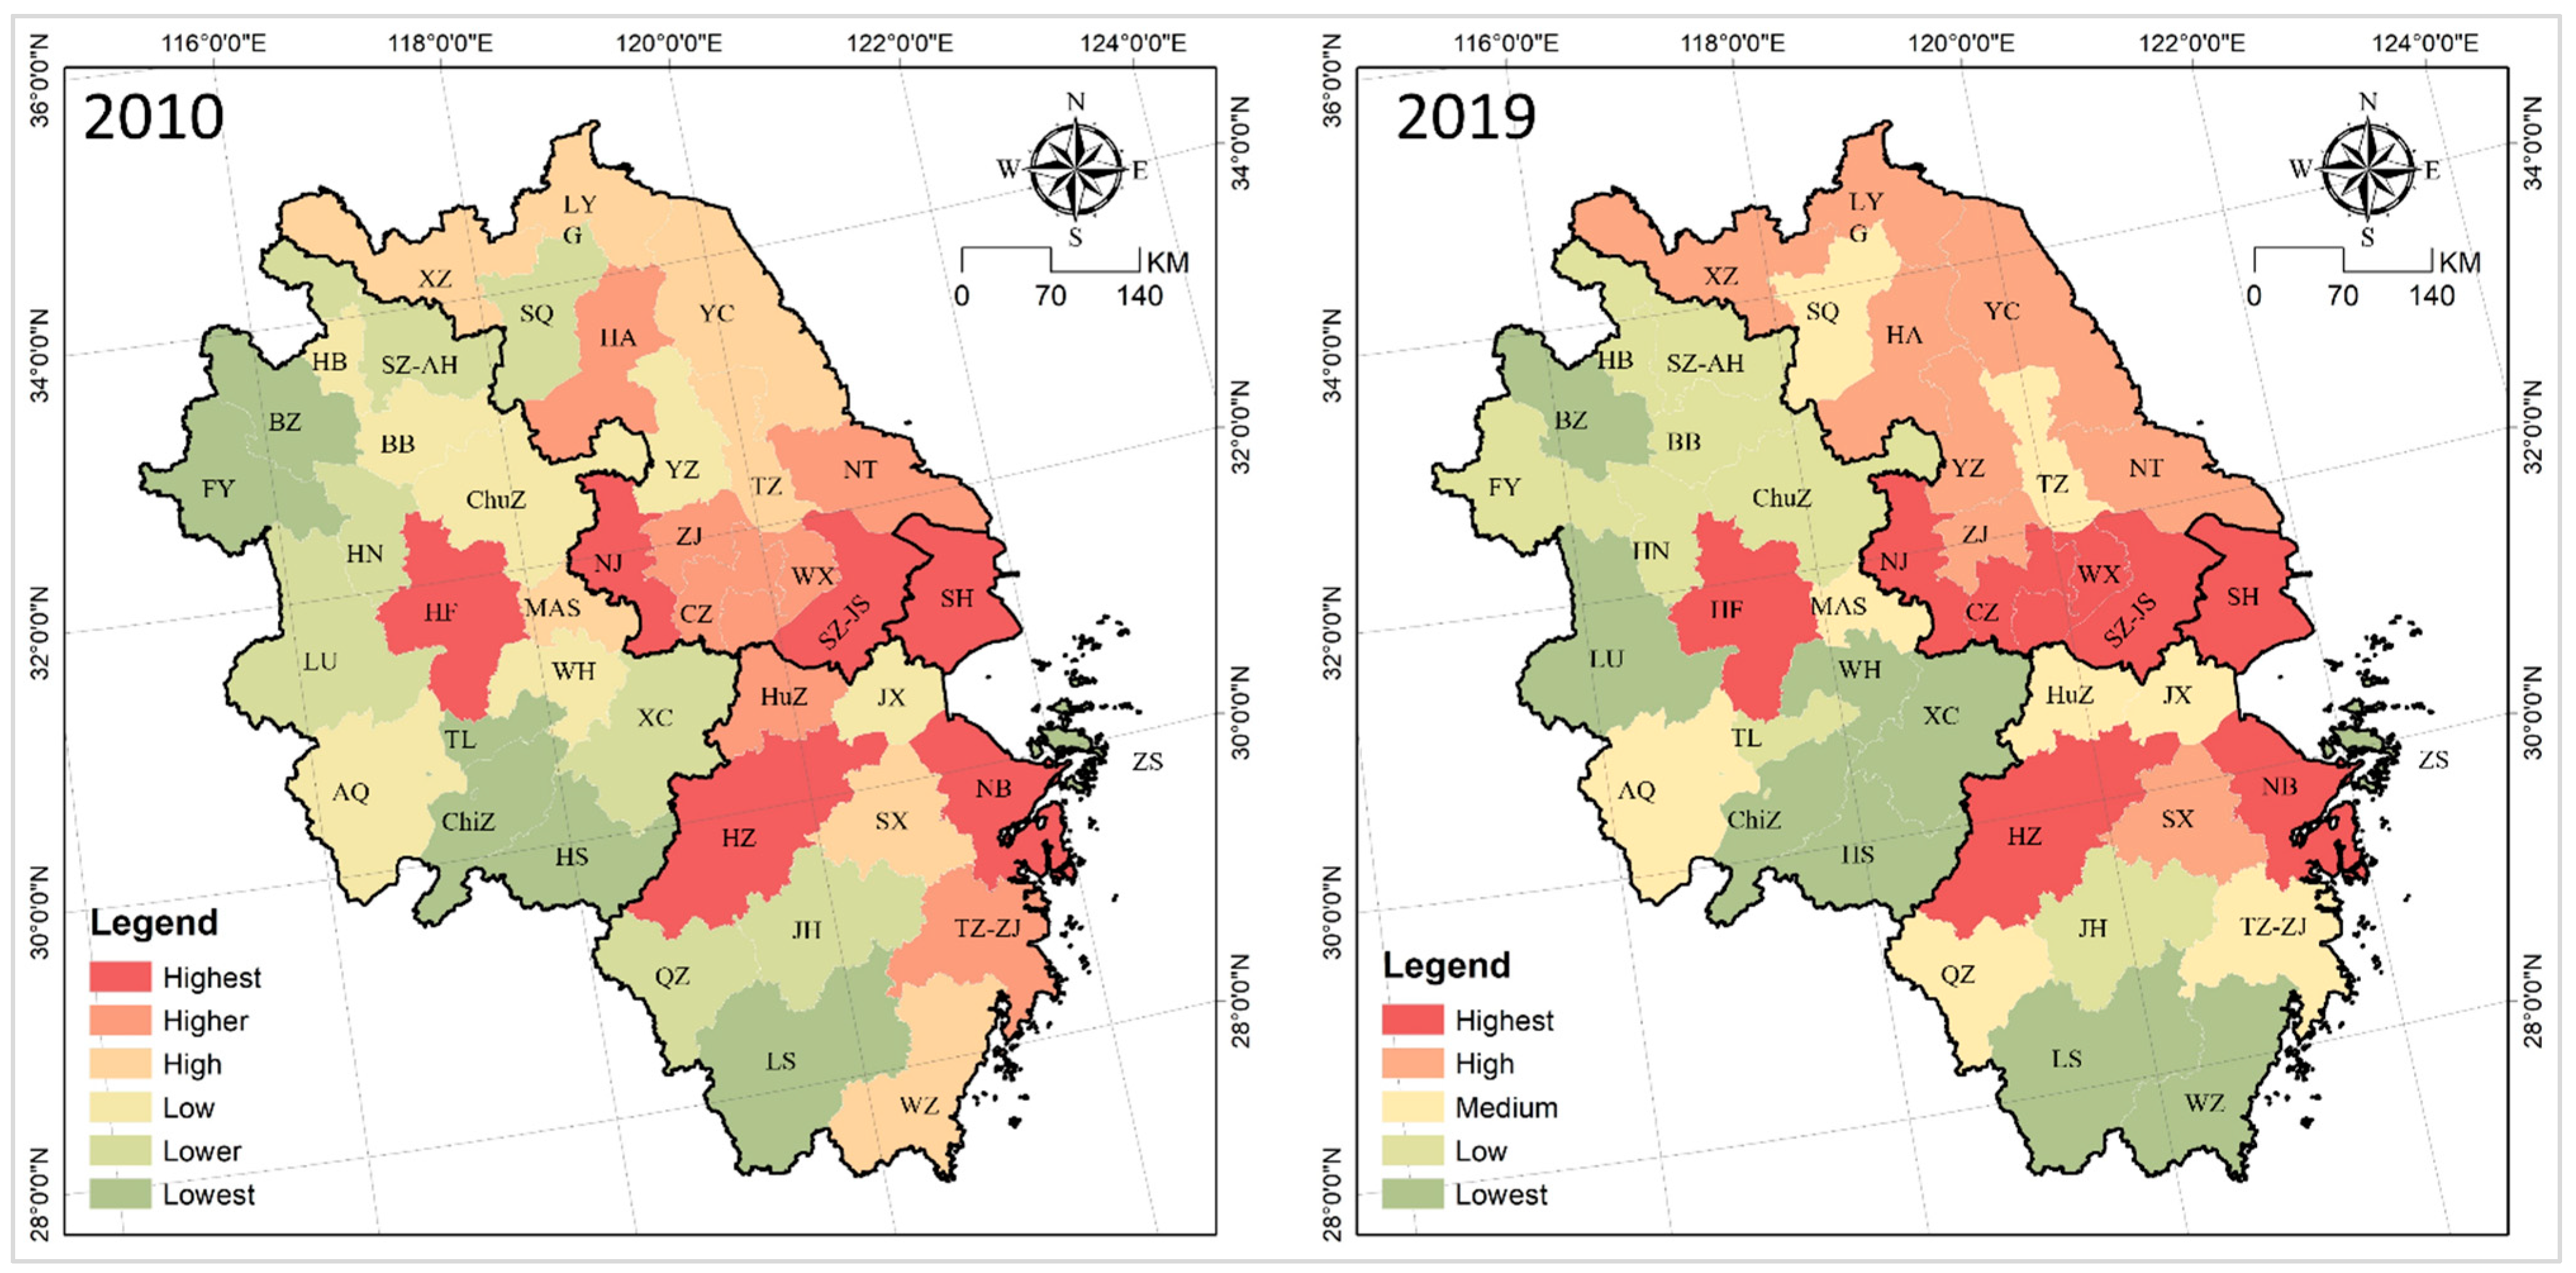
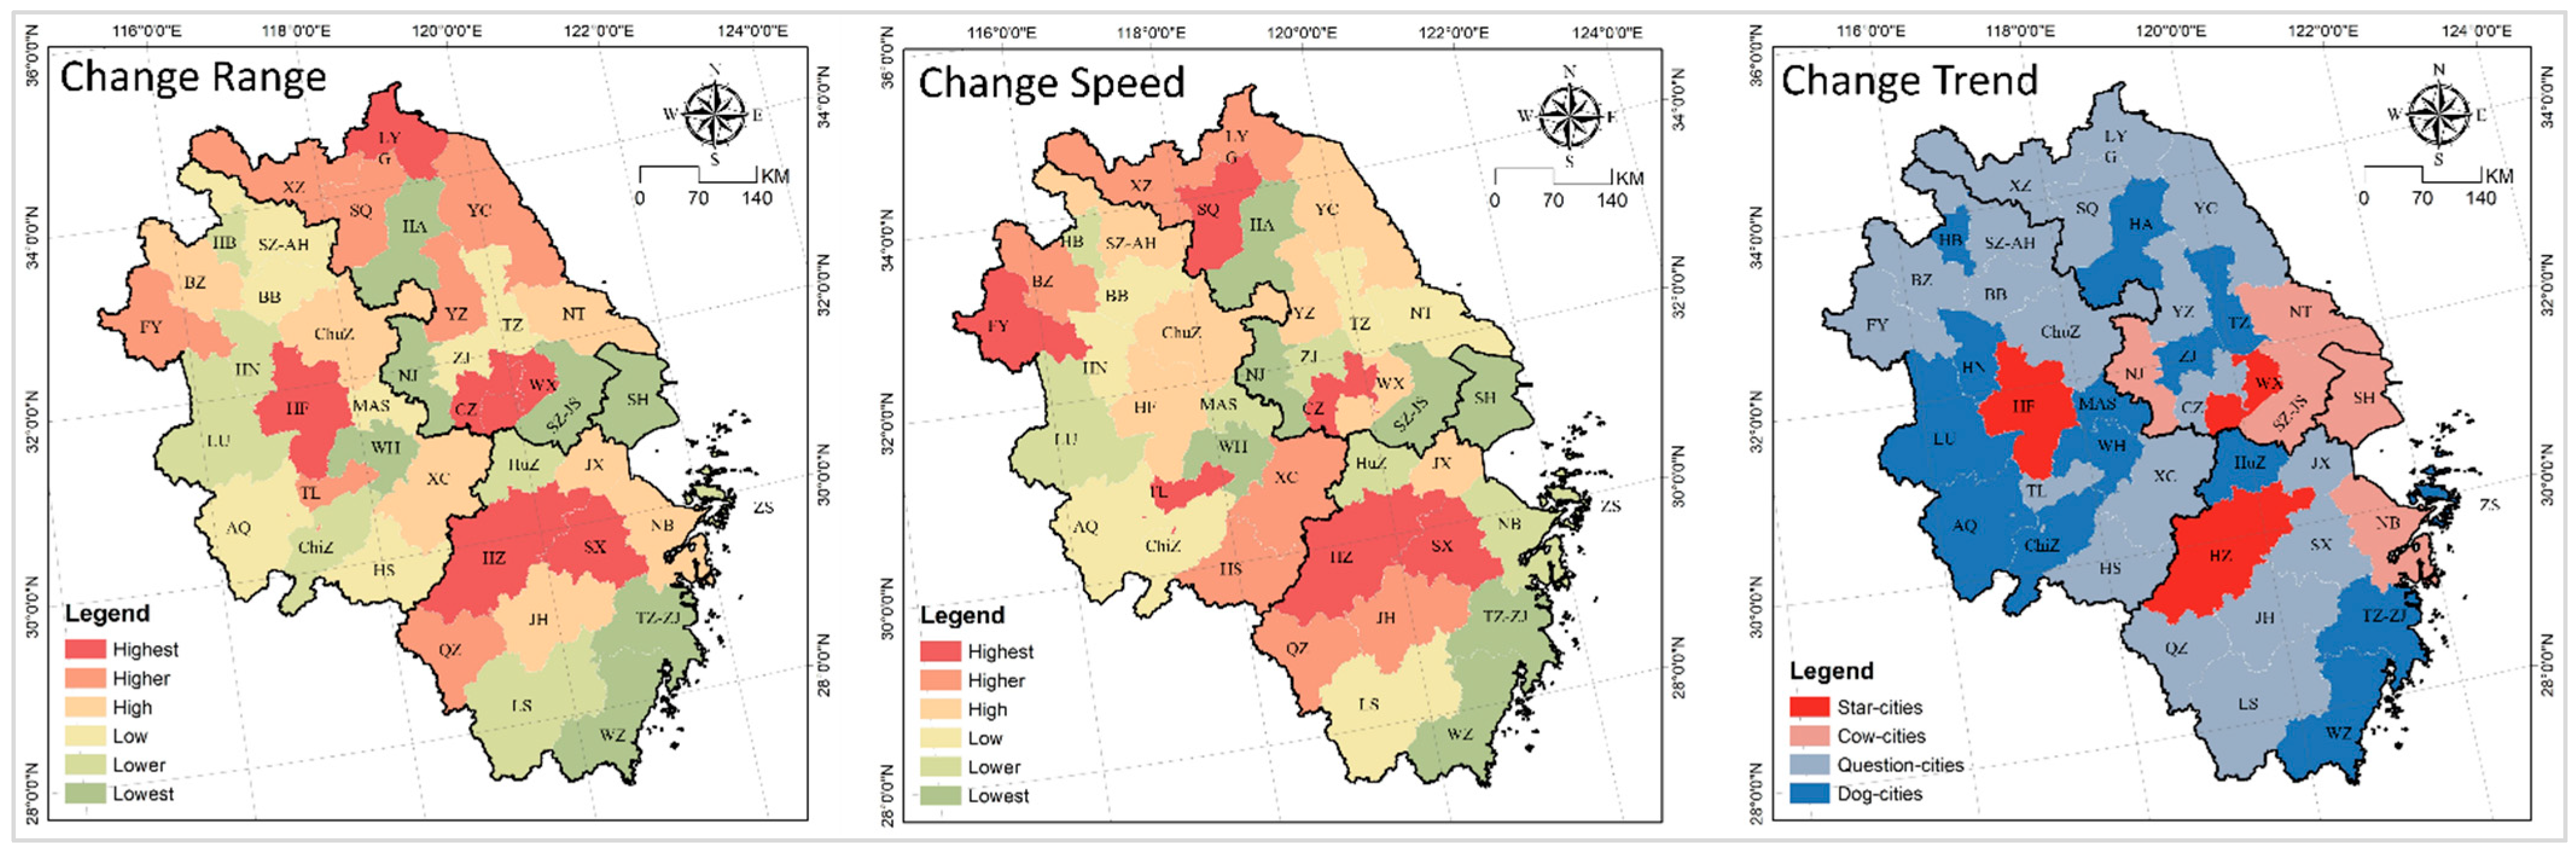
4.1.2. Evolution Mode and Spatial Pattern

As for the range of the changes, most of the cities with the highest levels of change were concentrated in the Nanjing, Hangzhou, and Hefei metropolitan areas, and those with high levels were concentrated in the northern and coastal areas of Jiangsu province. The cities with the lowest levels of change were concentrated in the Shanghai and Wenzhou metropolitan areas and those with low levels were mostly concentrated in West Anhui province. For the speed of the changes, the cities with the highest and high levels were mainly concentrated in the junction of Zhejiang and Anhui provinces, the Huaihai economic zone, and North Anhui province, and those with the lowest and low levels were mostly concentrated in the Shanghai metropolitan area, the junction of Anhui and Jiangsu provinces, and the eastern region of Zhejiang province (Figure 9). It is worth noting that, affected by the economic transformation and development stage, the changes in YRD industrial land were increasingly differentiated. From 2010 to 2019, most cities maintained positive growth, especially Changzhou, Hangzhou, Shaoxing, and Hefei and other cities had strong expansion; however, Shanghai, Nanjing, Suzhou, Huai’an, Wenzhou, Huzhou, Zhoushan, Taizhou-ZJ, and Wuhu experienced varying degrees of decline.
The average relative share of industrial land in YRD cities in 2019 was 7.15% and the average development rate from 2010 to 2019 was 5.31%. Using the Boston Consulting Group matrix, the 41 cities were grouped into four types. HH-type cities included Wuxi, Hangzhou, and Hefei. Wuxi is a famous manufacturing city in China, whereas Hangzhou and Hefei are two stars that have emerged in recent years. HL-type cities included Shanghai, Nanjing, Suzhou-JS, Nantong, and Ningbo and were mostly concentrated in the Shanghai metropolitan area. The LH type had the largest number of cities, with a share of 46.34%, including Xuzhou, Changzhou, Yancheng, Yangzhou, Jiaxing, Shaoxing, Bengbu, and Tongling, and was mostly concentrated in northern and southern Anhui, central Zhejiang, and coastal and northern Jiangsu. LL-type cities accounted for 34.15%, including Anqing, Chizhou, Lu’an, Taizhou-ZJ, Huzhou, Wenzhou, Huai’an, and Zhenjiang, and were mostly concentrated in western Anhui and southeastern Zhejiang (Figure 9).
Significantly, with the transformation of urban development stages and goals, changes in urban industrial land have been increasingly differentiated, with more than 20% of cities experiencing active or passive reductions in urban industrial land. Shanghai, Nanjing, Suzhou-JS, and Wenzhou are active cities, which are in the process of transition from industrialization to post-industrialization and are committed to leading the innovative reductions in the YRD in accordance with the national land reduction policy. Huai’an, Huzhou, Zhoushan, Taizhou-ZJ, and Wuhu are passive cities that have faced difficulties in attracting investment in manufacturing industries due to limitations related to their nature (tourist- or resource-based cities) or siphoning off by large nearby cities and even enterprise outflow, leading to the decline in urban industrial land area.

4.2. Influencing Factors of Urban Industrial Land Spatial Allocation

4.2.1. Direct Influences

In 2010 and 2019, the average values of the direct influence of the factors were 0.52 and 0.57, the maximum values were 0.67 (land used for utilities) and 0.68 (GDP and government revenue), and the minimum values were 0.09 and 0.35, respectively, (both per capita GDP). This showed that the direct influence of all the factors on urban industrial land became increasingly stronger. Considering the maximum, minimum, average value, and classification balance, this paper divides the impact factors into key factors, important factors, and auxiliary factors with 0.55 and 0.65 as the thresholds. In 2010, the land used for utilities and logistics and storage were key factors; the land used for commercial and other services, GDP, population, foreign direct investment, and government revenue were important factors; and higher education institutions, the added value of tertiary industry, government investment in science and technology, import and export trade, etc., were auxiliary factors. In 2019, the GDP, government revenue, added value of tertiary industry, and government investment in science and technology were key factors; foreign direct investment, population, the land used for logistics and storage, land used for commercial and other services, and authorized patent were important factors; and the land used for utilities, import and export trade, urbanization rate, etc., were auxiliary factors (Table 3).
From the changes in the direct force of the factors, the land used for utilities and logistics and storage changed from being key factors to auxiliary factors or important factors, indicating that with the integrated development of the YRD, the infrastructure gaps between the cities were narrowing and their impact on the allocation of urban industrial land was rapidly diminishing. The GDP and government revenue changed from being important factors to key factors, indicating that the goal orientation and scale effect of economic growth have played a decisive role in the allocation of urban industrial land. The added value of tertiary industry and government investment in science and technology changed from being auxiliary factors to key factors, indicating that with the transformation of China’s urban development, the influence of industrial structures and technological innovation was rapidly increasing. It should be noted that the authorized patent changed from being an auxiliary factor to an important factor, which further indicates that the influence of innovation was rapidly increasing. Foreign direct investment, population, and the land used for commercial and other services were constant important factors, whereas the import and export trade, urbanization rate, road length, higher education institutions, and per capita GDP had been auxiliary factors for a long time and their direct influence was stable. However, the influence of the per capita GDP was the smallest in the long term, especially in 2010, which is not statistically significant.

4.2.2. Interactive Influence

Although the interaction between the urbanization rate and road length was a nonlinear enhancement, all factor pairs were bifactor enhancements. It is worth noting that the interaction force of many factor pairs was very high, reaching as high as 0.999, such as with X 1 X 11 , X 2 X 6 , X 2 X 7 , X 2 X 8 , X 2 X 9 , X 2 X 5 , X 1 X 5 , X 6 X 11 , etc., (Table 4 and Table 5). From the average value of the factor interaction influence, the interaction effect and enhancement range in 2019 were both weaker than in 2010. In 2010, higher education institutions, the urbanization rate, land used for utilities, land used for logistics and storage, import and export trade, land used for commercial and other services, and road length had a relatively high interaction effect and enhancement range. In 2019, the import and export trade, population, GDP, government revenue, added value of tertiary industry, foreign direct investment, government investment in science and technology, land used for logistics and storage, and land used for utilities had a relatively high interaction effect and enhancement range, especially the land used for logistics and storage, utilities, and commercial and other services, and the import and export trade was also relatively high in 2010 and 2019 (Table 6).

4.3. Static: Spatial Mismatch of Urban Industrial Land Allocation

4.3.1. Spatial Mismatch Type

Analysis of the value added showed that 53.66% of the cities experienced negative mismatching in 2010, with average positive and negative spatial mismatch indexes of 0.48 and −0.34, respectively. A total of 53.66% of the cities experienced negative matching, with the largest number in extensive contiguous distribution, whereas 31.71% experienced positive matching, most of which were concentrated in central Anhui and southern Zhejiang. Wuxi, Xuzhou, Changzhou, and Hangzhou experienced positive efficiency and were regional development benchmarks. Shanghai and Lianyungang experienced negative economies and were obstacles to regional development. A total of 60.98% of the cities experienced negative mismatching in 2019, with average positive and negative spatial mismatch indexes of 0.52 and −0.30. The cities that experienced negative matching remained unchanged in general, whereas those that experienced positive matching decreased to 19.51%, changing from cluster agglomeration to random decentralized distribution. The cities that experienced positive efficiency grew to 17.07% and were mostly concentrated in southern Jiangsu. Anqing, Quzhou, Shanghai, and Lianyungang experienced negative inefficiency and restricted regional development (Table 7 and Figure 9).
With regard to the employed population, 51.22% of the cities experienced negative mismatching in 2010, with average positive and negative spatial mismatch indexes of 0.63 and −0.49, respectively. A total of 51.22% of the cities experienced negative matching, and they were mainly concentrated in the contiguous distribution in Anhui and Jiangsu, whereas 34.15% of the cities experienced positive matching and were mostly concentrated in Zhejiang. Shanghai and Suzhou-JS experienced positive efficiency, whereas Huainan, Shaoxing, Hangzhou, and Wuxi experienced negative inefficiency. A total of 63.41% of the cities experienced negative mismatching in 2019, with average positive and negative spatial mismatch indexes of 0.86 and −0.44, respectively; 46.34% experienced negative matching and they were mostly concentrated in Anhui; and 19.51% experienced negative inefficiency, most of which were concentrated in the coastal and northern marginal areas of Jiangsu. Positive efficiency and matching shared the same proportions, with the former clustered in southern Jiangsu and northern Zhejiang in a circular belt, whereas the latter was decentralized in Jiangsu and southern Zhejiang and central Anhui (Table 6 and Figure 10).
As for total assets, 63.41% of the cities experienced negative mismatching in 2010, with average positive and negative spatial mismatch indexes of 0.61 and −0.28, respectively. A total of 53.66% of the cities experienced negative matching and they were concentrated in contiguous distribution in Anhui, Jiangsu, and central Zhejiang; and 24.39% experienced positive matching and they were concentrated in the east and south of Zhejiang. Chuzhou, Anqing, Taizhou-ZJ, Huzhou, Hui’an, and Shanghai experienced negative effectiveness, whereas Wuxi, Changzhou, and Hangzhou experienced positive effectiveness, all in decentralized distribution. A total of 70.73% of the cities experienced negative mismatching in 2019, with average positive and negative spatial mismatch indexes of 0.67 and −0.25, respectively; and 41.46% experienced negative matching and they were mostly concentrated in Anhui, with a small number in Jiangsu and central Zhejiang. Positive matching and efficiency shared similar proportions, with the former mostly concentrated in the east and south of Zhejiang and the latter mostly concentrated in the south of Jiangsu (Table 6 and Figure 10).
On the gross profit side, 70.73% of the cities experienced negative mismatching in 2010, with average positive and negative spatial mismatch indexes of 0.79 and −0.26, respectively; 53.66% experienced negative matching and they were mostly concentrated in the coastal areas of Anhui and Jiangsu; and 21.95% experienced negative inefficiency, most of which were clustered in the Shanghai and Nanjing metropolitan areas. Yangzhou, Zhenjiang, Ningbo, Zhoushan, Lishui, and Hefei experienced positive matching, whereas Wuxi, Xuzhou, Changzhou, and Hangzhou experienced positive efficiency, all in decentralized distribution. A total of 19.51% of the cities experienced positively matching, all in decentralized distribution. Shanghai, Nanjing, Wuxi, Suzhou-JS, and Hangzhou experienced positive efficiency, and they were central cities in the Shanghai–Nanjing corridor and Hangzhou metropolitan area (Table 6 and Figure 10).

4.3.2. Mismatch Index Contribution Rate

Most of the cities with the highest and high added values were clustered in southern and northern Jiangsu and central Anhui in 2010, and in the Shanghai–Nanjing development corridor and western Zhejiang in 2019. It is noteworthy that the contribution of Anhui decreased. The cities with the highest level of employed population were clustered in the Shanghai and Hangzhou metropolitan areas, and higher agglomerations were transformed from the coastal development belt of Zhejiang to the Nanjing metropolitan area, with the contribution of Anhui remaining constantly low. The cities with the highest total assets shifted from decentralized distribution in 2010 to clustering in the Shanghai–Nanjing development corridor in 2019, whereas the clustering area for the cities with the lowest total assets shifted from the south to the east of Zhejiang. The cities with the highest and high gross profits were clustered in the Shanghai–Nanjing development corridor and Hefei and Hangzhou metropolitan areas and expanded northward over time along the coastal zone of Jiangsu (Figure 11).

4.4. Dynamic: Decoupling Index between Urban Industrial Land Changes and Economic Growth

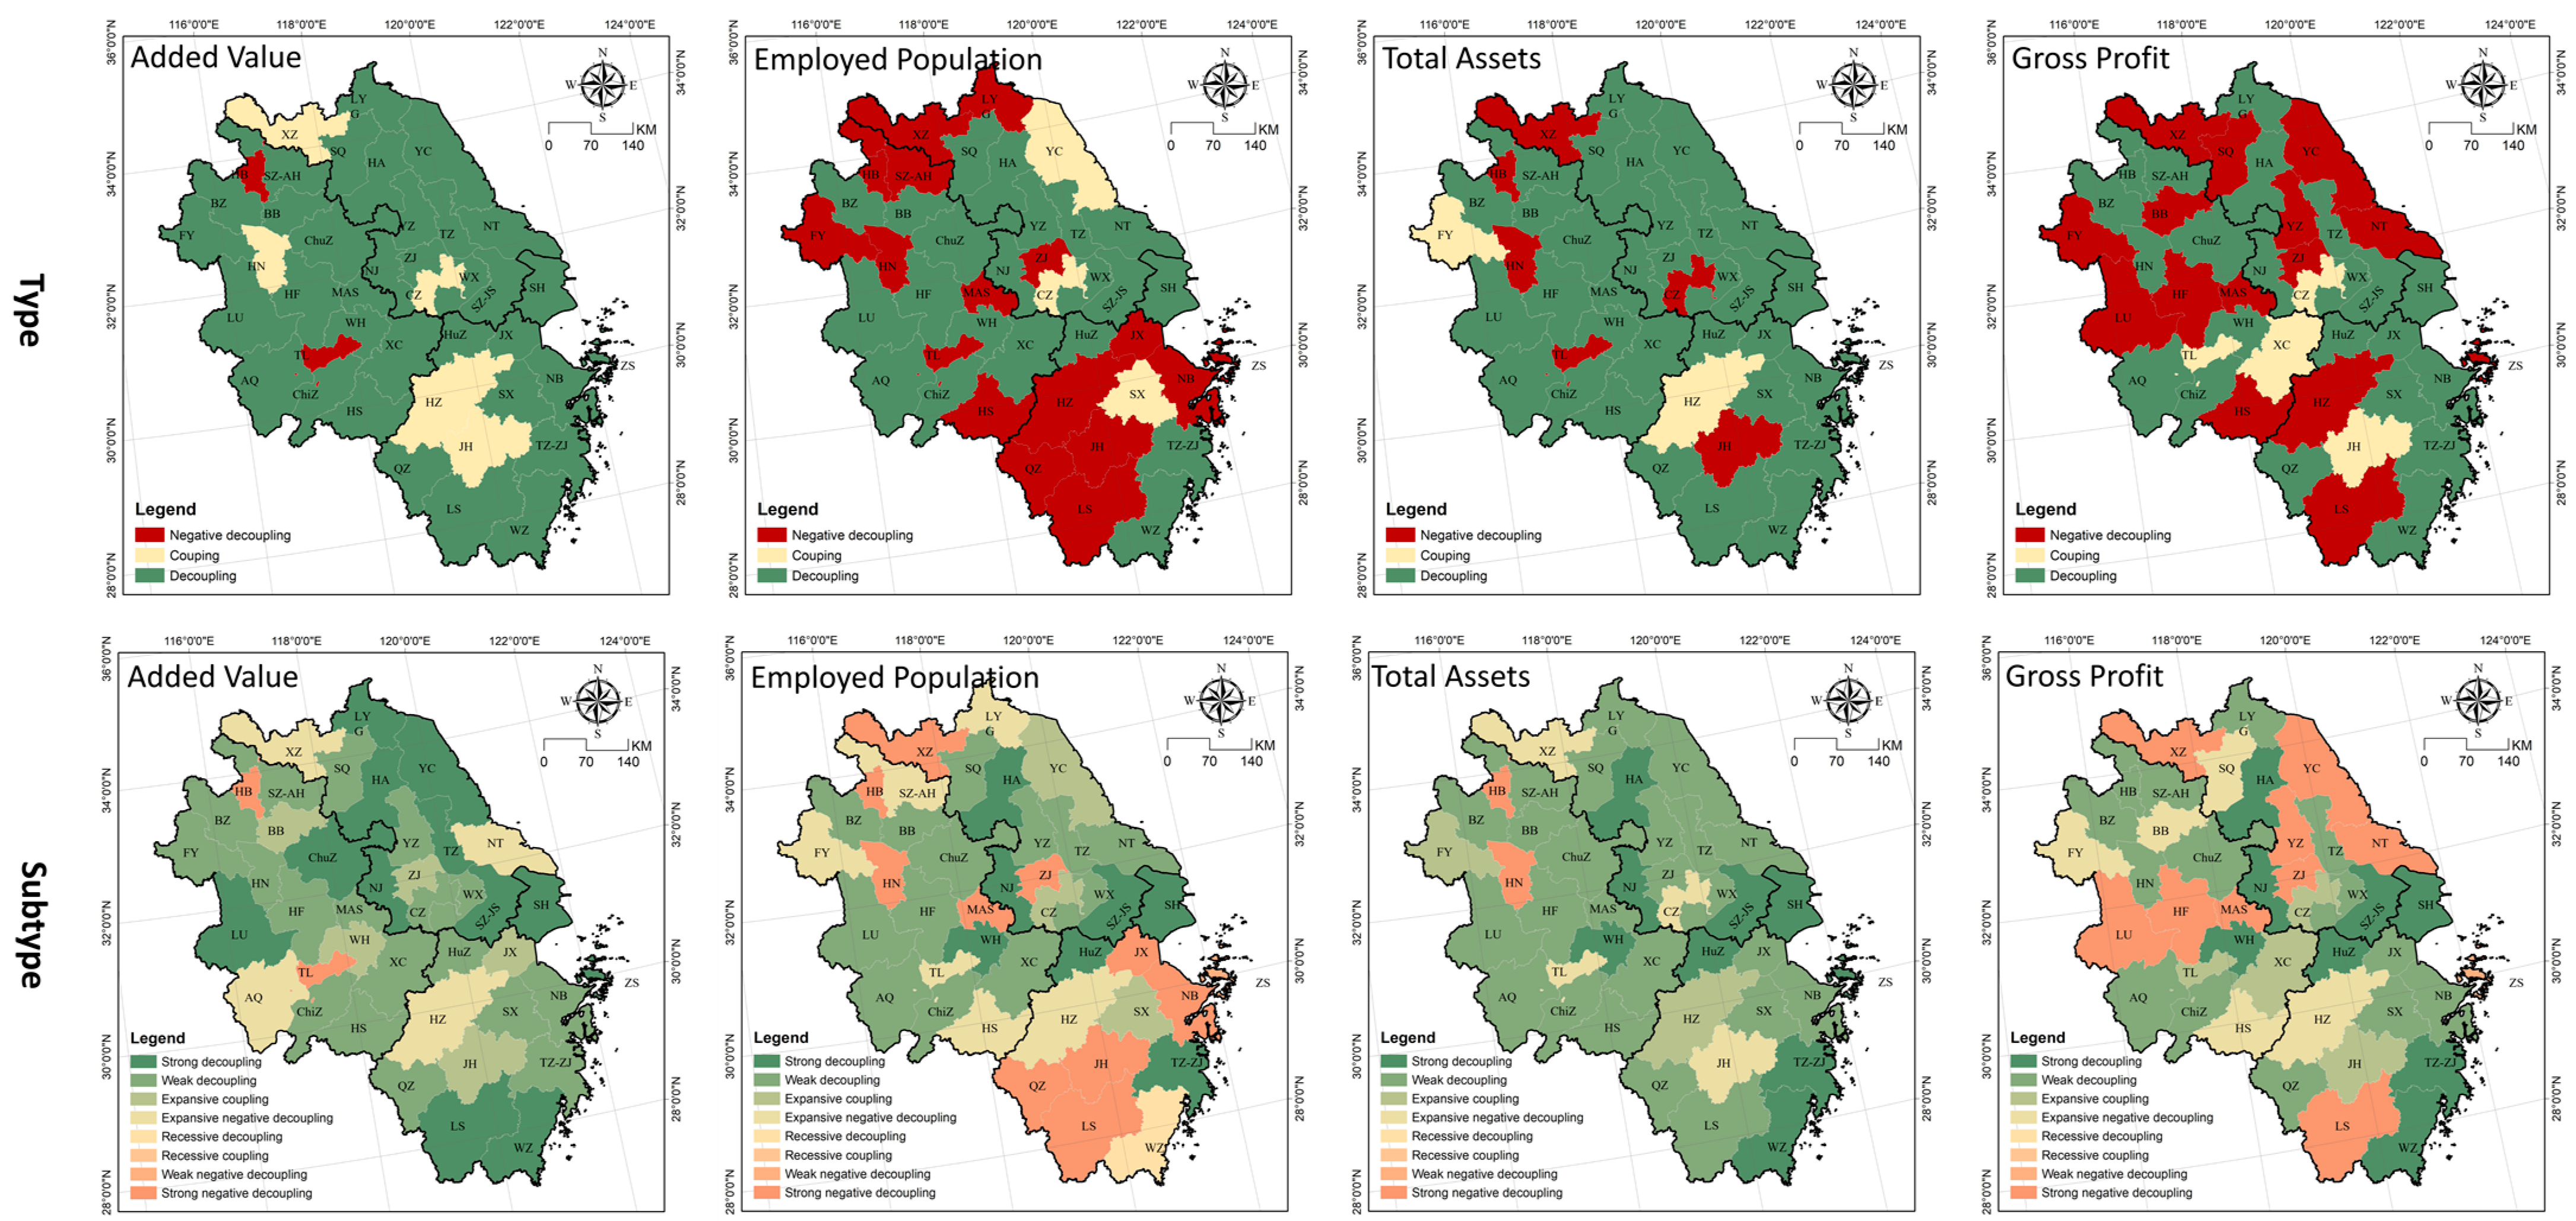
4.4.1. Index Statistical and Spatial Analysis

From the perspective of the added value, 82.93% of the cities experienced decoupling, except for two resource-based cities, Huabei and Tongling, which experienced negative decoupling, and Hangzhou, Xuzhou, Changzhou, Huainan, and Jinhua, which experienced coupling. A total of 60.98% of the cities experienced weak decoupling and they were mostly concentrated in north-central and southern Anhui and eastern Zhejiang, whereas 21.95% experienced strong decoupling and were concentrated in the Shanghai and Nanjing metropolitan areas, coastal Jiangsu, and southern Zhejiang. Xuzhou, Changzhou, Hangzhou, Jinhua, and Huainan experienced expansive coupling, whereas Tongling and Huabei experienced expansive and strong negative decoupling, respectively (Figure 12).
In terms of the employed population, 51.22% and 41.46% of the cities experienced decoupling and negative decoupling, respectively, with the former concentrated in Anhui and Jiangsu and the latter concentrated in Zhejiang, Jiangsu, and northern Anhui. Aside from Changzhou, Yancheng, and Shaoxing that experienced coupling, 31.71% of the cities experienced weak decoupling and they were mostly concentrated in Anhui and Jiangsu; 24.39% experienced strong negative decoupling and were concentrated in southern and central Zhejiang; 17.04% experienced strong decoupling and were distributed in the Shanghai and Nanjing metropolitan areas; and 14% experienced expansive negative decoupling and were decentralized around the edges of the provinces. Changzhou and Yancheng experienced expansive coupling, whereas Wenzhou and Zhoushan experienced recessive and weak negative decoupling, respectively (Figure 12).
With regard to the total assets, 80.49% of the cities experienced decoupling, with Huaibei, Tongling, Huainan, Jinhua, Xuzhou, and Changzhou experiencing negative decoupling and only Hangzhou and Fuyang experiencing coupling; 58.54% experienced weak decoupling and were mostly concentrated in Anhui and Jiangsu; 21.95% experienced strong decoupling and were concentrated in the Shanghai and Nanjing metropolitan areas; Hangzhou and Fuyang experienced expansive coupling; Xuzhou, Changzhou, Jinhua, and Bengbu experienced expansive negative decoupling; and both Huainan and Huaibei (resource-based cities) experienced strong negative decoupling (Figure 12).
From the point of the gross profit, 53.66% of the cities experienced decoupling and they were mostly concentrated in the east of Zhejiang, the north and south of Anhui, and the south of Zhejiang; and 36.59% experienced negative decoupling and were distributed in many clusters in coastal and northern Jiangsu, northern Anhui, and the Hangzhou metropolitan area. Changzhou, Jinhua, Tongling, and Xuancheng experienced coupling. A total of 34.15% of the cities experienced weak decoupling and they were mostly concentrated in north-central and southern Anhui and eastern Zhejiang; 21.95% experienced strong negative decoupling and were mostly concentrated in central Anhui and coastal Jiangsu; and 19.51% experienced strong decoupling and were concentrated in the Shanghai and Nanjing metropolitan areas and southeastern Zhejiang. Changzhou, Xuancheng, Tongling, and Jinhua experienced expansive coupling; Fuyang, Huangshan, Suqian, and Hangzhou experienced expansive negative decoupling; and Zhoushan experienced weak negative decoupling (Figure 12).

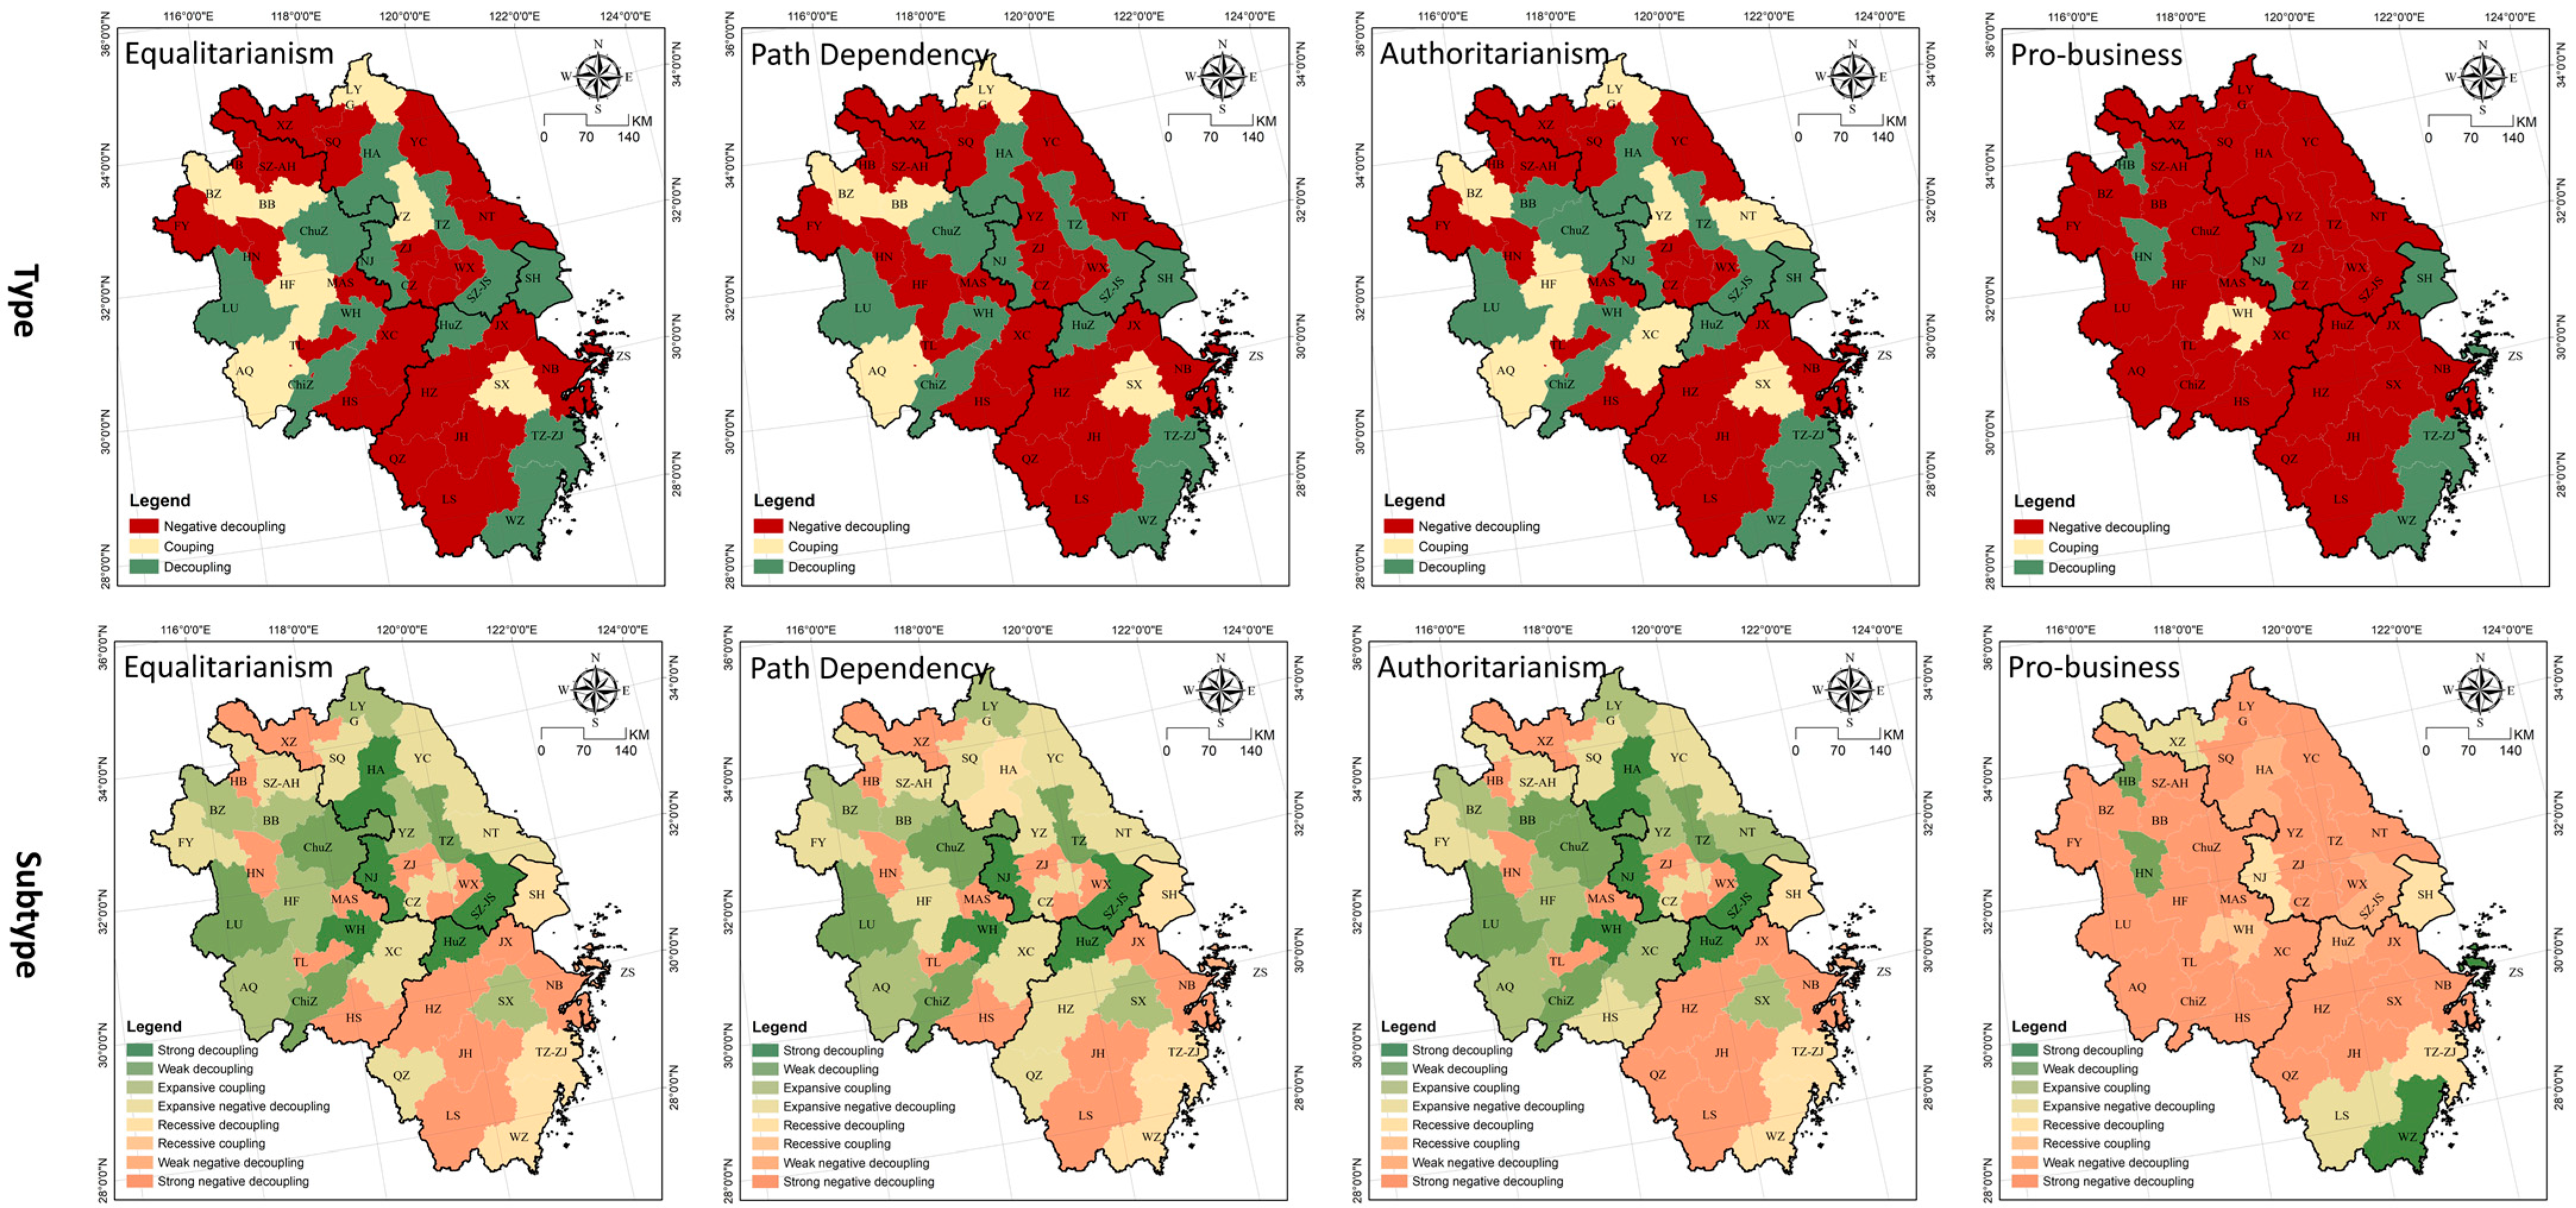
4.4.2. Spatial Overlay Analysis

The results of the decoupling analysis based on the different indicators varied greatly, and in order to more accurately determine the true state of each city, a weighted overlay analysis of the research results was required with consideration of the research objectives and practical needs. Depending on the value orientation, four weight combinations are provided in this paper. Both equalitarianism and path dependency are objective weights, with the former being equally weighted and the latter calculated by the coefficient of variation method based on the data from 2010 and 2019. Authoritarianism and pro-business are subjective weights, with the former tending to exert a governmental force and the latter a market force (Table 8). The values of the subjective weights were set by the authors through discussion, with the aim of analyzing the differences between the four options, and in practical applications, their values should be finalized according to the actual development of the study area and the results of discussions among all stakeholders.
The results of the analysis of equalitarianism and authoritarianism and their spatial patterns are largely the same. About 30% of the cities experienced decoupling, which were positive mismatches and concentrated in the fringe areas of Jiangsu, Anhui, and Zhejiang. About 50% of the cities experienced negative decoupling, which were negative mismatches and mostly concentrated in the Zhejiang, Huaihai, and southern Jiangsu economic zones. About 30% of the cities experienced strong negative decoupling and they were concentrated in western and eastern Zhejiang. About 20% of the cities experienced expansive coupling and expansive negative decoupling and they were mostly concentrated in central Anhui and coastal Jiangsu. About 10% of the cities experienced strong and weak decoupling and they were concentrated in the Nanjing–Chuzhou–Huaian and Suzhou–Huzhou regions (Figure 13).
The cities and their spatial patterns in the path dependency scenario that experienced decoupling were basically the same as those in the scenario of equalitarianism and authoritarianism. About 60% of the cities experienced negative decoupling and they were mostly concentrated in the Zhejiang, Huaihai, and southern Jiangsu economic zones, Wanjiang City Belt, Hefei–Fuyang City Belt, and coastal Jiangsu. About 30% of the cities experienced strong negative decoupling and they were concentrated in western and eastern Zhejiang; 26.83% experienced expansive negative decoupling, mostly in Jiangsu; about 10% experienced strong and weak decoupling, expansive coupling, and recessive decoupling, respectively, and were distributed in the fringe areas of the three provinces (Figure 13).
In the pro-business scenario, 80.49% of the cities experienced negative decoupling, with Shanghai, Nanjing, Wenzhou, Taizhou-ZJ, Zhoushan, Huainan, and Huabei experiencing decoupling and only Wuhu experiencing coupling; and 68.29% experienced strong negative decoupling and they were concentrated in the contiguous distribution in Anhui and Jiangsu and northern Zhejiang. Wenzhou and Zhoushan experienced strong decoupling; Huainan and Huabei experienced weak decoupling; Xuzhou and Lishui experienced expansive negative decoupling; Shanghai, Nanjing, and Taizhou-ZJ experienced recessive decoupling; Suzhou, Huai’an, and Huzhou experienced weak negative decoupling; and only Wuhu experienced recessive coupling. No city experienced expansive coupling (Figure 13).

5. Discussion

5.1. Spatiotemporal Evolution and Dislocation Characteristics

The land use change studies showed that the spatial differentiation and mismatch of industrial land in cities has attracted the attention of scholars, signaling the urgent need for the government to change the “one-size-fits-all” industrial land supply and management model. The study found high spatial heterogeneity and convergence in the scale of urban industrial land and its variations among different cities, a view that corroborates the findings of Zhao [75], Louw [76], Wang [77,78], and Cui [79]. Although the analyses in this paper are based on a different research method, study area, and study period to theirs, the conclusions reached are broadly the same. In case studies of the Chinese Silk Road cities, Yangtze River economic belt, and the Netherlands, industrial land was found to be quite uneven in spatial distribution, and its evolution patterns and change trends were increasingly complex. More and more scholars have begun to specialize in studying the mechanisms of the role of spatial heterogeneity in urban industrial land allocation or incorporate spatial heterogeneity into analysis models of urban industrial land [80], and it has become an increasing trend to study urban industrial land from the spatial dimension perspective. This paper found that urban industrial land mismatch is a major obstacle to the development of manufacturing, which corroborates the findings of some scholars [81]. Due to special land system and land management policies, the primary market for urban industrial land supply is monopolized by the government, and city governments prefer to use urban land allocation as a policy tool to attract new firms in specific industries and promote industrial growth in China. Affected by factors such as central–local government discussions, promotion incentives, financial incentives, competition for investments, and enterprise speculation, the government tends to offer industrial land at low prices, whereas enterprises are more likely to appropriate and hoard industrial land in large quantities, waiting for future land appreciation to change the nature and mode of land use to start development or resell, thus leading to serious mismatches between urban industrial land resources and land use efficiency. As a result, the sustainable and high-quality development of urban manufacturing is restricted.
Moreover, the results of the dynamic mismatch index analysis are better than that of the static model and the method is more suitable for current urban industrial land management. The static spatial mismatch model is essentially used to analyze the land consumed per unit of manufacturing and is classified using the average value of the YRD region (including positives and negatives) as the threshold. Therefore, the results of the static spatial mismatch model analysis are uncertain, and in case of any changes in the study area or study period, their average may be different and so will the classification results that have been calculated based on them. In addition, the static spatial mismatch model is mainly used for comparative analysis from a regional perspective and essentially, it does not touch on the deep connection between urban industrial land changes and the growth of manufacturing. More importantly, due to temporal hysteresis and slow release, it is generally difficult to reflect the land input–output directly in the current period, thus making the static model analysis results less accurate. The dynamic mismatch index can better solve the above problem, as it takes fixed thresholds of 1.0 and 1.2, and calculates the results according to the changes in the cities themselves in a period (corresponding to time delays) rather than regional comparisons (of course, they can also be applied to regional comparative analyses) to reach more stable, accurate, and comparable analysis conclusions [82]. With regard to the urban development life cycle, the relationship between urban industrial land and manufacturing development is phased and dynamic, gradually changing from linear to nonlinear. The dynamic mismatch index can better explain this dynamic relationship than the static mismatch model and is more aligned with the concept of sustainable development. Therefore, policy design should be based on the results of the dynamic mismatch index and the results of the static mismatch model should be used as a reference.
Although resource misallocation has raised concerns in both developed and developing countries, it has not grown into a mainstream topic of research and has not attracted much attention from international scholars. In the field of resource mismatch research, most of the current studies focus on the impact of firm-level “resource” mismatches on manufacturing development in a general sense [83]. Studies of the different types of resource mismatches have focused on the effects of mismatches in hard or soft “resources” such as labor [84], finance and capital [85], natural resources [86], policies [87], and strategies [88]. There are fewer studies on land resource mismatches, and attention to geographical and spatial dimensions is obviously insufficient. Compared with the mismatches of factors such as labor and capital, land resource mismatches have special characteristics and produce more diversified and complex comprehensive impacts. Since the location of land is fixed, it is not as free to move as labor and capital, making its allocation more influenced by administrative interventions and regional, environmental, and other factors. In addition, due to the public attributes and externalities of land resources, the issues caused by their mismatches are often not limited to enterprises or land parcels but tend to be amplified through industrial chains or spatially autocorrelated interaction networks, eventually producing not only regional-level economic losses but also having an adverse social and ecological impact.
The differentiated evolution of urban industrial land is a key driver in reshaping the regional town system and economic geography, and it will further drive the reconfiguration of the regional social, and political landscapes, as well as spatial relationships, in the future. In the context of tightening constraints and the stricter management of land resources by central and local governments, what lies behind the spatial heterogeneity and mismatches of urban industrial land is a call to change the “one-size-fits-all” policy design way of thinking [89]. Since there are significant differences in economic development, resource endowments, industrial structures, and urban development stages among different cities, land policies should be formulated in a “city-specific” and “classified management” manner in order to maximize the accuracy of the policies. In other words, the government should use more flexible and differentiated policies to finely manage urban industrial land. Criteria should be established under the actual conditions of each city and the economic development needs of the manufacturing industries, rather than blindly pursuing regional balance or “making a decision subjectively” (making an emotional decision) or “governorship” (more power means more land resources). The government should adjust urban land policies in a timely manner depending on the dynamic relationship between the consumption of urban industrial land and the growth of manufacturing industries in order to avoid land resource mismatches, especially negative mismatching, and to promote the mutual adaptation of land allocation to economic and social development stages.

5.2. Spatial Adjustment and Management Policy Design Recommendations

Urban industrial land is a highly differentiated resource type that has economic and social attributes, and information on land quantity, quality, location, structure, and other characteristics of the region is spatially heterogeneous. With developments in industrialization and urbanization, the development of urban industrial land presents diversified, refined, and complex characteristics and spatial heterogeneity, agglomeration, and mismatches are increasingly apparent [90]. Universal or uniform land management models and policies inevitably result in a loss of land use and management benefits. Therefore, it is necessary to explore differentiated management methods for urban industrial land [91]. The YRD is classified into four types of policy zones by reorganizing the eight types of decoupling shown in Figure 2 by the quadrant where they are located and accordingly recalculating and plotting the results in Figure 10. In the process of designing policy partitioning, multiple weighting combination relationships should be exploited based on value-oriented differences to determine the four scenarios of policy zoning options for the government to compare and use on merit under actual conditions (Figure 14). For the different zones, differentiated response strategies should be further developed with consideration of the goal orientations and actual needs of urban development [92].
In the context of sustainable development, creating more manufacturing with less urban industrial land is a sign of high-quality development. Strong decoupling in the fourth quadrant represents a positive mismatch, indicating that the high growth of manufacturing has been achieved despite the reduction in urban industrial land, which is a benchmark of regional high-quality development and these cities are classified as high-quality development policy areas. Strong negative decoupling in the second quadrant represents a negative mismatch, indicating that the continuous additional investment in urban industrial land has not only failed to create a manufacturing boom but has also failed to effectively stop the decline, suggesting that land was not the root cause of the constraints of industrial economic development and these cities are classified as transformation development policy areas. Weak decoupling, expansive coupling, and expansive negative decoupling in the first quadrant, in which cities maintained positive growth in industrial land and manufacturing, represent positive dynamic matching, but the matching degree did not reach the optimal state; therefore, these cities should be classified as performance improvement policy areas. Recessive decoupling, recessive coupling, and weak negative decoupling in the third quadrant, in which cities maintained negative growth in industrial land and manufacturing, represent negative dynamic matching, but the matching degree and development state were in an unsustainable state and these cities should be classified as smart shrinking policy areas in the future.

5.2.1. High-Quality Development Policy Area

There were a small number of cities in this policy area, and the membership composition was essentially the same in each scenario except for pro-business. Equalitarianism and authoritarianism had the same zonings including Suzhou, Huzhou, Nanjing, Wuhu, and Huai’an. The path dependency scenario did not include Huaian compared with the previous two, whereas the cities in the pro-business scenario changed to Wenzhou and Zhoushan. They were in a state of land reduction and high-quality manufacturing development with manufacturing and economic development beyond the limits of land resources, and as a benchmark for the efficient and intensive use of industrial land in the YRD, they should give full play to regional evidence and driving effects in the future. First of all, the government should formulate urban industrial land reduction plans, deconstruct the reduction tasks at different levels, steadily promote the reduction in the use of urban industrial land, and orderly guide the transfer or upgrade of inefficient enterprises to maintain and enhance the sustainable development capacities of the cities. Second, the government should establish a cross-regional trading platform for reduced land indexes and a revenue refinancing mechanism and determine the trading subjects, guiding prices, trading rules, and supervision mechanisms, to realize the transfer of reduced land indexes from cities with surplus indexes to cities with scarce indexes and improve the efficiency of the utilization of resources. At the same time, the target inflow cities should increase their efforts to feed the target outflow cities by transfer payments, providing employment opportunities, and targeted support to achieve effective compensation for the land development rights and development spaces of the reduced target outflow cities [93]. Third, the development of living or ecological functions should be given priority in the process of urban industrial land renewal. Non-industrial functions should be precisely implanted and public service facilities configured based on resident surveys of public service and ecological needs. Priority should be given to encouraging the conversion of land into green plazas equipped with leisure, cultural, sports, welfare, medical, and children’s facilities.

5.2.2. Performance Improvement Policy Area

The equalitarianism, authoritarianism, and path dependency scenarios had a large number of cities in this policy area and most of them were concentrated in the contiguous distribution in Anhui and Jiangsu. The membership composition in the three scenarios varies only locally, such as in the cities in northern Zhejiang. Unlike these scenarios, the pro-business scenario contained a sparse number of cities, Xuzhou, Huabei, and Lishui. The cities in this policy area will have to adopt different means in the future to enhance the intensity and efficiency of urban industrial land use. First, they should revise the land use standards for industrial project construction and urban planning and increase the volume ratio, investment intensity, and added-value requirements in the planning approval and supply of industrial land [94]. Second, they should adopt economic instruments to regulate the supply and demand of urban industrial land and change the management focus from regulating supply to demand. For example, the values of land use concessions should be increased to induce industrial enterprises to reduce the demand for land areas under the premise that the total amount and structure of investment remain unchanged, and to meet the demand for the production spaces of enterprises by increasing the plot ratio and other intensive land use routes. Third, they should develop strict criteria for attracting investment and improving the quality of new enterprises. High value-added industries such as advanced manufacturing and modern services should be promoted, and higher requirements should be set for new enterprises in terms of registered capital, revenue capacity, average land tax revenue, and employment. Fourth, they should establish a dynamic performance monitoring and evaluation mechanism to implement the dynamic assessment of the efficiency of urban industrial land use throughout its life cycle so that the inefficiencies can be detected in time to make timely efforts to prevent idleness and waste [95]. Fifth, they should build an anti-driving mechanism with financial incentives for those using land sparingly and intensively and penalties for those who fail to meet the standards.

5.2.3. Smart Shrinking Policy Area

There was a small number of cities in this policy area. The equalitarianism, path dependency, and authoritarianism scenarios contained the same cities, that is, Shanghai, Wenzhou, and Taizhou-ZJ, and the pro-business scenario had a significantly expanded geographic scope including Shanghai, Suzhou-JS, Huzhou, Taizhou-ZJ, Nanjing, Wuhu, and Huai’an. Although both their industrial land and manufacturing were in sustained contraction, the influencing factors or driving mechanisms were not the same. Shanghai, Suzhou-JS, Nanjing, and Wuhu are regional and are national manufacturing cities that are transforming from the industrialization to post-industrialization stage, and their contraction is an active innovation in response to laws of development and national policies. Huzhou, Taizhou-ZJ, and Huai’an are regional tourist or ecological cities where in the era of ecological civilization, the nature of the cities has become more restrictive for industrial development, and industrial land and manufacturing are forced to contract. This policy area should focus on the following response measures in the future. First, urban industrial land should be classified into various types, such as the preservation of the status quo, upgrading and transformation, relocation and retreat, and adopting of categorical measures to guide industries to change from “passive withdrawal and relocation” to “active transformation and renewal” based on the evaluation of the degree of intensive use of industrial land, with the consideration of a variety of dimensions, including whether it is in line with urban planning, whether the land is fragmented, and whether there is potential for renewal. Second, a comprehensive “access-adjustment-exit” life cycle circulation system should be set up [96] with emphasis on establishing a mechanism for the exit of inefficient urban industrial land and adopting economic compensation and interest inducements to guide industrial enterprises that do not meet planning requirements or are unable to withdraw voluntarily or effectively improve their own production efficiency. Third, government intervention is still important for the industrial and especially national economic development of the YRD so, in order to cope with its own de-industrialization development trend and the siphoning effect of re-industrialization in developed countries, it is necessary to draw on the experience of industrial land management in PRD cities and designate protection red lines for industrial land with protective and strategic value in shrinking cities [97,98]. The land within the red lines should be dedicated to high-end, strategic manufacturing and emerging economic development and be protected for its industrial assets or reserved for long-term development. The industrial protection line should ensure both quantity and quality, that is, although the land is protected, supportive and preferential industrial development policies should be designed or various basic and public production service facilities should be built according to the needs of industrial transformation and upgrading. Fourth, the development of new economies should be cultivated with high quality to support high-quality industrial investments. Higher entry standards should be established for new enterprises, including the types of industrial entry, enterprise entry standards, and industrial park land use requirements. Office and production land should be provided for start-ups, high-tech enterprises, and incubators to revitalize existing industrial land resources using “resale to rent” and other industrial land use methods.

5.2.4. Transformation Development Policy Area

The equalitarianism, path dependency, and authoritarianism scenarios had similar zoning schemes, with most cities being distributed in Zhejiang, differing only locally such as Hangzhou, Quzhou, and Huangshan. The pro-business scenario had a large number of cities and they were widely distributed throughout Anhui and Jiangsu and in northern Zhejiang. There was a serious negative mismatching between industrial land change and the growth of manufacturing in these cities, and land input was hardly driving the manufacturing boom. In the future, they must strengthen the management of the urban industrial land supply and the way it is utilized, acquire information on corporate land use in real time, and promote the redistribution of industrial land with a demand-side orientation [99,100]. In addition, more investment should be made in non-land resources such as talent, finance and capital, technology, and policies to achieve sustainable development [101].
First of all, they should further promote the openness and standardization of urban industrial land concessions, standardize the operation procedures of “bidding, auction and listing”, strictly prohibit all kinds of formalistic “bidding, auction and listing”, and establish a multi-level supervision and restraint system for the process of industrial land concessions [102]. Second, they should innovate the land supply. It is necessary to determine appropriate ways of transferring industrial land based on industrial policy, land planning, industrial land demand, and other specific factors to explore new ways of using land, such as leasing or transferring after leasing, and implement a flexible terms-type system of transferring industrial land. The lease terms of industrial land should be flexibly adjusted according to the life cycle of enterprises to prevent enterprises from “hoarding land for appreciation” by the “transferring after leasing” method for industrial land management in light of the life cycle of enterprises, which helps revitalize land resources and release the value-added effect of land assets.
Third, they should establish a regular evaluation and update system for the lowest price standard of industrial land policies. There is still a practical need to restrict local governments from enabling land transfers at a low cost through the minimum price standard of industrial land policies under the imperfect development of the urban industrial land market. Therefore, it is particularly important to regularly update the lowest price standard of industrial land policies to adapt to economic and social development. Dynamic monitoring methods of the status of industrial land use should be studied and established to regularly update industrial land classification standards and results. A scientific mechanism for forming and updating the minimum price guideline for industrial land should be forged to realize the modern management of the data in the cost–benefit evaluation of industrial land so that the minimum price standard can truly play a controlling and guiding role in land concessions. In addition, a mechanism should be established to effectively regulate the reasonable ratio of industrial land to residential land, raise the price of industrial land, narrow the gap between the price of industrial land and the price of residential land and commercial and other business land, reduce enterprises’ speculative habit of “hoarding” land, and promote the use of industrial land for industrial projects.
Fourth, a “standard land + commitment system” should be implemented. The “standard land” refers to areas eligible for land supply within urban development boundaries and state-owned construction land that has been granted under the “commitment system” after construction assessments of new industrial projects have been completed and is based on clear control indicators such as project investment intensity, construction standards, output efficiency, and environmental protection. The “3 + X” control system is usually adopted where three represents the fixed asset investment intensity, plot ratio, average tax revenue per mu; and X represents the average output value per mu, emission standard per unit area, energy consumption intensity benchmark, safety production control, R&D investment, employment, technology, talent, brand, etc. The aim of the “commitment system” is to define the control indicators, completion and acceptance, production review, liability for non-compliance, and other matters in line with the Performance Supervision Agreement for “Standard Land” for Industrial Projects, Enterprise Credit Commitment to “Standard Land”, and other commitment agreements implemented by the government for the land-using enterprises in accordance with the principle of “policy guidance, corporate credit commitment, and effective regulatory constraints” and under the premise of making clear control indexes of “standard land”. Land transfers subject to the “standard land + commitment system” can improve the accuracy of industrial land supply, control the efficiency of land use, avoid mismatches between the government and enterprises regarding the supply and demand of urban industrial land, and promote the high-quality development of manufacturing in all aspects.

6. Conclusions

Scholars have long had insufficient understanding of whether and to what extent there is a mismatch between urban industrial land resources and in practice, the government has no targeted detection tools and monitoring mechanisms, thus mismatches have become a key obstacle to the high-quality development of manufacturing and there are no effective corrective strategies or management methods. Based on a combination of the Boston Consulting Group matrix, spatial mismatch model, decoupling index, and GIS tools, this paper empirically investigated the mismatch between industrial land changes and the growth of manufacturing in YRD cities. We found the following:
(1)
Urban industrial land had high spatial heterogeneity and agglomeration but low convergence. Furthermore, the spatial structure of the “center-periphery” gradient changes remained stable for a long time, and the spatial patterns and forms have changed from central agglomeration to belt-like agglomeration. The expansion and contraction of urban industrial land have co-existed, and the changes are becoming more complex and diversified, with different types of cities clustered together. There were a large number of LH and LL-type cities, with the former mostly concentrated in northern and southern Anhui, central Zhejiang, and coastal and northern Jiangsu, whereas the latter were mostly in western Anhui and southeastern Zhejiang. There were few HH- and HL-type cities, with the former consisting of regional traditional manufacturing cities (Wuxi) or up-and-coming cities (Hefei, Hangzhou), and the latter mostly in the Shanghai metropolitan area.
(2)
The factors affecting the allocation of urban industrial land were divided into three categories according to the direct influences: key factors, important factors, and auxiliary factors. The GDP, government revenue, added value of tertiary industry, and government investment in science and technology were key factors, indicating that the goal orientation and scale effect of economic growth played a decisive role in the allocation of urban industrial land, and the influence of industrial structures and technological innovation has rapidly increased. Foreign direct investment, population, and the land used for commercial and other services have long been important factors, indicating that their direct influence has been stable and cannot be ignored. The interaction between the different factors were bifactor enhancements, for example, land used for logistics and storage, utilities, and commercial and other services, as well as the import and export trade, which had a strong synergistic enhancement effect.
(3)
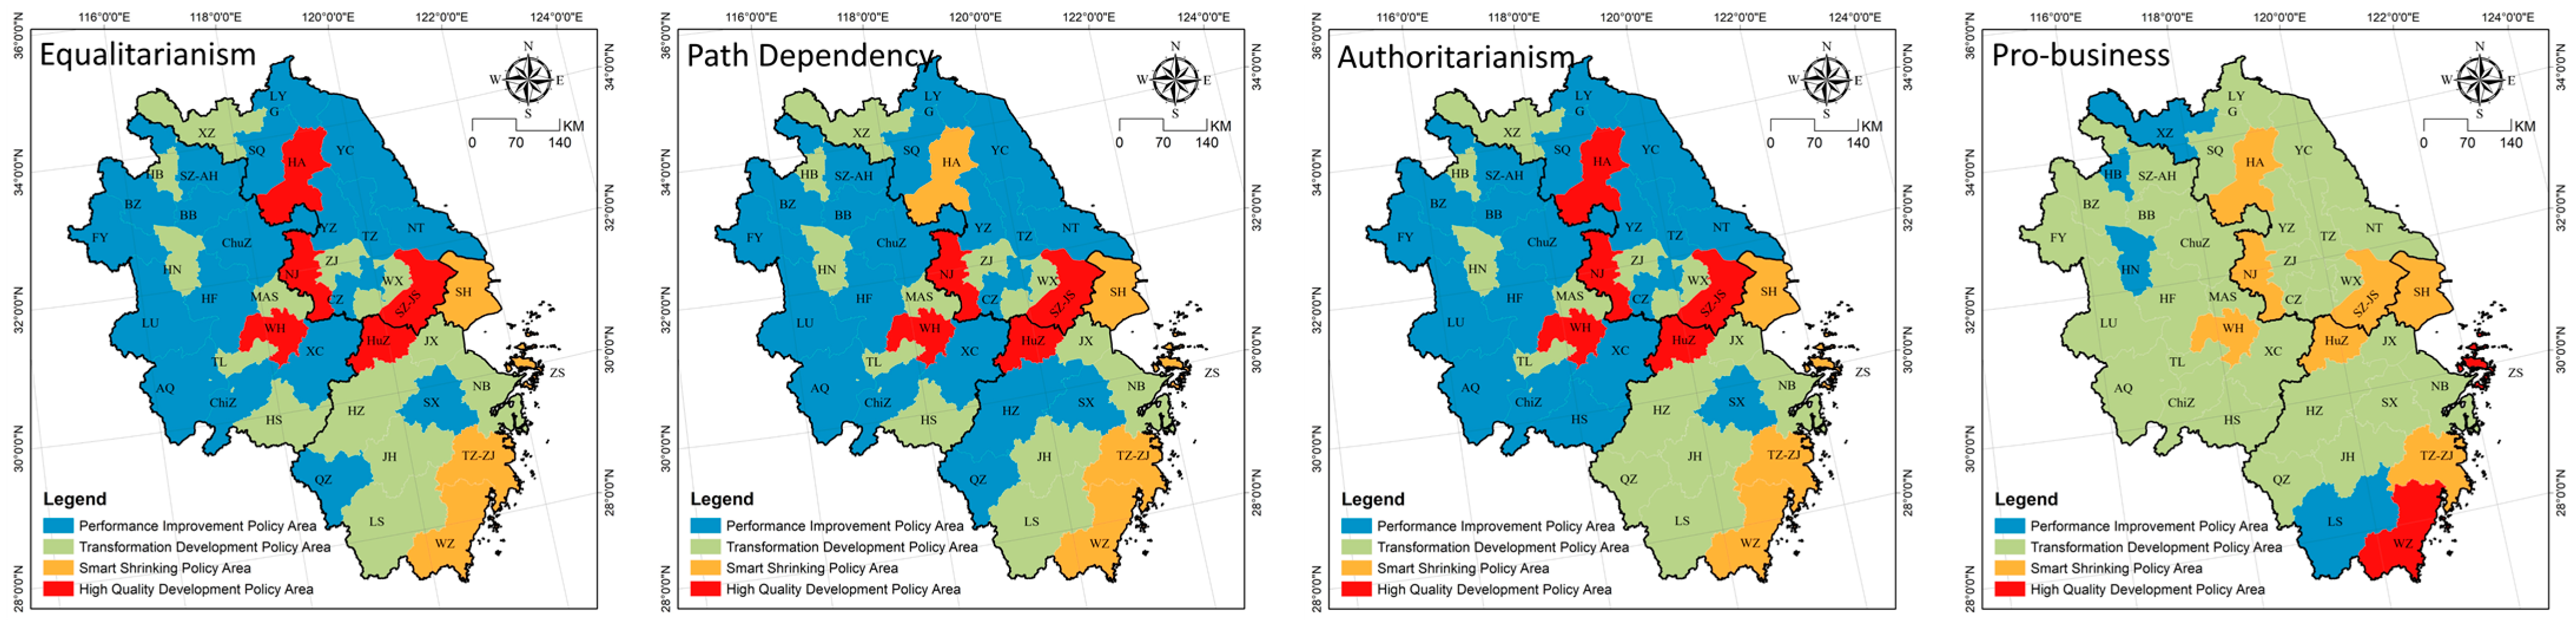
From the static mismatch analysis, the YRD was still in a better state with negative and positive matching as the dominant trends. It should be noted that more and more cities experienced negative mismatching, and the cities with a higher contribution to the spatial mismatch index were clustered in the Shanghai–Nanjing–Hefei–Hangzhou development corridor. From the dynamic mismatch analysis, most cities experienced decoupling, but the sub-category analysis revealed that more and more cities were in an unhealthy state. The dynamic analysis results were more suitable for urban industrial land management than the static ones. The results of the four indicators of added value, employed population, total assets, and gross profit and the four scenarios of equalitarianism, path dependency, authoritarianism, and pro-business varied greatly. The government should choose the optimal solution according to the actual conditions present in practical applications.
(4)
With transformations in urban development, the evolution of industrial land has become more differentiated, and the homogenized land resource allocation policy can no longer meet new development needs and trends. Based on the results of the dynamic mismatch analysis and the static and spatio-temporal evolution analysis, the YRD was classified into four types of policy areas, including the high-quality development policy area, performance improvement policy area, smart shrinking policy area, and transformation development policy area, with proposals for differentiated response strategies for each type of policy area.
Compared to factors in production, such as labor, finance, and capital, land resources are more serious and difficult to improve due to their spatial immobility in terms of mismatches. In the context of sustainable development, governments around the world should strengthen the monitoring and research of urban industrial land mismatches and propose strategies to correct land resource mismatches and achieve a dynamic balance between supply and demand. The research framework and analytical results of this paper are applicable not only to China but also to rapidly industrializing countries such as India, Iran, Egypt, and Vietnam, as well as re-industrializing countries such as the United States, Germany, and Japan. Land resource mismatches are is closely related to the national land management system, the degree of factor market development, and the stage of industrial economic development. Therefore, when the findings of this paper are applied in other countries or when new case studies are conducted, it is important to take into account their differences from China and make adaptations.
Urban industrial land allocation includes spatial allocation and also involves industrial structure allocation, allocation methods, and timing, which may all have an impact on mismatching. Moreover, in the era of ecological civilization, both economic benefits and a balance between social equity and ecological safety are the goals of the allocation of urban industrial land. Due to the limitations of data availability, this paper only analyzed the degree of mismatches in the quantity of urban industrial land and its economic (added value, total assets, gross profit) and social (employed population) benefits, with little attention paid to the effects of structural and temporal mismatches, as well as the ecological effects of the mismatches. These are the shortcomings of this paper and also the directions for our research efforts in the future.

Author Contributions

Conceptualization, K.L. and C.Z.; methodology, C.Z. and K.L.; software, C.Z., W.L. and Y.Z.; validation, C.Z., D.Y. and K.L.; formal analysis, C.Z., W.L. and K.L.; investigation, C.Z. and Y.Z.; resources, K.L. and D.Y.; data curation, C.Z. and W.L.; writing—original draft preparation, C.Z. and K.L.; writing—review and editing, D.Y. and K.L.; visualization, C.Z. and Y.Z.; supervision, K.L. and D.Y.; project administration, D.Y. and C.Z.; funding acquisition, D.Y., K.L. and C.Z. All authors have read and agreed to the published version of the manuscript.

Funding

This research was funded by the Youth Fund Program of the National Natural Science Foundation of China, grant number 51908116.

Institutional Review Board Statement

Not applicable.

Informed Consent Statement

Not applicable.

Data Availability Statement

https://www.mohurd.gov.cn/index.html (accessed on 10 February 2022) and http://www.stats.gov.cn/ (accessed on 15 February 2022).

Conflicts of Interest

The authors declare no conflict of interest.

References

  1. Majeed, M.; Mushtaq, S.O.; Khan, J.I. Perspectives into the Industrialization Process of India Through the New Economic Geography Lens. J. Quant. Econ. 2022, 20, 437–458. [Google Scholar] [CrossRef]
  2. Grabowski, R.; Self, S. Industrialization and deindustrialization in Indonesia. Asia Pac. Policy Stud. 2020, 7, 95–111. [Google Scholar] [CrossRef]
  3. Obeng-Odoom, F. Industrial policy, economic theory, and ecological planning. Int. Rev. Appl. Econ. 2022, 36, 285–290. [Google Scholar] [CrossRef]
  4. Rajinipriya, M.; Nagalakshmaiah, M.; Robert, M.; Elkoun, S. Importance of Agricultural and Industrial Waste in the Field of Nanocellulose and Recent Industrial Developments of Wood Based Nanocellulose: A Review. ACS Sustain. Chem. Eng. 2018, 6, 2807–2828. [Google Scholar] [CrossRef]
  5. Li, T.; Liu, Y.; Lin, S.; Liu, Y.; Xie, Y. Soil Pollution Management in China: A Brief Introduction. Sustainability 2019, 11, 556. [Google Scholar] [CrossRef] [Green Version]
  6. Gao, J.; Qiao, W.; Ji, Q.; Yu, C.; Sun, J.; Ma, Z. Intensive-use-oriented identification and optimization of industrial land readjustment during transformation and development: A case study of Huai’an, China. Habitat Int. 2021, 118, 102451. [Google Scholar] [CrossRef]
  7. Park, J.-I.; Kim, J.-O. Does industrial land sprawl matter in land productivity? A case study of industrial parks of South Korea. J. Clean. Prod. 2022, 334, 130209. [Google Scholar] [CrossRef]
  8. Ustaoglu, E.; LaValle, C. Examining lag effects between industrial land development and regional economic changes: The Netherlands experience. PLoS ONE 2017, 12, e0183285. [Google Scholar] [CrossRef] [Green Version]
  9. Lin, Y.; Qin, Y.; Yang, Y.; Zhu, H. Can price regulation increase land-use intensity? Evidence from China’s industrial land market. Reg. Sci. Urban Econ. 2020, 81, 103501. [Google Scholar] [CrossRef]
  10. Zhao, A.; Huang, J.; Ploegmakers, H.; Lan, J.; van der Krabbene, E.; Ma, X. Can land prices be used to curb urban industrial land expansion? An explanation from the perspective of substitutability of land in production. Int. J. Urban Sci. 2022, 1–21. [Google Scholar] [CrossRef]
  11. Yang, S.; Hu, S.; Li, W.; Zhang, C.; Song, D. Spatio-Temporal Nonstationary Effects of Impact Factors on Industrial Land Price in Industrializing Cities of China. Sustainability 2020, 12, 2792. [Google Scholar] [CrossRef] [Green Version]
  12. Chen, W.; Shen, Y.; Wang, Y. Does industrial land price lead to industrial diffusion in China? An empirical study from a spatial perspective. Sustain. Cities Soc. 2018, 40, 307–316. [Google Scholar] [CrossRef]
  13. Chen, W.; Shen, Y.; Wang, Y.; Wu, Q. How do industrial land price variations affect industrial diffusion? Evidence from a spatial analysis of China. Land Use Policy 2018, 71, 384–394. [Google Scholar] [CrossRef]
  14. Zheng, X.; Geng, B.; Wu, X.; Lv, L.; Hu, Y. Performance Evaluation of Industrial Land Policy in China. Sustainability 2014, 6, 4823–4838. [Google Scholar] [CrossRef] [Green Version]
  15. Silva, F.B.E.; Koomen, E.; Diogo, V.; Lavalle, C. Estimating Demand for Industrial and Commercial Land Use Given Economic Forecasts. PLoS ONE 2014, 9, e91991. [Google Scholar] [CrossRef] [Green Version]
  16. Ustaoglu, E.; E Silva, F.B.; LaValle, C. Quantifying and modelling industrial and commercial land-use demand in France. Environ. Dev. Sustain. 2020, 22, 519–549. [Google Scholar] [CrossRef]
  17. Aghmashhadi, A.H.; Zahedi, S.; Kazemi, A.; Fürst, C.; Cirella, G.T. Conflict Analysis of Physical Industrial Land Development Policy Using Game Theory and Graph Model for Conflict Resolution in Markazi Province. Land 2022, 11, 501. [Google Scholar] [CrossRef]
  18. Hu, J.; Liang, J.; Fang, J.; He, H.; Chen, F. How do industrial land price and environmental regulations affect spatiotemporal variations of pollution-intensive industries? Regional analysis in China. J. Clean. Prod. 2022, 333, 130035. [Google Scholar] [CrossRef]
  19. Aragonés-Beltrán, P.; Aznar, J.; Ferrís-Oñate, J.; García-Melón, M. Valuation of urban industrial land: An analytic network process approach. Eur. J. Oper. Res. 2008, 185, 322–339. [Google Scholar] [CrossRef]
  20. Theys, T.; Deschacht, N.; Adriaensens, S.; Verhaest, D. Spatial mismatch, education and language skills in the Brussels metropolis: An analysis. Bruss. Stud. 2020, 136. [Google Scholar] [CrossRef] [Green Version]
  21. Martin, R.W. Spatial Mismatch and the Structure of American Metropolitan Areas, 1970–2000. J. Reg. Sci. 2004, 44, 467–488. [Google Scholar] [CrossRef]
  22. Durst, N.J. Land-use regulation and the spatial mismatch between housing and employment opportunities. Proc. Inst. Civ. Eng. Urban Des. Plan. 2021, 174, 37–44. [Google Scholar] [CrossRef]
  23. Yue, W.; Wang, T.; Liu, Y.; Zhang, Q.; Ye, X. Mismatch of morphological and functional polycentricity in Chinese cities: An evidence from land development and functional linkage. Land Use Policy 2019, 88, 104176. [Google Scholar] [CrossRef]
  24. Ferrara, A.; Salvati, L.; Sabbi, A.; Colantoni, A. Soil resources, land cover changes and rural areas: Towards a spatial mismatch? Sci. Total Environ. 2014, 478, 116–122. [Google Scholar] [CrossRef] [PubMed]
  25. Belay, K.; Manig, W. Access to rural land in Eastern Ethiopia: Mismatch between policy and reality. J. Agric. Rural. Dev. Trop. Subtrop. 2004, 105, 123–138. [Google Scholar]
  26. Sun, W.; Jin, H.; Chen, Y.; Hu, X.; Li, Z.; Kidd, A.; Liu, C. Spatial mismatch analyses of school land in China using a spatial statistical approach. Land Use Policy 2021, 108, 105543. [Google Scholar] [CrossRef]
  27. Chen, W.; Chi, G. Spatial mismatch of ecosystem service demands and supplies in China, 2000–2020. Environ. Monit. Assess. 2022, 194, 295. [Google Scholar] [CrossRef]
  28. Deng, Y.; Liu, J.; Luo, A.; Wang, Y.; Xu, S.; Ren, F.; Su, F. Spatial Mismatch between the Supply and Demand of Urban Leisure Services with Multisource Open Data. ISPRS Int. J. Geo-Inf. 2020, 9, 466. [Google Scholar] [CrossRef]
  29. Le, K. Land use restrictions, misallocation in agriculture, and aggregate productivity in Vietnam. J. Dev. Econ. 2020, 145, 102465. [Google Scholar] [CrossRef] [Green Version]
  30. He, Q.; Du, J. The impact of urban land misallocation on inclusive green growth efficiency: Evidence from China. Environ. Sci. Pollut. Res. 2022, 29, 3575–3586. [Google Scholar] [CrossRef]
  31. Li, X.; Huang, K. Element Mismatch Change in China’s Industrial Sector: Theory and Demonstration. Economist 2016, 9, 68–76. [Google Scholar] [CrossRef]
  32. Zhao, X.; Ye, Y.; Zhang, L.; Wang, J. Study on Spatial Mismatch of Urban Industrial Land Allocation in China. China Land Sci. 2021, 35, 75–86. [Google Scholar] [CrossRef]
  33. Deng, C.; Zhao, H.; Xie, B.; Li, Z.; Li, K. The Impacts of Land Misallocation on Urban Industrial Green Total-Factor Productivity in China. J. Geogr. 2021, 76, 1865–1881. [Google Scholar] [CrossRef]
  34. Li, J.; Lu, X.; Kuang, B.; Cai, D. How does the Industrial Land Misallocation Affect Regional Green Development? China Land Sci. 2021, 35, 43–50. [Google Scholar] [CrossRef]
  35. Li, Y.; Luo, H. Does land resource misallocation hinder the upgrading of industrial structure? Empirical evidence from Chinese 35 large and medium-sized cities. J. Financ. Econ. 2017, 43, 110–121. [Google Scholar] [CrossRef]
  36. Liu, J.; Jiang, Z.; Chen, W. Land misallocation and urban air quality in China. Environ. Sci. Pollut. Res. 2021, 28, 58387–58404. [Google Scholar] [CrossRef]
  37. Du, W.; Li, M. The impact of land resource mismatch and land marketization on pollution emissions of industrial enterprises in China. J. Environ. Manag. 2021, 299, 113565. [Google Scholar] [CrossRef]
  38. Ma, A.; He, Y.; Tang, P. Understanding the Impact of Land Resource Misallocation on Carbon Emissions in China. Land 2021, 10, 1188. [Google Scholar] [CrossRef]
  39. Li, M.; Zang, J.; Luo, H.; Yu, Y. Spatial Mismatch Between Economic Development and Pollution Emission. Ecol. Environ. Sci. 2013, 22, 1620–1624. [Google Scholar] [CrossRef]
  40. Chari, A.; Liu, E.M.; Wang, S.-Y.; Wang, Y. Property Rights, Land Misallocation, and Agricultural Efficiency in China. Rev. Econ. Stud. 2021, 88, 1831–1862. [Google Scholar] [CrossRef]
  41. Zhang, J.; Shi, Z.; Chu, X.; Shen, Y. The effect of the spatial misallocation of land supply on entrepreneurial activity. Appl. Econ. Lett. 2021, 28, 949–953. [Google Scholar] [CrossRef]
  42. Gao, X.; Wang, S.; Ahmad, F.; Chandio, A.A.; Ahmad, M.; Xue, D. The nexus between misallocation of land resources and green technological innovation: A novel investigation of Chinese cities. Clean Technol. Environ. Policy 2021, 23, 2101–2115. [Google Scholar] [CrossRef]
  43. Qu, Y.; Zhang, Z.; Feng, Y. Effects of Land Finance on Resource Misallocation in Chinese Cities during 2003–2017: A Dynamic Panel Econometric Analysis. Discret. Dyn. Nat. Soc. 2020, 2020, 2639024. [Google Scholar] [CrossRef]
  44. Huang, Z.; Du, X. Government intervention and land misallocation: Evidence from China. Cities 2017, 60, 323–332. [Google Scholar] [CrossRef]
  45. Huang, Z.; Du, X. Strategic interaction in local governments’ industrial land supply: Evidence from China. Urban Stud. 2017, 54, 1328–1346. [Google Scholar] [CrossRef]
  46. Zhang, D.; Zhang, J.; Han, R.; Zhan, D. Two-stage development, allocation strategies’ effect, and industrial land policies’ adjustment, China. Growth Chang. 2022, 53, 890–909. [Google Scholar] [CrossRef]
  47. Rahman, A.H.; Gandhi, D.K.; Smith, J.B. Industrial Land-Value and Asset Size—Theory and Evidence. Can. J. Adm. Sci. Rev. Can. Sci. Adm. 1994, 11, 177–180. [Google Scholar] [CrossRef]
  48. Zhu, J. The impact of industrial land use policy on industrial change. Land Use Policy 2000, 17, 21–28. [Google Scholar] [CrossRef]
  49. Li, X.; Zhang, J.; Guo, J. Analysis of Intensive Utilization Potential of Industrial Land at Enterprise Scale. In Proceedings of the 26th International Conference on Geoinformatics, Kunming, China, 28–30 June 2018. [Google Scholar]
  50. Zhou, L.; Tian, L.; Cao, Y.; Yang, L. Industrial land supply at different technological intensities and its contribution to economic growth in China: A case study of the Beijing-Tianjin-Hebei region. Land Use Policy 2021, 101, 105087. [Google Scholar] [CrossRef]
  51. Liu, S.-C.; Lin, Y.-B.; Ye, Y.-M.; Xiao, W. Spatial-temporal characteristics of industrial land use efficiency in provincial China based on a stochastic frontier production function approach. J. Clean. Prod. 2021, 295, 126432. [Google Scholar] [CrossRef]
  52. Dai, P.; Sheng, R.; Miao, Z.; Chen, Z.; Zhou, Y. Analysis of Spatial–Temporal Characteristics of Industrial Land Supply Scale in Relation to Industrial Structure in China. Land 2021, 10, 1272. [Google Scholar] [CrossRef]
  53. Zhang, J.; Zhang, D.; Huang, L.; Wen, H.; Zhao, G.; Zhan, D. Spatial distribution and influential factors of industrial land productivity in China’s rapid urbanization. J. Clean. Prod. 2019, 234, 1287–1295. [Google Scholar] [CrossRef]
  54. Zhang, L.; Bi, X.; Huang, Z. Urban industrial land use efficiency under the background of economic transformation in the Yangtze River Economic Belt. Resour. Sci. 2020, 42, 1728–1738. [Google Scholar] [CrossRef]
  55. Huang, Z.J.; Zhu, S.J.; Shi, T. Industrial Land Transfer, Technological Relatedness and Industrial Entry Dynamics. Econ. Geogr. 2022, 42, 144–155. [Google Scholar] [CrossRef]
  56. Zhao, S.; Li, W.; Zhao, K.; Zhang, P. Change Characteristics and Multilevel Influencing Factors of Real Estate Inventory—Case Studies from 35 Key Cities in China. Land 2021, 10, 928. [Google Scholar] [CrossRef]
  57. Zhao, S.; Zhang, P.; Li, W. A Study on Evaluation of Influencing Factors for Sustainable Development of Smart Construction Enterprises: Case Study from China. Buildings 2021, 11, 221. [Google Scholar] [CrossRef]
  58. Kain, J.F. Housing Segregation, Negro Employment, and Metropolitan Decentralization. Q. J. Econ. 1968, 82, 175. [Google Scholar] [CrossRef]
  59. Tapio, P. Towards a theory of decoupling: Degrees of decoupling in the EU and the case of road traffic in Finland between 1970 and 2001. Transp. Policy 2005, 12, 137–151. [Google Scholar] [CrossRef] [Green Version]
  60. Ma, Y.; Zhang, P.; Zhao, K.; Zhou, Y.; Zhao, S. A Dynamic Performance and Differentiation Management Policy for Urban Construction Land Use Change in Gansu, China. Land 2022, 11, 942. [Google Scholar] [CrossRef]
  61. Longhofer, W.; Jorgenson, A. Decoupling reconsidered: Does world society integration influence the relationship between the environment and economic development? Soc. Sci. Res. 2017, 65, 17–29. [Google Scholar] [CrossRef]
  62. Zhang, P.; Hu, J.; Zhao, K.; Chen, H.; Zhao, S.; Li, W. Dynamics and Decoupling Analysis of Carbon Emissions from Construction Industry in China. Buildings 2022, 12, 257. [Google Scholar] [CrossRef]
  63. Miyamoto, S.; Chacon, A.; Hossain, M.; Martinez, L. Soil salinity of urban turf areas irrigated with saline water I. Spatial variability. Landsc. Urban Plan. 2005, 71, 233–241. [Google Scholar]
  64. Ruan, B.Q.; Xu, F.R.; Jiang, R.F. Analysis on spatial and temporal variability of groundwater level based on spherical sampling model. J. Hydraul. Eng. 2008, 39, 573–579. [Google Scholar]
  65. Zhao, S.; Zhao, K.; Zhang, P. Spatial Inequality in China’s Housing Market and the Driving Mechanism. Land 2021, 10, 841. [Google Scholar] [CrossRef]
  66. She, D.L.; Shao, M.A.; Yu, S.G. Spatial Variability of Soil Water Content on a Cropland-grassland Mixed Slope Land in the Loess Plateau, China. Trans. Chin. Soc. Agric. Mach. 2010, 41, 57–63. [Google Scholar]
  67. Li, L.; Zhao, K.; Wang, X.; Zhao, S.; Liu, X.; Li, W. Spatio-Temporal Evolution and Driving Mechanism of Urbanization in Small Cities: Case Study from Guangxi. Land 2022, 11, 415. [Google Scholar] [CrossRef]
  68. Li, W.; Zhang, P.; Zhao, K.; Zhao, S. The Geographical Distribution and Influencing Factors of COVID-19 in China. Trop. Med. Infect. Dis. 2022, 7, 45. [Google Scholar] [CrossRef]
  69. Li, S.-M. Housing Inequalities under Market Deepening: The Case of Guangzhou, China. Environ. Plan. A Econ. Space 2012, 44, 2852–2866. [Google Scholar] [CrossRef]
  70. Watson, S.I. Efficient design of geographically-defined clusters with spatial autocorrelation. J. Appl. Stat. 2021. [Google Scholar] [CrossRef]
  71. Zhang, P.; Li, W.; Zhao, K.; Zhao, S. Spatial Pattern and Driving Mechanism of Urban–Rural Income Gap in Gansu Province of China. Land 2021, 10, 1002. [Google Scholar] [CrossRef]
  72. Wang, J.-F.; Li, X.-H.; Christakos, G.; Liao, Y.-L.; Zhang, T.; Gu, X.; Zheng, X.-Y. Geographical detectors-based health risk assessment and its application in the neural tube defects study of the Heshun region, China. Int. J. Geogr. Inf. Sci. 2010, 24, 107–127. [Google Scholar] [CrossRef]
  73. Wang, J.F.; Xu, C.D. Geodetector: Principle and prospective. Acta Geogr. Sin. 2017, 72, 116–134. [Google Scholar]
  74. Zhao, S.; Zhang, C.; Qi, J. The Key Factors Driving the Development of New Towns by Mother Cities and Regions: Evidence from China. ISPRS Int. J. Geo-Inf. 2021, 10, 223. [Google Scholar] [CrossRef]
  75. Zhao, S.; Yan, Y.; Han, J. Industrial Land Change in Chinese Silk Road Cities and Its Influence on Environments. Land 2021, 10, 806. [Google Scholar] [CrossRef]
  76. Louw, E.; Van Der Krabben, E.; Van Amsterdam, H. The Spatial Productivity of Industrial Land. Reg. Stud. 2012, 46, 137–147. [Google Scholar] [CrossRef] [Green Version]
  77. Wang, Y.; Gu, H.; Zhou, L.; Shen, T. Spatial Patterns and Evolving Characteristics of Industrial Land Conveyance in China from 2007 to 2016. Areal Res. Dev. 2018, 37, 148–154. [Google Scholar] [CrossRef]
  78. Wang, C.; Zhu, G.; Huang, J.; Zou, W. Study on Temporal and Spatial Pattern Evolution and Driving Factors of Market Level of Industrial Land in the Yangtze River Economic Belt. Resour. Environ. Yangtze Basin 2022, 31, 823–831. [Google Scholar] [CrossRef]
  79. Cui, X.; Meng, X.; Wang, D. Regional Differences and Convergence Characteristics of Industrial Land Marketization in Urban Agglomerations of China from the Spatial Perspective. China Land Sci. 2020, 34, 34–43. [Google Scholar] [CrossRef]
  80. Mei, L.; Wei, X. Industrial Land Allocation, Spatial Heterogeneity and Industrial Efficiency. Res. Econ. Manag. 2022, 43, 78–96. [Google Scholar] [CrossRef]
  81. Dai, X.; Cheng, L. Aggregate productivity losses from factor misallocation across Chinese manufacturing firms. Econ. Syst. 2019, 43, 30–41. [Google Scholar] [CrossRef]
  82. Zhao, S.; Zhao, K.; Yan, Y.; Zhu, K.; Guan, C. Spatio-Temporal Evolution Characteristics and Influencing Factors of Urban Service-Industry Land in China. Land 2022, 11, 13. [Google Scholar] [CrossRef]
  83. Restuccia, D.; Rogerson, R. Misallocation and productivity. Rev. Econ. Dyn. 2013, 16, 1–10. [Google Scholar] [CrossRef] [Green Version]
  84. Bun, M.J.; de Winter, J. Capital and labor misallocation in the Netherlands. J. Prod. Anal. 2022, 57, 93–113. [Google Scholar] [CrossRef]
  85. Zhang, Q.; Yang, L.; Liu, C. Vertical structure, capital misallocation and capital allocation efficiency of the real economy. Econ. Plan. 2021, 54, 557–584. [Google Scholar] [CrossRef]
  86. Monge-Naranjo, A.; Sánchez, J.M.; Santaeulàlia-Llopis, R. Natural Resources and Global Misallocation. Am. Econ. J. Macroecon. 2019, 11, 79–126. [Google Scholar] [CrossRef]
  87. Le, P. Capital Misallocation and State Ownership Policy in Vietnam. Econ. Rec. 2022. [Google Scholar] [CrossRef]
  88. Chen, B.; Lin, J.Y. Development strategy, resource misallocation and economic performance. Struct. Chang. Econ. Dyn. 2021, 59, 612–634. [Google Scholar] [CrossRef]
  89. Xu, Y. Industrial Land Supply in Four Types of Regions of China—An Explanation form NEG. Econ. Theory Bus. Manag. 2015, 35, 87–96. [Google Scholar]
  90. Hudalah, D.; Viantari, D.; Firman, T.; Woltjer, J. Industrial Land Development and Manufacturing Deconcentration in Greater Jakarta. Urban Geogr. 2013, 34, 950–971. [Google Scholar] [CrossRef]
  91. Li, C.; Gao, X.; Wu, J.; Wu, K. Demand prediction and regulation zoning of urban-industrial land: Evidence from Beijing-Tianjin-Hebei Urban Agglomeration, China. Environ. Monit. Assess. 2019, 191, 412. [Google Scholar] [CrossRef]
  92. Whittemore, A.H. Racial and Class Bias in Zoning: Rezonings Involving Heavy Commercial and Industrial Land Use in Durham (NC), 1945–2014. J. Am. Plan. Assoc. 2017, 83, 235–248. [Google Scholar] [CrossRef]
  93. Wang, K.; Li, G.; Liu, H. Industrial Land Reduction, High-Quality Economic Development and Local Fiscal Revenue. Financ. Res. 2019, 9, 33–46+61. [Google Scholar] [CrossRef]
  94. Zhao, X.; Zhang, L.; Huang, X.; Zhao, Y.; Zhang, Y. Evolution of the Spatiotemporal Pattern of Urban Industrial Land Use Efficiency in China. Sustainability 2018, 10, 2174. [Google Scholar] [CrossRef] [Green Version]
  95. Dai, B.; Gu, X.; Xie, B. Policy Framework and Mechanism of Life Cycle Management of Industrial Land (LCMIL) in China. Land Use Policy 2020, 99, 104997. [Google Scholar] [CrossRef]
  96. Tian, Y.; Zhou, D.; Jiang, G. A new quality management system of admittance indicators to improve industrial land use efficiency in the Beijing−Tianjin−Hebei region. Land Use Policy 2021, 107, 105456. [Google Scholar] [CrossRef]
  97. Lin, S.-W.; Ben, T.-M. Impact of government and industrial agglomeration on industrial land prices: A Taiwanese case study. Habitat Int. 2009, 33, 412–418. [Google Scholar] [CrossRef]
  98. Lester, T.W.; Kaza, N.; Kirk, S. Making Room for Manufacturing: Understanding Industrial Land Conversion in Cities. J. Am. Plan. Assoc. 2013, 79, 295–313. [Google Scholar] [CrossRef]
  99. Shu, H.; Xiong, P.-P. Reallocation planning of urban industrial land for structure optimization and emission reduction: A practical analysis of urban agglomeration in China’s Yangtze River Delta. Land Use Policy 2019, 81, 604–623. [Google Scholar] [CrossRef]
  100. Needham, B.; Louw, E.; Metzemakers, P. An economic theory for industrial land policy. Land Use Policy 2013, 33, 227–234. [Google Scholar] [CrossRef]
  101. Yin, G.; Lin, Z.; Jiang, X.; Qiu, M.; Sun, J. How do the industrial land use intensity and dominant industries guide the urban land use? Evidences from 19 industrial land categories in ten cities of China. Sustain. Cities Soc. 2020, 53, 101978. [Google Scholar] [CrossRef]
  102. Zhang, L.; Zhao, Y.; Liu, Y.; Qian, J. Does the Land Price Subsidy Still Exist against the Background of Market Reform of Industrial Land? Land 2021, 10, 963. [Google Scholar] [CrossRef]
Figure 1. Study area.
Land 11 01390 g001
Figure 2. Boston Consulting Group matrix.
Land 11 01390 g002
Figure 3. Decoupling Index.
Land 11 01390 g003
Figure 4. Research steps.
Land 11 01390 g004
Figure 5. Change analysis of urban industrial land in the YRD.
Land 11 01390 g005
Figure 6. Spatial heterogeneity analysis of urban industrial land in the YRD.
Land 11 01390 g006
Figure 7. Spatial cluster analysis of urban industrial land in the YRD.
Land 11 01390 g007
Figure 8. Spatial autocorrelation analysis of urban industrial land in the YRD.
Land 11 01390 g008
Figure 9. Spatial pattern analysis on changes in urban industrial land in the YRD.
Land 11 01390 g009
Figure 10. Analysis of the spatial mismatch types in the YRD.
Land 11 01390 g010
Figure 11. Analysis of the mismatch index contribution rate in the YRD.
Land 11 01390 g011
Figure 12. Spatial analysis of the decoupling types in the YRD.
Land 11 01390 g012
Figure 13. Spatial analysis of decoupling types based on different weights in the YRD.
Land 11 01390 g013
Figure 14. Analysis of the zoning management in the YRD.
Land 11 01390 g014
Table 1. Variable composition, type, and code.
TypeIndicator NameUnitCode
Independent.PopulationPeopleX1
GDPBillion $X2
Government RevenueBillion $X3
Per Capita GDPBillion $X4
Urbanization Rate%X5
Land Used for Utilitieskm2X6
Road LengthkmX7
Land Used for Logistics and Storage km2X8
Land Used for Commercial and Other Services km2X9
Added Value of Tertiary IndustryBillion $X10
Import and Export TradeBillion $X11
Foreign Direct InvestmentBillion $X12
Authorized PatentPiecesX13
Higher Education InstitutionsPiecesX14
Government Investment in Science and TechnologyBillion $X15
DependentUrban Industrial Landkm2Y
OtherAdded ValueBillion $Z1
Employed PopulationPeopleZ2
Total AssetsBillion $Z3
Gross ProfitBillion $Z4
Table 2. The implications in urban industrial land consumption and manufacturing economic growth 2010–2019.
Added ValueEmployed PopulationTotal AssetsGross Profit
20102019201020192010201920102019
1Shanghai9.6219.150.210.3331.7864.483.105.44
2Suzhou-JS12.5553.710.340.7335.89111.482.636.89
3Hangzhou27.8937.260.580.6278.29103.358.098.95
4Nanjing27.5229.840.480.2459.2253.238.453.58
5Hefei31.9733.680.320.3595.2482.967.226.52
6Ningbo12.4332.130.300.7735.6898.712.897.17
7Changzhou13.3224.950.310.6730.5144.543.322.56
8Shaoxing6.5016.280.260.2028.2245.172.895.07
9Wuxi9.1130.530.250.4315.8332.991.702.44
10Wuhu11.9125.580.230.2423.3155.132.730.81
11Yancheng20.2840.910.281.0948.2660.725.442.14
12Lianyungang13.6420.760.260.1933.1739.753.432.70
13Taizhou-JS12.0731.870.241.2131.5160.082.834.35
14Nantong11.7517.820.210.3624.9231.393.032.30
15Jiaxing33.7435.661.710.99107.47106.259.528.34
16Yangzhou13.4525.540.420.3841.4769.723.745.97
17Maanshan17.06146.090.632.1238.51210.942.7315.33
18Huzhou10.8519.610.540.3636.5558.862.573.63
19Chuzhou9.2922.850.310.4722.9852.441.593.46
20Quzhou7.7724.660.720.8731.5461.831.735.27
21Xuzhou11.3312.560.540.2436.8332.951.621.60
22Tongling9.2310.720.230.1322.6136.081.672.56
23Suqian26.6655.280.790.6793.34142.685.733.33
24Taizhou-ZJ8.9623.960.460.6324.1847.201.512.85
25Bozhou20.9628.300.550.2169.8988.557.616.00
26Bengbu15.7326.300.410.9131.6878.014.462.78
27Huai’an19.9164.070.511.1146.38209.253.0911.55
28Zhenjiang8.3418.440.210.3716.7232.141.771.70
29Suzhou-AH17.3616.921.160.4096.9656.312.754.03
30Fuyang14.2917.960.300.2732.7254.033.112.81
31Anqing12.8011.720.760.3649.1933.002.593.55
32Chizhou30.9116.990.720.3879.0454.002.923.00
33Xuancheng6.2911.550.160.2310.0419.900.851.42
34Jinhua10.4512.740.300.2712.9517.952.341.37
35Lu’an5.3818.970.140.3011.2135.991.433.43
36Zhoushan10.1814.090.610.3321.0524.482.261.77
37Lishui7.5817.730.400.3514.7231.942.063.09
38Huangshan4.3418.390.300.8711.9125.852.361.82
39Wenzhou9.0619.780.180.2711.6842.102.683.33
40Huaibei14.6734.640.170.3528.2463.562.037.96
41Huainan5.439.330.020.0813.4521.481.511.44
Table 3. Factor detection analysis results of Geodetector in the YRD.
X1X2X3X4X5X6X7X8X9X10X11X12X13X14X15
2010q0.560.560.560.090.510.670.440.650.580.540.520.560.450.550.53
p0.040.030.030.080.040.000.010.0000.010.050.000.020.020.020.01
2019q0.620.680.680.350.530.550.520.580.580.670.540.640.570.460.65
p0.010.000.0000.040.030.010.010.040.000.000.000.000.000.010.000
Table 4. Interactive detection analysis results of Geodetector in the YRD (2010).
X1X2X3X4X5X6X7X8X9X10X11X12X13X14X15
X10.558
X20.5760.561
X30.5820.5810.557
X40.5730.5720.5680.090
X50.9920.9900.9880.5240.507
X60.9940.9910.9870.6740.9800.666
X70.9960.9900.9890.4590.9800.6770.445
X80.9920.9930.9980.6630.9690.6770.6890.648
X90.9990.9990.9990.5870.9990.6920.5870.6950.576
X100.5810.5740.5720.5560.9820.9830.9820.9981.0000.545
X110.9920.9960.9970.5400.9930.9950.6760.9900.6900.9970.520
X120.5750.5730.5810.5690.9880.9910.9900.9911.0000.5750.9930.558
X130.5760.5760.5810.4750.9830.9940.6880.9890.6900.5810.6820.5740.454
X140.9910.9930.9970.5620.5670.9930.9960.9880.9990.9970.9830.9900.9830.550
X150.5740.5760.5680.5460.9750.9850.9800.9880.9960.5630.9800.5750.5720.9890.534
Table 5. Interactive detection analysis results of Geodetector in the YRD (2019).
X1X2X3X4X5X6X7X8X9X10X11X12X13X14X15
X10.619
X20.9890.677
X30.9880.6940.677
X40.6540.6970.6910.351
X50.6520.6990.6910.5540.528
X60.6410.9880.9860.6400.6380.551
X70.6520.9830.9870.5540.6530.6320.517
X80.6540.9910.9900.6520.6440.5990.6430.581
X90.6370.9890.9900.6420.6450.6040.6210.6170.579
X100.9850.6850.6870.6910.6950.9840.9810.9890.9870.673
X110.9780.9830.9860.5960.9680.9680.6890.9710.9640.9820.538
X120.9750.6940.6900.6860.6760.9520.9630.9910.9600.6870.9700.638
X130.9860.6950.6880.6010.6770.9810.6970.9790.9810.6880.6850.6850.565
X140.6480.6920.6940.4930.5540.6430.6420.6390.6350.6910.9660.6790.6820.463
X150.9830.6910.6930.6910.6870.9550.9640.9880.9620.6910.9700.6630.6890.6900.648
Table 6. Average interaction force and enhancement range in the YRD.
Average Interaction ForceAverage Enhancement Range
2010201920102019
X10.790.820.270.25
X20.780.820.270.25
X30.780.820.270.25
X40.560.630.010.04
X50.920.670.400.10
X60.900.800.390.23
X70.830.760.310.18
X80.900.810.390.24
X90.850.800.340.23
X100.780.820.270.25
X110.890.910.380.33
X120.780.810.270.24
X130.710.770.190.19
X140.930.670.410.09
X150.780.810.260.24
Table 7. Average value of spatial mismatch index in the YRD.
Added ValueEmployed PopulationTotal AssetsGross Profit
PositiveNegativePositiveNegativePositiveNegativePositiveNegative
20100.48−0.340.63−0.490.61−0.280.79−0.26
20190.52−0.300.86−0.440.67−0.250.69−0.32
Table 8. Weighting schemes based on different value orientations in the YRD.
Added ValueEmployed PopulationTotal AssetsGross Profit
Equalitarianism2010 and 20190.250.250.250.25
Path Dependency20100.240.210.270.28
20190.220.220.270.30
Authoritarianism2010 and 20190.30.30.20.2
Pro-business2010 and 20190.20.20.30.3
Publisher’s Note: MDPI stays neutral with regard to jurisdictional claims in published maps and institutional affiliations.

