Article

Variation of Net Carbon Emissions from Land Use Change in the Beijing-Tianjin-Hebei Region during 1990–2020

1
Hebei Province Collaborative Innovation Center for Sustainable Utilization of Water Resources and Optimization of Industrial Structure, Hebei GEO University, Shijiazhuang 050031, China
2
School of Land Science and Space Planning, Hebei GEO University, Shijiazhuang 050031, China
3
Graduate School, Hebei GEO University, Shijiazhuang 050031, China
*
Author to whom correspondence should be addressed.
Land 2022, 11(7), 997; https://doi.org/10.3390/land11070997
Submission received: 1 June 2022 / Revised: 27 June 2022 / Accepted: 29 June 2022 / Published: 30 June 2022
(This article belongs to the Special Issue Rethinking the Man-Land Relations in China)

Abstract

:
Global increasing carbon emissions have triggered a series of environmental problems and greatly affected the production and living of human beings. This study estimated carbon emissions from land use change in the Beijing-Tianjin-Hebei region during 1990–2020 with the carbon emission model and explored major influencing factors of carbon emissions with the Logarithmic Mean Divisia Index (LMDI) model. The results suggested that the cropland decreased most significantly, while the built-up area increased significantly due to accelerated urbanization. The total carbon emissions in the study area increased remarkably from 112.86 million tons in 1990 to 525.30 million tons in 2020, and the built-up area was the main carbon source, of which the carbon emissions increased by 370.37%. Forest land accounted for 83.58–89.56% of the total carbon absorption but still failed to offset the carbon emission of the built-up area. Carbon emissions were influenced by various factors, and the results of this study suggested that the gross domestic product (GDP) per capita contributed most to the increase of carbon emissions in the study area, resulting in a cumulative increase of carbon emissions by 9.48 million tons, followed by the land use structure, carbon emission intensity per unit of land, and population size. By contrast, the land use intensity per unit of GDP had a restraining effect on carbon emissions, making the cumulative carbon emissions decrease by 103.26 million tons. This study accurately revealed the variation of net carbon emissions from land use change and the effects of influencing factors of carbon emissions from land use change in the Beijing-Tianjin-Hebei region, which can provide a firm scientific basis for improving the regional land use planning and for promoting the low-carbon economic development of the Beijing-Tianjin-Hebei region.

1. Introduction

The global increasing carbon emission under high carbon emission mechanisms has triggered a series of environmental problems, e.g., global climate anomalies, sea level rise, and frequent extreme weather events, which have greatly affected the production and living of human beings in recent decades [1,2]. Previous studies suggested that the land use system serves as a vital link between the human socio-economic system and the natural ecological environment, and the carbon emissions caused by land use change have been one of the important influencing factors of global warming [1,2,3]. In fact, various human activities, e.g., social construction, economic development, industrial arrangement, urban expansion, and energy consumption, are all closely related to the carbon emissions, all of which are ultimately implemented in different land use practices [4,5], and relevant land use change has been considered as the second most important influencing factor of the global increasing atmospheric CO2 content [6,7]. The 14th Five-Year Plan of China proposed to achieve the “peak carbon dioxide emissions” by 2030 and “carbon neutrality” by 2060, that the low-carbon economy should serve as a new economic growth mode in the future, and that new green energy sources should be developed to reduce the dependence of economic growth on the major fossil energy sources such as coal and oil [4]. It is, therefore, of practical significance to explore the regional carbon emissions from land use change to achieve low carbon land use, promote low carbon economic development, and establish a resource-conserving and environment-friendly society in this context [8,9].
Previous studies on carbon emissions from land use change at home and abroad were primarily concentrated on the spatiotemporal variation of different land use types and their relevant effects on carbon emissions, carbon emission accounting, influencing factors of land use change, and carbon emissions [10,11,12,13]. The Guidelines for the National Greenhouse Gas Inventories prepared by the Intergovernmental Panel on Climate Change (IPCC) provided a valuable methodological reference for accounting carbon emissions from land use change [13,14]. Besides, some scholars also proposed the emission coefficient method for the carbon emission accounting of cropland, forest land, grassland, and built-up area and explored the effects of land use change on carbon emissions [14,15,16]. In addition, most scholars have generally explored the influencing factors of carbon emissions with various econometric methods, such as the factor decomposition method [17,18], and some other scholars explored the drivers of carbon emissions with the Laspeyres decomposition method [19,20,21]. Moreover, more scholars carried out decomposition analyses based on the Logarithmic Mean Divisia Index (LMDI) model to reveal the influencing factors of carbon emissions in various relevant fields, e.g., carbon emissions per capita, carbon emissions due to industrial combustion energy, carbon emissions in the manufacturing industry, and drivers of carbon emissions from energy consumption for different time durations in China [22,23]. The results of these studies provided valuable methodological references for exploring a series of issues related to carbon emissions from land use change [24,25]. However, these existing studies focused more on some major land use types, such as cropland and built-up area, with less consideration of the carbon emissions from some other land use types [25,26]. In particular, there are relatively fewer quantitative studies on the influencing factors of carbon emissions from land use change, especially the studies on the influencing factors of carbon emissions from land use change with the LMDI model [6,27,28].
The Beijing-Tianjin-Hebei region, as one of the major urban agglomerations in China, accounted for 11–12% of the national total carbon emissions, which is higher than the national proportions of both gross domestic product (GDP) and the population of this region [5,12]. In particular, the goal of peak carbon dioxide emissions and carbon neutrality has put forward new and higher requirements for the synergistic development of this region [16,18,29]. This study estimated the net carbon emissions from land use change in the Beijing-Tianjin-Hebei region from the perspective of land use and decomposed the influencing factors of carbon emissions from land use change to quantitatively reveal the effects of these influencing factors on the carbon emissions from land use change, aiming to provide a firm scientific basis for improving the regional land use planning, promoting the low-carbon economic development, and guiding the development of the Beijing-Tianjin-Hebei region into the capital economy circle.

2. Materials and Methods

2.1. Study Area

The Beijing-Tianjin-Hebei region is located in the northern part of China (36°5′–42°40′ N, 113°27′–119°50′ E), which is one of the three major urban agglomerations in China [18,26,30]. There is very complex terrain in this region, where there are mainly higher mountains and plateaus in the northern and western parts and flatter plains in the southern and eastern parts (Figure 1). There is a warm-temperate continental monsoon climate in this region, with higher temperatures and precipitation in the summer. The Beijing-Tianjin-Hebei region is the political, economic, cultural, and scientific center of China and plays a strategically important role in the economic development of China [18]. The Beijing-Tianjin-Hebei region takes up approximately 2% of the total national land area, but it accounts for approximately 8.1% of the total national population and 9.44% of the total national GDP. However, there is very high energy consumption intensity along with rapid urbanization in the Beijing-Tianjin-Hebei region, leading to very high carbon emission. For example, the carbon emission in the Beijing-Tianjin-Hebei region reached 1.085 billion tons in 2018, accounting for about 1/9 of the total national carbon emissions of China [26,30]. Exploring the long time-series variation of net carbon emissions from land use change can provide valuable information for addressing the pressure of carbon emission reduction in the Beijing-Tianjin-Hebei region, especially in the context of the coordinated development of the Beijing-Tianjin-Hebei region [26,27].

2.2. Data and Processing

The spatial data used in this study includes the 1-km land use data extracted from the Land Use Remote Sensing Monitoring Data of China in 1990, 1995, 2000, 2005, 2010, 2015, and 2020 (http://www.resdc.cn, accessed on 31 October 2021), which were reverted from Landsat TM/ETM images. The land types were classified into cropland, forest land, grassland, water area, built-up area, and barren land [12,26], based on which this study explored the land use transfer matrix of the Beijing-Tianjin-Hebei region during 1990–2020. Besides, the non-spatial data used in this study mainly included the socioeconomic data (e.g., population and GDP), regional energy consumption data, and carbon emission coefficients of the Beijing-Tianjin-Hebei region, which were obtained from various issues of the China Statistical Yearbook, the China Energy Statistical Yearbook, IPCC reports, and the relevant literature. Finally, these data in different parts of the study area were combined to obtain the regional energy consumption amount and the carbon emission coefficients of different land use types, and these regional data were further summed up to obtain the relevant total data of the whole Beijing-Tianjin-Hebei region.

2.3. Carbon Emission Accounting Model and Carbon Emission Coefficients

The carbon emissions can be categorized into direct and indirect carbon emissions [27]. The former refers to carbon emissions caused by the processes of maintenance and conversion and specific land types, while the latter refers to carbon emissions generated by the land serving as a carrier of production and living processes of human beings [28,29]. A large number of studies have shown that some land use types may be both carbon sources and sinks, and the intensity of carbon sources and sinks generally varies greatly among different land use types [30,31]. This study primarily focused on the carbon emission effects of land use change caused by human activities, i.e., the amounting of carbon emissions and the sequestration of cropland, forest land, grassland, water body, built-up area, and barren land under the influence of human activities, and it finally summarized the carbon emission amount of different land use types. The major crops in the study area include wheat and maize, and these crops on cropland can absorb CO2 in the air through photosynthesis in general, but most of the crop biomass is then decomposed in the soil and released back into the air in the short term, so there are generally insignificant effects of crop biomass as a carbon sink. Meanwhile, the effects of cropland inputs and soil emissions on the carbon emissions can also be reflected with the carbon emission coefficient of cropland [30]. By contrast, carbon emissions from energy consumption and industrial activities such as housing, mining, and manufacturing and transportation are the main sources of carbon emissions. Thus, the built-up area and cropland generally serve as the carbon sources, with positive carbon emission coefficients, while the forest land, grassland, water body, and barren land generally serve as carbon sinks, which are carbon absorbers with negative carbon emission coefficients. The regional carbon emission can be estimated based on the carbon emission coefficients according to the guidelines of IPCC as follows:
E c = e i = A i × ξ i
where E c is the total carbon emission (or absorption) amount, e i is the carbon emission (or absorption) amount from the ith land use type, A i is the area of the ith land use type, and δ i is the carbon emission (or absorption) coefficient of the ith land use type.
The carbon emission (or absorption) coefficients of different land use types, which were assumed to keep stable during the study period, were determined as follows. The cropland that provides both carbon emission and carbon absorption serves as both a carbon source and carbon sink [29,30]. It is therefore necessary to take into account the greenhouse gas produced during the crop production and CO2 absorption of crops during the reproductive period, and the difference between the two can be used to estimate the net carbon emission coefficient of the cropland [22,24]. Previous studies have shown that the carbon emission coefficient and carbon sequestration coefficient of cropland are approximately 0.422 t/hm2 and 0.007 t/hm2, respectively [31,32], so this study took the difference between the two as the net carbon emission coefficient of cropland, i.e., 0.415 t/hm2. In addition, the forest land and grassland are the most important carbon sink and carbon sequestration systems in the terrestrial ecosystem, and previous studies have shown that the carbon emission coefficients of the forest land and grassland were −0.623 t/hm2 and −0.144 t/hm2, respectively [33,34], which were also adopted in this study. In addition, previous studies showed that there is very limited carbon absorption of the water body and barren land, generally with very weak impacts on the regional net carbon emissions [27,32]. However, the water body and barren land accounted for 4% of the total area in the Beijing-Tianjin-Hebei region, so this study still considered the carbon emission coefficients of the water body and barren land, which were approximately −0.03 t/hm2 and −0.05 t/hm2, respectively, according to the literature survey results [35,36,37]. Moreover, there are various types of built-up area, e.g., urban land, rural settlements, traffic roads, factories and mines, industrial areas, oil fields, salt fields, and quarries. The built-up area carries a large amount of the energy consumed in the production and living of human beings, and it is unfeasible to calculate the carbon emissions of the built-up area according to only the area share of built-up area [38,39]. It is necessary to estimate the carbon emissions from the built-up area based on the carbon emissions generated by the energy consumption of human beings on the built-up area [40,41], which can be estimated according to the carbon emission coefficient method of the IPCC as follows:
E C = m i × β i × θ i
where E C is the carbon emission from energy consumption on the built-up area, m i is the consumption amount of various fossil energy sources, β i is the standard coal conversion coefficient of each energy resource, and θ i is the carbon emission coefficient of each energy resource. This study used the standard coal conversion coefficient and carbon emission coefficient of each energy resource published by the IPCC guidelines [32,42,43], which are shown in Table 1.

2.4. Decomposition Analysis of Influencing Factors of Carbon Emissions

This study explored the influencing factors of carbon emissions with the LMDI model, which is one of the most widely used methods to explore the influencing factors of energy consumption in the field of low carbon economy due to its advantages such as high operability, full decomposition, no residuals, and unique results [36,37]. Specifically, this study analyzed the effects of different influencing factors on carbon emissions from land use change according to the Kaya identity by introducing the land use factor and establishing the formula of influencing factors of regional carbon emissions from five aspects, i.e., energy consumption structure, land output intensity, land use structure, economic growth, and population scale effect, as follows [41,42]:
C = C i L i × L i L × L G × G P × P
where C is the total carbon emissions from land use change (million tons), C i is the carbon emission amount of the ith land use type (million tons), L i is the area of the ith land use type (km2), L is the total land area of the study area (km2), G is the GDP (108 CNY), and P is the regional population size (104 persons).
Then, the regional total carbon emissions can be expressed as follows [40,42]:
f i = C i L i ;   S i = L i L ;   q = L G ;   g = G P C = f i × S i × q × g × P
where f i , S i , q , g , and P refer to the carbon emission intensity per unit of the ith land use type, the effect of the land use structure, land use intensity per unit of GDP, GDP per capita, and population size, respectively. According to this formula, the contribution value and contribution rate of each factor can be further analyzed with the LMDI model. Assuming the carbon emission in the base period and the Tth period are C 0 and C T , respectively, then the carbon emission change during the study period (0–T) can be expressed as follows [40,43]:
Δ C = C T C 0 = i = 1 , 2 , ......6 f i T × s i T × q T × g T × P T i = 1 , 2 , ......6 f i 0 × s i 0 × q 0 × g 0 × P 0 = Δ C f i + Δ C s i + Δ C q + Δ C g + Δ C P + Δ C r s d
D = C T C 0 = D f D s D q D g D P D r s d
where Δ C is the carbon emission change during the study period, Δ C f i , Δ C s i , Δ C q , Δ C g , and Δ C P are the contribution values of f i , S i , q , g , and P, respectively, and Δ C r s d is the decomposition residual. If the obtained contribution value is >0, then the factor has a pulling effect on the carbon emissions during the study period; otherwise, the factor has a suppressing effect on carbon emissions. D is the carbon emission change percentage between the base period and the Tth period; D f , D s , D q , D g , D p , and D r s d are the contribution rates of f i , S i , q , g , and the residual error, respectively.
The following are the relationships in the additive decomposition mode according to the LMDI model [40,44,45]:
Δ C f i = i C i T C i 0 ln C i T ln C i 0 × ln f i T f i 0 Δ C s i = i C i T C i 0 ln C i T ln C i 0 × ln S i T S i 0 Δ C q = i C i T C i 0 ln C i T ln C i 0 × ln q T q 0 Δ C g = i C i T C i 0 ln C i T ln C i 0 × ln g T g 0 Δ C P = i C i T C i 0 ln C i T ln C i 0 × ln P T P 0
The following are the relationships in the multiplicative decomposition mode according to the LMDI model [40,45]:
D f = exp ( W Δ C f i ) ; D s = exp ( W Δ C s i ) D q = exp ( W Δ C q ) ; D g = exp ( W Δ C g ) D P = exp ( W Δ C P ) ; D r s d = 1 W = ln D Δ C

3. Results

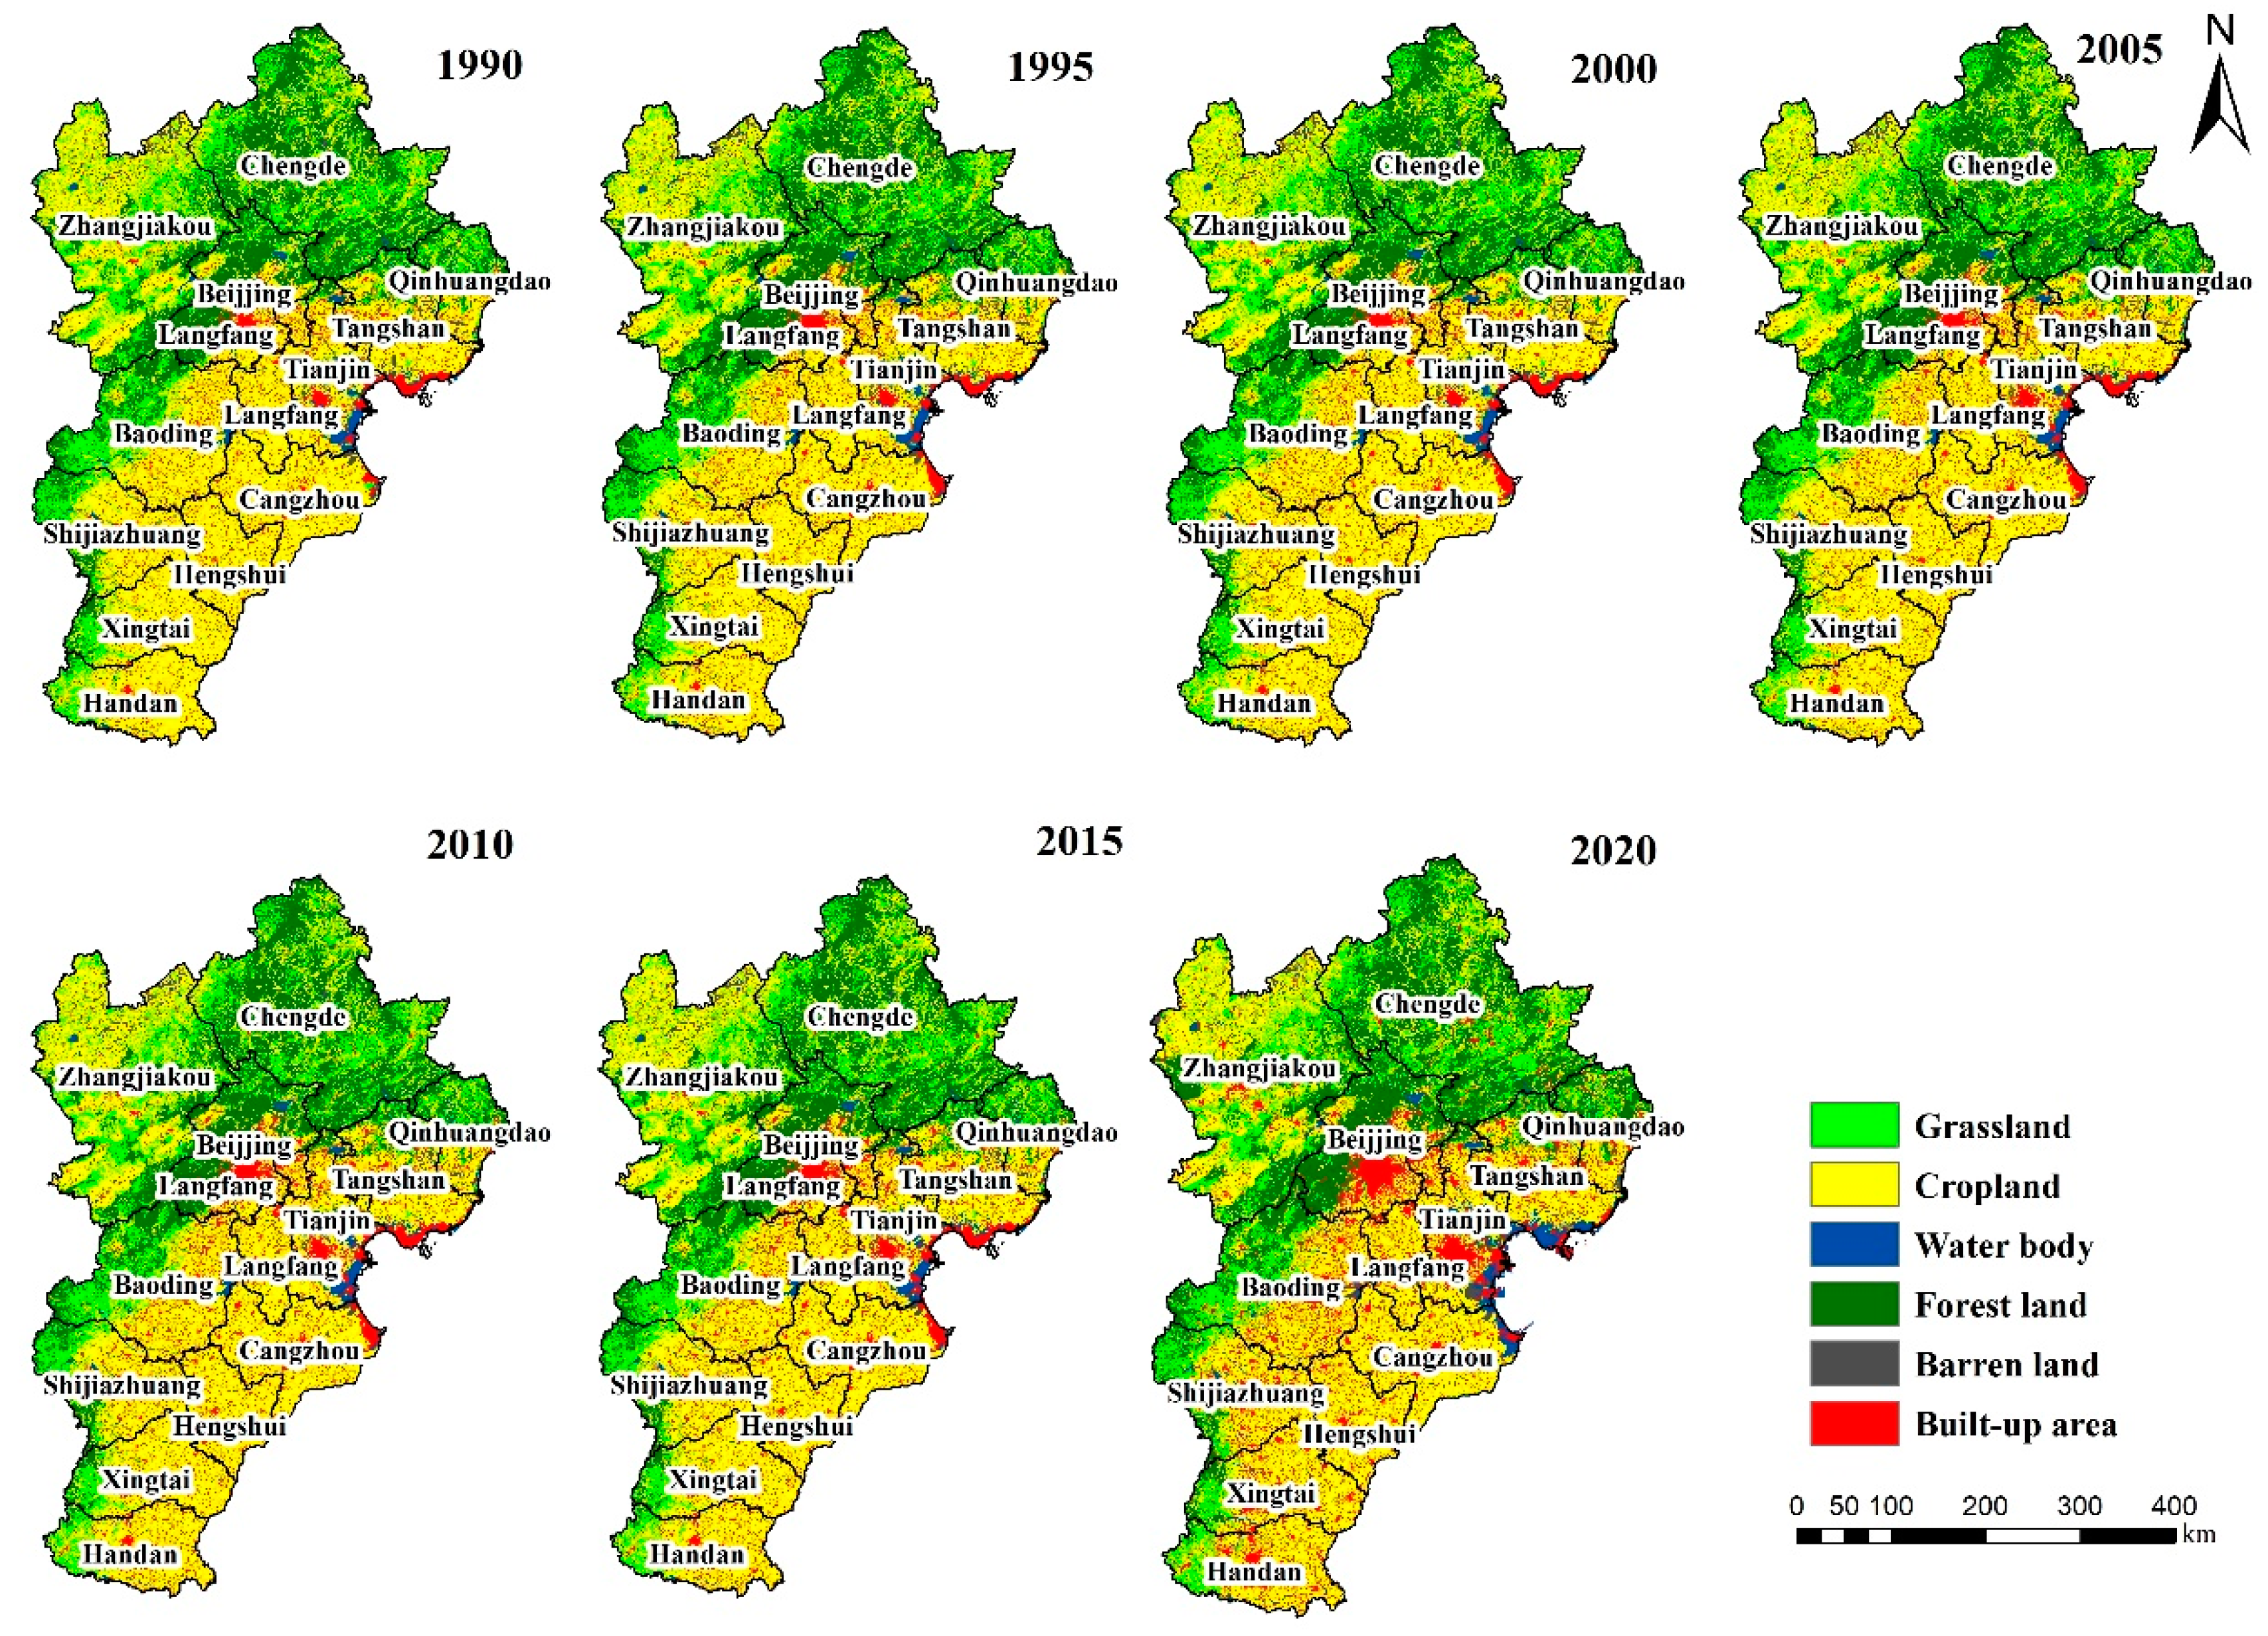
3.1. Land Use Change in the Beijing-Tianjin-Hebei Region

There was remarkable land use change in the Beijing-Tianjin-Hebei region during 1990–2020. There is mainly cropland and forest land in the Beijing-Tianjin-Hebei region, where the cropland is mainly distributed in the central and southeast parts of the study area, and the forest land as well as grassland are mainly distributed in the northeast and western parts (Figure 2). The built-up area is concentrated in the central part and the peripheral zone of the central towns in the study area. The water body is very limited in the study area, which mainly includes rivers near towns and lakes in the northwest. More specifically, cropland as the main land use type accounted for approximately 51.92% of the entire area in 1990. The forest land and grassland ranked second and third, accounting for about 20.65% and 16.49% of the entire area, respectively, while the built-up area, water body and barren land accounted for 10.94% of the entire area in total. There was a decreasing trend of cropland, forest land, grassland, and barren land from 2000–2015, while the built-up area increased significantly due to the accelerated urbanization process. In particular, the cropland decreased significantly from 2015–2020, while the built-up area continued to increase, and other land types only changed slightly.
Table 2 shows the land use transfer in the Beijing-Tianjin-Hebei region from 1990–2020. A total of 73,072 km2 of land was transferred during 1990–2020, among which the transfer-out area of the cropland ranked first, accounting for about 91.2% of the total transfer-out area. The cropland was mainly transferred into built-up area, grassland, and forest land, with the converted areas of which reaching 6726 km2 and 4705 km2 and 17,621 km2, respectively. Meanwhile the transfer-in area of cropland reached 19,880 km2, which was mainly converted from grassland and built-up area, accounting for about 69.4% of the total transfer-in area of cropland. The transfer-in area of built-up area increased most significantly during the study area, reaching 20,837 km2, 84.6% of which was transferred from the cropland. By contrast, watershed and barren land only changed slightly, most of which was converted to cropland, accounting for 49% and 51% of their transfer-out area, respectively.

3.2. Evolution of Net Carbon Emissions in the Beijing-Tianjin-Hebei Region

The average annual net carbon emission during 1990–2020 was 313.93 million tons, and the net carbon emissions of Hebei Province changed most significantly, increasing by 317.71 million tons during the study period, followed by Tianjin and Beijing. From the perspective of regions within the study area, the changing trend of net carbon emissions of Hebei Province is similar to that of Beijing and Tianjin. Besides, the evolution of carbon emissions in the Beijing-Tianjin-Hebei region over these 30 years was divided into three stages, according to the change of net carbon emissions, the industrial development status, and energy consumption status in the study area, as shown in Figure 3.
Phase I (1990–2000) is the stage of slow increase in net carbon emissions, which increased from 112.86 million tons to 178.54 million tons but was still significantly lower than the average level of the whole study period. This is mainly due to the fact that the study area was still in the early industrialization stage during this phase, with a low urbanization level and low consumption of various energy sources, which led to relatively lower net carbon emissions.
Phase II (2000–2010) is the stage of rapid growth of net carbon emissions, which rapidly increased from 178.54 million tons to 436.83 million tons, with the average annual growth rate reaching 144.66%. This is mainly due to the national focus on the development of heavy industries and the relatively loose macro production capacity policies during this period, which led to the lower entry requirement of high energy-consuming, high-emission, and low-efficiency enterprises into the study area, thus resulting in the rapid increase of the net carbon emissions.
The third phase (2010–2020) is the stage of steady increase of net carbon emissions, with the total carbon emissions increasing steadily from 436.83 million tons to 525.31 million tons. The average carbon emission level during this phase was 1.58 times that of the second phase, but the average annual growth rate was only 20.25%, which is much lower than that of the second phase. This is mainly due to the improvement of energy efficiency under the influence of the national policies on energy saving and emission reduction and application of advanced technologies. In particular, the implementation of the policies of “peak carbon dioxide emissions” and “carbon neutrality” imposed important limitations on the increase of carbon emissions.

3.3. Variation of Carbon Emissions from Land Use Change

The carbon emissions from land use change are shown in Table 3, which were estimated on the basis of the land use data and energy consumption data of the Beijing-Tianjin-Hebei region during 1990–2020. The carbon emissions from land use change in the Beijing-Tianjin-Hebei region showed an overall increasing trend during 1990–2020, with the total carbon emissions increasing from 112.86 million tons in 1990 to 525.30 million tons in 2020, with an overall growth rate of 365.46% during these 30 years (Table 3). Among the major sources of carbon emissions, the carbon emissions from cropland decreased slowly from 4.66 million tons in 1990 to 4.15 million tons in 2020, with a total decrease of 0.52 million tons and an average annual decrease of 17.12 thousand tons in these 30 years, which is mainly due to the slowly decreasing trend of cropland area in the study area during the study period. However, the carbon emissions from built-up area as another major source of carbon emissions increased rapidly from 111.51 million tons in 1990 to 524.51 million tons in 2020, with an overall growth rate of 370.37% during the study period. In particular, carbon emissions from built-up area accounted for 95.99–99.22% of the total carbon emissions, so built-up area served as the main carbon emission source in the Beijing-Tianjin-Hebei region during the study period. The carbon sinks included the forest land, grassland, water area, and barren land, the effects of which on the carbon absorption shoed a descending order. Specifically, the carbon absorption effect of the forest land was the most significant, accounting for 83.58–89.56% of the total carbon absorption amount of the study area, while the grassland and water body accounted for 9.62–15.49% and 0.47–0.59% of the total carbon absorption amount of the study area, respectively. By contrast, the carbon sequestration effect of barren land was the least significant, accounting for only 0.24–0.35% of the total carbon absorption amount of the study area. It is particularly notable that the ratio of the carbon emissions from the built-up area to the carbon absorption from the forest land ranged between 40.26 and 185 during 1990–2020. In other words, the carbon emissions from the built-up area were so large that the carbon absorption effect of the forest land failed to offset the carbon source effect of built-up area, which is the underlying reason for the continuous increase of the total carbon emissions in the study area during the study period.

3.4. Effects of Influencing Factors of Carbon Emissions from Land Use Change

The decomposition of the variation of carbon emissions in the Beijing-Tianjin-Hebei region during 1990–2020 with the LMDI model revealed the contribution value and contribution rate of five influencing factors of carbon emissions, i.e., carbon emission intensity per unit of land, land use structure, land use intensity per unit of GDP, GDP per capita, and population size in Figure 4. The results showed that there was obvious annual variation trends of these influencing factors of carbon emissions from land use change in the study area (Figure 4). Besides, Figure 5 shows the cumulative contribution rate of these influencing factors. There were remarkable differences in the contribution value between various influencing factors of the carbon emissions from land use change (Figure 5). The absolute contribution values of each influencing factor to the variation of carbon emissions from land use change during 1990–2020 in a descending order were land use intensity per unit of GDP > GDP per capita > land use structure > carbon emission intensity per unit of land > population size. The land use intensity per unit of GDP was the biggest restraining factor of the increase of carbon emissions, and the remaining four factors all had positive effects on the increase of carbon emissions, among which GDP per capita had the greatest promotion effects on the increase of carbon emissions (Figure 5).
This study suggested that the land use factors played an important role in influencing the carbon emissions. For example, there were extremely unstable effects of the carbon emission intensity per unit of land on the carbon emissions, which showed a promoting effect during 1990–2015 and a restraining effect during 2015–2020, indicating uncertainties of the role of carbon emission intensity per unit of land in influencing the carbon emissions from land use change. Nevertheless, the cumulative contribution rate of the carbon emission intensity per unit of land was 89.06% during the study period. Besides, the land use structure had an overall positive effect on the carbon emissions from land use change during the study period, with a cumulative contribution rate of 64.3%. It is notable that the contribution value of the land use structure showed a significant increase during 2015–2020, which is mainly because the built-up area expanded rapidly during this period, which led to the remarkable increase of carbon emissions from land use change. It is therefore of great significance to the control of carbon emissions to carry out the reasonable layout of land use structure. By contrast, the land use intensity per unit of GDP was the primary restraining factor of the carbon emissions from land use change in the study area, which had a suppressive effect on the net carbon emissions throughout the study period, with a cumulative contribution reaching −385.47%. This indicates that it is feasible to achieve a sustainable development status of the land use by promoting the economic development and adopting some reasonable means.
There was always a positive contribution value of GDP per capita to the increase of carbon emissions, i.e., GDP per capita had played a positive role in promoting the increase of carbon emissions from land use change during the study period. In particular, the cumulative contribution of GDP per capita was the highest among these influencing factors, indicating that GDP per capita played the most important role in promoting the increase of carbon emissions from land use change. In fact, GDP per capita represents the regional economic development level as well as the affluence level, and the rapid economic development not only brings abundant material achievements but also generates a large amount of carbon emissions; it is therefore necessary to pay more attention to the factors of economic development in future research and the practice of carbon emission reduction. Additionally, the population size always had a promoting effect on the increase of carbon emissions during 1990–2015, which is similar to GDP per capita. The cumulative contribution value and cumulative contribution rate of population size reached 1.05 million tons and 30.61%, respectively, indicating that the population size is also one of the most important factors promoting the increase of carbon emissions from land use change. This is primarily because the population growth leads to the increase in energy consumption and further results in more carbon emissions from energy consumption on the land.

4. Discussion

There is an overall high reliability of the results of this study, which were generally consistent with previous studies. For example, some previous studies suggested that the growth of GDP per capita resulting from expansion of coal intensive industries was a major factor driving carbon emissions in China [44,46], and this study also suggested that GDP per capita played a dominant role in promoting the increase of carbon emissions in the Beijing-Tianjin-Hebei region, indicating there was a consistent major driving factor of the Beijing-Tianjin-Hebei region and the whole of China. On the one hand, the Beijing-Tianjin-Hebei region and other parts of China both used to heavily depend on coal, with a slight difference in the technological level of energy utilization among these regions, which led to a similar pattern of carbon emissions of the Beijing-Tianjin-Hebei region and other parts of China. On the other hand, the Beijing-Tianjin-Hebei region, as one of the three major urban agglomerations in China, generally kept pace with the rapid economic development of the whole of China, leading to a similar change of GDP per capita and subsequently carbon emissions. More importantly, this study estimated the carbon emissions with the data extracted from the authoritative statistical yearbooks and carried out a decomposition analysis of influencing factors of carbon emissions with the relatively mature LMDI model, which were both generally consistent with previous studies and therefore guaranteed the reliability of the results of this study.
There are still some uncertainties in the results of this study due to the limitation of data accuracy, and it is especially necessary to further improve the estimation of the carbon emission (or absorption) coefficients based on dynamic observation data in the future. For example, the carbon emission coefficient of the State Grid Corporation of China has been adjusted from 0.6101 tCO2/MWh to 0.5810 tCO2/MWh in 2022, according to the latest “Corporate Greenhouse Gas Emissions Accounting Methodology and Reporting Guidelines for Power Generation Facilities (2022 Revised Edition)”. This carbon emission coefficient has declined slightly by only 4.77% after years of technical progress; it is therefore still feasible to assume that the carbon emission coefficient of electricity kept constant in past decades. Nevertheless, it is still necessary to use some dynamic carbon emission coefficients, according to the specific conditions, to more accurately reveal the effects of technical progress and other factors on carbon emissions in the future.
Although there are still some uncertainties, this study still successfully revealed the effects of various influencing factors of carbon emissions from land use change. This study has accordingly proposed the following policy recommendations, which can contribute to promoting the improvement of the lower carbon emission of land use and support the synergetic development of the Beijing-Tianjin-Hebei region.
(1)
Optimization of the land use structure and the spatial layout of land use
It is necessary to carry out land use in a more economical and intensive way, making full use of the barren land and a large amount of idle land by giving priority to turning the barren land and idle land into cropland, forest land, and grassland. It is also necessary to carry out a moderate return of cropland to forest land and grass land. It is particularly urgent to control the proportion of built-up area and increase the area of carbon sinks by planting trees and optimizing the spatial layout of public green space, which can contribute to achieving environmental improvement and low-carbon development in the Beijing-Tianjin-Hebei region.
(2)
Adjustment of the energy structure and development of new cleaner energy sources
The current energy consumption of the Beijing-Tianjin-Hebei region dominantly depends on fossil energy, especially coal, while the proportion of cleaner energy is still very low, and it is therefore very necessary to adjust the energy structure and reduce the dependence on fossil energy. To achieve this end, it is necessary to promote the development of new cleaner energy sources and to encourage the development of advanced energy-saving technologies, e.g., the Carbon Capture and Storage technologies, which can effectively reduce carbon emissions.
(3)
Optimization of the industrial structure and promotion of the development of the tertiary industry
The increase of GDP of the Beijing-Tianjin-Hebei region still heavily depends on the secondary industry, which plays an important role in the increasing the carbon emissions. By contrast, the primary and tertiary industries have relatively small carbon emissions. It is therefore necessary to carry out optimization of the industrial structure by “retreating from secondary industry and developing the tertiary industries”, which can make a considerable contribution to the energy saving and carbon emission reduction in the Beijing-Tianjin-Hebei region.

5. Conclusions

This study estimated the carbon emissions in the Beijing-Tianjin-Hebei region during 1990–2020 based on the carbon emission coefficients, and it revealed the quantitative relationship between land use change and carbon emissions with the decomposition analysis of the main influencing factors of carbon emissions from land use change. The major conclusions are as follows: (1) the cropland, forest land, grassland, and barren land in the study area all showed a decreasing trend during 1990–2020, among which the cropland decreased most significantly and the built-up area increased significantly due to the accelerated urbanization. (2) The total carbon emissions in the study area increased from 112.86 million tons in 1990 to 525.31 million tons in 2020, with a growth rate of 365.46%. Built-up area was the main carbon source, the carbon emissions of which increased rapidly from 111.51 million tons in 1990 to 524.52 million tons in 2020, with a growth rate of 370.37%. The forest land accounted for 83.58–89.56% of the total carbon absorption, but it still failed to offset the carbon emissions of the built-up area. (3) GDP per capita contributed most to the increase of the carbon emissions, resulting in a cumulative increase of carbon emissions by 94.78 million tons. While the land use structure, carbon emission intensity per unit of land, and population size led to the increase of carbon emissions by 18.11 million tons, 22.95 million tons, and 8.67 million tons, respectively. By contrast, the land use intensity per unit of GDP had a restraining effect on the carbon emissions, making the carbon emissions decrease by 103.26 million tons in total. This study accurately revealed the variation of net carbon emissions from land use change and the effects of influencing factors of carbon emissions from land use change in the Beijing-Tianjin-Hebei region, and all the conclusions of this study can provide a firm scientific basis for improving the regional land use planning and for promoting the low-carbon economic development of the Beijing-Tianjin-Hebei region.

Author Contributions

H.Y. (Haiming Yan) and S.Z.: investigation, data curation, writing—original draft preparation, writing—review and editing, and funding acquisition; H.Y. (Huicai Yang): conceptualization, methodology, supervision, and project administration; H.Y. (Haiming Yan) and X.G.: software, validation, and visualization. All authors have read and agreed to the published version of the manuscript.

Funding

This study was funded by the Major Project of Humanities and Social Science Research of Hebei Education Department (ZD201907), the Science and Technology Project of Hebei Education Department (BJ2019045), and the National Natural Science Foundation of China (51909052).

Data Availability Statement

Not applicable.

Acknowledgments

We are very grateful for the helpful inputs from the editor and anonymous reviewers.

Conflicts of Interest

The authors declare no conflict of interest.

References

  1. Quay, P.; Tilbrook, B.; Wong, C. Oceanic uptake of fossil fuel CO2: Carbon-13 evidence. Science 1992, 256, 74–79. [Google Scholar] [CrossRef] [PubMed] [Green Version]
  2. Houghton, R. Magnitude, distribution and causes of terrestrial carbon sinks and some implications for policy. Clim. Policy 2002, 2, 71–88. [Google Scholar] [CrossRef]
  3. Lau, H.C.; Ramakrishna, S.; Zhang, K.; Radhamani, A.V. The role of carbon capture and storage in the energy transition. Energy Fuels 2021, 35, 7364–7386. [Google Scholar] [CrossRef]
  4. Chuai, X.; Huang, X.; Wang, W.; Zhao, R.; Zhang, M.; Wu, C. Land use, total carbon emissions change and low carbon land management in Coastal Jiangsu, China. J. Clean. Prod. 2015, 103, 77–86. [Google Scholar] [CrossRef]
  5. Lai, L.; Huang, X.; Yang, H.; Chuai, X.; Zhang, M.; Zhong, T.; Chen, Z.; Chen, Y.; Wang, X.; Thompson, J.R. Carbon emissions from land-use change and management in China between 1990 and 2010. Sci. Adv. 2016, 2, e1601063. [Google Scholar] [CrossRef] [PubMed] [Green Version]
  6. Hong, C.; Burney, J.A.; Pongratz, J.; Nabel, J.E.M.S.; Mueller, N.D.; Jackson, R.B.; Davis, S.J. Global and regional drivers of land-use emissions in 1961–2017. Nature 2021, 589, 554–561. [Google Scholar] [CrossRef] [PubMed]
  7. Zhou, D.; Xiao, J.; Frolking, S.; Zhang, L.; Zhou, G. Urbanization contributes little to global warming but substantially intensifies local and regional land surface warming. Earth’s Future 2022, 10, e2021EF002401. [Google Scholar] [CrossRef]
  8. Yohannes, H.; Soromessa, T.; Argaw, M.; Dewan, A. Spatio-temporal changes in habitat quality and linkage with landscape characteristics in the Beressa watershed, Blue Nile basin of Ethiopian highlands. J. Environ. Manag. 2021, 281, 111885. [Google Scholar] [CrossRef]
  9. Janizadeh, S.; Chandra Pal, S.; Saha, A.; Chowdhuri, I.; Ahmadi, K.; Mirzaei, S.; Mosavi, A.H.; Tiefenbacher, J.P. Mapping the spatial and temporal variability of flood hazard affected by climate and land-use changes in the future. J. Environ. Manag. 2021, 298, 113551. [Google Scholar] [CrossRef]
  10. Mukul, S.A.; Halim, M.A.; Herbohn, J. Forest carbon stock and fluxes: Distribution, biogeochemical cycles, and measurement techniques. In Life on Land, Encyclopedia of the UN Sustainable Development Goals; Leal Fil-ho, W., Azul, A., Brandli, L., Lange Salvia, A., Wall, T., Eds.; Springer: Cham, Switzerland, 2021; pp. 365–380. [Google Scholar]
  11. Kalnay, E.; Cai, M. Impact of urbanization and land-use change on climate. Nature 2003, 423, 528–531. [Google Scholar] [CrossRef]
  12. Liang, Y.; Hashimoto, S.; Liu, L. Integrated assessment of land-use/land-cover dynamics on carbon storage services in the Loess Plateau of China from 1995 to 2050. Ecol. Indic. 2021, 120, 106939. [Google Scholar] [CrossRef]
  13. Lin, Q.; Zhang, L.; Qiu, B.; Zhao, Y.; Wei, C. Spatiotemporal analysis of land use patterns on carbon emissions in China. Land 2021, 10, 141. [Google Scholar] [CrossRef]
  14. IPCC. 2006 IPCC Guidelines for National Greenhouse Gas Inventories; Institute for Global Environmental Strategies: Hayama, Japan, 2006. [Google Scholar]
  15. Villamor, G.B.; Le, Q.B.; Djanibekov, U.; van Noordwijk, M.; Vlek, P.L. Biodiversity in rubber agroforests, carbon emissions, and rural livelihoods: An agent-based model of land-use dynamics in lowland Sumatra. Environ. Model. Softw. 2014, 61, 151–165. [Google Scholar] [CrossRef] [Green Version]
  16. Wu, S.; Hu, S.; Frazier, A.E. Spatiotemporal variation and driving factors of carbon emissions in three industrial land spaces in China from 1997 to 2016. Technol. Forecast. Soc. 2021, 169, 120837. [Google Scholar] [CrossRef]
  17. Kuang, B.; Lu, X.; Zhou, M.; Chen, D. Provincial cultivated land use efficiency in China: Empirical analysis based on the SBM-DEA model with carbon emissions considered. Technol. Forecast. Soc. 2020, 151, 119874. [Google Scholar] [CrossRef]
  18. Wang, Q.; Wang, S.; Li, R. Determinants of decoupling economic output from carbon emission in the transport sector: A comparison study of four municipalities in China. Int. J. Environ. Res. Public Health 2019, 16, 3729. [Google Scholar] [CrossRef] [Green Version]
  19. Bhattacharyya, S.C.; Matsumura, W. Changes in the GHG emission intensity in EU-15: Lessons from a decomposition analysis. Energy 2010, 35, 3315–3322. [Google Scholar] [CrossRef]
  20. Xie, X.; Shao, S.; Lin, B. Exploring the driving forces and mitigation pathways of CO2 emissions in China’s petroleum refining and coking industry: 1995–2031. Appl. Energy 2016, 184, 1004–1015. [Google Scholar] [CrossRef]
  21. Lin, B.; Benjamin, N.I. Influencing factors on carbon emissions in China transport industry. A new evidence from quantile regression analysis. J. Clean. Prod. 2017, 150, 175–187. [Google Scholar] [CrossRef]
  22. Shen, L.; Sun, Y. Review on carbon emissions, energy consumption and low-carbon economy in China from a perspective of global climate change. J. Geogr. Sci. 2016, 26, 855–870. [Google Scholar] [CrossRef] [Green Version]
  23. Wang, S.; Ma, Y. Influencing factors and regional discrepancies of the efficiency of carbon dioxide emissions in Jiangsu, China. Ecol. Indic. 2018, 90, 460–468. [Google Scholar] [CrossRef]
  24. Zhao, R.; Huang, X.; Liu, Y.; Zhong, T.; Ding, M.; Chuai, X. Carbon emission of regional land use and its decomposition analysis: Case study of Nanjing City, China. Chin. Geogr. Sci. 2015, 25, 198–212. [Google Scholar] [CrossRef]
  25. Auffhammer, M.; Carson, R.T. Forecasting the path of China’s CO2 emissions using province-level information. J. Environ. Econ. Manag. 2008, 55, 229–247. [Google Scholar] [CrossRef] [Green Version]
  26. Yan, H.; Li, W.; Yang, H.; Guo, X.; Liu, X.; Jia, W. Estimation of the rational range of ecological compensation to address land degradation in the Poverty Belt around Beijing and Tianjin, China. Land 2021, 10, 1383. [Google Scholar] [CrossRef]
  27. Fang, J.; Guo, Z.; Piao, S.; Chen, A. Terrestrial vegetation carbon sinks in China, 1981–2000. Sci. China Ser. D 2007, 50, 1341–1350. [Google Scholar] [CrossRef]
  28. Chen, Y.; Lu, H.; Li, J.; Xia, J. Effects of land use cover change on carbon emissions and ecosystem services in Chengyu urban agglomeration, China. Stoch. Environ. Res. Risk Assess. 2020, 34, 1197–1215. [Google Scholar] [CrossRef]
  29. Fang, J.; Zhu, J.; Wang, S. Global warming, carbon emissions and uncertainty. Sci. China Earth Sci. 2011, 10, 1385–1395. [Google Scholar]
  30. Zhou, Y.; Chen, M.; Tang, Z.; Mei, Z. Urbanization, land use change, and carbon emissions: Quantitative assessments for city-level carbon emissions in Beijing-Tianjin-Hebei region. Sustain. Cities Soc. 2021, 66, 102701. [Google Scholar] [CrossRef]
  31. Lippke, B.; Perez-Garcia, J. Will either cap and trade or a carbon emissions tax be effective in monetizing carbon as an ecosystem service. For. Ecol. Manag. 2008, 256, 2160–2165. [Google Scholar] [CrossRef]
  32. Yang, H.; Zheng, H.; Liu, H.; Wu, Q. NonLinear effects of environmental regulation on eco-efficiency under the constraint of land use carbon emissions: Evidence based on a bootstrapping approach and panel threshold model. Int. J. Environ. Res. Public Health 2019, 16, 1679. [Google Scholar] [CrossRef] [Green Version]
  33. Dunn, J.B.; Mueller, S.; Kwon, H.-y.; Wang, M.Q. Land-use change and greenhouse gas emissions from corn and cellulosic ethanol. Biotechnol. Biofuels 2013, 6, 51. [Google Scholar] [CrossRef] [PubMed] [Green Version]
  34. Houghton, R.A.; House, J.I.; Pongratz, J.; Van Der Werf, G.R.; Defries, R.S.; Hansen, M.C.; Le Quéré, C.; Ramankutty, N. Carbon emissions from land use and land-cover change. Biogeosciences 2012, 9, 5125–5142. [Google Scholar] [CrossRef] [Green Version]
  35. Fatichi, S.; Pappas, C.; Zscheischler, J.; Leuzinger, S. Modelling carbon sources and sinks in terrestrial vegetation. New Phytol. 2019, 221, 652–668. [Google Scholar] [CrossRef] [PubMed] [Green Version]
  36. Zhu, E.; Deng, J.; Zhou, M.; Gan, M.; Jiang, R.; Wang, K.; Shahtahmassebi, A. Carbon emissions induced by land-use and land-cover change from 1970 to 2010 in Zhejiang, China. Sci. Total Environ. 2019, 646, 930–939. [Google Scholar] [CrossRef]
  37. Guo, R.; Zhao, Y.; Shi, Y.; Li, F.; Hu, J.; Yang, H. Low carbon development and local sustainability from a carbon balance perspective. Resour. Conserv. Recycl. 2017, 122, 270–279. [Google Scholar] [CrossRef]
  38. Say, N.P.; Yücel, M. Energy consumption and CO2 emissions in Turkey: Empirical analysis and future projection based on an economic growth. Energy Policy 2006, 34, 3870–3876. [Google Scholar] [CrossRef]
  39. Nguyen, K.H.; Kakinaka, M. Renewable energy consumption, carbon emissions, and development stages: Some evidence from panel cointegration analysis. Renew. Energy 2019, 132, 1049–1057. [Google Scholar] [CrossRef]
  40. Fan, R.N. A Study on the Influencing Factors of Carbon Emissions in Zhejiang Province-Based on Kaya Identity; Zhejiang University of Finance and Economics: Hangzhou, China, 2016. (In Chinese) [Google Scholar]
  41. Mahony, T.O. Decomposition of Ireland’s carbon emissions from 1990 to 2010: An extended Kaya identity. Energy Policy 2013, 59, 573–581. [Google Scholar] [CrossRef] [Green Version]
  42. Vinuya, F.; DiFurio, F.; Sandoval, E. A decomposition analysis of CO2 emissions in the United States. Appl. Econ. Lett. 2010, 17, 925–931. [Google Scholar] [CrossRef]
  43. Han, X.; Yu, J.; Xia, Y.; Wang, J. Spatiotemporal characteristics of carbon emissions in energy-enriched areas and the evolution of regional types. Energy Rep. 2021, 7, 7224–7237. [Google Scholar] [CrossRef]
  44. Chong, C.; Ma, L.; Li, Z.; Ni, W.; Song, S. Logarithmic mean Divisia index (LMDI) decomposition of coal consumption in China based on the energy allocation diagram of coal flows. Energy 2015, 85, 366–378. [Google Scholar] [CrossRef]
  45. Wang, W.; Liu, X.; Zhang, M.; Song, X. Using a new generalized LMDI (logarithmic mean Divisia index) method to analyze China’s energy consumption. Energy 2014, 67, 617–622. [Google Scholar] [CrossRef]
  46. Cui, Y.; Li, L.; Chen, L.; Zhang, Y.; Cheng, L.; Zhou, X.; Yang, X. Land-use carbon emissions estimation for the Yangtze River Delta Urban Agglomeration using 1994–2016 Landsat image data. Remote Sens. 2018, 10, 1334. [Google Scholar] [CrossRef] [Green Version]
Figure 1. Location of the Beijing-Tianjin-Hebei region.
Land 11 00997 g001
Figure 2. Spatial pattern of land use in the Beijing-Tianjin-Hebei region from 1990–2020.
Land 11 00997 g002
Figure 3. Changing trends of net carbon emissions in the Beijing-Tianjin-Hebei region from 1990–2020 (million tons).
Land 11 00997 g003
Figure 4. Contribution value of the influencing factors to variation of carbon emissions from land use change in the Beijing-Tianjin-Hebei region.
Land 11 00997 g004
Figure 5. Cumulative contribution rate of influencing factors to the variation of carbon emissions from land use change in the Beijing-Tianjin-Hebei region.
Land 11 00997 g005
Table 1. Standard coal conversion coefficients and carbon emission coefficients of various energy sources.
Energy SourcesStandard Coal Conversion CoefficientCarbon Emission Coefficient
Coal0.7143 (kgce/kg)0.7559
Coke0.9714 (kgce/kg)0.8550
Crude oil1.4286 (kgce/kg)0.5857
Gasoline1.4714 (kgce/kg)0.5538
Kerosene1.4714 (kgce/kg)0.5714
Diesel oil1.4571 (kgce/kg)0.5921
Fuel oil1.4286 (kgce/kg)0.6185
Natural gas1.3301 (kgce/m3)0.4483
Electric power0.1229 kg (kgce/kWh)0.7476
Table 2. Land use transfer matrix in the Beijing-Tianjin-Hebei region during 1990–2020 (km2).
19902020
GrasslandCroplandBuilt-up AreaForest LandWater BodyBarren LandTotal Decrease
Grassland19,37770161425685853822316,060
Cropland672679,73817,6214705251230231,866
Built-up area31467776821190996438320
Forest land6713345483633,1032512911,283
Water body486177876836122884893882
Barren land320855187752245471661
Total increase14,55919,88020,83712,1894521108673,072
Overall change−1501−11,98612,517906639−575
Table 3. Carbon emissions from land use change in the Beijing-Tianjin-Hebei region during 1990–2020 (million tons).
Year1990199520002005201020152020
Forest land−2.77−3.72−2.79−2.79−2.79−2.78−2.84
Grassland−0.51−0.4−0.51−0.5−0.5−0.5−0.49
Water body−0.02−0.02−0.02−0.02−0.02−0.02−0.02
Barren land−0.01−0.01−0.01−0.01−0.01−0.01−0.01
Cropland4.664.224.554.514.494.464.15
Built-up area111.51153.74177.33299.91435.66487.95524.52
Carbon sink−3.31−4.16−3.32−3.32−3.32−3.31−3.36
Carbon Source116.17157.96181.87304.42440.15492.41528.66
Total carbon emissions112.86153.8178.55301.1436.83489.1525.31
Publisher’s Note: MDPI stays neutral with regard to jurisdictional claims in published maps and institutional affiliations.

