Article

Image Classification and Land Cover Mapping Using Sentinel-2 Imagery: Optimization of SVM Parameters

by
Saleh Yousefi
1,
Somayeh Mirzaee
2,
Hussein Almohamad
3,4,*,
Ahmed Abdullah Al Dughairi
3,
Christopher Gomez
5,
Narges Siamian
6,
Mona Alrasheedi
3,7 and
Hazem Ghassan Abdo
8,9,10
1
Agricultural and Natural Resources Research and Education Center, Soil Conservation and Watershed Management Research Department, Chaharmahal and Bakhtiari AREEO, Shahrekord 8814843114, Iran
2
Department of Natural Resources, Shahrekord University, Shahrekord 8818634141, Iran
3
Department of Geography, College of Arabic Language and Social Studies, Qassim University, Burayda 51452, Saudi Arabia
4
Department of Geography, Justus Liebig University of Giessen, 35390 Giessen, Germany
5
LofHazs Laboratory (Sabo), Graduate School of Oceaonology, Kobe University, Kobe 657-8501, Japan
6
Environment, Science and Research Branch, Islamic Azad University, Tehran 1477893855, Iran
7
Geography Program, Department of Social Sciences, College of Arts, University of Ha’il, Ha’il 55476, Saudi Arabia
8
Geography Department, Faculty of Arts and Humanities, University of Tartous, Tartous P.O. Box 2147, Syria
9
Geography Department, University of Damascus, Damascus P.O. Box 30621, Syria
10
Geography Department, University of Tishreen, Lattakia P.O. Box 2237, Syria
*
Author to whom correspondence should be addressed.
Land 2022, 11(7), 993; https://doi.org/10.3390/land11070993
Submission received: 26 May 2022 / Revised: 25 June 2022 / Accepted: 27 June 2022 / Published: 29 June 2022

Abstract

:
Land use/cover (LU/LC) classification provides proxies of the natural and social processes related to urban development, providing stakeholders with crucial information. Remotely sensed images combined with supervised classification are common to define land use, but high-performance classifiers remain difficult to achieve, due to the presence of model hyperparameters. Conventional approaches rely on manual adjustment, which is time consuming and often unsatisfying. Therefore, the goal of this study has been to optimize the parameters of the support vector machine (SVM) algorithm for the generation of land use/cover maps from Sentinel-2 satellite imagery in selected humid and arid (three study sites each) climatic regions of Iran. For supervised SVM classification, we optimized two important parameters (gamma in kernel function and penalty parameter) of the LU/LC classification. Using the radial basis function (RBF) of the SVM classification method, we examined seven values for both parameters ranging from 0.001 to 1000. For both climate types, the penalty parameters (PP) showed a direct relationship with overall accuracy (OA). Statistical results confirmed that in humid study regions, LU/LC maps produced with a penalty parameter >100 were more accurate. However, for regions with arid climates, LU/LC maps with a penalty parameter >0.1 were more accurate. Mapping accuracy for both climate types was sensitive to the penalty parameter. In contrast, variations of the gamma values in the kernel function had no effect on the accuracy of the LU/LC maps in either of the climate zones. These new findings on SVM image classification are directly applicable to LU/LC for planning and environmental and natural resource management.

1. Introduction

The spatial distribution of land use/cover (LU/LC) plays a key role in many environmental and management activities, including the fields of water resources, natural resources and environmental management [1,2,3]. Using data from multiple satellite sensors, the mapping of land use/cover is a comprehensive and rapidly evolving technique, which is now used by researchers across disciplines [4,5,6,7,8]. The analysis of satellite imagery reveals the human interactions with natural resources. Notably, the usage of multispectral imagery can be a useful tool to identify the nature of the land cover [9,10,11,12]. Traditionally, image classification approaches have been divided into supervised and unsupervised classification. In the supervised method, satellite images are classified using training sets for each defined class. In the unsupervised method, the satellite images are classified based on a statistical indicator built from the spectral reflectance of the targets [13,14].
The remote sensing methods encounter different difficulties depending on the local climate and specificities of the atmosphere. In Iran, depending on the location, the climate can vary between four main categories: arid (central plateau), warm and humid (south coast), humid (southern shores of the Caspian Sea) and cold climate (western mountains). Consequently, the regional climates have a very important role in determining the type of vegetation and land use. In Iran, an arid region is defined as a region where severe water shortages and precipitation pose a challenge to vegetation growth and wildlife. These areas are hot and dry and receive less than 200 mm of precipitation throughout the year [15,16]. Humid climate is where the solar heat received is not enough to evaporate all the moisture that occurs in the form of precipitation, and excess water flows through the surface drainage into the lakes and sea, and in these areas, shortage of water is not a challenge [17,18]. Such humid climates include the Caspian coast, which has a humid climate with heavy rainfall, high humidity and moderate temperatures [19].
Overall, there are numerous categorization methods/algorithms to produce land cover/use maps from satellite imagery, including random forest (RF), maximum likelihood (ML), neural network (NN) and SVM [2,8,20,21,22,23,24,25]. Support Vector Machine is presented as a popular and accurate technique for supervised image classification [21,25,26,27,28,29,30,31]. SVM is a recently introduced, supervised classification technique based on statistical learning theory [21,29]. SVM often provides more robust classification results from highly variable spectral information than the most popular supervised classification methods. Most image classification methods involve variables and parameters that need to be optimized.
Wentz et al. [32] compared some existing methods to map land cover with Landsat TM imagery in the US state of Arizona and found a high accuracy of satellite imagery for land use mapping. Al-Ahmadi et al. [20] compared four image classification algorithms for ETM+ imagery in arid lands in Saudi Arabia and reported that the ML (maximum likelihood) algorithm is one of the most accurate methods for land cover mapping. Meanwhile, in Japan, Thapa and Murayama [33] described the use of the fuzzy technique for map comparisons. Perumal and Bhaskaran [34] evaluated various image classification techniques for land cover mapping in India and discovered that the Mahalanobis distance with a kappa coefficient of 0.97 was more accurate than the Parallel Piped, Maximum Likelihood, Spectral Angle Mapper (SAM), Minimum Distance to Mean (MDM) and the NN methods. More recently, Núñez et al. [35] investigated classification algorithms using high resolution images to map cities in the National Urban System of Mexico. This study found that an artificial neural network (ANN) performed best as a classifier with an overall accuracy (OA) of 92%. Helber et al. [36] used Sentinel-2 imagery to demonstrate area-based land cover mapping with an OA of 98.6%. Land use maps for six research sites were created using the SVM approach. Kesikoglu et al. [30] investigated the effectiveness of some classification algorithms (SVM, ANN and MLH) for land cover change detection in a case study in Turkey and found that the SVM method provided the highest OA in image categorization.
Another study in Brazil [37] applied the Maximum Likelihood and Random Forest (RF) classification algorithms to monitor the forest regeneration in Brazil using Light Detection and Ranging (LIDAR) data and multispectral images from an unmanned aerial vehicle (UAV) camera. The authors concluded that RF is the more accurate classification method for land cover mapping. Despite these recent findings, numerous published documents and literature reviews have reported that the SVM method is the most accurate classification algorithm, although the optimum values of variable parameters in the SVM structure are often not reported, even if these optimum values could be very useful for future studies and to researchers in the field of remote sensing and land use mapping.
In the present contribution, we therefore propose unique optimization parameters for high-resolution satellite images classification algorithms, not only for one single type of climate and land-cover, but for humid and arid climates together. For this purpose, a novel optimization approach was developed for humid and arid regions, especially because the ideal range of SVM parameters as well as the penalty parameters (PP) and the gamma in the kernel function are not known precisely. Therefore, the main objective of this research has been to analysis the accuracy of variation ranges of these critical parameters in the support vector machine methods to improve the accuracy of land use/cover mapping in humid and arid regions using Sentinel-2 satellite data.

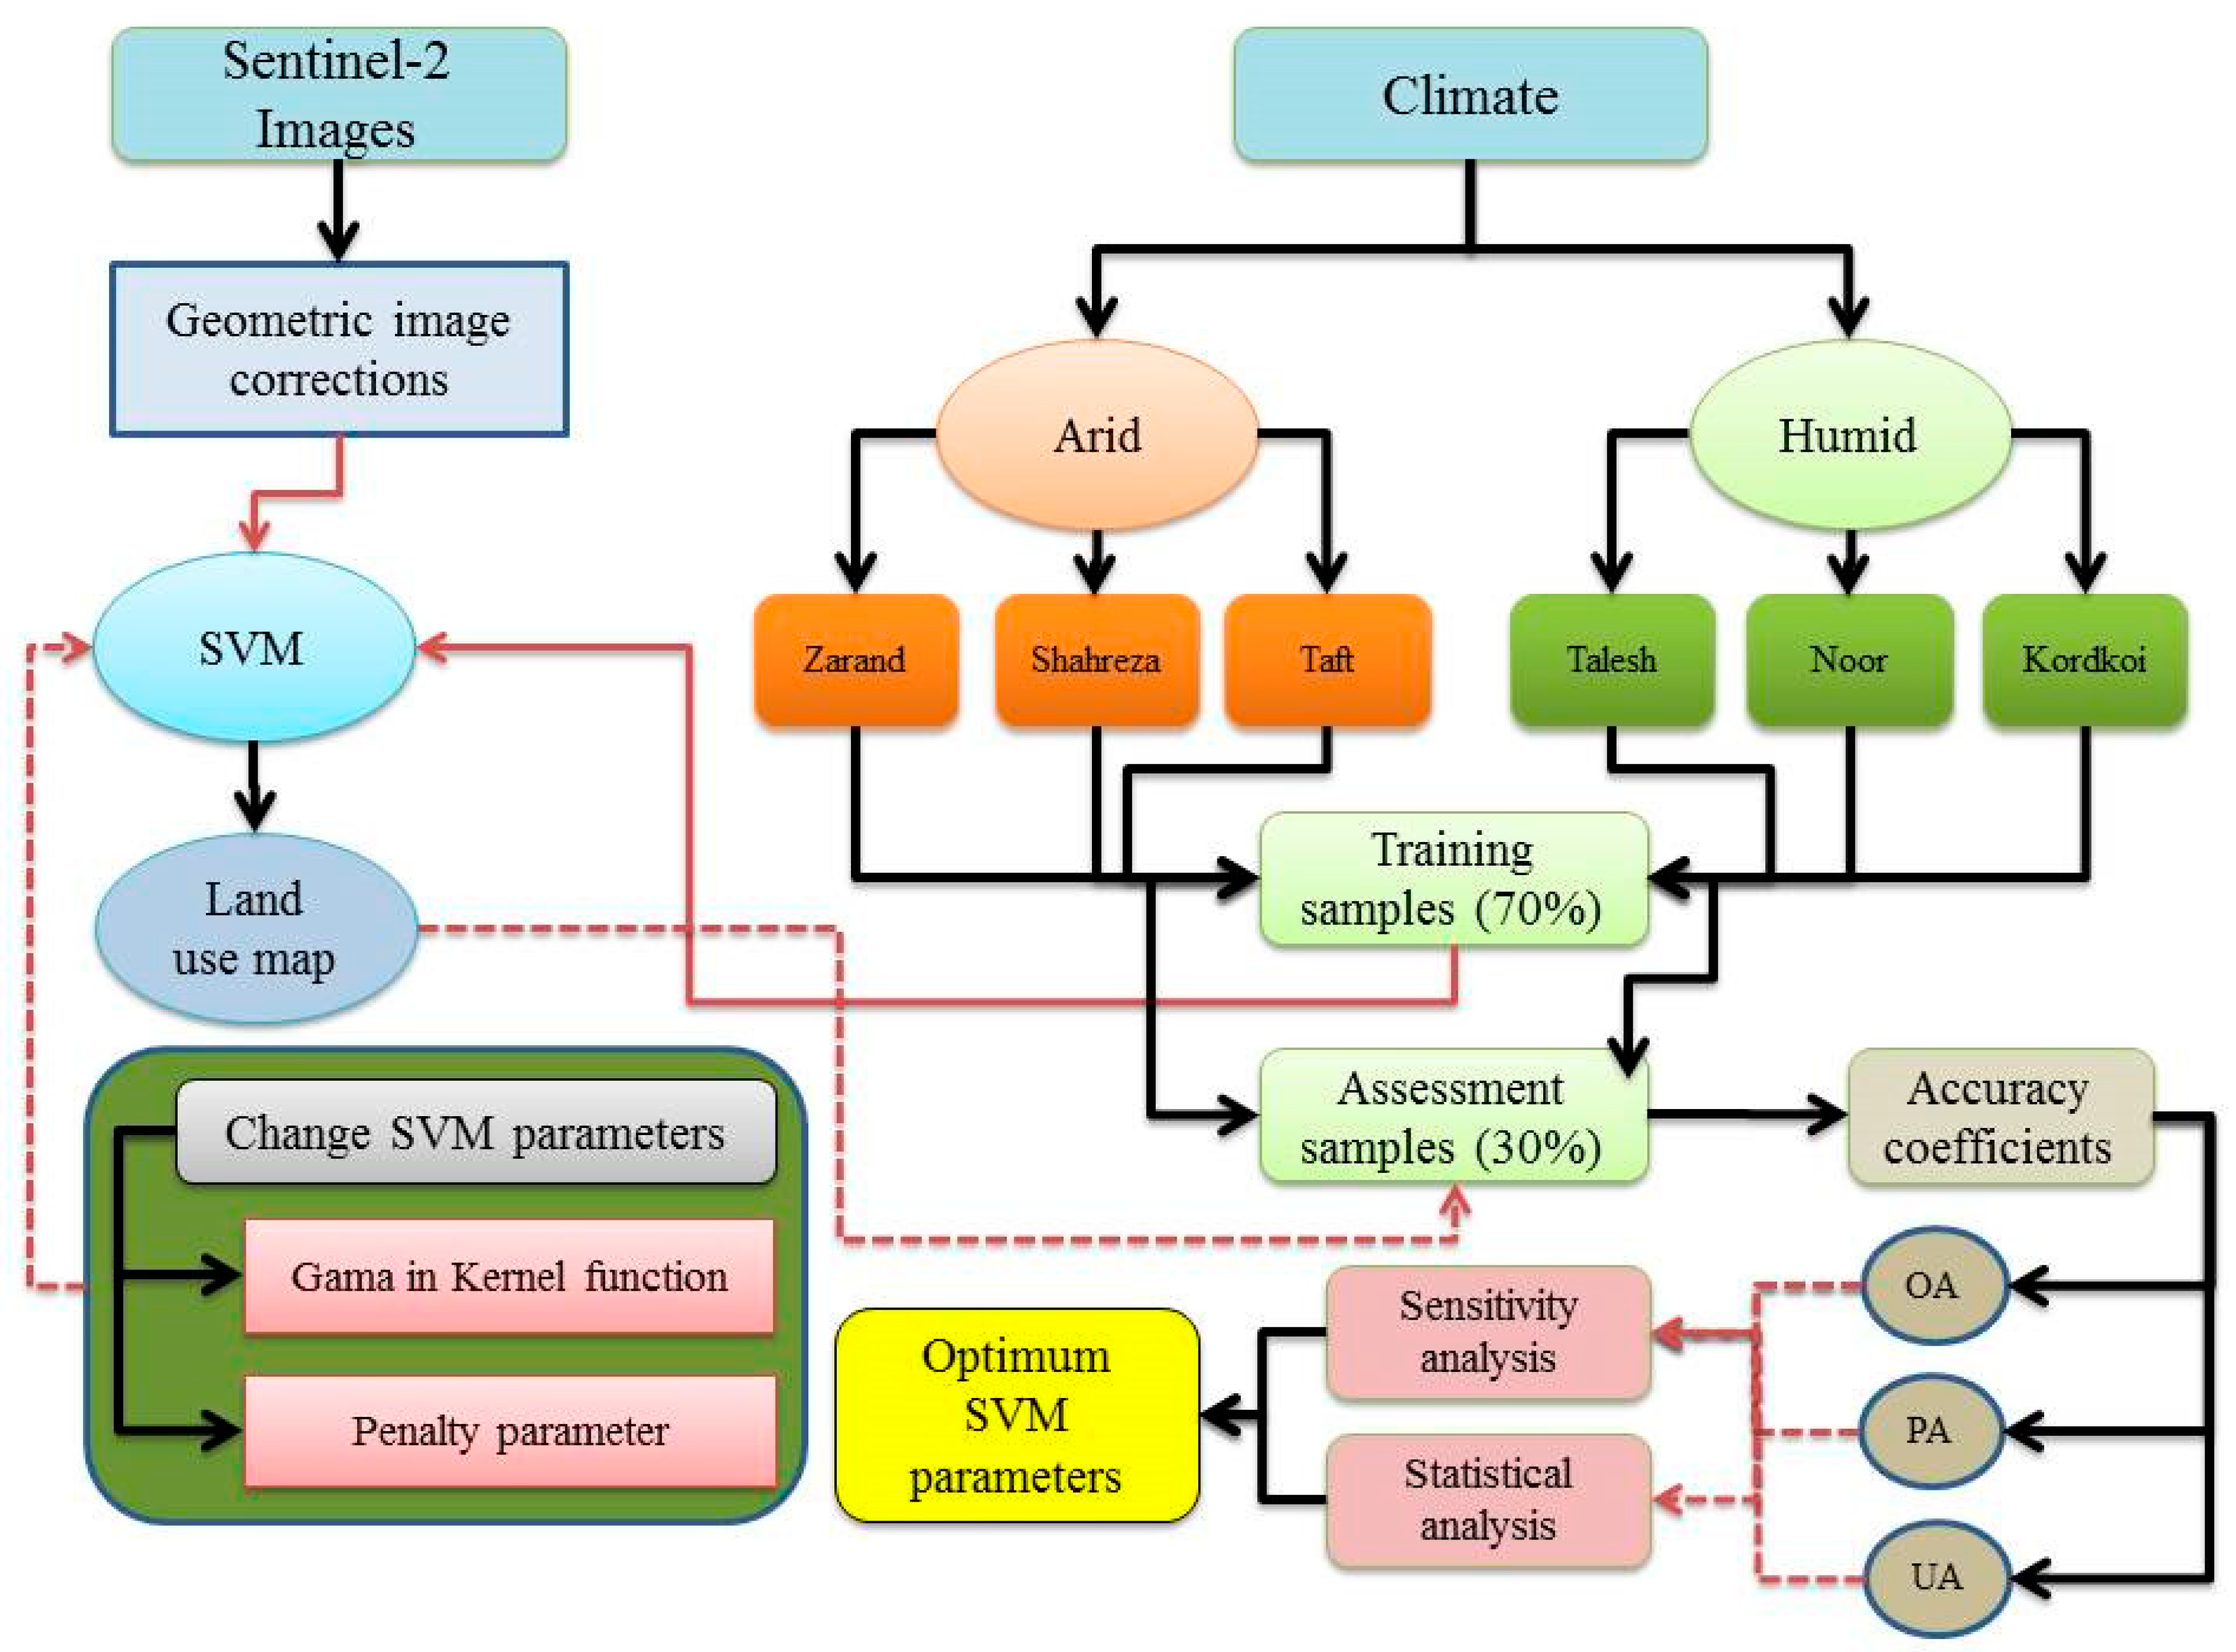
2. Materials and Methods

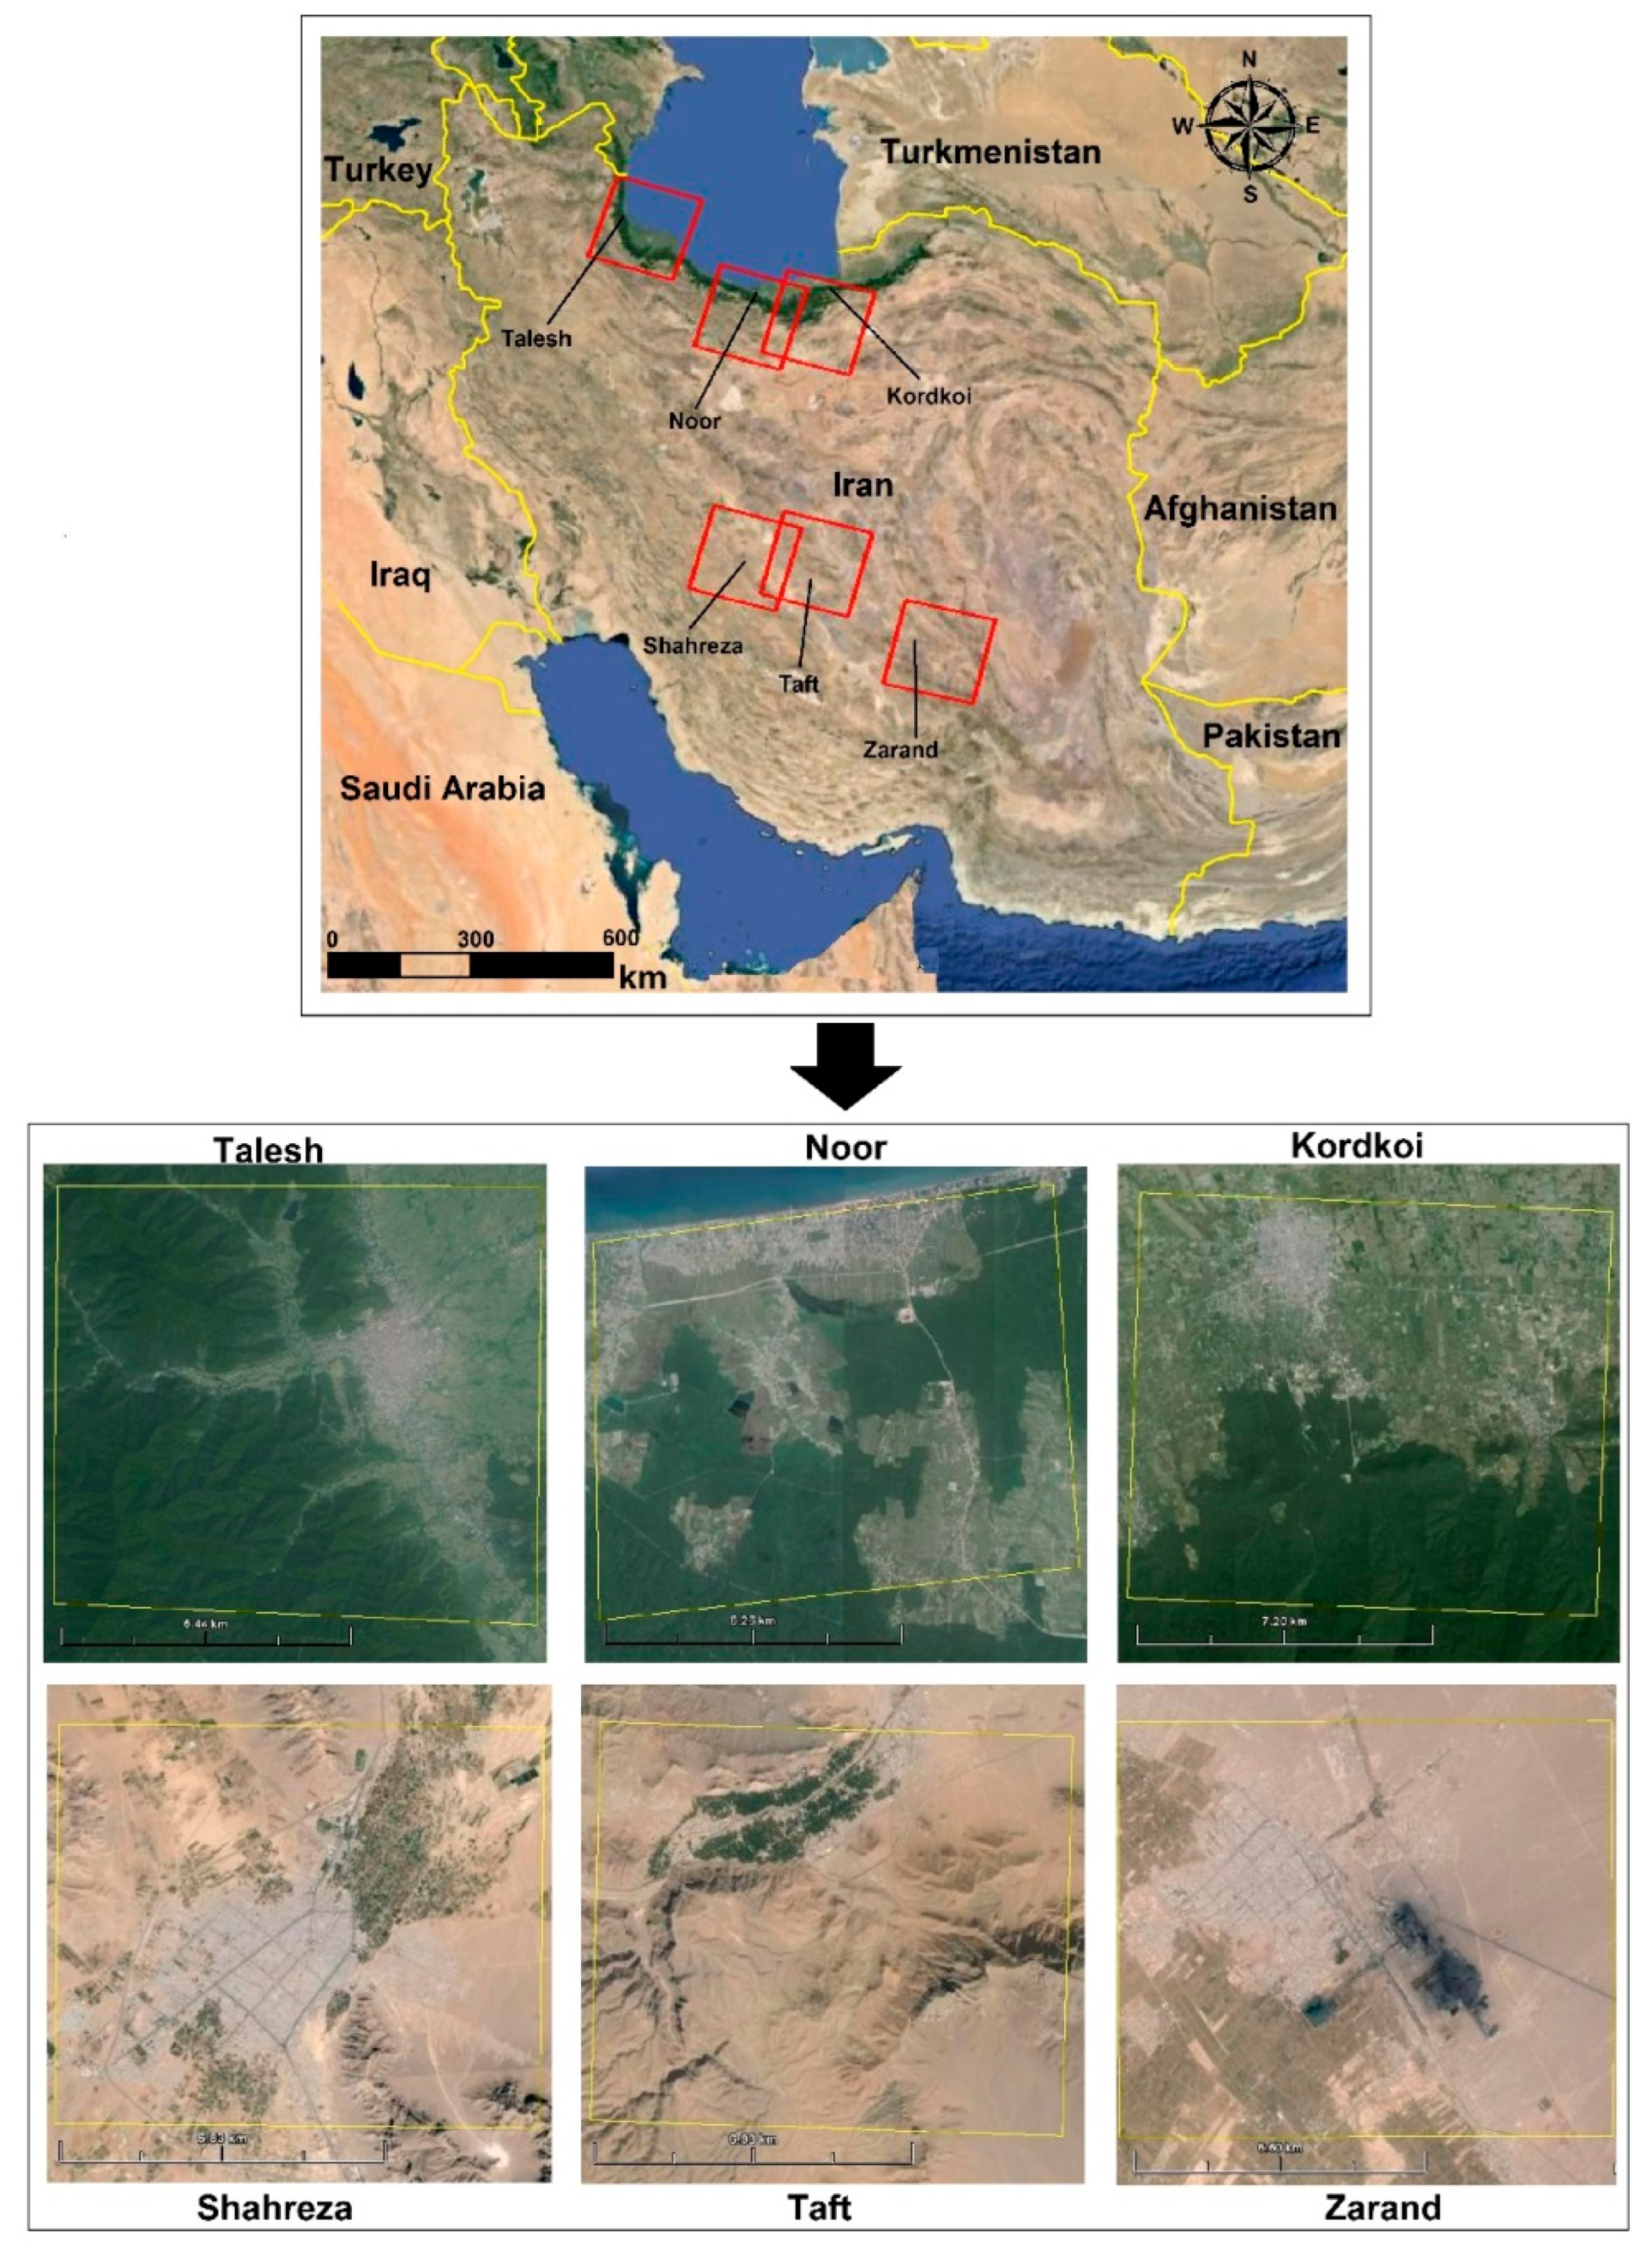
2.1. Study Sites and Data Sources

Iran is located in an arid belt with two arrays of mountains in the north and west [8,38]. Climatically, most of Iran is located in a dry climate, but in the north, between the Alborz mountain and the Caspian Sea, there is a humid climate with heavy rainfall and humidity [18].
Due to the fact that climate has a great role in determining land use and vegetation in each region, in the present research, the two main climates of Iran (humid and arid) were studied. Six study regions were determined based on distribution and data needs. For each climate, three study regions were selected based on distribution and data requirements (arid and humid). Shahreza in Esfahan province, Taft in Yazd province, and Zarand in Kerman province were chosen as arid climate locations. All these sites are located in the central region of Iran (Figure 1). Kordkoi, a city in Golestan province, Noor, a city in Mazandaran province and Talesh, a city in Gilan province, were also chosen as places with humid climates in the northwestern region of Iran (Figure 1). Based on Dumbarton’s climate categorization, all three selected case studies in the north and three selected case studies in the central region of Iran were classified as areas with humid and arid climates, respectively (Table 1).
The first step in developing a land use map has been to collect the Sentinel-2 satellite imagery from the Copernicus Earth Observation Program distributed by the US Geological Survey (https://earthexplorer.usgs.gov/, accessed on 27 July 2019). Then, the data were used to develop land cover maps for the study sites. The images were adjusted for topography using 1:25,000 scale topographic maps. In the present study, the LU/LC classes were determined by Anderson classification system Level 1, including built-up land, barren land, forest land and agricultural land [39].

2.2. Support Vector Machine (SVM)

The best approach for categorizing satellite imagery is still the object of research, and SVM is the latest algorithm to be tested. More specifically, SVM [1,30,40,41] is a non-parametric image classification algorithm that consists of a collection of related regression and classification learning algorithms [21,40,41,42,43,44]. Vapnik et al. [45] proposed the theory underlying SVM, which was extended by Weston et al. [46], Oommen et al. [13] and Filipovych and Davatzikos [31]. The SVM can discriminate between classes by maximizing the spread between classes on the decision surface. The surface is called the ideal hyperplane in most studies, whereas the support vectors are the data closest to the hyperplane. In this case, the support vectors are the most important aspects of the training set.
The penalty parameter in the SVM specifies an acceptable level of misclassification during the classification process, which is critical for training sets with challenging classes’ separation. The penalty parameter essentially allows for managing the trade-off between “allowing training errors” and “enforcing strict margins”. Increasing the penalty parameter in the SVM method reduces the number of misclassified pixels during classification, resulting in a more accurate model. In most remote sensing programs, the penalty parameter is set to 100.0 by default, but as the penalty parameter controls the degree of misclassification in the classification process, its control becomes critical for non-separable training sets. As the SVM algorithm is increasingly used to map land use/land cover using sentinel imagery, determining the optimal values of the penalty parameter in the SVM method is thus essential, by notably taking into account the different types of land cover and the corresponding surface land reflectance in arid and humid regions.
The kernel function projects the training sets into a large space, allowing the detection of a better sequestration buffer for the OSH [10,47]. In this work, the Radial Basis Function (RBF) was used as the kernel function. In addition, a pairwise SVM classification technique was applied in the ENVI 5.3 image multiclass processing environment. This method essentially generates a binary classifier for each pair of classes and selects the class with the highest probability of recognition in pairwise comparisons. In this work, the radial basis function (RBF) of SVM kernels was used., viz.:
Radial Basis Function: K (xi, xj) = exp (−y ‖(xi, xj)‖ 2), γ > 0
where y is the width of the kernel functionfor all kernel types exept linier type. In this equation y is a user-controled parameter and its correct defination significantly increas the accuracy of SVM algorithm. For all selected kernels, the pyramid levels, classification probability threshold and penalty parameter were set to the same values. In this scenario, the penalty parameter was always set to the highest value (1000) so that all pixels in the training examples converge to one class. The pyramid parameter was set to 0 for all kernels. The classification probability threshold was also set to zero to ensure that each image pixel receives only one class label and no pixel remains unclassified [48,49].

2.3. Geometric Corrections

In this work, the image-to-map function was used to geometric correction of the images for the study sites. For each study site, 25 controlling points in vector planes (roads, canals, and residential areas) were extracted from topographic maps. The points found were then matched with the corresponding points on the Sentinel-2 satellite imagery. The unsuitable points were then removed using the non-parametric polynomial approach, and geometric image matching was completed with 19 to 22 control points, resulting in a RMSE of the matched pixels between 0.11 and 0.18. Figure 2 shows the methodological flowchart for the work covered in this study.

3. Results

The SVM method was used to create land use maps for six research sites. Data for the existing land use/cover types were derived through GPS and a field study, and thus, training patterns were created for each land use/cover type in Arc GIS 10.4.2. Finally, the training patterns were randomly divided into two categories: (i) image classification (70%) and (ii) classification accuracy assessment (30%) (Table 2).
The same training pattern was reproduced for the different SVM classification parameters at each study site. The same scenario was used for the training patterns and the confusion matrix. Finally, using the SVM classification technique, land use/land cover maps with the best values of the gamma and penalty parameter in the kernel function for humid climates, such as Talesh (Figure 3a), Noor (Figure 3b) and Kordkoi, were constructed (Figure 3c). Furthermore, based on the ideal range of the gamma and penalty parameters in the kernel function, land use/cover maps for arid climates were created for Zarand (Figure 3d), Shahreza (Figure 3e) and Taft (Figure 3f).
As shown in Figure 3, in cities located in the north of Iran with a humid climates, forest cover is a dominant land use/land cover (Kordkoi with 73.1 ha, Noor with 67.5 ha and Talesh with 62.5 ha). Agricultural land is the second most widespread land use in these cities that happen due to the conversion of forest land use to farming (Kordkoi with 45.2 ha, Noor with 46.6 ha and Talesh with 30.5 ha). In cities with an arid climate, barren land is a dominant land use/land cover (Shahreza with 127.8 ha, Taft with 121.3 and Zarand with 109.4 ha).

Evaluation of Classification and Sensitivity Analysis

To compare the performance of the machine learning classification algorithm (SVM), we have used the confusion matrix technique. Confusion matrices were extracted for the classified images using true ground samples collected using GPS during the field survey. After the classification stage, the confusion matrix was extracted using ENVI 5.3 post classification process. In this study, the values for OA, product accuracy (PA) and user accuracy (UA) were used to evaluate the classification stage [21,50,51,52]. According to the current study, OA decreased with decreasing PP in both arid and humid climate regions (Figure 4). In addition, the downward trend caused by penalty values less than 0.1 showed a steeper increase (Figure 4). The overall accuracy for the six study areas spanned from 31% to 95% and was constant for penalty values less than 0.01 (Figure 4). Furthermore, adjusting the gamma values in the kernel function had little effect on the accuracy coefficients in both the arid and humid climate regions.
The likelihood that a specific land cover/land use in a region is classified as what is known as producer accuracy. According to the accuracy results, the best values of the penalty parameter for agricultural land in this study are 1000, but when the penalty parameter is less than 0.1, the accuracy of the results drops to zero (See Figure 5).
Furthermore, in the case of agricultural produce accuracy (PA), PP greater than 1 provides an acceptable value for accuracy for both arid and humid climate studies (Figure 5). Due to changes in PP, variability in produce accuracy for built-up land is high, but it generally decreases as the values of PP are reduced. Forest land is one of the most important classes in humid climates. Consequently, the algorithms used to classify forest lands using satellite imagery have a significant impact on the accuracy of the final land use/cover map. The results of generation accuracy in the forest land class show that the values of generation accuracy did not change significantly by changing the PP and are almost stable for three case studies in humid climates. The PP used for the barren land class accuracy in arid climate sites are too variable. For two case studies, Shahreza and Zarand, a rising trend in generation accuracy values leads to a decrease in PP values, especially for PP less than 0.1, causing generation accuracy to increase dramatically, even to 100% (Figure 5).
User accuracy (UA) is critical for classifying each study class. By changing the PP, in three case studies, we discovered that the user accuracy was steadier for agricultural land in humid areas than in arid ones. In agricultural land, PP less than 0.1 resulted in an intensive decrease in accuracy in the arid climate case studies. The highest value of UA for the built-up land class in humid and arid climates belongs to PP above 100, and the decreasing trend of UA of the built-up land class in case studies for arid climate is larger than that for case studies for humid climate. These results also show that increasing the PP has almost a stable effect on the UA of forest land class in humid areas (Figure 6).
The statistical mean comparison (Tukey test) for the arid and humid climate research areas showed that the OA of the maps produced differed significantly by different penalty parameter values at the 99% level (Table 3). In addition, the OA with different penalty parameter values showed significant differences at the 99% level for arid and humid climate areas.

4. Discussion

Machine learning algorithms are widely employed in land use/cover and mapping, among other applications. However, the impact of parameter selection on classification performance has received insufficient attention. Many studies have demonstrated that when SVM is used for classification, the kernel function and parameter values have a significant impact on classification results [37]. The results of this study show that the variability of SVM parameters is critical in image classification for land use/cover mapping. This finding illustrated that the accuracy of the land use/cover maps is highly dependent on the SVM parameters, especially the penalty parameter.
Tukey’s homogeneous grouping results show that in humid climate areas, the OA is divided into three groups based on different penalty parameter values. In addition, arid and both (arid and humid) climates are divided into two groups (Figure 7). Figure 7 shows that PP of less than 0.01 results in the lowest OA of the maps produced, whereas PP greater than 100 results in very accurate land use/cover maps. In general, maps produced in study areas with humid climates are more accurate over the entire range of PP than maps produced in study areas with arid climates. SVM has been shown to outperform other image classification algorithms in terms of accuracy [4,29,53,54].
The SVM algorithm has the advantage of solving the problem of imbalance between training locations [55]. The results of this study support the findings of [25,56], which found that SVM has higher accuracy than other image classification algorithms such as ANN, MD and ML. However, these researchers did not mention the SVM parameter and factors values. In the SVM algorithm, the penalty parameter (PP) controls the trade-off between minimizing and maximizing the training error and classification margin, respectively. In addition, the kernel parameters play an important role in determining the distance between patterns, dimensions and the complexity of new spaces of the classification model [57]. Therefore, the work described here is intended to build on recent research showing that the SVM algorithm is more accurate than alternative methods [11,28,33,58,59,60,61].
One of the most important advantages of the SVM classification method for land use mapping is the ability to export classified images with high accuracy from small training sets [1,14,60,62]. Shih et al. [58] compared different machine learning classifiers (ANN, SVM, RF, and DT) to produce land use and land cover maps using Landsat images in Ghana and China. They found that land use/cover map derived from the SVM algorithm in ENVI software has the highest OA in Ghana (72%). In addition, in this study, they did not mention the SVM parameters and variables which play a very important role in output accuracy. Mao et al. [59] compared machine learning methods for urban land use mapping used sentinel images, and they have compared RF, SVM and ANN methods and stated that the accuracy of the SVM algorithm is 78%, but they did not present any details about the SVM parameters such as PP. SVM image classification automatically determines the class area by statistical analysis of the training patterns. The results of the current study and the benefits of defined optimal SVM parameters help environmental and natural resource managers to quickly produce more accurate land use/cover maps in arid and humid climates, saving time and money. The details of the factors and parameters of the SVM algorithm play a very important role in the quality and accuracy of the output results of this algorithm as an application map. Unfortunately, in most studies, only this algorithm has been compared with other algorithms and the details of these algorithms, which play a very important role in the quality of output maps, have not been addressed. Based on the findings of this study in general, the land use/cover map produced from satellite images can be subject to many changes in accuracy with a slight change in the parameters of the SVM algorithm.
Most major natural hazard modeling requires a land use map [60,61,62]. These include hydrologic modeling [26,63], soil erosion modelling [64,65], land slide modelling [66,67], snow avalanche modelling [68,69], fluvial geomorphology [7], land scape modelling [65,70], gully erosion [71] and flood modelling [72,73,74,75]. Sensitivity analysis of the main variables of the SVM algorithm such as PP in this study showed that the appropriate range of value of each of these factors for land use/cover mapping using Sentinel-2 images in dry and humid climates.
Therefore, the results of the current study are crucial to obtain more accurate results in modeling and prediction of natural hazards for humid and arid climates.
Phan and Kappas [3] found that RF, SVM and k-NN classifiers produced diverse results when applied to classify six types of land use/land cover using Sentinel-2 image data in Vietnam’s Red River Delta. According to this study, SVM generated the highest OA (95.29%) with the least sensitivity to training sample sizes, followed by RF (94.44%) and k-NN (94.13%). These findings suggest that no accuracy criteria is adequate for all instances because accuracy relevance is determined by both the objective and the user.
Although in conjunction with an understanding of classification uncertainties, spatial information, including remotely sensed data, has been an excellent source of information for decision makers in land use/land cover management, thereby lowering the likelihood of making suboptimal and impractical choices. For this study, OA ranged from 31% to 95% (Figure 4) when using Sentinel 2 data to classify land use/land cover, with SVM producing the greatest accuracies. In addition, the adjustment of gamma values in the kernel function had little effect on the accuracy coefficients in both dry and humid climates. In addition, the adjustment of gamma values in the kernel function had little effect on the accuracy coefficients in both dry and humid climates.
This study also has some limitations. When the proposed method is used in real-world applications, there are a number of concerns that should be addressed. The spatial resolution of the Sentinel-2 satellite, for example, is around 10 m; as a result, some pixels (particularly those near surface class boundaries) are really mixed pixels combining multiple surface classes. As a result, the classification performance for these mixed pixels is insufficient, and a higher spatial resolution would provide a better result. Furthermore, the cloud may have a negative impact on classification accuracy. This can be somewhat solved by taking a satellite image with minimal cloud coverage or taking the median value of satellite images over a period of time.

5. Conclusions

Land cover/use mapping is a necessary step in managing many natural and human resources. The SVM algorithm has been proposed in this field as an efficient and accurate approach for classifying satellite imagery to produce land use maps, although optimization of SVM parameters requires extensive knowledge and frequent experimentation with different settings. Many research papers that claim that SVM is the most accurate classification model compared to other classification algorithms (i.e., ANN, RF and ML) do not specify the optimal values of SVM parameters, so their results are not very applicable for researchers in the field of land use/cover mapping technique. SVM is one of the well-known machine learning methods for classification. This model’s parameters, such as penalty parameter and kernel parameters, play a great role in the complexity and performance of this algorithm. In addition, these important parameters are usually selected and used as a black box, without understanding the internal details and optimal range in land use/cover mapping studies. Therefore, using Sentinel-2 images of humid and arid climatic regions in Iran, we adjusted the settings of the SVM algorithm to produce more accurate land use/cover maps. The systematic modification of the penalty parameters can serve as a direction for future research. Thus, our results provide a basis for constructing reliable land use/cover maps using Sentinel-2 images in arid and humid climates more broadly. We also found that agricultural land, forest land, barren land and built-up land in humid and arid climates are particularly sensitive to SVM parameters. However, further research is needed to confirm the general applicability and transferability of our approach.

Author Contributions

Conceptualization, S.Y., S.M. and H.A.; methodology, S.Y., H.G.A., S.M., N.S. and A.A.A.D.; software, S.Y. and H.G.A.; validation, S.Y., formal analysis, S.Y., H.A. and H.G.A. investigation, S.Y., H.G.A. and A.A.A.D.; resources, S.Y.; data curation, S.Y.; writing—original draft preparation, S.Y., H.A., C.G., N.S., S.M., A.A.A.D., M.A. and H.G.A. writing—review and editing, S.Y., H.A., A.A.A.D., C.G. and H.G.A.; visualization, S.Y.; A.A.A.D., M.A., S.M., N.S. and H.G.A. supervision, project administration, S.Y., funding acquisition, H.A. All authors have read and agreed to the published version of the manuscript.

Funding

The article processing charge was funded by the Deanship of Scientific Research, Qassim University.

Institutional Review Board Statement

Not applicable.

Informed Consent Statement

Not applicable.

Data Availability Statement

Not applicable.

Acknowledgments

The authors would like to thank the Deanship of Scientific Research, Qassim University for funding the publication of this project.

Conflicts of Interest

The authors declare no conflict of interest.

References

  1. Salberg, A.-B.; Jenssen, R. Land-cover classification of partly missing data using support vector machines. Int. J. Remote Sens. 2012, 33, 4471–4481. [Google Scholar] [CrossRef]
  2. Jacqueminet, C.; Kermadi, S.; Michel, K.; Béal, D.; Gagnage, M.; Branger, F.; Jankowfsky, S.; Braud, I. Land cover mapping using aerial and VHR satellite images for distributed hydrological modelling of periurban catchments: Application to the Yzeron catchment (Lyon, France). J. Hydrol. 2013, 485, 68–83. [Google Scholar] [CrossRef]
  3. Thanh Noi, P.; Kappas, M. Comparison of random forest, k-nearest neighbor, and support vector machine classifiers for land cover classification using Sentinel-2 imagery. Sensors 2018, 18, 18. [Google Scholar] [CrossRef] [PubMed] [Green Version]
  4. Pal, M.; Mather, P.M. Support vector machines for classification in remote sensing. Int. J. Remote Sens. 2005, 26, 1007–1011. [Google Scholar] [CrossRef]
  5. Schneider, A. Monitoring land cover change in urban and peri-urban areas using dense time stacks of Landsat satellite data and a data mining approach. Remote Sens. Environ. 2012, 124, 689–704. [Google Scholar] [CrossRef]
  6. Zhou, Z.; Wei, S.; Zhang, X.; Zhao, X. Remote sensing image segmentation based on self-organizing map at multiple-scale. In Proceedings of the Geoinformatics 2007: Remotely Sensed Data and Information, Nanjing, China, 20 August 2007; Volume 6752, p. 67520E. [Google Scholar]
  7. Yousefi, S.; Keesstra, S.; Pourghasemi, H.R.; Surian, N.; Mirzaee, S. Interplay between river dynamics and international borders: The Hirmand River between Iran and Afghanistan. Sci. Total Environ. 2017, 586, 492–501. [Google Scholar] [CrossRef]
  8. Yousefi, S.; Mirzaee, S.; Tazeh, M.; Pourghasemi, H.; Karimi, H. Comparison of different algorithms for land use mapping in dry climate using satellite images: A case study of the Central regions of Iran. Desert 2015, 20, 1–10. [Google Scholar] [CrossRef]
  9. Matinfar, H.R.; Sarmadian, F.; Panah, S.K.A.; Heck, R.J. Comparisons of Object-Oriented and Pixel-Based Classification of Land Use/Land Cover Types Based on Lansadsat7, Etm + Spectral Bands (Case Study: Arid Region of Iran) College of Geography, University of Tehran, Iran. Am.-Eurasian J. Agric. Environ. Sci. 2007, 2, 448–456. [Google Scholar]
  10. Szuster, B.W.; Chen, Q.; Borger, M. A comparison of classification techniques to support land cover and land use analysis in tropical coastal zones. Appl. Geogr. 2011, 31, 525–532. [Google Scholar] [CrossRef]
  11. Tigges, J.; Lakes, T.; Hostert, P. Urban vegetation classification: Benefits of multitemporal RapidEye satellite data. Remote Sens. Environ. 2013, 136, 66–75. [Google Scholar] [CrossRef]
  12. Shim, D. Remote sensing place: Satellite images as visual spatial imaginaries. Geoforum 2014, 51, 152–160. [Google Scholar] [CrossRef]
  13. Oommen, T.; Misra, D.; Twarakavi, N.K.C.; Prakash, A.; Sahoo, B.; Bandopadhyay, S. An objective analysis of support vector machine based classification for remote sensing. Math. Geosci. 2008, 40, 409–424. [Google Scholar] [CrossRef]
  14. Halder, A.; Ghosh, A.; Ghosh, S. Supervised and unsupervised landuse map generation from remotely sensed images using ant based systems. Appl. Soft Comput. J. 2011, 11, 5770–5781. [Google Scholar] [CrossRef]
  15. Mirzabaev, A.; Ahmed, M.; Werner, J.; Pender, J.; Louhaichi, M. Rangelands of Central Asia: Challenges and opportunities. J. Arid Land 2016, 8, 93–108. [Google Scholar] [CrossRef] [Green Version]
  16. Middleton, N.J.; Sternberg, T. Climate hazards in drylands: A review. Earth-Science Rev. 2013, 126, 48–57. [Google Scholar] [CrossRef]
  17. Yousefi, S.; Khatami, R.; Mountrakis, G.; Mirzaee, S.; Pourghasemi, H.R.; Tazeh, M. Accuracy assessment of land cover/land use classifiers in dry and humid areas of Iran. Environ. Monit. Assess. 2015, 187, 641. [Google Scholar] [CrossRef]
  18. Yousefi, S.; Sadeghi, S.H.; Mirzaee, S.; Van Der Ploeg, M.; Keesstra, S.; Cerdà, A. Spatio-temporal variation of throughfall in a hyrcanian plain forest stand in Northern Iran. J. Hydrol. Hydromechanics 2018, 66, 97–106. [Google Scholar] [CrossRef] [Green Version]
  19. Yousefi, S.; Moradi, H.; Boll, J.; Schönbrodt-Stitt, S. Effects of road construction on soil degradation and nutrient transport in Caspian Hyrcanian mixed forests. Geoderma 2016, 284, 103–112. [Google Scholar] [CrossRef]
  20. Hames, A.S. Comparison of Four Classification Methods to Extract Land Use and Land Cover from Raw Satellite Images for Some Remote Arid Areas, Kingdom of Saudi Arabia. J. King Abdulaziz Univ. 2009, 20, 167–191. [Google Scholar]
  21. Srivastava, P.K.; Han, D.; Rico-Ramirez, M.A.; Bray, M.; Islam, T. Selection of classification techniques for land use/land cover change investigation. Adv. Sp. Res. 2012, 50, 1250–1265. [Google Scholar] [CrossRef]
  22. Li, J.; Donselaar, M.E.; Hosseini Aria, S.E.; Koenders, R.; Oyen, A.M. Landsat imagery-based visualization of the geomorphological development at the terminus of a dryland river system. Quat. Int. 2014, 352, 100–110. [Google Scholar] [CrossRef]
  23. Lindquist, E.J.; D’Annunzio, R.; Gerrand, A.; MacDicken, K.; Achard, F.; Beuchle, R.; Brink, A.; Eva, H.D.; Mayaux, P.; San-Miguel-Ayanz, J. Global Forest Land-Use Change 1990–2005; FAO/JRC: Rome, Itlay, 2012; ISBN 9251073996. [Google Scholar]
  24. Gola, J.; Webel, J.; Britz, D.; Guitar, A.; Staudt, T.; Winter, M.; Mücklich, F. Objective microstructure classification by support vector machine (SVM) using a combination of morphological parameters and textural features for low carbon steels. Comput. Mater. Sci. 2019, 160, 186–196. [Google Scholar] [CrossRef]
  25. Mohammadi, A.; Shahabi, H.; Ahmad, B. Bin Land-cover change detection in a part of cameron highlands, malaysia using ETM+ satellite imagery and support vector machine (SVM) algorithm. EnvironmentAsia 2019, 12, 145–154. [Google Scholar] [CrossRef]
  26. Snelder, T.H.; Lamouroux, N.; Leathwick, J.R.; Pella, H.; Sauquet, E.; Shankar, U. Predictive mapping of the natural flow regimes of France. J. Hydrol. 2009, 373, 57–67. [Google Scholar] [CrossRef]
  27. Serda, M. Synteza i Aktywność Biologiczna Nowych Analogów Tiosemikarbazonowych Chelatorów Żelaza; Uniwersytet Śląski: Katowice, Poland, 2013; pp. 343–354. [Google Scholar] [CrossRef]
  28. Cheng, T.; Li, P. Multivariate variogram-based multichannel image texture for image classification. In Proceedings of the International Geoscience and Remote Sensing Symposium (IGARSS), Seoul, Korea, 29 July 2005; Volume 6, pp. 3830–3832. [Google Scholar]
  29. Yousefi, S.; Pourghasemi, H.R.; Hooke, J.; Navratil, O.; Kidová, A. Changes in morphometric meander parameters identified on the Karoon River, Iran, using remote sensing data. Geomorphology 2016, 271, 55–64. [Google Scholar] [CrossRef] [Green Version]
  30. Hayri Kesikoglu, M.; Haluk Atasever, U.; Dadaser-Celik, F.; Ozkan, C. Performance of ANN, SVM and MLH techniques for land use/cover change detection at Sultan Marshes wetland, Turkey. Water Sci. Technol. 2019, 80, 466–477. [Google Scholar] [CrossRef]
  31. Filipovych, R.; Davatzikos, C. Semi-supervised pattern classification of medical images: Application to mild cognitive impairment (MCI). Neuroimage 2011, 55, 1109–1119. [Google Scholar] [CrossRef] [Green Version]
  32. Wentz, E.A.; Stefanov, W.L.; Gries, C.; Hope, D. Land use and land cover mapping from diverse data sources for an arid urban environments. Comput. Environ. Urban Syst. 2006, 30, 320–346. [Google Scholar] [CrossRef]
  33. Thapa, R.B.; Murayama, Y. Urban mapping, accuracy, & image classification: A comparison of multiple approaches in Tsukuba City, Japan. Appl. Geogr. 2009, 29, 135–144. [Google Scholar] [CrossRef] [Green Version]
  34. Perumal, K.; Bhaskaran, R. Supervised classification performance of multispectral images. arXiv 2010, arXiv:1002.4046. [Google Scholar]
  35. Núñez, J.M.; Medina, S.; Ávila, G.; Montejano, J. High-Resolution Satellite Imagery Classification for Urban Form Detection. In Satellite Information Classification and Interpretation; IntechOpen: London, UK, 2019. [Google Scholar]
  36. Helber, P.; Bischke, B.; Dengel, A.; Borth, D. Eurosat: A novel dataset and deep learning benchmark for land use and land cover classification. IEEE J. Sel. Top. Appl. Earth Obs. Remote Sens. 2019, 12, 2217–2226. [Google Scholar] [CrossRef] [Green Version]
  37. Reis, B.P.; Martins, S.V.; Fernandes Filho, E.I.; Sarcinelli, T.S.; Gleriani, J.M.; Leite, H.G.; Halassy, M. Forest restoration monitoring through digital processing of high resolution images. Ecol. Eng. 2019, 127, 178–186. [Google Scholar] [CrossRef] [Green Version]
  38. Amiri, M.J.; Eslamian, S.S. Investigation of climate change in iran. J. Environ. Sci. Technol. 2010, 3, 208–216. [Google Scholar] [CrossRef] [Green Version]
  39. Anderson, J.R.; Hardy, E.E.; Roach, J.T.; Witmer, R.E. Land Use and Land Cover Classification System for Use With Remote Sensor Data; US Government Printing Office: Washington, DC, USA, 1976; Volume 964.
  40. Bray, M.; Han, D. Identification of support vector machines for runoff modelling. J. Hydroinformatics 2004, 6, 265–280. [Google Scholar] [CrossRef] [Green Version]
  41. Han, D.; Chan, L.; Zhu, N. Flood forecasting using support vector machines. J. Hydroinformatics 2007, 9, 267–276. [Google Scholar] [CrossRef]
  42. Remesan, R.; Bray, M.; Shamim, M.A.; Han, D. Rainfall-runoff modelling using a wavelet-based hybrid SVM scheme. In Proceedings of the IAHS-AISH Publication, Hyderabad, India, 6–12 September 2009; Volume 331, pp. 41–50. [Google Scholar]
  43. Abyaneh, H.Z.; Nia, A.M.; Varkeshi, M.B.; Marofi, S.; Kisi, O. Performance evaluation of ANN and ANFIS models for estimating garlic crop evapotranspiration. J. Irrig. Drain. Eng. 2011, 137, 280–286. [Google Scholar] [CrossRef]
  44. Zhang, H.; Jiang, Q.; Xu, J. Coastline Extraction Using Support Vector Machine from Remote Sensing Image. J. Multimed. 2013, 8, 175–182. [Google Scholar]
  45. Vapnik, V.; Guyon, I.; Hastie, T. Support vector machines. Mach. Learn 1995, 20, 273–297. [Google Scholar]
  46. Weston, J.; Mukherjee, S.; Chapelle, O.; Pontil, M.; Poggio, T.; Vapnik, V. Feature selection for SVMs. In Proceedings of the Advances in Neural Information Processing Systems, Denver, CO, USA, 1 January 2000; Volume 13, pp. 668–674. [Google Scholar]
  47. Anthony, G.; Gregg, H.; Tshilidzi, M. Image classification using SVMs: One-Against-One Vs One-against-All. In Proceedings of the 28th Asian Conf. Remote Sens. 2007, ACRS 2007, Kuala Lumpur, Malaysia, 12–16 November 2007; Volume 2, pp. 801–806. [Google Scholar]
  48. Petropoulos, G.P.; Knorr, W.; Scholze, M.; Boschetti, L.; Karantounias, G. Combining ASTER multispectral imagery analysis and support vector machines for rapid and cost-effective post-fire assessment: A case study from the Greek wildland fires of 2007. Nat. Hazards Earth Syst. Sci. 2010, 10, 305–317. [Google Scholar] [CrossRef] [Green Version]
  49. Petropoulos, G.P.; Kontoes, C.; Keramitsoglou, I. International Journal of Applied Earth Observation and Geoinformation Burnt area delineation from a uni-temporal perspective based on Landsat TM imagery classification using Support Vector Machines. Int. J. Appl. Earth Obs. Geoinf. 2011, 13, 70–80. [Google Scholar] [CrossRef]
  50. De Backer, A.; Adam, S.; Monbaliu, J.; Toorman, E.; Vincx, M.; Degraer, S. Remote sensing of biologically reworked sediments: A laboratory experiment. Estuaries Coasts 2009, 32, 1121–1129. [Google Scholar] [CrossRef] [Green Version]
  51. Aguilar, M.A.; Saldaña, M.M.; Aguilar, F.J. GeoEye-1 and WorldView-2 pan-sharpened imagery for object-based classification in urban environments. Int. J. Remote Sens. 2013, 34, 2583–2606. [Google Scholar] [CrossRef]
  52. Mirzaee, S.; Yousefi, S.; Keesstra, S.; Pourghasemi, H.R.; Cerdà, A.; Fuller, I.C. Effects of hydrological events on morphological evolution of a fluvial system. J. Hydrol. 2018, 563, 33–42. [Google Scholar] [CrossRef] [Green Version]
  53. Foody, G.M.; Mathur, A. A relative evaluation of multiclass image classification by support vector machines. IEEE Trans. Geosci. Remote Sens. 2004, 42, 1335–1343. [Google Scholar] [CrossRef] [Green Version]
  54. Melgani, F.; Bruzzone, L. Classification of hyperspectral remote sensing images with support vector machines. IEEE Trans. Geosci. Remote Sens. 2004, 42, 1778–1790. [Google Scholar] [CrossRef] [Green Version]
  55. Huang, C.; Davis, L.S.; Townshend, J.R.G. An assessment of support vector machines for land cover classification. Int. J. Remote Sens. 2002, 23, 725–749. [Google Scholar] [CrossRef]
  56. Gualtieri, J.A.; Cromp, R.F. Support vector machines for hyperspectral remote sensing classification. In Proceedings of the 27th AIPR Workshop: Advances in Computer-Assisted Recognition; International Society for Optics and Photonics, Washington, DC, USA, 29 January 1999; Volume 3584, pp. 221–232. [Google Scholar]
  57. Tharwat, A. Parameter investigation of support vector machine classifier with kernel functions. Knowl. Inf. Syst. 2019, 61, 1269–1302. [Google Scholar] [CrossRef]
  58. Shih, H.; Stow, D.A.; Tsai, Y.H. Guidance on and comparison of machine learning classifiers for Landsat-based land cover and land use mapping. Int. J. Remote Sens. 2019, 40, 1248–1274. [Google Scholar] [CrossRef]
  59. Mao, W.; Lu, D.; Hou, L.; Liu, X.; Yue, W. Comparison of machine-learning methods for urban land-use mapping in Hangzhou city, China. Remote Sens. 2020, 12, 2817. [Google Scholar] [CrossRef]
  60. Yousefi, S.; Pourghasemi, H.R.; Emami, S.N.; Pouyan, S.; Eskandari, S.; Tiefenbacher, J.P. A machine learning framework for multi-hazards modeling and mapping in a mountainous area. Sci. Rep. 2020, 10, 12144. [Google Scholar] [CrossRef]
  61. Yousefi, S.; Pourghasemi, H.R.; Emami, S.N.; Rahmati, O.; Tavangar, S.; Pouyan, S.; Tiefenbacher, J.P.; Shamsoddini, S.; Nekoeimehr, M. Assessing the susceptibility of schools to flood events in Iran. Sci. Rep. 2020, 10, 18114. [Google Scholar] [CrossRef] [PubMed]
  62. Pourghasemi, H.R.; Kariminejad, N.; Amiri, M.; Edalat, M.; Zarafshar, M.; Blaschke, T.; Cerda, A. Assessing and mapping multi-hazard risk susceptibility using a machine learning technique. Sci. Rep. 2020, 10, 3203. [Google Scholar] [CrossRef] [PubMed] [Green Version]
  63. O’Driscoll, M.; Clinton, S.; Jefferson, A.; Manda, A.; McMillan, S. Urbanization Effects on Watershed Hydrology and In-Stream Processes in the Southern United States. Water 2010, 2, 605–648. [Google Scholar] [CrossRef]
  64. Palacio, R.G.; Bisigato, A.J.; Bouza, P.J. Soil erosion in three grazed plant communities in northeastern Patagonia. L. Degrad. Dev. 2014, 25, 594–603. [Google Scholar] [CrossRef]
  65. Sun, G.; McNulty, S.G. Modeling soil erosion and transport on forest landscape. In Proceedings of the Steamboat Springs, CO: International Erosion Control Association, Reno, NV, USA, 16–20 February 1998; pp. 189–198. [Google Scholar]
  66. Youssef, A.M.; Pourghasemi, H.R.; El-Haddad, B.A.; Dhahry, B.K. Landslide susceptibility maps using different probabilistic and bivariate statistical models and comparison of their performance at Wadi Itwad Basin, Asir Region, Saudi Arabia. Bull. Eng. Geol. Environ. 2016, 75, 63–87. [Google Scholar] [CrossRef]
  67. Feizizadeh, B.; Blaschke, T. Comparing GIS-Multicriteria Decision Analysis for landslide susceptibility mapping for the lake basin, Iran. Int. Geosci. Remote Sens. Symp. 2012, 65, 5390–5393. [Google Scholar] [CrossRef]
  68. Christophe, C.; Georges, R.; Jérôme, L.S.; Markus, S.; Pascal, P. Spatio-temporal reconstruction of snow avalanche activity using tree rings: Pierres Jean Jeanne avalanche talus, Massif de l’Oisans, France. Catena 2010, 83, 107–118. [Google Scholar] [CrossRef]
  69. Bellaire, S.; van Herwijnen, A.; Mitterer, C.; Schweizer, J. On forecasting wet-snow avalanche activity using simulated snow cover data. Cold Reg. Sci. Technol. 2017, 144, 28–38. [Google Scholar] [CrossRef]
  70. Giriraj, A.; Irfan-Ullah, M.; Murthy, M.S.R.; Beierkuhnlein, C. Modelling spatial and temporal forest cover change patterns (1973–2020): A case study from South Western Ghats (India). Sensors 2008, 8, 6132–6153. [Google Scholar] [CrossRef] [Green Version]
  71. Pourghasemi, H.R.; Yousefi, S.; Kornejady, A.; Cerdà, A. Performance assessment of individual and ensemble data-mining techniques for gully erosion modeling. Sci. Total Environ. 2017, 609, 764–775. [Google Scholar] [CrossRef] [Green Version]
  72. Kiss, T.; Blanka, V. River channel response to climate- and human-induced hydrological changes: Case study on the meandering Hernád River, Hungary. Geomorphology 2012, 175–176, 115–125. [Google Scholar] [CrossRef]
  73. Shafizadeh-Moghadam, H.; Valavi, R.; Shahabi, H.; Chapi, K.; Shirzadi, A. Novel forecasting approaches using combination of machine learning and statistical models for flood susceptibility mapping. J. Environ. Manag. 2018, 217, 1–11. [Google Scholar] [CrossRef] [PubMed] [Green Version]
  74. Hazarika, N.; Barman, D.; Das, A.K.; Sarma, A.K.; Borah, S.B. Assessing and mapping flood hazard, vulnerability and risk in the Upper Brahmaputra River valley using stakeholders’ knowledge and multicriteria evaluation (MCE). J. Flood Risk Manag. 2016, 11, S700–S716. [Google Scholar] [CrossRef]
  75. Yousefi, S.; Mirzaee, S.; Keesstra, S.; Surian, N.; Pourghasemi, H.R.; Zakizadeh, H.R.; Tabibian, S. Effects of an extreme flood on river morphology (case study: Karoon River, Iran). Geomorphology 2018, 304, 30–39. [Google Scholar] [CrossRef]
Figure 1. The arid and humid climate case studies’ geographical locations in Iran.
Land 11 00993 g001
Figure 2. Flowchart of the SVM optimization methodology.
Land 11 00993 g002
Figure 3. Land use/cover map created using SVM in humid ((a) (Kordkoi), (b) (Noor) and (c) (Talesh)) and arid ((d) (Zarand), (e) (Taft) and (f) (Shahreza)) case studies.
Land 11 00993 g003
Figure 4. Overall accuracy (OA) sensitivity analysis for six study areas.
Land 11 00993 g004
Figure 5. Produce accuracy (PA) sensitivity analysis for six study areas.
Land 11 00993 g005
Figure 6. User accuracy (UA) sensitivity analysis for six study areas.
Land 11 00993 g006
Figure 7. Tukey’s homogeneous grouping for arid, humid or both climates.
Land 11 00993 g007
Table 1. Summary of metadata for the humid and arid climate study sites.
ClimateStudy Area Area (km2)Annual Precipitation (mm)Sentinel-2 Images
HumidKordkoi113.5897013 August 2019
Noor89.19103012 Juny 2019
Talesh107.61113025 July 2019
AridShahreza95.61408 August 2019
Taft91.9816410 August 2019
Zarand107.611117 August 2019
Table 2. Characteristics of the LU/LC training sites.
ClimateCase StudyLand CoverTraining (ha)Accuracy Assessment (ha)
HumidKordkoiForest land71.320.9
Built-up land5.92.3
Agricultural land45.214.5
NoorForest land67.524.8
Built-up land 9.33.5
Agricultural land46.612.3
TaleshForest land62.626.6
Built-up land 6.22.7
Agricultural land30.59.8
Water 2.30.8
AridShahrezaBuilt-up land6.42.6
Agricultural land22.78.8
Barren land127.841.2
TaftBuilt-up land3.71.2
Agricultural land19.85.7
Barren land 121.338.7
ZarandBuilt-up land11.14.1
Agricultural land89.236.7
Barren land 109.435.1
Table 3. Compare mean values for overall accuracy (OA) using one-way ANOVA.
Climate LocationsMean SquaredfFSig.
Humid113065.120.006
Arid1211620.070.000
Humid and Arid 2341615.070.000
Publisher’s Note: MDPI stays neutral with regard to jurisdictional claims in published maps and institutional affiliations.

