Article

Exploring Functional Diversity and Community Structure of Diazotrophic Endophytic Bacteria Associated with Pennisetum glaucum Growing under Field in a Semi-Arid Region

1
Institute of Bioscience and Technology, Shri Ramswaroop Memorial University, Lucknow-Deva Road, Barabanki 225003, India
2
Indian Agricultural Research Institute, Pusa, New Delhi 110012, India
3
Department of Biotechnology, Vignan’s Foundation for Science, Technology and Research, Vadlamudi, Guntur 522213, India
4
Department of Biotechnology, Smt. S. S. Patel Nootan Science & Commerce College, Sankalchand Patel University, Visnagar 384315, India
5
Department of Agriculture, Food, Environment and Forestry, University of Florence, P.le delle Cascine 28, 50144 Firenze, Italy
6
Hainan Key Laboratory for Sustainable Utilization of Tropical Bioresource, College of Tropical Crops, Hainan University, Haikou 570228, China
7
Institute of Genetics and Plant Experimental Biology, Uzbekistan Academy of Sciences, Kibray 111208, Uzbekistan
8
Department of Geology and Pedology, Faculty of Forestry and Wood Technology, Mendel University in Brno, Zemedelska 1, 61300 Brno, Czech Republic
9
Centre for Biotechnology, Department of Biological Sciences, Birla Institute of Technology and Science, Pilani 333031, India
*
Authors to whom correspondence should be addressed.
Land 2022, 11(7), 991; https://doi.org/10.3390/land11070991
Submission received: 23 May 2022 / Revised: 16 June 2022 / Accepted: 17 June 2022 / Published: 29 June 2022

Abstract

:
Diazotrophic endophytic bacteria (DEB) are the key drivers of nitrogen fixation in rainfed soil ecosystems and, hence, can influence the growth and yield of crop plants. Therefore, the present work investigated the structure and composition of the DEB community at different growth stages of field-grown pearl millet plants, employing the cultivation-dependent method. Diazotrophy of the bacterial isolates was confirmed by acetylene reduction assay and amplification of the nifH gene. ERIC-PCR-based DNA fingerprinting, followed by 16S rRNA gene analysis of isolates recovered at different time intervals, demonstrated the highest bacterial diversity during early (up to 28 DAS (Days after sowing)) and late (63 DAS onwards) stages, as compared to the vegetative growth stage (28–56 DAS). Among all species, Pseudomonas aeruginosa was the most dominant endophyte. Assuming modulation of the immune response as one of the tactics for successful colonization of P. aeruginosa PM389, we studied the expression of the profile of defense genes of wheat, used as a host plant, in response to P. aeruginosa inoculation. Most of the pathogenesis-related PR genes were induced initially (at 6 h after infection (HAI)), followed by their downregulation at 12 HAI. The trend of bacterial colonization was quantified by qPCR of 16S rRNAs. The results obtained in the present study indicated an attenuated defense response in host plants towards endophytic bacteria, which is an important feature that helps endophytes establish themselves inside the endosphere of roots.

1. Introduction

Nitrogen is the most limiting nutrient for the growth of plants. Most modern agricultural practices use industrially manufactured fertilizer. However, drawbacks associated with chemical fertilizers, such as the use of fossil fuels for manufacturing fertilizers, greenhouse gases emission during the manufacturing process, and contamination of the water system by nitrate, due to its leaching, make them unsuitable for agricultural practices [1]. In recent years, plant growth-promoting diazotrophic (nitrogen-fixing) endophytic bacteria and their potential to replace, or minimize, the use of chemical fertilizer has gained immense attention [2]. Endophytic bacteria reside inside plant tissue and can benefit host plants directly (nitrogen fixation, phytohormone production, phosphate solubilization, amelioration of biotic and abiotic stress due to ACC deaminase activity, and biocontrol activities, etc.) and indirectly (siderophore production, lytic enzymes, etc.) [3,4].
Diazotrophic endophytic bacteria have been isolated from diverse crop plant species [5], but only a few studies have been conducted on the isolation and characterization of diazotrophic bacteria from pearl millet [Pennisetum glaucum (L.) R. Br.] [6,7]. Pearl millet is a staple cereal of the hottest, driest areas of the tropics and subtropics, used for both grain and forage, and can be a healthy alternative to wheat. It is the main cereal crop grown in Rajasthan, the largest state, during ‘Kharif’ (rainy to autumn) season. Its life cycle span is 70–75 days [8]. The composition of the microbial community is very dynamic and subject to changes in response to environmental cues. As the endophytic bacterial community is shaped by both soil and plant factors, they are prone to be altered depending on the physiological changes occurring at different plant growth stages [9].
Generally, plants have a strong immune response which plays an important role in protection from the attack of invading microbes. Like animals, plants exhibit the first line of defense (pattern-triggered immunity (PTI) and effector-triggered immunity (ETI)), the second line of defense mediated by hormone signaling and acquired resistance. These defense mechanisms help plants respond to the intruder’s invasion without any self-reactivity and develop long-term memory (SAR in pathogens and ISR in beneficial microbes) for future attacks [10]. Pathogenesis-related (PR) proteins produced in plants during the generation of the immune response are eminent in combating biotic stress conditions. PR proteins are usually absent or produced at basal concentrations in healthy tissues, but they are induced and accumulated upon microbial invasion [11]. Since endophytic bacteria are also alien to the plants, plants do respond to them and induce an immune response in host plants. Recent evidence suggests that beneficial bacteria developed decoy strategies to short-circuit hormone-regulated defense responses, which paves the way for long-term association for mutualism [12,13].
Therefore, the overall aim for the present study was to elucidate the community structure and temporal dynamics of endophytic diazotrophic bacteria at various growth stages of pearl millet plants in natural farming conditions. The understanding of the diazotrophic microbial community and its function in a given plant can be utilized to harness beneficial bacteria-plant association for enhancing the growth and yield of the plant. In addition, the present study aimed to identify and characterize the dominant diazotrophic bacterial species in the entire season, which has already been published in our previous articles [14,15]. Further, we aimed to estimate the level of immune response generated to the most dominant endophytic bacteria in the wheat plant, and to correlate this with the success of bacterial colonization in-planta. The level of immune response was estimated by measuring PR gene expression in endophyte-treated plants. We chose wheat plants instead of a model plant, such as Arabidopsis thaliana or tobacco, as hosts for immune response studies, as the former is a major cereal crop world-wide, whereas the model plants have no significance from an agricultural point of view. Further, understanding of endophyte-crop plant association could be helpful in increasing the yield of crop plants in the future. Therefore, it is important to understand the strategies deployed by endophytic bacteria to subsist the host immune responses, as well as the role of plants in helping endophytic bacteria to establish themselves inside the plants.

2. Materials and Methods

2.1. Plant Variety and Sampling Site

Pennisetum glaucum variety Sanker, a hybrid variety, was used in the present study. The selection of the seed variety was based on the farmer’s experience and feedback. It was obtained from a local commercial supplier. The study site was a pearl millet field (60.96 × 152.40 m2) located in Pilani, an extreme northeastern part (28.37° N 75.6° E) of Rajasthan (India). The study area has a semi-arid climate, uncertain and erratic rainfall (300–500 mm annually), high wind velocity (20.62 Kmph), and nutrient-deficient sandy clay loam soil, belonging to the Typic haplocamborthid class (USDA). In summer, the temperature ranges from 35–48 °C, while it varies from 1–10 °C in the winter season and sometimes it falls below 0 °C [16,17]. Pre-sowing soil properties of the selected field were as follows: pH 9.3, EC (Electrical conductivity) 0.43 dSm−1, OC (Organic Carbon) 0.06%, Olsen P (Available Phosphate) 11.90 mg Kg−1, total N 102.7 mg Kg−1, Zn 0.56 µg g−1, Mn 13.63 µg g−1, Fe 24.24 µg g−1 and Cu 1.09 µg g−1. The selected field was not supplemented with any kind of organic or inorganic fertilizers. Healthy plant samples were collected and processed as described in a previous study [14]. Soil and plant samples were collected randomly in triplicate every seventh day (weekly) from the seed sowing stage to the harvesting stage of the crop. For plants taken 56 days after sowing (DAS), the aerial portion of the plant was divided equally into lower (closer to root), middle and upper parts, each of 50–60 cm in length. This was done in order to explore the distribution of endophytic bacteria in aerial parts and to track their upward movement, if any. Plant samples were transferred to the laboratory and processed immediately. Each part was processed separately for isolation and analysis of diazotrophic endophytic bacteria.

2.2. Culture Media

LGI medium (Composition: per liter, CaCO3 1.0 g, K2HPO4 1.0 g, MgSO4.7H2O 0.2 g, FeSO4.7H2O 0.1 g, Na2MoO4.2H2O 5.0 mg, Sucrose 5 g, pH 5.5) was used for isolation and maintenance of the diazotrophic bacteria [18]. The spread plate method was used for the isolation of bacteria and its dilution form 10−1 to 10−5 was plated onto Nutrient Agar and LGI media to calculate the total endophytic population and diazotrophic bacteria, respectively. Nutrient agar (NA) (Himedia, Mumbai, India) was used to assess the efficiency of the sterilization process for the enumeration of total endophytic bacteria. Semi-solid agar LGI medium was used for testing the nitrogenase activity of the bacterial isolates. Then, 1.5% and 0.3% agar-agar were added to the medium for solid-agar plates and a semi-solid medium, respectively. All reagents were of analytical grade and were prepared using distilled water obtained from a Milli-Q system.

2.3. Isolation of Endophytic Bacteria

Pearl millet plants were collected and endophytic bacteria were isolated as described earlier [14]. Each isolate was maintained as pure culture and sub-cultured for several generations to ensure diazotrophic nature. Glycerol stock (15% w/v) for each isolate was prepared and stored at −70 °C until further use.

2.4. Enterobacterial Repetitive Intergenic Consensus Sequences-PCR (ERIC-PCR)

The DNA template for PCR was prepared by the “Boiling lysis method”, as described in [19] and an ERIC-PCR of each sample was performed using the PTC thermal cycler (MJ Research, Inc., Walthon, MA, USA), as described earlier [14,20]. The amplified products were analyzed on 2% agarose gel using a gel documentation unit (Bio-Rad, Hercules, CA, USA). The ERIC profiles of all the isolates obtained at different weeks were analyzed by comparing the pattern of amplicons in agarose gel. Isolates showing identical banding patterns were considered to be the same strain.

2.5. Amplification and Analysis of 16S Ribosomal RNA Gene

The 1.5 kb amplicons of the 16S rRNA gene of each isolate were amplified, sequenced, and analyzed, as described earlier [14]. Amplified PCR products were visualized on 1% agarose gel and further PCR products were used for sequencing to identify the strains.

2.6. 16S Ribosomal RNA Gene Sequencing

Bacterial taxonomic affiliations were assigned, based on the closest match to sequences available at the NCBI database (http://www.ncbi.nlm.nih.gov/, accessed on 21 May 2022) using the BLAST algorithm [21]. A 98% threshold of 16S rRNA gene sequence matching was used to assign the taxa of isolates. The 16S rRNA genes of the strains were submitted to NCBI GenBank. A phylogenetic tree was constructed using partial rRNA gene sequences of bacterial strains obtained in this study, using the Neighbor-Joining method in MEGA 4.0 [22].

2.7. Diversity Index and Relative Species Abundance (RSA)

In order to elucidate the community structure of endophytic bacteria, two important measures were taken into consideration. First, we estimated overall bacterial diversity, based on species richness and evenness. Second, we measured relative species abundance to identify the most dominant species present at different growth stages of pearl millet. Diversity was estimated by calculating the Shannon diversity index and the diversity curves were prepared separately for strains recovered from all plant parts (using PAST software version 2.10). Shannon’s diversity index (DI) is important to compare the differences between the two communities. The Hill’s first and second diversity numbers were used to estimate genera diversity. Hill’s first number is a modification of Shannon’s index, where N1 = eH’, and H’ was estimated using the equation
H = i = 1 G [ ( ni / n )   ln ( ni / n ) ]
where, Pi = ni/N (Total cfu of ith species /total cfu of endophytic bacterial species), ith species refers to species of interest [23]. Shannon’s index is based on the data corresponding to the total number of bacterial isolates per identified species obtained in different growth stages of pearl millet. Identification of species was based on 16S rRNA gene sequence analysis.
The relative species abundance (RSA) was calculated to understand the abundance and dominance of bacterial species isolated from various plant parts at different time periods [24]. Apart from abundance of species in a sample, it also reveals the status of species richness indirectly. RSA was calculated by the following formula: Total cfu of ith species/total CFU of endophytic bacterial species, where ith species refers species of interest (e.g., P. aeruginosa), which was identified on the basis of 16S rRNA gene sequence analysis. To identify the rank of different species in the endophytic community at a particular sampling time, the rank abundance curves (Preston curve) were plotted using PAST software 2.10.

2.8. Estimation of Plant Growth-Promoting Properties

2.8.1. Acetylene Reduction Assay

Acetylene reduction assay (ARA) was used to quantify the activity of nitrogenase, a key enzyme in the nitrogen-fixation reaction. All strains were subjected to ARA according to previous research [14]. A culture of standard Escherichia coli strain was used as a negative control. Three replications for each treatment and control were subjected to analysis. Culture present on the slant was carefully picked and used for extraction and estimation of soluble protein, using Lowry’s method [25]. ARA activity was expressed in nmoles of ethylene-produced mg−1 protein hr−1.

2.8.2. Amplification of nifH Gene

To confirm diazotrophy at the molecular level, nifH gene encoding dinitrogenase reductase was amplified. Genomic DNA of different bacterial strains was prepared using a genomic DNA extraction kit (Qiagen, Delhi), following the manufacturer’s instructions. The gene was amplified using nifH specific primers described in our previous report [14]. Genomic DNA of E. coli and Azotobacter chroococcum were used as negative and positive controls, respectively. The amplified product was electrophoresed on 2% agarose gel containing ethidium bromide and analyzed using a Gel documentation system (Bio-Rad, Hercules, CA, USA).

2.8.3. Phosphate Solubilization, IAA, and Siderophore Production

Phosphate solubilization activity was tested and quantified following an earlier method keeping K2HPO4 as standard [26,27]. Production of indole-3-acetic acid (IAA) was tested by the colorimetric method [28]. Various concentrations of purified IAA (Sigma-Aldrich, USA) were used as standard for quantification of IAA produced by each isolate. Siderophore production was determined following the method reported earlier [14].

2.8.4. Test of Cellulolytic and Pectinolytic Activity

All bacterial isolates were screened for cellulolytic activities, namely, endoglucanase, and exoglucanases (β-glucosidase and cellobiohydrolase). Production of endoglucanase by endophytic bacteria was tested employing Gram’s iodine method with slight modifications [29]. The β-glucosidase and cellobiohydrolase activities were determined by previous protocols [30]. Similarly, pectinase activity was tested by spot-inoculating exponentially grown culture on NA plates containing 0.5% pectin and incubated for 72 h at 30 °C, as described earlier [31].

2.9. Evaluation of Cross-Infection Ability of Bacterial Isolates and Their Effects on Plant Growth

Based on the presence of plant growth promoting (PGP) activities, 14 bacterial isolates were selected to test their effect on plant growth and ability to cross-infect wheat plants (Triticum aestivum L. var GW322). The experiment was performed under axenic conditions in replicates of four. For this, wheat seeds were surface sterilized with 70% ethanol for 2 min, followed by treatment with 0.2% HgCl2 solution for 3 min. Surface sterilized seeds were washed thoroughly to remove all traces of sterilant. Six seeds were kept in each Petri dish having moist sterile Whatman filter paper No. 1 for treatment with bacteria [32]. Overnight grown cells of endophytic bacteria (108 cells mL−1 in phosphate buffer saline (PBS)) were applied to each Petri dish containing surface-sterilized seeds. Seeds treated with PBS served as control. All the Petri dishes were incubated in dark initially for 4 days and then for 10 days with a photoperiod of 16:8 (light/dark cycle) at 28 ± 2 °C. Water (2.0 mL) was added to the Petri dishes on every alternate day. After 10 days of growth, plants were examined for root/shoot length, fresh weight and vigor index. The vigor index was calculated by the following formula: (Shoot length + Root length) × Percent Germination.

2.10. Plant and Dominant Bacterial Strain Used

The most dominant endophytic bacteria P. aeruginosa PM389, isolated from field grown pearl millet, was used for inoculation of the plant. It was characterized and maintained for further studies, as described in our previous work [14,33].

2.11. Inoculation of Wheat Plant with Bacterial Strains

Triticum aestivum variety GW322 seeds were surface sterilized and grown in semi-solid Hoagland media (0.3% Agar), as described previously [33]. For induction of immune response, plants inoculated with bacteria were used for RNA extraction and assessment of gene expression by quantitative PCR was conducted, as described earlier [34]. Endophyte-treated and control plants were collected at 0, 6, 12 and 24 h of bacterial treatment for qPCR studies [33].

2.12. RNA Extraction and cDNA Preparation

Plant samples were washed thoroughly with Milli Q water for the removal of adhered media and crushed in liquid nitrogen. Then, 100 mg of each crushed sample was used for extraction of RNA using the Qiagen Plant mini-RNA isolation kit (Qiagen, Delhi, India), as per the manufacturer’s instruction. Purity and quantity of extracted RNAs were measured by the Experion RNA StdSens analysis kit (BIO-RAD, Hercules, CA, USA) and RNA samples were treated with DNAse I (Thermoscientific, Delhi, India) to remove DNA, as per the manufacturer’s instruction. After this, cDNA preparation was done by the cDNA synthesis kit, following manufacturer’s instructions (Thermoscientific, Waltham, MA, USA).

2.13. Quantitative-PCR of Defense-Related Genes

Quantitative real-time PCR was performed in optical clear 8 well-strips using the SYBR green I based detection system in a BIO-RAD iQ5 Real-Time PCR detection system. An amount of 15 µL of each reaction mix for PCR contained 7.5 µL 2X iQTM SYBR green supermix (BIO-RAD, USA), 10 pmol each of forward and reverse gene-specific primers, and 25 ng cDNA. The sequence of gene-specific primers and the size of expected amplicons are listed in Supplementary Table S3. The thermal profile used for all qPCR reactions were: 95 °C for 10 min, 40 cycles of 95 °C for 15 s and 58 °C for 25 s. Data was analyzed using iQTM5 optical system software, version 2.1 (BIO-RAD, USA) and Microsoft Excel. Normalization of the Ct values for all genes was done using the wheat ß-tubulin gene and the double-delta Ct method was used for quantification.

2.14. The qPCR Based Quantification of Bacterial Colonization: Colonization Studies

With a similar experimental set-up of defense genes, colonization of endophytic bacteria was studied using qPCR. The species-specific primers used were: PM389F-5’GAGCTTGCTCCTGGATTCAGC3’ and PM389R-5’CGTGAGGTCCGAAGATCCCCC3’. Oligonucleotides were synthesized by Eurofins scientific, India (Bangalore), as described previously [15,35]. In order to understand the relative changes in endophytic population during initial plant-endophyte interaction vis-a-vis the immune response of the host plant, qPCR of 16S rRNA gene of P. aeruginosa PM389 was performed. Preparation of RNA, cDNA, and qPCR mix was similar to that described for defense-gene. The rRNA gene was amplified using a thermal profile as follows: 95 °C for 5 min, 40 cycles of 95 °C for 1 min and 58 °C for 1 min.

2.15. Statistical Analysis

Standard deviation was calculated for various replicates in an experiment using Microsoft Excel 2007 software. All population data (triplicates) were converted to log colony-forming units per gram of fresh weight tissue. All populations below the detection limits were scored as 0 for calculation of means [36]. Difference in population data of a particular sample at different time intervals was statistically analyzed by ANOVA. The Least Significant Difference (LSD) test at probability level 0.05 was used to separate the means when the ANOVA F-test indicated a significant effect of the bacterial treatments on plant growth, as well as to analyze the significant changes in PGPR treated plants in comparison to control plants. Then, the means of different samples were compared by Duncan’s Multiple Range Test, wherever applicable [37].

3. Results

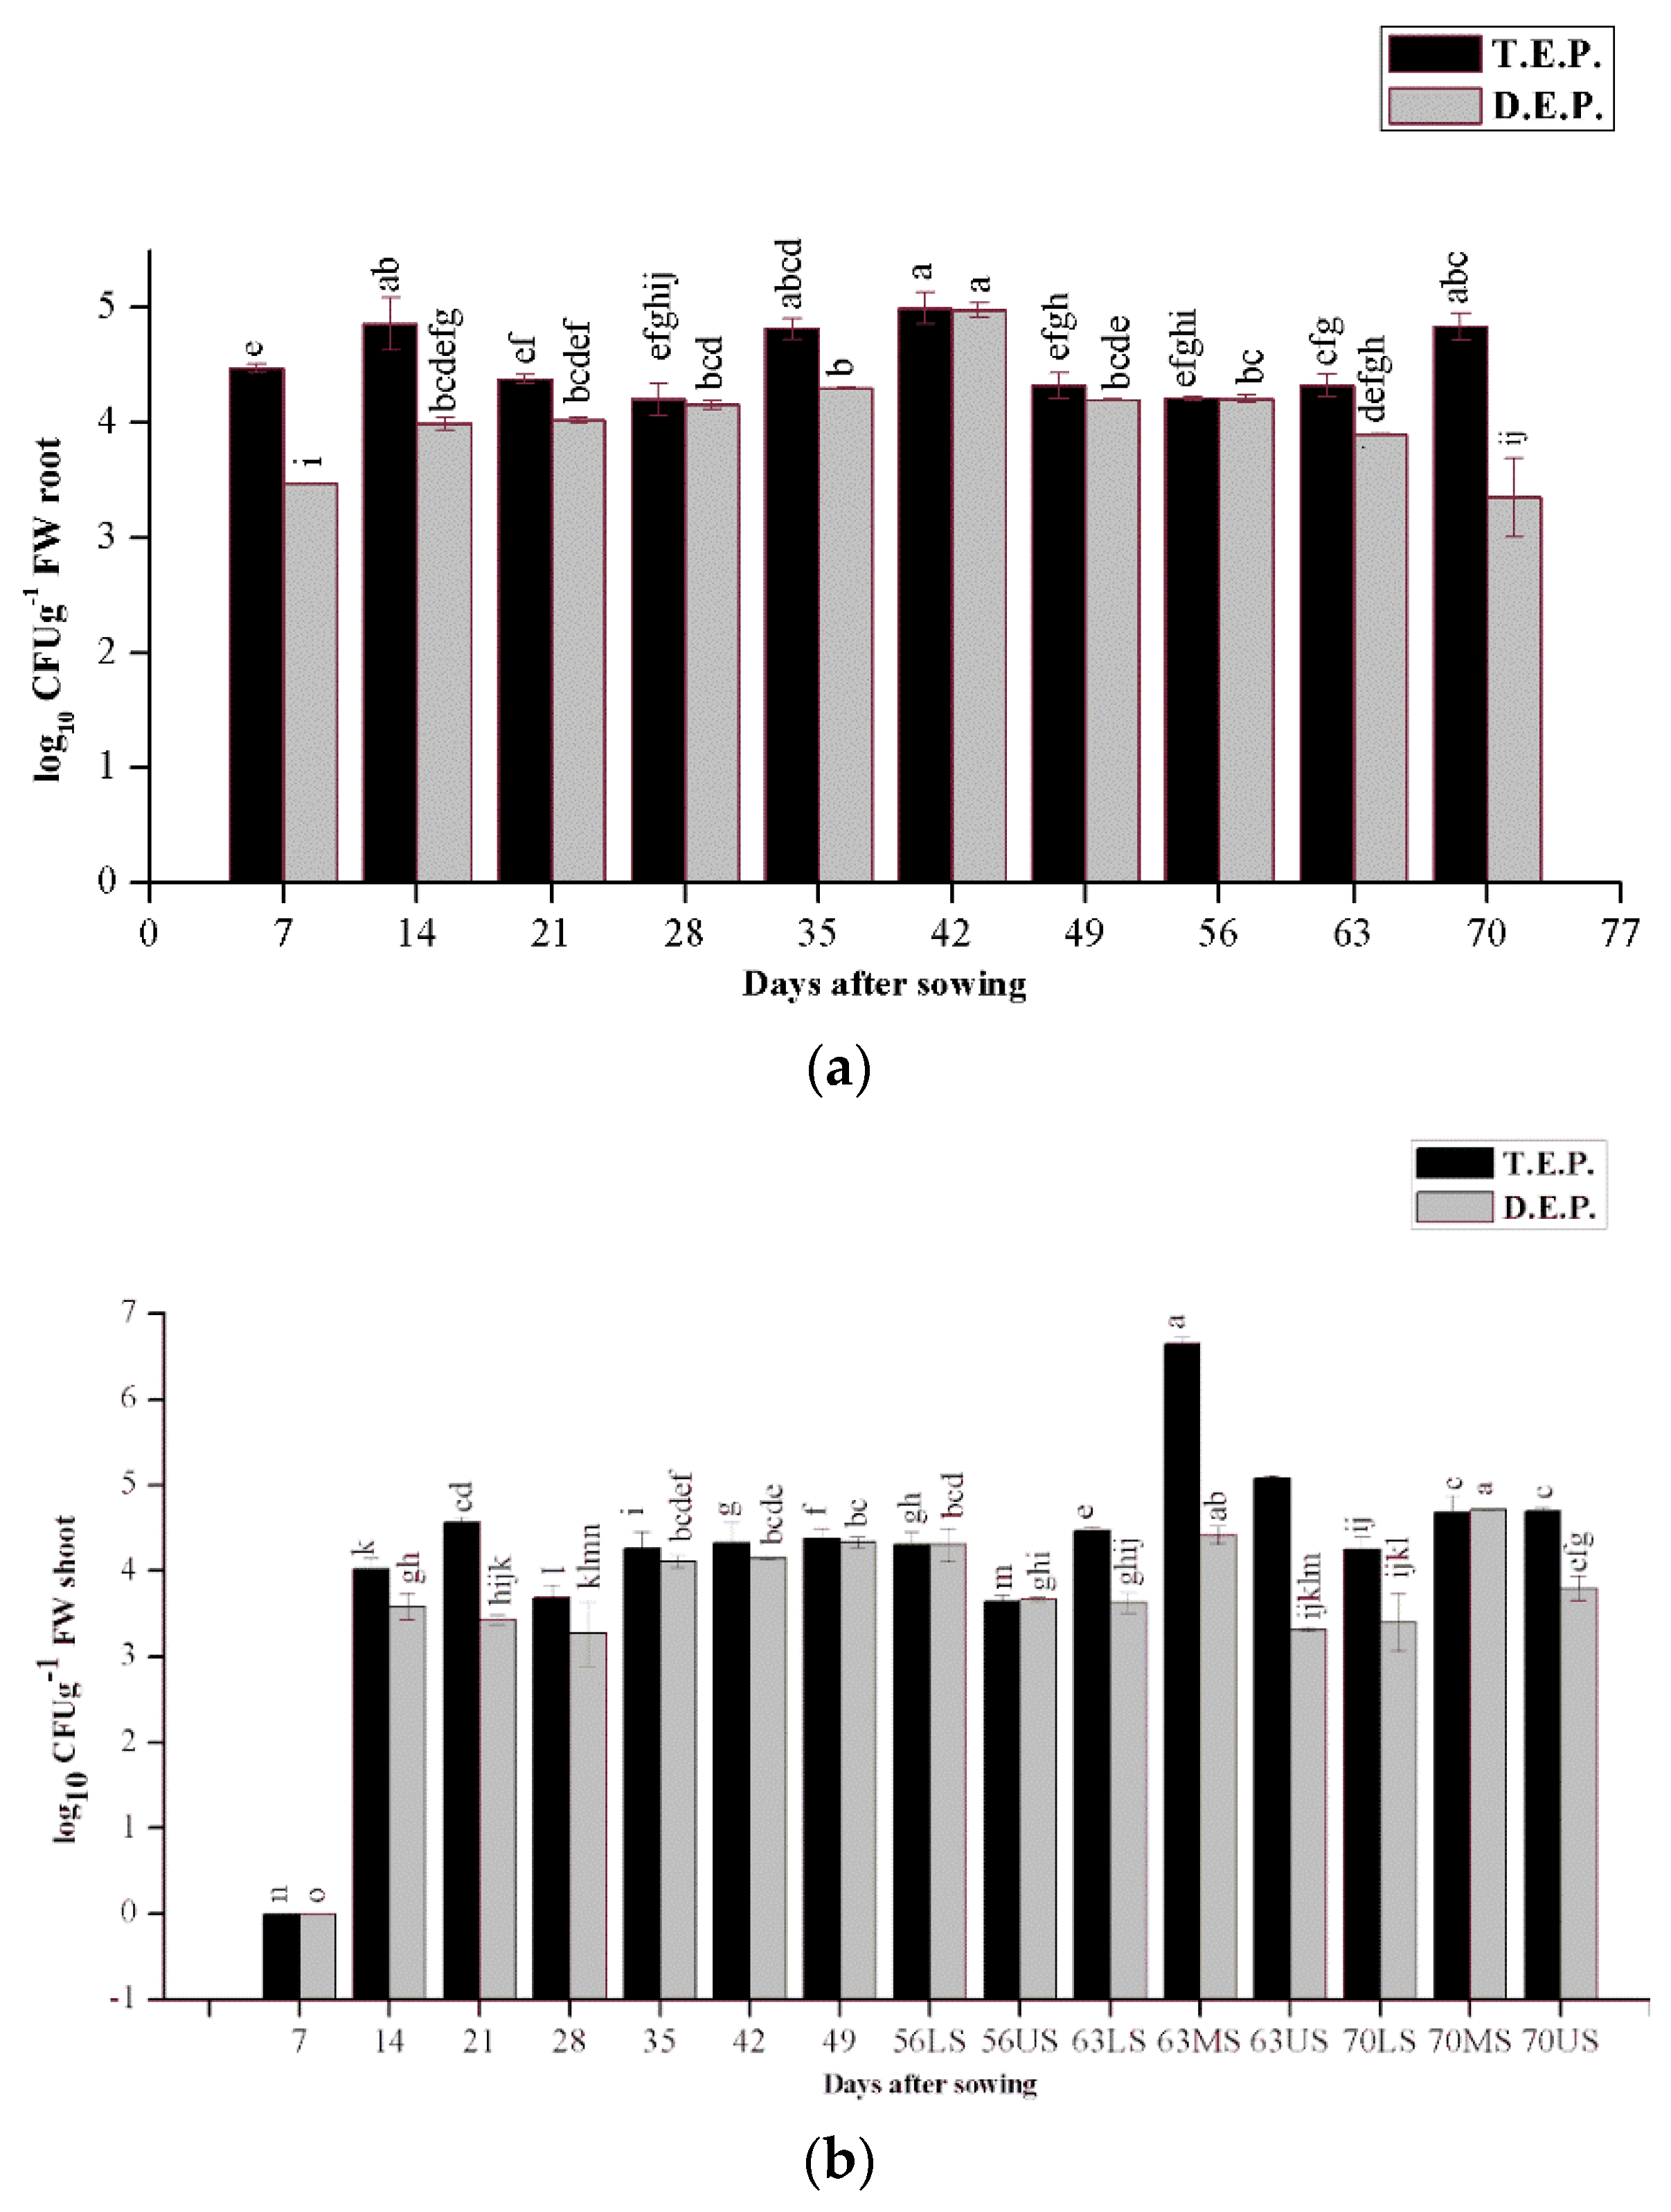
3.1. Isolation of Endophytic Bacteria and Study of Population Dynamics

Based on colony morphology, 210 different diazotrophic endophytic isolates were obtained during the entire study. To elucidate the dynamics of diazotrophic bacterial community in pearl millet, changes in the population size of diazotrophic bacteria were compared with total endophytic bacterial populations recovered at various growth stages of plants (Figure 1). The population of total endophytic bacteria was almost always greater than the diazotrophic endophytic population. Overall, population of diazotrophic bacteria increased during vegetative growth (42 to 56 DAS), except at 35 DAS, rather than in the initial phase of the plants. Population dynamics was also compared in different plant parts. Bacterial population in root samples (Figure 1a) was higher than shoot samples at most of the growth stages, except at 63 DAS, where it was much higher in the middle part of the shoot than in the root (Figure 1). Diazotrophic population varied in lower, middle and upper parts of the plants during different stages of plant growth (Figure 1b). The presence of bacterial species were more diverse during early (up to 28 DAS) and late (63 DAS MS to 70 DAS) growth stages of plants than in the vegetative growth stage of plants (from 35 DAS to 63 DAS). A single morphotype predominated the diazotrophic endophytic community in the middle stage of plant growth from 28 to 56 DAS and 28 to 42 DAS in the root and shoot, respectively.

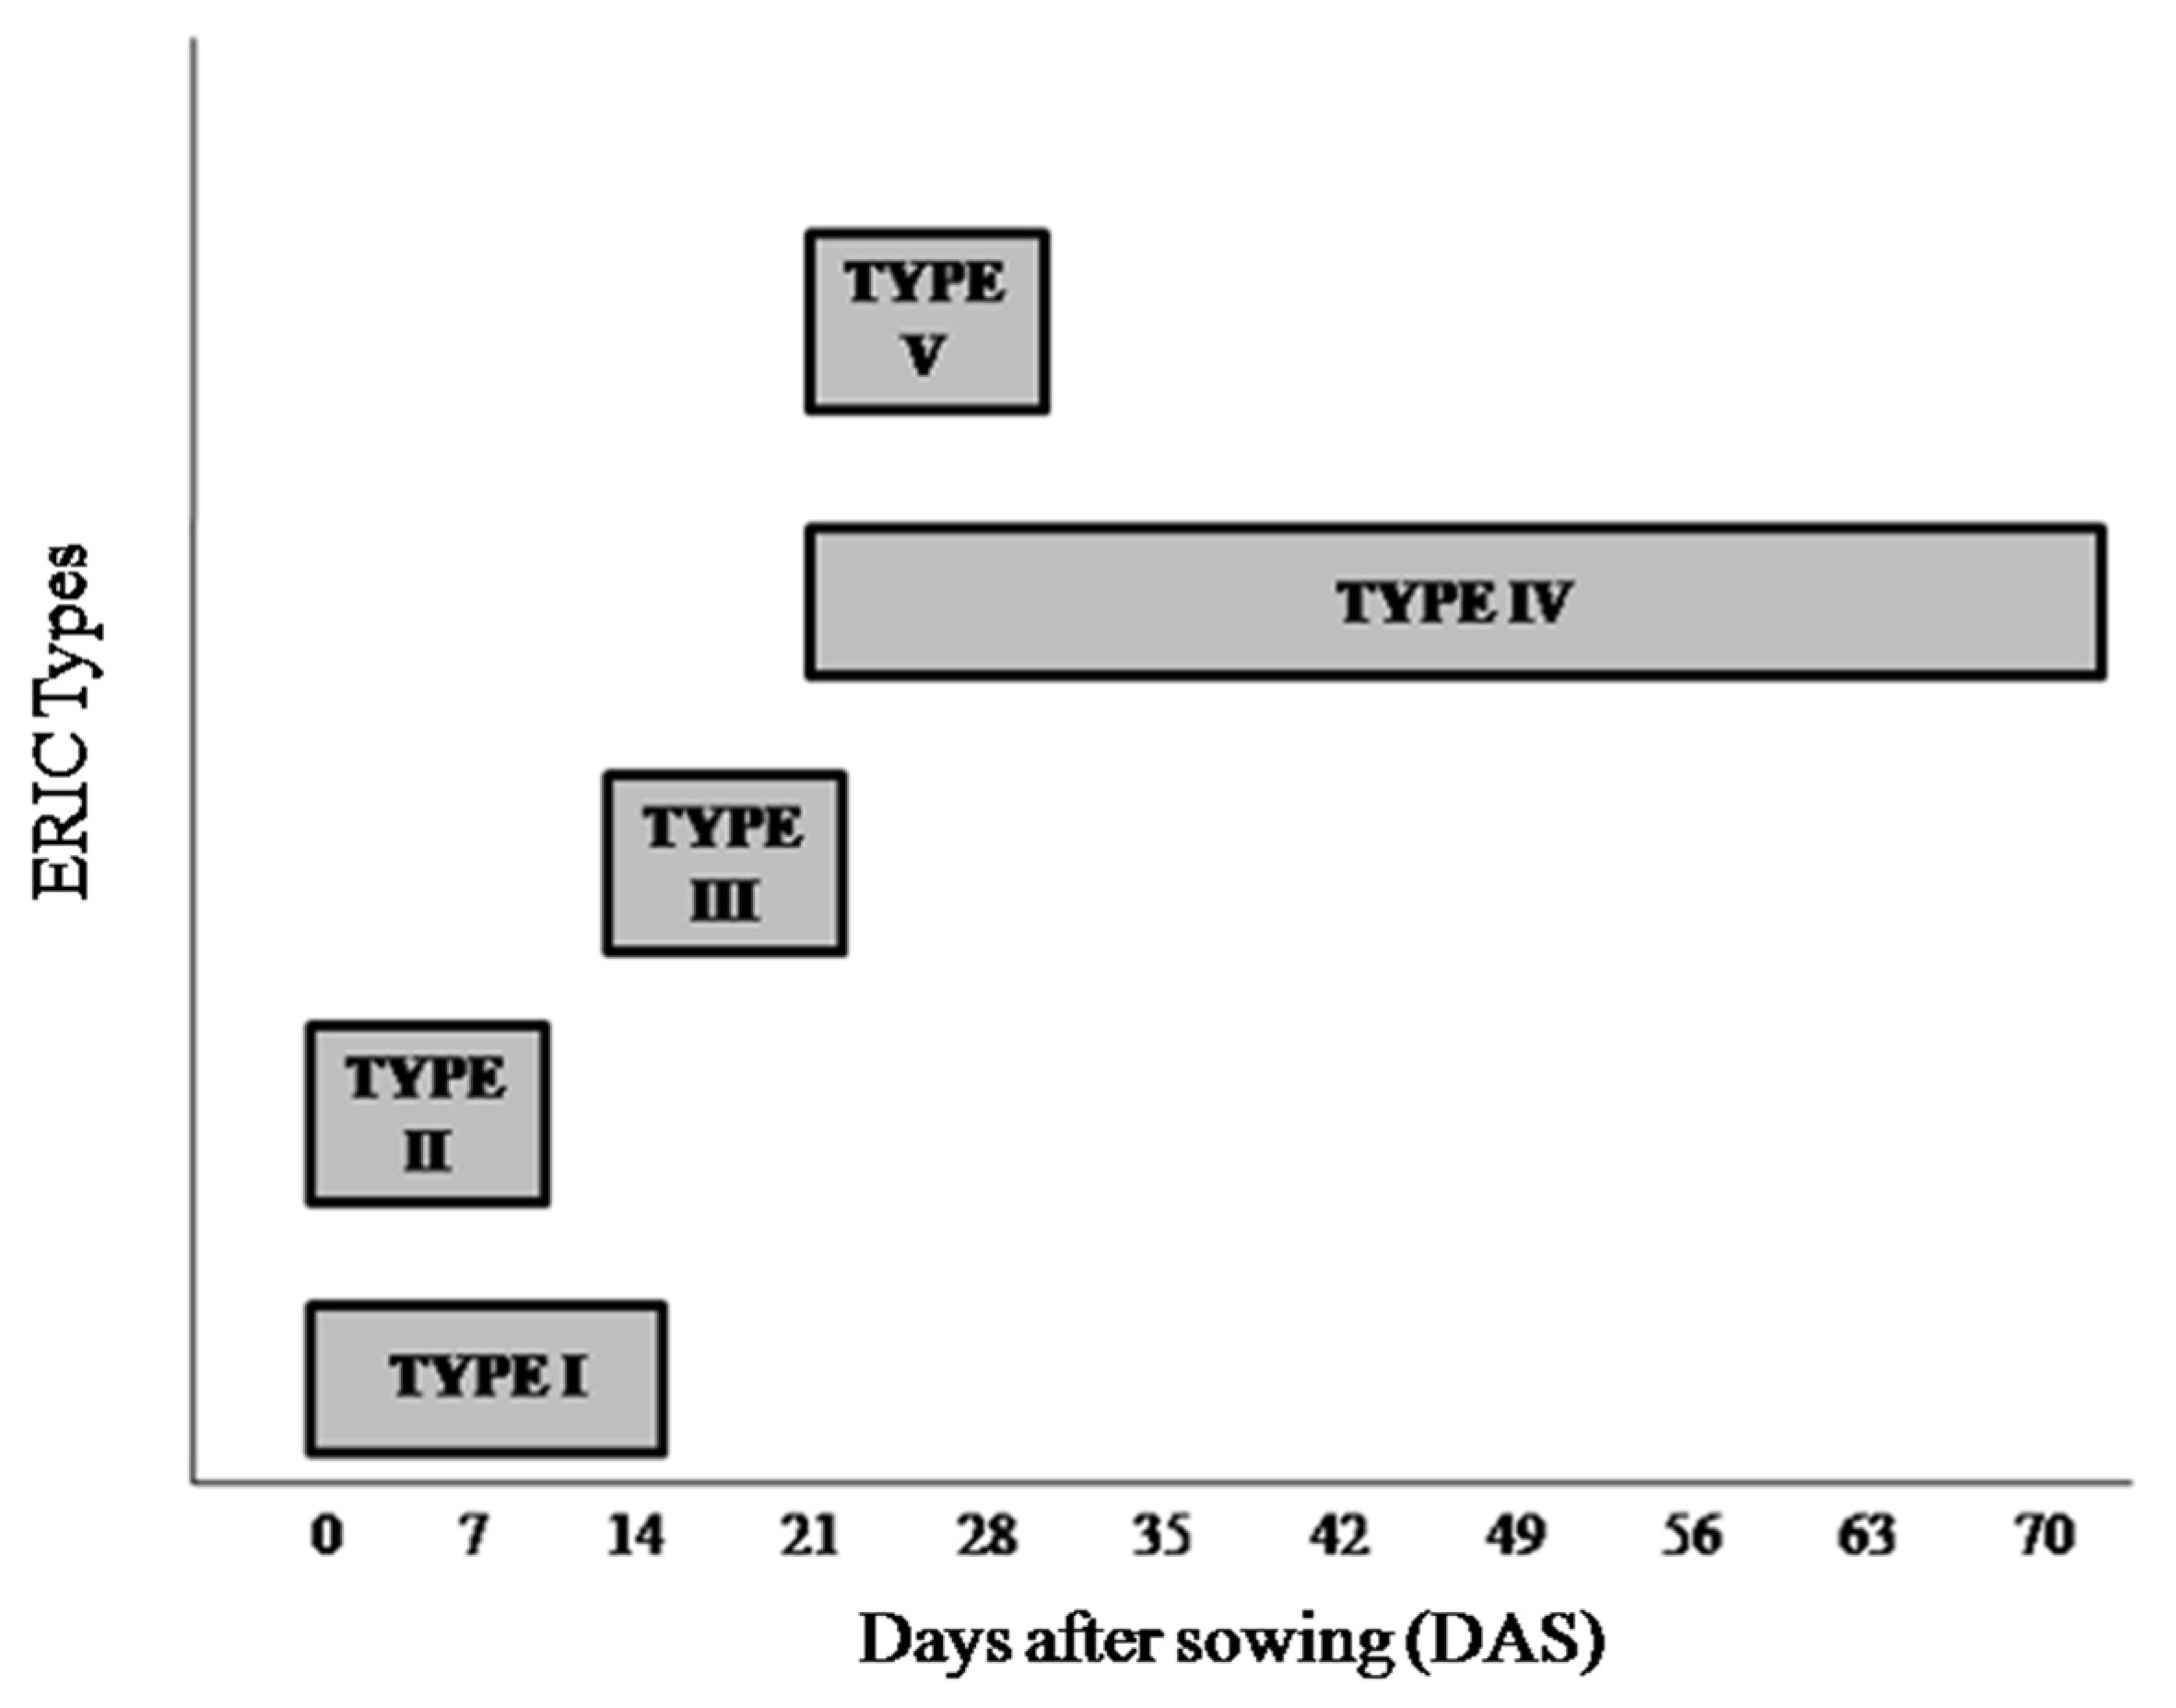
3.2. Study of Molecular Diversity Using ERIC-PCR as a Biomarker

ERIC-PCR-based DNA fingerprinting was carried out to study molecular diversity among various isolates obtained at different growth stages of pearl millet. It was also used as a marker to track endophytic diazotrophic bacteria in plants at various growth periods. Out of 210 isolates, only 174 isolates showed amplification of DNA segments. Therefore, the remaining 36 isolates were directly sequenced for identification and diversity analysis. Based on the ERIC-patterns, bacterial isolates were grouped into 40 different ERIC types. Among these, 5 different ERIC-types (type I to V) were observed at more than one sampling period (Figure 2), out of which type IV was the most dominant, being present in most of the sampling periods (from 21 DAS to 70 DAS). It was observed in both root and shoot samples obtained between 21 DAS and 56 DAS. However, at 63 DAS, recovery of type IV strain was obtained only from the lower part of the shoot and from the middle part of the shoot at 70 DAS. In addition to type IV strains, representative strains of a few other ERIC types were also repetitively observed in plant samples collected at two to three consecutive weeks (Figure 2).

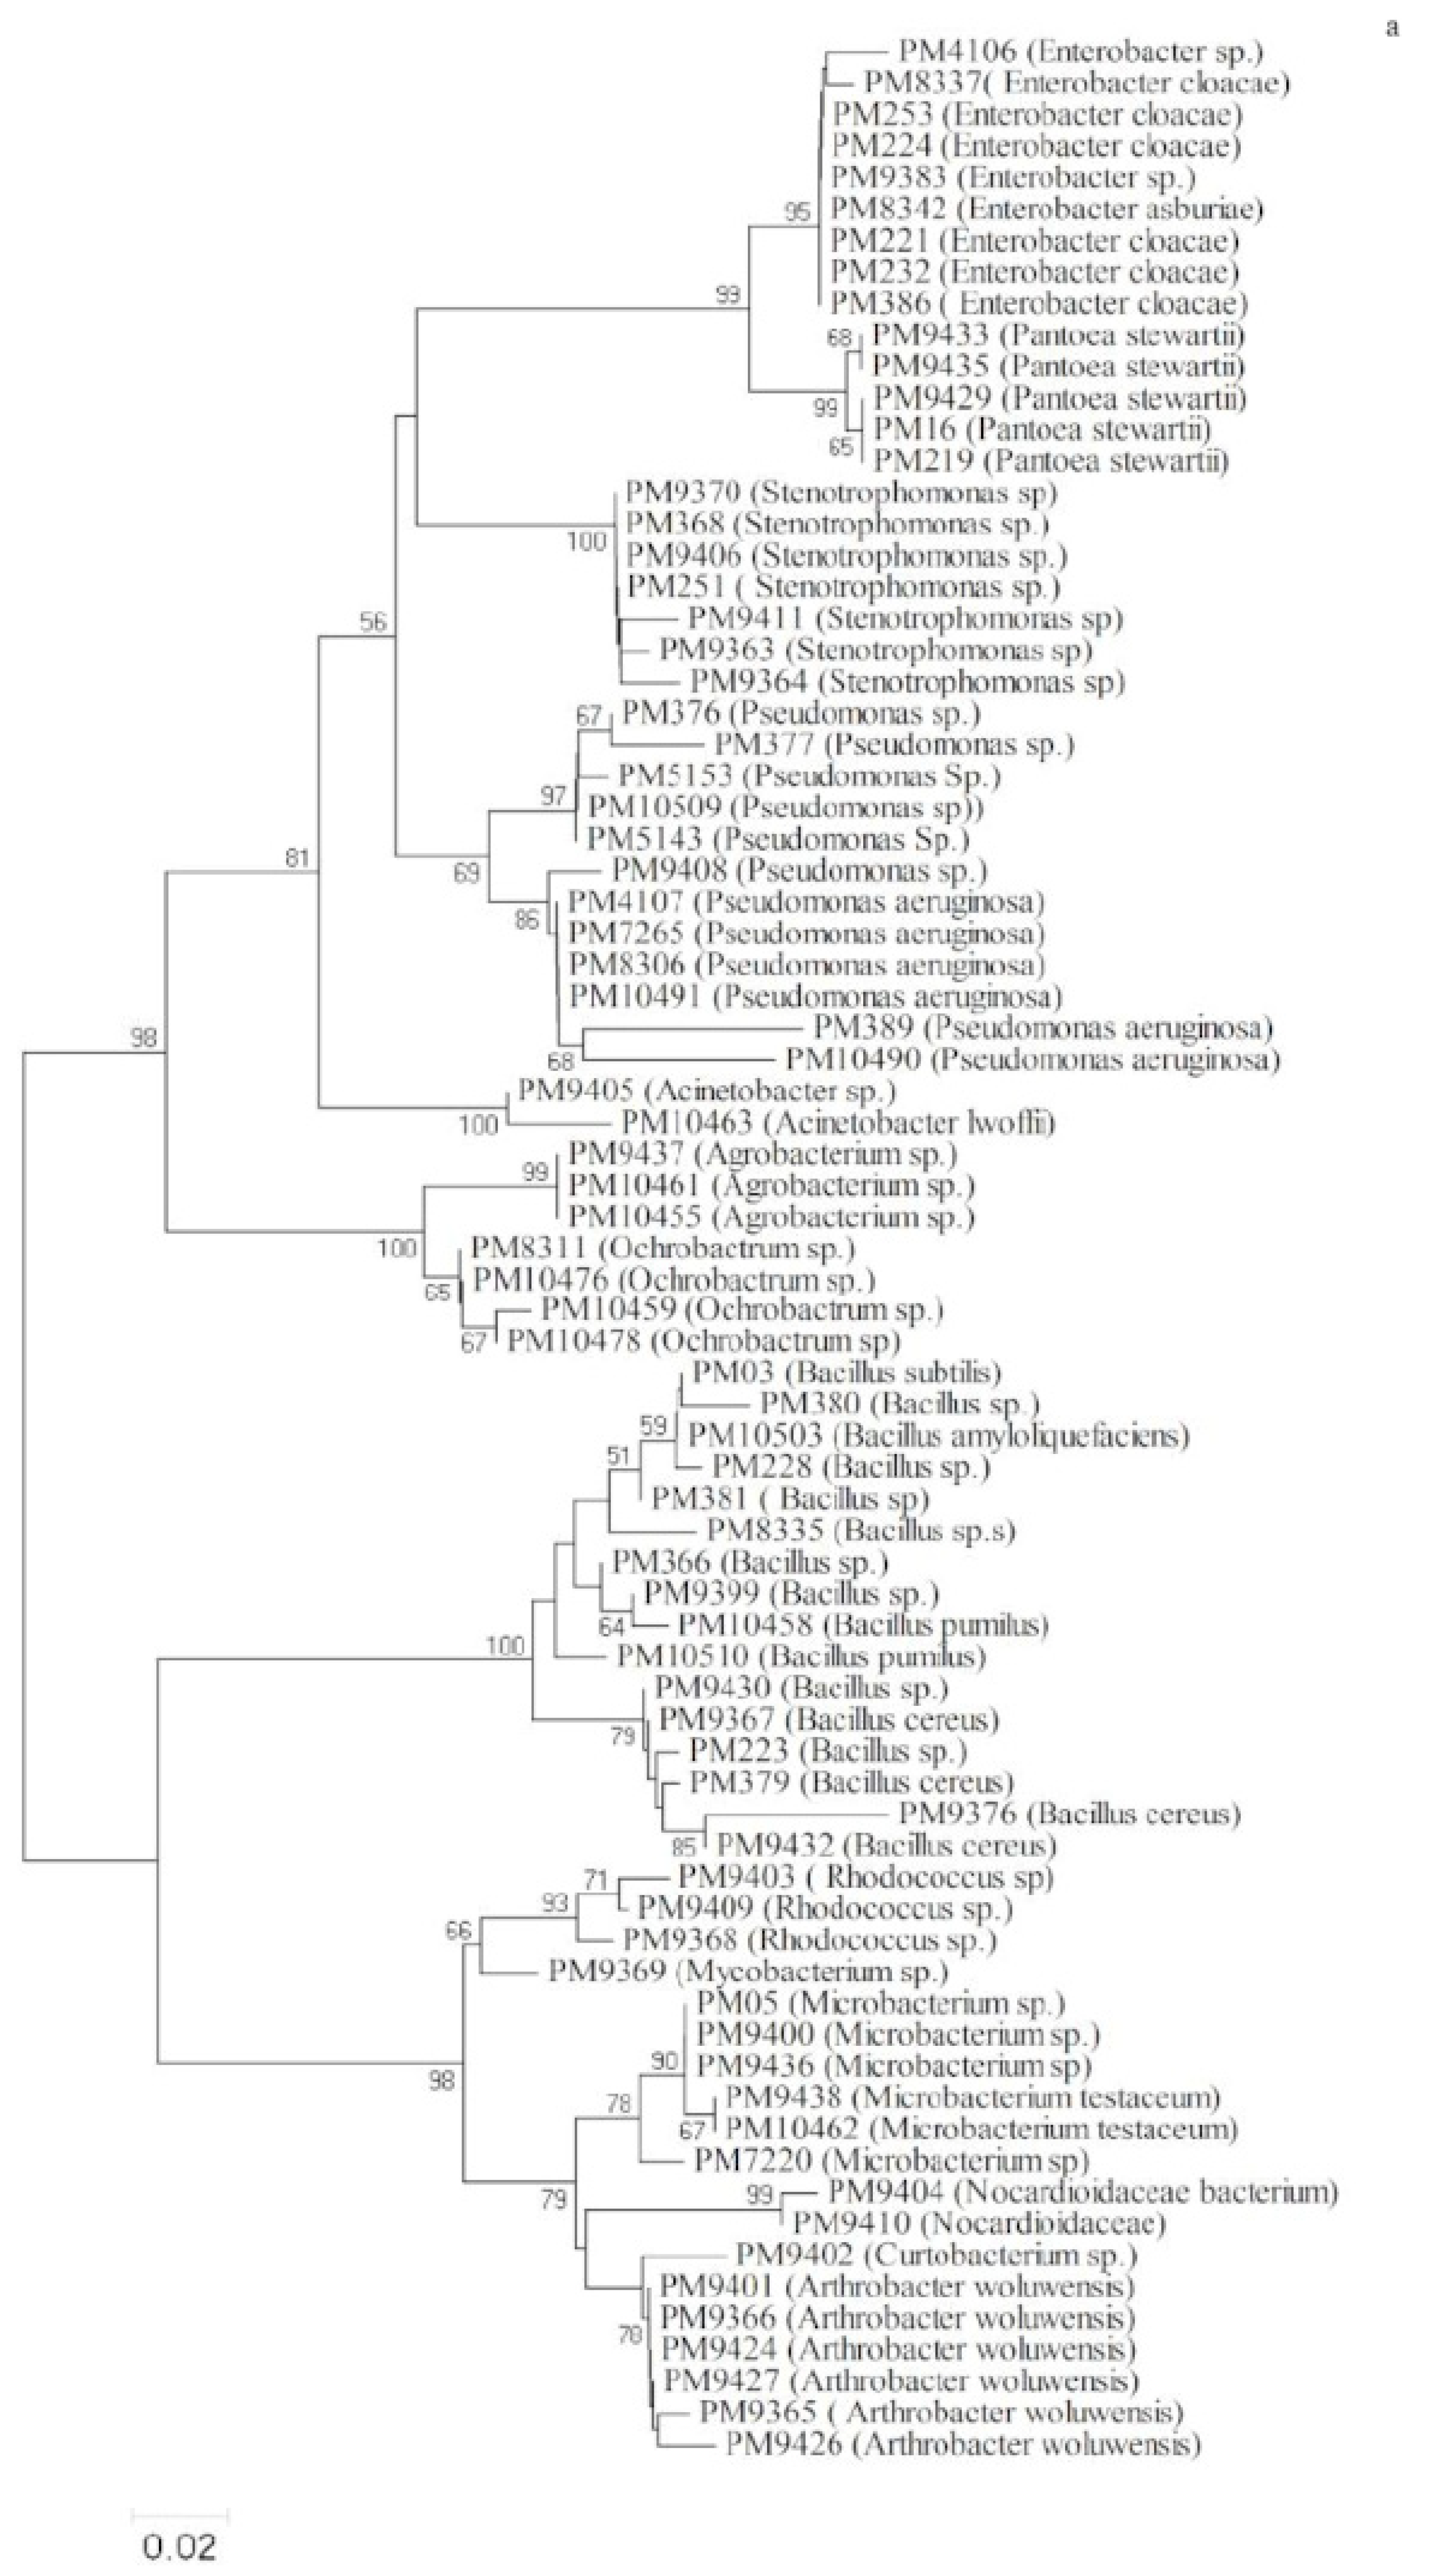
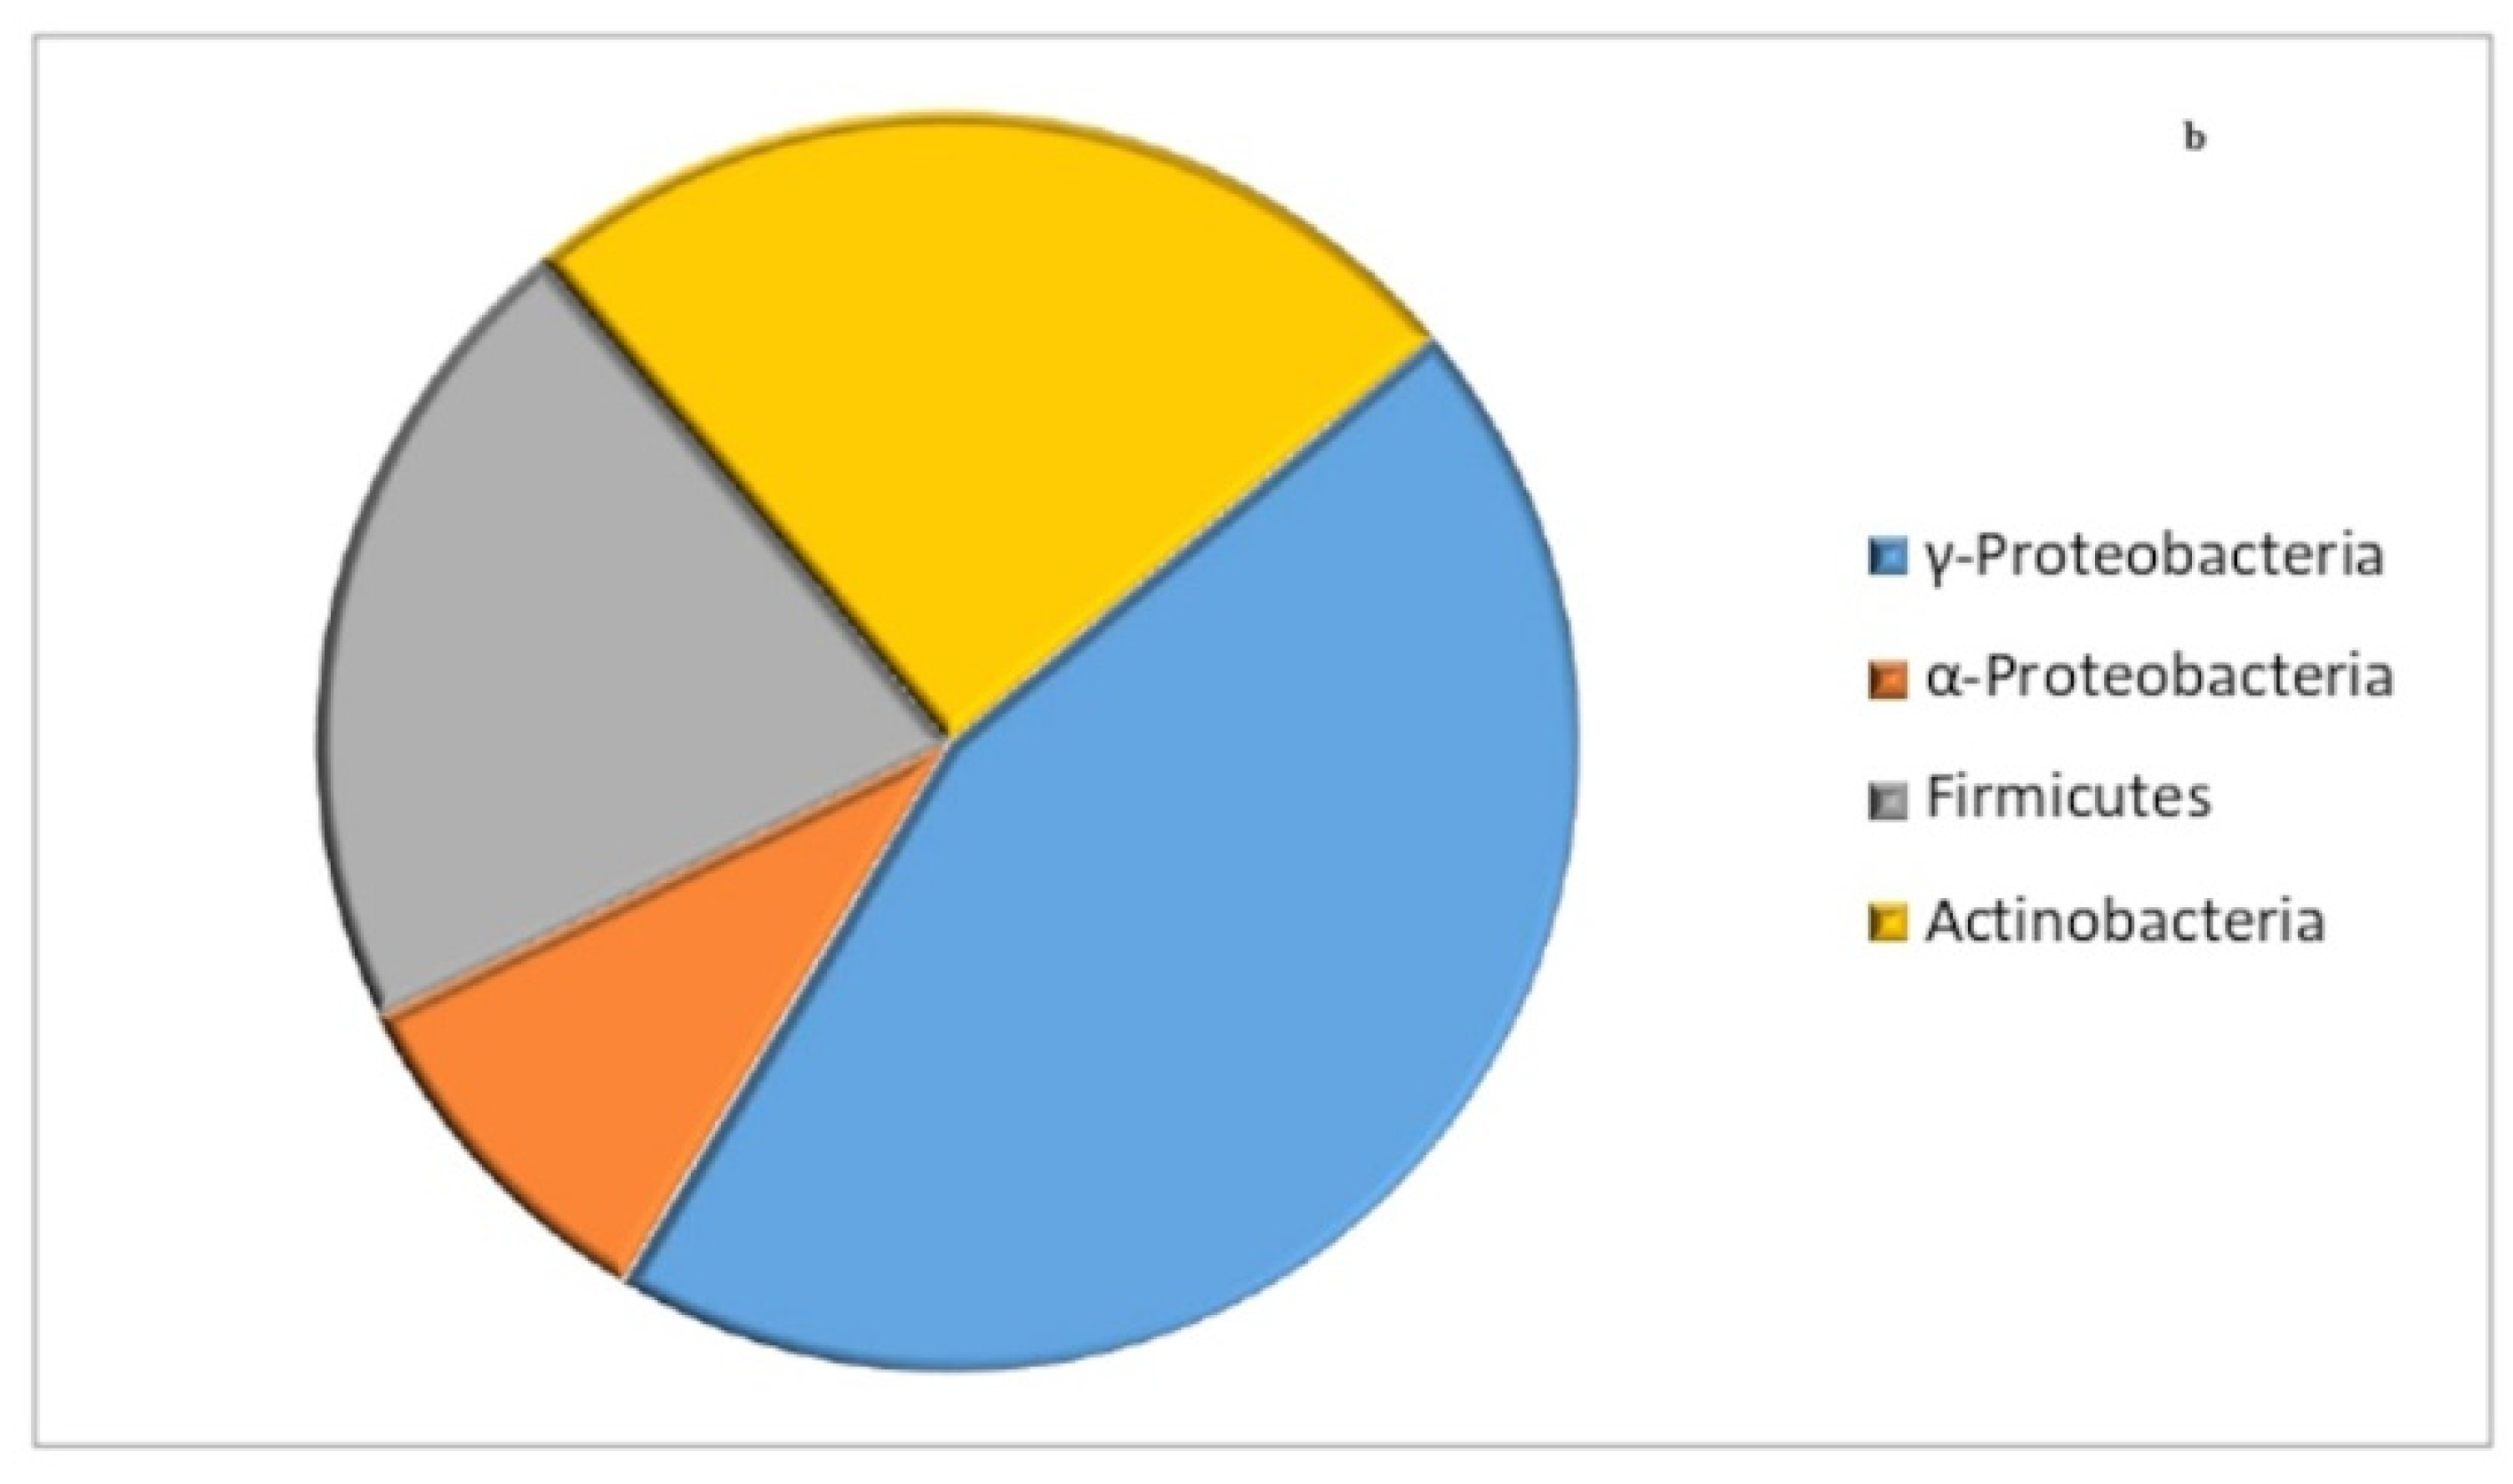
3.3. Phylogenetic Analysis Based on 16S rRNA Gene Sequence Analysis

Out of 76 strains (representatives from different ERIC types), 41 Gram-negative and 35 Gram-positive strains were obtained from plant samples at different growth stages. The phylogenetic tree is shown in Figure 3a. Analysis based on 16S rRNA gene sequence revealed affiliation of the 76 isolates to three phyla, namely, Proteobacteria, Firmicutes, and Actinomycetes (Figure 3b), which represented 54% (45% γ-Proteobacteria and 9% α-Proteobacteria), 21%, and 25%, respectively, of the endophytic bacterial community (Figure 3b). In this study, different genera like Enterobacter (12%), Pantoea (6.5%), Stenotrophomanas (9%), Pseudomonas (15.7%), Acinetobacter (2.6%), Agrobacterium (3.9%), Ochrobactrum (5.2%), Bacillus (21%), Rhodococcus (3.9%), Mycobacterium (1.3%), Microbacterium (7.8%), Nocardioidaceae (2.6%), Arthrobacter (7.8%) were obtained. The various bacterial species obtained in the present study are listed in Supplementary Table S1.

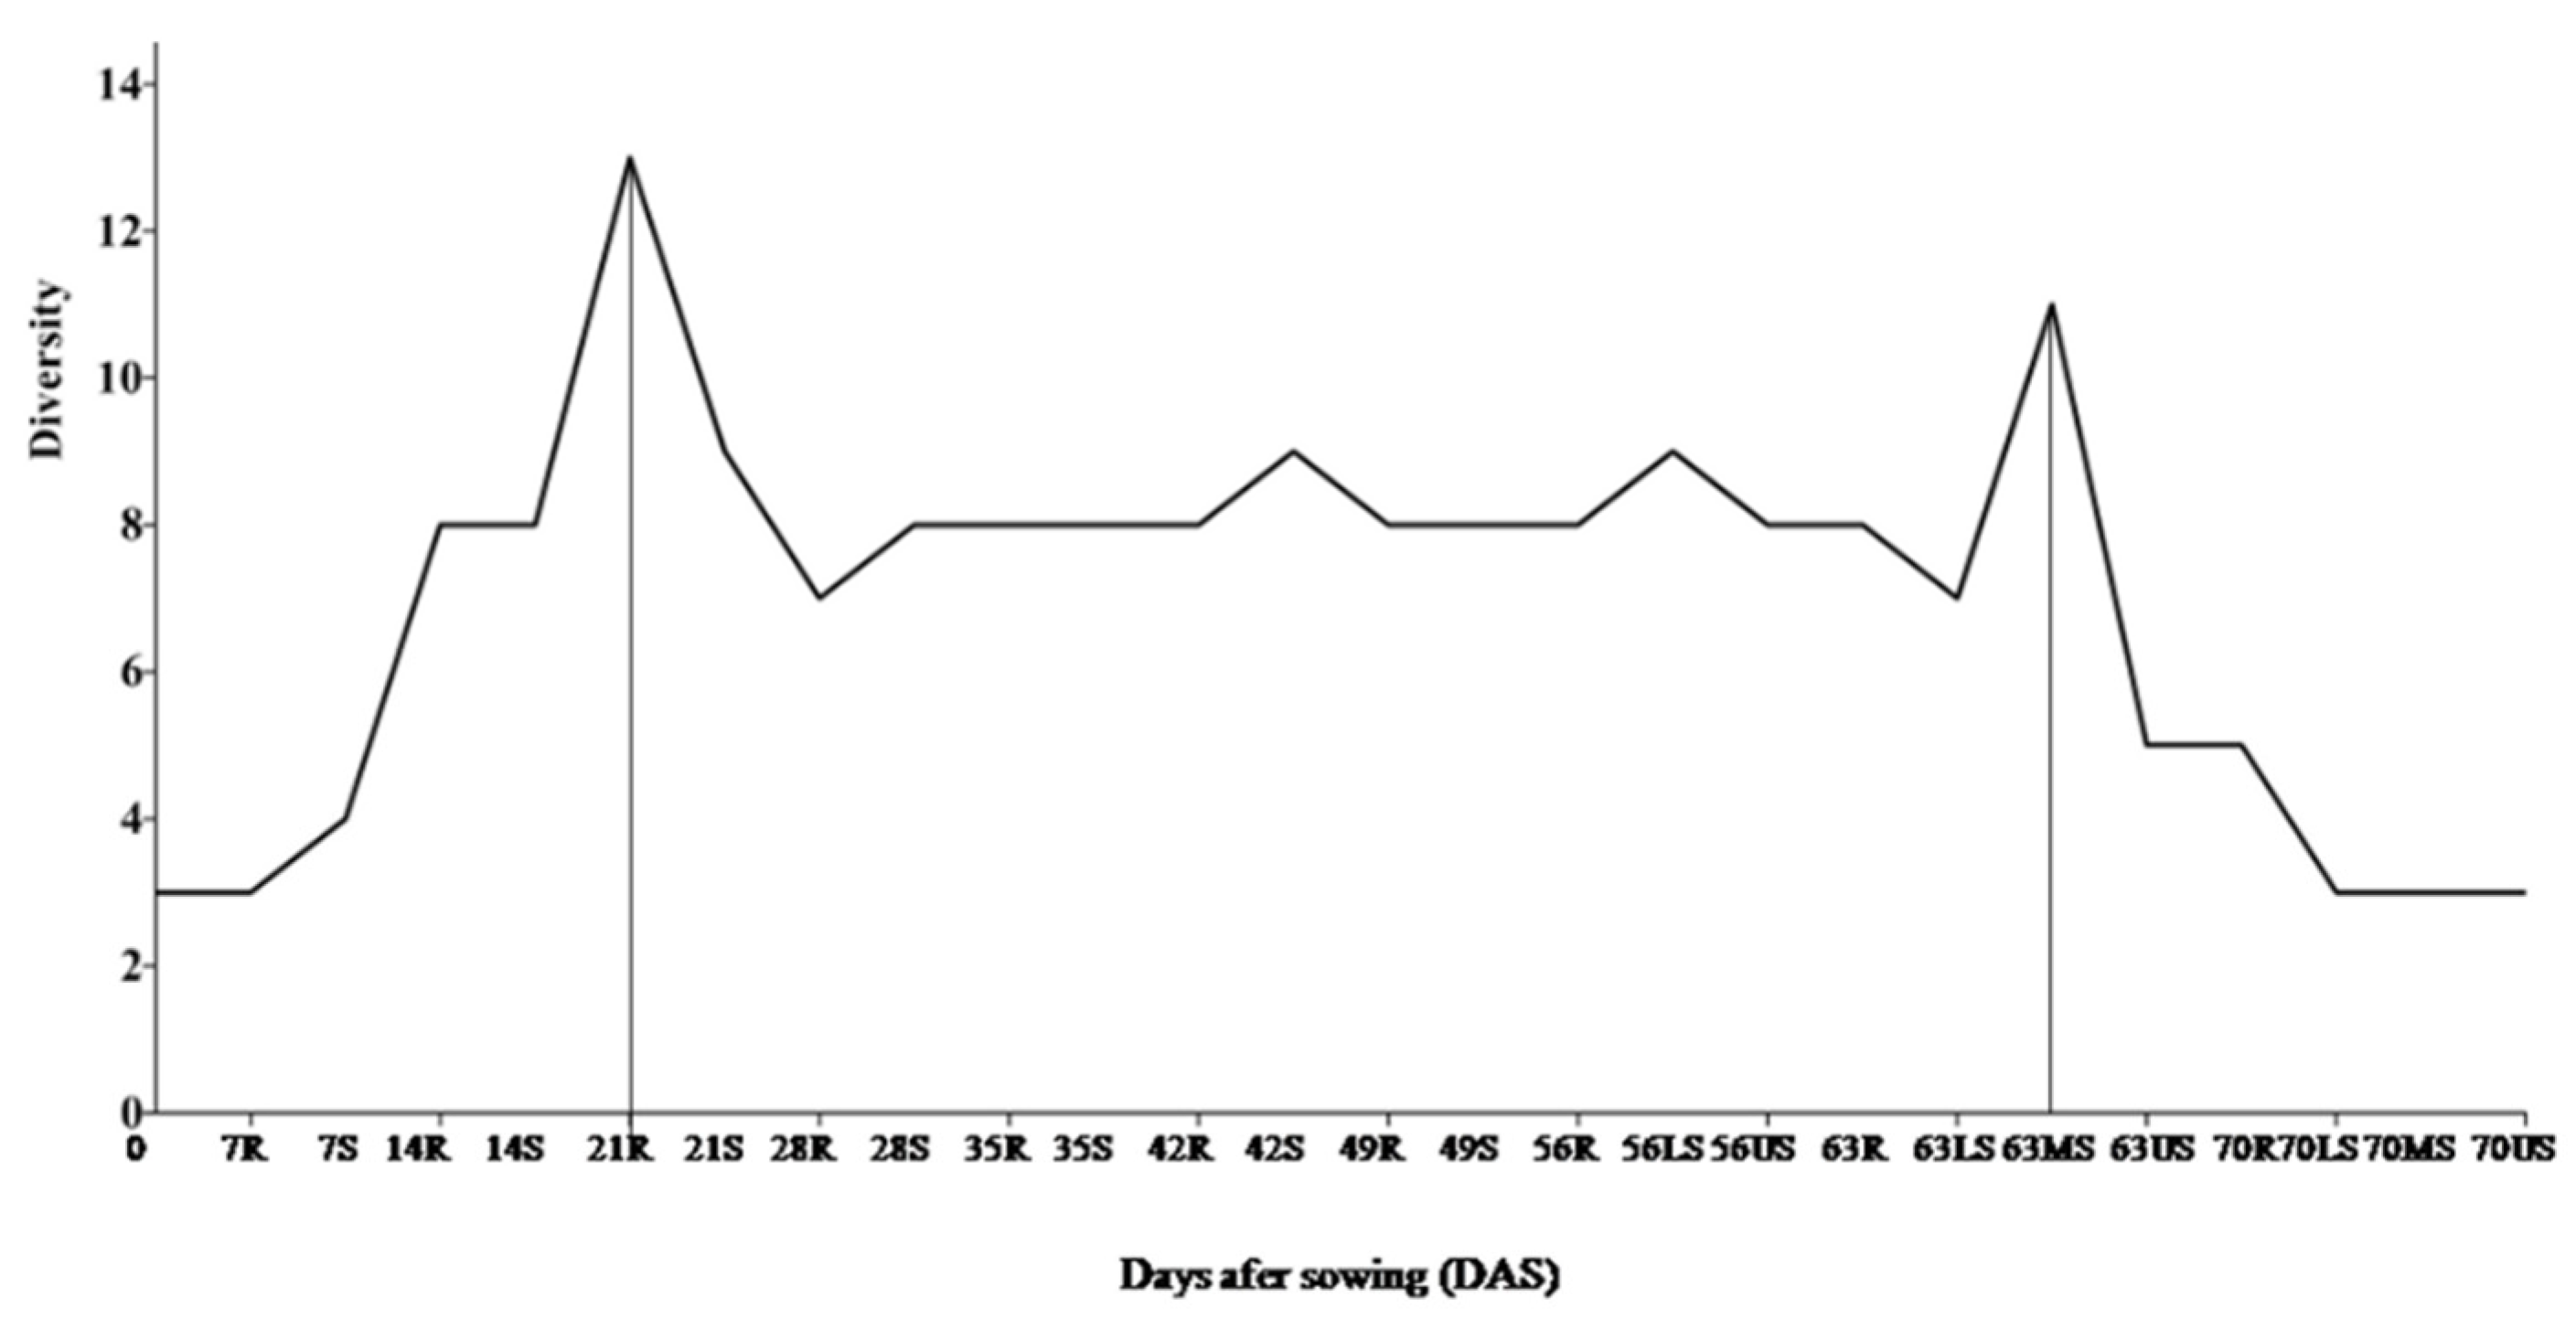
3.4. Periodic Molecular Diversity and Dynamics of Diazotrophic Bacteria

Once the isolates belonging to each ERIC types were identified, the pattern of species distribution at different periods of plant growth was analyzed. For this, the data of the 16S rDNA sequence of those 36 isolates, in which ERIC-PCR profile was not observed, were also included. Therefore, the data for recurrence of different species during various stages of plant growth may vary from the data based on the ERIC-pattern. Seed-borne isolates, identified as Microbacterium assamensis and Pantoea sp., were recovered till 14 DAS. Enterobacter cloacae showed its presence from 14 to 28 DAS in the root and at 21, 56, and 63 DAS in the shoot. Another isolate belonging to Enterobacter sp. was also observed in the roots at 28 (PM4106) and in the upper shoot region at 56 DAS (PM9383). As described in our previous report, Pseudomonas aeruginosa PM389, belonging to ERIC type IV, was first recovered in both the root and shoot at 21 DAS and was regularly observed up to 70 DAS (Gupta et al., 2013). However, its spatial distribution varied between 56 and 70 DAS. After 63 DAS, the presence of diverse bacterial species was observed in all parts of the plant, except in the middle part of the shoot, where dominance of P. aeruginosa was observed at 70 DAS. Only P. aeruginosa showed a regular presence in the later weeks of study, based on isolation studies.
In addition to P. aeruginosa, endophytic bacterial species which showed recurrence at various stages of plant growth were Arthrobacter woluvensis, Bacillus amyloliquefaciens, B. cereus, Enterobacter sp., Microbacterium testaceum, Pseudomonas sp. (PM377) and Stenotrophomonas maltophilia. On the other hand, various species, such as Acinetobacter sp., Agrobacterium larrymoorei, Bacillus flexus, B. nealsonii, B. pumilus, B. subtilis, Enterobacter asburiae, Microbacterium arborescens, Ochrobactrum anthropi, O. intermedium, O. sp., Pseudomonas fluorescens, P. putida, P. sp. (PM5143), Rhodococcus qingshengii, and Rhizobium sp., were recovered only once in the entire study period.
Analysis of diversity indicated a higher diversity of endophytic diazotrophic bacterial species in the root and the shoot till 21 DAS than in the rest of the study period. Diversity decreased with increasing dominance of P. aeruginosa PM389 from 28 DAS to 56 DAS (Table 1). Evenness (lack of dominance of species and thus more diversity) was higher at time intervals where P. aeruginosa was not observed to be dominant. During the entire study period, the highest diversity was observed at 21 DAS in the root, followed by 63 DAS in the middle part of the shoot (Figure 4). Overall, the population as well as the diversity of diazotrophic endophytic bacteria in the shoots was lower than in the roots (Figure 1 and Figure 4). Similar to the results of the roots, dominance of P. aeruginosa was also observed in the shoot from 28 to 49 DAS. Dominance continued in the lower part of the shoot at 56 DAS, when the upper part of the shoots showed higher diversity of diazotrophic bacteria than the lower part. Data from Table 1 shows that Shannon’s diversity index (DI) at most of the sampling period, in both root and shoot, in the initial (14–35 DAS in root and 14–21 DAS in shoot) and later growth stages (56–70 DAS in root and 49–70 DAS in shoot except in middle shoot at 70 DAS) was more than 0, which suggests lack of dominance of any species in the plant. Similarly, evenness and dominance parameters also suggested higher evenness and lower dominance with few exceptions during aforesaid sampling periods. On the contrary, Shannon’s DI reached 0, showing higher dominance, in the middle growth period of the plant. This observation was supported by the higher value for dominance and lower value for evenness (Table 1).

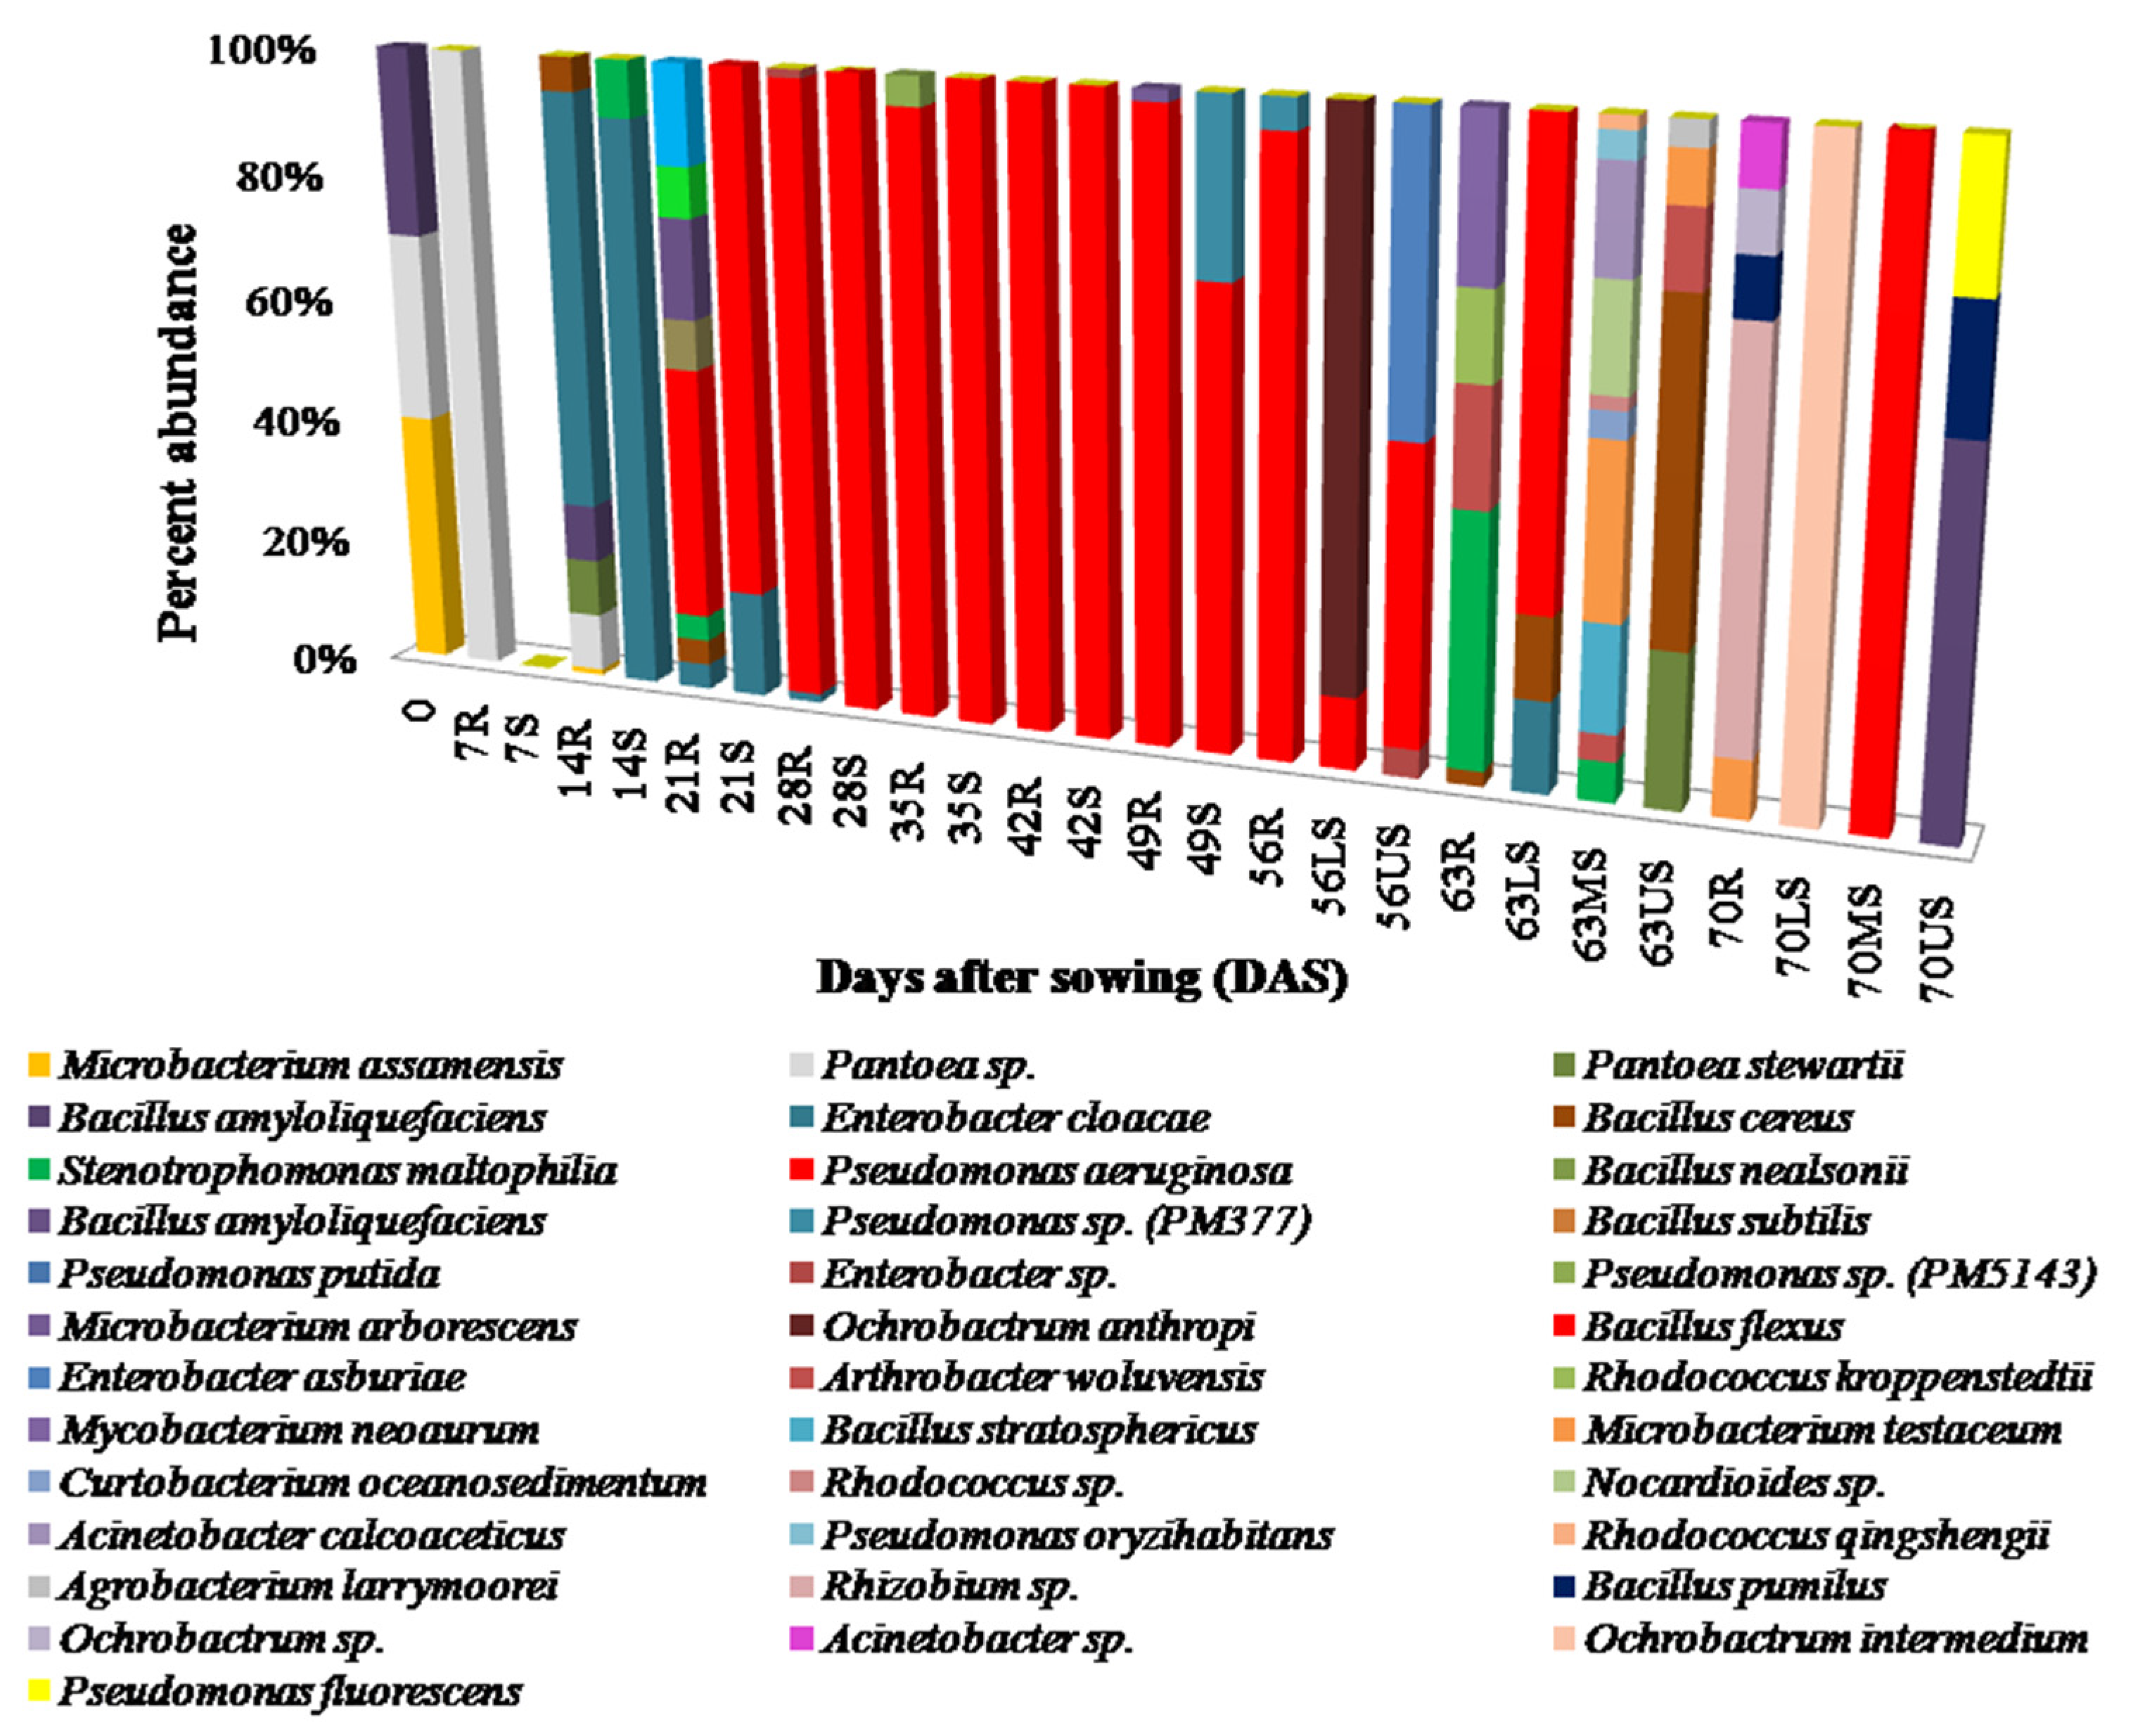
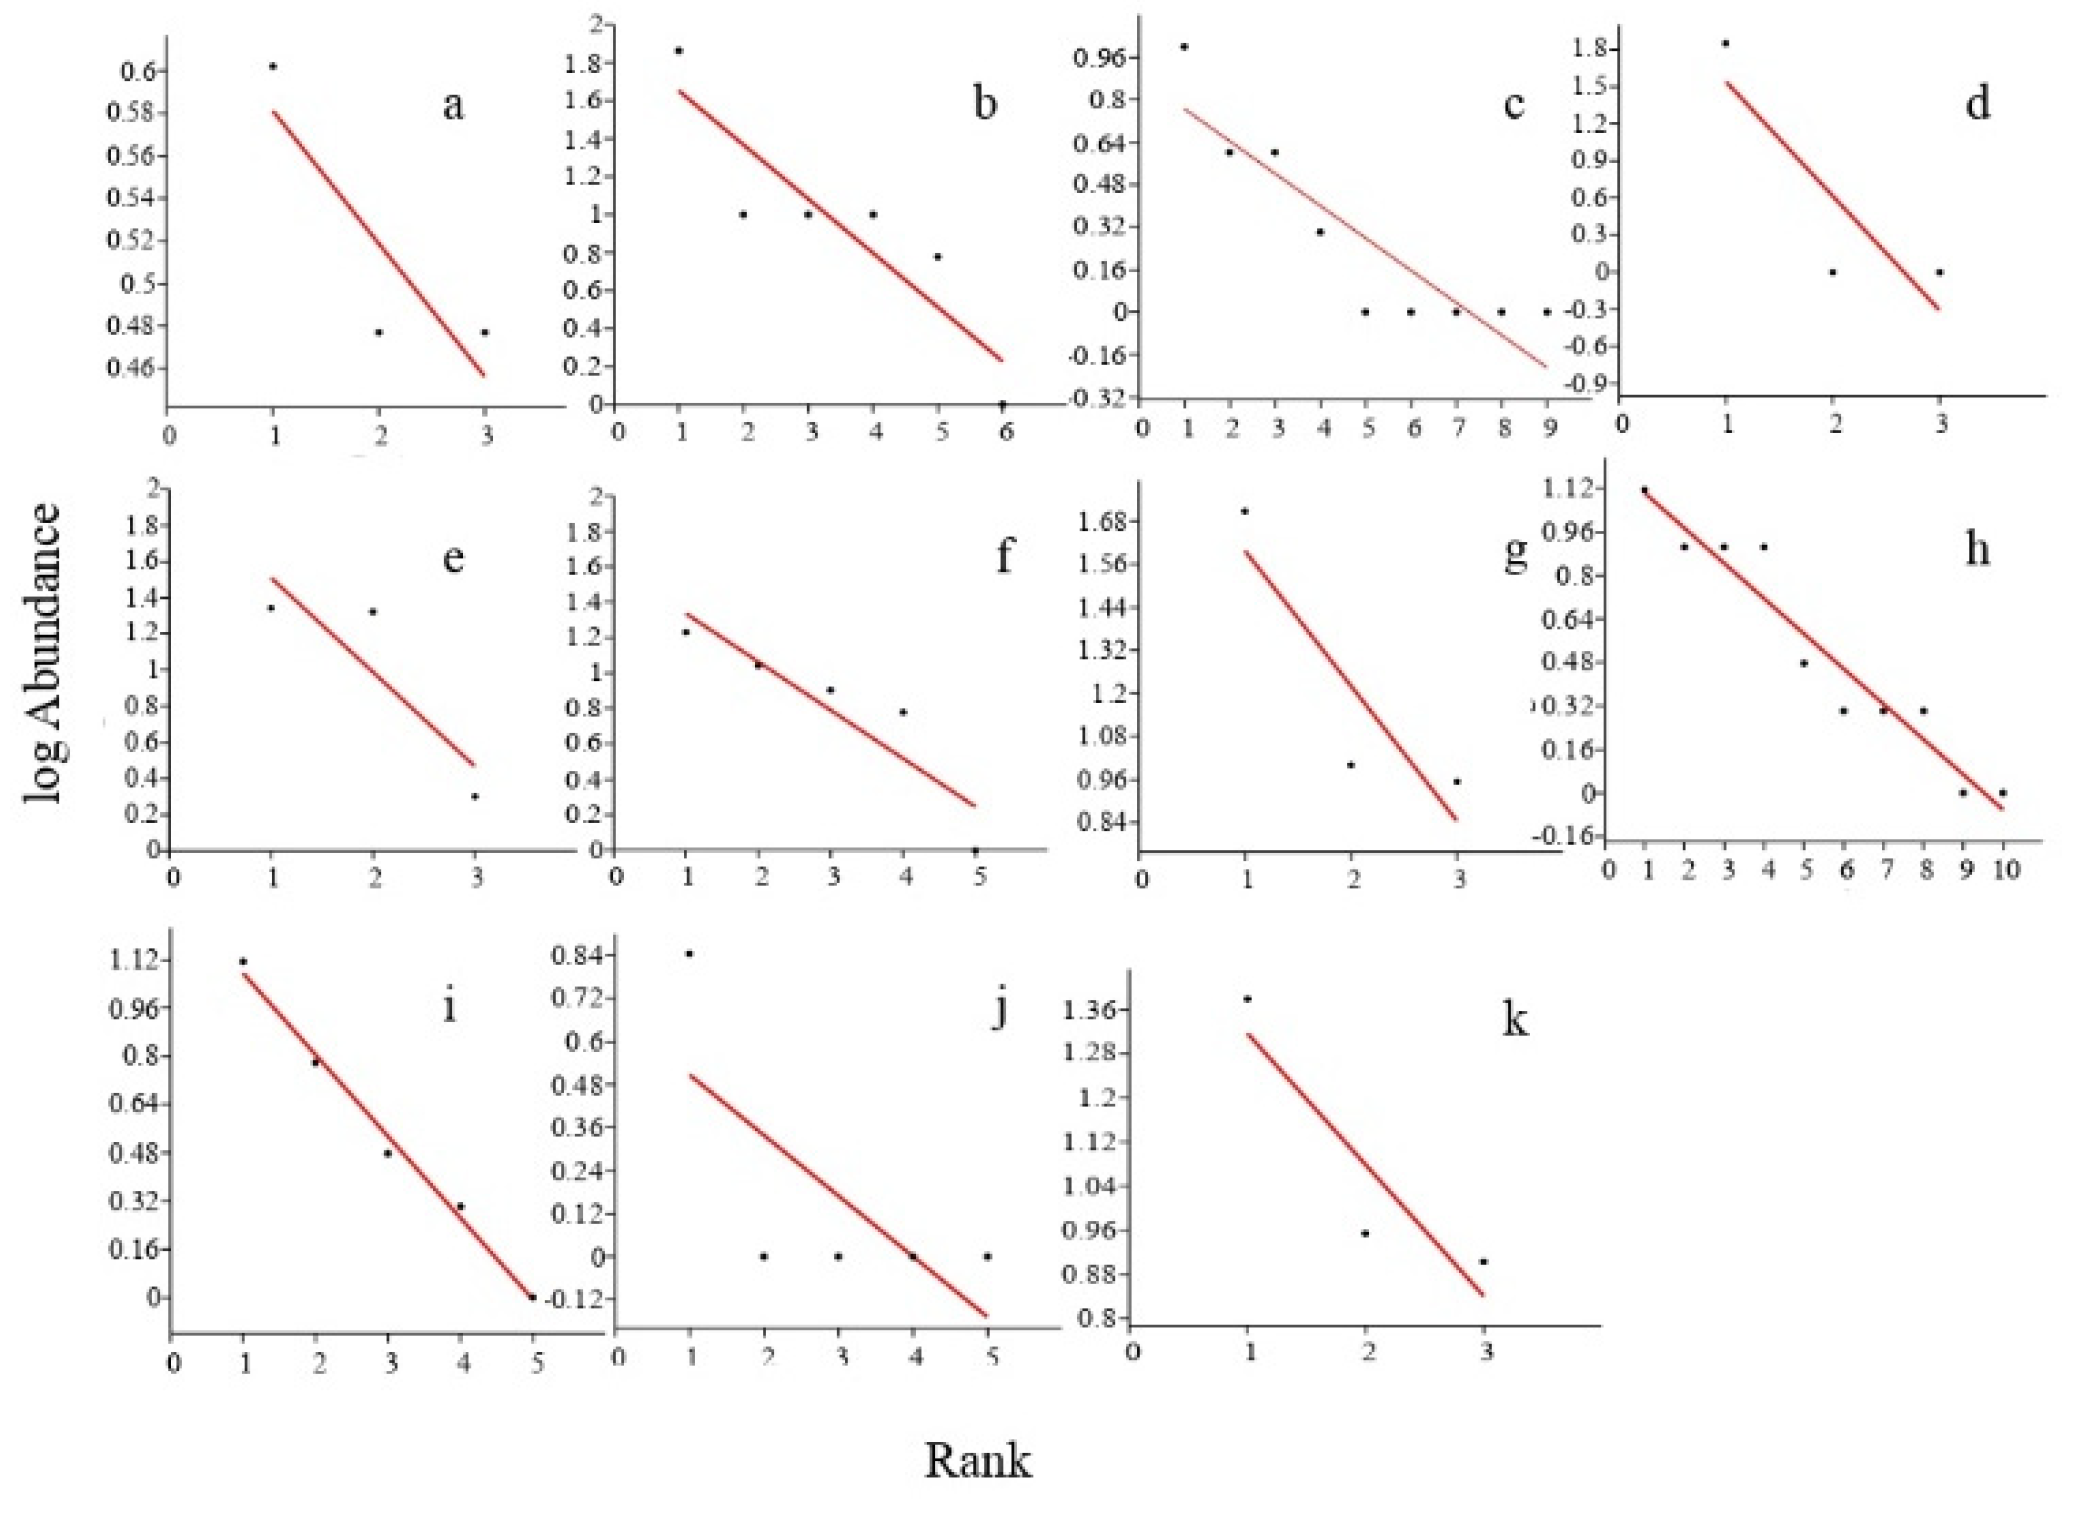
3.5. Relative Species Abundance

Pseudomonas aeruginosa PM389 was found to be the most dominant bacterium (11–100%) throughout the growth period of pearl millet. The next most dominant genus was Enterobacter cloacae, and its abundance ranged from 1 to 99%. Other than these latter two species, a few other species repeatedly showing their occurrence were also found to be abundant at different growth stages. These included Arthrobacter woluvensis (6–22%), Bacillus amyloliquefaciens (10–58%), Microbacterium testaceum (6–44%), Pseudomonas sp. (PM5143) (5–27%) and Stenotrophomonas maltophilia (1–42%) (Figure 5). Various species showed their recurrence at different time points, but some of them, including Pantoea sp. (100%), Ochrobactrum anthropi (89%), Bacillus flexus (91%), Ochrobactrum intermedium (100%), showed greater abundance at 7 DAS in the root, 56 DAS in the lower shoot part, 56 DAS in the upper shoot part, and 70 DAS in the lower shoot part, respectively.
To rank the abundance of different bacterial species at various time intervals of plant growth, a rank abundance curve (Preston’s plot) was plotted (Figure 6). Based on % abundance of species, they were ranked in decreasing order for different weeks. The rank abundance plot indicated that a single species dominated at some time points (Figure 6a,d,g,j,k) while other species remained almost equally abundant in most of the cases. At other time points, the rank abundance plot showed equal abundance of most of the species (Figure 6b,c,e,h). In few sampling periods, abundance varied among most of the species and, thus, a scattered pattern was observed in the Preston’s plot (Figure 6f,i).

3.6. Test of Plant Growth Promotion Activities

3.6.1. Confirmation of Diazotrophy

All the test isolates showed positive results for ARA which indicated the presence of nitrogenase activity. However, different isolates showed varied nitrogenase activity in the range of 1.83 to 128.36 nmol ethylene mg protein−1 hr−1 (Table 2). The highest nitrogenase activity was exhibited by strain PM10455 (128.36 nmol ethylene mg protein−1 hr−1) followed by PM10461 (103.93 nmol ethylene mg protein−1 hr−1). Further, to confirm diazotrophy at the molecular level, the nifH gene was amplified using universal primers. Out of 76, successful amplification of the nifH gene was observed only in 13 isolates, which showed the desired amplicon of 342 bp, corresponding to the target gene (Table 2). The reasons for discrepancy between the results of ARA and nifH amplification is mentioned in the discussion section.

3.6.2. Phosphate Solubilization, IAA and Siderophore Production

All 210 isolates were subjected to the qualitative tests of mineral phosphate solubilization activity, production of IAA and siderophore. Out of 210 isolates, 96, 83 and 119 were found to be positive for phosphate solubilization, IAA and siderophore production, respectively (data not shown). Representative strains belonging to each phylotype showing best activity in qualitative tests were subjected to quantification of the above-mentioned properties. The highest P solubilization activity was shown by PM03 (9.4 mM mL−1) followed by PM10462 (9.1 mM mL−1) and PM386 (8.9 mM mL−1) (Table 2), whereas the highest production of IAA was observed in PM253 (81.3 µg mL−1), followed by PM224 (80.25 µg mL−1). Twenty isolates which showed positive results for the production of siderophore were subjected to siderophore typing. Out of these 20 isolates, eleven isolates produced hydroxamate and four isolates produced catacholate type siderophore (Table 2). Three isolates, namely PM376, PM377, PM389, produced both hydroxamate and catecholate types, while two (PM8337 and PM8342) of them showed production of some other type of siderophores (not tested).

3.6.3. Tests for Cellulolytic and Pectinolytic Activities

Presence of cellulolytic (endoglucanase, cellobiohydrolase, β-glucosidase) and pectinolytic activities (pectinase) are among the few important traits required for endophytic colonization of bacteria. Out of 76 phylotypes, 26 isolates produced only one type of the above mentioned four hydrolytic enzymes, while 20 and 3 isolates were found positive for the production of two and three types of these enzymes, respectively. PM9411 and PM10462 showed the highest production of β-glucosidase, but none of the strains showed good activity for cellobiohydrolase. Isolates PM228 and PM380 showed the highest endoglucanase activity, while PM5143 and PM7220 exhibited the best pectinase activity (Supplementary Table S2).

3.7. In Vitro Studies of Plant Growth

Based on the presence of the best plant growth promoting properties, 14 isolates were selected and used to inoculate wheat seeds for: (i) evaluation of their effect on seed germination, (ii) plant growth stimulation in plate assay, and (iii) their ability to cross-infect. Inoculation of all selected isolates led to increase in root/shoot length and fresh weight in comparison to the un-inoculated control (Table 3). Out of 14 isolates, PM10455 was noted as the most efficient isolate, which enhanced plant growth by 23 and 88% w.r.t. total height and biomass, respectively. Except for a few, all the isolates showed significant difference in various parameters in comparison to the control (p < 0.05, n = 37). For instance, inoculation of PM380 and PM10461 resulted in insignificant changes in root length of treated plants, while PM9438 and PM9368 showed no significant changes in shoot length. In the case of fresh weight, no significant changes were observed in PM9438, PM8311, PM9364 and PM9368. Similarly, PM8311 and PM9364 showed no significant changes in vigor index.

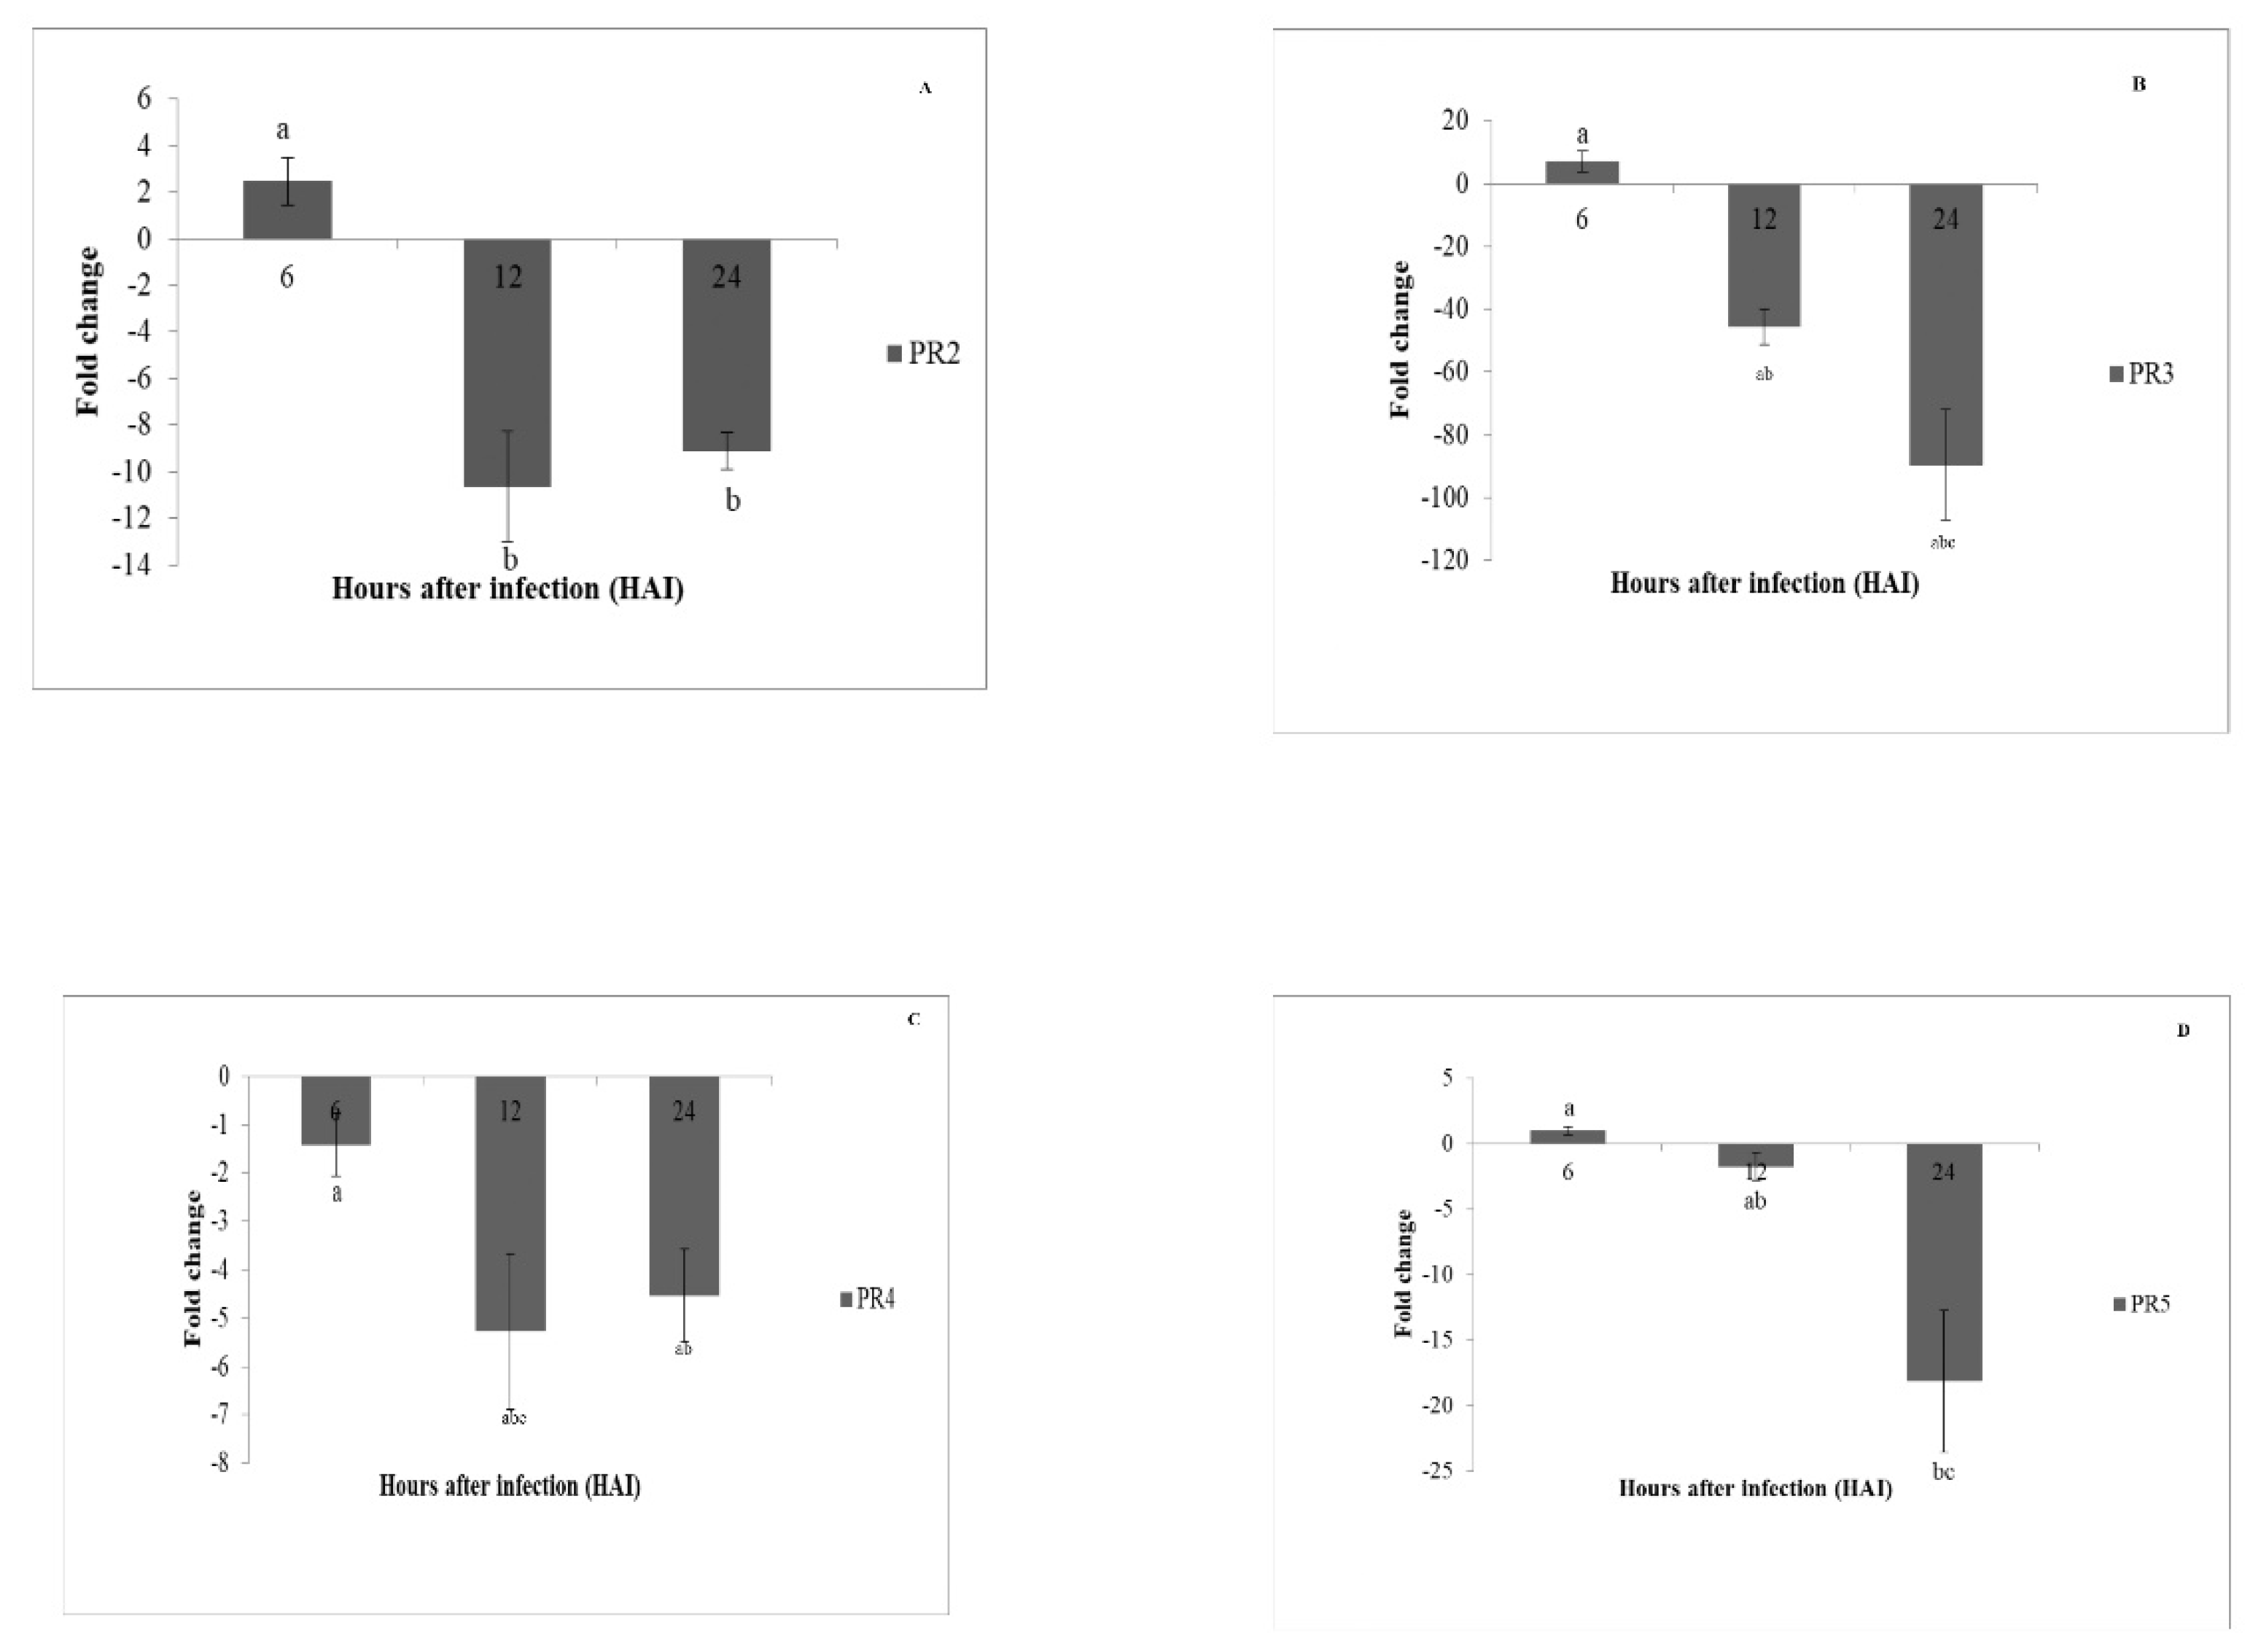
3.8. Gene Expression Analysis of Pathogenesis Related Genes

Changes in the PR gene expression profile in plants on endophytic challenge (P. aeruginosa PM389) were quantified to understand the plant responses towards dominant endophytic bacteria. Specificity of each pair of primers was confirmed using plant genomic DNA as a template with the appearance of a single amplicon of expected size on agarose gel. For analysis of qPCR data, values for PR gene expression in the control sample was nullified and the ratio was taken for the expression of the treated sample. Initially 2-fold (n = 12, p < 0.05) induction of PR2 gene at 6 HAI, followed by 10-fold (approx.) (n = 12, p < 0.05) downregulation from 12–24 HAI, was observed. Similarly, slight induction at 6 HAI followed by significantly high downregulation of the PR-3 gene at 12 HAI (45-fold) and at 24 HAI (90-fold) was observed. Unlike the majority of PR genes, PR4 was significantly downregulated (1–5 fold; n = 12, p < 0.05) at all the time points. Like PR2, the expression of PR5 slightly upregulated (1-fold approximately; n = 12, p < 0.05) initially (6 HAI) and then sharply downregulated (18-fold; n = 12, p < 0.05) at 24 HAI. The upregulated expression of PR10, with approximately 1-fold increase (n = 12, p < 0.05) at 6 and 12 HAI, followed downregulation at 24 HAI (1-fold approximately; n = 12, p < 0.05). A steep 25-fold (n = 12, p < 0.05) downregulation of PR12 was observed at 24 HAI. The expression of PR16 was upregulated at 6 and 24 HAI by 3- and 5-fold respectively, whereas it was downregulated at 12 HAI (9-fold approximately; n = 12, p < 0.05). Similar to PR5, PDI showed slightly higher expression than the control treatment at 6HAI, and became further downregulated at 24 HAI. PDI showed the highest downregulation at 24 HAI by 130 times (n = 12, p < 0.05) (Figure 7). PR2 and PR16 showed approximately 2-fold induction at 6 HAI, which was the highest among all PR genes studied. PR9 was the most downregulated gene at 6 HAI (Figure 7). Thus, downregulation of PR12 on colonization of p. aeruginosa PM389 accorded with the above observations (Figure 7). Interestingly, all PR genes, except PR16, were found to be downregulated at 24 HAI, while the level of PR16 was 5.28-fold higher than the control (Figure 7).

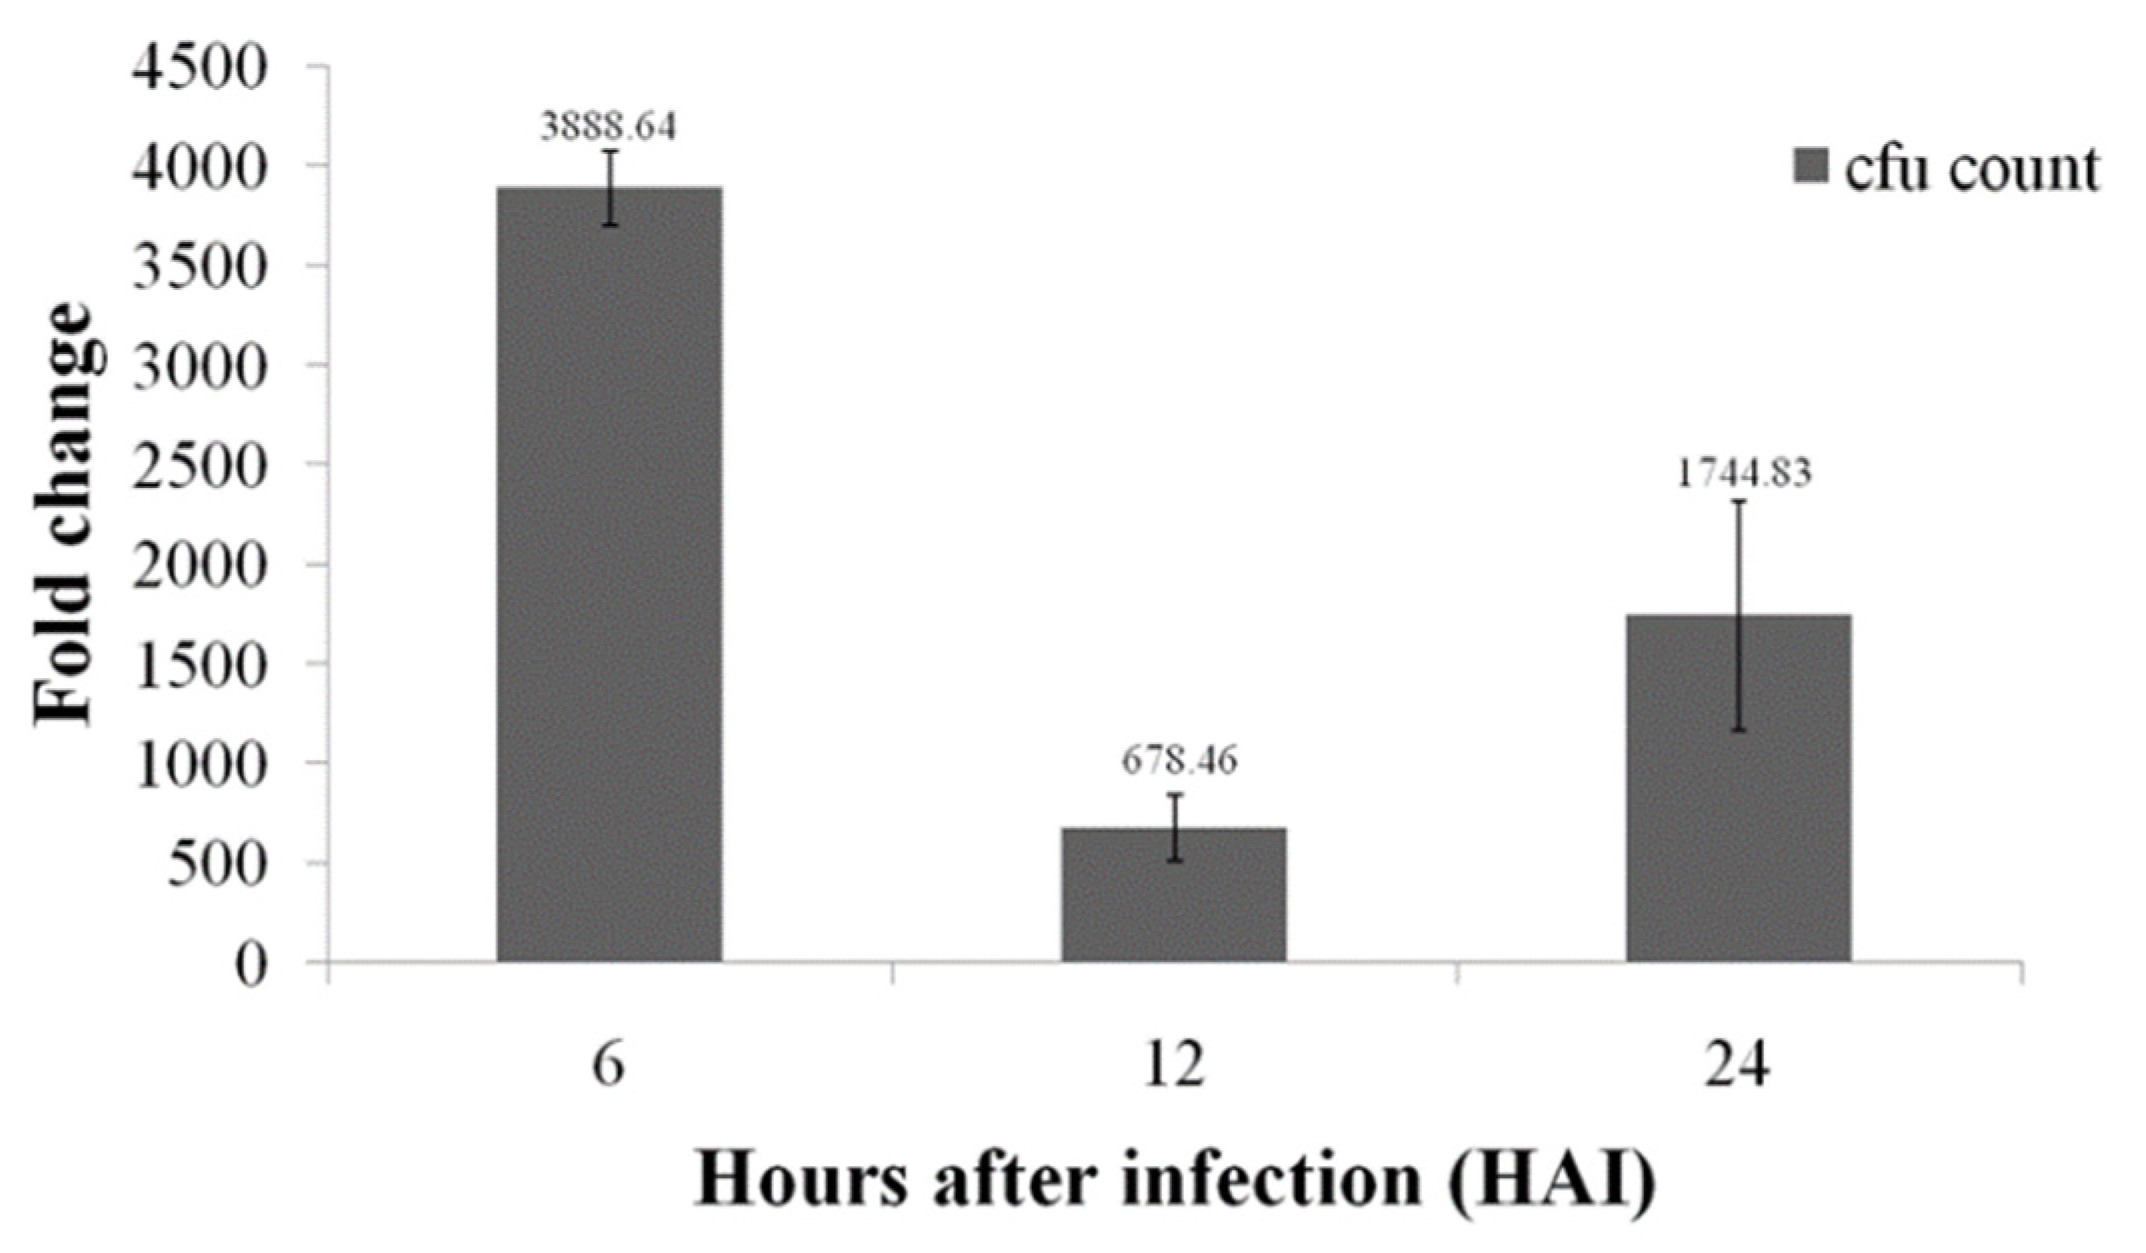
3.9. Colonization Studies

Based on level of the 16S rRNA gene transcript, no certain trend of colonization was observed. At 6 HAI, significant increase (n = 12, p < 0.05) of the 16S rRNAs of P. aeruginosa PM389 was observed (Figure 8). However, an approximately 6-fold decrease was observed in the level of bacterial transcript from plant samples collected at 12 HAI. Then, the level of bacterial transcript increased by 2.5-folds at 24 HAI.

4. Discussion

The present study highlighted the population dynamics and diversity of diazotrophic endophytic bacteria in the pearl millet growing in actual farming conditions. Overall, 210 cultivable diazotrophic endophytes were recovered and characterized in this study by analyzing their phenotypic properties, taxonomic position, and features likely to contribute in promoting plant growth. Understanding the population dynamics and bacterial diversity at different stages of plant growth can unveil several important aspects, including effect of plant age on the diazotrophic endophytic community, influence of community shift on nitrogen fixation [38], migration of endophytes in the plant parts under field conditions [39], and effect of diversity on soil factors [40].
The study of population dynamics demonstrated that the population of diazotrophic endophytic bacteria was low at early growth stage and then increased gradually in subsequent weeks up to the middle growth stage (28–56 DAS) of the pearl millet plant. This corroborated with earlier findings, where similar trends in population change were observed in temporal studies of field grown cucumber [23]. Enhanced population of endophytic bacteria during vegetative growth of the plant might have resulted from the availability of nutrient rich root exudates released from the plants. Contents of root exudate act as probable chemo-attractants and lead to successful colonization of compatible bacteria. In the later stage (63 DAS) of plant growth, bacterial population increased in the middle part of the stem. This observation supports the notion that the migration of bacteria to aerial portions results due to the search for more nutrition and space caused by shift of sink (source-sink relationship) from roots to aerial parts of the plant [14]. However, population of diazotrophic bacteria was lower in the upper part of the stem than in the other parts. This indicates that the lower bacterial population in the uppermost aerial portion probably arose due to slow systemic spreading in xylem connectivity or occluded pits in tracheary elements. Thus, restriction of the passage between xylem elements lengthens time required to reach the uppermost part of the stem [41]. Greater populations of endophytic bacteria in the root than in the shoot during the majority of growth stages of the plant correlates with the fact that the vast surface area provided by roots is a favorable habitat for harboring a variety of microorganisms [42]. Therefore, root growth leads to substrate production in the rhizosphere, which, in turn, promotes rhizobacterial proliferation, providing a carbon-rich environment and the primary site for the entry of endophytes [5].
One of the purposes of using the ERIC-PCR approach was to track the fate of seed-borne isolates during plant growth in natural conditions. Recovery of isolates from the root at 14 and 21 DAS showed ERIC-profiles identical to those of seed isolates, and indicated migration from seed to root. This observation was similar to the findings of earlier studies in which transfer of various endophytes from seeds to seedling was reported [43]. However, seed-borne isolates could not be recovered during the later stages of plant growth, which suggests replacement of the former with soil-borne bacteria [44]. As reported previously, P. aeruginosa PM389 was obtained from plant parts during the majority of the growth period of the plant and emerged as the most dominant colonizer [14]. Similar to our observation, Pseudomonads have been found to be diverse, numerous, dominating, and aggressive colonizers in earlier studies as well [45,46]. The reason for becoming the most dominant bacteria could be based on their high colonization efficiency and the fact that these genera are nutritionally or environmentally favored by the host plant [23]. The next most abundant species recovered during the study period was Enterobacter. Similar findings were observed, in which Pseudomanas and Enterobacter genera were the dominant genera associated with the canola plant (Brassica napus) in [47]. However, unlike our findings, none of the genera was reported to be the most dominant in their study.
In the initial stages of plant growth, some species like Enterobacter sp. and Bacillus sp. Other than the P. aeruginosa were also recovered from different parts of the plants. Subsequently, P. aeruginosa predominated in the middle stage of plant growth, although the above mentioned two species reappeared in the last stage of plant growth when population of P. aeruginosa declined. It can be inferred that these endophytic bacteria were present in the middle stage of pearl millet growth but they could not be recovered due to very low population resulting from the antagonistic nature of P. aeruginosa [14]. The recovery of these endophytic bacteria from plant samples collected in the late stage of plant growth indicated suboptimal conditions for the growth of P. aeruginosa. Decline in the population of P. aeruginosa might also have resulted due to intraspecies competition for nutrition and space [48,49].
Diversity of endophytic bacteria in the shoots was lower than the roots during early stages, while it showed a stable community structure in the middle stage of plant growth. Furthermore, endophytic bacterial diversity was high in both roots and shoots during late stages of plant growth. Similar observations were recorded by Mahaffee and Kloepper (1997) in which the diversity and genera richness of all the habitats studied tended to increase over the growing season, with the highest diversity and genera richness values at 70 days after planting [23]. Higher diversity of diazotrophic bacteria in roots than in shoots in the initial weeks might have resulted due to the difference in niches w.r.t. nutrient supply, atmospheric conditions, and competitiveness with other components of these communities [50]. In roots, carbon exudates are released which act as a nutrient source, as well as chemo-attractant, for bacteria, and are responsible for the colonization of endophytes inside the plant [46,51,52,53]. Moreover, higher bacterial diversity in the upper part as compared to the middle part of the shoot might have originated from aerial colonization in the plants [54]. The present study also demonstrated high diversity of endophytic bacteria but with low total population count. This result is supported by earlier study where relative increase in diversity of bacteria with decline in population was reported [23].
From 210 isolates, 76 different isolates, representing each phylotype, were further screened for various plant growth promoting activities. Based on ARA, all isolates showed positive results for nitrogenase activity. However, only 13 isolates showed amplification of the nifH gene encoding one of the structural components of the nitrogenase enzyme. Negative results for amplification of nifH in ARA-positive bacteria have also been reported in previous studies. This may occur due to high variability of this gene in nature [55,56]. The set of conserved sites of these genes suitable for designing primers is rather limited. Moreover, a high degree of degeneracy of the nifH gene nucleotide sequences virtually rules out the possibility of the existence of sufficiently extended invariant sequence sites. It has been reported that no direct correlation exists between the presence of nifH and the ARA activity of the bacterial strains [57].
On the basis of plant-growth promoting properties, fourteen best isolates were selected and applied to wheat plants to observe their effect on plant growth under controlled conditions. This was a simple and quick preliminary test for the initial screening of plant growth promoting bacteria to select efficient inoculants [32], so that the selected inoculants could further be tested on pot and field level for the development of future biofertilizer. Owing to these plant-growth promoting effects, various strains showed significant differences in plant growth in comparison to control plants, as shown in Table 3. The results of plant growth due to bacterial inoculation suggest that these endophytes can be used as potential biofertilizers. Appropriate formulation of individual bacteria, or of a consortium of these bacteria, needs to be optimized for field application in future studies.
Further, regulation of PR genes might have influential roles in the establishment of colonization of endophytic bacteria. Therefore, expression of different genes was quantified in plants inoculated with endophytic P. aeruginosa PM389. Further proteomic studies done earlier documented significant suppression of peroxidase, Mn-superoxide dismutase, PR10 and stress-induced protein during nodule emergence in legume-rhizobium association [58]. Suppression of peroxidase (PR9) in the host during colonization is supported by other reports as well [59,60]. Like PR9, PR2 resulted in a similar trend supported by downregulation of β-glucanase (MtBGLU1) gene from the roots of M. truncatula after 24 h of inoculation of Sinorhizobium meliloti [61]. PR3 and PR4 mainly contain chitinase (fungi) activity, whereas others have lysozyme activity (PR3) or release elicitor-active oligosaccharides and peroxidases, for evasion of pathogens [62]. Invading Rhizobium meliloti was protected from chitinases of Medicago and Vicia through structural modification in nod factors [63], while, in our study, beneficial bacteria suppressed expression of chitinases.
Defensins (PR12/PDF1.2) are regulated by the JA-ET pathway, and PGPRs are involved in interfering JA signaling for plant colonization [12]. PR 1–5 and PR12 were not upregulated in Arabidopsis (wild type for Ethylene signaling)-Piriformospora indica interaction (upregulation in ethylene mutants) and ERFs (Ethylene response factors) 9 and 14 were involved in suppression of PR 1 and 2 in [64]. Similarly, our results suggest that P. aeruginosa PM389 might be interfering with the JA pathway or other signaling cascades and/or the host plant suppresses its immune response for the establishment of P. aeruginosa PM389.
PR16 (JA-mediated oxalate-like oxidase) releases peroxidases and elicits hypersensitive cell death [65]. Previous research work suggested that JA-induced genes restrict entry of Azoarcus in rice and JA plays a major role during less compatible interaction [66]. Thus, downregulation of JA-responsive genes in our study suggests a compatible interaction between PM389 and wheat plants. PDI acts as a chaperone and assists in maintaining conformation of PR proteins in harsh environments [67]. It also acts in the endoplasmic reticulum (ER) quality control system for correct protein folding in Piriformospora indica [68]. Interruption in the ER (endoplasmic reticulum)-quality control system disturbs MTI, and thus increases disease susceptibility due to enhanced microbial colonization [69]. Therefore, initial induction of PDI might be involved in correct PR protein generation and prevention of initial colonization. However, the absence of PDI may lead to an increase in the invasion of bacteria by altering MTI, due to interruption in the ER (endoplasmic reticulum)-quality control system. Thus, altered expression of PDI might be one of the mechanisms of suppression of PR genes by endophytic bacteria to gain entry inside the plant (Figure 7). In the present study, PDI was also downregulated at 24 HAI after initial induction on the endophytic challenge.
To establish a relation between immune response and successful colonization, the trend of endophytic colonization was further studied by quantifying endophytic P. aeruginosa PM389 in plants. The qPCR approach was used for measuring the 16S rRNA transcript using a pair of primers specific to P. aeruginosa PM389, which revealed that the population of P. aeruginosa PM389 fluctuated during the initial interaction with the host plant. It suggested that during the initial encounter, the host plant detects the endophyte as non-self and generates a significantly high immune response, which is also supported from the expression data of defense-related genes described above. On downregulation of the immune response at 12 HAI afterwards, the level of P. aeruginosa PM389 transcript increased, indicating a direct relationship between immune response and bacterial colonization. In brief, the level of bacterial colonization was higher at 6 HAI, which reduced, due to the higher immune response, at 12 HAI. Then, it started increasing in the later phase at 24 HAI on reduction of the defense responses. In two recent reports about PGPR, it was noticed that Pseudomonas flourescens WCS417r and Bacillus subtilis FB17 are involved in suppressing early MAMP-triggered immune responses (MTI), which may further lead to successful establishment inside the host plant [70,71]. These results suggest the need to identify factors which may suppress the immune response of plants to allow successful endophytic colonization in future research (Figure 8).

Supplementary Materials

The following supporting information can be downloaded at: https://www.mdpi.com/article/10.3390/land11070991/s1, Table S1: Summary of the closest affiliations of the representative isolates in the GenBank according to the 16S-rRNA gene sequences. Table S2: Test for the cellulolytic and pectinolytic activities in various endophytic bacteria obtained in present study. Table S3: Primer sequences used for PR gene expression studies used in real time PCR.

Author Contributions

Formal analysis, S.P. and S.I.P.; Investigation, S.P.; Methodology, P.N.J., S.D. and D.J.; Resources, P.N.J.; Software, S.S., G.P., S.D. and R.D.; Validation, R.D.; Writing—original draft, G.G.; Writing—review & editing, S.S., G.P., S.I.P., S.D., D.J. and R.D. All authors have read and agreed to the published version of the manuscript.

Funding

This research work was supported by Department of Science and Technology (DST), Govt. of India, New Delhi under SERC Fast Track Scheme Project (No. SR/FT/LS 0662/065/2008) Sanctioned to PNJ. The first author is thankful to DST, New Delhi and UGC-BSR fellowship for providing research fellowship.

Institutional Review Board Statement

Not Applicable.

Informed Consent Statement

Not Applicable.

Data Availability Statement

Not Applicable.

Acknowledgments

This research work was supported by Department of Science and Technology (DST), Govt. of India, New Delhi. Sanctioned to PNJ. The first author is thankful to DST, New Delhi and UGC-BSR fellowship for providing research fellowship. We sincerely acknowledge Rajesh Mehrotra and Pankaj K. Sharma, Assistant Professors in Department of Biological Sciences, BITS Pilani for reviewing the manuscript for its technical content and English language. We sincerely acknowledge A.K. Das of Department of Biological Sciences, BITS Pilani for providing research facility in their lab as well as Amit subuddhi for providing help in conducting the experiments.

Conflicts of Interest

The authors declare no conflict of interest.

References

  1. Bhattacharjee, R.; Singh, A.; Mukhopadhyay, S.N. Use of nitrogen-fixing bacteria as biofertilizer for non-legumes: Prospects and challenges. Appl. Microbiol. Biotechnol. 2008, 80, 199–209. [Google Scholar] [CrossRef] [PubMed]
  2. Gupta, G.; Panwar, J.; Akhtar, M.; Jha, P. Endophytic nitrogen-fixing bacteria as biofertilizer. In Sustainable Agriculture Reviews; Lichtfouse, E., Ed.; Springer: Dordrecht, The Netherlands, 2012; pp. 183–221. [Google Scholar]
  3. Afzala, I.; Shinwari, Z.K.; Sikandar, S.; Shahzad, S. Plant beneficial endophytic bacteria: Mechanisms, diversity, host range and genetic determinants. Microbiol. Res. 2019, 221, 36–49. [Google Scholar] [CrossRef] [PubMed]
  4. Sarkar, D.; Sankar, A.; Devika, O.S.; Singh, S.; Parihar, M.; Rakshit, A.; Sayyed, R.Z.; Gafur, A.; Ansari, M.J.; Danish, S.; et al. Optimizing nutrient use efficiency, productivity, energetics, and economics of red cabbage following mineral fertilization and biopriming with compatible rhizosphere microbes. Sci. Rep. 2021, 11, 15680. [Google Scholar] [CrossRef]
  5. Lodewyckx, C.; Vangronsveld, J.; Porteous, F.; Moore, E.R.B.; Taghavi, S.; Mezgeay, M.; Van Der Lelie, D. Endophytic bacteria and their potential applications. Crit. Rev. Plant Sci. 2002, 21, 583–606. [Google Scholar] [CrossRef]
  6. Hameeda, B.; Rupela, O.P.; Reddy, G.; Satyavani, K. Application of plant growth-promoting bacteria associated with composts and macrofauna for growth promotion of pearl millet (Pennisetum glaucum L.). Biol. Fertil. Soils 2006, 43, 221–227. [Google Scholar] [CrossRef] [Green Version]
  7. Pallavi, S.P.; Srinivas, P.; Kumar, V.P.; Chandra, S.J.; Reddy, S.R. Plant growth promoting activities of fluorescent pseudomonads associated with some crop plants. Afr. J. Microbiol. Res. 2010, 4, 1491–1494. [Google Scholar]
  8. Manga, V.K.; Yadav, O.P. Effect of seed size on developmental traits and ability to tolerate drought in pearl millet. J. Arid Environ. 1995, 29, 169–172. [Google Scholar] [CrossRef]
  9. Mendes, R.; Kruijt, M.; de Bruijn, I.; Dekkers, E.; van der Voort, M.; Schneider, J.H.M.; Piceno, Y.M.; DeSantis, T.Z.; Andersen, G.L.; Bakker, P.A.H.M.; et al. Deciphering the rhizosphere microbiome for disease-suppressive bacteria. Science 2011, 332, 1097–1100. [Google Scholar] [CrossRef]
  10. Spoel, S.H.; Dong, X. How do plants achieve immunity? Defence without specialized immune cells. Nat. Rev. Immunol. 2012, 12, 89–100. [Google Scholar] [CrossRef]
  11. Van Loon, L.; Van Strien, E. The families of pathogenesis-related proteins, their activities, and comparative analysis of PR-1 type proteins. Physiol. Mol. Plant Pathol. 1999, 55, 85–97. [Google Scholar] [CrossRef]
  12. Jacobs, S.; Zechmann, B.; Molitor, A.; Trujillo, M.; Petutschnig, E.; Lipka, V.; Kogel, K.-H.; Schäfer, P. Broad-spectrum suppression of innate immunity is required for colonization of Arabidopsis roots by the fungus Piriformospora indica. Plant Physiol. 2011, 156, 726–740. [Google Scholar] [CrossRef] [PubMed] [Green Version]
  13. Zamioudis, C.; Pieterse, C.M. Modulation of host immunity by beneficial microbes. Mol. Plant-Microbe Interact. 2012, 25, 139–150. [Google Scholar] [CrossRef] [PubMed] [Green Version]
  14. Gupta, G.; Panwar, J.; Jha, P.N. Natural occurrence of P. aeruginosa, a dominant cultivable diazotrophic endophytic bacterium colonizing Pennisetum glaucum (L.) R. Br. Appl. Soil Ecol. 2013, 64, 252–261. [Google Scholar]
  15. Gupta, G.; Gupta, A.D.; Jha, P.N. Biocontrolling and colonization potential of P. aeruginosa PM389 Isolated from Pennisetum glaucum under field conditions. Int. J. Res. Emerg. Sci. Technol. 2015, 2, 104–116. [Google Scholar]
  16. Ghosh, S.P. Agro-Climatic Zone Specific Research-Indian Perspective under NARP (ICAR); Indian Council of Agriculture Research, India: New Delhi, India, 1991. [Google Scholar]
  17. Shyampura, R.L.; Singh, S.K.; Singh, R.S.; Jain, B.L.; Gajbhiye, K.S. Soil Series of Rajasthan; Udaipur: Technical Bulletin, NBSS & LUP; Indian Council of Agriculture Research, India: New Delhi, India, 2002. [Google Scholar]
  18. Cavalcante, V.A.; Döbereiner, J. A new acid-tolerant nitrogen-fixing bacterium associated with sugarcane. Plant Soil 1988, 108, 23–31. [Google Scholar] [CrossRef] [Green Version]
  19. Misra, N.; Gupta, G.; Jha, P.N. Assessment of mineral phosphate solubilizing properties and molecular characterization of zinc tolerant bacteria. J. Basic Microbiol. 2012, 52, 549–558. [Google Scholar] [CrossRef]
  20. Versalovic, J.; Koeuth, T.; Lupski, J.R. Distribution of repetitive DNA sequences in eubacteria and application to fingerprinting of bacterial genomes. Nucleic Acids Res. 2004, 19, 6823–6831. [Google Scholar] [CrossRef]
  21. NCBI Database. Available online: http://www.ncbi.nlm.nih.gov/ (accessed on 2 December 2013).
  22. Tamura, K.; Dudley, J.; Nei, M.; Kumar, S. MEGA4: Molecular evolutionary genetics analysis (MEGA) Software Version 4.0. Mol. Biol. Evol. 2007, 24, 1596–1599. [Google Scholar] [CrossRef]
  23. Mahaffee, W.F.; Kloepper, J.W. Temporal changes in the bacterial communities of soil, rhizosphere, and endorhiza associated with field-grown Cucumber (Cucumis sativus L.). Microb. Ecol. 1997, 34, 210–223. [Google Scholar] [CrossRef]
  24. Odum, E.P.; Barrett, J.W. Fundamentals of Ecology; Brooks/Cole-Thomson Learning; Thomson Brooks/Cole: Belmont, CA, USA, 2005. [Google Scholar]
  25. Lowry, O.H.; Rosebrough, N.J.; Farr, A.L.; Randall, R.J. Protein measurement with the folin phenol reagent. J. Biol. Chem. 1951, 193, 265–275. [Google Scholar] [CrossRef]
  26. Mehta, S.; Nautiyal, C.S. An efficient method for qualitative screening of phosphate-solubilizing bacteria. Curr. Microbiol. 2001, 43, 51–56. [Google Scholar] [CrossRef] [PubMed]
  27. Ames, B.N. Assay of inorganic phosphate, total phosphate and phosphatases. In Methods in Enzymology; Ginsburg, N.V., Ed.; Academic Press Publisher: New York, NY, USA, 1996; Volume 8, pp. 115–118. [Google Scholar]
  28. Gordon, S.A.; Weber, R.P. Colorimetric estimation of indole-acetic acid. Plant Physiol. 1951, 26, 192–195. [Google Scholar] [CrossRef] [PubMed] [Green Version]
  29. Kasana, R.; Salwan, R.; Dhar, H.; Dutt, S.; Gulati, A. A rapid and easy method for the detection of microbial cellulases on agar plates using Gram’s Iodine. Curr. Microbiol. 2008, 57, 503–507. [Google Scholar] [CrossRef] [PubMed]
  30. Reinhold-Hurek, B.; Hurek, T.; Gillis, M.; Hoste, B.; Vancanneyt, M.; Kersters, K.; De Ley, J. Azoarcus gen. nov., nitrogen-fixing proteobacteria associated with roots of kallar grass (Leptochloa fusca (L.) Kunth), and description of two species, Azoarcus indigens sp. nov. and Azoarcus communis sp. nov. Int. J. Syst. Bacteriol. 1993, 43, 574–584. [Google Scholar] [CrossRef]
  31. Jha, P.; Kumar, A. Characterization of novel plant growth promoting endophytic bacterium Achromobacter xylosoxidans from wheat plant. Microb. Ecol. 2009, 58, 179–188. [Google Scholar] [CrossRef]
  32. Khalid, A.; Arshad, M.; Zahir, Z.A. Screening plant growth-promoting rhizobacteria for improving growth and yield of wheat. J. Appl. Microbiol. 2004, 96, 473–480. [Google Scholar] [CrossRef]
  33. Garima, G.; Das, A.; Jha, P.; Jha, P.N. Endophytic Bacteria Pseudomonas aeruginosa PM389 Subsists Host’s (Triticum aestivum) Immune Response for Gaining Entry Inside the Host. J. Pure Appl. Microbiol. 2021, 15, 2486–2497. [Google Scholar]
  34. Gupta, G.; Das Gupta, A.; Jha, P.N. Comparative analysis of defence responses Triticum aestivum L in response to the endophytic Pseudomonas aeruginosa PM389 and the non-host microbial pathogens Erwinia carotovora and Fusarium monaliforme. Res. J Biotech. 2022, 17, 107–117. [Google Scholar] [CrossRef]
  35. SpeciesPrimer: A bioinformatics pipeline dedicated to the design of qPCR primers for the quantification of bacterial species. PeerJ. 2020, 8, e8544. [CrossRef] [Green Version]
  36. Kloepper, J.W.; Beauchamp, C.J. A review of issues related to measuring colonization of plant roots by bacteria. Can. J. Microbiol. 1992, 38, 1219–1232. [Google Scholar] [CrossRef]
  37. Quinn, G.P.; Keough, M.J. Experimental Design and Data Analysis for Biologists, 1st ed.; Cambridge University Press: Cambridge, UK, 2002. [Google Scholar]
  38. Zafar-ul-Hye, M.; Akbar, M.N.; Iftikhar, Y.; Abbas, M.; Zahid, A.; Fahad, S.; Datta, R.; Ali, M.; Elgorban, A.M.; Ansari, M.J.; et al. Rhizobacteria inoculation and caffeic acid alleviated drought stress in lentil plants. Sustainability 2021, 13, 9603. [Google Scholar] [CrossRef]
  39. Andreote, F.D.; Rocha, U.N.; Araújo, W.L.; Azevedo, J.L.; Van Overbeek, L.S. Effect of bacterial inoculation, plant genotype and developmental stage on root-associated and endophytic bacterial communities in potato (Solanum tuberosum). Antonie Leeuwenhoek 2010, 97, 389–399. [Google Scholar] [CrossRef] [PubMed]
  40. Garbeva, P.; Postma, J.; Van Veen, J.A.; Van Elsas, J.D. Effect of above-ground wplant species on soil microbial community structure and its impact on suppression of Rhizoctonia solani AG3. Environ Microbiol. 2006, 8, 233–246. [Google Scholar] [CrossRef] [PubMed]
  41. Compant, S.; Kaplan, H.; Sessitsch, A.; Nowak, J.; Ait Barka, E.; Clément, C. Endophytic colonization of Vitis vinifera L. by Burkholderia phytofirmans strain PsJN: From the rhizosphere to inflorescence tissues. FEMS Microbiol. Ecol. 2008, 63, 84–93. [Google Scholar] [CrossRef] [Green Version]
  42. Welbaum, G.E.; Sturz, A.V.; Dong, Z.; Nowak, J. Managing soil microorganisms to improve productivity of agro-ecosystems. CRC Crit. Rev. Plant Sci. 2004, 23, 175–193. [Google Scholar] [CrossRef]
  43. Ferreira, A.; Quecine, M.C.; Lacava, P.T.; Oda, S.; Azevedo, J.L.; Araújo, W.L. Diversity of endophytic bacteria from Eucalyptus species seeds and colonization of seedlings by Pantoea agglomerans. FEMS Microbiol. Lett. 2008, 287, 8–14. [Google Scholar] [CrossRef] [PubMed] [Green Version]
  44. Lilley, A.K.; Fry, J.C.; Bailey, M.J.; Day, M.J. Comparison of aerobic heterotrophic taxa isolated from four root domains of mature sugar beet (Beta vulgaris). FEMS Microbiol. Ecol. 1996, 21, 231–242. [Google Scholar] [CrossRef]
  45. Germida, J.; Siciliano, S.D.; Renato De Freitas, J.; Seib, A.M. Diversity of root-associated bacteria associated with field-grown canola (Brassica napus L.) and wheat (Triticum aestivum L.). FEMS Microbiol. Ecol. 1998, 26, 43–50. [Google Scholar] [CrossRef]
  46. Sarkar, D.; Rakshit, A.; Parewa, H.P.; Danish, S.; Alfarraj, S.; Datta, R. Bio-priming with compatible rhizospheric microbes enhances growth and micronutrient uptake of red cabbage. Land 2022, 11, 536. [Google Scholar] [CrossRef]
  47. Farina, R.; Beneduzi, A.; Ambrosini, A. Diversity of plant growth-promoting rhizobacteria communities associated with the stages of canola growth. App. Soil Ecol. 2012, 55, 44–52. [Google Scholar] [CrossRef]
  48. Bacon, C.; Hinton, D. Bacterial endophytes: The endophytic niche, its occupants, and its utility. In Plant-Associated Bacteria; Gnanamanickam, S.S., Ed.; Springer: Dordrecht, The Netherlands, 2007; Volume 3, pp. 155–194. [Google Scholar]
  49. Sarkar, D.; Rakshit, A. Amalgamation of farmers’ bio-priming knowledge in integrated nutrient management for sustainable management of red cabbage soil under Middle Gangetic Plains, India. Environ. Manag. 2022. [Google Scholar] [CrossRef] [PubMed]
  50. Rao, D.; Webb, J.S.; Kjelleberg, S. Microbial colonization and competition on the marine alga Ulva australis. Appl. Environ. Microbiol. 2006, 72, 5547–5555. [Google Scholar] [CrossRef] [PubMed] [Green Version]
  51. Datta, R.; Baraniya, D.; Wang, Y.F.; Kelkar, A.; Meena, R.S.; Yadav, G.S.; Teresa Ceccherini, M.; Formanek, P. Amino acid: Its dual role as nutrient and scavenger of free radicals in soil. Sustainability 2017, 9, 1402. [Google Scholar] [CrossRef] [Green Version]
  52. Holátko, J.; Brtnický, M.; Kučerík, J.; Kotianová, M.; Elbl, J.; Kintl, A.; Kynický, J.; Benada, O.; Datta, R.; Jansa, J. Glomalin–Truths, myths, and the future of this elusive soil glycoprotein. Soil Biol. Biochem. 2021, 153, 108116. [Google Scholar] [CrossRef]
  53. Sarkar, D.; Rakshit, A.; Al-Turki, A.I.; Sayyed, R.Z.; Datta, R. Connecting bio-priming approach with integrated nutrient management for improved nutrient use efficiency in crop species. Agriculture 2021, 11, 372. [Google Scholar] [CrossRef]
  54. Verma, S.C.; Singh, A.; Chowdhury, S.P.; Tripathi, A.K. Endophytic colonization ability of two deep-water rice endophytes, Pantoea sp. and Ochrobactrum sp. using green fluorescent protein reporter. Biotechnol. Lett. 2004, 26, 425–429. [Google Scholar] [CrossRef]
  55. Chowdhury, S.; Schmid, M.; Hartmann, A.; Tripathi, A. Identification of diazotrophs in the culturable bacterial community associated with roots of Lasiurus sindicus, a perennial grass of thar desert, India. Microbial Ecol. 2007, 54, 82–90. [Google Scholar] [CrossRef]
  56. Zehr, J.P.; Jenkins, B.D.; Short, S.M.; Steward, G.F. Nitrogenase gene diversity and microbial community structure: A cross-system comparison. Environ. Microbiol. 2003, 5, 539–554. [Google Scholar] [CrossRef]
  57. Dean, D.R.; Jacobson, M.R. Biochemical genetics of nitrogenase. In Biological Nitrogen Fixation; Stacey, G., Burris, R.H., Evans, H.J., Eds.; Chapman & Hall: New York, NY, USA, 1992; pp. 763–834. [Google Scholar]
  58. Lim, C.W.; Park, J.Y.; Lee, S.H.; Hwang, C.H. Comparative proteomic analysis of soybean nodulation using a supernodulation mutant, SS2-2. Biosci. Biotech. Biochem. 2010, 74, 2396–2404. [Google Scholar] [CrossRef] [Green Version]
  59. Den Herder, J.; Lievens, S.; Rombauts, S.; Holsters, M.; Goormachtig, S. A symbiotic plant peroxidase involved in bacterial invasion of the tropical legume Sesbania rostrata. Plant Physiol. 2007, 144, 717–727. [Google Scholar] [CrossRef] [Green Version]
  60. Naffaa, W.; Ravel, C.; Boyer, N.; Guillaumin, J.-J. Peroxidase activity of perennial ryegrass and tall fescue seedlings artificially infected with endophytes. Agronomie 1999, 19, 611–619. [Google Scholar] [CrossRef]
  61. Mitra, R.M.; Long, S.R. Plant and bacterial symbiotic mutants define three transcriptionally distinct stages in the development of the Medicago truncatula/Sinorhizobium meliloti symbiosis. Plant Physiol. 2004, 134, 595–604. [Google Scholar] [CrossRef] [PubMed] [Green Version]
  62. Stintzi, A.; Heitz, T.; Prasad, V.; Wiedemann-Merdinoglu, S.; Kauffmann, S.; Geoffroy, P.; Legrand, M.; Fritig, B. Plant ‘pathogenesis-related’proteins and their role in defense against pathogens. Biochimie 1993, 75, 687–706. [Google Scholar] [CrossRef]
  63. Staehelin, C.; Schultze, M.; Kondorosi, É.; Mellor, R.B.; Boiler, T.; Kondorosi, A. Structural modifications in Rhizobium meliloti Nod factors influence their stability against hydrolysis by root chitinases. Plant J. 1994, 5, 319–330. [Google Scholar] [CrossRef]
  64. Camehl, I.; Oelmüller, R. Do ethylene response factors 9 and-14 repress PR gene expression in the interaction between Piriformospora indica and Arabidopsis? Plant Sig. Behav. 2010, 5, 932–936. [Google Scholar] [CrossRef] [Green Version]
  65. Lane, B.G. Oxalate, Germins, and Higher-Plant Pathogens. IUBMB Life 2002, 53, 67–75. [Google Scholar] [CrossRef]
  66. Miché, L.; Battistoni, F.; Gemmer, S.; Belghazi, M.; Reinhold-Hurek, B. Upregulation of jasmonate-inducible defense proteins and differential colonization of roots of Oryza sativa cultivars with the endophyte Azoarcus sp. Mol. Plant-Microbe Interact. 2006, 19, 502–511. [Google Scholar] [CrossRef] [Green Version]
  67. Kitajima, S.; Sato, F. Plant pathogenesis-related proteins: Molecular mechanisms of gene expression and protein function. J. Biochem. 1999, 125, 1–8. [Google Scholar] [CrossRef]
  68. Anelli, T.; Sitia, R. Protein quality control in the early secretory pathway. EMBO 2008, 27, 315–327. [Google Scholar] [CrossRef] [Green Version]
  69. Saijo, Y.; Tintor, N.; Lu, X.; Rauf, P.; Pajerowska-Mukhtar, K.; Häweker, H.; Dong, X.; Robatzek, S.; Schulze-Lefert, P. Receptor quality control in the endoplasmic reticulum for plant innate immunity. EMBO J. 2009, 28, 3439–3449. [Google Scholar] [CrossRef] [Green Version]
  70. Millet, Y.A.; Danna, C.H.; Clay, N.K.; Songnuan, W.; Simon, M.D.; Werck-Reichhart, D.; Ausubel, F.M. Innate immune responses activated in Arabidopsis roots by microbe-associated molecular patterns. Plant Cell Online 2010, 22, 973–990. [Google Scholar] [CrossRef] [PubMed] [Green Version]
  71. Lakshmanan, V.; Kitto, S.L.; Caplan, J.L.; Hsueh, Y.-H.; Kearns, D.B.; Wu, Y.-S.; Bais, H.P. Microbe-associated molecular patterns-triggered root responses mediate beneficial rhizobacterial recruitment in Arabidopsis. Plant Physiol. 2012, 160, 1642–1661. [Google Scholar] [CrossRef] [PubMed] [Green Version]
Figure 1. Comparison of total endophytic (TEP) and diazotrophic endophytic population (DEP) with the growth of Pennisetum glaucum in (a) Root and (b) Shoot. Letters L, M, U denote lower, middle and upper parts of stem. Vertical bars represent standard deviation. The mean values were compared, using Duncan’s multiple range test (DMRT) at p < 0.05. Values that were significantly different from each other are headed by different letters in different samples (Data obtained from Gupta et al., 2013 [14]).
Land 11 00991 g001
Figure 2. Depiction of recurrence of ERIC-types at different growth stages of Pennisetum glaucum under field growth conditions.
Land 11 00991 g002
Figure 3. (a) Phylogenetic tree based on partial 16S rRNA gene sequence showing the relationship among various bacterial isolates obtained from pearl millet during the entire growth period of the plant. Bootstrap values greater than 50 are indicated at the corresponding nodes. (b) Pie-diagram showing different classes of bacteria isolated during the present study.
Land 11 00991 g003aLand 11 00991 g003b
Figure 4. Change in diversity of diazotrophic endophytic bacteria with growth of pearl millet plants grown under field conditions. Highest peaks at 21R and 63MS refer to maximum diversity in roots sampled at 21 DAS and middle parts of shoots sampled at 63 DAS respectively. Letters R, S, MS, US, LS denote roots, shoot, middle shoot, upper shoot and lower shoot, respectively.
Land 11 00991 g004
Figure 5. Representation of percent abundance of variety of bacterial species obtained in different weeks of plant growth under field conditions (R-root, S-shoot, LS-lower shoot, MS-middle shoot, US-upper shoot). Each color represents a different species, and P. aeruginosa was the most dominant in the middle stage, while diversity was present in the initial and final stages of plant growth. Some species present in the initial growth stages showed recurrence in the later stages of plant growth.
Land 11 00991 g005
Figure 6. Preston’s rank abundance curve of endophytic bacterial communities at different growth stages of pearl millet. Rank abundance plots are based on relative abundance data when abundance was measured as cfu counts for each species. (a) 0 DAS (b) 14 DAS (Root) (c) 21 DAS (Root) (d) 28 DAS (Root) (e) 56 DAS (Above Shoot) (f) 63 DAS (Root) (g) 63 DAS (Below shoot) (h) 63 DAS (Middle shoot) (i) 63 DAS (Above shoot) (j) 70 DAS (Root) (k) 70 DAS (Above shoot). Abundance distribution of different ranked bacteria is shown by dots.
Land 11 00991 g006
Figure 7. Temporal changes in PR gene (A. PR2, B. PR3, C. PR4, D. PR5, E. PR9, F. PR10, G. PR12, H. PR16, I. PDI) expression of Triticum aestivum (var. GW322) on endophytic (P. aeruginosa PM389) challenge from 0–24 HAI. Vertical bars represent standard deviation. The mean values were compared, using Duncan’s multiple range test (DMRT) at p < 0.05. Values that were significantly different from each other are headed by different letters in each bar of treatment.
Land 11 00991 g007aLand 11 00991 g007b
Figure 8. Population dynamics of endophyte (P. aeruginosa PM389) on challenge inoculation in Triticum aestivum (var. GW322) at transcript level. Each value represents mean of duplicates and vertical bars represent standard deviation. The mean values were compared using Duncan’s multiple range test (DMRT) at p < 0.05. Values that were significantly different from each other are headed by different letters in each bar of treatment.
Land 11 00991 g008
Table 1. Changes in diversity of total diazotrophic endophytic population with the growth of pearl millet under field conditions. R and S represent root and shoot, respectively.
Sample (DAS)Shannon’s
Index (H)
Evenness (eH/S)Dominance (D)
0 (Seeds)1.08900.99030.3400
70.00001.00001.0000
14R1.12700.51460.4683
14S0.30460.67810.8347
21R1.79900.67140.2256
21S0.45060.78460.7222
28R0.14460.38520.9463
28S0.00001.00001.0000
35R0.18880.60390.9109
35S0.00001.00001.0000
42R0.00001.00001.0000
42S0.00001.00001.0000
49R0.09380.54920.9629
49S0.58900.90110.6005
56R0.19760.60920.9056
56(L)S0.35140.71050.8006
56(U)S0.84390.77510.4588
63R1.39100.80360.2764
63(L)S0.77240.72170.5678
63(M)S1.98100.72540.1667
63(U)S1.26800.71060.3504
70R1.16000.63770.4380
70(L)S0.00001.00001.0000
70(M)S0.00001.00001.0000
70(U)S0.96520.87510.4289
Table 2. Plant growth promoting traits of various strains obtained in this study.
Isolate No.IAA
(µg/mL)
Phosphate-Solubilization (mM/mL)% Siderophore
(Typing)
ARA
(nmol Ethylene
mg Protein−1 hr−1)
nifH
PM03 -9.4-40.24-
PM0510.74 ± 0.49-12.8 (H)7.70 ± 0.20-
PM16-2.52.5 (H)21.09 ± 3.80+
PM21911.80 ± 0.57--30.36 ± 2.54+
PM22173.70 ± 0.926.40.3 (C)24.84 ± 5.60-
PM223 ---35.53-
PM22480.25 ± 2.107.5-26.22-
PM228---32.40+
PM23219.76 ± 0.906.814.2 (C)26.28-
PM251---3.45-
PM25381.30 ± 3.396.06.77 (C)28.84-
PM3668.58 ± 0.93-3 (H)30.23-
PM368--0.5 (C)4.55-
PM3769.40 ± 0.63-63.5 (C) (H)10.09-
PM377--78.5 (C) (H)9.78-
PM379---45.83 ± 2.57-
PM380 ---20.84 ± 4.13+
PM381---23.20-
PM38667.30 ± 2.478.9-18.98-
PM389-V.L.0.6 (C) (H)28.91 ± 1.86+
PM410650.35 ± 0.50--20.34-
PM4107-V.L.13 (H)25.68-
PM514314.09 ± 1.05--9.87+
PM51534.47 ± 0.40-0.3 (H)8.87+
PM7220---5.67-
PM7265-V.L.13.43 (H)26.00-
PM83113.40 ± 0.17--6.72 ± 2.56+
PM8335---31.79-
PM833715.47 ± 2.455.911.722.98+
PM834231.81 ± 2.202.913.0529.98-
PM9363---2.98+
PM9364---1.83 ± 0.87+
PM9365---34.63 ± 1.49-
PM9366-2.55.3 (H)28.89-
PM9367---20.79-
PM9368---10.96 ± 3.33-
PM9369---18.94-
PM937017.78 ± 1.20--4.32-
PM9376---15.67-
PM9383---7.58-
PM9399---28.89-
PM94006.91 ± 2.10--6.86-
PM940115.43 ± 0.32--26.78-
PM9402---24.32 ± 6.20-
PM9403---13.58-
PM9404--0.5 (H)56.03 ± 4.66-
PM940510.77 ± 1.98--95.56 ± 0.92-
PM9406---4.58-
PM9408 6.50 ± 1.15-8.8 (H)16.43 ± 2.83-
PM9409---13.08-
PM9410---5.90-
PM94117.89 ± 0.50--5.25-
PM9424 ---30.90-
PM94268.99 ± 2.78--32.96 ± 1.86-
PM942710.23 ± 0.00--30.34-
PM9429---18.65-
PM9430---16.90-
PM9432---8.92-
PM9433---7.89-
PM943541.49 ± 0.11--14.56-
PM943617.62 ± 3.25--5.67-
PM943715.85 ± 0.5--100.89-
PM943814.86 ± 1.79--31.86 ± 5.06-
PM1045512.08 ± 0.32--128.36 ± 3.42+
PM10458---25.43-
PM10459---15.98-
PM1046119.48 ± 1.79--103.93 ± 1.99-
PM104626.34 ± 0.959.1-5.68-
PM10463---15.02-
PM10476---8.98-
PM10478---15.67-
PM10490-V.L.3.5 (H)23.34-
PM10491-V.L.8.8 (H)25.67-
PM10503---47.11 ± 6.22+
PM10509---18.96-
PM10510---57.73 ± 6.9-
-—no activity, +—activity present, H—hydroxamate, C—catacholate, V.L.—very low.
Table 3. Effect of selected bacterial inoculants on growth of wheat plant.
IsolatesRoot Length (cm) Shoot Length (cm)Fresh Wt. (g)Vigour Index
Control2.9 ± 1.06.7 ± 0.90.08 ± 0.02960
PM94383.4 ± 1.9 (17%) *7.6 ± 1.9 (13%)0.10 ± 0.05 (35%)1100 (15%) *
PM104553.65 ± 1.3 (26%) *8.2 ± 1.7 (22%) *0.15 ± 0.09 (88%) *1185 (23%) *
PM3803.1 ± 1.6 (7%)8.45 ± 1.5 (25%) *0.13 ± 0.03 (63%) *1155 (20%) *
PM3893.5 ± 0.1 (21%) *7.9 ± 1.3 (18%) *0.1 ± 0.02 (25%) *1140 (19%) *
PM94263.8 ± 1.5 (31%) *9.6 ± 2.2 (43%) *0.10 ± 0.03 (25%) *1340 (40%) *
PM83113.3 ± 1.3 (14%) *6.9 ± 1.7 (3%) *0.08 ± 0.03 (0%)1020 (6%)
PM93643.32 ± 1.5 (14%) *6.9 ± 2.4 (3%) *0.08 ± 0.02 (0%)1022 (6%)
PM94024 ± 1.8 (38%) *7.8 ± 1.0 (16%) *0.09 ± 0.01 (13%) *1180 (23%) *
PM93633.7 ± 0.9 (28%) *8.2 ± 1.0 (22%) *0.11 ± 0.02 (38%) *1190 (24%) *
PM93683.7 ± 1.3 (28%) *7.1 ± 1.3 (5%)0.09 ± 0.02 (13%)1080 (23%) *
PM94053.8 ± 1.2 (31%) *7.8 ± 1.2 (16%) *0.11 ± 0.02 (38%) *1160 (21%) *
PM104613.4 ± 1.1 (17%)7.6 ± 1.5 (13%) *0.09 ± 0.03 (13%) *1100 (15%) *
PM94043.7 ± 1.0 (28%) *7.6 ± 1.0 (13%) *0.10 ± 0.02 (25%) *1130 (18%) *
PM94083.7 ± 1.4 (28%) *7.5 ± 1.2 (12%) *0.10 ± 0.02 (25%) *1120 (17%) *
* represent the significant changes in various parameters compared to control.
Publisher’s Note: MDPI stays neutral with regard to jurisdictional claims in published maps and institutional affiliations.

