Article

The External Characteristics and Mechanism of Urban Road Corridors to Agglomeration: Case Study for Guangzhou, China

1
College of Architecture and Urban Planning, Guangzhou University, Guangzhou 510006, China
2
College of Design and Art, Lanzhou University of Technology, Lanzhou 730050, China
3
College of Literature and Media, Dongguan University of Technology, Dongguan 523808, China
*
Author to whom correspondence should be addressed.
These authors contributed equally to this work.
Land 2022, 11(7), 1087; https://doi.org/10.3390/land11071087
Submission received: 15 June 2022 / Revised: 8 July 2022 / Accepted: 11 July 2022 / Published: 15 July 2022

Abstract

:
Existing research on the agglomeration effect of urban roads mainly focuses on land use but ignores the differences between various locations, types, and directions of roads. Few studies have been conducted on the built buildings which can represent the actual utility, and land use as a kind of government authorization may not necessarily represent actual needs. This research provides an analytical framework and an empirical analysis to study the differences in impacts of different urban roads on land use and to identify its internal dynamic mechanism. Guangzhou, being the research object, is one of the five major central cities in China. By using the techniques of GIS and SPSS, together with the methods of corridor effect, correlation analysis, and geographic detector, we analyze the external characteristics of office buildings and land gathering along both sides of the roads, explore the urban characteristics of corridor effect, then analyze the relationship with urban traffic flow and bus network density in order to find out the internal motivation of corridor effect. The fundamental conclusion can be drawn that the corridor effect on the land used for commercial offices is mostly unnoticeable, and roads of different locations, types, and directions display various scope and intensity of corridor effects. The agglomeration power is mainly caused by private transportation and has no relationship with public transport. The article concludes the model of the corridor effect and provides some policy suggestions to the government in order to strengthen the linkage development of transportation and land and to promote the improvement of land use efficiency.

1. Introduction

Urban roads, supported by public taxes and built for citizen use, are important municipal facilities planned by the city government for their public and open nature. Urban roads have become the ‘aorta’ in urban development. The urban sector theory, brought up by H. Hoyt (1939), states that transportation is the chief factor in directing the formation of a city. The interactive relationship between urban transportation and land use is the common research result, and their mutual coordination is the fundamental way to solve traffic problems.

2. Literature Review

The research on transportation and land use can be divided into three stages according to the research content and period. Early, Arturo Soria y Mata, a Spanish engineer, put forward the “linear city concept” in 1882. He believes that the urban development model of expanding from the core to the outside will only lead to urban congestion and health deterioration. In order for urban residents to enjoy urban facilities without departing from nature, the future city should be a 500-meter-wide block along the main road and be as long as it takes. In 1909, the German economist A. Weber put forward the industrial location theory, which attributed the agglomeration of industrial land to three factors: freight, labor cost, and agglomeration. Transportation has become the most important key factor. On the basis of studying the real estate data of 142 cities in the United States, R. M. Hurd put forward the fan-shaped city model In 1939 and believed that the urban land distribution is mainly determined by urban roads and rent. These studies from the early nineteenth century to the mid-twentieth century are almost from the perspective of urban form.
From 1950 to the present, theories on the interaction between urban roads and urban society and other elements mainly focused on the biological environment and landscape [1,2,3,4,5,6], urban agglomeration and urbanization [7,8,9,10,11,12], industrial transformation [13,14,15,16], land agglomeration use [17,18,19,20,21], real estate development [22,23,24,25,26,27,28], location [29,30,31,32,33,34,35,36,37], mixed land use [38,39,40,41], and property right [42,43]. Based on quantitative models, scholars have conducted a lot of research mainly on the interaction between economy, social demand [44,45], land and transportation [46]. Regarding the specific role of roads on urban land use, researchers established urban form development models, such as the accessibility model [31,36], urban time budget and space budget model [47], single constraint gravity model [48], and micro simulation urbanism model [49].
The specific corridor effect on land advancement was not propounded until the end of the 20th century. Taaffe (1992) [50] created the corridor effect theory from the macro scale, according to which urban functional agglomeration and diffusion occur mainly along arterial routes, leading to a star-shaped urban form. Fu Bojie (2001) [51], from the micro traffic accessibility, came up with a corridor effect, which includes the circulation effect (i.e., the traffic role of corridors) and field effect (i.e., the radial impact from corridors). The field effect can be illustrated by its spatial attraction and differentiation, in which the former, principally due to the enlargement of space accessibility, is to stimulate the burgeoning of land along the roads, while the latter, due to the assorted attraction to different types of land after improving space approachability, leads eventually to the classification of land functions, such as verifying the magnetic and repulsive effect of corridors to the population densities [52], public infrastructures [53], business, industry, and offices [54], housing price, and the degrees of development [55,56] by using quantitative means. As for the study of influential radius, Chinese scholars took 500 m and 1000 m [57,58] as their research ranges, while most other scholars took 2000 m [38] as theirs. Early case studies focused on single traffic line, such as Guangzhou Avenue in Guangzhou [54], and later research gradually broadened their scope, such as Changchun City [40].
Most of the existing corridor effect model research is based on the analysis of land use, which often contains land title information. However, the fact is land use is also affected by government planning [59,60]. Buildings can truly reflect the market construction situation, but they are often ignored. Urban roads with different locations, types, and directions may exhibit different corridor effects and influence ranges, and such research content is often overlooked. An in-depth analysis of these possibilities could promote the depth and refinement of the corridor effect model.

3. Materials and Methodology
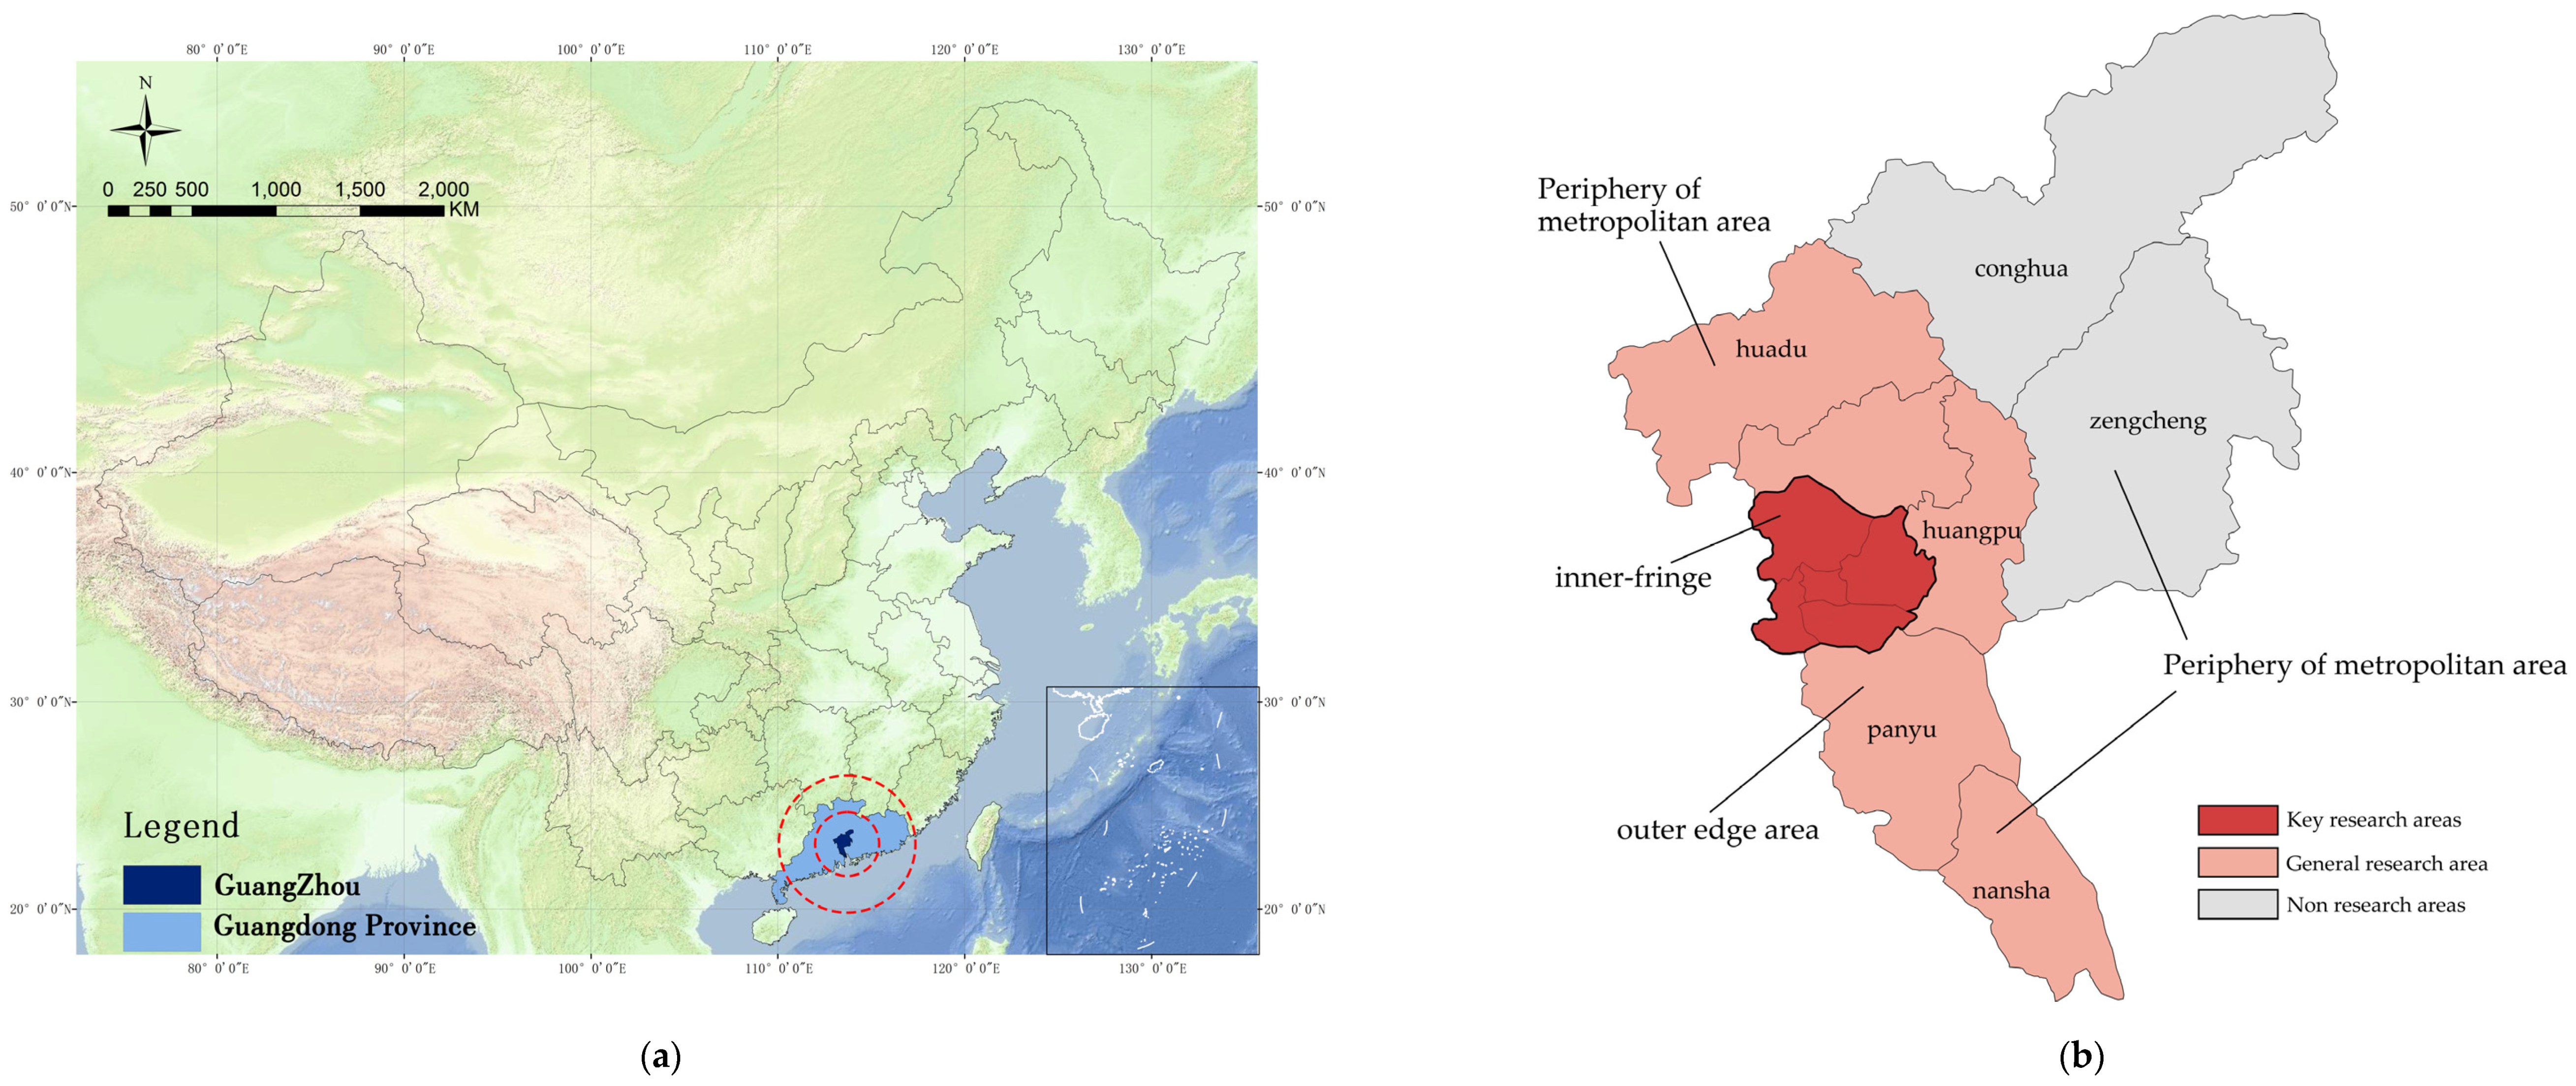
3.1. Study Area

Guangzhou is the capital of Guangdong Province and the central city of South China (Figure 1a). The population of Guangzhou increased from 3.077 million in 1980 to 18.811 million in 2021, an increase of more than six times, with an average annual growth rate of 14.55%. The gross national product (GDP) increased from USD 1679.135 billion in 1980 to USD 438.944 billion in 2021, with an average annual growth rate of 6.21%. With a history of more than 4000 years, Guangzhou is one of the five most developed cities in China, with a mature construction of road system and a large number of high-quality office buildings. In comparison with other cities, Guangzhou, for the business offices and transportation have been developing rapidly for more than 50 years, could serve as a perfect case for research.
Guangzhou spans eleven districts, covering a combined area of 7434  km2. The study area covers an area of 3843  km2. The city could be divided into two areas: the inner fringe and the periphery of the metropolitan area (Figure 1b). As the key research areas in this research, the inner fringe area includes developed districts such as Liwang and Yuexiu District, and developing districts such as Haizhu and Tianhe District, all amounting to 249 km2, are the nucleus of economy, politics, culture, and population. The periphery of the metropolitan area is the downtown diffusion and radiation zone. The general research area, excluding the area of Conghua and Zengcheng District for the absence of relevant data, accounts for almost half of Guangzhou, covering a territory of about 3594 km2.
Referenced to the Chinese Urban Road Design Standard issued by the Ministry of Housing and Urban-Rural Development of the People’s Republic of China in 2016: Code for the Design of Urban Road Engineering [CJJ37-2012], the roads are divided into four grades: expressway, trunk road, secondary trunk road and branch road (Table 1). In consideration that the general scale of office land is over 0.5 hectare (70 × 70 m) [60], the road spacing of the secondary trunk road is only 300 or 500 m that can only be divided into 4–7 parts by 70 m. These numbers (4–7 parts) are too small to find out the influence radius of the road, not to speak of branch roads with less road spacing. Therefore, this paper studies particularly the expressways and trunk Roads but doesn’t involve secondary trunk roads and branch roads. Referenced to the land use Standard issued by the Ministry of Housing and Urban-Rural Development of the People’s Republic of China in 2011: Urban land classification and planning construction land standard (GB50137-2011), the research concentrates on commercial and business facilities (CBF), which includes comprehensive office space for finance, insurance, securities news, publishing, literary and art groups, etc., and that land for public facilities shows great relationship with the urban roads [40,54].

3.2. Data Source

The main sources of our information are the statistics in governmental urban planning and big data in network. The data on the urban road system and the current office land use are subject to the Overall Urban Planning of Guangzhou (2010–2020); all areas of office land are 1342.81 hectares. The traffic flow data come from the traffic industry data sharing and analysis service platform of Guangzhou Transportation Commission. The locations of office buildings and bus lines are obtained by the following process: obtain the name of office buildings by using crawl tools to enter the key website: https://gz.sydc.anjuke.com/xzl-zu/ (accessed on 3 January 2022), and then process and choose the figures, and eventually get a full sample of 1023 commercial office buildings. Then, obtain the fixed latitude and longitude of buildings by applying the coordinate picker tool of Baidu Map API (https://lbsyun.baidu.com/ (accessed on 3 January 2022)). Through the location API interface of the Google Maps platform, the locations of 7711 bus stop locations in Guangzhou were obtained and sorted out, and calculate the density at a distance of 200 m. The statistical caliber of all data is 2020. With respect to the benchmark coordinates, we appeal to the software ArcGIS 10.0 as our analysis basis.

3.3. Research Methods

This research provides an analytical framework and an empirical analysis to study the differences in impacts of different urban roads on land use and to identify its internal dynamic mechanism.

3.3.1. Corridor Effect

Fu Bojie (2001) came up corridor effect to describe the functional relationship between the road and the surrounding land. The effect of corridors is created by the principle in which the central axis stands in the core, and the farther the distance is from the hub, the less charm it maintains. Theoretically, it can be expressed by the logarithmic decay function as follows:
D = F ( e ) = a L n a ± a 2 e 2 e a 2 e 2
Formula (1) The Logarithmic Decay Function of Corridor Distance of Traffic Lines. a = a constant, means the peak intensity of the corridor effect; it will change with different types of roads. e = intensity of the corridor effect; D = distance to the road. The interpretation is as follows: when the distance is extended from D1 to D3, the corridor benefit is reduced from e1 to e3, and it is in the shape of a ribbon from inside out.

3.3.2. Correlation Analysis

The correlation efficiency is a statistical indicator used to reflect the closeness of the correlation between variables. The correlation efficiency is calculated according to the product-difference method, which is also based on the deviation of the two variables and their respective averages, and the degree of correlation between the two variables is reflected by multiplying the two deviations, focusing on the linear single correlation efficient. There are many ways to define correlation efficiency; the most commonly used is the Pearson correlation efficiency. It is the earliest statistical indicator designed by statistician Carl Pearson. It is generally represented by the letter r. It can be expressed as follows:
r = i = 1 n ( X i X ¯ ) ( Y i Y ¯ ) i = 1 n ( X i X ¯ ) 2 i = 1 n ( Y i Y ¯ ) 2
Formula (2) is the Pearson correlation efficiency. r = degree of correlation between two variables; X = independent variable; Y = dependent variable.
The absolute value of the r value is between 0 and 1. Generally speaking, the closer r is to 1, and the two-tailed value is less than 0.05 (excluding chance, passing the test), the stronger the correlation between x and y is. On the contrary, the closer r is to 0, the stronger the correlation between x and y is. The weaker the correlation between the quantities. This paper also uses SPSS17.0 software for correlation analysis.

3.3.3. Geographic Detector

Geographic detector is a set of statistical methods used to detect and study the spatial diversity of dependent variables so as to clarify their causes [61]. This method can detect the interaction of two combined factors on dependent variables at the same time. The identification method of interaction is to add the product term of two factors to the model to test its statistical significance. The Q value of the geographic detector explains the influence degree of the independent variable on the spatial distribution pattern of the dependent variable urban innovation activities. The Q value is between 0 and 1. The greater its value, the greater the impact on the fact on the land agglomeration use, and vice versa. Using the detector, we analyze the relationship between those roads with obvious corridor effect and motor vehicle traffic flow and public transport station density so as to find the influencing factors of corridor effect.

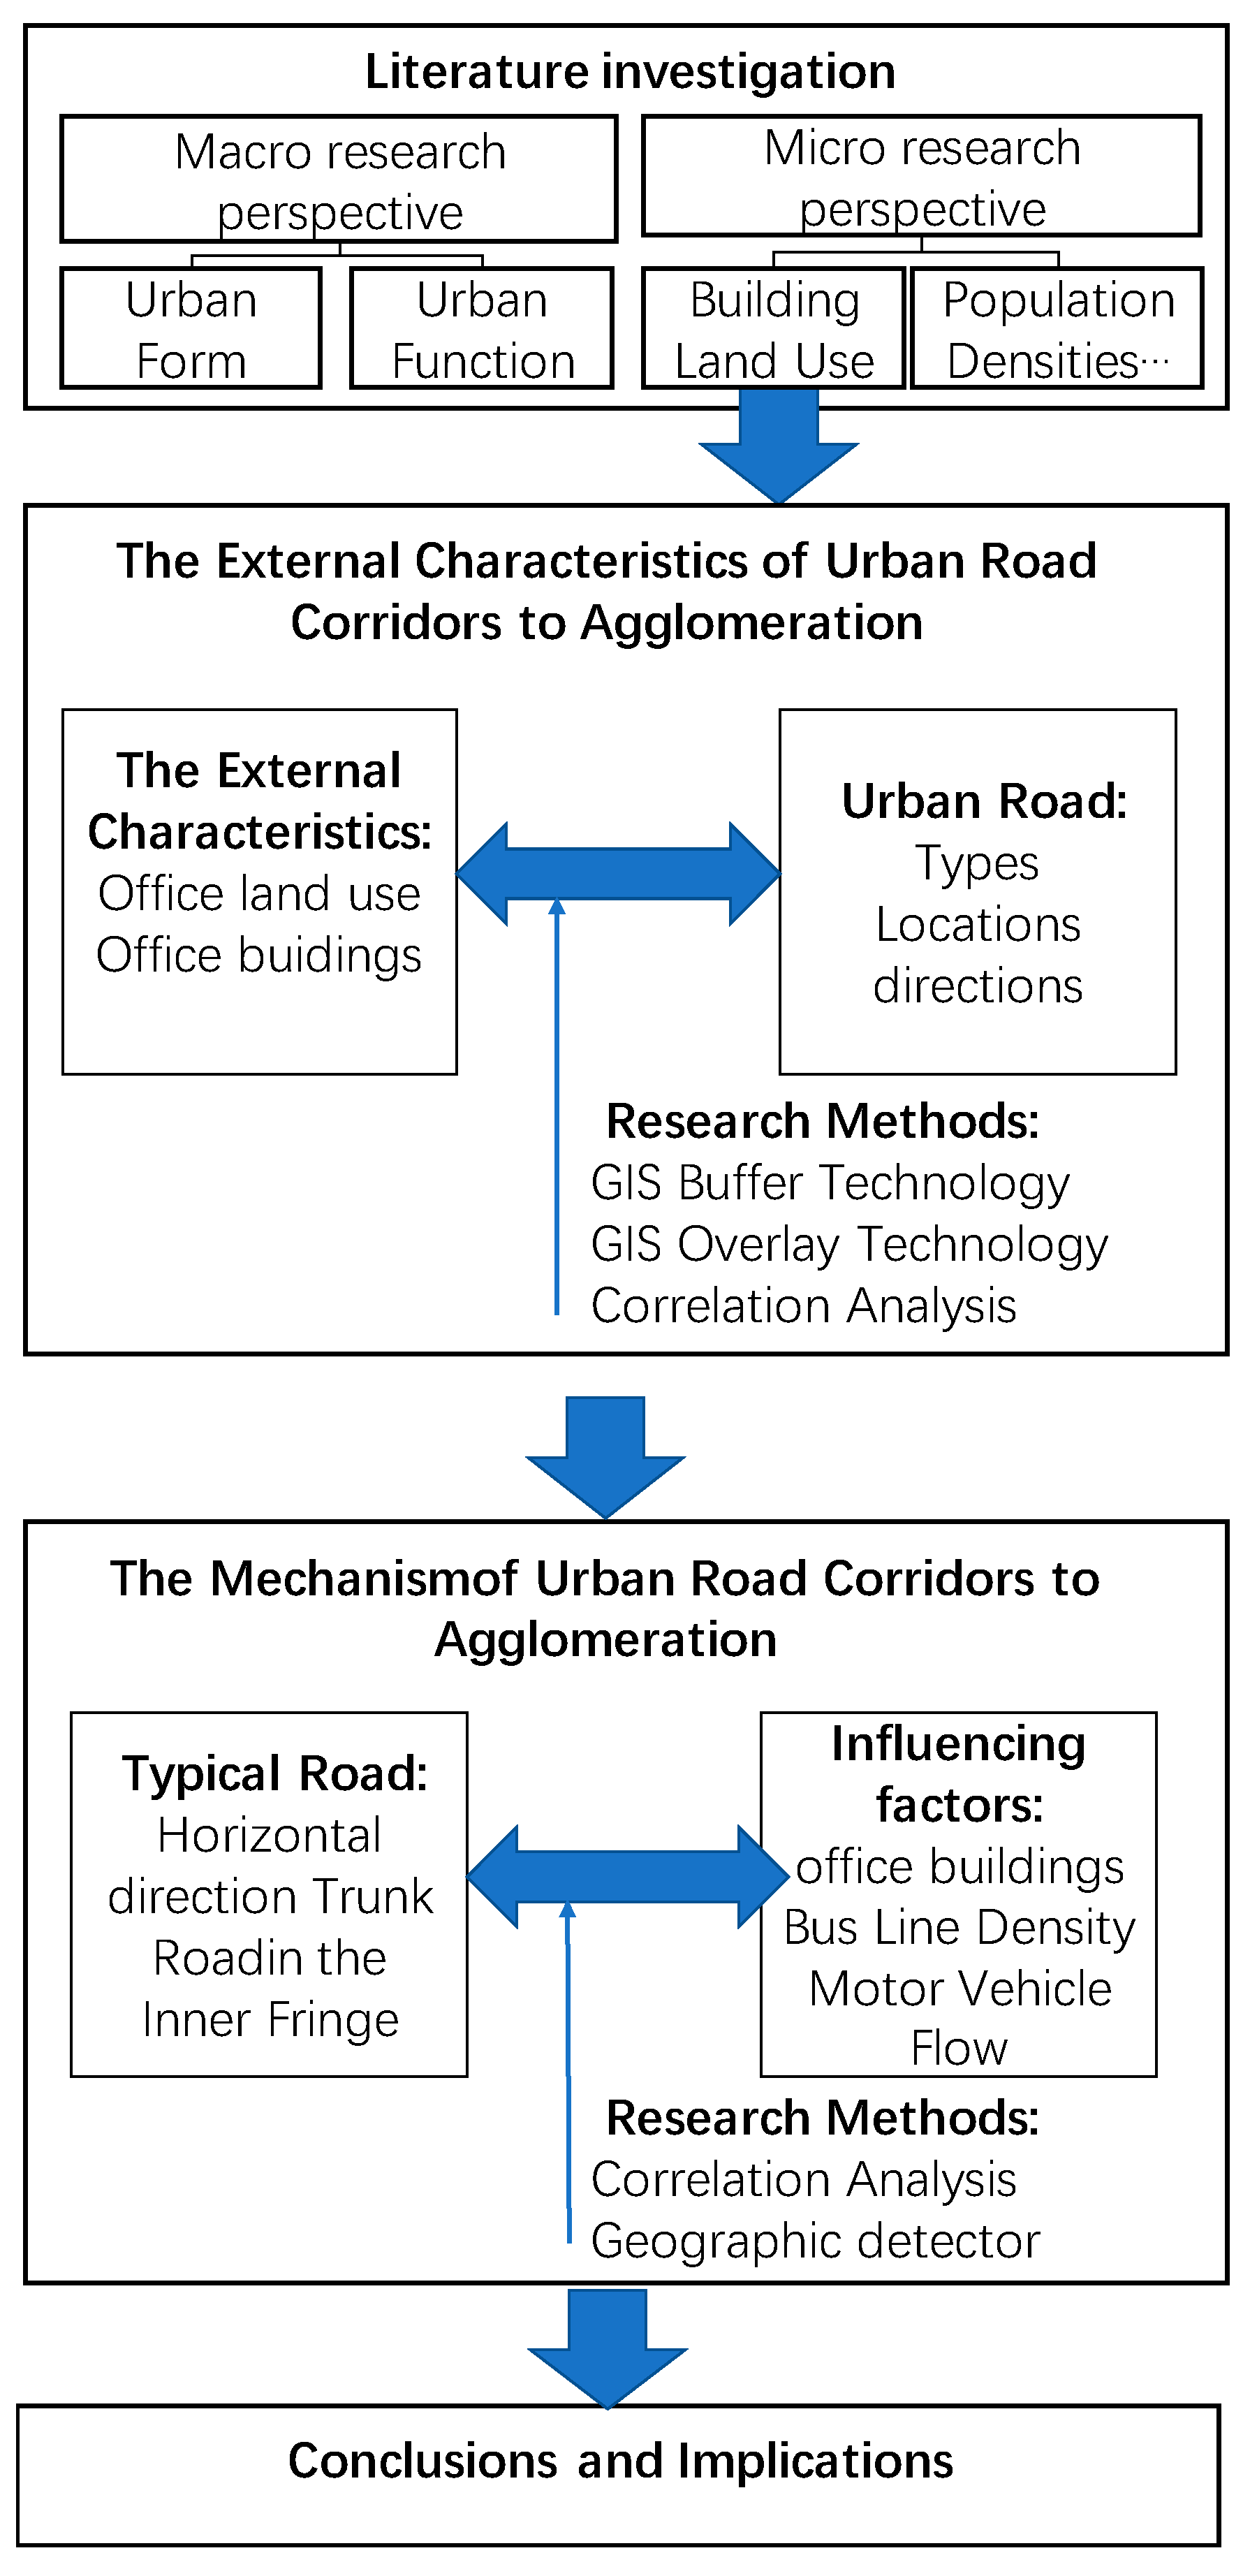
3.4. Research Process

Considering the urgent need to understand the role of urban roads in the period of rapid urbanization, this research focuses on the agglomeration effect of road corridor effects on buildings and land use and adopted the research process (Figure 2). Firstly, we analyze the external characteristics of urban road corridors to agglomeration by (1) consulting road design codes and office building land standards, the coverage of two sides of various highways can be determined. Expressways outside the inner fringe set its borderline within 2000 m around the roads, and the expressways and arterial roads in the inner fringe confine theirs within 1000 m and 500 m around the roads, respectively; (2) using the GIS Buffer Technology (BUFFER) to establish 5–10 corridor impact zones every 100–200 m according to the grades of highways; (3) using GIS Overlay Technology to obtain the quantity of office buildings and land use in impact zones; (4) inspecting whether there is corridor effect on urban roads in different regions, types and directions; (5) analyzing the acquired quantity of those urban roads with noticeable the corridor effect in SPSS 17.0, to obtain peak values for the corridor effect’s intensity, and the characteristics, influential radius and function mechanism of corridors. Then, we discover the mechanism of urban road corridors to agglomeration by exanimate the correlation between bus line density and motor vehicle flow to building gathering and find out the influential factors of corridor effect. Finally, we summarize the mechanisms of the corridor effect of roads in Guangzhou and put forward policy suggestions for future urban construction.

4. Results

4.1. The External Characteristics of Expressway

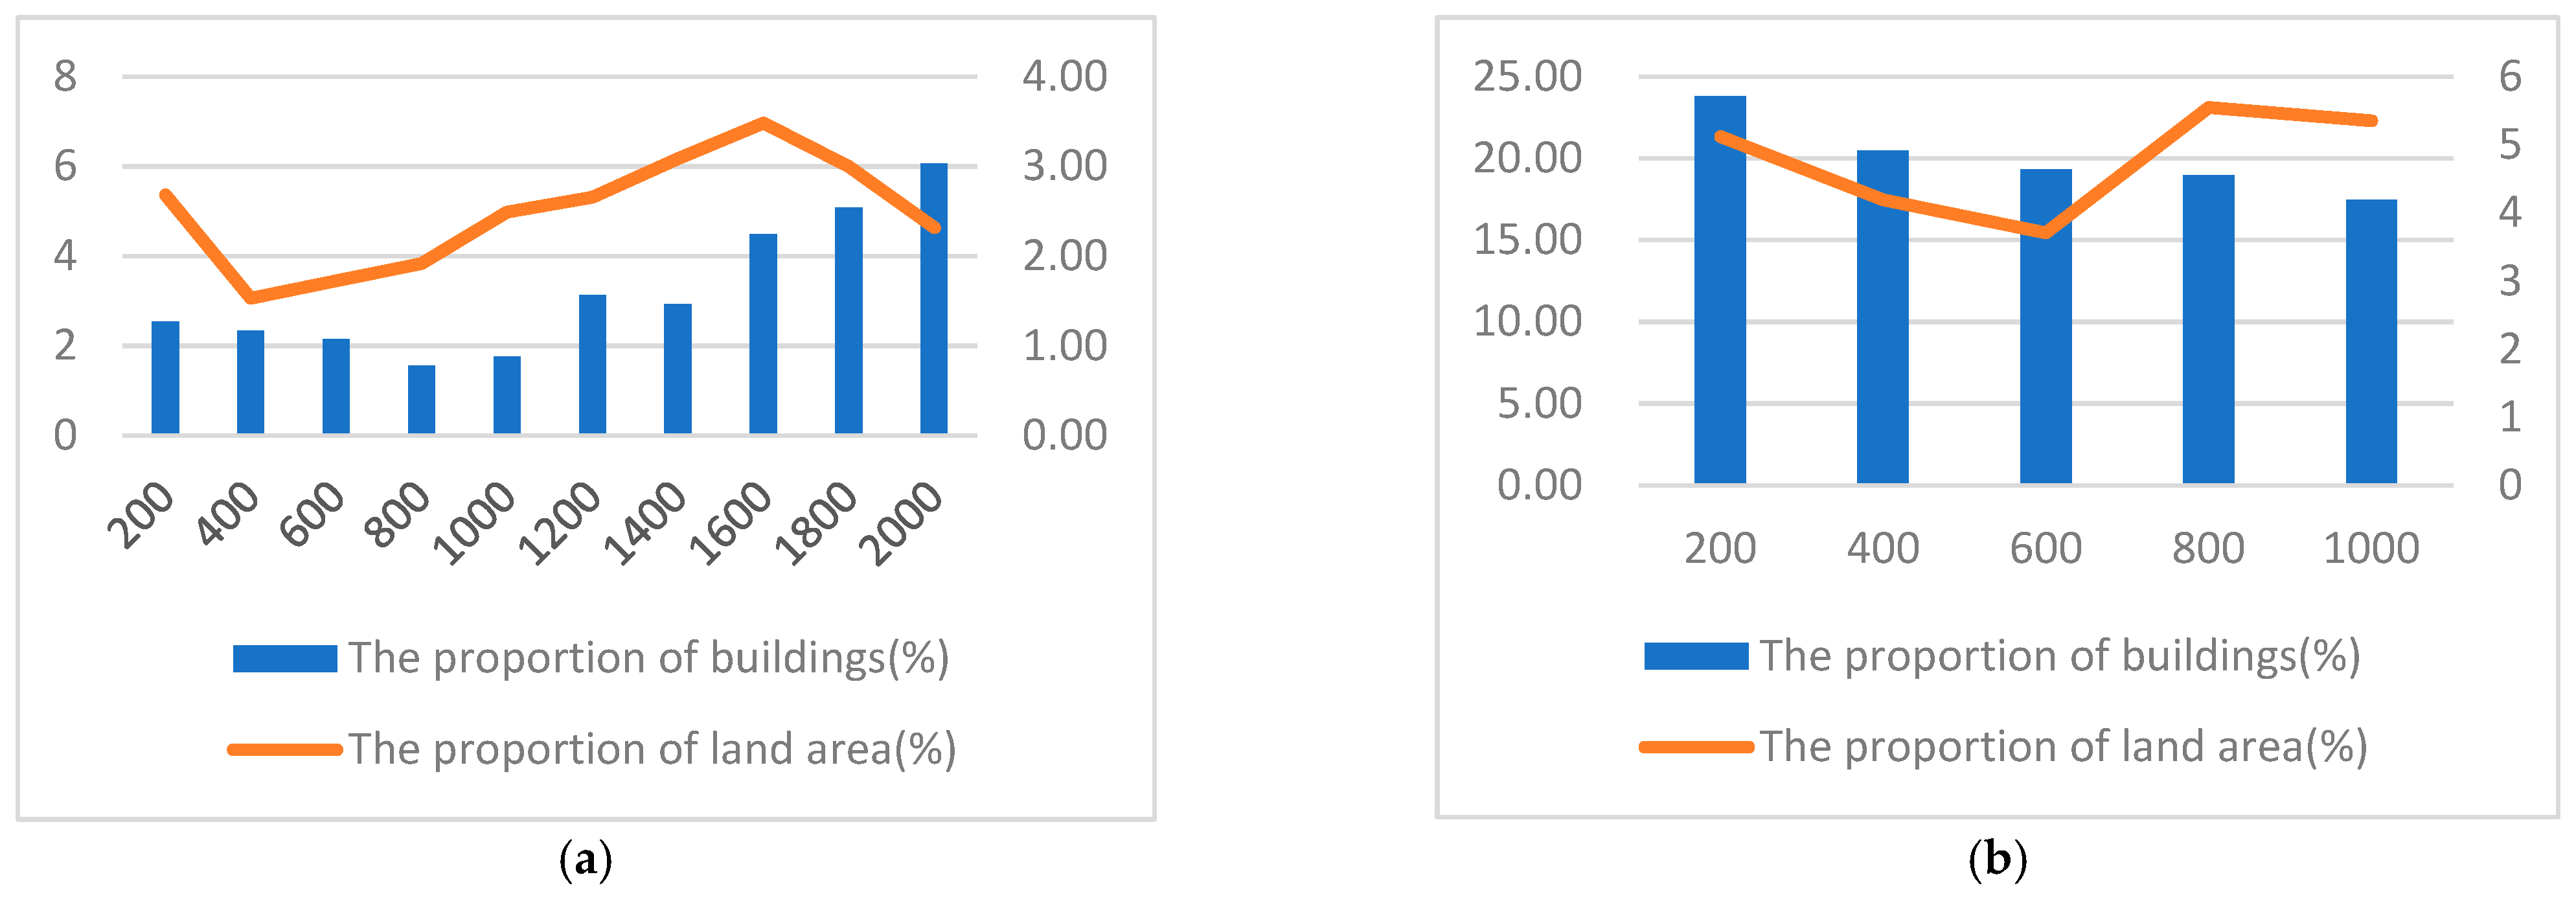
4.1.1. Expressway Outside the Inner-Fringe

Through analyzing the expressways outside the inner side, that is, the ratio of the quantity of office buildings (within our research field of reference 2000 m) on the 15 radiative expressways to the space of office buildings (Figure 3a or Figure 4a), it is found that the external expressways have a rare impact on how the commercial offices are gathered (Table 2). There are 173 office buildings within 2000 m, taking up 16.9%. The largest coverage of office buildings is at 400 m, and then there is a sudden increase when the distance is over 1000 m. The office buildings are evenly distributed when the range is from 400 to 1000 m; the distribution of land used for construction is different from that of office buildings, and the land of administrative offices is regularly strewed (fluctuating slightly between 10% ± 4%); however, it is similar with the land used for buildings. As we can see, the corridor effect is in performance when the purview is within 400 m, and when it reaches 800–1000 m, the effect is at work again, which explains that when the scope is within 400 m, these areas are most attractive to office buildings. Specifically, we can see the gathering areas of small-scale business and office buildings in the entrance and exit of expressways, such as the Baiyun and Panyu Branches affiliated to Wanda Plaza, for the convenience of the expressway and low rents, and after 1000 m, entering the outer area, such as Huadu District, Panyu City Bridge and other cardinal areas, the number of commercial offices gradually rises with the increasing of population, especially at 2000 m, the percentage of land using is about 9% and the amount of buildings soars to nearly 3.03%, more than 30 buildings, compared with the situation at 200 m in which 10% of the developed land has only 2.15% of office buildings, it is 60% higher than the latter, denoting that the corridor effect of expressways do not decrease with the distance expanding, but rather it presents a kind of reverse corridor effect, and the reverse linear function relationship (between 1000 and 2000 m): f(e) = 11.505 ln(x) + 7.3842 (x is the distance, f(e) is the number of buildings) and correlation coefficient R2 is 0.886, which signifies that they are strictly related.
Note: the number of left vertical axes in Figure 4 is the proportion of buildings, and the number of right vertical axes in Figure 4 is the proportion of the land area. The number of horizontal axes represents the corridor effect with different distances far from the urban road. For example, 200 represents the corridor effect from 0 m to 200 m away from the road, 400 represents the corridor effect from 200 m to 400 m away from the road, and so on.
Note: In order to make the data comparable, all percentages are calculated based on the total number. The percentage of buildings is based on all 1023 office buildings. Therefore, the total percentage of buildings is not 100%, but 16.91%. Similarly, the percentage of the land area is calculated according to the total area of 1342.81 hectares, and the total percentage of the land area is almost 50%.
Note: In order to make the data comparable, all percentages are calculated based on the total number. The percentage of buildings is based on all 1023 office buildings. Therefore, the total percentage of buildings is up to 52.59%. Similarly, the percentage of the land area is calculated according to the total area of 1342.81 hectares, and the total percentage of the land area is only 23.92%.

4.1.2. Expressways in the Inner Fringe

Expressways of the inner fringe in Guangzhou encompass the Inner Ring Expressway, the Circular Expressway, the South-China Express Truck Line, and the North Second Ring Expressway. Eight fast contact lines are Zengcha Road, Guangyuan West Road, Yongfu Road, and so on (Figure 3b). The marginal inviting ambit of expressways to the office buildings in the inner fringe is 800 m (Table 3), which is four times higher than that of the 200 m of the 15 external expressways (Compare a and b in Figure 4), pointing out that the corridor effect of expressways is pellucid in the inner fringe, and its corridor effect formula is f(e) = −19.77 ln(x) + 126.53 and correlation coefficient R2 is 0.970, which betokens that they connect tightly with each other. Allocated by the government, located in the middle, and related scarcely to the rapid roads, a large number of provincial and municipal administrative offices are scattered evenly and do not reveal a crystal-clear corridor effect. In addition, in comparison with the situation of land used in the inner fringe and that outside the inner fringe, it uncovers that there is no such unambiguous difference in the assembling of office buildings (the percentage of land usage in the inner part of urban fringe is 23%), and the number of construction buildings differs from each other (the percentage of office buildings in the inner fringe is 79%), which suggests that the land lease is relatively non-intensive in the peripheral area in which may exist the phenomenon of land waste.

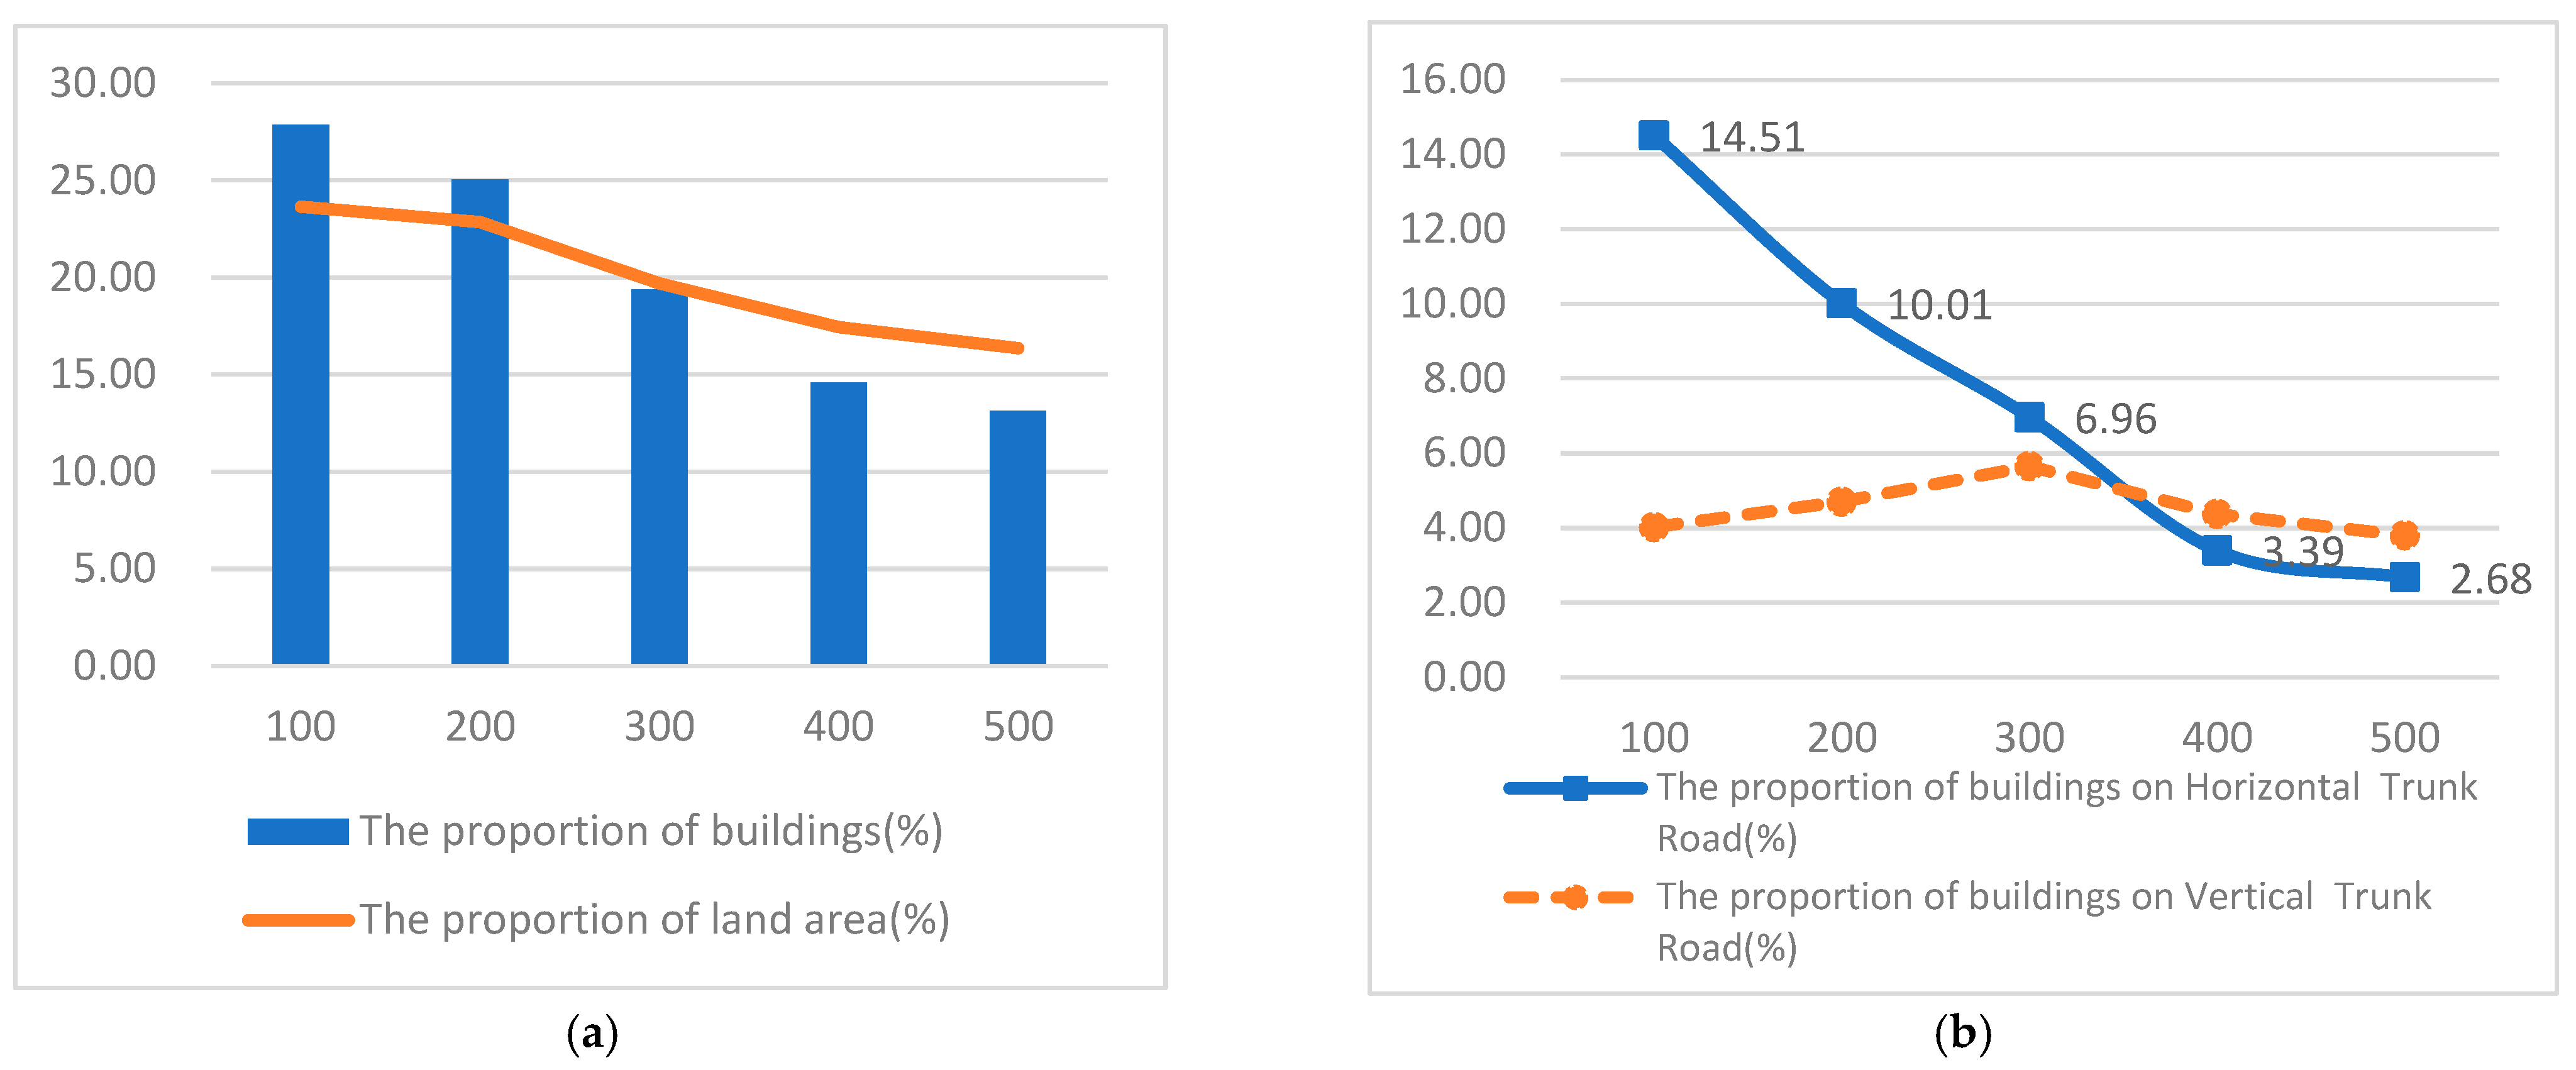
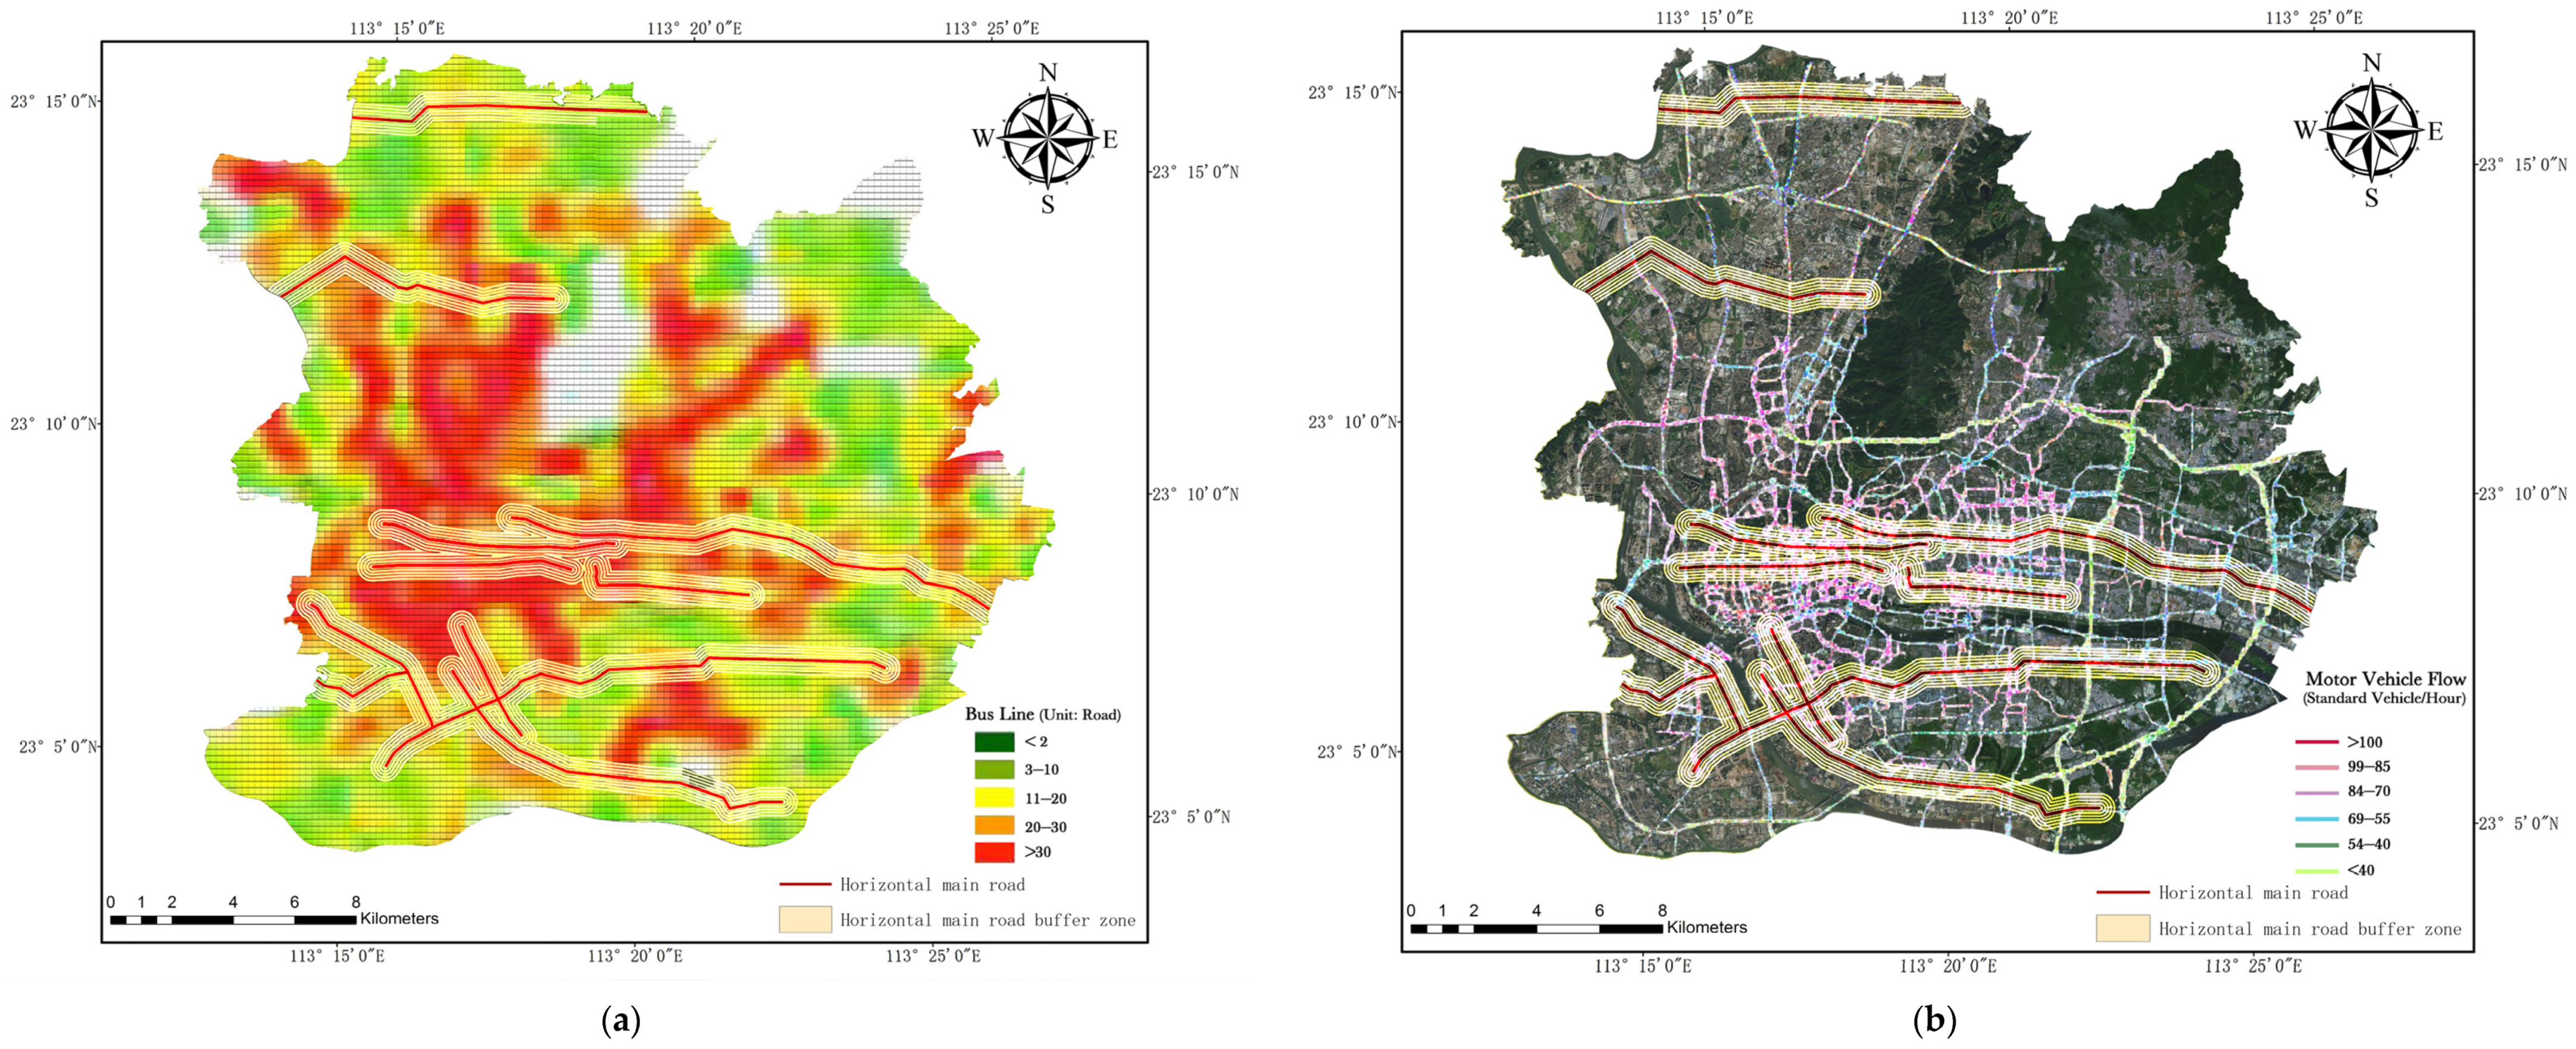
4.2. The External Characteristics of Trunk Road

4.2.1. Trunk Roads in the Inner-Fringe

The trunk roads in the inner fringe of Guangzhou are the leading bridges to other lines of the city center, and the “sixteen horizontally directed roads” (Figure 5a) and “sixteen vertically directed roads” (Figure 5b) form a grid layout, which is an effective complement to the expressways in a ring shape. Compared with the expressways in the inner fringe, the number of buildings on two sides of the trunk roads (Table 4) is almost four times the former, which shows a glassy corridor effect (Figure 6a), and the formula of corridor effect of architectural aggregation is f(e) = −9.737 ln(x) + 29.323, in which R2 is 0.936. Although the corridor effect is the strongest, the correlation coefficient is lower than that of the expressways of the inner fringe, and through further analysis, it implies that the discrepancy is caused by various road patterns, which can be summarized in two directions: vertical and horizontal directions. In terms of land use, the area of land on both sides of trunk roads varies gently with the changing of distance, and the corridor effect is not recognizable, which also signifies that when the government is making land using plans without considering the corridor effect.
Note: the number of left axes in Figure 6a,b is the proportion of buildings or land area. The number of the horizontal axis represents the corridor effect with different distances far from the urban road.

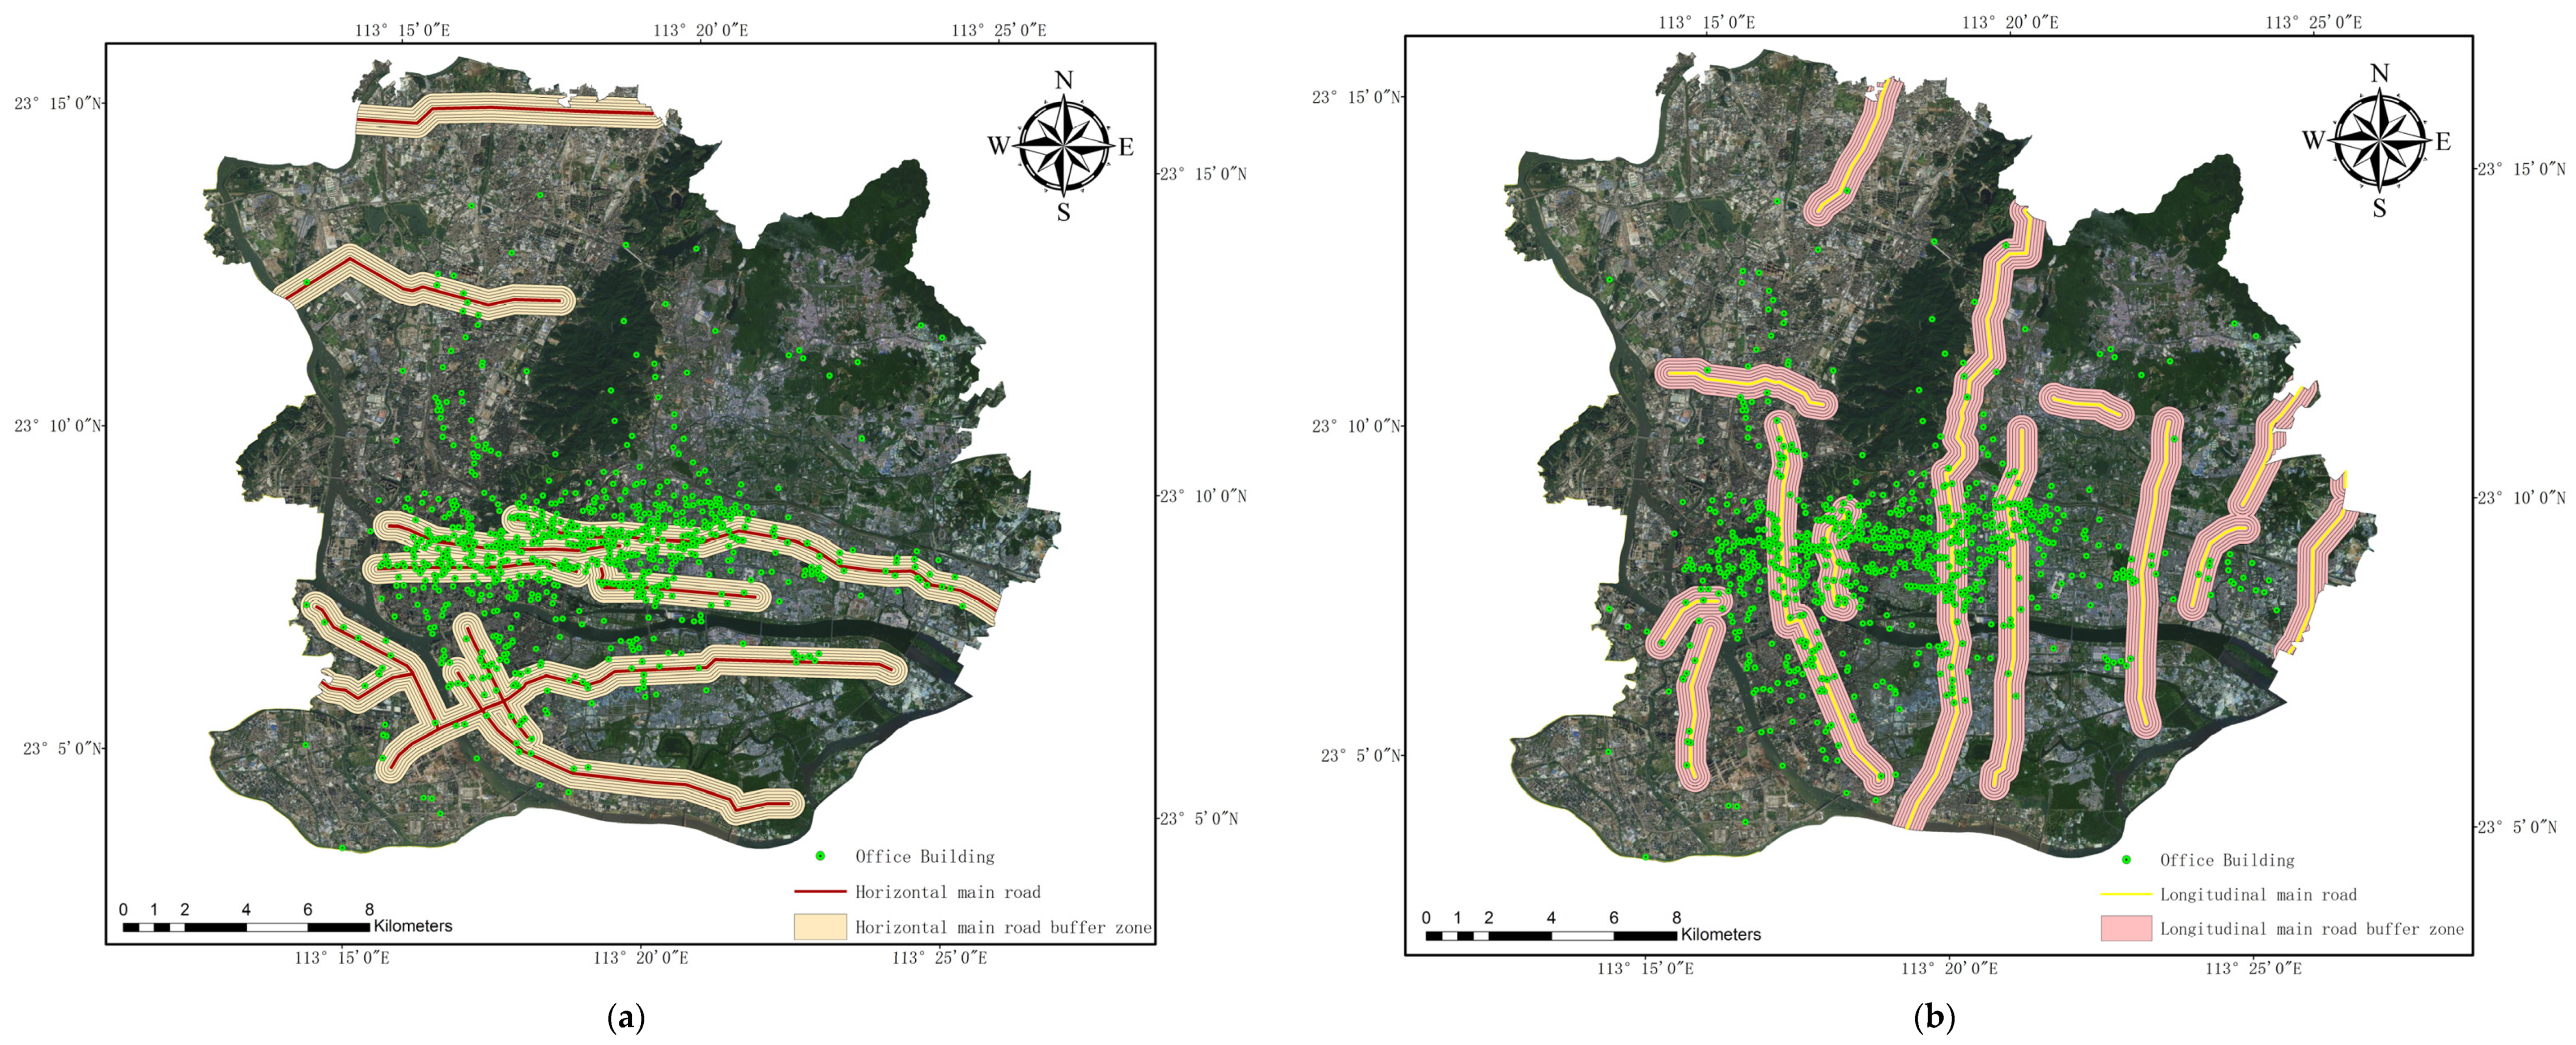
4.2.2. Trunk Roads with Different Directions

Finding out whether there is an association between the corridor effect and the structure of a city, we further explore trunk roads with conspicuous corridor effect according to their vertically and horizontally directions (Figure 5). Through the buffer analysis of GIS, it can be seen that the trunk roads (both vertically and horizontally extended) differ saliently (Figure 6b): the corridor effect on office buildings on two sides of the horizontally extended trunk roads is striking. The quantity of office buildings accounts for about 23.21% within 100 m. When it is 500 m adjacent to the roads, the percentage of them drops rapidly to 4.28%. Therefore, the attractive verges of the trunk road are 500 m, and its corridor effect formula is f(e) = −12.24 ln(x) + 23.732, and correlation coefficient R2 is 0.986, which indicates they are greatly relevant. The buildings on vertically extended trunk roads are distributed horizontally and flatly. The total number of office buildings (100 m near the road) only occupies about 8% of the total offices and does not show the peak effect of the corridor effect. Juxtaposing the impact of 16 vertically directed (north–south roads) and horizontally directed (east–west roads) trunk roads on the area of commercial offices, we can catch sight of the fact that the influence of the latter on office buildings is noticeably stronger than that of the former, pointing out that the corridor effect is synchronized with the conformation of urban development, and that the vertically oriented trunk roads have no detectable statistical characteristics (but this does not exclude some part of this kind of roads show perceivable corridor effect). Finally, the Formula 1 of the corridor effect is real. Being a constant, the a value can be −342 in the inner fringe of Guangzhou, the e value is 8.37–10.90, and the influence range of corridor effect ≤ 500 m.

4.3. The Mechanism of Urban Road Corridors

According to the 2020 Guangzhou transportation development annual report designated by Guangzhou transportation planning and Research Institute and the traveling of people in Guangzhou in 2006, the proportion of public motorized transport (29.6%) was 10% higher than that of private motorized transport (20%) in 2006. Almost 15 years late, with the expansion in automobile expenditure, by 2020, the percentage of private motorized transport tripled, up to 59%, and public transport has dropped by half, to only 14.3%. There is a distinctness between public and automobile transport, and assorted ways of traveling may shake the position of a corridor to some extent, so it is essential to ascertain the principal influential factors so as to resolve the dynamic mechanism of the corridor effect. According to previous studies, we use the bus distribution density to represent the public traffic (Figure 7a) and the traffic flow during the working period to represent the car traffic (Figure 7b). Choosing the horizontally directed trunk roads with the most explicit corridor effect in the inner fringe as research object (Table 5), we study the interrelation between the number of motor vehicles and bus network density by correlation analysis and geographic detector. The former analyzes the relationship between values, and the latter further examines whether there is also a relationship in space.
By means of correlation analysis (Table 6) on horizontal trunk roads, based on 95% credibility, and scrutinizing the “testing critical (rα) table of correlation coefficient ρ = 0”, we can attain r0.05 (11) = 0.553, and from correlation analysis table of the bus network density and office buildings, we find that the correlation coefficient is 0.37, which is below the standard above, suggesting that there is not any connection between the number of bus network density and that of office buildings. When we change the numbers to t = 2.11, p = 0.057, again we espy the same result. Therefore, it can be concluded that the number of office buildings around the roads is a little lumped together with bus network density. we can see that the correlation coefficient between the office buildings and the rolling of motor vehicles is 0.81, more than twice that of bus network density. Therefore, we could conclude that the internal factor affecting the corridor effect relies on the flowing of motor vehicles.
The main purpose of risk factor detection of the geographic detector is to judge whether there is a significant difference in the independent variable x in order to observe the spatial correlation of the independent variable x to the dependent variable y. Its value is represented by q. From Table 7, it can be seen that the q value of the bus network density is 0.2294, and it is at a low confidence level of 0.6049, while the interpretability of the traffic flow reaches 0.7448, and the confidence level is lower than 0.05. That shows that there is a correlation between the traffic flow and the corridor effect, while the bus network density is the opposite.
The interaction detection (Table 8) of the geographic detector is to identify the interaction between risk factors that can evaluate whether one or multiple independent variables are more important. From Table 8, it can be seen that the joint action value of the two is only 0.2273, which is lower than the independent action of the two facts. It shows that the interaction effect of and traffic flow on the corridor effect is lower than that of a single variable.

5. Conclusions and Implications

From this study, we can heed that the agglomeration effects of urban roads on buildings and land use show diversity. The correlation between land use and buildings in each buffer zone of the expressway is not obvious, especially outside the inner fringe, which reveals that the distribution of government-led land does not reflect market demand in this district. However, this situation is reversed in the inner fringe. For example, whether it is an expressway or a trunk road, the agglomeration of land and buildings shows a certain correlation. We can think that in the downtown, both land and buildings, can reflect the market demand and follow the corridor effect of urban roads, while not obvious in the outer areas of the city.
Secondly, as for architectural aggregation, the corridor effect on different locations and types of roads varies. There is no statistically significant corridor effect on the expressways within 1000 m, but there is an obvious reverse corridor effect from 1000 m to 2000 m outside the inner fringe. The corridor effect of the expressway road in the inner fringe can be observed, but it’s not so obvious compared to the trunk road. The total number of buildings gathered on both sides of the trunk road reached 534 within 400 m in the inner-fringe area, more than double that of the expressway. The corridor effect of the expressway is the weakest. The influential radius of the expressway road in the inner fringe is about 800 m, while that of the trunk roads is only half of the rapid roads, about 500 m. We can summarize the corridor effect of the trunk road as the most obvious, but the effect radius is the smallest; the expressway in the downtown has the corridor effect, and the effect radius is larger than that of the trunks road; the expressway outside the inner fringe has the reverse corridor effect, and the effect radius is the largest.
Finally, the corridor effect of different directions of roads exhibits diverse effects. The effect on horizontal direction trunk road (east–west direction) is obvious, while that on vertical direction trunk road (south–north direction) is non-existent. Since Guangzhou is blocked by the river (Pearl River) in the east–west direction, the city has been developing in an east–west direction. Even today, when the traffic is easily accessible, it only pays greater attention to the development of Guangzhou Avenue, Industrial Avenue, and other local main south–north roads. So, the geography of a city may cause corridors to have a natural shielding effect and may breed some historical inertia. The specific effect and formula of the corridor effect are proposed in the result chapter, and the scope of influence and effect can be summarized as follows (Table 9).
The study explains that the corridor effect is mainly affected by car traffic by analyzing the spatial correlation of the data such as the number of buildings agglomeration, bus network density, and traffic flow on the horizontal trunk road, where the corridor effect is the most obvious. In order to better promote the corridor effect, the government should make the following improvements: on the one hand, we can use the characteristics found in this study to adjust the trunk roads’ structure and orientation to improve the commercial office space layout; on the other hand, we should use corridor effect to adjust the development intensity base on the further study of periphery areas of the expressway and both sides of urban main roads, in order to avoid using equal methods of land plot control on different roads.
The corridor effect promotes the concentration of vehicle flow in urban traffic, which is conducive to leaving space for walking activities. However, excessive concentration of vehicle flow can easily cause road congestion. Therefore, the improvements in urban traffic are listed as follows. Firstly, it is necessary to strengthen the optimization of main traffic corridors to reduce the probability of congestion at intersections and improve the passing efficiency by reducing the number of intersections or setting up three-dimensional traffic lines. Secondly, traffic conversion facilities such as parking garages can be arranged on both sides of the corridor to reduce the traffic pressure, while walking, cycling, and other means of transportation can be used to solve the traffic within the range of 500–800 m on both sides of the road. Thirdly, we should strengthen the attraction of public transport. According to the flow and direction of private transport, we should adjust the route of public transport in time, optimize the setting of parking stations to shorten the traffic time, and set up feeder routes such as minibuses, so as to reduce the frequency of public transport conversion and facilitate office travel.
The authors acknowledge the fact that the research exhibits certain limitations, such as not studying building area, which may lead to statistical data not fully reflecting the difference between high-rise and low-rise buildings, resulting in the accuracy of corridor effect models, and this study focuses primarily on the gathering of office buildings and land. In the future, by comparing the distance between roads, the convenience of transportation, and the scale of building development, we can find the internal causes of the corridor effect influence radius, and we can study the dynamic generation process and internal mechanism of the corridor effect through the correlation between building aggregation and traffic flow in 10 or 20 years. We can also expand research on other buildings and land, such as commercial, residential, and industrial ones, to establish complete research on the mechanism of the corridor effect. In addition, due to different land management policies in various countries, it may also lead to differences in corridor effects, which need to be further studied.

Author Contributions

Conceptualization, L.Q. and M.P. Methodology, L.Q., Y.L. and Y.C.; Investigation, Calculation and and analysis of data; L.Q. and M.P.; Writing—original draft preparation, L.Q. and M.P.; Writing—review and editing, L.Q., L.J., Y.L. and M.P. All authors have read and agreed to the published version of the manuscript.

Funding

This research was supported by the Natural Science Foundation of Guangdong province “supported by the Characteristic of Productive Service Industry and Ecological Gathering of Enterprises in Major Cities of Guangzhou and Foshan” (2016A030313557), National Natural Science Foundation of China (51968042). Geospatial information and smart ecological environment cross innovation platform of Guangzhou University (evaluation, regulation, and simulation evaluation of ecological landscape and resources, PT252022023).

Institutional Review Board Statement

Not applicable.

Informed Consent Statement

Not applicable.

Data Availability Statement

All data of this study are contained within the article.

Conflicts of Interest

The authors declare no conflict of interest.

References

  1. Dramstad, W.E.; Olson, J.D.; Forman, R.T. Landscape Ecology Principles in Landscape Architecture and Land-Use Planning; Harvard University Graduate School of Design Island Press: Cambridge, MA, USA, 1996. [Google Scholar]
  2. Saunders, S.C.; Mislivets, M.R.; Chen, J.; Cleland, D.T. Effects of roads on landscape structure within nested ecological units of the Northern Great Lakes Region, USA. Biol. Conserv. 2002, 103, 209–225. [Google Scholar] [CrossRef]
  3. Yao, Z.; Ye, K.; Xiao, L.; Wang, X. Radiation Effect of Urban Agglomeration’s Transportation Network: Evidence from Chengdu–Chongqing Urban Agglomeration, China. Land 2021, 10, 520. [Google Scholar] [CrossRef]
  4. Yi, Y.; Zhang, C.; Zhang, G.; Xing, L.; Zhong, Q.; Liu, J.; Lin, Y.; Zheng, X.; Yang, N.; Sun, H.; et al. Effects of Urbanization on Landscape Patterns in the Middle Reaches of the Yangtze River Region. Land 2021, 10, 1025. [Google Scholar] [CrossRef]
  5. Pang, Q.; Zhou, W.; Zhao, T.; Zhang, L. Impact of Urbanization and Industrial Structure on Carbon Emissions: Evidence from Huaihe River Eco-Economic Zone. Land 2021, 10, 1130. [Google Scholar] [CrossRef]
  6. Chu, M.; Lu, J.; Sun, D. Influence of Urban Agglomeration Expansion on Fragmentation of Green Space: A Case Study of Beijing-Tianjin-Hebei Urban Agglomeration. Land 2022, 11, 275. [Google Scholar] [CrossRef]
  7. Zhao, G.; Zheng, X.; Yuan, Z.; Zhang, L. Spatial and temporal characteristics of road networks and urban expansion. Land 2017, 6, 30. [Google Scholar] [CrossRef] [Green Version]
  8. Gu, Y.R.; Li, M.; Zheng, L.; Huang, H. Backwash-Spread Effects of Transportation Corridors on the Development of City Groups. J. Urban Plan. Dev. 2018, 144, 04018028. [Google Scholar] [CrossRef]
  9. Ding, Y.; Zhang, L. The Impact of High-speed Railways on Urban Development in the Great Pearl River Delta of China. In Proceedings of the 2018 Asia-Pacific Conference on Intelligent Medical (Apcim)/2018 7th International Conference on Transportation and Traffic Engineering (Ictte 2018), Beijing, China, 21–23 December 2018; pp. 20–26. [Google Scholar]
  10. Surya, B.; Salim, A.; Hernita, H.; Suriani, S.; Menne, F.; Rasyidi, E.S. Land use change, urban agglomeration, and urban sprawl: A sustainable development perspective of Makassar City, Indonesia. Land 2021, 10, 556. [Google Scholar] [CrossRef]
  11. Kruszyna, M.; Śleszyński, P.; Rychlewski, J. Dependencies between demographic urbanization and the agglomeration road traffic volumes: Evidence from Poland. Land 2021, 10, 47. [Google Scholar] [CrossRef]
  12. Wang, Z.; Li, J.; Liang, L. Identifying the scope of the Lhasa Metropolitan Area based on a spatial field energy model. J. Geogr. Sci. 2021, 31, 245–264. [Google Scholar] [CrossRef]
  13. Guirao, B.; Campa, J.L. The effects of tourism on HSR: Spanish empirical evidence derived from a multi-criteria corridor selection methodology. J. Transp. Geogr. 2015, 47, 37–46. [Google Scholar]
  14. Gingerich, K.; Maoh, H.; Anderson, W. Choice of Land Use Development Type within Commercial and Industrial Zoning. J. Urban Plan. Dev. 2015, 141, 2. [Google Scholar] [CrossRef]
  15. Duan, D.; Du, D.; Liu, C.; Grimes, S. Spatio-temporal evolution of urban innovation structure based on zip code geodatabase: An empirical study from Shanghai and Beijing. J. Geogr. Sci. 2016, 26, 1707–1724. [Google Scholar] [CrossRef] [Green Version]
  16. Zhou, L.; Tian, L.; Cao, Y.; Yang, L. Industrial land supply at different technological intensities and its contribution to economic growth in China: A case study of the Beijing-Tianjin-Hebei region. Land Use Policy 2021, 101, 105087. [Google Scholar] [CrossRef]
  17. Zhang, X.; Hu, Z.; Ye, X. Research on the Influential Range of the Benefits of Urban Rail Transit Development. J. Tongji Univ. (Nat. Sci.) 2005, 8, 1118–1121. [Google Scholar]
  18. Dur, F.; Yigitcanlar, T. Assessing land-use and transport integration via a spatial composite indexing model. Int. J. Environ. Sci. Technol. 2015, 12, 803–816. [Google Scholar]
  19. Peng, Y.T.; Li, Z.C.; Choi, K. Transit-oriented development in an urban rail transportation corridor. Transp. Res. Part B-Methodol. 2017, 103, 269–290. [Google Scholar] [CrossRef]
  20. Song, J.; Chen, F.; Wu, Q.; Liu, W.; Xue, F.; Du, K. Optimization of passenger transportation corridor mode supply structure in regional comprehensive transport considering economic equilibrium. Sustainability 2019, 11, 1172. [Google Scholar] [CrossRef] [Green Version]
  21. Liu, Y.; Li, H.; Gao, P.; Zhong, C. Monitoring the Detailed Dynamics of Regional Thermal Environment in a Developing Urban Agglomeration. Sensors 2020, 20, 1197. [Google Scholar] [CrossRef] [Green Version]
  22. John, B. Mass transportation, apartment rent and property values. J. Real Estate Res. 1996, 12, 1–8. [Google Scholar] [CrossRef]
  23. Kim, J.; Zhang, M. Determining transit’s impact on Seoul commercial land values: An application of spatial econometrics. Int. Real Estate Rev. 2005, 8, 1–26. [Google Scholar] [CrossRef]
  24. Debrezion, G.; Pels, E.; Rietveld, P. The impact of railway stations on residential and commercial property value: A meta-analysis. J. Real Estate Financ. Econ. 2007, 35, 161–180. [Google Scholar] [CrossRef] [Green Version]
  25. Ko, K.; Cao, X. Impacts of the Hiawatha Light Rail Line on Commercial and Industrial Property Values in Minneapolis; Center for Transportation Studies: Minneapolis, MN, USA, 2010. [Google Scholar]
  26. Gu, Y.; Zhen, S. Impact of Rail Transit on the Intensity of Residential Prices and Land Development—Take Beijing Line 13 as an Example. Acta Geogr. Sin. 2010, 65, 213–223. [Google Scholar]
  27. Li, Z.; Jin, X. The Difference of Commercial Land Use on Strips along Commuting Direction of some Main Arterial Roads in Seoul. J. Korea Plan. Assoc. 2011, 46, 91–104. [Google Scholar]
  28. Li, B.; Cao, X.; Xu, J.; Wang, W.; Ouyang, S.; Liu, D. Spatial–Temporal Pattern and Influence Factors of Land Used for Transportation at the County Level since the Implementation of the Reform and Opening-Up Policy in China. Land 2021, 10, 833. [Google Scholar] [CrossRef]
  29. Alonso, W. Location and Land Use: Toward a General Theory of Land Rent; Harvard University Press: Cambridge, MA, USA, 1954. [Google Scholar]
  30. Smersh, G.T.; Smith, M.T. Accessibility changes and urban house price appreciation: Constrained optimization approach to determining distance effects. J. Hous. Econ. 2000, 9, 187–196. [Google Scholar] [CrossRef]
  31. Knaap, G.J.; Ding, C.; Hopkins, L.D. Do plans matter? The effects of light rail plans on land values in station areas. J. Plan. Educ. Res. 2001, 21, 32–39. [Google Scholar] [CrossRef]
  32. Perk, V.A.; Catala, M.; Reader, S. Land Use Impacts of BUS rapid Transit: Phase II—Effects of BRT Station Proximity on Property Values along the Boston Silver Line Washington Street Corridor (No. FTA Report No. 0022); United States Federal Transit Administration: Washington, DC, USA, 2012.
  33. Song, M.J. Research on the Impact on Surrounding Residential Price of Qingdao Subway Line M3 Based on Hedonic. Master’s Thesis, Qingdao University of Technology, Qingdao, China, 2015. (In Chinese). [Google Scholar]
  34. Im, J.; Hong, S.H. Impact of a new subway line on housing values in Daegu, Korea: Distance from existing lines. Urban Stud. 2018, 55, 3318–3335. [Google Scholar] [CrossRef]
  35. Ma, C.; Zhang, Q.; Yang, R. Research on the Influence Range of Rail Transit on Residential Prices Based on GIS and Accessibility Theory. Sci. Technol. Manag. Land Resour. 2018, 35, 74–85. [Google Scholar]
  36. Colaço, R.; de Abreu e Silva, J. Commercial Classification and Location Modelling: Integrating Different Perspectives on Commercial Location and Structure. Land 2021, 10, 567. [Google Scholar] [CrossRef]
  37. Garang, Z.; Wu, C.; Li, G.; Zhuo, Y.; Xu, Z. Spatio-Temporal Non-Stationarity and Its Influencing Factors of Commercial Land Price: A Case Study of Hangzhou, China. Land 2021, 10, 317. [Google Scholar] [CrossRef]
  38. Wang, X.; Xu, J.; Li, Y. Study on the development of Rail Tranit and Land compound use Based on GIS, a case study of Nanjing city. Urban Dev. Stud. 2005, 7, 53–56+62. (In Chinese) [Google Scholar]
  39. Dou, Z. A study on the pan corridor effect of Shenzhen Bay Port. Spec. Econ. Zone 2007, 07, 13–14. (In Chinese) [Google Scholar]
  40. Ma, Z.; Li, C.; Zhang, J. Transportation and Land Use Change: Comparison of Intracity Transport Routes in Changchun, China. J. Urban Plan. Dev. 2018, 144, 05018015. [Google Scholar] [CrossRef]
  41. Pang, M.; Chen, C.; Ma, L. Bilevel Mixed Land Use–Transportation Model Based on Urban Road Network Balance. J. Urban Plan. Dev. 2021, 147, 04021048. [Google Scholar]
  42. Li, J.L.; Wachs, M. The effects of federal transit subsidy policy on investment decisions: The case of San Francisco’s Geary Corridor. Transportation 2004, 31, 43–67. [Google Scholar]
  43. Buchari, E.; Putranto DD, A.; Saleh, E. The analysis of land use weights on road traces selection. MATEC Web Conf. EDP Sci. 2018, 195, 04018. [Google Scholar]
  44. Cevero, R. Mixed Land Use and Commuting: Evidence from the American Housing Survey. Transp. Res. 1996, 30, 361–377. [Google Scholar]
  45. Hanssen, J.U. Transportation Impacts of Office Relocation: A Case Study from Oslo. J. Transp. Geogr. 1995, 3, 247–256. [Google Scholar] [CrossRef]
  46. Badoe, D.A.; Miller, E.J. Transportation-land-use Interaction: Empirical Findings in North America, and Their Implications for Modeling. Transp. Res. Part D 2000, 5, 235–263. [Google Scholar] [CrossRef]
  47. Hunt, J.D.; Abraham, J.E. Design and Implementation of PECAS: A Generalized System for the Allocation of Economic Production, Exchange and Consumption Quantities; Oxford Elsevier Science Publishers: Kidlington/Oxford, UK, 2005. [Google Scholar]
  48. Hunt, J.D.; Kriger, D.S.; Millere, E. Current Operational Land-use Transport Modelling Frameworks: A Review. Transp. Rev. 2005, 25, 329–376. [Google Scholar] [CrossRef]
  49. Waddeli, P. A Behavioral Simulation Model for Metropolitan Policy Analysis and Planning: Residential Location and Housing Market Components of UrbanSim. Environ. Plan. B Plan. Des. 2000, 27, 247–263. [Google Scholar]
  50. Taaffe, E.J.; Krakover, S.; Gauthier, H.L. Interactions between spread-and-backwash, population turnaround and corridor effects in the inter-metropolitan periphery: A case study. Urban Geogr. 1992, 13, 503–533. [Google Scholar] [CrossRef]
  51. Fu, B.; Chen, L. Principles and Applications of Landscape Ecology; Science Press: Beijing, China, 2001; Volume 7, pp. 58–59. (In Chinese) [Google Scholar]
  52. Liu, D. Modelling the effects of spatial and temporal correlation of population densities in a railway transportation corridor. Eur. J. Transp. Infrastruct. Res. 2015, 3, 243-U123. [Google Scholar]
  53. Niu, F.; Wang, F.; Chen, M. Urban Land Use-Construction and Application of Integrated Transportation Model. J. Geogr. Sci. 2019, 29, 197–212. [Google Scholar] [CrossRef] [Green Version]
  54. Mao, J.; Yan, X. Study on corridor effect of urban traffic trunk roads on land use: Taking Guangzhou Avenue as an example. Geogr. Geo-Inf. Sci. 2004, 5, 58–61. (In Chinese) [Google Scholar]
  55. Cervero, R. Rail transit and development. J. Am. Plan. Assoc. 1994, 60, 1. [Google Scholar]
  56. Jiang, Y. Mechanism of the Effect of Transportation Development on Land Use Change. Master’s Thesis, Sichuan Normal University, Chengdu, China, 2015. (In Chinese). [Google Scholar]
  57. Zhou, J.; Xi, J. Corridor Effect of Railways and the Analysis of Urban Land Using: Taking Rail Pearl Line in Shanghai (Phase 1) as an Example. Urban Rail Transit Res. 2002, 1, 77–81. (In Chinese) [Google Scholar]
  58. Patsy, H. The Reorganisation of State and Market in Planning. Urban Stud. 1992, 29, 411–434. [Google Scholar]
  59. Wang, F.; Yuan, Q.; Shi, N.; Zhao, Y.; Lin, J. Spatial Planning—Government and Market. Urban Plan. 2016, 40, 102–106. (In Chinese) [Google Scholar]
  60. Li, X. Plane scale and economic indicators of standard floors of high-rise office buildings. South Archit. 2006, 10, 17–19. (In Chinese) [Google Scholar]
  61. Wang, J.; Xu, C. Geographic detectors: Principles and prospects. Acta Geogr. 2017, 72, 116–134. (In Chinese) [Google Scholar]
Figure 1. Guangzhou city: (a) the location of Guangzhou in China; (b) the study area.
Land 11 01087 g001
Figure 2. Research methods flowchart.
Land 11 01087 g002
Figure 3. Distribution of expressway: (a) expressway outside the inner-fringe area; (b) expressway in the inner-fringe area.
Land 11 01087 g003
Figure 4. The corridor effect of expressway with different locations: (a) expressway outside the inner-fringe area; (b) expressway in the inner-fringe area.
Land 11 01087 g004
Figure 5. Distribution of trunk road in the inner fringe of Guangzhou: (a) horizontal direction trunk road; (b) vertical direction trunk road.
Land 11 01087 g005
Figure 6. Spatial agglomeration of trunk road in the inner fringe: (a) both directions trunk road; (b) different directions trunk road.
Land 11 01087 g006
Figure 7. Analysis of the mechanism of horizontal trunk road corridor effect: (a) bus network density; (b) traffic flow.
Land 11 01087 g007
Table 1. Classification of the four types of urban roads studied.
Road Classification in ChinaDesigned Speed
(km/h)
Road Spacing
(km)
Road Width
(m)
Motor
Vehicle Lanes
Expressway60–1001.6–2.440–456–8
Trunk road40–600.8–1.545–556–8
Secondary trunk road30–500.3–0.540–504–6
Branch road20–40below 0.315–302–3
Source: Code for design of urban road engineering [GB CJJ37-2012 (Chinese Standard 2016)].
Table 2. Spatial agglomeration of expressway outside the inner fringe.
Distance (Meter)Architectural AgglomerationLand Agglomeration
Number of BuildingsPercentage
(%)
Land Area
(Hectares)
Percentage
(%)
200222.1571.975.36
400121.1741.093.06
600111.0846.263.45
80080.7851.363.83
100090.8866.804.98
1200161.5671.285.31
1400151.4782.796.17
1600232.2593.486.97
1800262.5480.456.00
2000313.0362.114.63
Total17316.91667.5949.76
Table 3. Spatial agglomeration of expressway in the inner fringe.
Distance (Meter)Architectural AgglomerationLand Agglomeration
Quantity of BuildingsPercentage
(%)
CBF Land Area (Hectares)Percentage
(%)
20012812.51 68.735.12
40011010.75 56.254.19
60010410.17 49.773.71
8001029.97 74.525.55
1000949.19 71.905.35
Total53852.59321.1723.92
Table 4. Spatial agglomeration of trunk road in the inner fringe.
Distance (Meter)Architectural AgglomerationLand Agglomeration
Number of BuildingsPercentage
(%)
Land Area
(Hectares)
Percentage
(%)
100171 16.73148.3211.05
20015415.04143.2310.67
30011911.65123.439.19
400908.77109.328.14
500817.89102.627.64
Total61560.08626.9246.69
Table 5. Part of horizontal trunk roads.
Road NameNumber of Office Buildings around the Road in 500 mBus Network Density
(Road/Hectare)
Traffic Flow
(Standard Vehicle/Hour)
Dongfeng Road97353620
Zhongshan Road93232480
Tianhe Road116283600
Huan Shi Dong72173150
Siyouxin Road28261960
Xingang Road69122750
Zhongshan Avenue112333480
Flower City Avenue32291980
Industrial Avenue32191750
Jiefang Avenue62302600
Jiangnan Avenue42183620
Table 6. Relevance analysis of internal mechanism of traffic corridor Eefect.
Correlation AnalysisNumber of Office BuildingsBus Network DensityTraffic Flow
Number of office buildings1
Bus network density0.371
Traffic flow0.810.1931
Table 7. Risk factor probe statistics.
Correlation AnalysisBus Network
Density
Traffic Flow
q statistic0.22940.7448
p value0.60490.042
Table 8. Interaction detection results.
Correlation AnalysisBus Network DensityTraffic Flow
Bus network density0.2294
Motor vehicle flow0.22730.7448
Table 9. Different corridor effect with various grades, locations, and directions.
Road GradeLocationRoad Characteristic or DirectionCorridor EffectRadius of Action
(m)
ExpresswaysOutside the inner fringeRadial formationNo corridor effect0–1000
Reverse corridor effect1000–2000
In the inner fringeAnnular formation Obvious800
Trunk roadIn the inner fringeHorizontal (east–west) directionObvious500
Vertical (north–south) directionNoneNone
Publisher’s Note: MDPI stays neutral with regard to jurisdictional claims in published maps and institutional affiliations.

