Article

Horizontal Distribution Characteristics and Environmental Factors of Shrubland Species Diversity in Hainan Island, China

1
South China Botanical Garden, Chinese Academy of Sciences, Guangzhou 510650, China
2
University of Chinese Academy of Sciences, Beijing 100049, China
*
Author to whom correspondence should be addressed.
Land 2022, 11(7), 1047; https://doi.org/10.3390/land11071047
Submission received: 19 May 2022 / Revised: 29 June 2022 / Accepted: 4 July 2022 / Published: 11 July 2022

Abstract

:
Tropical forests play a vital role in preserving world biodiversity and supporting ecological services. Moreover, the spatial distribution of species diversity and its causes are one of the core issues in community ecology. Therefore, the aim of this study was to explore the horizontal distribution characteristics of shrub community diversity in the tropical region of Hainan and reveal the relationship between species diversity and environmental factors under anthropogenic disturbances. Based on a survey of 39 shrubland plots, we evaluated shrub community diversity by calculating Hill number and Pielou evenness index. Regression analysis was employed to determine the horizontal distribution pattern, and Pearson correlation and redundancy analysis were applied to reveal the relationship between species diversity and environmental factors. The results reveal that species richness increased from west to east and the horizontal distribution of shrubland species diversity in Hainan was largely determined by rainfall and edaphic factors and not by topographic factors. Rainfall factors were the most influential. Although there was a significant human disturbance in Hainan shrublands, environmental factors were still influencing the distribution of these shrublands, and there was a lower shrub diversity in areas with poor moisture conditions, which should be studied more. Our results are of great significance to the study of tropical vegetation and regional biodiversity conservation.

1. Introduction

China is one of the world’s “mega-biodiversity countries” providing an abundant habitat for plants and animals serving as a home to more than 30,000 vascular plants (surpassed only by Brazil and Colombia) and 6300 vertebrates [1,2]. However, this biodiversity has suffered severe degradation due to the density of the human population, a long history of cultivation, and an increase in the intensity and extent of human disturbances in the plains and lowland areas [3,4]. Logging and intensive shifting cultivation have caused major degradation of tropical forests and the loss of biodiversity, thus necessitating a comprehensive study to understand the environmental effects on plant biodiversity to fast track the restoration of tropical forests [5,6]. Climatic changes induced by extremes in precipitation and temperature have threatened the biodiversity and habitats of various species and could trigger irreversible changes to tropical forest ecosystems [7,8].
Researchers have found the greatest abundance of threatened plant species in the southwestern region of mainland China (mainly in Yunnan, southeastern Xizang, and western Sichuan), northwestern Guangxi, northern Guangdong, Hainan Island, and the mountainous region of Taiwan; thus, researchers have proposed that nature reserves specifically be designed for threatened plant species in South China, especially in the Yunnan, Guizhou, Guangxi, Xinjiang, Hainan, and Zhejiang Provinces [9]. The associations between plant composition/diversity and the abiotic environment across six vegetation types in the Hainan Island, a biodiversity hotspot in China, have been studied and documented [10,11]. Results demonstrate that temperature and precipitation play an important role in confining the spread of various species across the island, giving the example of the Crofton weed (Ageratina adenophora) that has spread from subtropical areas with higher annual mean temperature and lower climatic fluctuations to much cooler and dryer areas at higher altitudes [11,12].
Species diversity is at the heart of biodiversity research and is considered extremely important by the ecological community [13,14]. Species diversity not only reflects the composition and distribution of species, the community structure characteristics, and adaptation to the environment [15], but it also reveals the ecological processes of a plant community [16]. Its spatial distribution pattern is directly correlated to various ecological factors and processes, i.e., soil nutrients, soil texture, region elevation, and relative dryness (based on slope angle and aspect) [17]. Many studies have found that the species diversity index of large-scale plant communities generally decreases gradually with an increase in latitude [18,19,20], and this trend is an important factor in making a distinction between various plant communities [21,22]. The vertical distribution pattern of species diversity has been shown to vary greatly among species especially those of different life forms, and the law of α diversity decreasing along the elevation gradient has been generally accepted [23], notably with single-peak [24,25], double-peak [26] and an upward trend pattern [27,28], with inconsistencies among different indices [29]. Previous studies have demonstrated that environmental factors that control the spatial distribution of species diversity vary greatly at different regional scales [30]. Generally, at the regional scale, hydrothermal conditions, flora, and soil parent material types jointly influence the distribution of plant communities [31,32]. Altitude has a significant impact on the climate, thus indirectly affecting the distribution of vegetation. Local differences in soil factors and microclimate are determinants of the formation of plant communities and vegetation distribution [33,34].
Hainan Island is in the southern part of China and located on the northern edge of the tropics, significantly influenced by the alternating winter and summer winds. It has a hot and rainy tropical monsoon climate, with two seasons of rain and drought a year, thus creating a superior geographical location endowed with abundant species resources, making it an excellent experimental field for biodiversity research. However, past studies on species diversity on Hainan Island have been mostly focused on tropical mountain forests such as Jianfengling, Bawangling, and Wuzhishan [35,36,37], and few studies have been conducted on shrub and grassland ecosystems [38], which are limited to just small regions and therefore lack systematic investigation. Shrub ecosystems are one of the important components in the terrestrial biosphere and play an important role in maintaining regional diversity, ecological environmental protection, and vital ecosystem functions [39]. The shrub area in Hainan is approximately 120.23 × 10⁴ m2 and is mostly scattered on lowlands and around plains, most of the shrubland having been destroyed for the development of local farming. Moreover, shrub communities on Hainan Island are already experiencing human disturbances, providing an opportunity to study the effects of disturbance history on shrub communities diversity.
At present, studies on the distribution of species diversity mainly focus on the horizontal distribution of large-scale plant communities or the distribution of mountain plants along elevation and slope direction at regional or local scales, neglecting the synthetical analysis of shrub community distribution along longitude, latitude, elevation, and slope direction. Therefore, a systematic study on the spatial distribution characteristics of the shrub community and the species diversity in Hainan is useful in not only expanding the background data of biodiversity but also in providing a reference for the scientific management and maintenance of shrub resources in tropical regions. In this study, we investigated 13 representative shrub plots in Wanning, Qiongzhong, Qionghai, Changjiang, Wenchang, Chengmai, Danzhou, and Lingao, Hainan, China, where shrub communities are widely distributed, and analyzed the horizontal distribution pattern and the species diversity of typical shrub communities on Hainan Island for climate, topography, and soil factors. The main factors affecting the species diversity and the distribution pattern of shrub communities on Hainan Island were documented. It was assumed that although shrub communities on Hainan Island were very badly degraded because of a long period of human activities, the species diversity still had spatial distribution characteristics of forest species diversity on a large scale and regularity in horizontal distribution; moreover, shrub species distribution was influenced by some environmental factors.

2. Materials and Methods
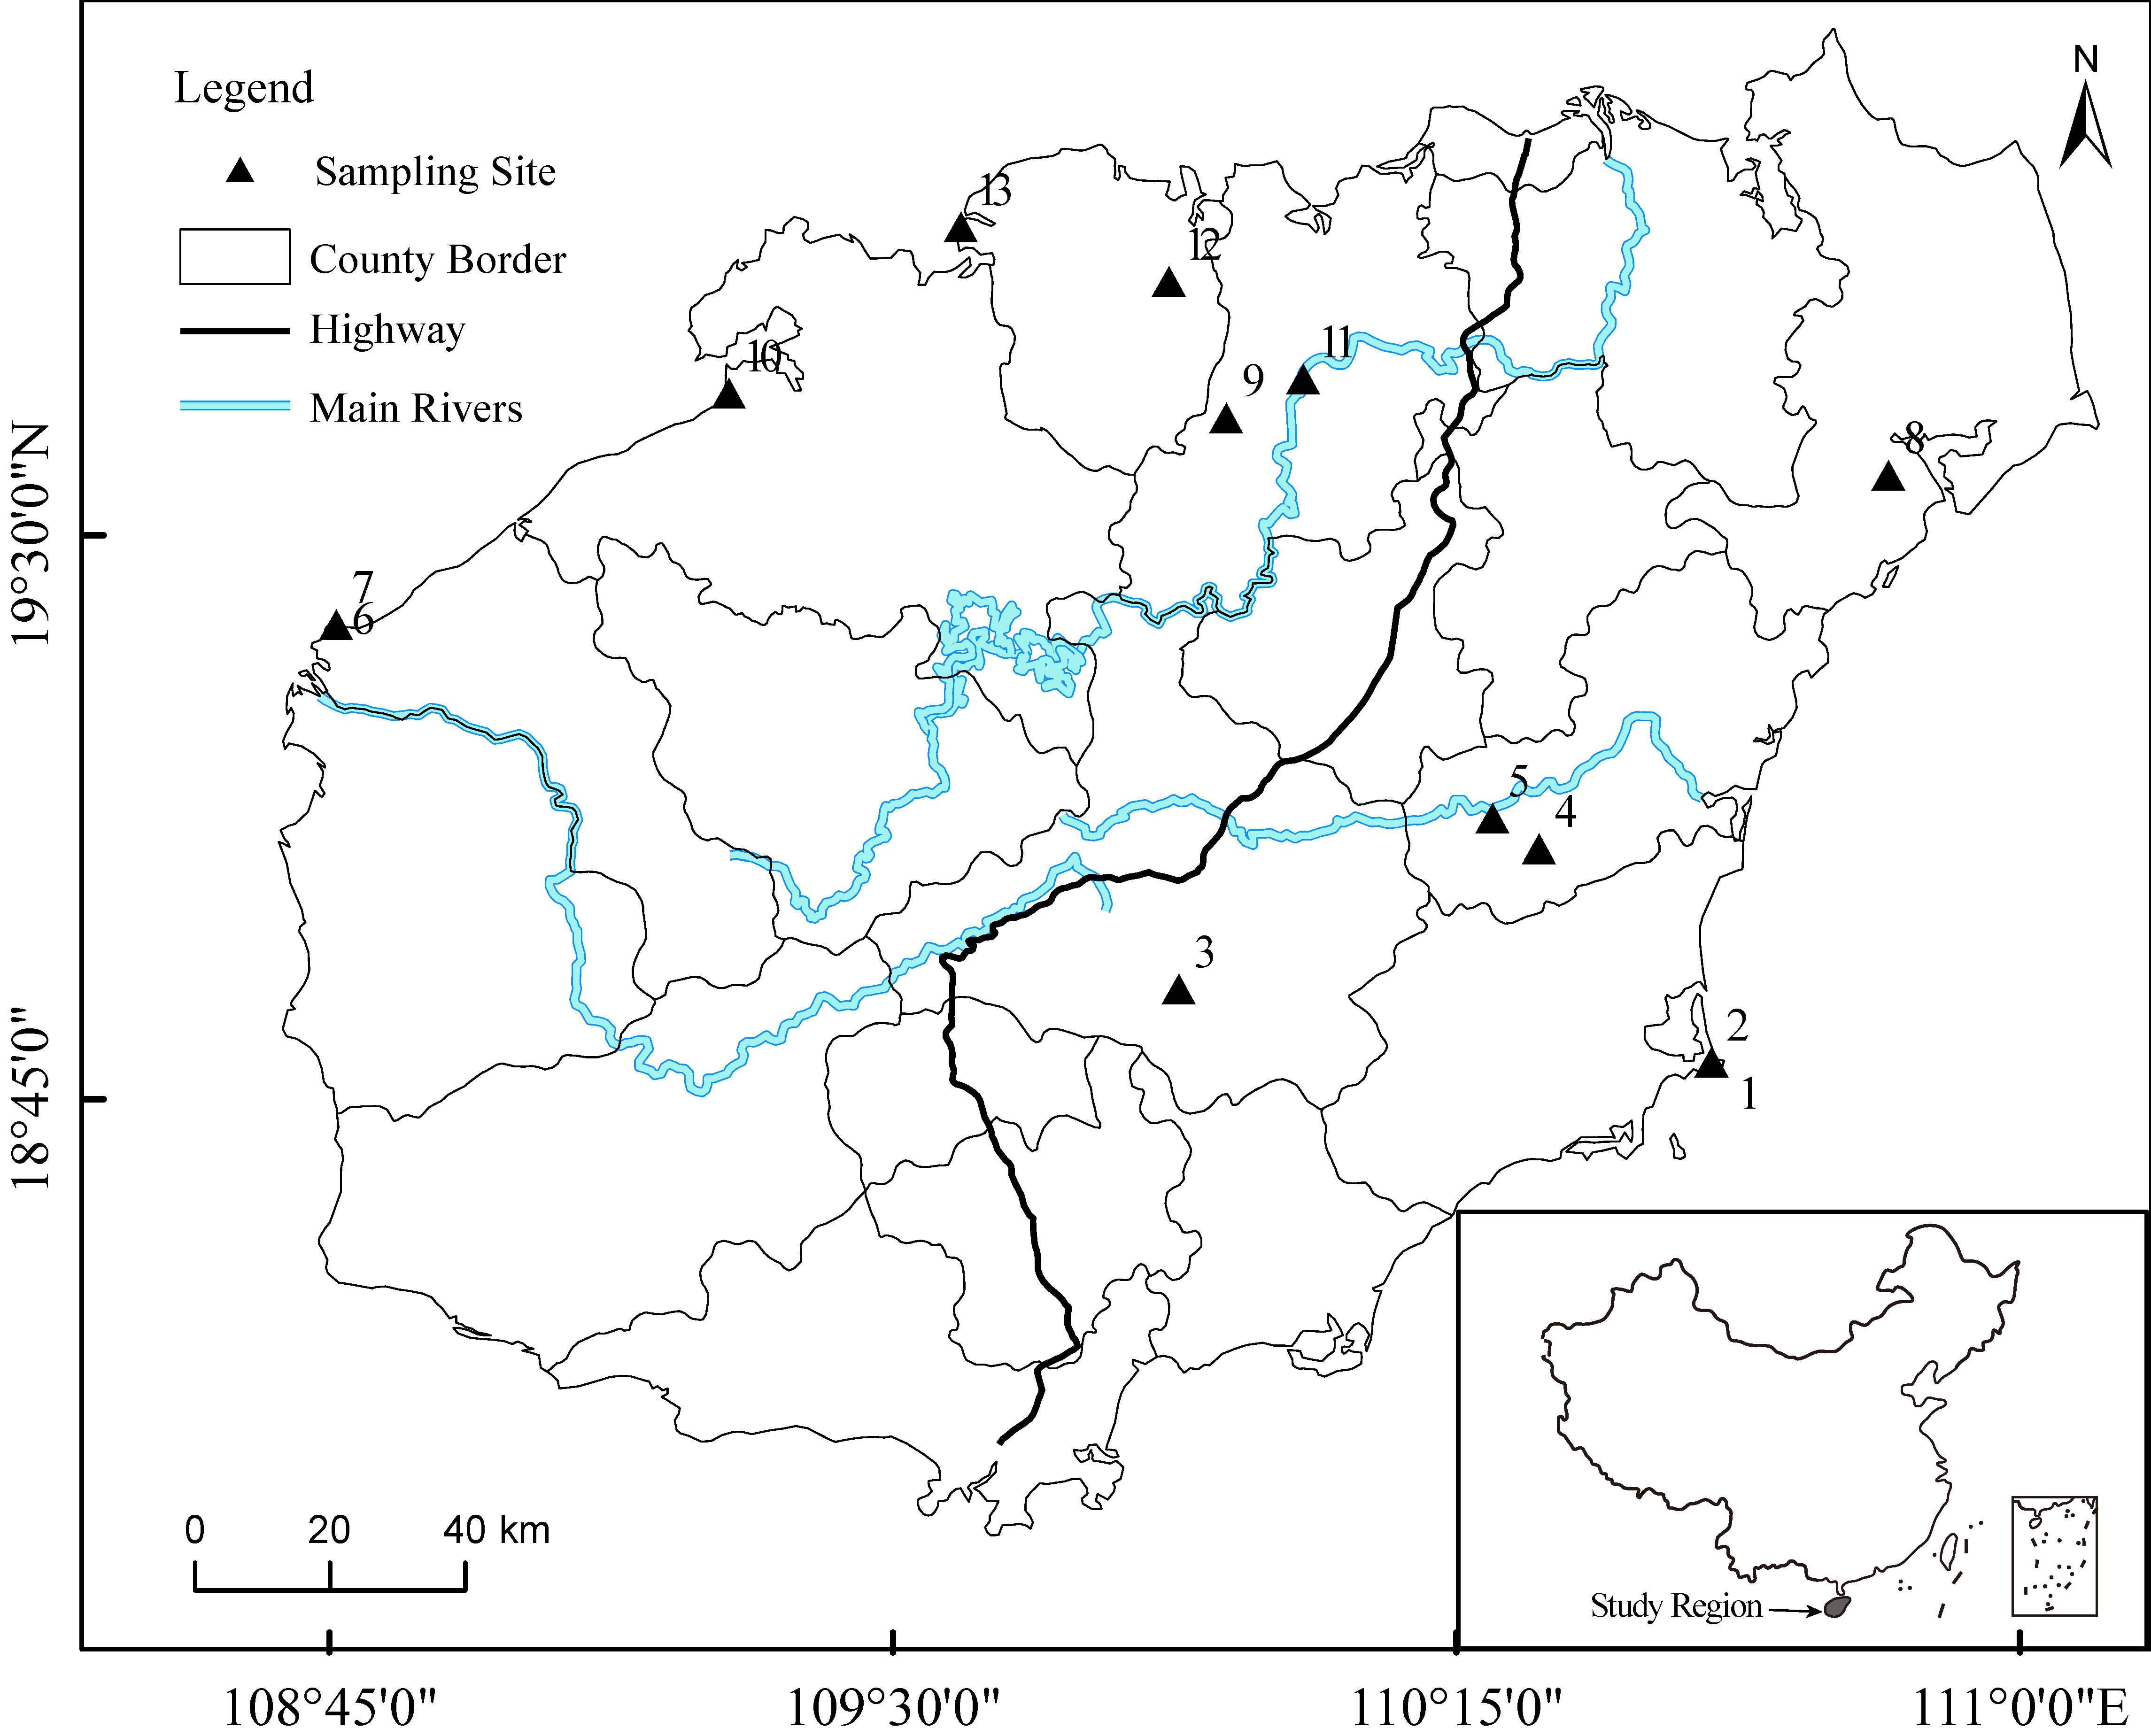
2.1. Study Site

Hainan Island is located between 18°10′ N to 20°1′ N and 108°30′ E to 111°3′ E in the northern margin of the tropics. The annual temperature averages between 22.5~25.6 °C, increasing from the central mountainous areas to the coastal areas [40]. The annual precipitation is averagely 1500~2000 mm and is divided into dry and wet seasons. It is wet season from May to October and dry season from November to April of the following year. There are differences in annual precipitation in different sections of the Island, and the influence of the southwest monsoon in western China is more significant in the dry season [41]. The terrain is mainly flat around the island dome, rising to a peak in the middle. It is a trapezoidal structure composed of mountains, hills, platforms, and plains with an average elevation of 120 m asl. The dominant shrubs are Rhodomytus tomentosa, Baeckea frutescens, Psychotriaasiatica, and Flacourtia indica; herbs include, i.e., Dicranopteris pedata, Imperata cylindrica var. major, Chromolaene odorata L., and so on.

2.2. Community Surveys

Eight counties in Hainan, Wanning, Qiongzhong, Qionghai, Changjiang, Wenchang, Chengmai, Danzhou, and Lingao, with a wide shrub distribution area, were selected for investigation in December 2019 and July 2020 to accomplish a comprehensive survey of Hainan shrubs. A typical plot investigation method was adopted in the study area and the representative shrub communities with a contiguous distribution and a patch area greater than 100 m × 100 m or a noncontiguous distribution area greater than 25 m × 25 m and a radius < 250 m were selected from 13 plots that had relatively uniform habitat and community structure. The plot distribution is as shown in Figure 1. The minimum distance between the quadrants was no less than 5 m while the maximum was no more than 50 m, and a total of 39 shrub quadrants were laid out. The indexes of the shrub species name, height, base diameter, and the canopy width’s long and short axes were recorded. In addition, to ensure the adequacy of the species survey, we estimated the sample coverage for each site. The accumulation curves of each studied site are presented in Figure S1. GPS was used to record the longitude, latitude, and altitude information of the sample plots, and the slope direction and inclination were measured using a compass. The basic information of the sample plots is shown in Table 1.

2.3. Soil Physicochemical Properties

We removed undecomposed or semi-decomposed litter on the surface and then adopted the five-point sampling method in each shrub plot. Soil samples from a depth ranging from 0~20 cm were drilled with a soil drill and mixed evenly and placed into marked and sealed plastic bags, which were then taken back to the laboratory for processing and analysis. After screening using a 2 mm sieve, the soil was air-dried. The soil organic matter was measured using the potassium dichromate-sulfuric acid oxidation external heating method. The total nitrogen (TN) in the soil was analyzed by semimicro-Kjeldahl methods [42], and total phosphorus (TP) in the soil was determined by the molybdenum antimony resistance colorimetric method [43]. The pH value of the soil was measured using a Sartorius PB-10 pH meter in a 1:2.5 soil/water suspension [44].

2.4. Analytical Approach

2.4.1. Measurement of Shrub Community Diversity

The importance values of each species in the shrub layer were calculated. Due to the replication and linearity principle, Hill numbers are used commonly to quantify abundance-based species diversity [45,46,47]. Hill numbers and the Pielou evenness index were selected to reflect the α diversity and the functional status of a shrub community. According to the plant community inventory method, the species importance value and α diversity index are determined as follows:
I V i = ( R a i + S d i + R h i ) / 3
where IVi is the relative importance of the ith shrub species in the corresponding community, Rai, Sdi,, and Rhi are the abundance, basal area, and height of the ith shrub species, respectively [48].
H = i = 1 s P i ln P i ,
where H′ is the Shannon–Wiener index, Pi is the proportion of the ith shrub species importance value in the quadrat, ln is the natural log (2.178), and S is the number of species in the survey sample [49].
D = 1 i = 1 s P i 2 ,
where D′ is the Simpson dominance index [50].
J = ( H ) / ( ln S ) ,
where J is the Pielou evenness index [51].
On this basis, we calculated the Hill numbers of the Hainan shrub community. The Hill numbers combine rich information on species richness, species rarity, and species dominance [52,53].
q D = ( i = 1 S P i q ) 1 / ( 1 q ) ,   q     0 ,   q     1 ,
where qD are the Hill numbers and q is the parameter that determines sensitivity to species relative abundances [47,52].
0 D = i = 1 S P i 0   = S ,
When q = 0, the Hill number N0 0D represents species richness [47,52].
1 D = exp ( i = 1 s P i ln P i ) =   e H ,
When q = 1, the Hill number N1 1D represents the exponential of Shannon diversity [47,52].
2 D = 1 / i = 1 s P i 2   = 1 / ( 1 D ) ,
When q = 2, the Hill number N2 2D represents the inverse of Simpson diversity [47,52].

2.4.2. Data Processing and Analysis

Sample coverage was calculated using the iNext package of the R 3.6.2 (R Core Team 2019; Vienna, Austria) and species accumulation curves were plotted using ggplot2 [54,55,56]. Temperature and precipitation data were obtained from the WorldClim database, species importance value was calculated in the R software, and the α diversity index was calculated using the Vegan package of the R software and Microsoft Excel. The horizontal distribution pattern of α diversity was tested using the unary regression analysis, the correlation between the α diversity index and environmental factors was analyzed using the Pearson correlation analysis, and the relationship between the α diversity and environmental factors was investigated using the Detrended Correspondence Analysis (DCA) and the Redundancy Analysis (RDA). Before the analysis, the species richness values underwent a natural logarithm conversion, and other environmental factors were analyzed after standardized processing. Particularly, the slope conversion was utilized to convert the azimuth value to between 0 and 1; this formula is as follows:
T R A S P = { 1 cos [ ( π 180 ) ( a s p e c t 30 ) ] } / 2
where TRASP is the slope aspect index and aspect is the slope azimuth value measured using a compass [57].
The unary regression analysis was performed using SPSS 25.0 for Windows software, setting the significance level to 0.05. Sigmaplot14.0 was used to plot all the data analysis graphs. Correlation analysis, community ordination, model correction test, and visualization were all carried out using R software. The Vegan package in the R software was used to conduct DCA and RDA [58], and the Rsquare Adj function was used to calculate the R2 [59]. The envfit function was used for the permutation test [60], the ordiR2step function was used for the forward selection of the model [61], and ggplot2 was used for data visualization.

3. Results

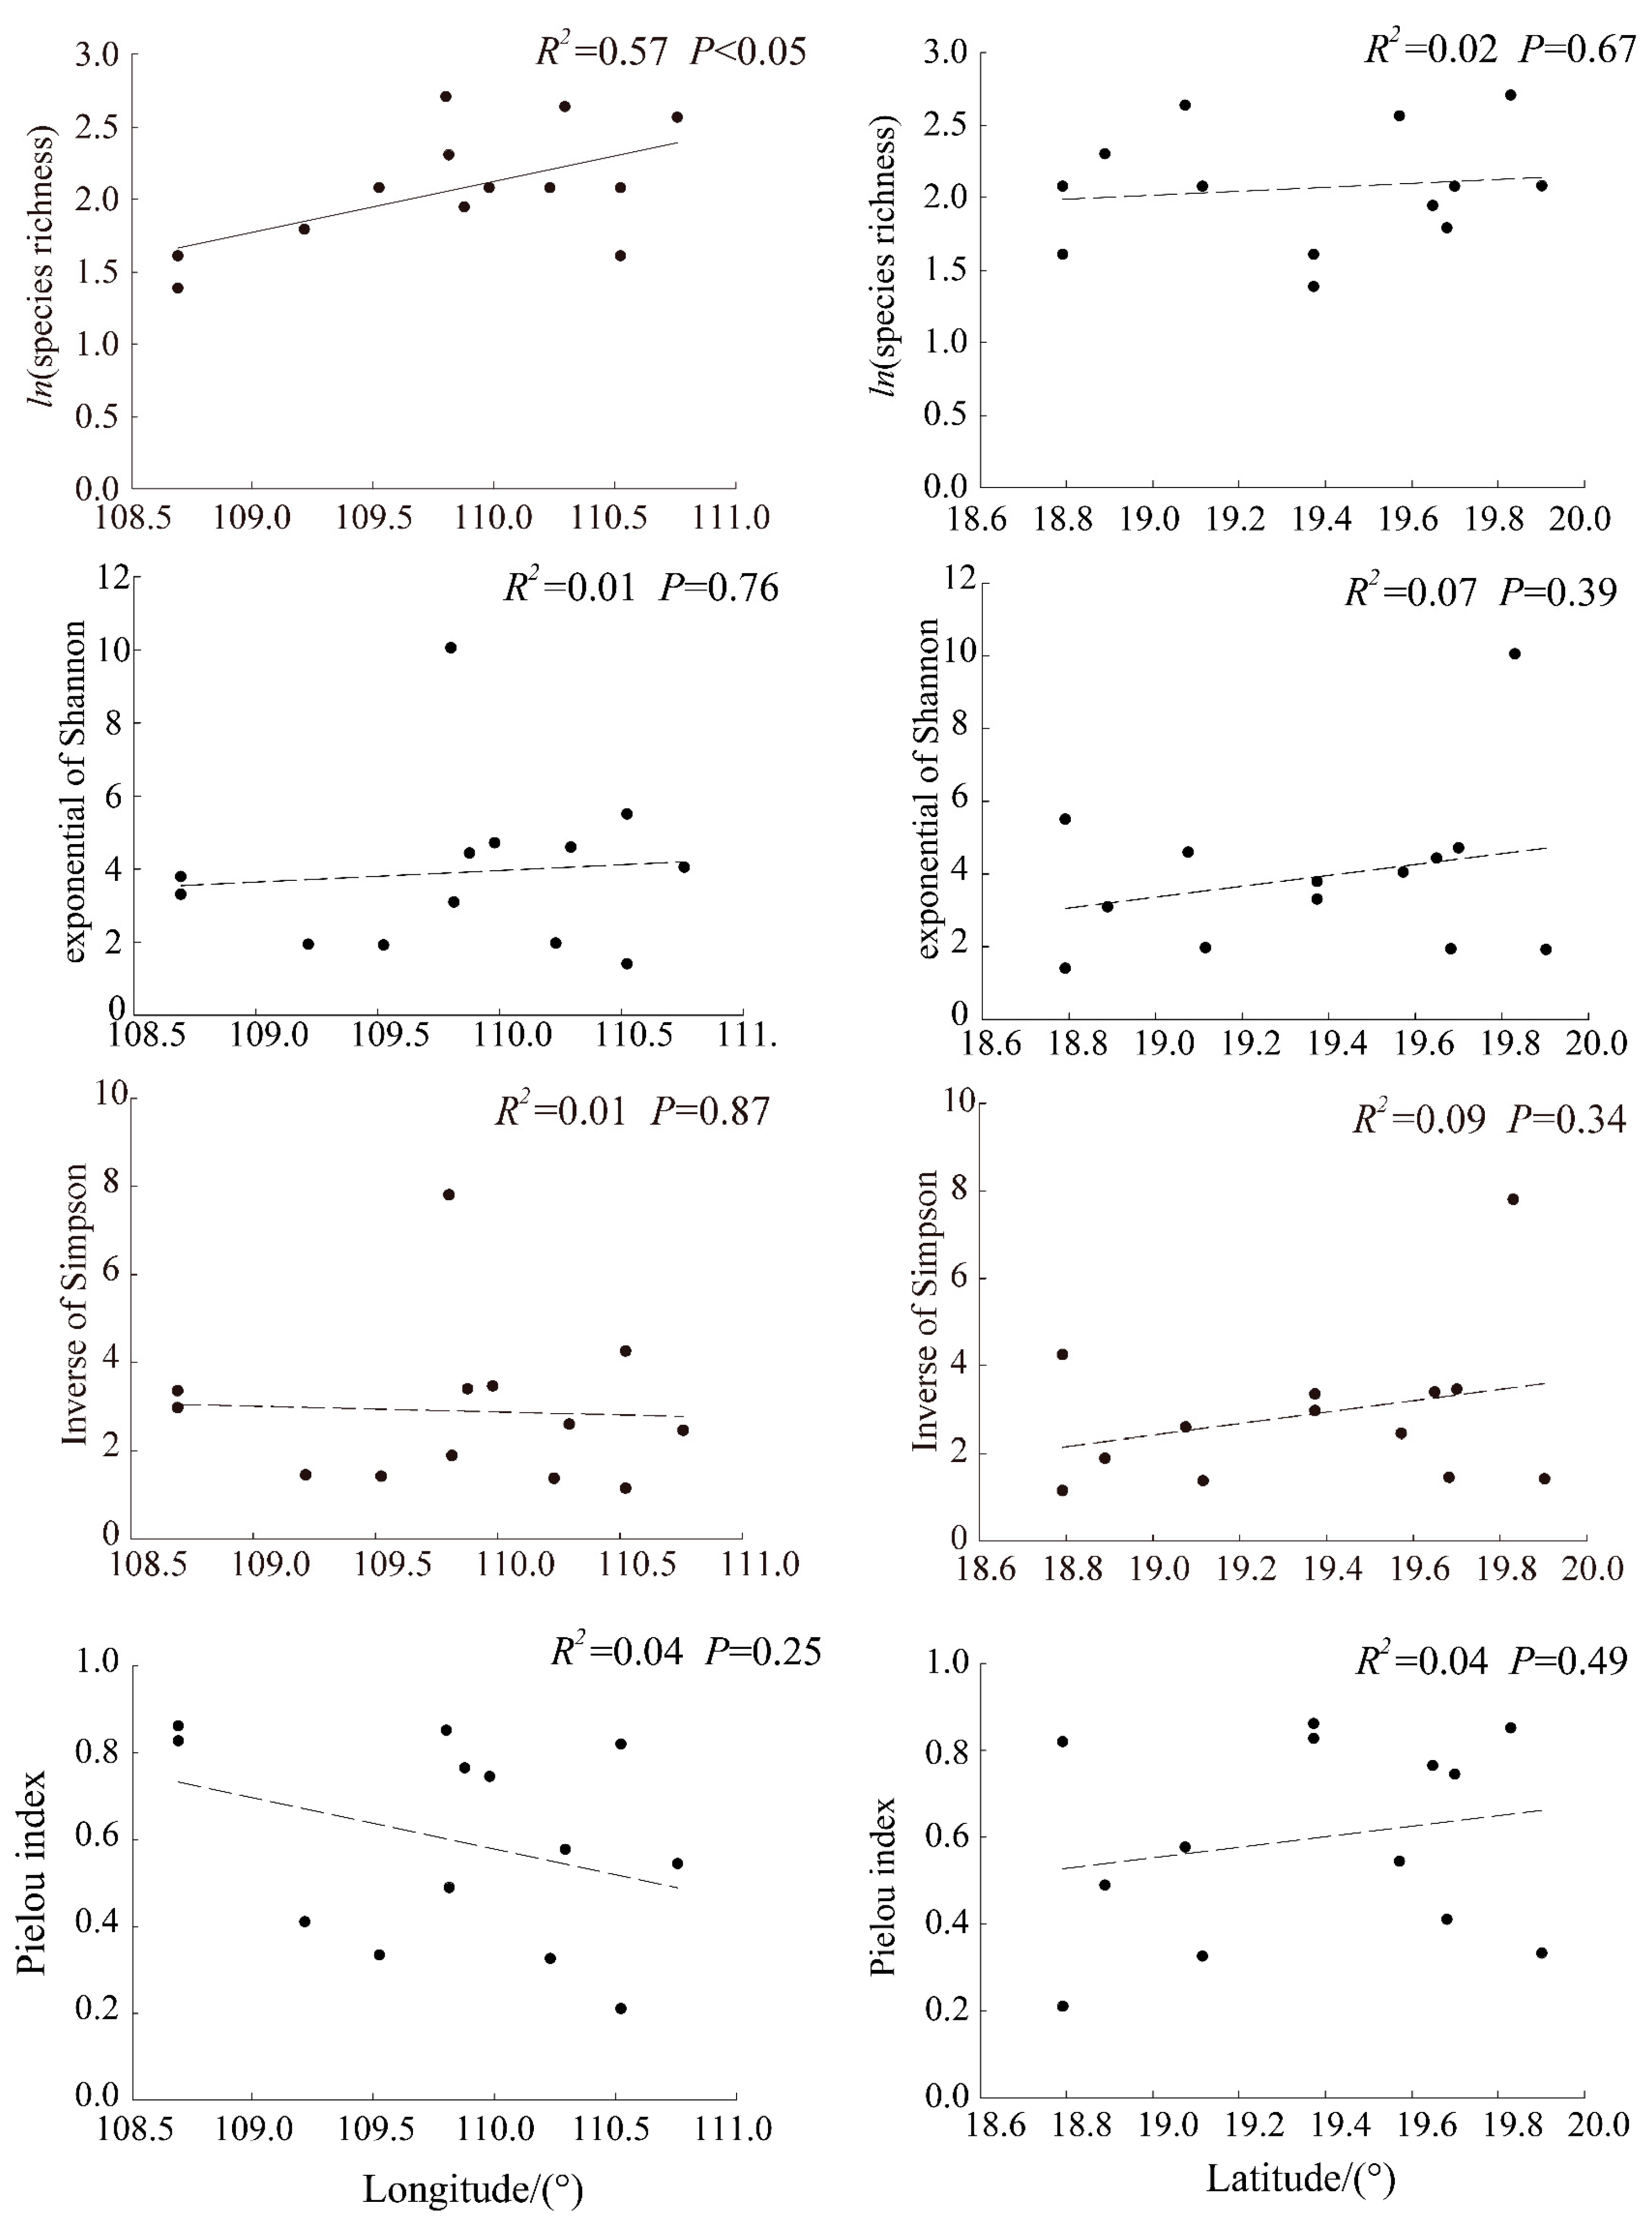
3.1. Horizontal Differentiation of Species Diversity Index

The species diversity index of the Hainan shrubs was spatially inconsistent (Figure 2). Species richness was positively correlated with longitude (R2 = 0.57, p < 0.05), that is, species richness increased from west to east, while the Pielou index gradually decreased, but the trend was not significant (p = 0.25). The exponential of Shannon diversity and the inverse of Simpson diversity fluctuated greatly in the east–west direction and did not show a clear trend (p > 0.05). In the north to south direction, species richness fluctuated significantly, but there was no significant correlation (p > 0.05). The Shannon–Wiener index, Simpson index, and Pielou index showed a slight upward trend from south to north (p = 0.39, p = 0.34, and p = 0.49). Consequently, we recorded that shrub species richness increased significantly from west to east, the exponential of Shannon diversity and the inverse of Simpson diversity increased from south to north, and the Pielou index slightly increased from southeast to northwest.

3.2. The Correlation between Species Diversity Index and Environmental Factors

The correlation analysis between species diversity index and environmental factors is shown in Table 2. Except for precipitation variation coefficient, the other three climatic factors, i.e., annual precipitation, precipitation in the driest season, and precipitation in the wettest season, were significantly positively correlated with species richness (r = 0.729, p < 0.01; r = 0.745, p < 0.01; r = 0.678, p < 0.05), and there was a significant negative correlation between the precipitation variation coefficient and species richness (r = −0.701, p < 0.01). The Pielou evenness index was significantly negatively correlated with soil organic carbon (r = −0.595, p < 0.05) and significantly positively correlated with soil total nitrogen and N/P ratio (r = 0.561, p < 0.05; r = 0.642, p < 0.05). Precipitation and soil factors were correlated with the four indexes in different degrees, while temperature and terrain factors were not correlated with the four indexes.

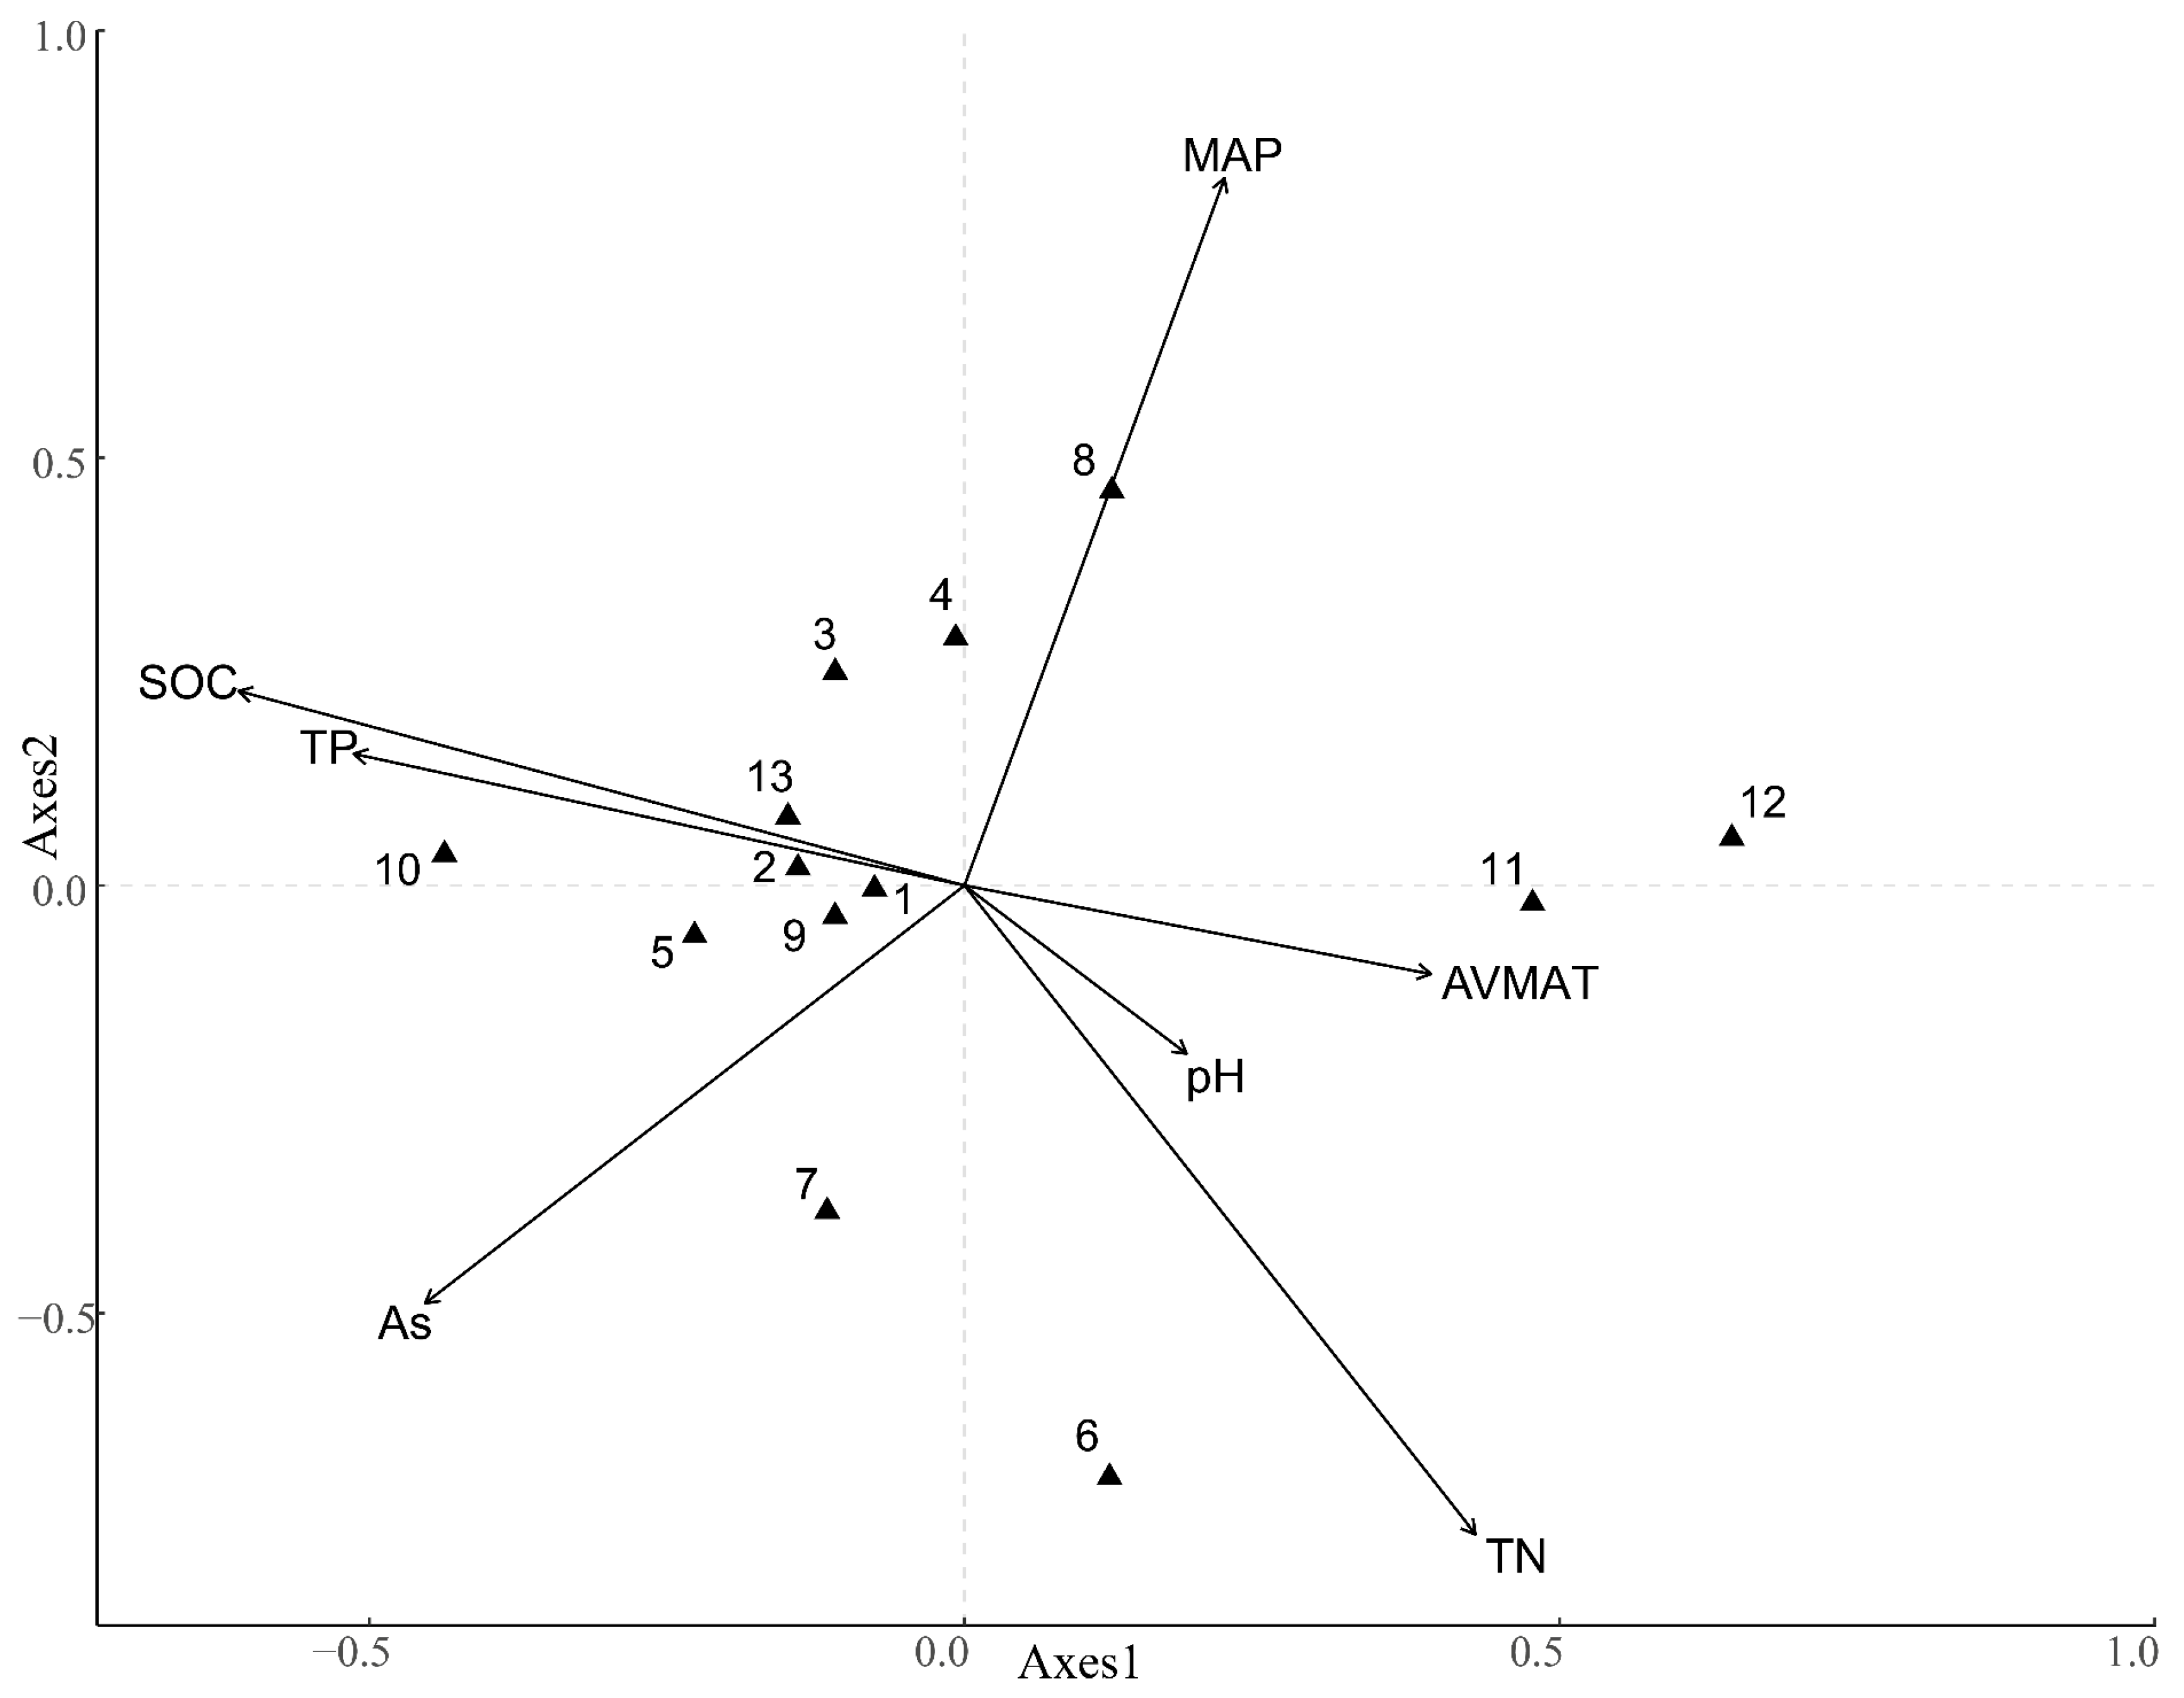
3.3. The Sequencing Analysis of Species Diversity and Environmental Factors

To ensure the accuracy of the model, the variance expansion factor method was used to screen out multicollinearity factors, leaving seven environmental factors (Table 3), including annual temperature, annual precipitation, slope aspect, soil organic carbon, soil total nitrogen, soil total phosphorus, and soil pH. DCA operation results show that the maximum gradient in the four axes was 0.476 fewer than 4, therefore the linear model RDA was used to explore the relationship between shrub species diversity and environmental factors. The characteristic values of the first two axes of the RDA analysis were 0.5266 and 0.1710, respectively, which could explain 62.6% and 2.0% of the relationship between the shrub species diversity and the environment, and the cumulative variance explanation rate was 64.6%, indicating that the first two axes contained most of the ranking information and could reflect the relationship between the shrub species diversity and environmental factors in a relatively complete way.
The RDA ranking results show (Table 3) that the correlation degree (absolute value) between the environmental factors and the first ranking axis was (from high to low) annual precipitation > soil total nitrogen > soil organic carbon > slope aspect > annual temperature difference > soil total phosphorus > soil pH. The first ranking axis mainly reflected the change in annual precipitation (r = 0.325). The correlation degree (absolute value) between environmental factors and the second-ranking axis was (from high to low) soil total nitrogen > soil total phosphorus > soil organic carbon > soil pH > slope aspect > annual precipitation > annual temperature difference. The second-ranking axis mainly reflected the change in soil total nitrogen (r = −0.229).
Species diversity and environmental factors have been represented in a two-dimensional sequence diagram (Figure 3); the arrowed line represents the environmental factors and the quadrant represents the positive and negative relationship between the environmental factors and ordination axes. The environmental factors distributed in quadrants 1 and 4 are positively correlated with axis 1(x-axis), those distributed in quadrants 2 and 3 are negatively correlated with axis 1. Similarly, the environmental factors distributed in quadrants 1 and 2 are positively correlated with axis 2(y-axis), and those distributed in quadrants 3 and 4 are negatively correlated with axis 2. Meanwhile, the line angle represents the degree of correlation. The longer the line and the smaller the angle, the greater the contribution of the environmental factor to species diversity and vice versa. Axis 1 mainly reflects the impact of annual precipitation on species diversity, with an increasing trend from bottom to top. Axis 2 (y-axis) mainly reflects the impact of soil total nitrogen on species diversity, with an increasing trend from left to right. At the same time, the distance between quadrats reflects the degree of similarity between the factors. The closer the distance between quadrats, the higher the degree of similarity and the more similar their impact is on environmental factors. To avoid the conjugation effect caused by redundant variables, forward selection, and the Monte Carlo replacement test were used in the RDA analysis to screen the main influencing factors of species diversity. Annual precipitation was the first factor selected, followed by soil total nitrogen, slope aspect, soil organic carbon, soil total phosphorus, annual temperature difference, and soil pH. The annual mean precipitation and soil total phosphorus significantly affected species diversity (MAP: R2 = 0.588, p = 0.021; TN: R2 = 0.531, p = 0.025).

4. Discussion

4.1. The Horizontal Distribution of Shrub Species Diversity in Hainan

At different scales, the spatial distribution of species diversity varies greatly due to different controlling factors [30]. The Hainan shrub community species diversity index has a positive correlation with longitude (R2 = 0.57, p < 0.05), and the species richness increases significantly from west to east. This result is consistent with the research on the distribution of species diversity [62]. The spatial variations of the Shannon–Wiener index, Simpson index, and Pielou index are complex and are not significantly correlated with latitude and longitude. The Pielou index shows a decreasing trend from west to east. The exponential of Shannon diversity, the inverse of Simpson diversity, and Pielou index showed a slight upward trend from south to north. Previous research on Hainan Island recorded the greatest influence on species distribution from environmental and anthropogenic disturbance compared with other spatial influences [62]. The elevation is the second most important factor affecting the patterns of species diversity, closely followed by soil physical factors such as density, water holding capacity, and porosity [62].
The Hill numbers and Pielou index are all based on individual abundance [47,63]. The exponential of Shannon diversity (Hill number N1), for instance, is a comprehensive indicator reflecting diversity, representing both the number of plant species and the uniformity of spatial distribution of different species [52,64]. The inverse of Simpson diversity (Hill number N2), on the other hand, can better reflect community dominance [65,66], and the Pielou index mainly represents species density and evenness in a community. The exponential of Shannon diversity showed no regularity in the east–west direction, while the Pielou index was opposite to the trend of species richness, indicating that precipitation was no longer the main controlling factor of species evenness. The specific reasons for our observations need further study. The exponential of Shannon diversity, the inverse of Simpson diversity and Pielou index all show an increasing trend from south to north, which is consistent with the research on the shrub of Rosa chinensis in north China [67] and contrary to the large-scale spatial pattern across the world [68,69]. This may be due to the low latitude of Hainan, so there is little difference in the annual average temperature in all regions. As a result, negative correlation between species diversity and latitude mainly caused by light and temperature could not be reflected.
Microenvironmental differences may be the main reason for differences in community species composition and structure, especially for relatively small plant communities [70]. The difference between the latitude and longitude in Hainan Island is less than 3°, the horizontal spatial scale is small, and the geographical environment is relatively consistent, leading to a strong dependence of the shrub community species on the microenvironment. The growth, reproduction, and competition of shrub species in different habitats may be the main reason for the nonsignificant spatial distribution of the α diversity index, which is consistent with some research about old-growth forests [71,72].

4.2. The Relationship between Shrub Species Diversity and Hydrothermal Factors in Hainan

The spatial distribution pattern of species diversity on a large regional scale was mainly influenced by the cumulative effect of hydrothermal factors [73], and the spatial variation of moisture and heat was manifested through the spatial differentiation of annual mean temperature and annual mean precipitation. The greater the spatial variation of annual mean temperature and annual mean precipitation, the more complex and diverse the water and energy gradients are to support the survival of more species. From our findings, we assert that the spatial pattern of shrub community diversity in Hainan was at least partially correlated with hydrothermal factors. Specifically, annual precipitation, precipitation in the driest season, and precipitation in the wettest season were significantly positively correlated with shrub species richness, and the precipitation variation coefficient was negatively correlated with species richness, and the redundancy analysis showed that the annual mean precipitation had a significant impact on the species diversity. This is also the main reason for the significant increase in shrub species richness from west to east in Hainan, indicating that although Hainan is generally a humid and rainy region, the moisture factor still has a strong limiting effect on the distribution of shrub community species diversity. This is consistent with the research on species diversity in both small and medium-scale areas [74,75].
In addition, the average annual temperature, the average temperature in the warmest season, and the average temperature in the coldest season were not correlated with the species diversity index of the shrub community in Hainan. This is similar to geographic patterns of species richness [76] and contrary to spatial patterns of species diversity of plants in China [20,21]. Perhaps because Hainan is in a low latitude area with abundant energy, shrub communities can grow and reproduce quite successfully under appropriate temperatures. Energy is therefore not the main limiting factor of shrub species diversity.

4.3. The Relationship between Shrub Species Diversity and Edaphic Factors in Hainan

Soil is the product of the long-term interaction between climate, parent material, terrain, and organisms and stores a large amount of carbon, nitrogen, phosphorus, and other nutrients [77]. Meanwhile, physical and chemical properties in the soil can restrict the growth and development of plants. Soil fertility level was significantly correlated with tropical plant community diversity [78]. The results of the correlation analysis show that the Pielou evenness index was significantly negatively correlated with soil organic carbon and was significantly positively correlated with soil total nitrogen and the nitrogen and phosphorus ratio, suggesting that soil organic carbon was beneficial to increasing the number of individuals, and soil total nitrogen was not conducive to increasing the number of individuals. This result is consistent with the research about evergreen broad-leaved forests [79] and contrary to the research on typical plant communities in the Miao Archipelago and the source of the Yellow River in China [80,81]. Research has established that on the Hainan Island, species diversity increases and is positively correlated to increasing soil fertility with the total phosphorus value being one of the best indicators of soil fertility and important in succession and recovery [82].
Different types of vegetation may have different requirements for soil nutrient types and levels. The shrub community in Hainan showed that the more the abundance of plants, the more the soil organic carbon was absorbed, and therefore less of it is available in the soil. The more the number of individual plant species, the more the soil total nitrogen that is absorbed, and therefore less of it is available in the soil. In plants, studies have shown that increased soil nutrients lead to increased plant productivity, increased competition among species, and the eventual gradual elimination of species with narrow ecological niches, thus reducing community diversity. Therefore, for the Hainan shrub community, it is necessary to pay attention to the location of vegetation types and to supplement nutrients promptly to establish a dynamic balance between tree species growth and nutrient storage. The redundancy analysis showed that soil total nitrogen was the main factor affecting species diversity of the Hainan shrub community and was significantly positively correlated with each diversity index. It may be that because Hainan shrubs have been a secondary tropical vegetation disturbed by human activities for a long time, soil conditions have not improved completely. The contents of soil total nitrogen of Hainan shrubs are still less, remaining a constraint on plant growth [78,83].

5. Conclusions

In this study, we investigated the spatial distribution characteristics and factors influencing the shrub community diversity in Hainan Province. The results show that the spatial distribution of the shrub community was mainly affected by rainfall and edaphic factors and had no significant correlation with topographic factors. First, the distribution of species diversity along the change in longitude also reminds us to pay more attention to the conservation of species in areas with poor hydrothermal conditions, especially under serious anthropogenic disturbances. Previous studies have shown that the slope angle and aspect usually have important effects on species diversity. However, this study showed that the influence of slope on species diversity is weak. Over the years, anthropogenic activities have caused significant damage and greatly contributed to the proliferation of secondary vegetation. Consequently, the impact of human disturbance on species diversity has far exceeded that of aspect, slope, and other topographic factors. In addition to human disturbance, the relationship between species diversity and plant characteristics may also be attributed to seed dispersal, interspecific competition, and plant functional attributes. Additional studies on the relationship between species diversity and plant characteristics can provide a more comprehensive reference for species diversity conservation and vegetation restoration in Hainan.

Supplementary Materials

The following supporting information can be downloaded at: https://www.mdpi.com/article/10.3390/land11071047/s1, Figure S1: The accumulation curves of 13 studied sites.

Author Contributions

Conceptualization, Y.L.; methodology, M.Y.; software, M.Y.; validation, Y.L. and S.L.; formal analysis, M.Y.; investigation, S.L. and J.H.; resources, Y.L. and S.W.; data curation, S.W.; writing—original draft preparation, M.Y.; writing—review and editing, B.N.M. and Y.L.; visualization, M.Y.; supervision, Y.L.; project administration, Y.L.; funding acquisition, Y.L. All authors have read and agreed to the published version of the manuscript.

Funding

This research was funded by [the National Science and Technology Basic Work Project] grant number [2015FY1103002], [the National Natural Science Foundation of China] grant number [31961143023] and [the National Key Research and Development Program of China] grant number [2021YFF0703905].

Institutional Review Board Statement

Not applicable.

Informed Consent Statement

Not applicable.

Data Availability Statement

Not applicable.

Conflicts of Interest

The authors declare no conflict of interest.

References

  1. Li, D.Q. Biodiversity conservation strategies and priority area analysis in China. In Research and Methods in Ecohealth and Conservation; GDRI Ecosystem Health and Environmental Disease Ecology: Kunming, China, 2016. [Google Scholar]
  2. Pritchard, H.W.; Moat, J.F.; Ferraz, J.B.S.; Marks, T.R.; Camargo, J.L.C.; Nadarajan, J.; Ferraz, I.D.K. Innovative approaches to the preservation of forest trees. For. Ecol. Manag. 2014, 333, 88–98. [Google Scholar] [CrossRef] [Green Version]
  3. Tang, Z.Y.; Wang, Z.H.; Zheng, C.Y.; Fang, J.Y. Biodiversity in China’s mountains. Front. Ecol. Environ. 2006, 4, 347–352. [Google Scholar] [CrossRef]
  4. Zhao, G.S.; Liu, J.Y.; Kuang, W.H.; Ouyang, Z.; Xie, Z.L. Disturbance impacts of land use change on biodiversity conservation priority areas across China: 1990–2010. J. Geogr. Sci. 2015, 25, 515–529. [Google Scholar] [CrossRef] [Green Version]
  5. Zhang, Y.Q.; Uusivuori, J.; Kuuluvainen, J. Econometric analysis of the causes of forest land use changes in Hainan, China. Can. J. For. Res. 2000, 30, 1913–1921. [Google Scholar] [CrossRef]
  6. Guo, J.; Gong, P.; Dronova, I.; Zhu, Z. Forest cover change in China from 2000 to 2016. Int. J. Remote Sens. 2022, 43, 593–606. [Google Scholar] [CrossRef]
  7. Mi, X.C.; Feng, G.; Hu, Y.B.; Zhang, J.; Chen, L.; Corlett, R.T.; Hughes, A.C.; Pimm, S.; Schmid, B.; Shi, S.H.; et al. The global significance of biodiversity science in China: An overview. Natl. Sci. Rev. 2021, 8, nwab032. [Google Scholar] [CrossRef]
  8. Wan, J.Z.; Wang, C.J.; Qu, H.; Liu, R.; Zhang, Z.X. Vulnerability of forest vegetation to anthropogenic climate change in China. Sci. Total Environ. 2018, 621, 1633–1641. [Google Scholar] [CrossRef]
  9. Zhang, Z.J.; He, J.S.; Li, J.S.; Tang, Z.Y. Distribution and conservation of threatened plants in China. Biol. Conserv. 2015, 192, 454–460. [Google Scholar] [CrossRef]
  10. Liu, H.D.; Chen, Q.; Liu, X.; Xu, Z.Y.; Dai, Y.C.; Liu, Y.; Chen, Y.F. Variation patterns of plant composition/diversity in Dacrydium pectinatum communities and their driving factors in a biodiversity hotspot on Hainan Island, China. Glob. Ecol. Conserv. 2020, 22, e01034. [Google Scholar] [CrossRef]
  11. Zhu, Z.X.; Nizamani, M.M.; Sahu, S.K.; Kunasingam, A.; Wang, H.F. Tree abundance, richness, and phylogenetic diversity along an elevation gradient in the tropical forest of Diaoluo Mountain in Hainan, China. Acta Oecol. 2019, 101, 103481. [Google Scholar] [CrossRef]
  12. Zhu, L.; Sun, O.J.; Sang, W.G.; Li, Z.Y.; Ma, K.P. Predicting the spatial distribution of an invasive plant species (Eupatorium adenophorum) in China. Landsc. Ecol. 2007, 22, 1143–1154. [Google Scholar] [CrossRef]
  13. Kratochwil, A. Biodiversity in ecosystems: Some principles. In Tasks for Vegetation Science; Springer: Dordrecht, The Netherlands, 1999; Volume 34, pp. 5–38. [Google Scholar]
  14. Duffy, J.E.; Godwin, C.M.; Cardinale, B.J. Biodiversity effects in the wild are common and as strong as key drivers of productivity. Nature 2017, 549, 261–264. [Google Scholar] [CrossRef] [PubMed]
  15. Flynn, D.F.; Mirotchnick, N.; Jain, M.; Palmer, M.I.; Naeem, S. Functional and phylogenetic diversity as predictors of biodiversity-ecosystem-function relationships. Ecology 2011, 92, 1573–1581. [Google Scholar] [CrossRef] [PubMed] [Green Version]
  16. Cadotte, M.W.; Carscadden, K.; Mirotchnick, N. Beyond species: Functional diversity and the maintenance of ecological processes and services. J. Appl. Ecol. 2011, 48, 1079–1087. [Google Scholar] [CrossRef]
  17. Palmer, M.W. The coexistence of species in fractal landscapes. Am. Nat. 1992, 139, 375–397. [Google Scholar] [CrossRef]
  18. Xu, M.; Ma, L.; Jia, Y.Y.; Liu, M. Integrating the effects of latitude and altitude on the spatial differentiation of plant community diversity in a mountainous ecosystem in China. PLoS ONE 2017, 12, e0174231. [Google Scholar] [CrossRef]
  19. Stomp, M.; Huisman, J.; Mittelbach, G.G.; Litchman, E.; Klausmeier, C.A. Large-scale biodiversity patterns in freshwater phytoplankton. Ecology 2011, 92, 2096–2107. [Google Scholar] [CrossRef]
  20. Wu, A.C.; Deng, X.W.; Ren, X.L.; Xiang, W.H.; Zhang, L.; Ge, R.; Niu, Z.E.; He, H.L.; He, L.J. Biogeographic patterns and influencing factors of the species diversity of tree layer community in typical forest ecosystems in China. Acta Ecol. Sin. 2018, 38, 7727–7738. [Google Scholar]
  21. Fang, J.M. Spatial patterns of species diversity of seed plants in China and their climatic explanation. Biodiv. Sci. 2008, 16, 470. [Google Scholar] [CrossRef]
  22. Shi, J.X.; Xu, M.S.; Fang, X.C.; Zheng, L.T.; Zhang, Y.; Bao, D.F.; Yang, A.N.; Yan, E.R. Latitudinal variability and driving factors of functional diversity in Pinus thunbergii communities across sea-islands in Eastern China. Chin. J. Plant Ecol. 2021, 45, 163–173. Available online: https://www.plant-ecology.com/EN/Y2021/V45/I2/163 (accessed on 3 July 2022). [CrossRef]
  23. Vazquez, J.A.; Garnish, T.J. Altitudinal gradients in tropical forest composition, structure, and diversity in the Sierra de Mazatlán. J. Ecol. 1998, 86, 999–1020. [Google Scholar] [CrossRef]
  24. Liu, Z.; Li, Q.; Chen, D.D.; Shai, W.T.; Zhao, L.; Xu, S.X.; Zhao, X.Q. Patterns of plant species diversity along an altitudinal gradient and its effect on above-ground biomass in alpine meadows in Qinghai-Tibet Plateau. Biodiv. Sci. 2015, 23, 451–462. [Google Scholar] [CrossRef]
  25. Li, M.J.; He, Z.S.; Jiang, L.; Gu, X.G.; Jin, M.R.; Chen, B.; Liu, J.F. Distribution pattern and driving factors of species diversity and phylogenetic diversity along altitudinal gradient on the south slope of Daiyun Mountain. Acta Ecol. Sin. 2021, 41, 1148–1157. [Google Scholar] [CrossRef]
  26. Xu, Y.J.; Chen, Y.N.; Li, W.H.; Fu, A.H.; Ma, X.D.; Gui, D.W.; Chen, Y.P. Distribution pattern and environmental interpretation of plant species diversity in the mountainous region of Ili River Valley, Xinjiang, China. Chin. J. Plant Ecol. 2010, 34, 1142–1154. [Google Scholar]
  27. Qin, H.; Zhang, Y.B.; Dong, G.; Zhang, F. Altitudinal patterns of taxonomic, phylogenetic and functional diversity of f-orest communities in Mount Guandi, Shanxi, China. Chin. J. Plant Ecol. 2019, 43, 762–773. [Google Scholar] [CrossRef]
  28. Weng, C.L.; Zhang, T.T.; Wu, D.H.; Chen, S.W.; Jin, Y.; Ren, H.B.; Yu, M.J.; Luo, Y.Y. Drivers and patterns of α- and β-diversity in ten main forest community types in Gutianshan, eastern China. Biodiv. Sci. 2019, 27, 33–41. [Google Scholar] [CrossRef]
  29. Zhao, S.Q.; Fang, J.Y.; Zong, Z.J.; Zhu, B.; Shen, H.H. Composition, structure and species diversity of plant commun-ities along an altitudinal gradient on the northern slope of Mt. Changbai, Northeast China. Biodiv. Sci. 2004, 12, 164–173. [Google Scholar] [CrossRef]
  30. Tang, Z.Y.; Fang, J.Y. A review on the elevational patterns of plant species diversity. Biodiv. Sci. 2004, 12, 20–28. [Google Scholar] [CrossRef]
  31. Pianka, E.R. Latitudinal gradients in species diversity-a review of concepts. Am. Nat. 1966, 100, 33–46. [Google Scholar] [CrossRef]
  32. O’brien, E. Water-energy dynamics, climate, and predicting of woody plant species richness: An interim general model. J. Biogeogr. 1998, 25, 379–398. [Google Scholar] [CrossRef]
  33. Burke, A. Classification and ordination of plant communities of the Naukluft Mountains, Namibia. J. Veg. Sci. 2001, 12, 53. [Google Scholar] [CrossRef]
  34. Siefert, A.; Ravenscroft, C.; Althoff, D.; Alvarez, Y.; Carter, C.; Glennon, B.E.; Kelsey, L.; Heberling, J.; Mason, J.; Pontes, A.; et al. Scale dependence of vegetation-environment relationships: A meta-analysis of multivariate data. J. Veg. Sci. 2012, 23, 942–951. [Google Scholar] [CrossRef]
  35. Fang, J.Y.; Li, Y.D.; Zhu, B.; Liu, G.Y. Community structures and species richness in the montane rain forest of Jianfengling, Hainan Island, China. Biodiv. Sci. 2004, 12, 29–43. [Google Scholar] [CrossRef]
  36. Li, Y.P.; Xu, H.; Li, Y.D.; Luo, T.S.; Chen, D.X.; Zhou, Z.; Lin, M.X.; Yang, H.A. Scale-dependent spatial patterns of species diversity in the tropical montane rain forest in Jianfengling, Hainan Island, China. Chin. J. Plant Ecol. 2016, 40, 861–870. [Google Scholar] [CrossRef] [Green Version]
  37. Wang, X.X.; Long, W.X.; Yang, X.B.; Xiong, M.H.; Kang, Y.; Huang, J.; Hong, Z.L.; Zhou, Z.L.; Lu, Y.Q.; Fang, J.; et al. Patterns of plant diversity within and among three tropical cloud forest communities in Hainan Island. Chin. J. Plant Ecol. 2016, 40, 469–479. [Google Scholar] [CrossRef]
  38. Chen, G.D.; Tong, S.Y.; Du, S.J.; Zhong, S.Y.; Fu, R.; Wu, H.X.; Yu, X.B. Subforest species diversity and dominant population distribution pattern of secondary forest community under different felling lianas treatments. J. West China For. Sci. 2020, 49, 54–60. [Google Scholar]
  39. Hu, H.F.; Wang, Z.H.; Liu, G.H.; Fu, B.J. Vegetation carbon storage of major shrublands in China. Chin. J. Plant Ecol. 2006, 30, 539–544. [Google Scholar] [CrossRef]
  40. Spicer, R.A.; Herman, A.B.; Liao, W.; Spicer, T.E.V.; Kodrul, T.M.; Yang, J.; Jin, J.H. Cool tropics in the Middle Eocene: Evidence from the Changchang Flora, Hainan Island, China. Palaeogeogr. Palaeoclimatol. Palaeoecol. 2014, 412, 1–16. [Google Scholar] [CrossRef]
  41. Luo, W.Q.; Fu, S.H.; Yang, X.B.; Chen, Y.K.; Zhou, W.; Yang, Q.; Tao, C.; Zhou, W.S. Distribution patterns of alien invasive plants and their influences on native plants of Hainan Island. Chin. J. Plant Ecol. 2015, 39, 486–500. [Google Scholar] [CrossRef]
  42. Bremner, J.M. Nitrogen-total. In Methods of Soil Analysis: Part 3 Chemical Methods; Sparks, D.L., Ed.; SSSA: Madison, WI, USA, 1996; pp. 1085–1121. [Google Scholar] [CrossRef]
  43. Pierzynski, G.M. Methods of Phosphorus Analysis for Soils, Sediments, Residuals, and Waters; North Carolina State University: Manhattan, KS, USA, 2000. [Google Scholar]
  44. Jackson, M.L. Soil Chemical Analysis; Constable and Co. Ltd.: London, UK, 1962. [Google Scholar]
  45. Hurlbert, S.H. The non-concept of species diversity: A critique and alternative parameters. Ecology 1971, 52, 577–586. [Google Scholar] [CrossRef]
  46. Spellerberg, I.F.; Fedor, P.J. A tribute to Claude Shannon (1916–2001) and a plea for more rigorous use of species richness, species diversity and the ‘Shannon–Wiener’ Index. Glob. Ecol. Biogeogr. 2013, 12, 177–179. [Google Scholar] [CrossRef] [Green Version]
  47. Hill, M.O. Diversity and Evenness: A Unifying Notation and Its Consequences. Ecology 1973, 54, 427–432. [Google Scholar] [CrossRef] [Green Version]
  48. Fang, J.Y.; Wang, X.P.; Shen, Z.H.; Tang, Z.Y.; He, J.S.; Yu, D.; Jiang, Y.; Wang, Z.H.; Zheng, C.Y.; Zhu, J.L.; et al. Methods and protocols for plant community inventory. Biodiv. Sci. 2009, 17, 533–548. [Google Scholar]
  49. Shannon, C.E. A mathematical theory of communication. Bell Syst. Tech. J. 1948, 27, 379–423. [Google Scholar] [CrossRef] [Green Version]
  50. Simpson, E.H. Measurement of diversity. Nature 1949, 163, 688. [Google Scholar] [CrossRef]
  51. Pielou, E.C. The measurement of diversity in different types of biological collections. J. Theor. Biol. 1966, 13, 131–144. [Google Scholar] [CrossRef]
  52. Chao, A.; Chiu, C.H.; Jost, L. Unifying species diversity, phylogenetic diversity, functional diversity, and related similarity and differentiation measures through Hill numbers. Annu. Rev. Ecol. Evol. Syst. 2014, 45, 297–324. [Google Scholar] [CrossRef] [Green Version]
  53. Chao, A.; Gotelli, N.J.; Hsieh, T.C.; Sander, E.L.; Ma, K.H.; Colwell, R.K.; Ellison, A.M. Rarefaction and extrapolation with Hill numbers: A framework for sampling and estimation in species diversity studies. Ecol. Monogr. 2014, 84, 45–67. [Google Scholar] [CrossRef] [Green Version]
  54. Chao, A.; Jost, L. Coverage-based rarefaction and extrapolation: Standardizing samples by completeness rather than size. Ecology 2012, 93, 2533–2547. [Google Scholar] [CrossRef]
  55. Colwell, R.K.; Chao, A.; Gotelli, N.J.; Lin, S.Y.; Mao, C.X.; Chazdon, R.L.; Longino, J.T. Models and estimators linking individual-based and sample-based rarefaction, extrapolation and comparison of assemblages. J. Plant Ecol. 2012, 5, 3–21. [Google Scholar] [CrossRef] [Green Version]
  56. Hsieh, T.C.; Ma, K.H.; Chao, A. iNEXT: An R package for rarefaction and extrapolation of species diversity (Hill numbers). Methods Ecol. Evol. 2016, 7, 1451–1456. [Google Scholar] [CrossRef]
  57. Roberts, D.W.; Cooper, S.V. Concepts and techniques of vegetation mapping. In Proceedings of the Land Classifications Based on Vegetation: Applications for Resource Management, Moscow, ID, USA, 17–19 November 1987; pp. 90–96. [Google Scholar]
  58. Von, W.H.; Hanspach, J.; Bruelheide, H.; Wesche, K. Pluralism and diversity: Trends in the use and application of ordination methods 1990–2007. J. Veg. Sci. 2009, 20, 695–705. [Google Scholar] [CrossRef]
  59. Kucuk, A.; Clare, A.G.; Jones, L. An estimation of the surface tension for silicate glass melts at 1400 C using statistical analysis. Glass Technol. 1999, 40, 149–153. [Google Scholar]
  60. Patiño, J.; González-Mancebo, J.M. Exploring the effect of host tree identity on epiphyte bryophyte communities in different Canarian subtropical cloud forests. Plant Ecol. 2011, 212, 433–449. [Google Scholar] [CrossRef]
  61. Blanchet, F.G.; Legendre, P.; Borcard, D. Forward selection of explanatory variables. Ecology 2008, 89, 2623–2632. [Google Scholar] [CrossRef]
  62. Xu, H.; Li, Y.D.; Luo, T.S.; Chen, D.X.; Lin, M.X. Environmental factors correlated with species diversity in different tropical rain forest types in Jianfengling, Hainan Island, China. Chin. J. Plant Ecol. 2013, 37, 26–36. [Google Scholar] [CrossRef]
  63. Deng, L.P.; Bai, X.J.; Qin, S.J.; Wei, Y.W.; Zhou, Y.B.; Li, L.L.; Niu, S.S.; Han, M.N. Spatial distribution and scale effect of species diversity of secondary forests in montane region of eastern Liaoning Province, China. Chin. J. Appl. Ecol. 2016, 27, 2197–2204. [Google Scholar] [CrossRef]
  64. Strong, W.L. Biased richness and evenness relationships within Shannon–Wiener index values. Ecol. Indic. 2016, 67, 703–713. [Google Scholar] [CrossRef]
  65. Hill, T.C.J.; Walsh, K.A.; Harris, J.A.; Moffett, B.F. Using ecological diversity measures with bacterial communities. FEMS Microbiol. Ecol. 2003, 43, 1–11. [Google Scholar] [CrossRef]
  66. Jost, L. Partitioning diversity into independent alpha and beta components. Ecology 2007, 88, 2427–2439. [Google Scholar] [CrossRef] [Green Version]
  67. Tang, L.L.; Yang, T.; Liu, H.Y.; Kuang, M.Y.; Wang, R.Q.; Zhang, F.; Gao, X.M.; Yue, M.; Zhang, M.; Zheng, P.F.; et al. Distribution and species diversity patterns of Vitex negundo var. heterophylla Shrublands in North China. Chin. J. Plant Ecol. 2019, 43, 825–833. [Google Scholar] [CrossRef]
  68. Ma, B.; Zhou, Z.Y.; Zhang, L.L.; Gao, W.X.; Chen, S.K.; Zhang, B.L. The spatial distribution characteristics of plant diversity in Alex Left Banner. Acta Ecol. Sin. 2008, 28, 6099–6106. [Google Scholar]
  69. Lü, L.S.; Cai, H.Y.; Yang, Y.; Wang, Z.H.; Zeng, H. Geographic patterns and environmental determinants of gymnosperm species diversity in China. Biodiv. Sci. 2018, 26, 1133–1146. [Google Scholar] [CrossRef] [Green Version]
  70. Wang, D.B.; Ji, S.Y.; Chen, F.P. A review on the species diversity of plant community. Chin. J. Ecol. 2001, 20, 55–60. [Google Scholar]
  71. Frelich, L.E.; Calcote, R.R.; Davis, M.B.; Pastor, J. Patch formation and maintenance in an old-growth hemlock-hardwood forest. Ecology 1993, 74, 513–527. [Google Scholar] [CrossRef]
  72. Gong, H.D.; Yang, G.P.; Lu, Z.Y.; Liu, Y.H. Diversity and spatial distribution patterns of trees in an evergreen broad-leaved forest in the Ailao Mountains, Yunnan. Biodiv. Sci. 2011, 19, 143–150. [Google Scholar] [CrossRef]
  73. He, J.S. Plant species diversity of the degraded ecosystems in the three gorges region. Acta Ecol. Sin. 1998, 18, 399–407. [Google Scholar]
  74. Sha, W.; Dong, S.K.; Liu, S.L.; Liu, Q.R.; Shi, J.B.; Li, X.W.; Su, X.K.; Wu, Y. Spatial patterns of plant community biomass and species diversity in Aerjin Mountain Nature Reserve and their influencing factors. Chin. J. Ecol. 2016, 35, 330–337. [Google Scholar]
  75. Wang, A.S.; Ma, J.J.; Gong, H.D.; Fan, G.A.; Wang, M.; Zhao, H.M.; Cheng, J.H. Patterns and drivers of species richness of early spring annual ephemeral plants in northern Xinjiang. Biodiv. Sci. 2021, 29, 735–745. [Google Scholar] [CrossRef]
  76. Hawkins, B.A.; Field, R.; Cornell, H.V.; Currie, D.J.; Guégan, J.-F.; Kaufman, D.M.; Kerr, J.T.; Mittelbach, G.G.; Oberdorff, T.; O’Brien, E.M.; et al. Energy, water, and broad-scale geographic patterns of species richness. Ecology 2003, 84, 3105–3117. [Google Scholar] [CrossRef] [Green Version]
  77. Crick, J.C.; Grime, J.P. Morphological plasticity and mineral nutrient capture in 2 herbaceous species of contrasted ecology. N. Phytol. 1987, 107, 403–414. [Google Scholar] [CrossRef] [PubMed]
  78. Brosofske, K.D.; Chen, J.; Crow, T.R. Understory vegetation and site factors: Implications for a managed Wisconsin landscape. For. Ecol. Manag. 2001, 146, 75–87. [Google Scholar] [CrossRef]
  79. Zhou, R.H.; Su, T.C.; Yu, J.; Xiang, L.; Chen, C.L.; Zhang, H.W.; Li, J.; Hao, J.F. Species diversity and soil physicochemical properties of different communities in Bifengxia evergreen broad-leaved forest. Chin. J. Ecol. 2021, 41, 1–8. [Google Scholar]
  80. Zheng, L.T.; Su, T.; Liu, X.Y.; Yin, F.; Guo, C.; Tuo, B.; Yan, E.R. Species, functional, structural diversity of typical plant communities and their responses to environmental factors in Miao Archipelago, China. Chin. J. Appl. Ecol. 2018, 29, 343–351. [Google Scholar]
  81. Li, C.Y.; Zhang, W.J.; Lai, Z.M.; Peng, F.; Chen, X.J.; Xue, X.; Wang, T.; You, Q.G.; Du, H.Q. Plant productivity, species diversity, soil properties, and their relationships in an alpine steppe under different degradation degrees at the source of the Yellow River. Acta Ecol. Sin. 2021, 41, 4541–4551. [Google Scholar]
  82. Long, W.X.; Yang, X.D.; Li, D.H. Patterns of species diversity and soil nutrients along a chronosequence of vegetation recovery in Hainan Island, South China. Ecol. Res. 2012, 27, 561–568. [Google Scholar] [CrossRef]
  83. Zou, Y.J. Study on Distribution Characteristics of Organic Carbon and Total Nitrogen in Shrub Ecosystem of Hainan Island; Hainan University: Hainan, China, 2017. [Google Scholar]
Figure 1. The distribution of sample plots. Note: The distribution of 13 sample plots in Wanning, Qiongzhong, Qionghai, Changjiang, Wenchang, Chengmai, Danzhou, and Lingao, Hainan, China. The specific information of the sample is listed in Table 1.
Land 11 01047 g001
Figure 2. The species diversity indices change along the longitude and latitude. Note: • represents one of 13 sample plots.
Land 11 01047 g002
Figure 3. The Redundancy Analysis ordination diagram of species diversity indices and environmental factors. Note: AVMAT: annual variation of mean annual temperature; MAP: annual mean precipitation; As: aspect; SOC: soil organic carbon; TN: soil total nitrogen; TP: soil total phosphorus. Numbers 1–13 represent the 13 samples listed in Table 1.
Land 11 01047 g003
Table 1. The physical characteristics of the sample plots.
Plot No.LatitudeLongitudeElevation
(m−1)
Exposure
(°)
Slope (°)Dominant Species
118.79110.531524510Embelia laeta, Flacourtia indica
218.81110.5223516025Pandanus tectorius
318.89109.813474030Rhodomyrtus tomentosa
419.07110.29562805Rhodomyrtus tomentosa
519.12110.23181473Flueggea virosa
619.37108.6952080Opuntia, Clerodendrum inerme
719.38108.6882080Opuntia, Pandanus tectorius
819.57110.76201405Mallotus paniculatus
919.65109.881101185Rhodomyrtus tomentosa, Ternstroemia microphylla
1019.68109.2142780Rhodomyrtus, Vitex trifolia
1119.70109.98948810Rhodomyrtus tomentosa
1219.83109.80108800Rhodomyrtus tomentosa
1319.90109.5222790Rhodomyrtus
Table 2. The correlation between species diversity indices and environmental factors.
Variableln (Species Richness)Exponential of ShannonInverse of Simpson Pielou Evenness Index
MAT/°C−0.336 ns −0.029 ns 0.049 ns 0.055 ns
MTWQ/°C−0.310 ns 0.045 ns 0.139 ns 0.149 ns
MTCQ/°C−0.286 ns −0.116 ns −0.071 ns −0.093 ns
AVMAT/°C0.140 ns 0.305 ns 0.326 ns 0.290 ns
MAP/mm0.729 ** 0.225 ns 0.075 ns −0.321 ns
PDQ/mm0.745 ** 0.149 ns −0.025 ns −0.335 ns
PWQ/mm0.678 * 0.211 ns 0.075 ns −0.350 ns
Pcov−0.701 ** −0.122 ns 0.044 ns 0.356 ns
Elevation0.125 ns −0.021 ns −0.069 ns −0.243 ns
Aspect−0.254 ns −0.335 ns −0.314 ns −0.149 ns
Slope0.013 ns −0.235 ns −0.288 ns −0.355 ns
SOC−0.067 ns −0.486 ns −0.491 ns −0.595 *
TN−0.349 ns 0.295 ns 0.434 ns 0.561 *
TP−0.089 ns −0.411 ns −0.409 ns −0.478 ns
C/N0.294 ns −0.173 ns −0.274 ns −0.309 ns
N/P−0.247 ns 0.406 ns 0.523 ns 0.642 *
C/P0.062 ns 0.239 ns 0.245 ns 0.240 ns
pH value −0.043 ns 0.137 ns 0.170 ns 0.283 ns
Note: * p < 0.05; ** p < 0.01; ns, p > 0.05. MAT: annual mean temperature; MTWQ: mean temperature of the warmest quarter; MTCQ: coldest season mean temperature of the coldest quarter; AVMAT: annual variation of mean annual temperature; MAP: annual mean precipitation; PDQ: precipitation of driest quarter; PWQ: precipitation of wettest quarter; Pcov: precipitation variability coefficient (seasonality of variation); SOC: soil organic carbon; TN: soil total nitrogen; TP: soil total phosphorus.
Table 3. Results obtained through the Redundancy Analysis ordination and the Monte Carlo permutation test.
FactorCorrelation with RDA Ordination AxesMonte Carlo Permutation Test
Axis1Axis2R2p-Value
AVMAT/°C0.053 −0.001 0.103 0.576
MAP/mm0.325 0.107 0.588 0.021 *
Aspect0.112 −0.113 0.346 0.114
SOC−0.175 −0.194 0.265 0.215
TN0.276 −0.229 0.531 0.025 *
TP0.011 0.201 0.180 0.376
pH value0.000 0.141 0.049 0.779
DCA0.4760.208
RDA5.2660.171
Percentage explainable of species data62.62.0
Cumulative proportion of species–environment relationships62.664.6
Note: * Represents significant correlation (α = 0.05); AVMAT: annual variation of mean annual temperature; MAP: annual mean precipitation; SOC: soil organic carbon; TN: soil total nitrogen; TP: soil total phosphorus; DCA: Detrended Correspondence Analysis; RDA: Redundancy Analysis.
Publisher’s Note: MDPI stays neutral with regard to jurisdictional claims in published maps and institutional affiliations.

