Article

Systematicity and Stability Analysis of Land Use Change—Taking Jinan, China, as an Example

School of Land Science and Technology, China University of Geosciences, Beijing 100083, China
*
Author to whom correspondence should be addressed.
Land 2022, 11(7), 1045; https://doi.org/10.3390/land11071045
Submission received: 8 June 2022 / Revised: 25 June 2022 / Accepted: 5 July 2022 / Published: 9 July 2022

Abstract

:
The study of the systematic stability of land use change is essential for regulating land use results and layout. This article took Jinan, China, as an example, and used the land transfer matrix to calculate the changing area and intensity based on remote sensing image maps and land use status maps, and then used the intensity analysis method to compare the changing intensity with the average intensity at three levels: interval level, land category level, and transition level. The systematicity and stability of land use changes from 2005 to 2018 in Jinan were analyzed using intensity analysis. The results showed that the intensity of land use change in Jinan led to a rapid change pattern from 2005 to 2010 and a slow change pattern from 2010 to 2018. The occupation of cultivated land by construction land in Jinan showed high activity, while the transition process of cultivated land to construction land and other land categories showed a steady, systematic change pattern, other land categories showed different trends and intensities of change, and the transition of forest land and other land categories showed stability in time scale. The results showed that the changes in construction land were mainly due to external influences, showing a systematic non-steady change pattern.

1. Introduction

Land use or land cover change (LUCC) is an essential component and one of the leading causes of global environmental change [1]. It has a significant impact on natural and socio-economic processes such as global carbon sink [2], ecosystem change [3], species diversity, and food security [4,5]. Since the beginning of the new century, LUCC research has always been the frontier and hotspot of geographical research [1]. A scientific understanding of the patterns, mechanisms, and effects behind the process of land use change may help to build sustainable urban development strategies and management policies [5]. As a standard method to study land use change, the land use transfer matrix can comprehensively and concretely analyze the quantitative structure characteristics of regional land use change and the direction of local category change [6,7,8,9,10]. The land category transformation law it contains is an essential basis for studying land use intensity change [11]. However, the land use transfer matrix cannot reveal the internal interaction process between humans and the environment in land use change, nor can it systematically conduct in-depth research on the transfer matrix formed by multiple continuous time intervals [10,11,12]. For this reason, Aldwaik et al. [13] proposed a framework for analyzing the intensity of land use change based on the transfer matrix. Based on the land use transfer matrix, the size and intensity of land use change are analyzed from three aspects: interval level, land category level, and transition level [11]. The intensity of the transition area in the land category is calculated from the perspective of the system theory [6]. Subsequently, Pontius provides an in-depth interpretation of the four aspects of intensity analysis and analyzes the problems that can be solved by intensity analysis in addressing land use change processes. Mallinis G et al. [14] applied intensity analysis to a study of land use change in the Panita and Penteli Mountains in the Athens metropolitan area of Attica, Greece, and analyzed its association with concurrent human disturbances (activities) and other major socioeconomic developments in the area. Huang et al. [15] applied this method for the first time in China, studying the processes and patterns of land use change in the Jiulong River basin in southeastern China from the 1986–2007 land use change processes and patterns [5], and explored the relationship between land cover change and the overall economy and recent agriculture in the region. Mallinis et al. (2014) conducted a comparative study of land use and vegetation cover change (LUCC) over the last 62 years in two districts, Parnitha and Penteli, using intensity analysis at multiple levels. Sun, Yunhua [6] et al. applied this framework to study Kunming City and conducted an in-depth analysis of stability at different levels based on intensity analysis. Jianxin Yang [5] et al. on the other hand, applied an improved analytical framework to characterize the structural changes in land use in Wuhan city. Niu Lele et al. [11] used this framework to explore in depth the process and pattern of land use intensity change at different levels in Haixi Prefecture, Qinghai Province, revealing the current status of land use in ecologically fragile areas and organically integrating the land use change process with natural and human activities.
The intensity analysis theory is mature, but domestic scholars still study land use change relatively infrequently [11]. As the capital of Shandong Province and one of the [15] sub-provincial cities in China, Jinan is located in an essential geographical location, bordering the capital economic circle in the north, the Yangtze River Delta economic circle in the south, the Shandong Peninsula in the East, and Central China in the West [16]. Thanks to the strong support of national resources and policies, Jinan has developed rapidly in recent years. In 2018, Jinan’s GDP grew by 7.4% year-on-year, one percentage point higher than that of the province, accounting for 10.27% of the provincial share. On a per capita basis, Jinan’s GDP per capita exceeded 100,000 yuan for the first time in 2018, reaching 106,302 yuan, a gain of 5.7%. Rapid urbanization has also changed the spatial and temporal patterns and characteristics of land use change in Jinan. Because of this, this article aimed at the intensity and stability of land use change in Jinan. It established four spatial attribute databases in 2005, 2010, 2015, and 2018 with the support of ArcGIS10.2 (California, United States) and other software, used land use change data, and used the research methods of the land transfer matrix and intensity analysis to analyze the remote sensing data in the time intervals of 2005–2010, 2010–2015, and 2015–2018. The results explain the patterns and processes of land use change according to the results of the analysis of land use change intensity [5], and deeply explore which changes are steady, which changes tend to be system steady due to the intense change drive of the outside world (including natural and human activities), and which are non-system and unsteady. It is expected to provide a theoretical basis for sustainable land use and management, the regulation of land use results, and the layout in Jinan in the future, to realize the optimal allocation of resources, maintain the stability of the ecosystem, and coordinate the development of human and land.

2. Data Sources and Method

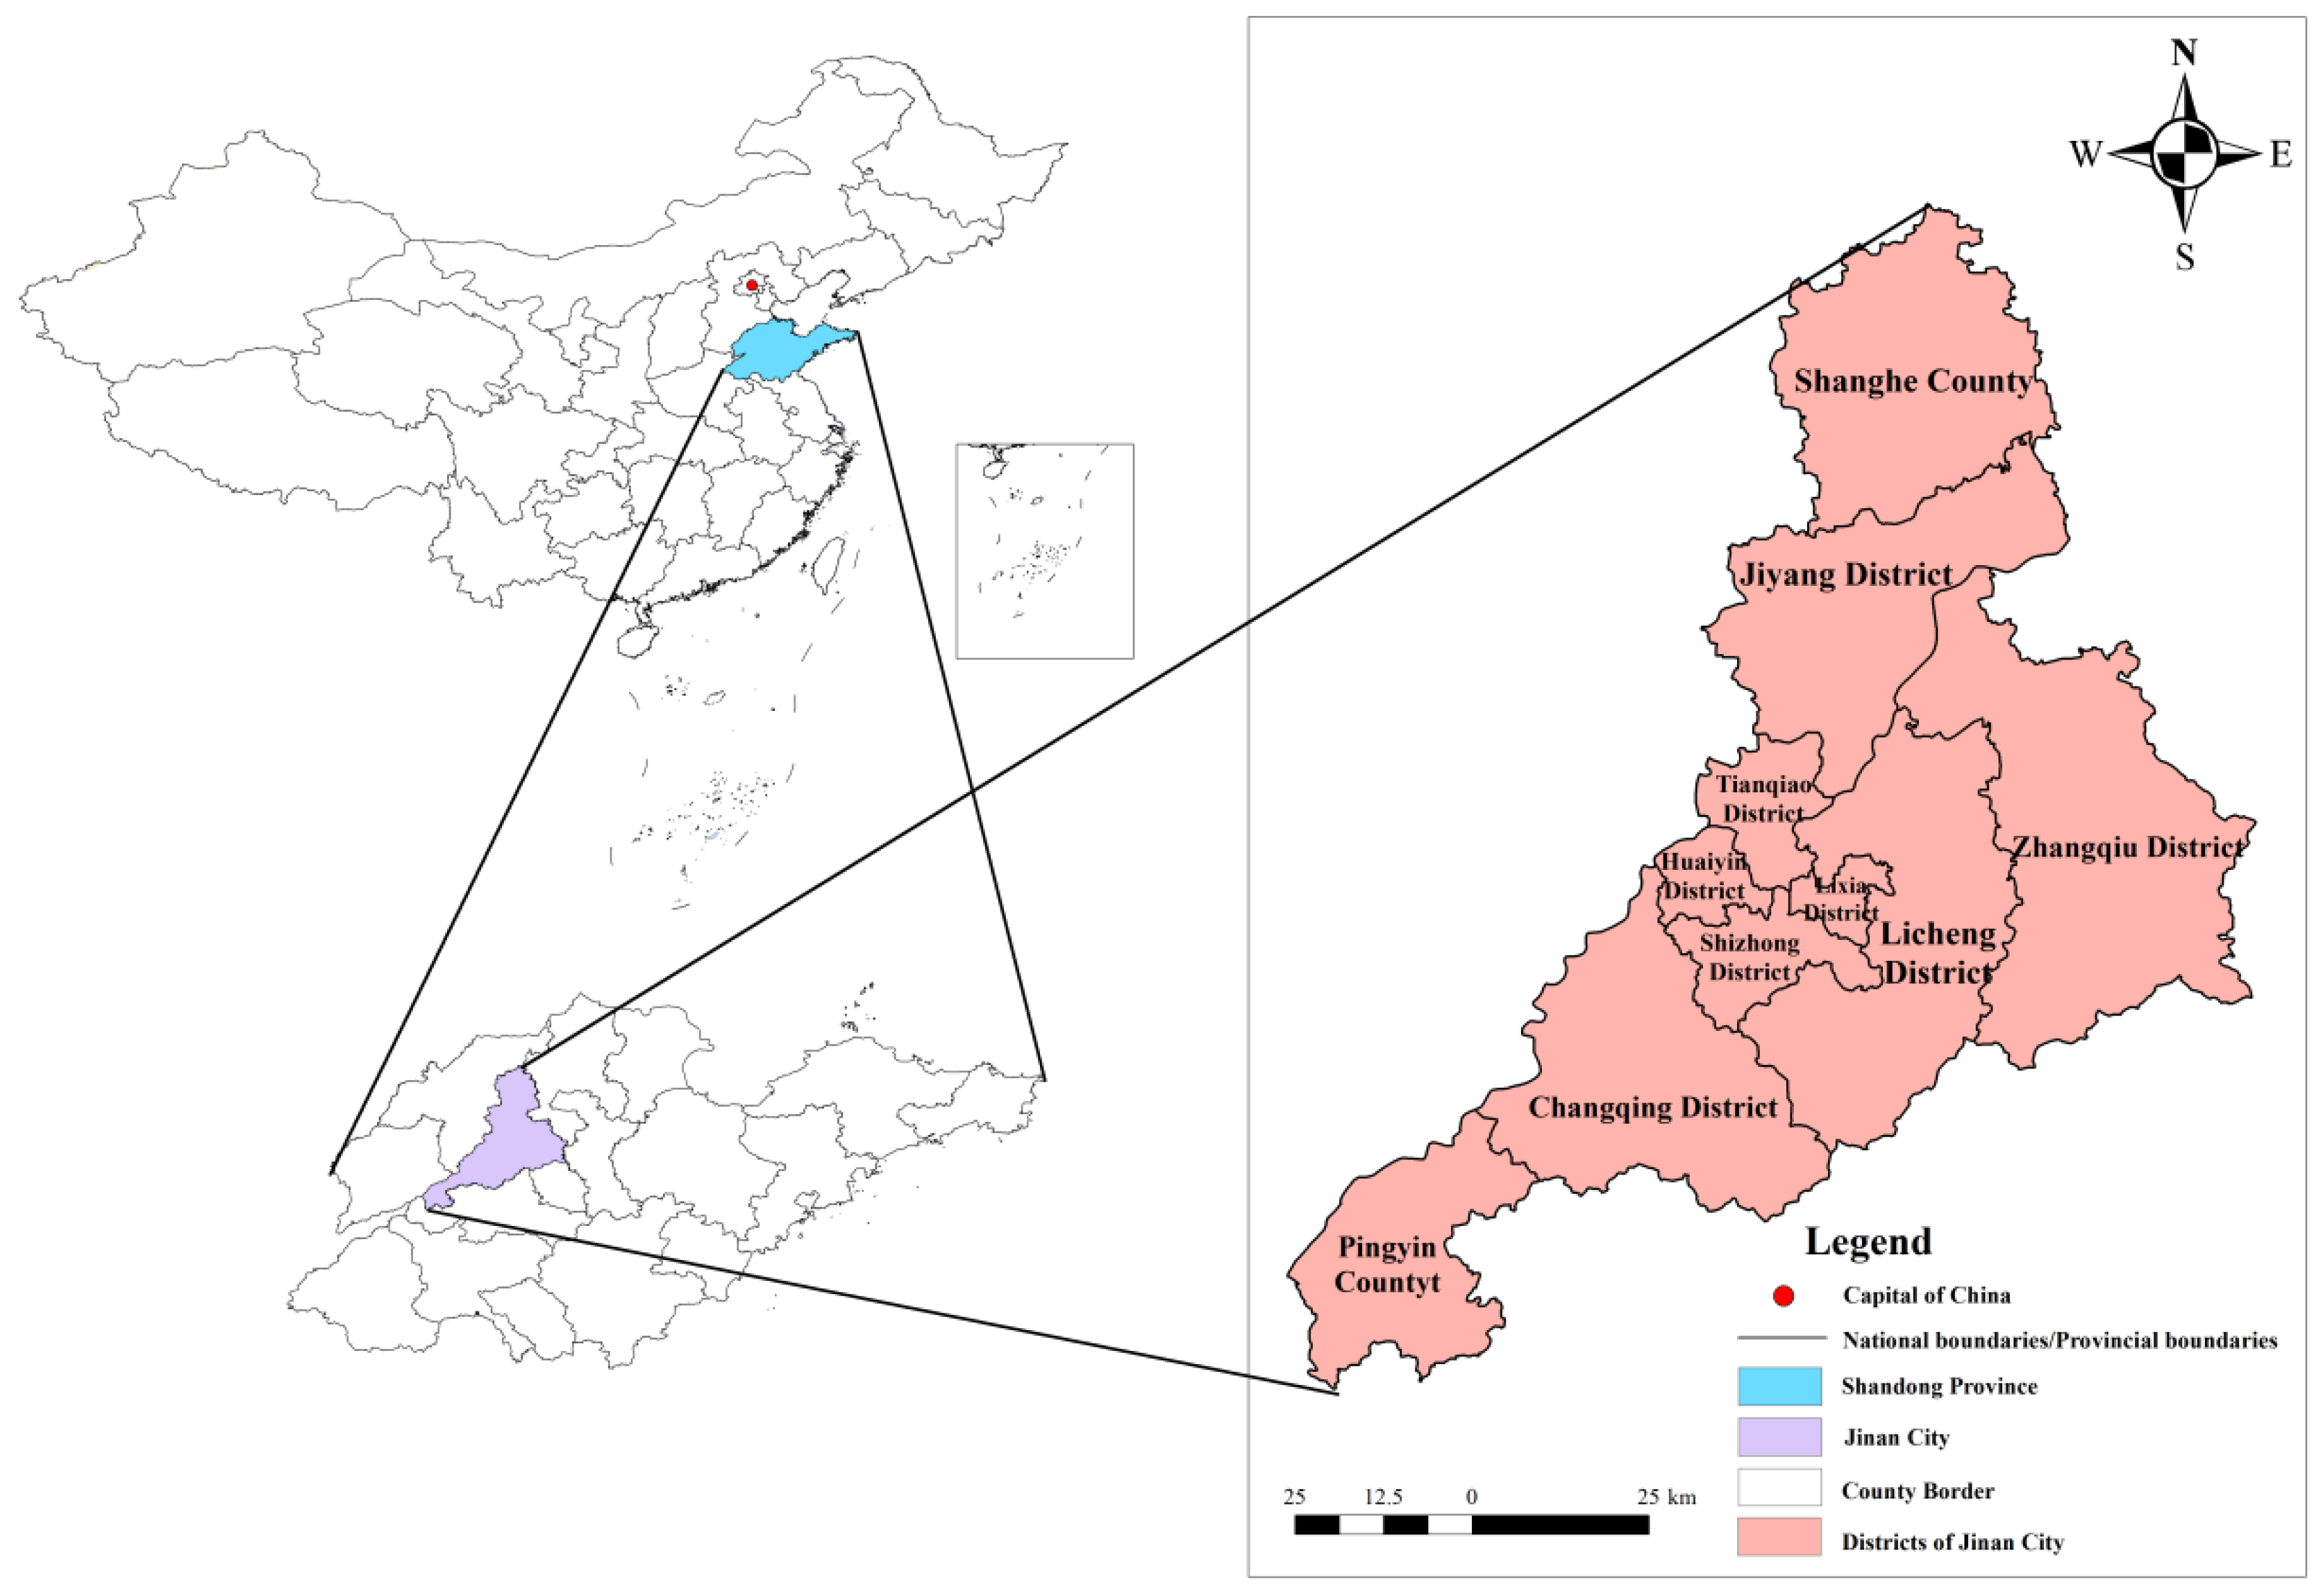
2.1. Overview of the Study Area
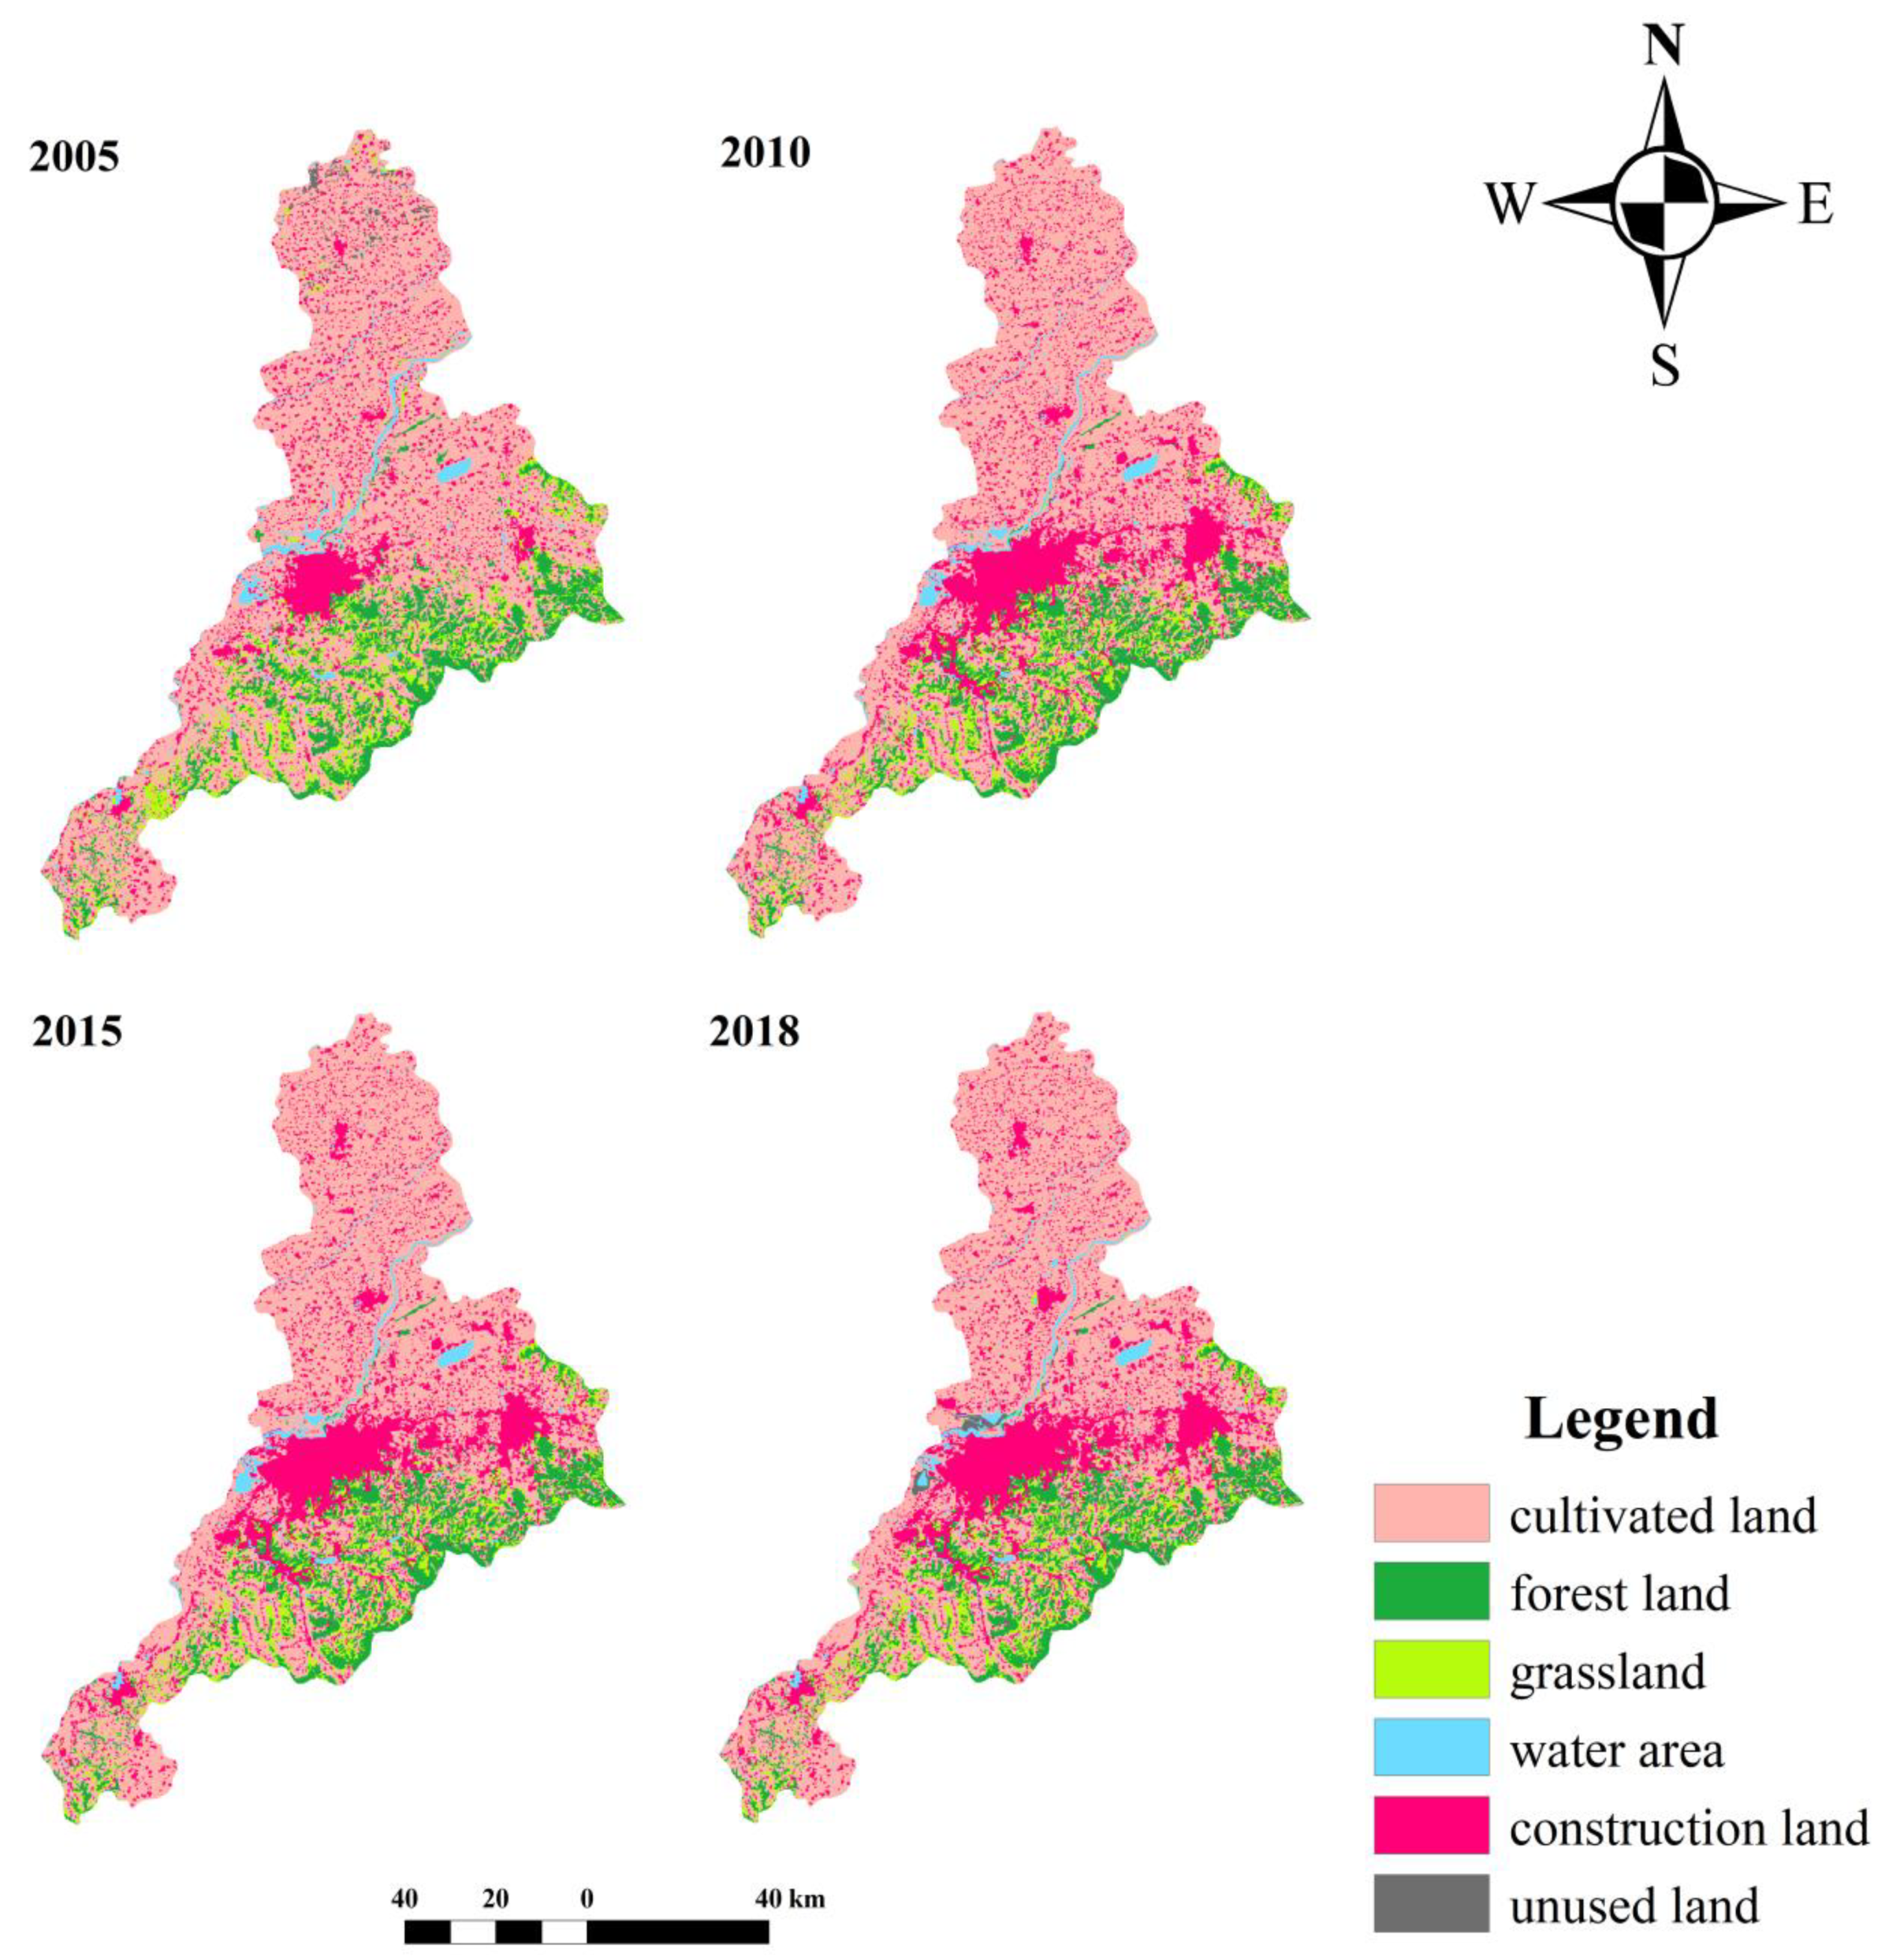
Jinan is located in the central and western parts of Shandong Province. It is adjacent to Mount Tai in the south and the Yellow River in the north. It is located at the junction of low mountains and hills in central and southern Shandong and alluvial plains in northern Shandong. The terrain is high in the south and low in the north [17,18] (Figure 1). As the capital of Shandong Province, Jinan is the political, economic, and cultural center of the province, relying on its own geographical and social conditions, Jinan is also the central city in the south wing of the Bohai Rim, the core city of Shandong Peninsula Urban Agglomeration and Jinan Metropolitan area. Jinan is also the principal city on the south wing of the Bohai Sea, the core city of Shandong Peninsula Urban Agglomeration and Jinan Metropolitan area. By the end of 2018, Jinan had jurisdiction over Lixia District, Shizhong District, Huaiyin District, Tianqiao District, Licheng District, Changqing District, Zhangqiu District, Jiyang District, Pingyin County, and Shanghe County. At the end of 2019 and the beginning of 2020, the permanent population was 8.9087 million, a gain of 0.78% since the end of the previous year. The registered residence population was 7.9674 million, a gain of 1.46%. In terms of land distribution, agricultural land in Jinan is distributed in all districts and counties, and Zhangqiu City, Licheng District, and Changqing District account for a large proportion; Zhangqiu City has the most construction land, which is widely distributed; in other land areas, Zhangqiu City ranks first with 15,643 hm2, and the reserve resources are relatively abundant. As a critical city for transforming new and old kinetic energy, Jinan has made some achievements in economic development in recent years. Still, the rapid economic growth has also brought about drastic changes in land use.
In January 2019, the State Council approved Shandong Province to adjust the administrative division of Laiwu City of Jinan City, revoke Laiwu City, and put its jurisdiction under the jurisdiction of Jinan City. However, the time interval of the past three years is short, and the land use and cover changes are not obvious. Therefore, the four phases of land use data of the original administrative division of Jinan City were used to analyze the intensity, systematicity, and stability of land use changes.

2.2. Data Sources

The land use change data of China’s Shandong Province in 2005, 2010, 2015, and 2018 on a scale of 1:100,000 provided by the China scientific resources and environmental science data center were used, and the primary classification system was adopted, including cultivated land, forest land, grassland, water area, construction land, and unused land. Through the leading technologies such as remote sensing monitoring (ENVI5.3, California, United States) and geographic information system (ArcMap10.6, California, United States), the four phases of land use remote sensing data of Shandong Province in 2005, 2010, 2015, and 2018 and the boundary vector file of Jinan City were used to merge and crop the land categories to obtain the four phases of land use data of Jinan City (Figure 2).

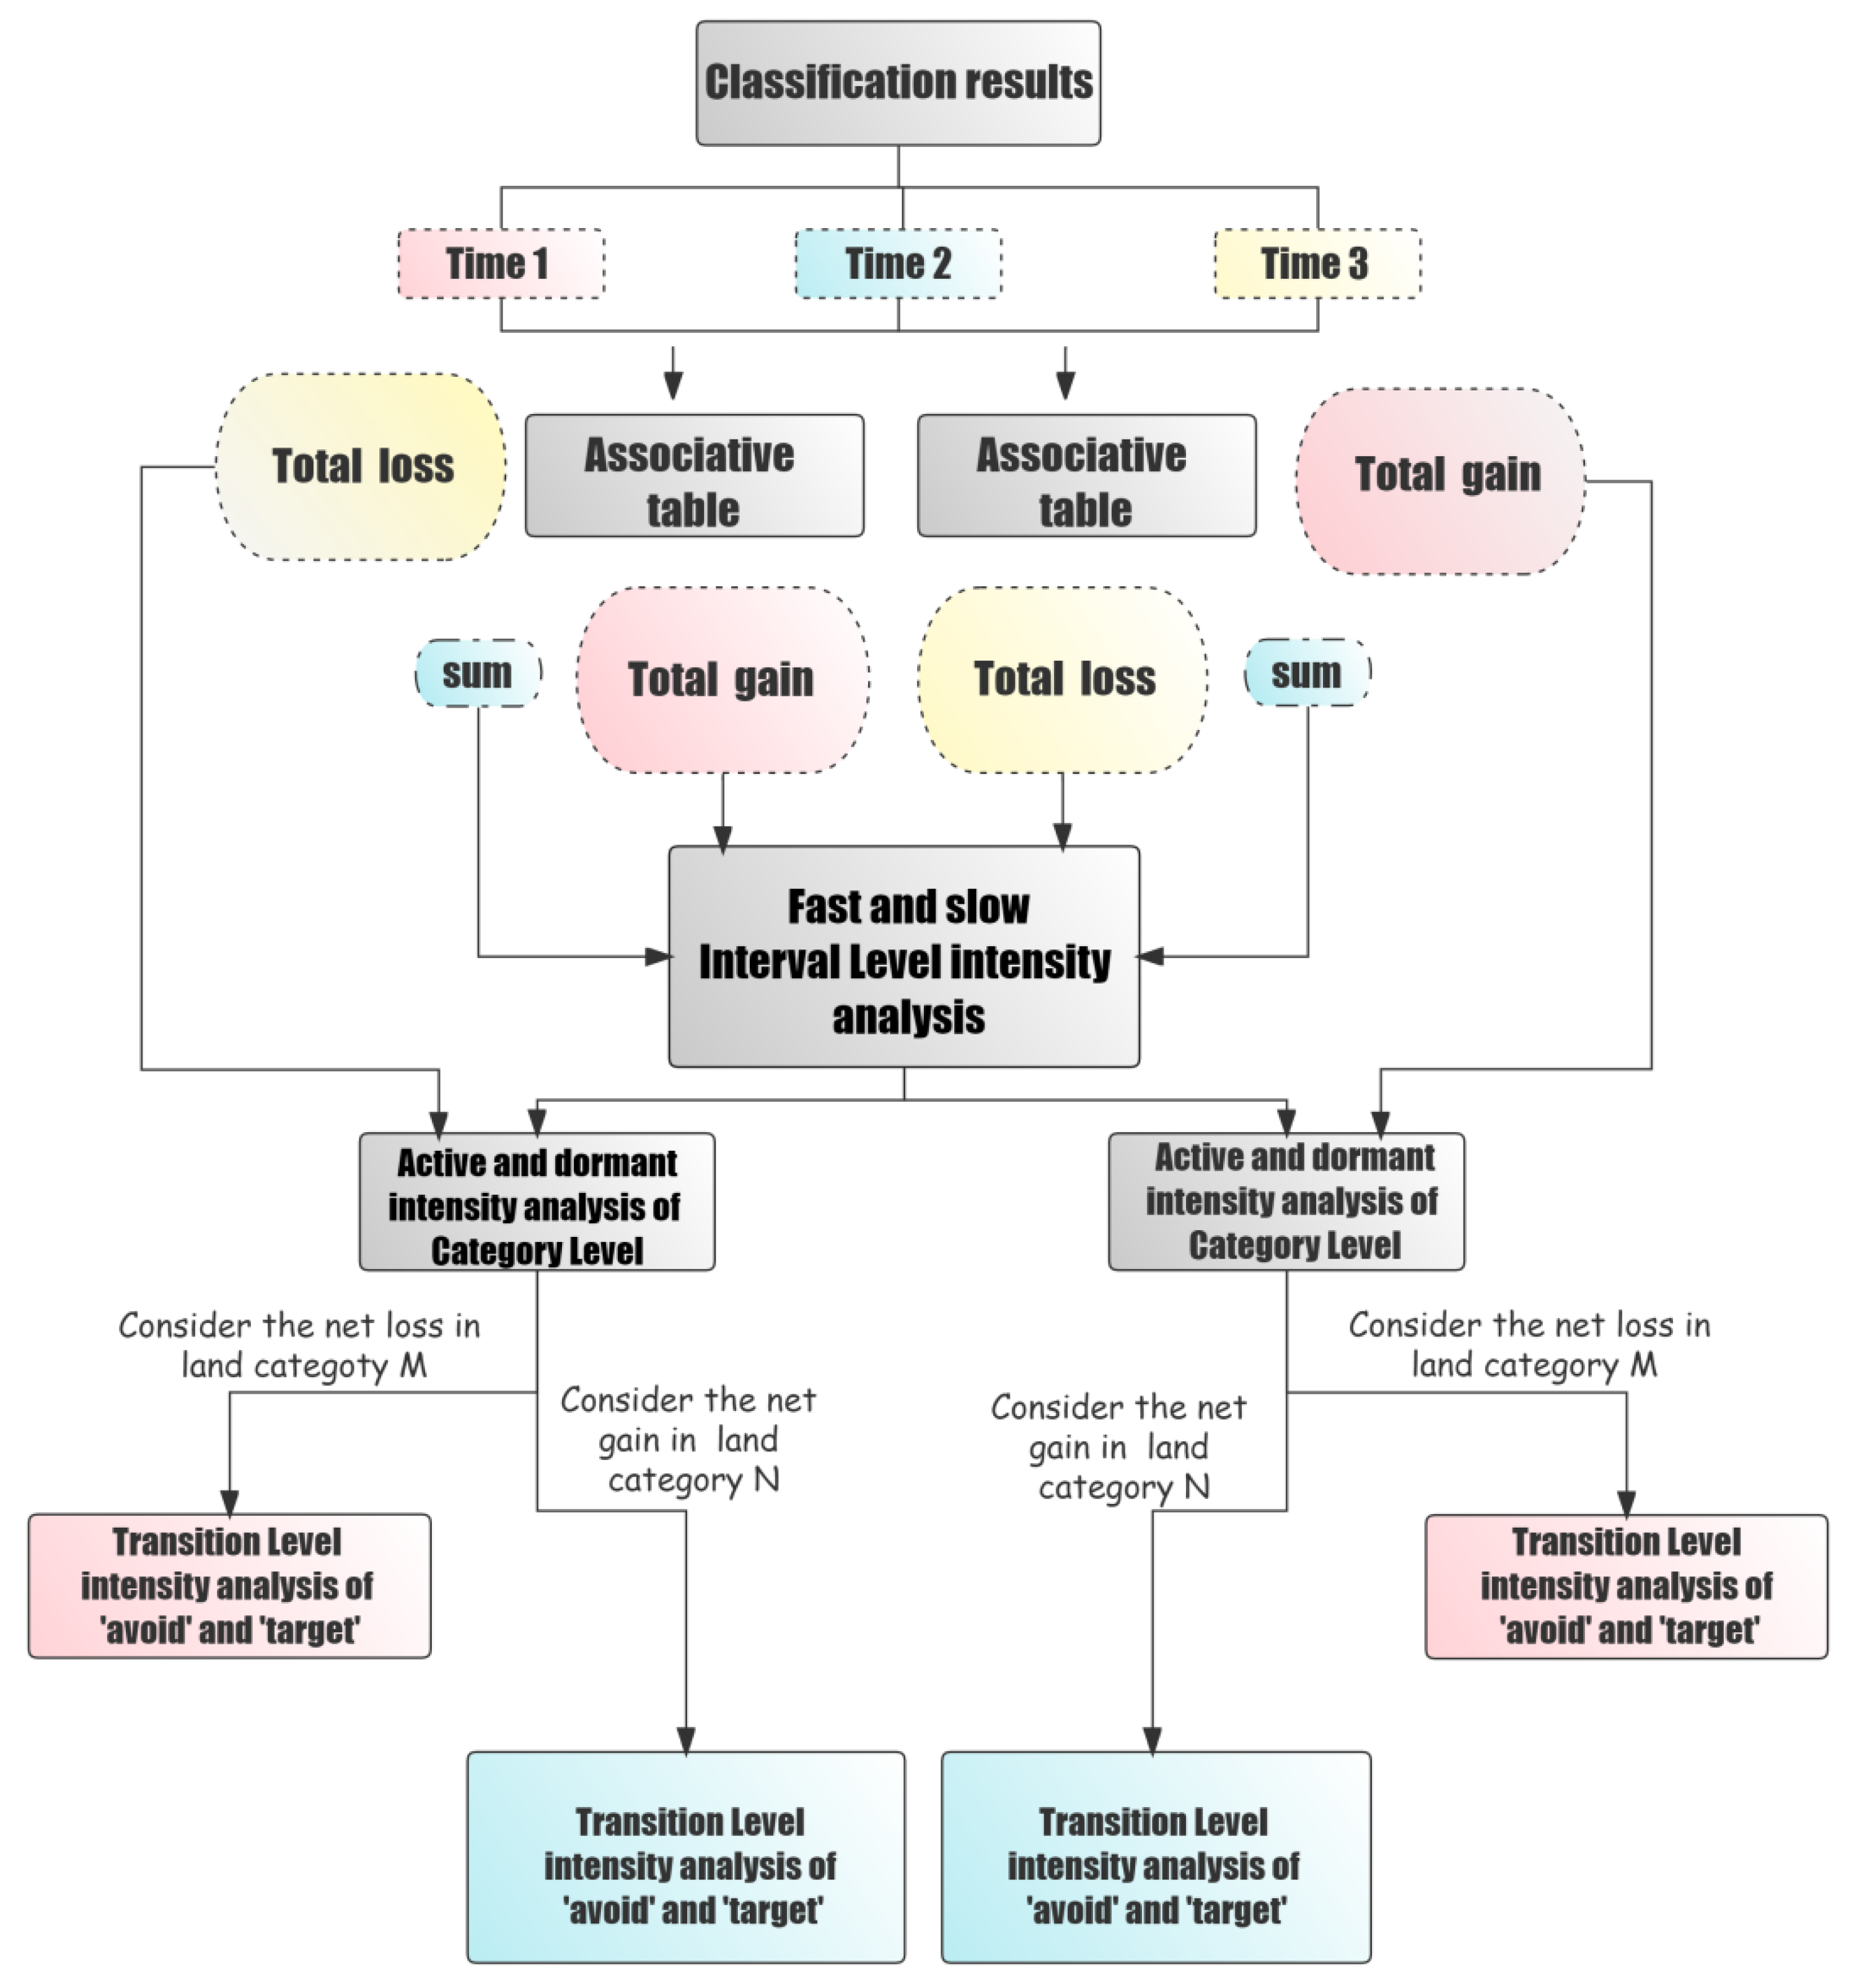
2.3. Intensity Analysis

This article used land use intensity to analyze information on changes in the quantity, structure, and direction of land transition in the study area. In the meantime, the analysis of land use structure was used to understand the primary land use types in the study area and the total area change of each category. Since the transition between land categories is affected by the extent of land use types, however, the judgment of whether a transition is advantageous only by the size of the transition area is incomplete. Intensity analysis is a top-down interpretive framework structure for analyzing differences in variability between land categories [19,20]. Intensity analysis gives a direct interpretation on the one hand, and on the other hand, provides a deeper understanding of remote sensing image interpretation maps from multiple periods and multiple land use types to improve the accuracy of the study [21]. This interpretive framework has been widely used [21,22,23]. Combining the remote sensing image map and the land use change maps, the intensity analysis method based on the land transfer matrix can systematically reflect the impact of the land use change process on human development, the resources, and the environment.
Figure 3 is the technical flow chart of intensity analysis, and Table 1 gives the mathematical notes and their meanings used in intensity analysis. The intensity analysis is conducted by making a correlation table for each consecutive time interval from the results of remote sensing image interpretation for each time interval, calculating the total gain area of each land class and the total loss area of each land category, and calculating the total change area of each time interval. The intensity analysis of the interval levels was established by comparing the area change and intensity change of each time interval. The average change intensity ratio of multiple levels, called average change intensity, was also calculated.
The intensity analysis includes three levels: interval level, land category level, and transition level. Among the 3 levels of intensity analysis, the later level is a detailed explanation of the earlier level and the earlier level is a supplement to the later level; the 3 levels together explain the land use change process and the interaction mechanism, and also help to link the land use change process with the graph.

2.3.1. Interval Level

The interval level mainly reflects the relationship between land use change area S, change intensity St and average change intensity U in the whole time interval. Through calculation and visualization, the situation of each time interval change in the entire study period is obtained, which is described as fast or slow. As shown in Formulas (1) and (2), if LUCC is steady during the study period, S values in all time intervals are equal, then St = U; if LUCC changes rapidly during the study period, St > U; if LUCC changes slowly during the study period, St < U.
U = t = 1 T 1 j = 1 J [ ( i = 1 J C t i j ) C t j j ] / [ i = 1 J ( i = 1 J C t i j ) ] Y T Y 1 × 100 %
S t = j = 1 J [ ( i = 1 J C t i j ) C t j j ] / [ j = 1 J ( i = 1 J C t i j ) ] Y t + 1 Y t × 100 %

2.3.2. Land Category Level

Based on interval level, the land category level mainly reflects the transition between land categories at a specific time interval. According to the gain and decrease mode of land categories, the changing intensity of the area gain and decrease is analyzed, to describe the changing intensity as active and steady, respectively. As shown in Formulas (3) and (4), the average change value of land categories at this level is St in each period of time. When the intensity of gain or decrease of land categories is relatively active, Gti > St or Lti > St; when the gain or decrease intensity of land category is relatively steady, Gti < St or Lti < St; when the gain or decrease of each land category is steady, Gti = St or Lti = St.
L t i = [ ( j = 1 J C t i j ) C t i i ] / ( Y t + 1 Y 1 ) j = 1 J C t i j × 100 %
G t j = [ ( i = 1 J C t i j ) C t i j ] / ( Y t + 1 Y 1 ) i = 1 J C t i j × 100 %

2.3.3. Transition Level

Based on the above, the transition level is to calculate the area and intensity of a specific land category converted to other land categories and the area and intensity of other land categories converted to this particular land category in a more in-depth and detailed way for the gain mode of a specific land category N or the decreasing mode of a specific land category M within a specific time interval. Thus, the transformation information of the transfer matrix is further explained systematically and in detail, to reflect the trend of transformation and occupation among land categories, which is described as active or relatively steady. As shown in Formulas (5)–(8), when Rtin > Wtn, it suggests that the rise in land category N tends to occupy land category I; when Rtin < Wtn, it suggests that the gain of land category N avoids the occupation of land category I; similarly, when Qtmj > Vtm, it suggests that the decrease in land category M tends to convert to land category J; when Qtmj < Vtm, it suggests that the decrease in land category M avoids the occupation of land category J.
R t i n = C t i n / ( Y t + 1 Y t ) j = 1 J C t i j × 100 %
W t n = [ ( i = 1 J C t i n ) C t n n ] / ( Y t + 1 Y t ) j = 1 J [ ( i = 1 J C t i j ) C t n j ] × 100 %
Q t m j = C t m j / ( Y t + 1 Y t ) j = 1 J C t i j × 100 %
V t m = [ ( i = 1 J C t m j ) C t m m ] / ( Y t + 1 Y t ) j = 1 J [ ( i = 1 J C t i j ) C t i m ] × 100 %
The method of intensity analysis can more objectively reflect the advantages of system transformation among land categories. Among the three levels of intensity analysis, there is a progressive relationship [19], where the latter level is a more detailed explanation of the former level, and the former level is a summary and supplement to the latter level; using the method of intensity analysis, the land use transfer matrix of three-time intervals was calculated at three levels to reflect its land use change at the time interval level, land category level, and transition level, to reflect its stability and systematic situation comprehensively.

3. Results and Analysis

The study of the results includes two main parts: Jinan City as a whole and the analysis of each district and county. To reflect both the overall trend of change and the differences among districts and counties in Jinan, and to systematically reflect the change and stability of land use in Jinan, a hierarchical analysis of each district in Jinan was conducted based on the overall analysis.

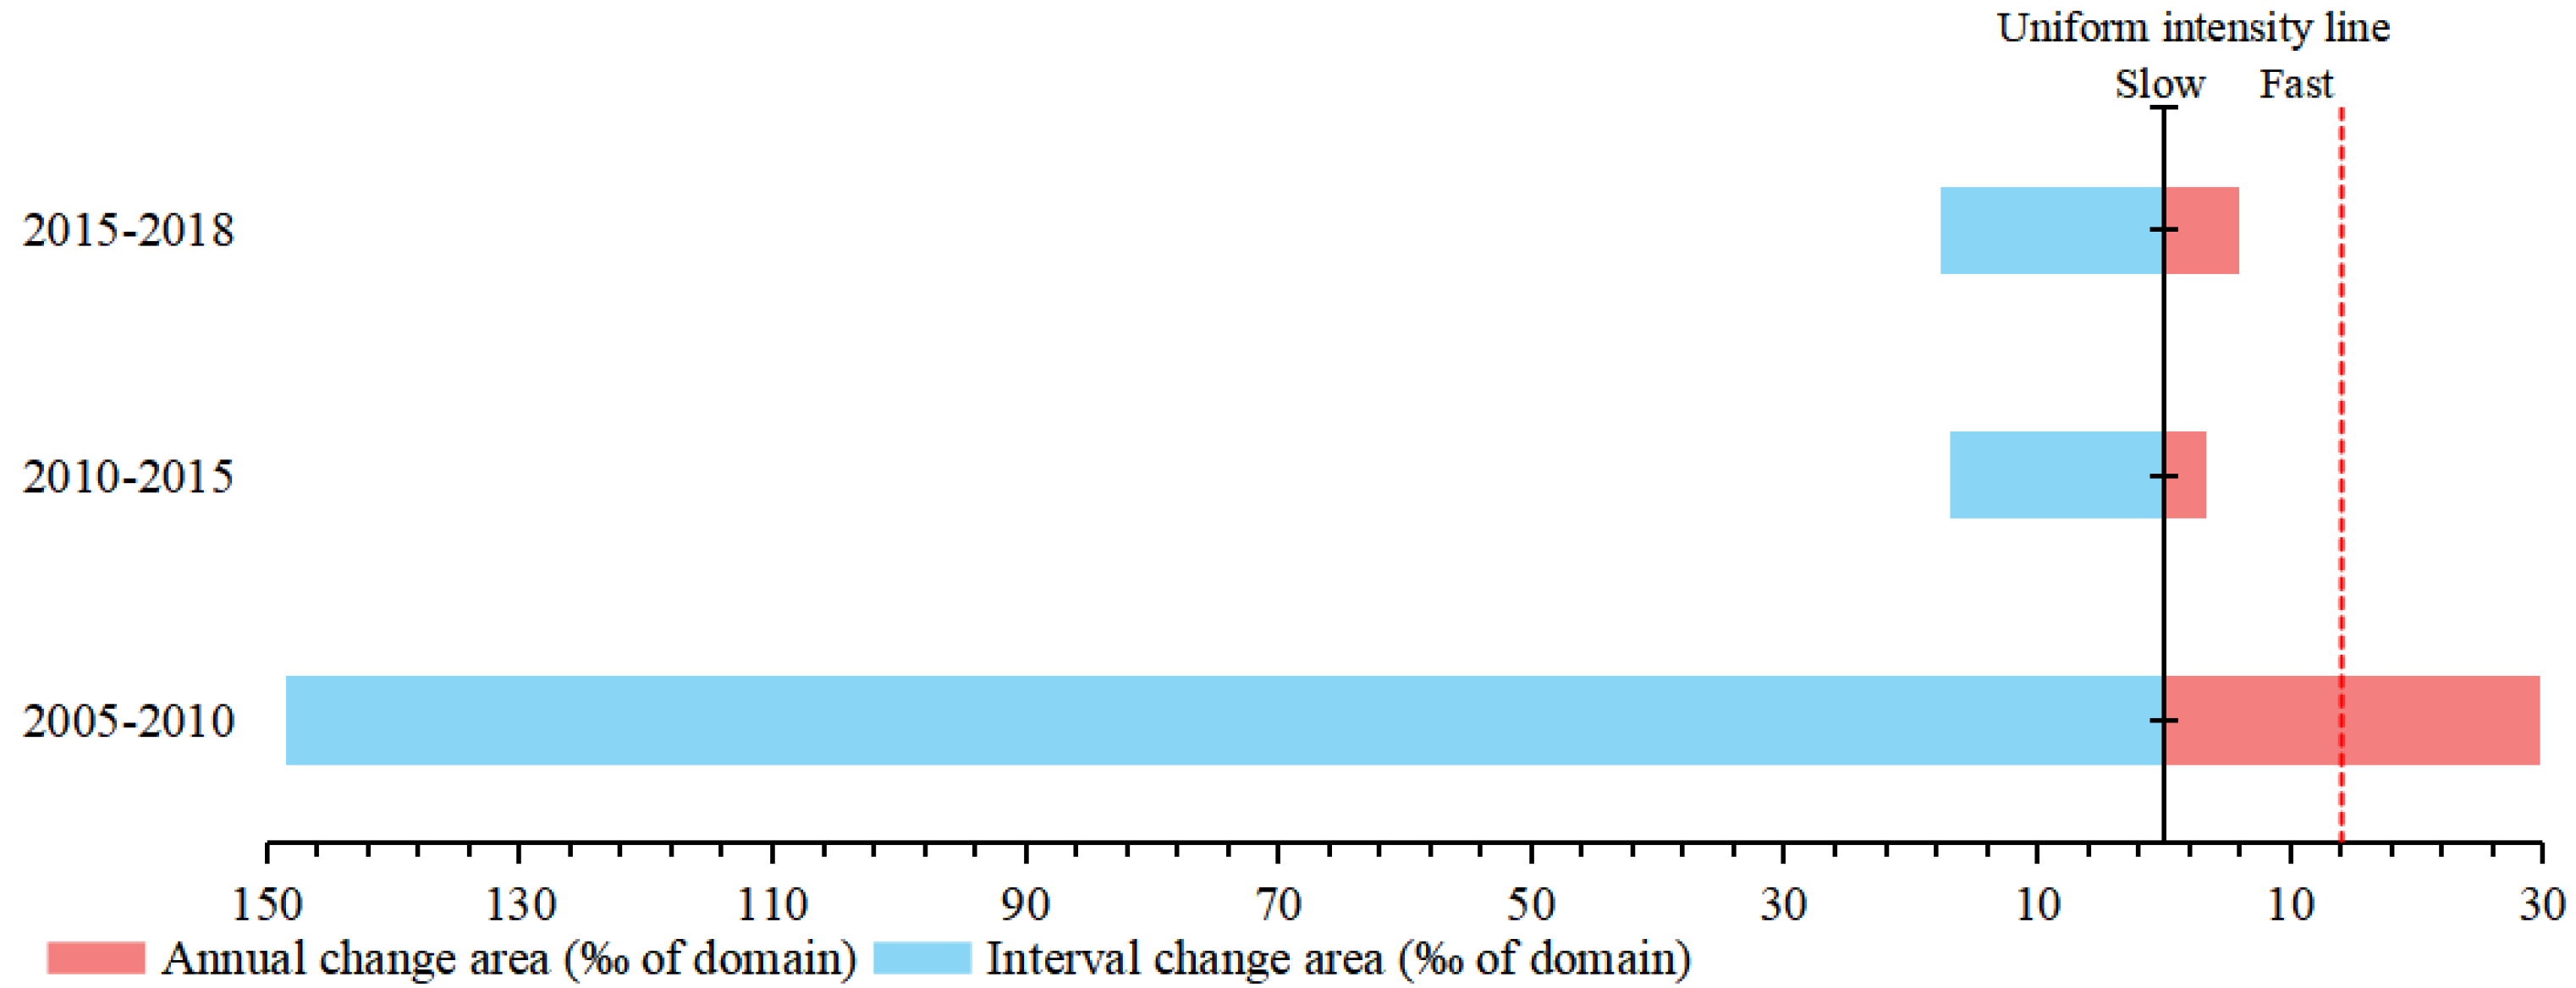
3.1. Interval Level Changes

3.1.1. Analysis of Interval Level Changes in Jinan

At the interval Level (Figure 4), the change intensity from 2005 to 2010 was greater than the average change intensity on the right side of the figure, indicating a rapid pattern of land use change at this interval level from 2005 to 2010. The change intensity from 2010 to 2015 and from 2015 to 2018 were less than the average intensity of change, indicating a slow change pattern at this interval level. As can be seen from the area change on the left side of Figure 4, the area change and intensity change were essentially proportional, with the smallest area change from 2010 to 2015, accounting for only about 3.36‰ of the study area; the largest area change was from 2005 to 2010, accounting for about 29.68‰ of the study area.

3.1.2. Analysis of Interval Level Changes in Jinan by District and County

The overall level of the relationship between the area of land use change and the change intensity, and the average change intensity is reflected at the interval level (Table 2). From 2005 to 2010, the intensity of land use change was greater than the average change intensity in all districts except Tianqiao District, which showed a rapid change pattern, while from 2010 to 2015, only Zhangqiu District showed a rapid change pattern with the land use change intensity greater than the average change intensity, with all other districts showing a slow change pattern. The interval levels from 2015 to 2018, on the other hand, showed a pattern of change with different trends, in which the land use change intensity in Zhangqiu District, Tianqiao District, and Shizhong District were greater than the average intensity of change, thus showing a pattern of rapid change, while the change intensity in all other districts were less than the average change intensity, showing a pattern of slow change.

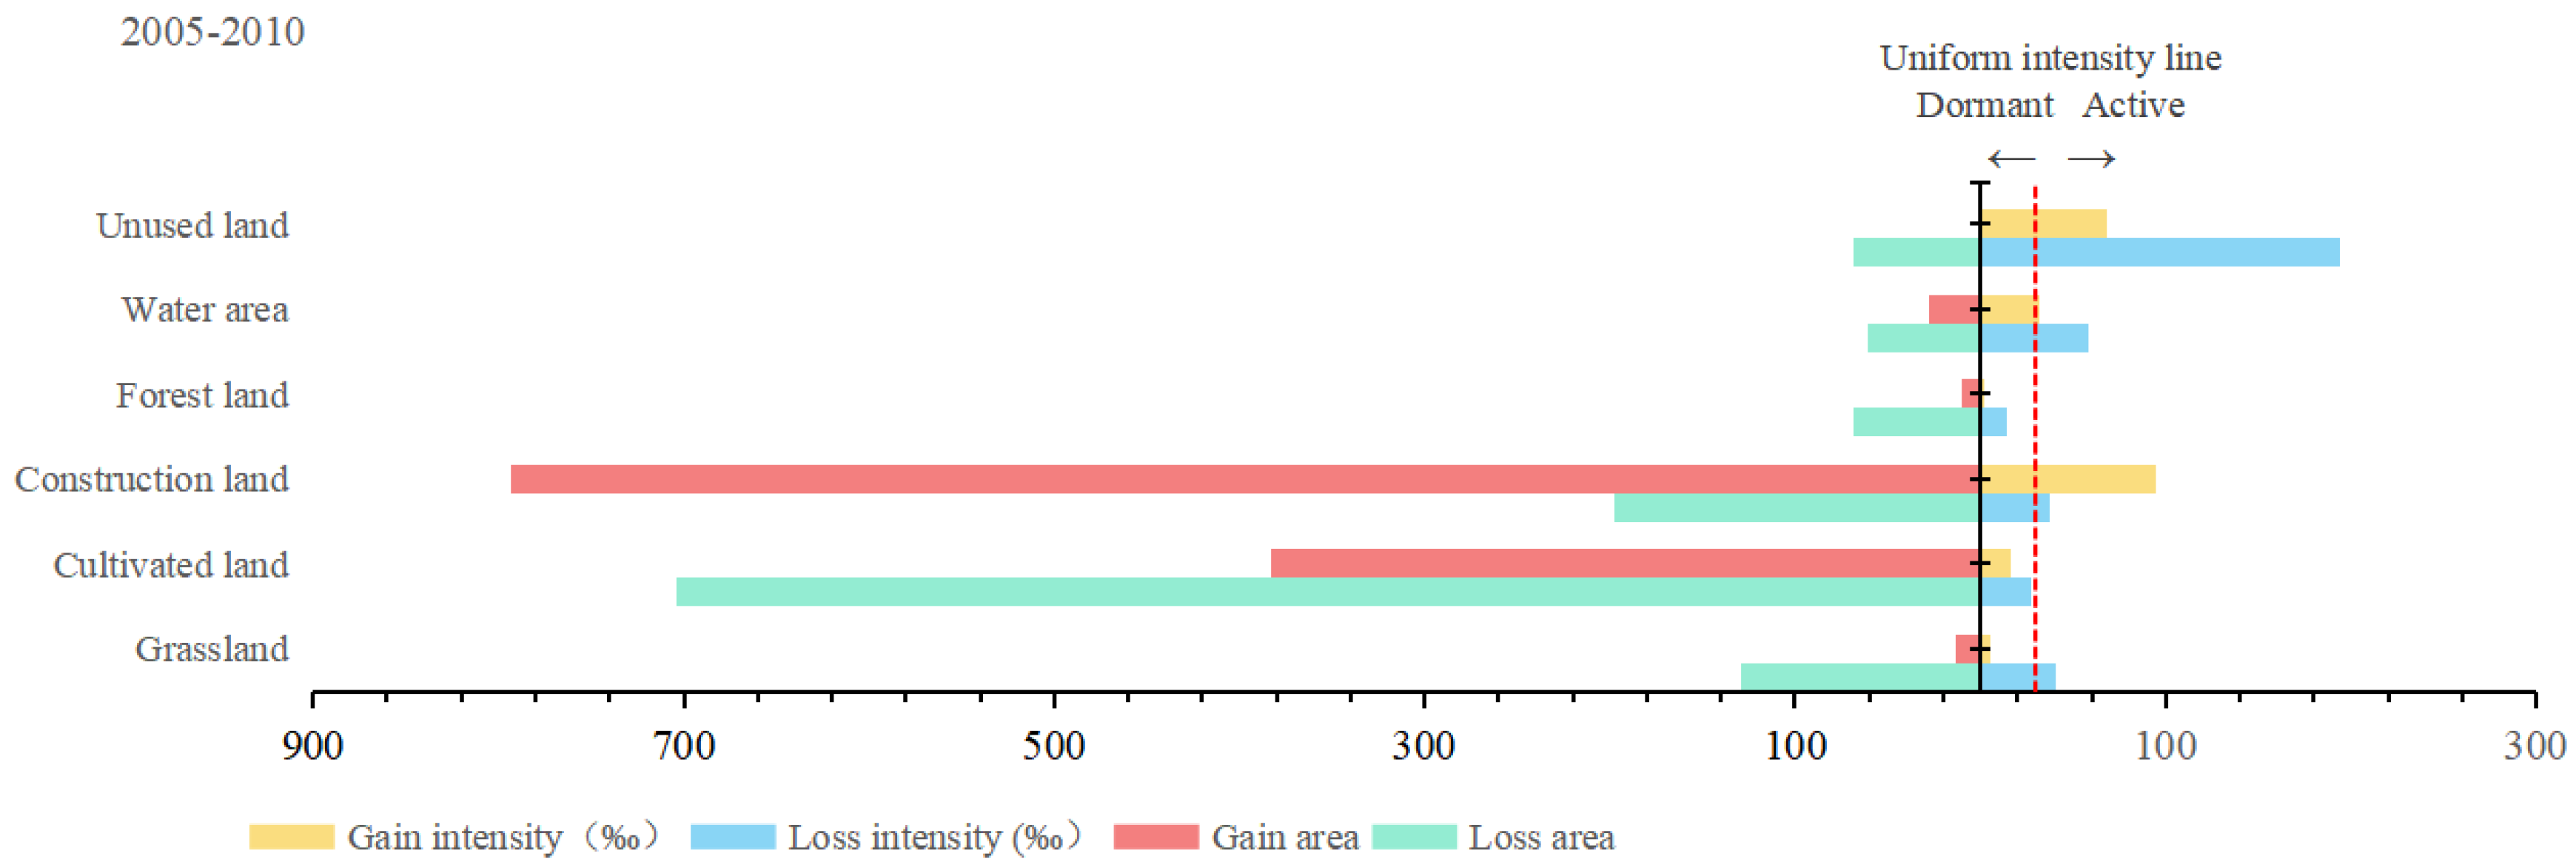
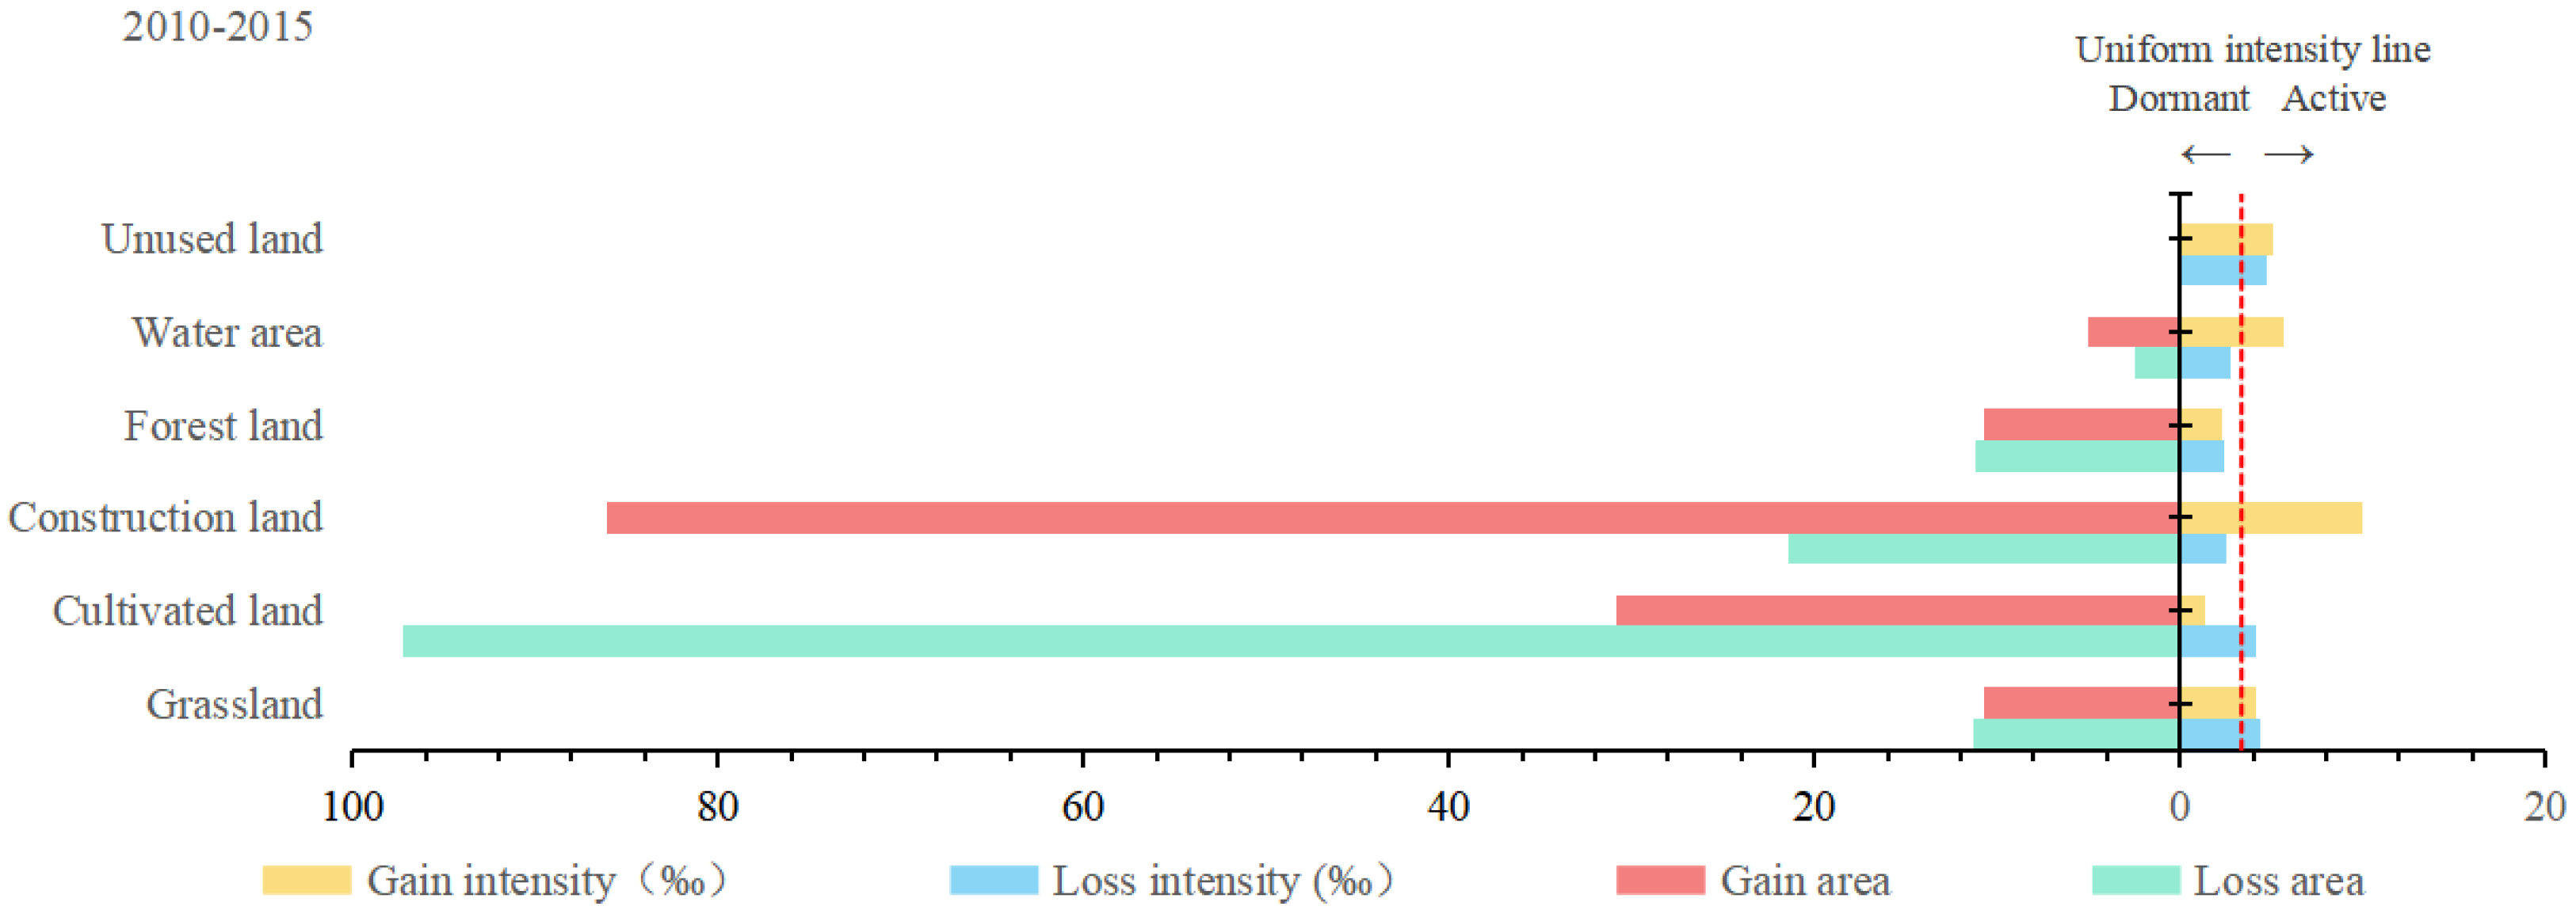
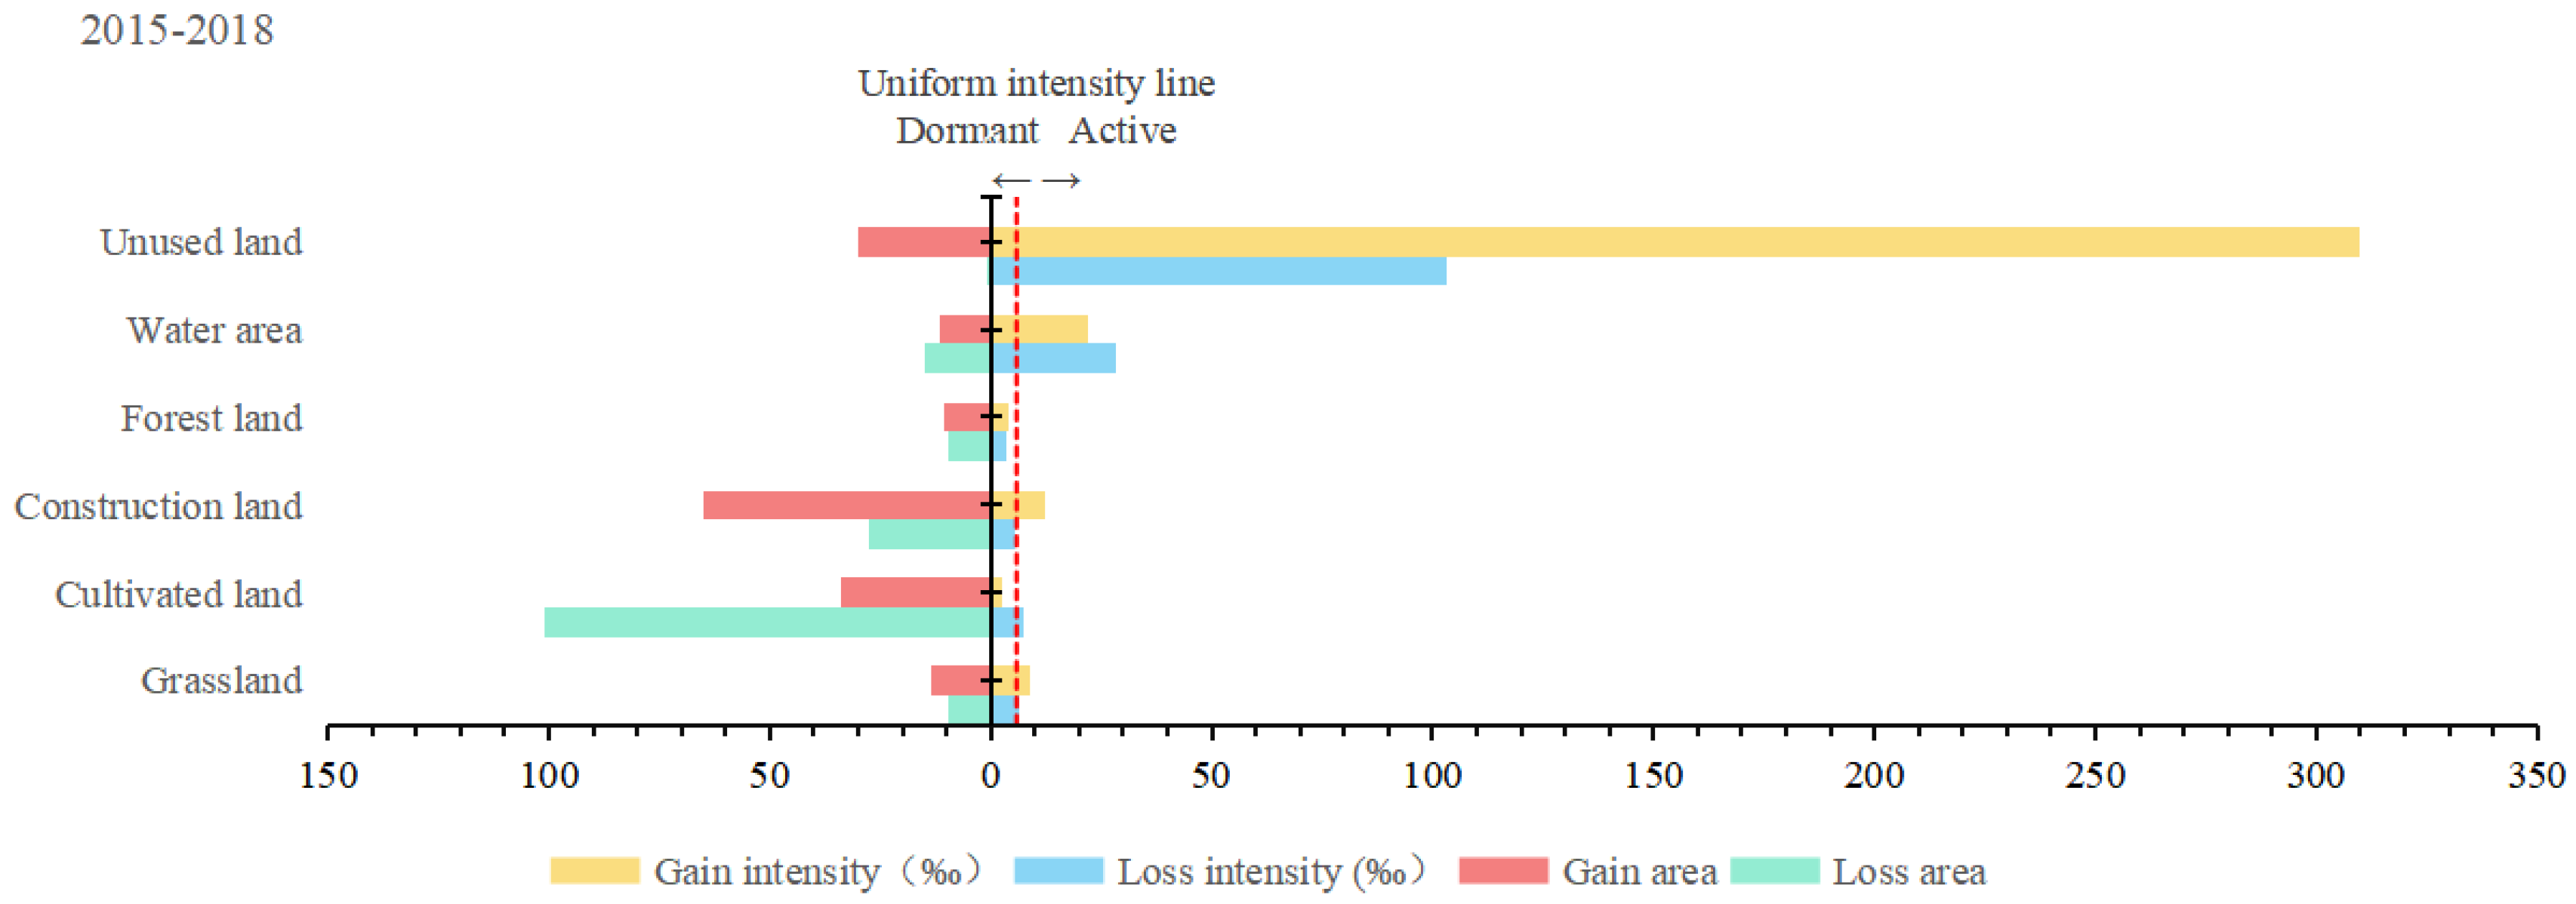
3.2. Land Interval Level Changes

3.2.1. Analysis of Land Interval Level Changes in Jinan

At the land interval level, from the change intensity on the right side of Figure 5, Figure 6 and Figure 7, the gain and decrease in the change intensity in forest land were smaller than the average gain in the change intensity and the average decrease in the change intensity. Forest land showed systematic stability throughout the period of, time.
The intensity of increasing change and decreasing change of unused land was greater than the average change intensity and average decreasing change, showing an active change pattern throughout the interval. The intensity of increasing change or decreasing change in other land categories showed different trends in intensity over the three-time intervals. According to the definition of the stability of the land category hierarchy, the change intensity in the unused land was greater than the average intensity of change throughout the interval, showing an active change pattern.
From the change area on the left side of Figure 5, Figure 6 and Figure 7, the gain and loss of construction land and cultivated land were larger in each time interval, and the gain area of construction land was larger than the decrease area as a whole three time intervals. In contrast, the loss area of cultivated land was larger than the gain area in all three time intervals, resulting in a spatial transformation phenomenon. Grassland losses from 2005 to 2010 were second to construction land and cultivated land, and water area losses from 2015 to 2018 were greater than those of grassland. A comparison of the six land categories showed that the gain in the area of construction land was much greater than the loss, and its intensity showed very high activity.

3.2.2. Analysis of Land Category Level in Jinan by District and County

At the land category level, the relationship between the gain and decrease in the change intensity of the land category and the average intensity of change is used to reflect whether the land category exhibits systematic stability throughout the interval. Taking Zhangqiu District of Jinan, where the calculation results were representative, as an example, the increase and decrease in the change intensity of cultivated land, forest land, and grassland were smaller than the annual gain in the change intensity and the average decrease in the change intensity. Thus, the three land categories showed systematic stability throughout the time interval. In contrast, from 2005 to 2010, the intensity of the decrease in construction land was less than the average change intensity. Its increase was greater than the average change intensity; therefore, the construction land showed an active change pattern at the land category change level during this time interval.

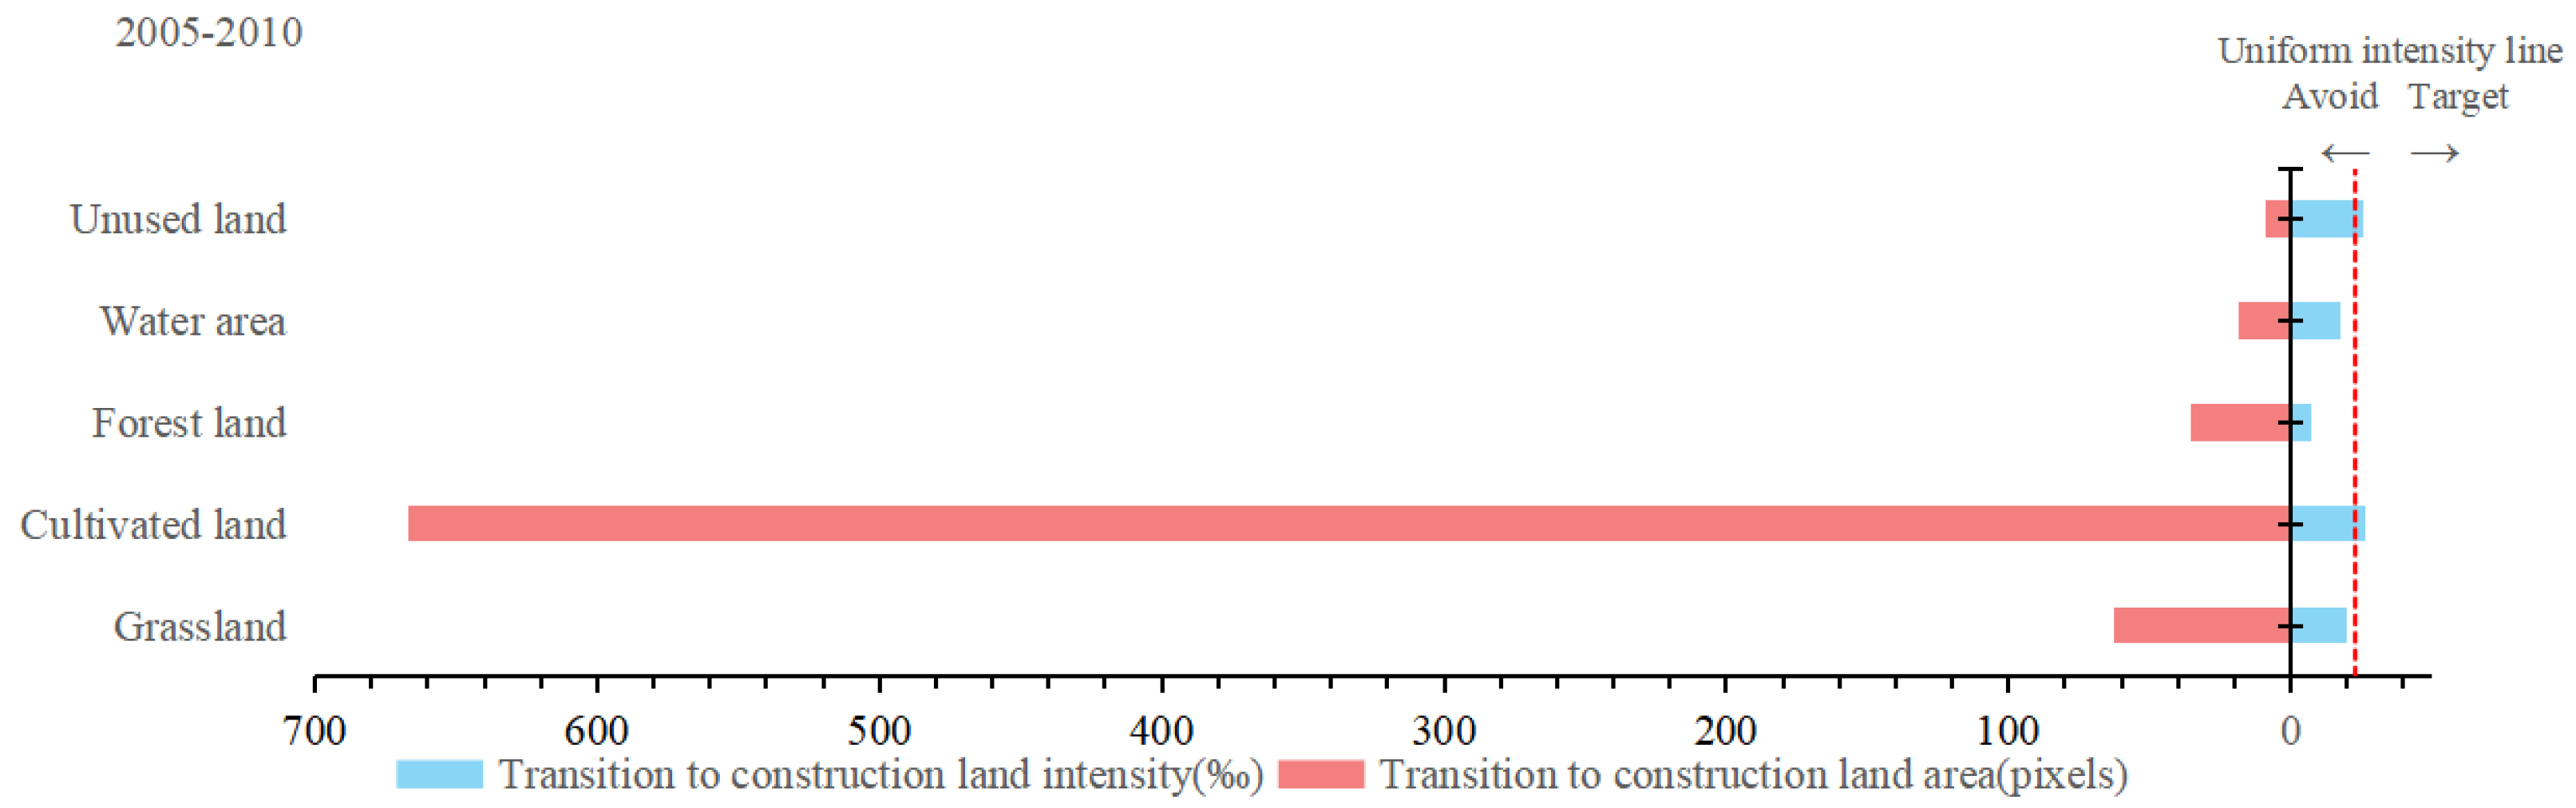
3.3. Transition Level Changes

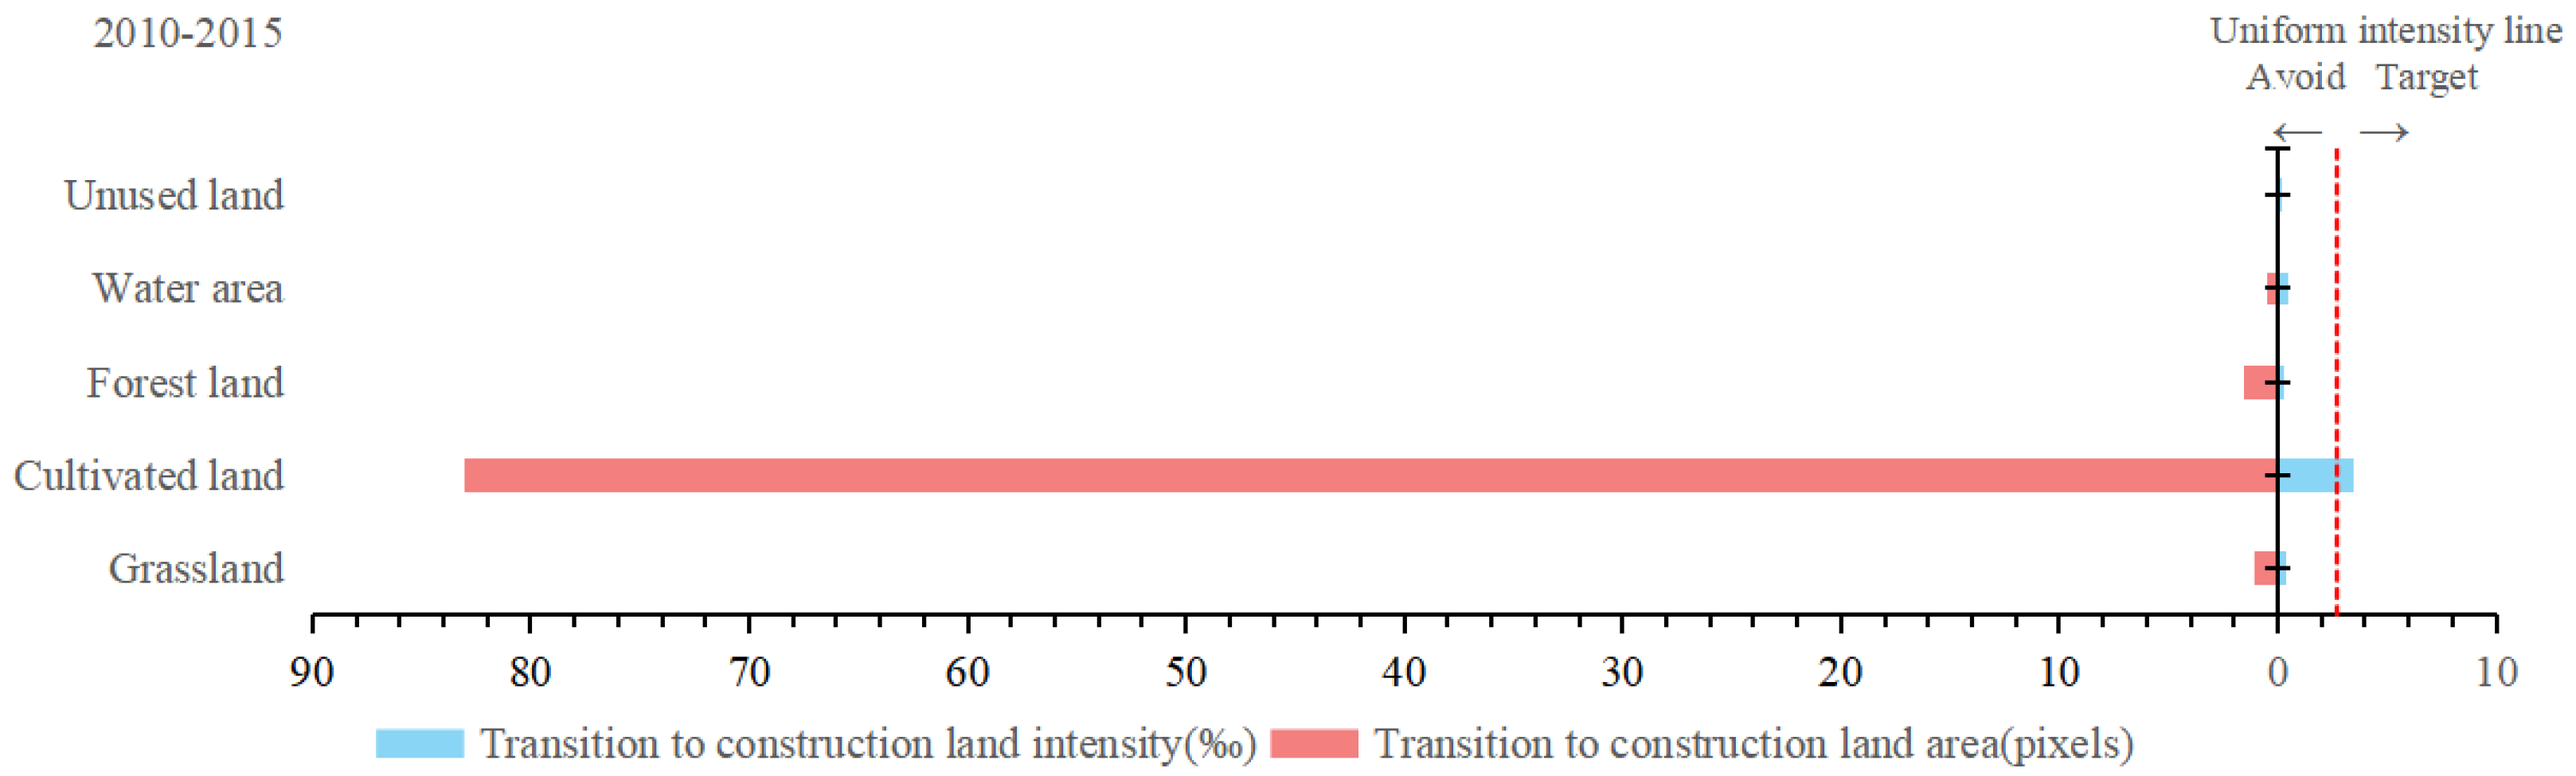
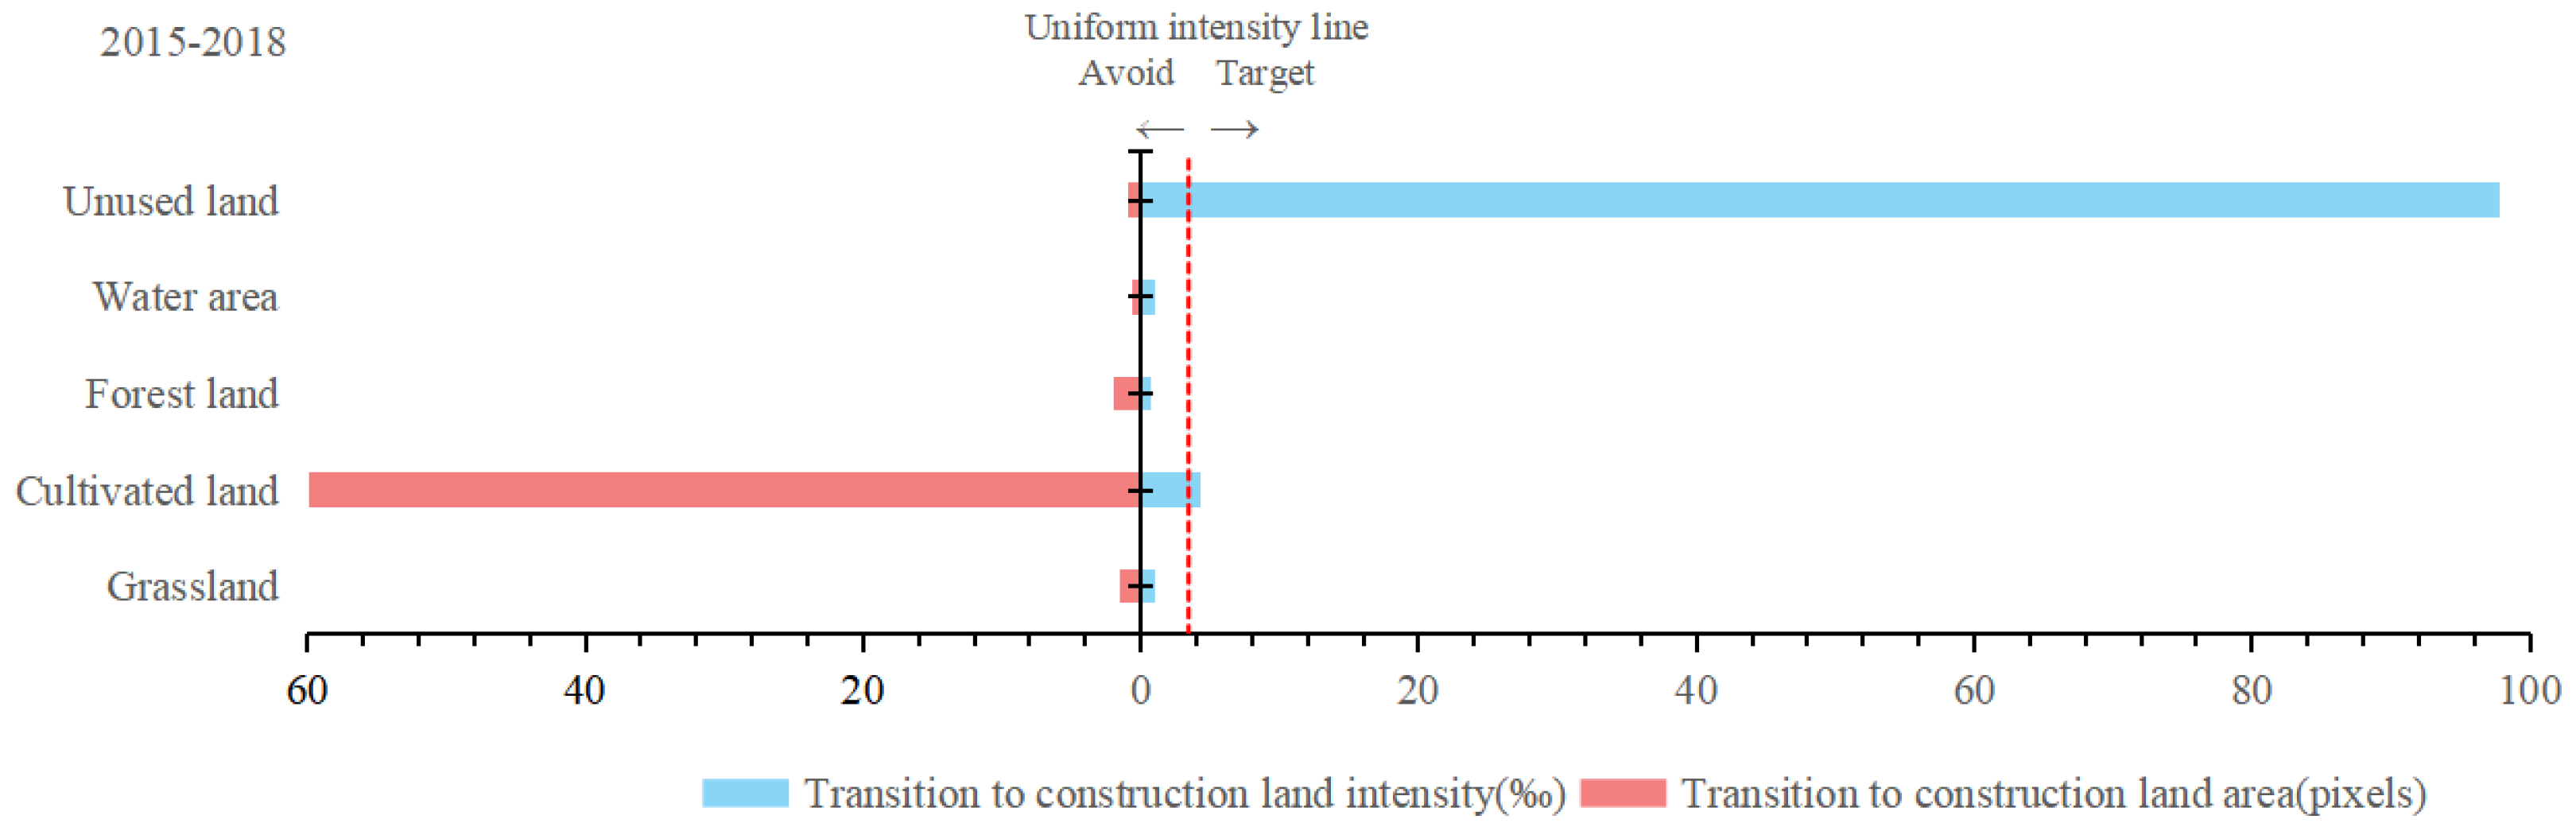
3.3.1. Construction Land Transition Level

  • Construction Land Transition Level in Jinan
Let us consider at the pattern of increasing transition levels, taking construction land as an example. As shown on the right side of Figure 8 and Figure 9, the change intensity in the increasing transition of cultivated land is was greater than the change intensity in the average transition from 2005 to 2010 and 2010 to 2015, indicating that the increase in construction land mainly originated from cultivated land rather than another land category. As shown on the right side of Figure 10, the change intensity in the increased transition of unused land was greater than the change intensity in the average transition from 2015 to 2018, indicating that the increase in construction land mainly originated from unused land. In contrast, the change intensity in forest land was smaller than the average intensity of change in all three-time intervals, indicating that the increase in construction land avoided the occupation of forest land.
Among them, the area changes on the left side of Figure 8 and Figure 9 from 2005 to 2010 and, 2010 to 2015 also indicate that the increase in construction land occupied the most cultivated land and originated from a decreased area of other land categories. According to the definition of the stability of the increase pattern at the transition level, the increase in construction land in the first two time intervals mainly originated from cultivated land rather than forest land, so the transition from cultivated land to construction land was in a steady condition, while the trend of the forest land not converted into construction land was also in a steady condition.
  • Construction Land Transition Level in Jinan by District and County
Taking Zhangqiu District in Jinan as an example, the increased pattern of the transition level was seen in terms of construction land. The results showed that from 2005 to 2010, and 2010 to 2015, the change intensity in the increased transition of cultivated land was greater than the change intensity in the average transition, indicating that the increase in construction land mainly originated from cultivated land rather than other land categories. From 2015 to 2018, the change intensity in the increased transition of forest land was greater than the change intensity in the average transition, indicating that the increase in construction land mainly originated from forest land. In contrast, the change intensity of grassland and water areas was smaller than the average intensity of change in all three–time intervals, indicating that the increase of in construction land avoided the occupation of grassland and water areas.
Among them, the changes in the area from 2005 to 2010, and 2010 to 2015 also indicated that the increase in construction land occupied the largest area of cultivated land and originated from other land categories to a lesser extent. According to the definition of the stability of the increase pattern at the transition level, the increase in construction land in the first two time intervals mainly originated from cultivated land rather than grassland and water areas, so the transition from cultivated land to construction land was in a steady condition. At the same time, the trend of not transforming grassland and water land into construction land was also in a steady condition.

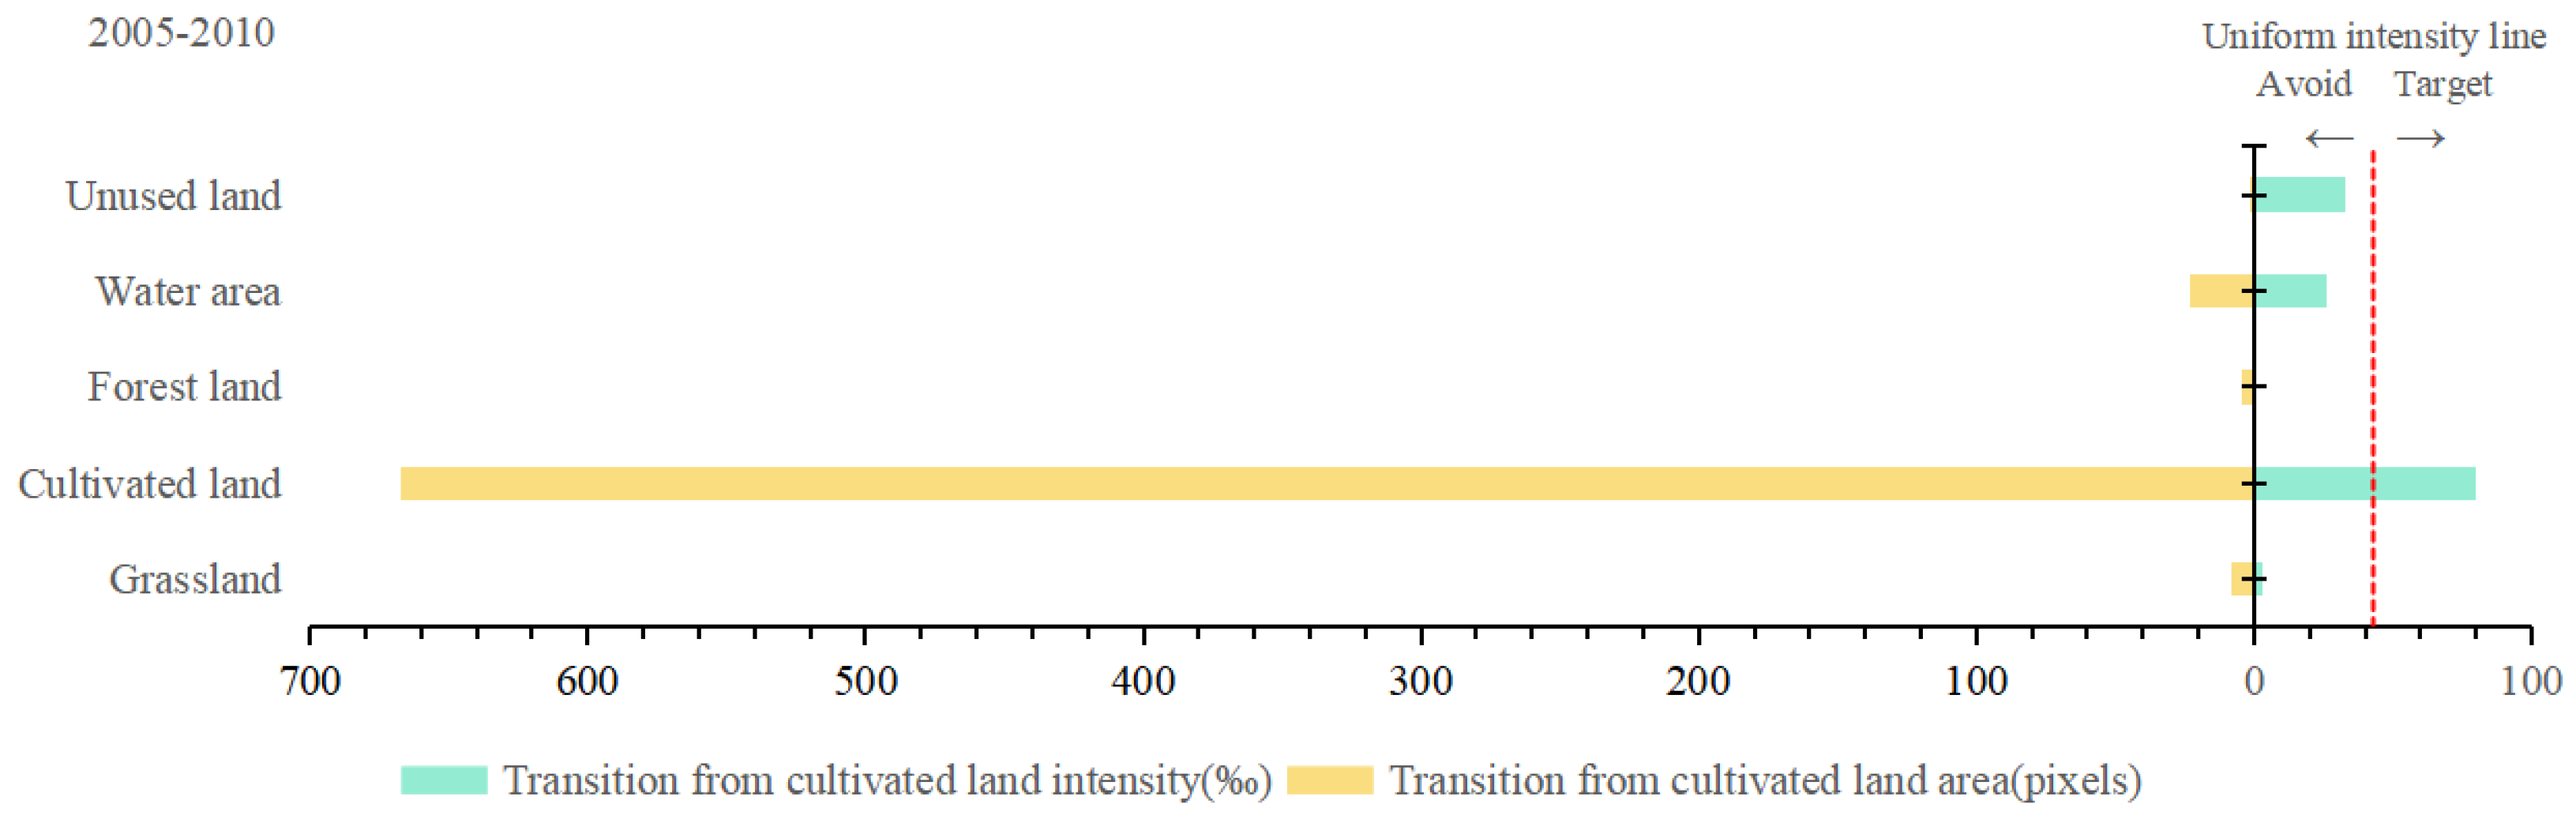
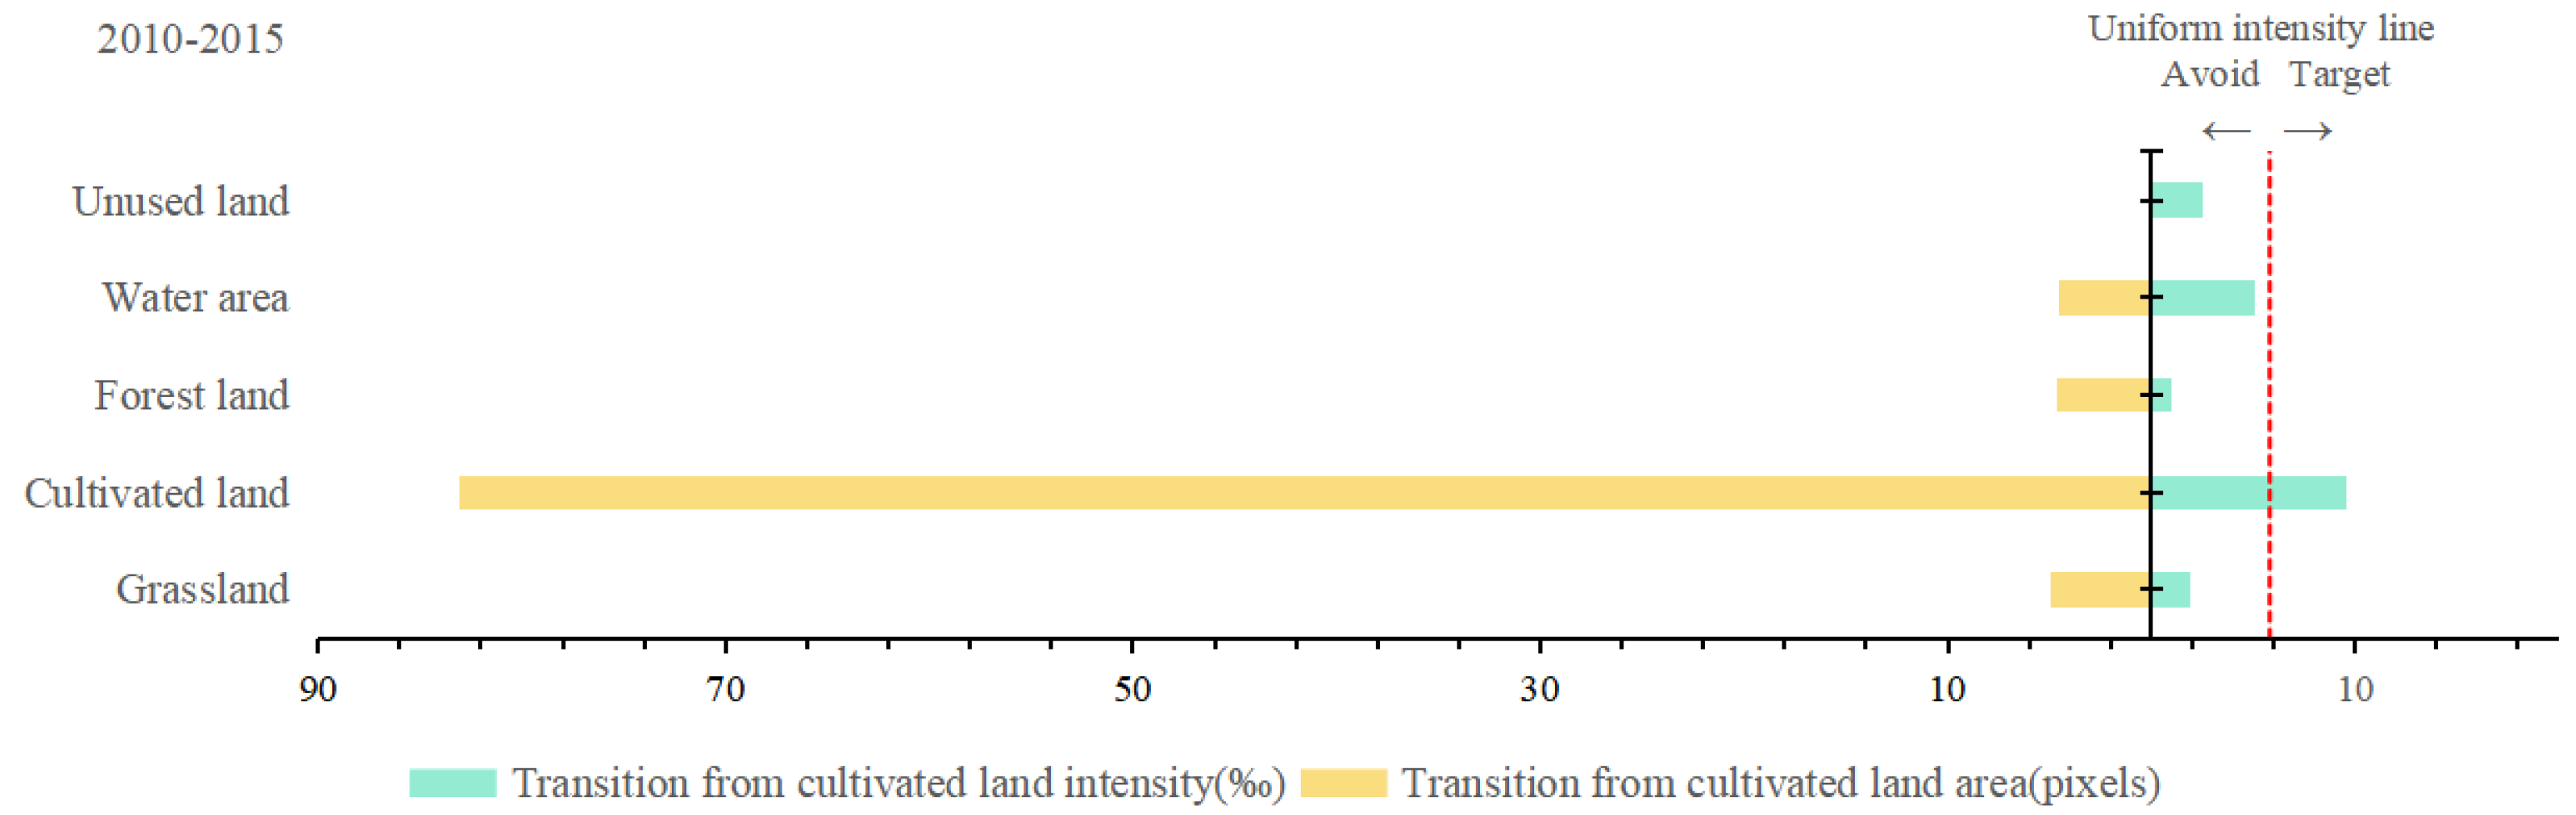
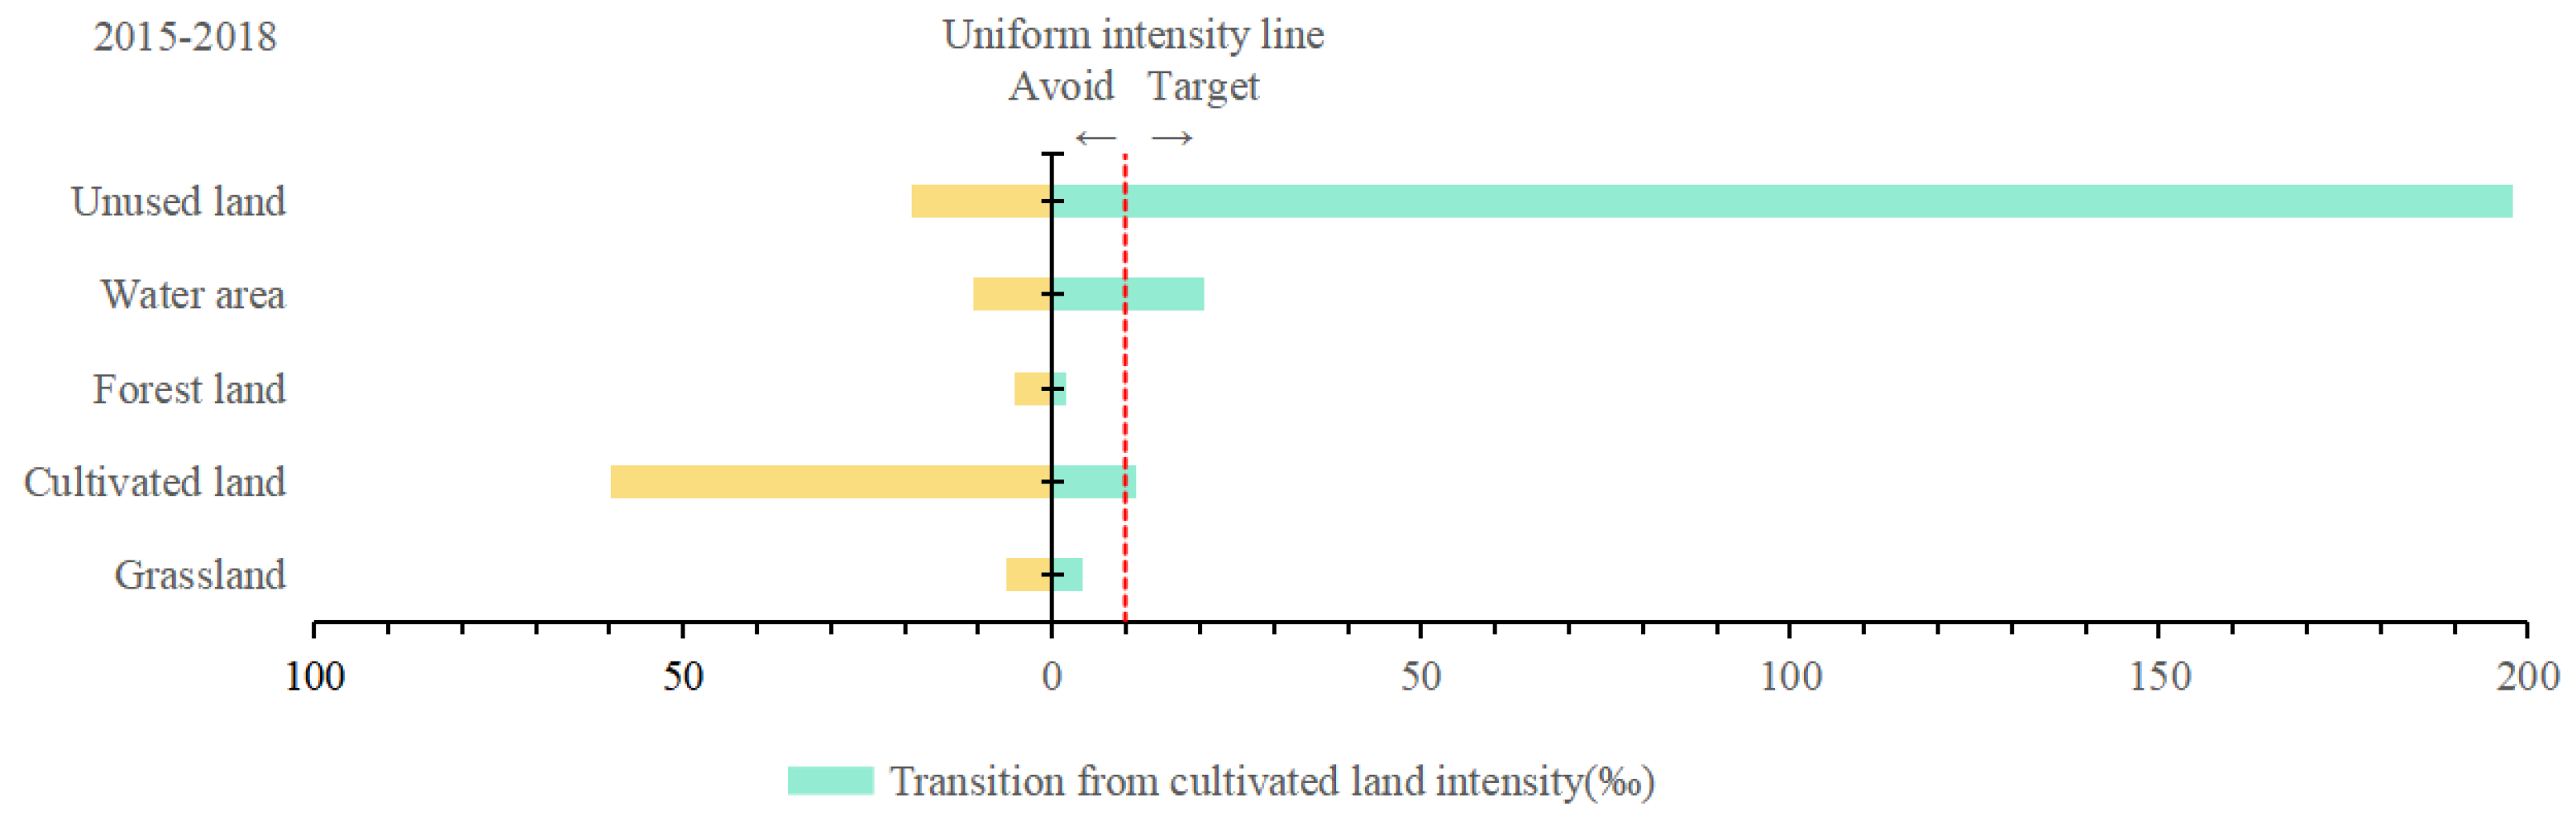
3.3.2. Cultivated Land Transition Level

  • Cultivated Land Transition Level in Jinan
In terms of the decrease pattern at the transition level, taking cultivated land as an example, as shown in the change intensity on the right side of Figure 11, Figure 12 and Figure 13, the intensity of transition of cultivated land into construction land was greater than the average intensity in all three-time periods from 2005 to 2010, 2010 to 2015, and 2015 to 2018, and the decrease in cultivated land was mainly converted into construction land, followed by converting into unused land and watersheds, and from 2015 to 2018, it also tended to be converted into unused land and water areas. The decrease of in cultivated land in the three-time intervals was mainly converted into construction land, related to the larger share of construction land. From 2015 to 2018, the decrease in cultivated land was mainly converted into unused land and water areas. In contrast, the decrease in cultivated land from 2005–2010 and 2015–2018 was not converted into forest land and grassland, which is related to the proportion of forest land and grassland, and also to the territorial development policy in that period of, time. According to the definition of the stability of the transition level decrease pattern, the decrease in cultivated land into construction land indicates a steady condition in the three-time intervals, and the non–transition into forest land and grassland also shows a relatively steady condition.
  • Cultivated Land Transition Level in Jinan by District and County
Taking Zhangqiu District in Jinan as an example, there was a decreased pattern of the transition level to cultivated land. From 2010 to 2015, the intensity of the transition of cultivated land to forest land was greater than the average intensity in three-time intervals. The decrease in cultivated land was mainly converted to forest land. In the three-time intervals, the decrease in cultivated land in other districts and counties was mainly converted into construction land, while the decrease of in cultivated land was not converted into forest land and grassland. According to the stability definition of the transition level decrease pattern, the decrease in cultivated land into construction land showed a steady condition in three-time intervals, and the non-transition into forest land and grassland also indicates a relatively steady condition.

3.4. Summary of Analysis Results

The results of the study, based on the overall analysis, were progressively analyzed in different levels for each district in Jinan, and the changes in construction land in the overall land category level in Jinan were reflected in an active pattern at a smaller scale, which highlights this characteristic of land use changes in Jinan. The study results showed both synergies and differences among districts, showing certain spatial correlations and mutual influences and reflections.

4. Discussion

Previous studies have focused only on the major transformations and often may have overlooked the most systematic transformation processes [24]. Intensity analysis, as a top-down hierarchical interpretive mathematical framework, achieves a reasonable explanation of the change intensity [13,20,21,22,23,24], and is essential for a systematic and in-depth understanding of the land use change process [25,26,27]. Yet, geographers also need to adequately describe such patterns of change to generate a research plan to find the processes and causes of change. Our approach to analyzing land change patterns built on previous work and meets this need. It provides informative solid implications for decisions on planning and adjusting the land size and land category [28,29]. In response to study results, a comprehensive analysis was conducted, and we developed a discussion.

4.1. Focus on the Protection of Cultivated Land and Strictly Limit Land Development in Ecological Function Areas

In rapid urban development, attention should be paid to the protection of cultivated land. Land development in ecological function areas should be strictly restricted [30,31,32] to rationalize the layout of the land and adjust the land use structure appropriately. Through the study, it was found that Jinan City is in the process of rapid development, a high degree of land development, and unused land is only about 1 in 10,000. Still, the cultivated land area continued to decrease, especially from 2010 to 2015, and the cultivated land showed a rapid decrease, where the intensity of decrease in the category transition was about four-times the intensity of increase, the speed and extent of which caused us to think. Meanwhile, the corresponding ecological land showed a higher intensity decrease from 2015 to 2018, breaking for the first time the steady pattern of its transition to other land categories.
With the progress of urbanization, the trend of construction land occupying cultivated land is inevitable. However, the degree of change in land use intensity is closely related to the protection of cultivated land, which is related to national food security and the long-term livelihood of farmers. Therefore, it is necessary to implement the strictest use control system in accordance with laws and planning, prohibit the occupation of basic farmland for construction land development, and develop ecological economy and special industries that can be carried by resources and the environment according to local conditions. Meanwhile, in response to the unreasonable part of land use in Jinan, i.e., the continuous occupation of arable land by construction land, the development concept should be updated, the amount of cultivated land should be effectively replenished, the land use management should be increased, and efforts should be made to ensure that food security is not threatened.
Furthermore, changing the land use intensity (cultivated land was seriously occupied in the results) can mitigate the loss of ecological land. Measures include improving land quality, adapting to local conditions, and comprehensively developing land reserve resources to ensure the sustainable use of land resources in Jinan [32]. On the basis of alleviating the land use problem, factors such as adjusting land use intensity and land use structure can influence the total carbon emission [33]. Appropriate adjustment of land use structure and change in land use intensity can help mitigate carbon emissions [34] and alleviate the core problem that the world is currently committed to solve.

4.2. Strictly Control the Balance of Cultivated Land and Cautiously Develop Unused Land

The growing population is one of the most fundamental reasons affecting the change in the amount of cultivated land [35]. In terms of the agricultural population, as the population grows and income increases, it will inevitably generate greater demand in terms of housing and transportation, thus creating massive pressure on land (cultivated land). As farmers’ income increases, the growth of the rural population means a decrease in the amount of cultivated land. The same is true for the development of the urban population.
From the level of land category in all three-time intervals studied, the decrease in the cultivated land area was greater than the increase; from the level of transition from cultivated land, the central tendency was to transition to construction land (systematically) in all three-time intervals. However, from the level of transition to construction land, it could be seen that from 2015 to 2018, there was a transition mainly from unused land. From this analysis, it could be concluded that to reduce the occupation of cultivated land, the development of construction land in Jinan should transition to the occupation of unused land.
In the background of the gradual decline of cultivated land, the state has formulated policies related to the balance of cultivated land [36], with a view to protecting cultivated land, promoting the efficient use of land resources and maintaining national food security and social stability [37]. As a valuable land reserve resource, unused land needs to be developed carefully [38,39]. The occupation of cultivated land and unused land by construction land should be controlled in urban development. The balance of cultivated land should be strictly observed, and the quantity and quality of cultivated land should not be affected.

4.3. Implement Intensive Utilization of Construction Land and Promote the Redevelopment of Inefficient Construction Land in Cities and Towns

With the rapid development of urbanization in China, the contradiction between the supply and demand of construction land and the imbalance of spatial allocation efficiency is prominent [40,41]. The study found that the change in area and intensity of construction land in Jinan showed an active pattern throughout the time interval, more prominent in the small-scale district and county analysis and research results. Among them, the transition of construction land from 2005 to 2015 mainly came from cultivated land, and the intensity and speed of the transition of cultivated land slowed down from 2015 to 2018. In general, the increased area of cultivated land was far less than the reduced area, and the increased construction land area was far greater than the reduced area. The “imbalance between occupation and compensation” of cultivated land not only seriously wastes land resources, but also the massive expansion of construction land may lead to the ineffective expansion of urban development boundaries, resulting in the phenomenon of inefficient land use. Unbridled sprawling development may aggravate big city disease.
On 30 March 2020, the State Council issued the opinions on building a perfect system and mechanism for market-oriented allocation of factors (hereinafter referred to as the opinions). The opinions emphasized that the market mechanism should be fully used to revitalize the stock land and inefficient land use. We will further promote the consolidation of construction land and improve the policy linking the increase and decrease in urban and rural construction land. The Municipal Department of Natural Resources and Planning Shall strengthen the supervision and guidance on the redevelopment of inefficient urban construction land, and link the promotion of the redevelopment of inefficient urban construction land in all districts and counties with the planned allocation of new construction land in the next year, give appropriate preference and support in the distribution of new construction land in the districts and counties that promote fast, and deduct the indicators of new construction land in the next year for the districts and counties that promote slowly [42]. Urban development must abandon the blind expansion, take the road of new urbanization, make intensive use of land, based on the economy [43], encourage and guide market players to implement comprehensive development above and below the ground, and charge land transition fees for projects that use their stock of construction land to transform themselves; the public service facilities such as green land and bus stations compatible with the above-ground part would be included in the total construction area, and the land transition fee is not charged. The project implementation subject would construct the facilities free of charge and hand them over to the relevant departments for management and use. We improve the land use intensity and revitalize the quality of existing construction land [42].
Through the multi-level and multi-faceted research conducted by the above methods, we could comprehensively grasp the overall land use status of Jinan, China, from 2005 to 2018. The land is a strategic issue related to the sustainable development of the economy and society in Shandong Province. Understanding the process of land change is of great significance to the sustainable use and management of land. At the same time, the systematic and steady research on land use change is of great significance in regulating the results and land use layout. It has become an essential task for China’s land use planning to realize the rational layout of land use. Reasonable land use can neutralize the severe shortage of land resources and achieve the maximum intensive land use under the current conditions. Finally, it can support the construction of an ecological environment. With the coordinated development of rural areas, on the premise of ensuring the red line of cultivated land, we should continue to further promote the policy of returning farmland to forests, improving the ecological environment, and at the same time, we can change the face of poor and backward farmers by turning barren mountains into forest land, increasing farmers’ income, and promoting the joint development of urban and rural areas.

4.4. Innovation Points

Analyzing the land use changes, especially the actual changes in each category, based on the actual changes in the study period of time, and by translating the changes into specific numerical comparisons, provides a reference for the subsequent land planning and use of the city. Compared with other researchers who have only analyzed transfer matrices [42], or integrated humanities [35], economy [35], or policies [35,43,44] for analysis, this study concretized abstract land changes and presenteds them in an intuitive visualization such as graphs, and refined zoning based on the overall analysis, reflecting spatial differences and correlations and, rigorously providing a concrete quantitative reference for the city to carry out future planning.

5. Conclusions

Based on the land use transfer matrix, this article used the research method of intensity analysis to solve the problem of information and patterns of intrinsic land changes that cannot be studied by traditional matrix analysis. This study explained the land use changes and intensity of changes at the interval level, land category level, and transition level from 2005 to 2018 in Jinan, Shandong Province, China. We concluded that among the land category changes, construction land and cultivated land showed high activity in both the area and intensity of changes, and the transitions between them showed a steady and systematic pattern of changes, which is a common phenomenon in the urbanization process of recent years, while other land categories showed different trends and intensity of change in different periods. By scientifically describing this pattern of change and making the vast amount of information in the transformation process available to decision-makers, this study enriched the practical application of intensity analysis theory in land use layout in China. It provided the Chinese experience of land use change in the world urbanization process.

Author Contributions

Conceptualization, Y.H.; Data curation, K.Z. and X.W.; Formal analysis, K.Z.; Methodology, K.Z. and Z.W.; Project administration, K.Z.; Software, K.Z.; Supervision, Y.H.; Validation, K.Z.; Visualization, K.Z.; Writing―original draft, K.Z., X.W. and Z.W. All authors have read and agreed to the published version of the manuscript.

Funding

This research was financially supported by China University of Geosciences (Beijing) University Student Innovation and Entrepreneurship Training Program (S202111415156).

Institutional Review Board Statement

Not applicable.

Informed Consent Statement

Not applicable.

Data Availability Statement

Not applicable.

Acknowledgments

Thank you to everyone who contributed to this study.

Conflicts of Interest

The authors declare no conflict of interest.

References

  1. Chen, B.; Liu, X.; Yang, H. A review of recent advances in LUCC research. Adv. Geogr. Sci. 2003, 01, 22–29. [Google Scholar]
  2. Turner, B.L.; Lambin, E.F.; Reenberg, A. The emergence of land change science for global environmental change and sustainability. Proc. Natl. Acad. Sci. USA 2007, 104, 20666–20671. [Google Scholar] [CrossRef] [PubMed] [Green Version]
  3. Qin, M.Z. A new discipline arising from global change is land change science. J. Henan Univ. (Nat. Sci. Ed.) 2012, 42, 584–587. [Google Scholar] [CrossRef]
  4. Turner, B.L.; Kasperson, R.E.; Matson, P.A.; McCarthy, J.J.; Corell, R.W.; Christensen, L.; Eckley, N.; Kasperson, J.X.; Luers, A.; Martello, M.L.; et al. A framework for vulnerability analysis in sustainability science. Proc. Natl. Acad. Sci. USA 2003, 100, 8074–8079. [Google Scholar] [CrossRef] [PubMed] [Green Version]
  5. Yang, J.X.; Gong, J.; Gao, J.; Ye, Q. Stability and systematic characteristics of land use change in national central cities—Wuhan city as an example. Resour. Sci. 2019, 41, 701–716. [Google Scholar]
  6. Sun, Y.; Guo, T.; Cui, X. Intensity analysis and stability study of land use change in Kunming. Adv. Geogr. Sci. 2016, 35, 245–254. [Google Scholar]
  7. He, C.; Shi, P.; Chen, J.; Zhou, Y.Y. A study of land use/cover change in Beijing. Geogr. Stud. 2001, 20, 679–687. [Google Scholar]
  8. Pontius, R.G., Jr.; Shusas, E.; McEachern, M. Detecting significant categorical land changes while accounting for persistence. Agric. Ecosyst. Environ. 2004, 10, 251–268. [Google Scholar] [CrossRef]
  9. Takada, T.; Miyamoto, A.; Hasegawa, S.F. Derivation of yearly transition probability matrix for land use dynamic and its applications. Landsc. Ecol. 2010, 25, 561572. [Google Scholar] [CrossRef]
  10. Romero-Ruiz, M.H.; Flantua, S.G.A.; Tansey, K.; Berrio, J.C. Landscape transformations in savannas of northern south America: Land use/cover changes since 1987 in the Llanos Orientales of Colombia. Appl. Geogr. 2012, 32, 766–776. [Google Scholar] [CrossRef]
  11. Niu, L.; Zhang, B.; Jia, T.; She, D. Analysis of land use change intensity and stability in Haixi Prefecture, Qinghai Province. J. Soil Water Conserv. 2021, 35, 152–159. [Google Scholar]
  12. Pontius, R.G.; Boersma, W.; Castella, J.C.; Clarke, K.; de Nijs, T.; Dietzel, C.; Duan, Z.; Fotsing, E.; Goldstein, N.; Kok, K.; et al. Comparing the input, output, and validation maps for several models of land change. Ann. Reg. Sci. 2008, 42, 11–37. [Google Scholar] [CrossRef] [Green Version]
  13. Aldwaik, S.Z.; Pontius, R.G., Jr. Intensity analysis to unify measurements of size and stationarity of land changes by interval, land category, and transition. Landsc. Urban Plan. 2012, 106, 103–114. [Google Scholar] [CrossRef]
  14. Mallinis, G.; Koutsias, N.; Arianoutsou, M. Monitoring land use/land cover transformations from 1945 to 2007 in two peri-urban mountainous areas of Athens metropolitan area, Greece. Sci. Total Environ. 2014, 490, 262–278. [Google Scholar] [CrossRef]
  15. Huang, J.; Pontius, R.G., Jr.; Li, Q.; Zhang, Y. Use of intensity analysis to link patterns with land change processes from 1986 to 2007 in a coastal watershed of southeast China. Appl. Geogr. 2012, 34, 371–384. [Google Scholar] [CrossRef]
  16. Cheng, M.; Tang, G.; Lv, B.; Li, X.; Wu, X.; Wang, Y.; Wang, Y. Source apportionment of PM2.5 and visibility in Jinan, China. J. Environ. Sci. 2021, 102, 207–215. [Google Scholar] [CrossRef]
  17. Haji, M.; Liu, W.; Li, B.; Lin, L.; Qin, D.; Guan, Q.; Guo, Y. Study on the influence of Yufu River on karst hydrochemical processes in Jinan. J. Eng. Geol. 2017, 25, 190–198. [Google Scholar]
  18. Liu, J.; Li, X.; Zheng, X. Evaluation of resource and environment carrying capacity and its spatial characteristics analysis from a multi-scale perspective—Taking Jinan city as an example. Geogr. Res. Dev. 2019, 38, 115–121. [Google Scholar]
  19. Song, H. Research on Land Use Change in Quanzhou City Based on Intensity Analysis. Master’s Thesis, Hunan University of Science and Technology, Xiangtan, China, 2017. [Google Scholar]
  20. Pontius, R.G., Jr.; Gao, Y.; Giner, N.M.; Kohyama, T.; Osaki, M.; Hirose, K. Design and interpretation of intensity analysis illustrated by land change in Central Kalimantan, Indonesia. Land 2013, 2, 351–369. [Google Scholar] [CrossRef]
  21. Aldwaik, S.Z.; Pontius, R.G., Jr. Map errors that could account for deviations from a uniform intensity of land change. Int. J. Geogr. Inf. Sci. 2013, 27, 1717–1739. [Google Scholar] [CrossRef]
  22. Manandhar, R.; Odeh, I.O.; Pontius, R.G., Jr. Analysis of twenty years of categorical land transitions in the lower Hunter of New south Wales, Australia. Agric. Ecosyst. Environ. 2010, 135, 336–346. [Google Scholar] [CrossRef]
  23. Gitau, M.; Bailey, N. Multi-Layer assessment of land use and related changes for decision support in a coastal zone watershed. Land 2012, 1, 5–31. [Google Scholar] [CrossRef] [Green Version]
  24. Pontius, R.G., Jr.; Shusas, E.; Mceachern, M. Detecting essential categorical land changes while accounting for persistence. Agric. Ecosyst. Environ. 2004, 101, 251–268. [Google Scholar] [CrossRef]
  25. Jinan City People’s Government Jinan Geography and Climate [EB/OL]. 7 March 2022. Available online: http://www.jinan.gov.cn/col/col24698/index.html (accessed on 10 March 2022).
  26. Bell, E.J.; Hinojosa, R.C. Markov analysis of land use change: Continuous time and stationary processes. Socio-Econ. Plan. Sci. 1997, 11, 13–17. [Google Scholar] [CrossRef]
  27. Mertens, B.; Lambin, E.F. Land-cover-change trajectories in southern Cameroon. Ann. Assoc. Am. Geogr. 2000, 90, 467–494. [Google Scholar] [CrossRef]
  28. Pelorosso, R.; Della Chiesa, S.; Tappeiner, U.; Leone, A.; Rocchini, D. Stability analysis for defining management strategies in abandoned mountain landscapes of the Mediterranean basin. Landsc. Urban Plan. 2011, 103, 335–346. [Google Scholar] [CrossRef]
  29. Jinan Municipal People’s Government [EB/OL]. 11 July 2008. Available online: http://www.jinan.gov.cn/art/2008/7/11/art_33_247560.html2008-07-11 (accessed on 12 December 2021).
  30. Wang, P.; Li, X.J. Characteristics of land use changes in Jinan city driven by urbanization. J. Shandong Agric. Univ. (Nat. Sci. Ed.) 2018, 49, 352–358. [Google Scholar]
  31. Wang, P.; Li, X.J. Analysis of the driving mechanism of land use change in Jinan City in the context of urbanization. China Popul.-Resour. Environ. 2017, 202, 151–155. [Google Scholar]
  32. Li, Y.; Fu, H.; Zhang, H. Research on sustainable land use in Jinan City. J. Cap. Norm. Univ. (Nat. Sci. Ed.) 2009, 1, 65–69. [Google Scholar] [CrossRef]
  33. Meng, M.; Cui, X.; Wang, C. Study on the correlation measurement between land use structure and carbon emission in Urumqi city. Soil Water Conserv. Bull. 2018, 38, 178–182, 188. [Google Scholar]
  34. Zhang, M.; Chen, Y.; Cheng, D.; Gan, C. Analysis of land use structure and intensity changes on carbon emissions. Resour. Dev. Mark. 2018, 34, 624–628, 675. [Google Scholar]
  35. Li, J.; Zhang, S.; Hu, Y.; Wu, K. Performance evaluation of cultivated land occupation compensation balance in Guangdong Province Based on Space-Time Perspective. J. Agric. Resour. Environ. 2021, 38, 1064–1073. [Google Scholar]
  36. Jinan Shizhong District Bureau of Statistics, Jinan City, China. Jinan Shizhong District Statistical Yearbook 2012; Jinan Shizhong District Bureau of Statistics: Jinan, China, 2012. [Google Scholar]
  37. Li, N. Study on the Dynamics of Cultivated Land and Its Driving Forces in Jinan City. Master’s Thesis, Shandong Normal University, Jinan, China, 2010. [Google Scholar]
  38. Chen, Y.; Zhao, L.; Tao, J.; Zhang, P. Habitat quality evaluation of unused land before and after development based on InVEST model—Tang County as an example. Chin. J. Ecol. Agric. 2020, 28, 1093–1102. [Google Scholar] [CrossRef]
  39. Wang, P. Analysis of Land Use Changes and Driving Forces in Jinan City in the Context of Urbanization. Master’s Thesis, Shandong Agricultural University, Taian, China, 2018. [Google Scholar]
  40. Hu, Y.; Zheng, X. Economical and intensive utilization of construction land under the concept of ecological civilization. China Land 2019, 06, 13–14. [Google Scholar] [CrossRef]
  41. Sun, L. Research on Evaluating the Economical and Intensive Use of Construction Land in Jinan City. Master’s Thesis, Shandong University of Construction, Jinan, China, 2015. [Google Scholar]
  42. Implementation Opinions of the General Office of Jinan Municipal People’s Government on Deepening the Redevelopment of Low-Effective Construction Land in Cities and Towns. Jinan Munic. People’s Gov. Bull. 2019, 27–32.
  43. Deng, S. Analysis of Landscape Pattern and Ecosystem Service Value in Jiangxi Province under Land Use Change. Master’s Thesis, Donghua University of Technology, Shanghai, China, 2021. [Google Scholar] [CrossRef]
  44. Bian, D. Research on the Causes of Urban Idle Low-Utility Land in Yangzhou and Countermeasures for Prevention and Control. Master’s Thesis, Nanjing Normal University, Nanjing, China, 2020. [Google Scholar] [CrossRef]
Figure 1. Location and zoning map of Jinan City.
Land 11 01045 g001
Figure 2. Land use change maps of Jinan City.
Land 11 01045 g002
Figure 3. Flow chart of intensity analysis.
Land 11 01045 g003
Figure 4. Land use area and intensity changes in three-time intervals in Jinan City.
Land 11 01045 g004
Figure 5. Area and intensity changes for six land use categories in Jinan City, 2005–2010.
Land 11 01045 g005
Figure 6. Area and intensity changes for six land use categories in Jinan City, 2010–2015.
Land 11 01045 g006
Figure 7. Area and intensity changes for six land use categories in Jinan City, 2015–2018.
Land 11 01045 g007
Figure 8. Intensity analysis for transition to construction land based on the observed gains, 2005–2010.
Land 11 01045 g008
Figure 9. Intensity analysis for transition to construction land based on the observed gains, 2010–2015.
Land 11 01045 g009
Figure 10. Intensity analysis for transition to construction land based on the observed gains, 2015–2018.
Land 11 01045 g010
Figure 11. Intensity analysis for transition from cultivated land on the observed losses, 2005–2010.
Land 11 01045 g011
Figure 12. Intensity analysis for transition from cultivated land on the observed losses, 2010–2015.
Land 11 01045 g012
Figure 13. Intensity analysis for transition from cultivated land on the observed losses, 2015–2018.
Land 11 01045 g013
Table 1. Annotation meaning table.
NotesDefinition
TNumber of time points
  Y t Year of time point t
tIdentifier of the initial time point of time interval [ Y t , Y t + 1 ], ranging from 1 to T1 number of land categories
JInterval initial time point of a land category
iInterval final time point of a land category
jNumber of elements transited from land category i to land category j in the interval [ Y t , Y t + 1 ], the gain in land category j
C t i j Number of elements converted from land category j to land category i in the interval [ Y t , Y t + 1 ], the decrease of land category j
StThe average annual variation intensity in the interval [ Y t , Y t + 1 ]
UEquilibrium change intensity in the interval [ Y t , Y t + 1 ]
G t j The average annual gain in intensity of land category j in the interval [ Y t , Y t + 1 ], elative to time t + 1
L t i Annual average loss intensity of land category i in the interval [ Y t , Y t + 1 ] relative to time t
R t i n Annual average convert intensity of convert to land category n for land category i in the interval [ Y t , Y t + 1 ] relative to time t
W t n Annual average equilibrium convert intensity of all not-n land categories converted to n land categories in the interval [ Y t , Y t + 1 ] relative to time t
Q t m j Annual average transition intensity of transition from land category m to land category j in the interval [ Y t , Y t + 1 ] relative to land category j at time t + 1
V t m Annual average equilibrium transition intensity of m land categories converting to not-m land categories in [ Y t , Y t + 1 ] relative to not-m land categories at time t + 1
Table 2. Interval level results of each district and county.
Districts and Counties NameInterval Level
(Time Period)
Interval Intensity (St)Uniform Intensity (U)Fast or Slow
Shanghe County2005–20102.76%1.06%Fast
2010–20152.403‰Slow
2015–20183.28‰Slow
Jiyang District2005–20101.28%0.21%Fast
2010–20151.540‰Slow
2015–20184.872‰Slow
Zhangqiu District2005–20104.18%1.75%Fast
2010–201521.83%Fast
2015–201835.91%Fast
Tianqiao District2005–20101.92%1.95%Slow
2010–20150.38%Slow
2015–20185.59%Fast
Licheng District2005–20105.40%2.49%Fast
2010–20150.70%Slow
2015–20180.83%Slow
Lixia District2005–201014.31%4.067%Fast
2010–20153.48‰Slow
2015–20181.56%Slow
Huaiyin District2005–20109.970%5.11%Fast
2010–20152.16%Slow
2015–20182.67%Slow
Shizhong District2005–20106.38%2.63%Fast
2010–20152.34‰Slow
2015–20182.64%Fast
Changqing District2005–20103.23%1.29%Fast
2010–20151.166‰Slow
2015–20184.51‰Slow
Pingyin County2005–20101.78%7.41‰Fast
2010–20153.55‰Slow
2015–20185.286‰Slow
Publisher’s Note: MDPI stays neutral with regard to jurisdictional claims in published maps and institutional affiliations.

