
Mitigated Greenhouse Gas Emissions in Cropping Systems by Organic Fertilizer and Tillage Management


Abstract
:1. Introduction
2. Materials and Methods
2.1. Field Site
2.2. Experimental Design
2.3. Soil GHG Flux Calculation
2.4. Soil Measurements
2.5. Crop Yield
2.6. Statistical Analysis
3. Results
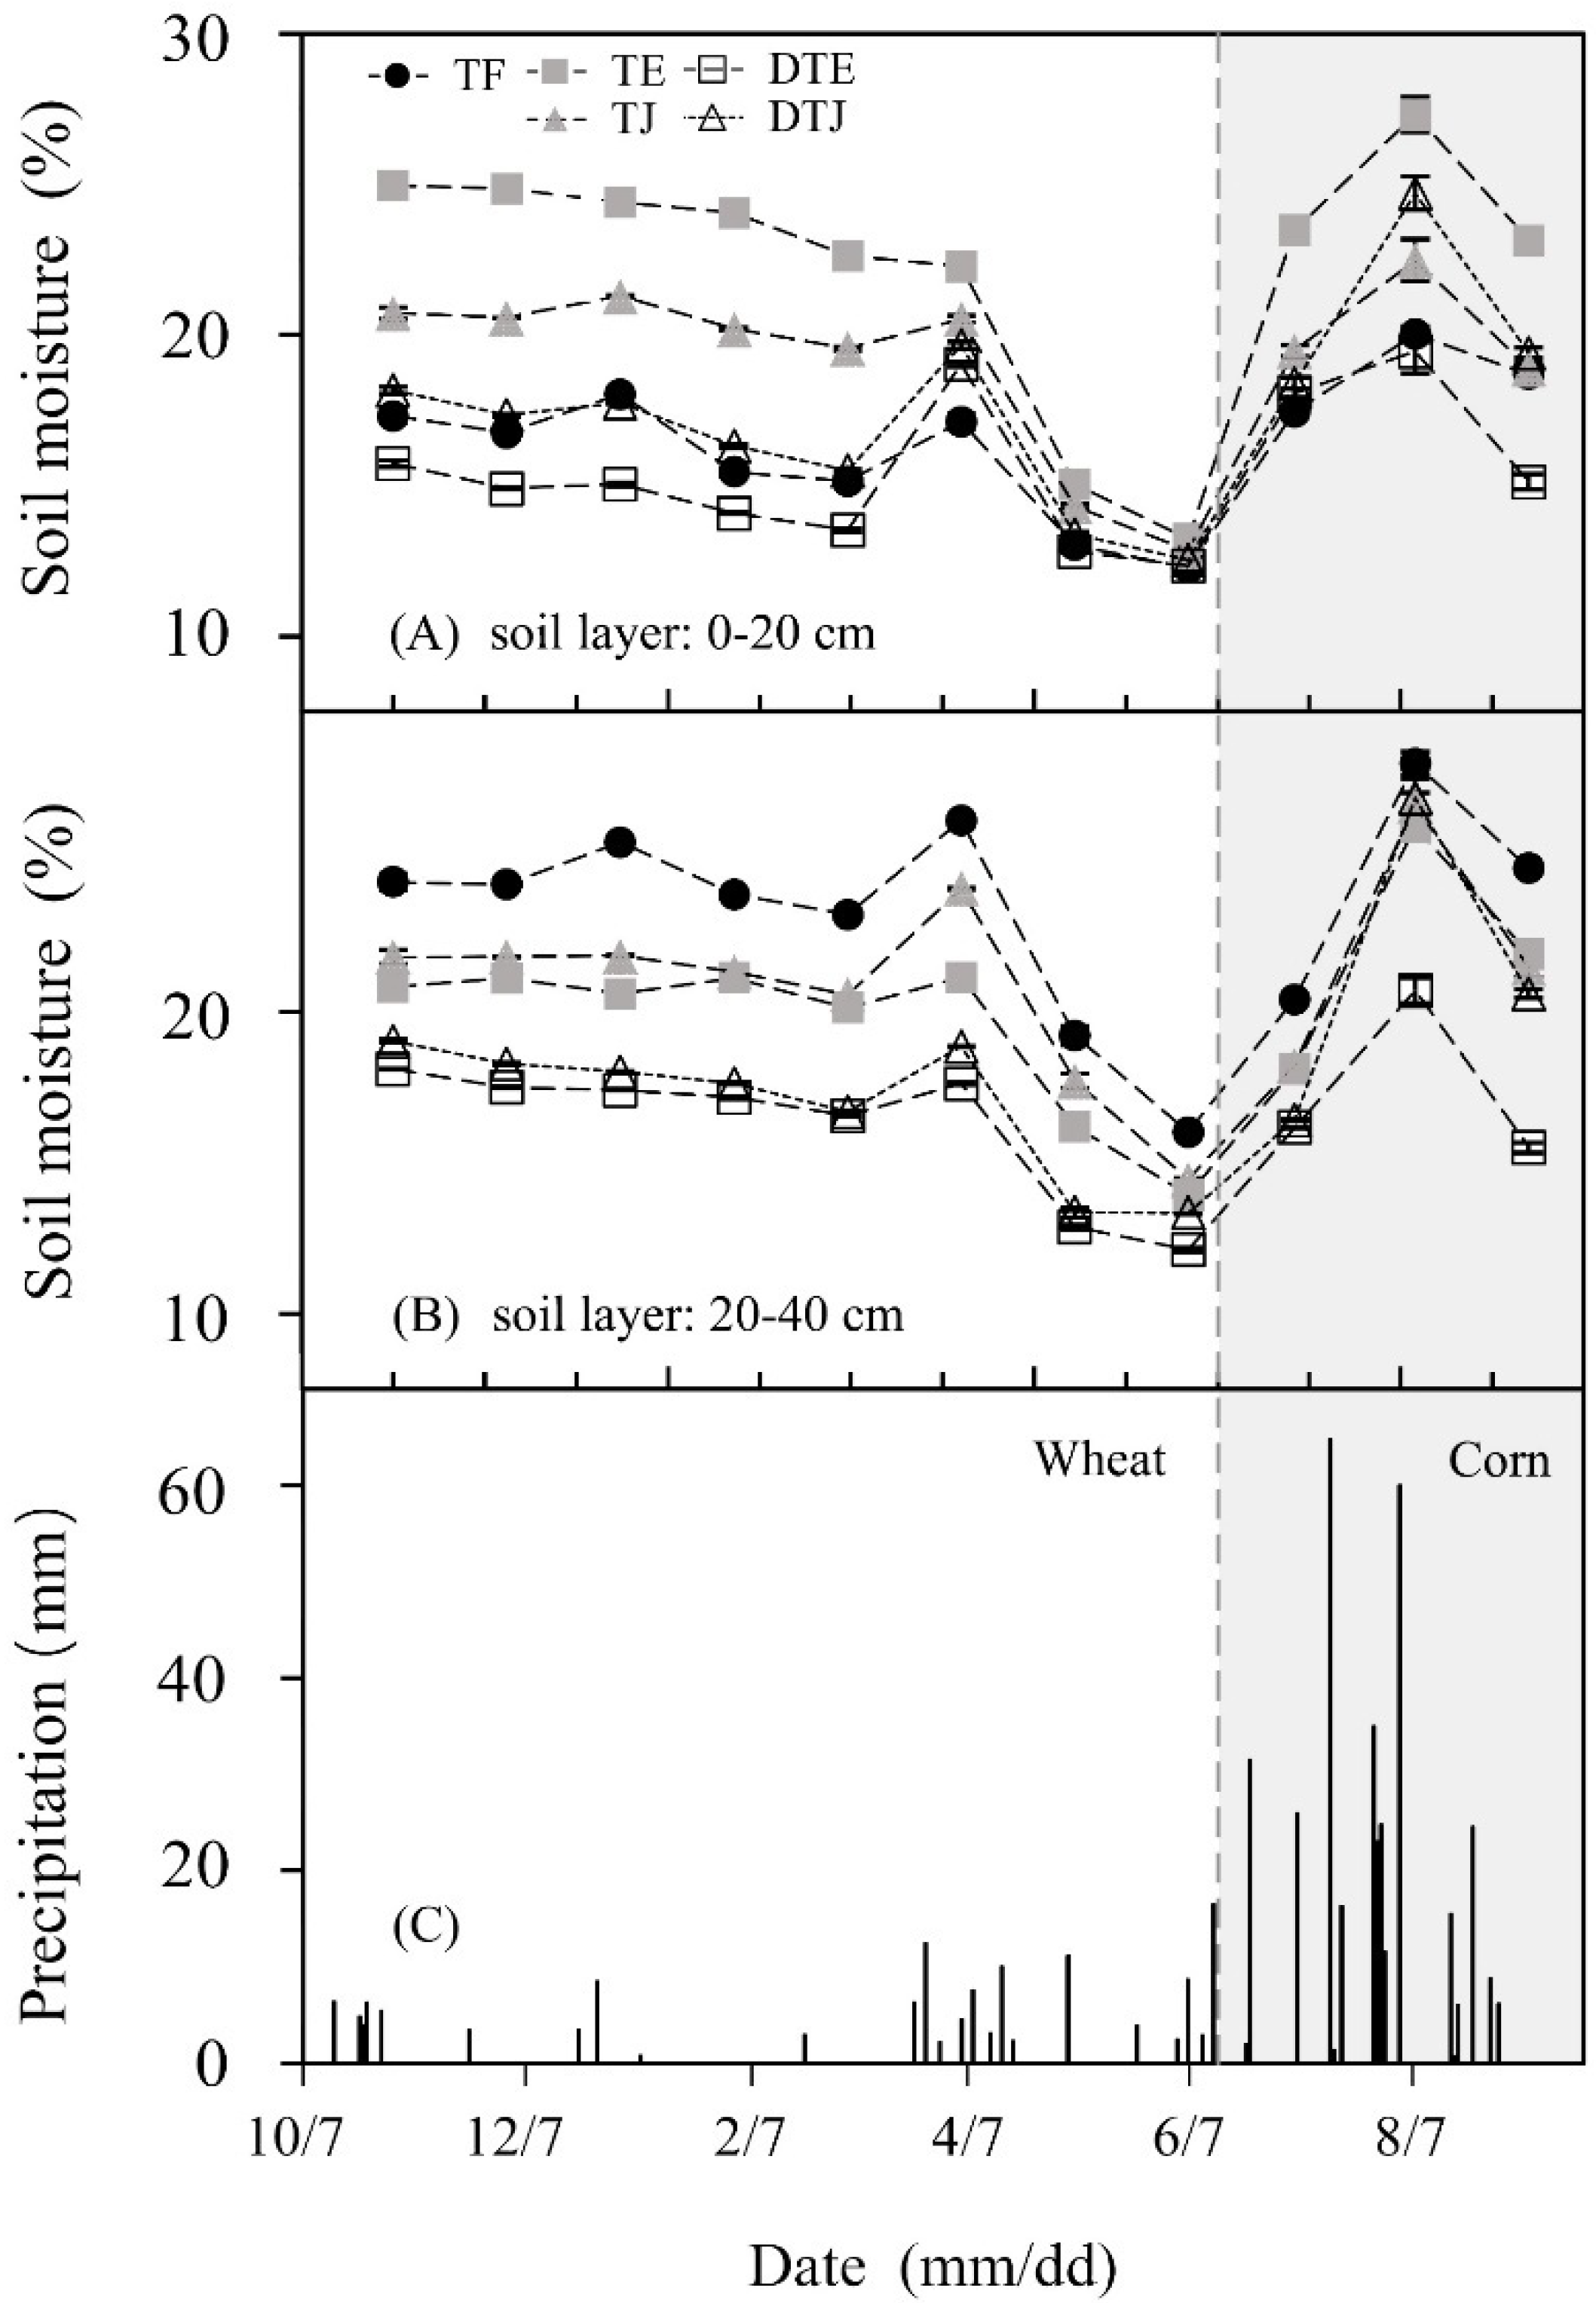
3.1. Soil Moisture
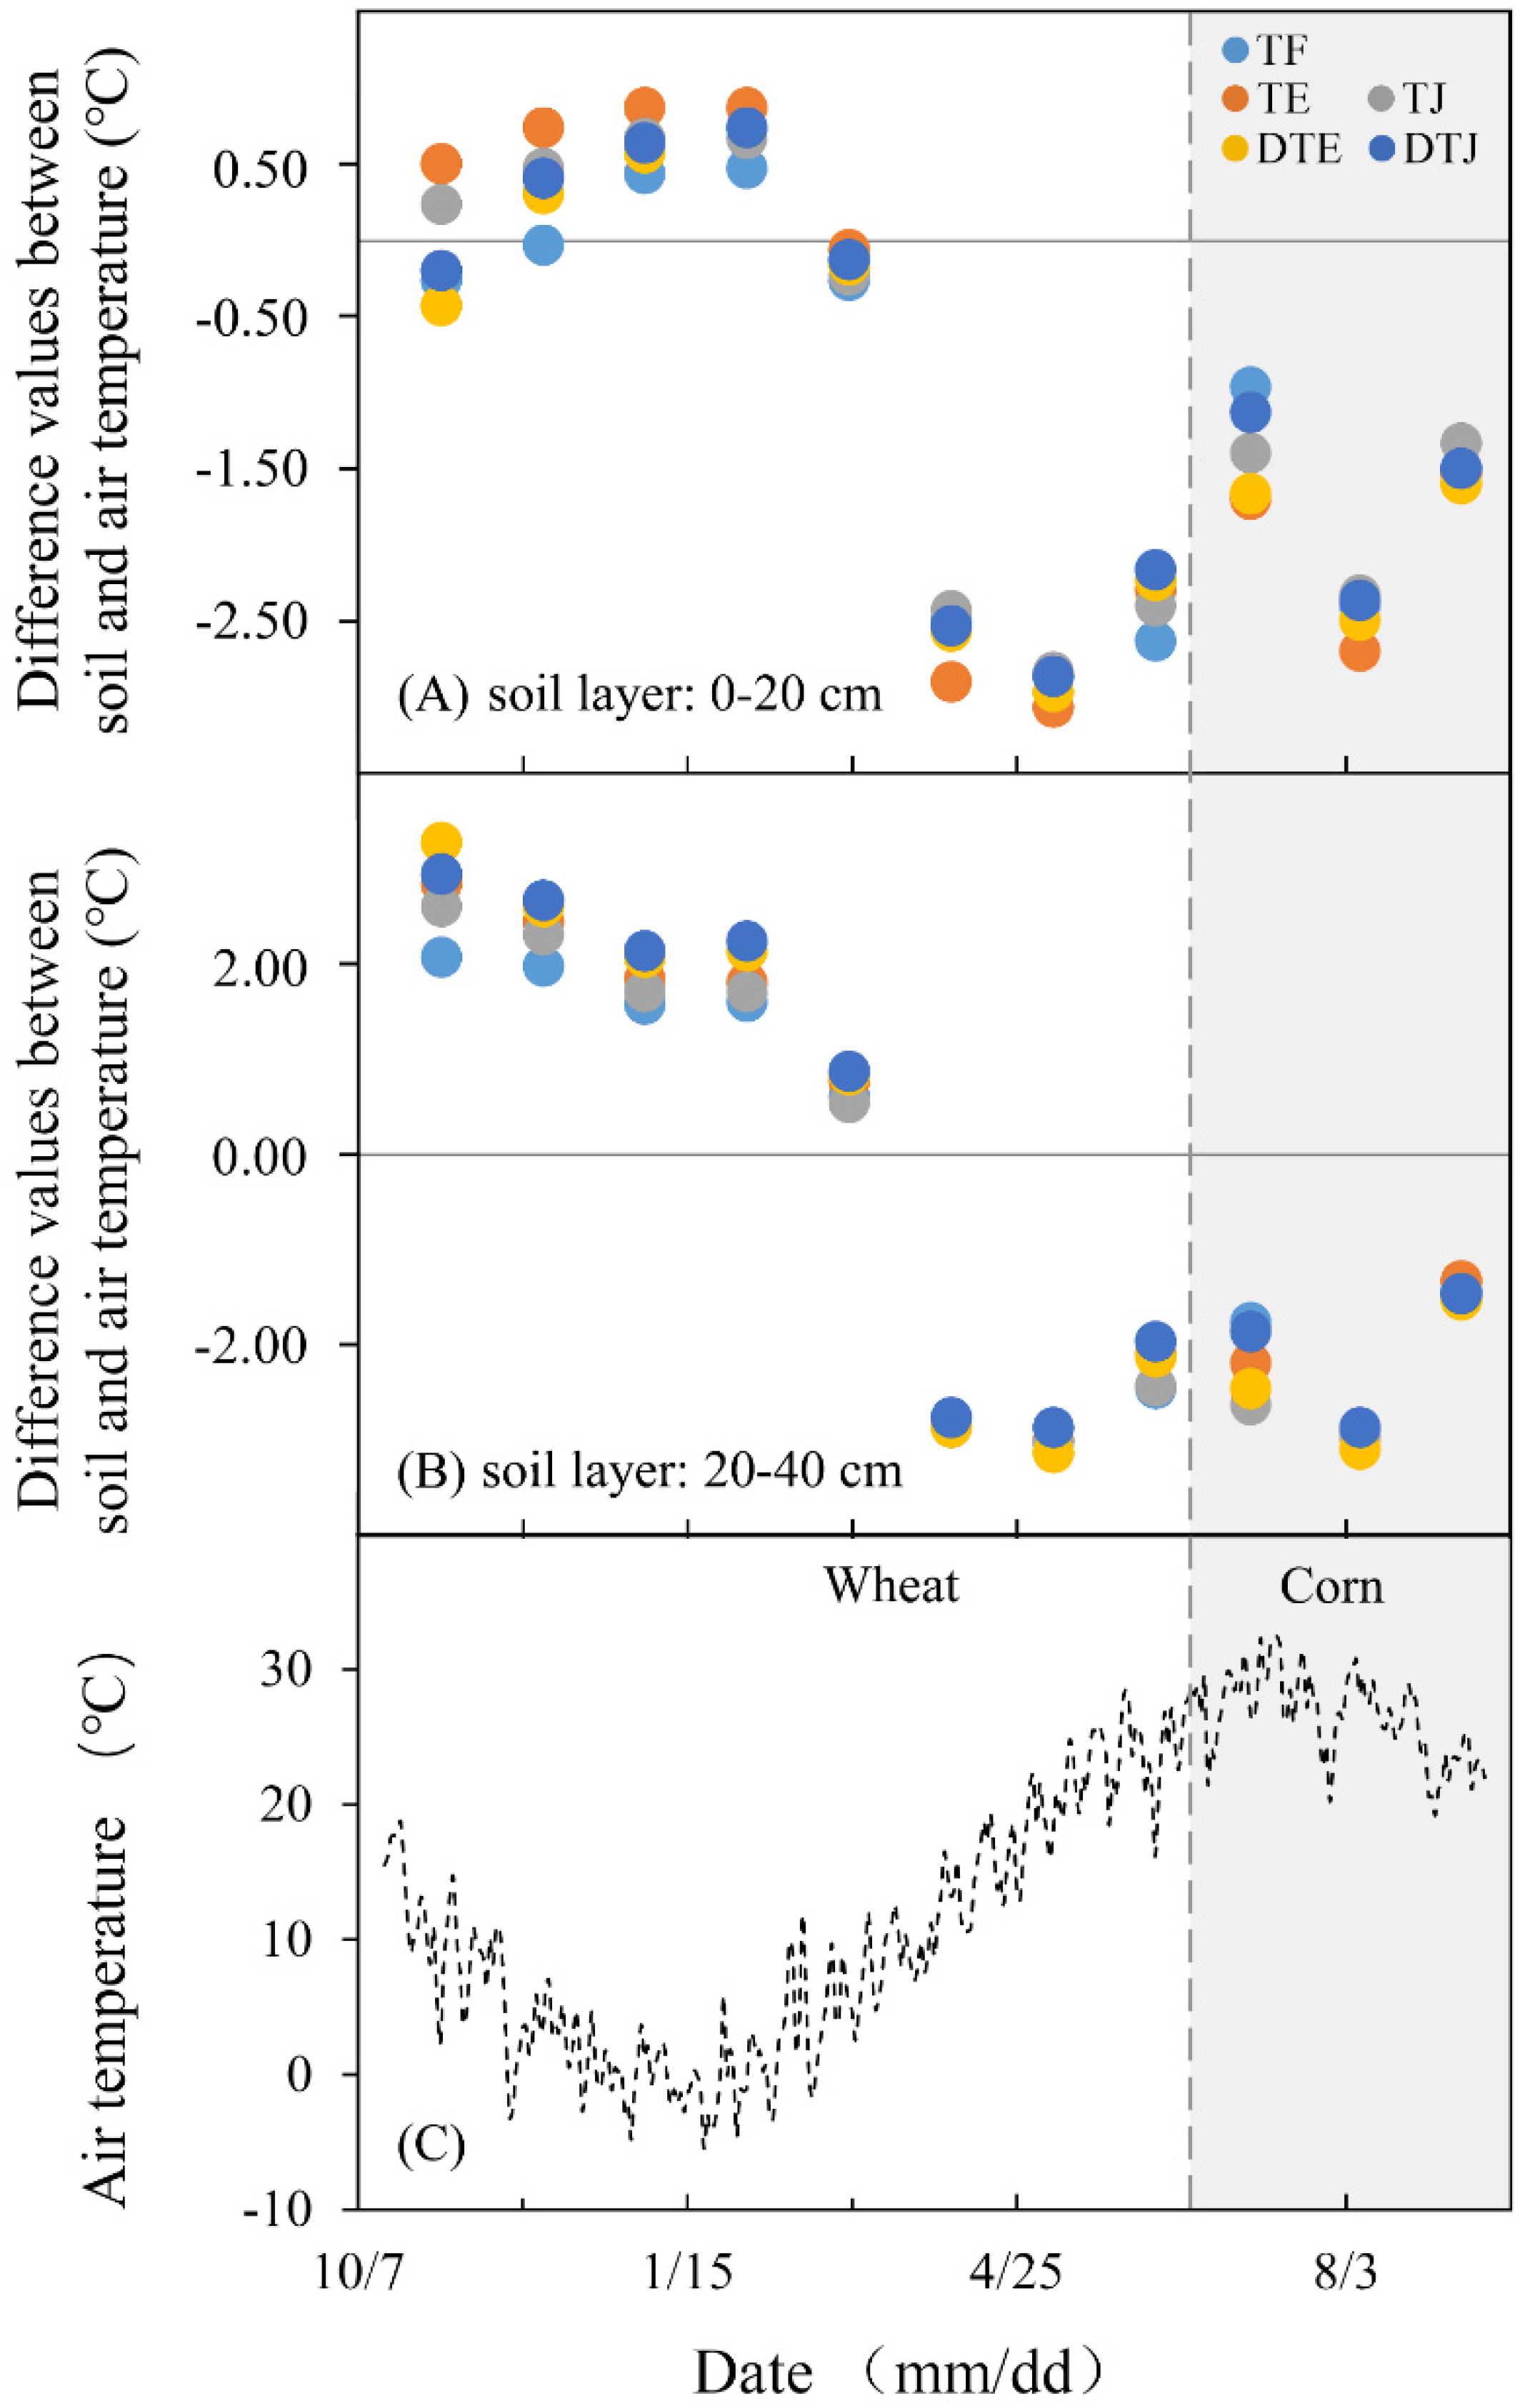
3.2. Soil Temperature
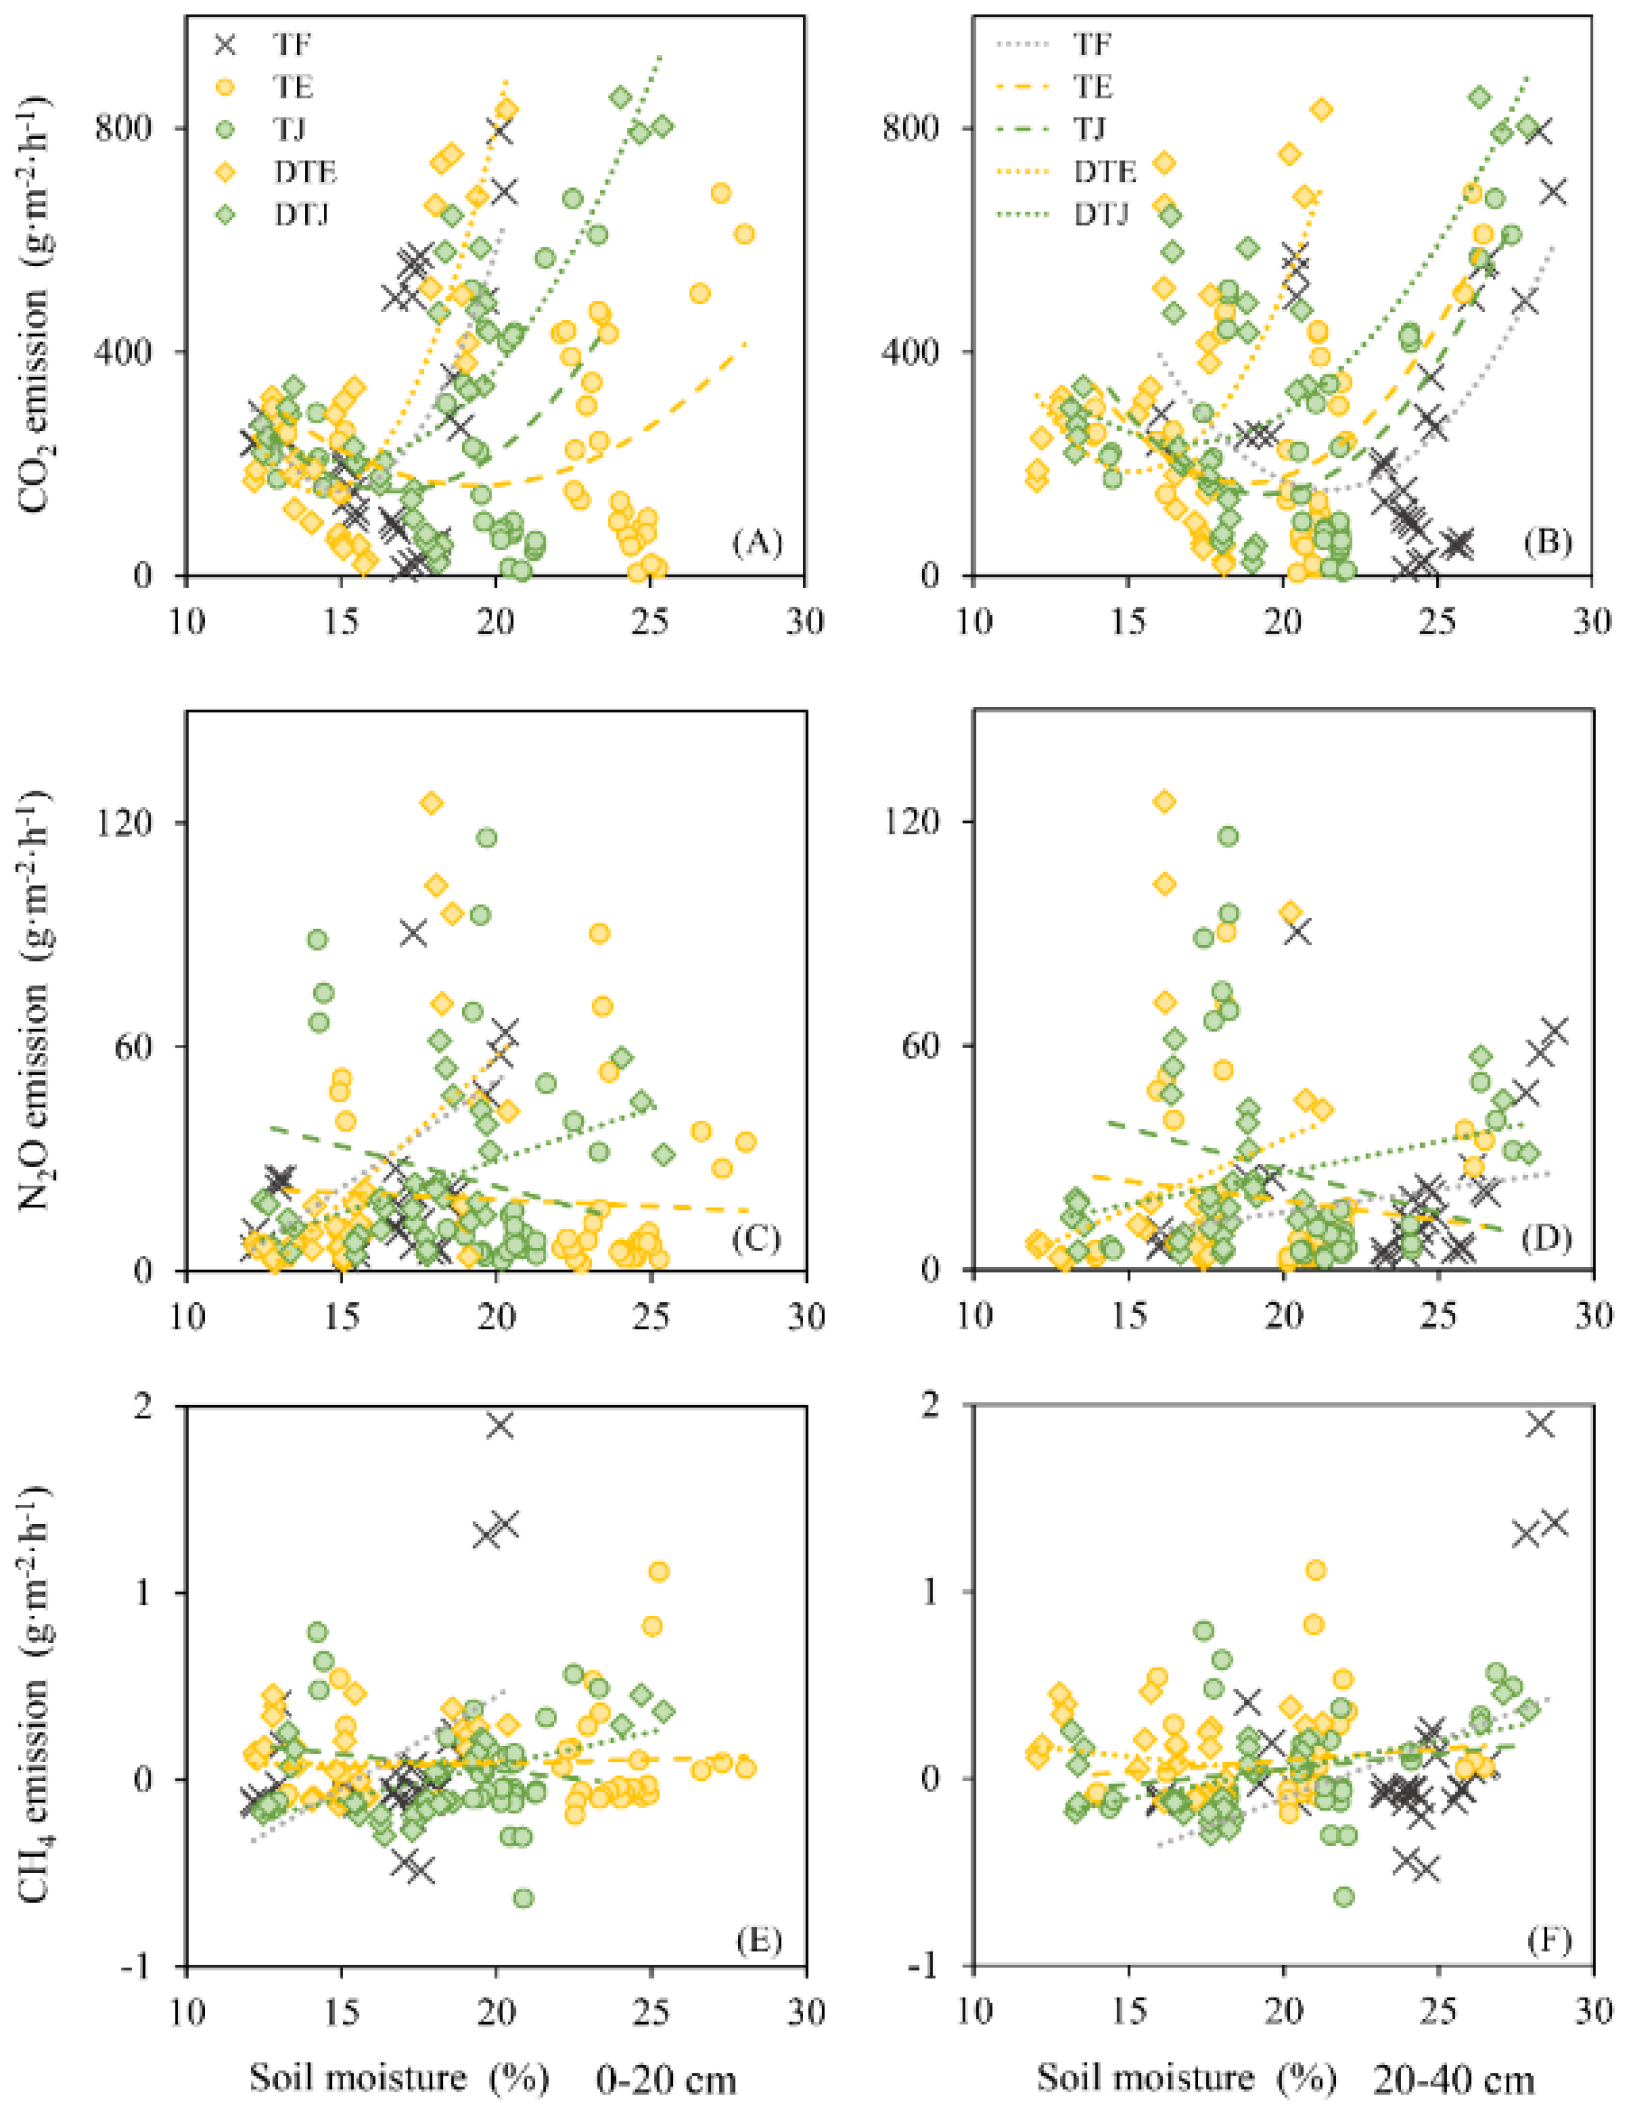
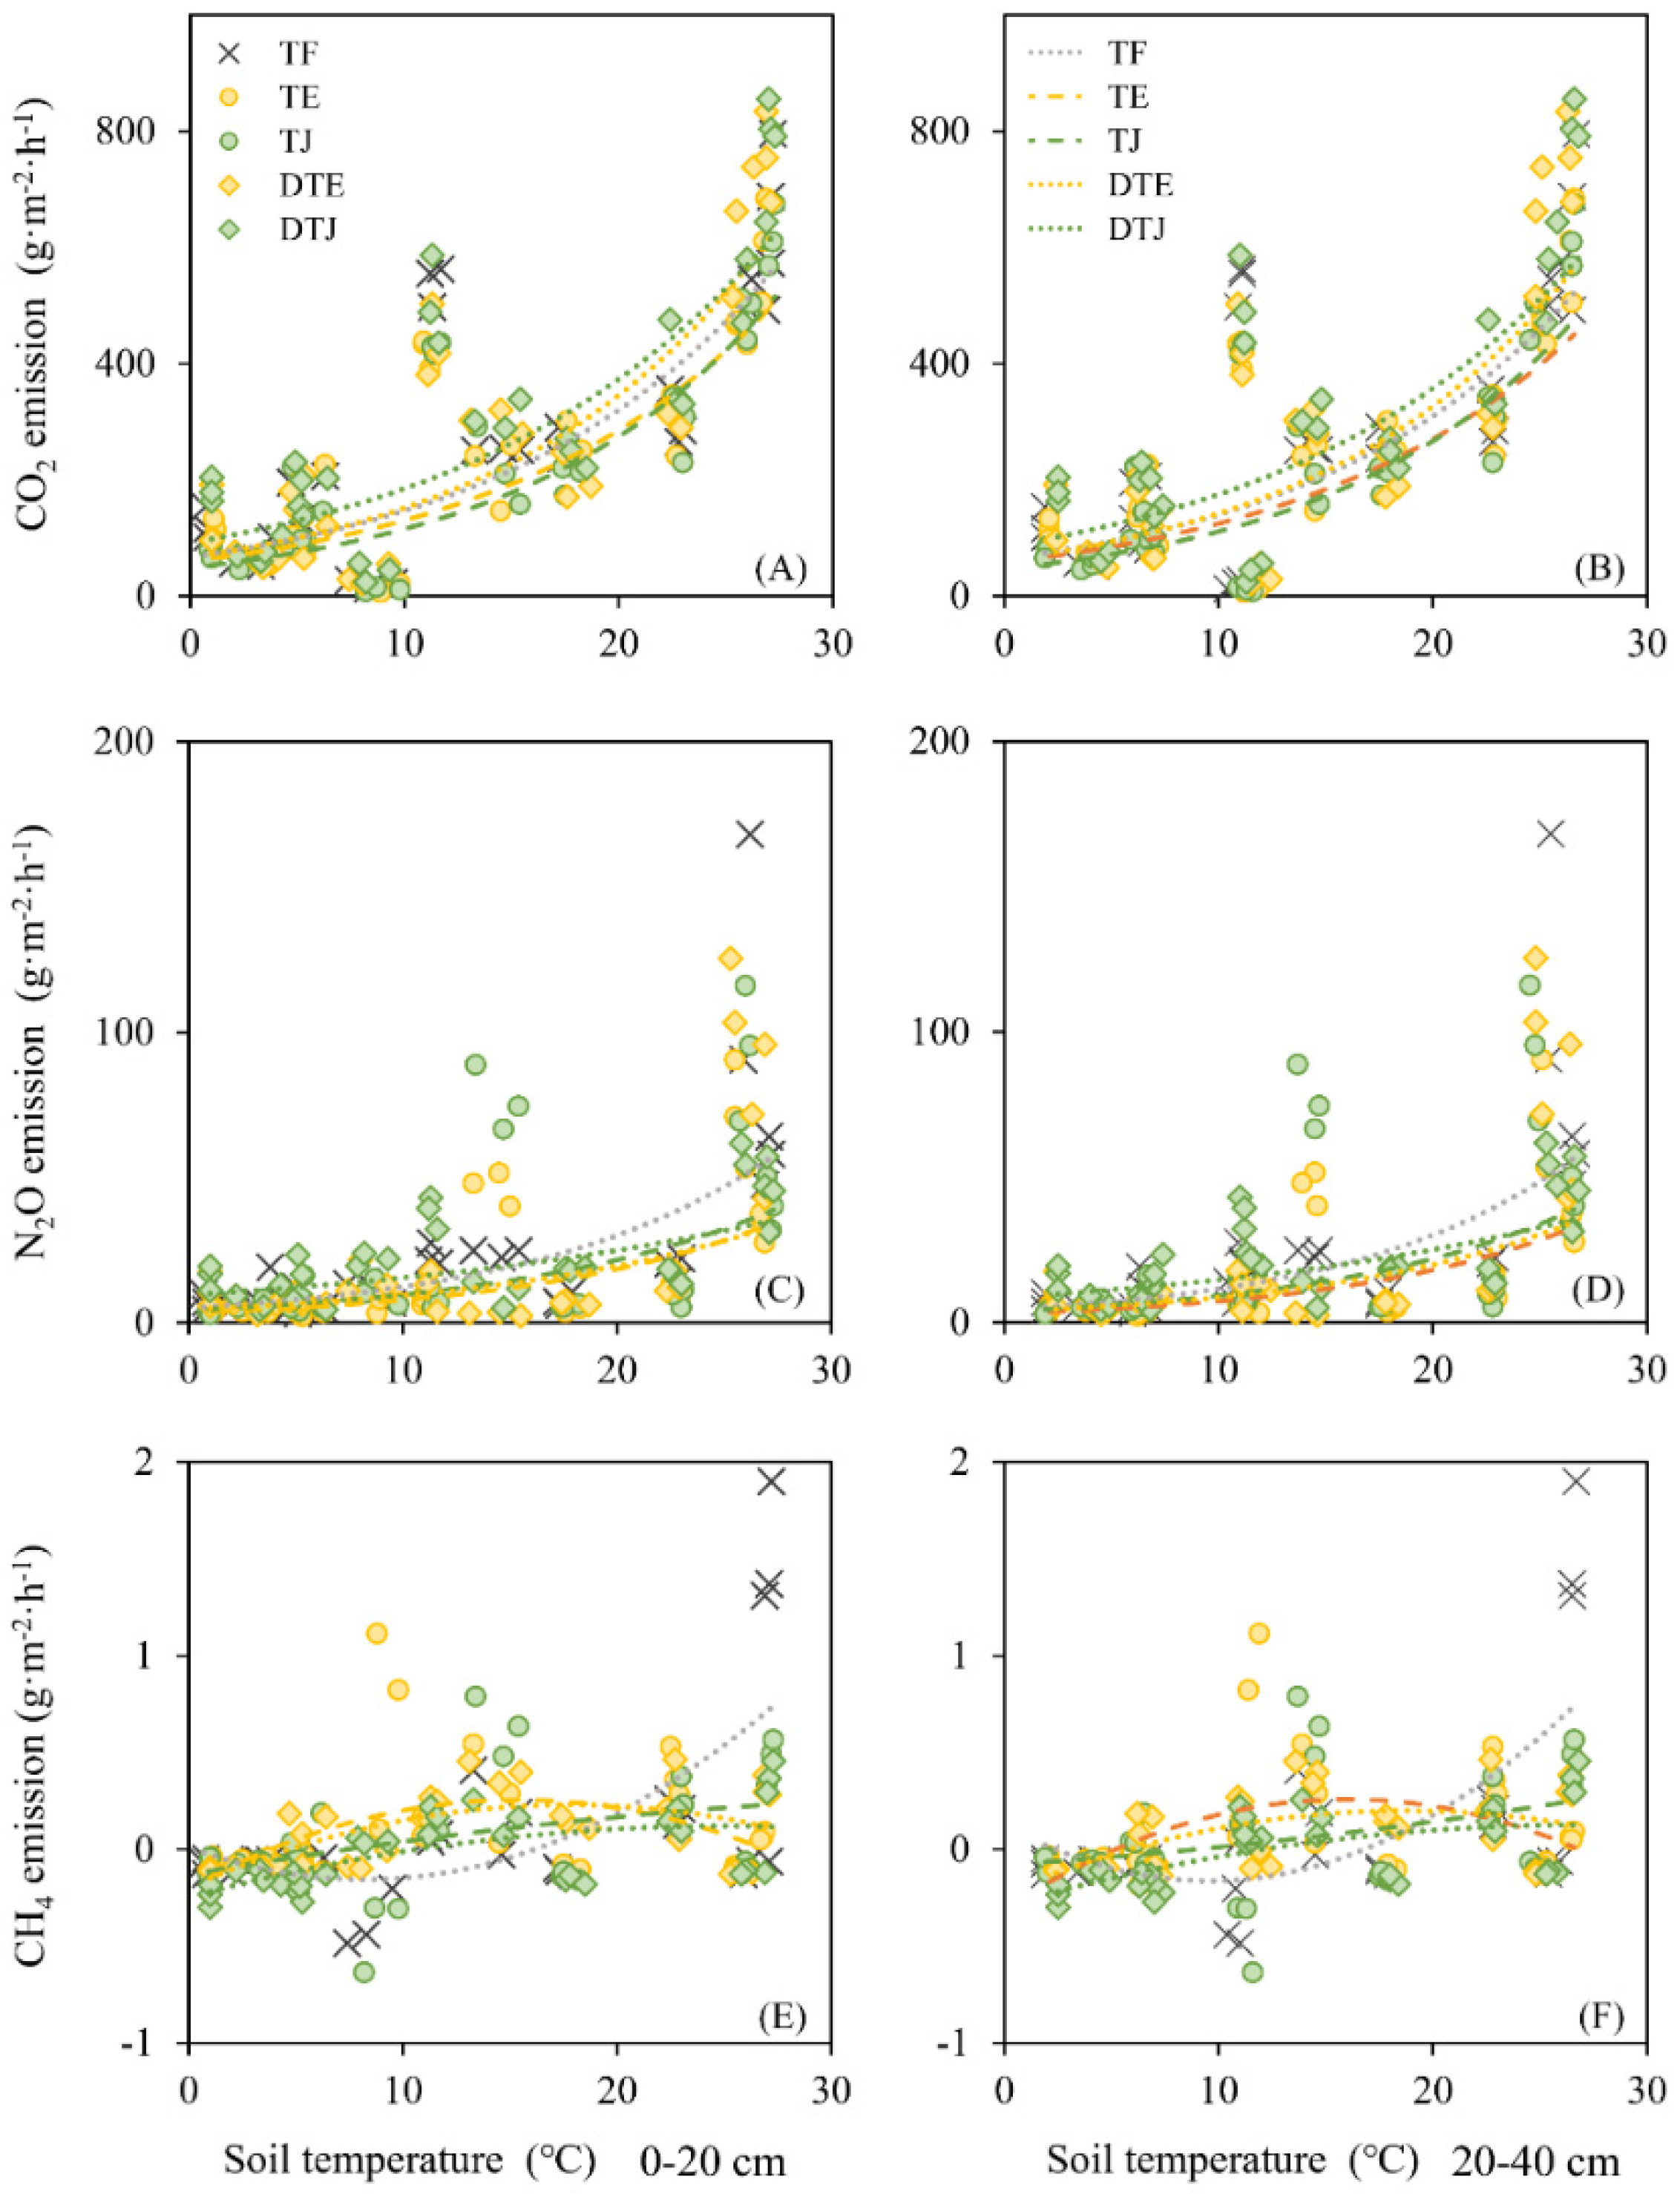
3.3. CO2 Flux Characteristics
3.4. N2O Flux Characteristics
3.5. CH4 Flux Characteristics
3.6. Total GHG Emission
3.7. Crop Yield
4. Discussion
4.1. Effect of Tillage and Fertilizer on Soil Moisture/Temperature
4.2. Effect of Tillage and Fertilizer on GHG Flux and the Relationship with Moisture/Temperature
4.3. Effect of Tillage and Fertilizer on Crop Yield
4.4. Limitations
5. Conclusions
Supplementary Materials
Author Contributions
Funding
Institutional Review Board Statement
Informed Consent Statement
Data Availability Statement
Acknowledgments
Conflicts of Interest
References
- Smith, P.; Martino, D.; Cai, Z.; Gwary, D.; Janzen, H.; Kumar, P.; McCarl, B.; Ogle, S.; O’Mara, F.; Rice, C.; et al. Greenhouse gas mitigation in agriculture. Philos. Trans. R. Soc. B-Biol. Sci. 2008, 363, 789–813. [Google Scholar] [CrossRef] [PubMed] [Green Version]
- Foley, J.A.; Ramankutty, N.; Brauman, K.A.; Cassidy, E.S.; Gerber, J.S.; Johnston, M.; Mueller, N.D.; O’Connell, C.; Ray, D.K.; West, P.C.; et al. Solutions for a cultivated planet. Nature 2011, 478, 337–342. [Google Scholar] [CrossRef] [PubMed] [Green Version]
- Fan, J.; McConkey, B.G.; Liang, B.C.; Angers, D.A.; Janzen, H.H.; Kröbel, R.; Cerkowniak, D.D.; Smith, W.N. Increasing crop yields and root input make Canadian farmland a large carbon sink. Geoderma 2019, 336, 49–58. [Google Scholar] [CrossRef]
- Liu, X.; Ju, X.; Zhang, F.; Pan, J.; Christie, P. Nitrogen dynamics and budgets in a winter wheat-maize cropping system in the North China Plain. Field Crops Res. 2003, 83, 111–124. [Google Scholar] [CrossRef] [Green Version]
- Ju, X.-T.; Xing, G.-X.; Chen, X.-P.; Zhang, S.-L.; Zhang, L.-J.; Liu, X.-J.; Cui, Z.-L.; Yin, B.; Christie, P.; Zhu, Z.-L.; et al. Reducing environmental risk by improving N management in intensive Chinese agricultural systems. Proc. Natl. Acad. Sci. USA 2009, 106, 3041–3046. [Google Scholar] [CrossRef] [Green Version]
- Aliyu, G.; Sanz-Cobena, A.; Müller, C.; Zaman, M.; Luo, J.; Liu, D.; Yuan, J.; Chen, Z.; Niu, Y.; Arowolo, A.; et al. A meta-analysis of soil background N2O emissions from croplands in China shows variation among climatic zones. Agric. Ecosyst. Environ. 2018, 267, 63–73. [Google Scholar] [CrossRef]
- Zhang, T.; Liu, H.; Luo, J.; Wang, H.; Zhai, L.; Geng, Y.; Li, J.; Lei, Q.; Bashir, M.A.; Wu, S.; et al. Long-term manure application increased greenhouse gas emissions but had no effect on ammonia volatilization in a Northern China upland field. Sci. Total Environ. 2018, 633, 230–239. [Google Scholar] [CrossRef]
- Nayak, D.; Saetnan, E.; Cheng, K.; Wang, W.; Koslowski, F.; Cheng, Y.-F.; Zhu, W.Y.; Wang, J.-K.; Liu, J.-X.; Moran, D.; et al. Management opportunities to mitigate greenhouse gas emissions from Chinese agriculture. Agric. Ecosyst. Environ. 2015, 209, 108–124. [Google Scholar] [CrossRef] [Green Version]
- Zhang, L.; Zheng, J.; Chen, L.; Shen, M.; Zhang, X.; Zhang, M.; Bian, X.; Zhang, J.; Zhang, W. Integrative effects of soil tillage and straw management on crop yields and greenhouse gas emissions in a rice–wheat cropping system. Eur. J. Agron. 2015, 63, 47–54. [Google Scholar] [CrossRef]
- Kim, D.-G.; Rafique, R.; Leahy, P.; Cochrane, M.; Kiely, G. Estimating the impact of changing fertilizer application rate, land use, and climate on nitrous oxide emissions in Irish grasslands. Plant Soil 2013, 374, 55–71. [Google Scholar] [CrossRef]
- Volpi, I.; Laville, P.; Bonari, E.; o Di Nasso, N.N.; Bosco, S. Improving the management of mineral fertilizers for nitrous oxide mitigation: The effect of nitrogen fertilizer type, urease and nitrification inhibitors in two different textured soils. Geoderma 2017, 307, 181–188. [Google Scholar] [CrossRef]
- Thangarajan, R.; Bolan, N.S.; Tian, G.; Naidu, R.; Kunhikrishnan, A. Role of organic amendment application on greenhouse gas emission from soil. Sci. Total Environ. 2013, 465, 72–96. [Google Scholar] [CrossRef] [PubMed]
- Fine, P.; Nadas, E. Options to reduce greenhouse gas emissions during wastewater treatment for agricultural use. Sci. Total Environ. 2012, 416, 289–299. [Google Scholar] [CrossRef] [PubMed]
- Gong, H.; Li, J.; Sun, M.; Xu, X.; Ouyang, Z. Lowering carbon footprint of wheat-maize cropping system in North China Plain: Through microbial fertilizer application with adaptive tillage. J. Clean. Prod. 2020, 268, 122255. [Google Scholar] [CrossRef]
- Liu, H.; Li, J.; Li, X.; Zheng, Y.; Feng, S.; Jiang, G. Mitigating greenhouse gas emissions through replacement of chemical fertilizer with organic manure in a temperate farmland. Sci. Bull. 2015, 60, 598–606. [Google Scholar] [CrossRef] [Green Version]
- Singh, J.S.; Strong, P. Biologically derived fertilizer: A multifaceted bio-tool in methane mitigation. Ecotoxicol. Environ. Saf. 2016, 124, 267–276. [Google Scholar] [CrossRef]
- Liu, G.; Yu, H.; Ma, J.; Xu, H.; Wu, Q.; Yang, J.; Zhuang, Y. Effects of straw incorporation along with microbial inoculant on methane and nitrous oxide emissions from rice fields. Sci. Total Environ. 2015, 518–519, 209–216. [Google Scholar] [CrossRef]
- Lupwayi, N.Z.; Lafond, G.P.; Ziadi, N.; Grant, C.A. Soil microbial response to nitrogen fertilizer and tillage in barley and corn. Soil Tillage Res. 2012, 118, 139–146. [Google Scholar] [CrossRef]
- Suleiman, A.K.; Gonzatto, R.; Aita, C.; Lupatini, M.; Jacques, R.J.; Kuramae, E.E.; Antoniolli, Z.I.; Roesch, L.F. Temporal variability of soil microbial communities after application of dicyandiamide-treated swine slurry and mineral fertilizers. Soil Biol. Biochem. 2016, 97, 71–82. [Google Scholar] [CrossRef]
- Mbuthia, L.W.; Acosta-Martínez, V.; DeBruyn, J.; Schaeffer, S.; Tyler, D.; Odoi, E.; Mpheshea, M.; Walker, F.; Eash, N. Long term tillage, cover crop, and fertilization effects on microbial community structure, activity: Implications for soil quality. Soil Biol. Biochem. 2015, 89, 24–34. [Google Scholar] [CrossRef]
- Moraru, P.I.; Rusu, T. Effect of tillage systems on soil moisture, soil temperature, soil respiration and production of wheat, maize and soybean crops. J. Food Agric Environ. 2012, 10, 445–448. [Google Scholar]
- Drury, C.F.; Reynolds, W.D.; Yang, X.M.; McLaughlin, N.B.; Welacky, T.W.; Calder, W.; Grant, C.A. Nitrogen source, application time, and tillage effects on soil nitrous oxide emissions and corn grain yields. Soil Sci. Soc. Am. J. 2012, 76, 1268–1279. [Google Scholar] [CrossRef]
- Dyer, L.; Oelbermann, M.; Echarte, L. Soil carbon dioxide and nitrous oxide emissions during the growing season from temperate maize-soybean intercrops. J. Plant Nutr. Soil Sci. 2012, 175, 394–400. [Google Scholar] [CrossRef]
- Wang, Z.; Hao, X.; Shan, D.; Han, G.; Zhao, M.; Willms, W.D.; Wang, Z.; Han, X. Influence of increasing temperature and nitrogen input on greenhouse gas emissions from a desert steppe soil in Inner Mongolia. Soil Sci. Plant Nutr. 2011, 57, 508–518. [Google Scholar] [CrossRef]
- Gong, H.; Li, J.; Ma, J.; Li, F.; Ouyang, Z.; Gu, C. Effects of tillage practices and microbial agent applications on dry matter accumulation, yield and the soil microbial index of winter wheat in North China. Soil Tillage Res. 2018, 184, 235–242. [Google Scholar] [CrossRef]
- Tu, C.; Li, F. Responses of greenhouse gas fluxes to experimental warming in wheat season under conventional tillage and no-tillage fields. J. Environ. Sci. 2017, 54, 314–327. [Google Scholar] [CrossRef]
- Liu, J.; Shen, J.; Li, Y.; Su, Y.; Ge, T.; Jones, D.L.; Wu, J. Effects of biochar amendment on the net greenhouse gas emission and greenhouse gas intensity in a Chinese double rice cropping system. Eur. J. Soil Biol. 2014, 65, 30–39. [Google Scholar] [CrossRef]
- Cai, Y.; Ding, W.; Luo, J. Nitrous oxide emissions from Chinese maize-wheat rotation systems: A 3-year field measurement. Atmos. Environ. 2013, 65, 112–122. [Google Scholar] [CrossRef]
- Schaufler, G.; Kitzler, B.; Schindlbacher, A.; Skiba, U.; Sutton, M.A.; Zechmeister-Boltenstern, S. Greenhouse gas emissions from European soils under different land use: Effects of soil moisture and temperature. Eur. J. Soil Sci. 2010, 61, 683–696. [Google Scholar] [CrossRef]
- Haynes, R.; Naidu, R. Influence of lime, fertilizer and manure applications on soil organic matter content and soil physical conditions: A review. Nutr. Cycl. Agroecosyst. 1998, 51, 123–137. [Google Scholar] [CrossRef]
- Wang, Y.; Wang, Z.-L.; Zhang, Q.; Hu, N.; Li, Z.; Lou, Y.; Li, Y.; Xue, D.; Chen, Y.; Wu, C.; et al. Long-term effects of nitrogen fertilization on aggregation and localization of carbon, nitrogen and microbial activities in soil. Sci. Total Environ. 2017, 624, 1131–1139. [Google Scholar] [CrossRef] [PubMed]
- Wang, X.; Jia, Z.; Liang, L.; Han, Q.; Yang, B.; Ding, R.; Cui, R.; Wei, T. Effects of organic fertilizer application on soil moisture and economic returns of maize in dryland farming. Trans. Chin. Soc. Agric. Eng. 2012, 28, 144–149. [Google Scholar]
- Lu, W.; Jia, Z.; Zhang, P.; Cai, T.; Li, R.; Hou, X.; Yang, B.; Li, Y. Effects of organic fertilization on winter wheat photosynthetic characteristics and water use efficiency in semi-arid areas of southern Ningxia. Plant Nutr. Fertitizer Sci. 2011, 17, 1066–1074. [Google Scholar]
- Zhang, Q.; Wang, Y.; Wu, Y.; Wang, X.; Du, Z.; Liu, X.; Song, J. Effects of biochar amendment on soil thermal conductivity, reflectance, and temperature. Soil Sci. Soc. Am. J. 2013, 77, 1478–1487. [Google Scholar] [CrossRef]
- Dijkstra, F.A.; Morgan, J.A.; Blumenthal, D.; Follett, R.F. Water limitation and plant inter-specific competition reduce rhizosphere-induced C decomposition and plant N uptake. Soil Biol. Biochem. 2010, 42, 1073–1082. [Google Scholar] [CrossRef]
- Sun, Q.; Wang, R.; Wang, Y.; Du, L.; Zhao, M.; Gao, X.; Hu, Y.; Guo, S. Temperature sensitivity of soil respiration to nitrogen and phosphorous fertilization: Does soil initial fertility matter? Geoderma 2018, 325, 172–182. [Google Scholar] [CrossRef]
- Wang, X.; Li, Z.; Xing, Y. Effects of mulching and nitrogen on soil temperature, water content, nitrate-N content and maize yield in the Loess Plateau of China. Agric. Water Manag. 2015, 161, 53–64. [Google Scholar]
- Bottinelli, N.; Angers, D.; Hallaire, V.; Michot, D.; Le Guillou, C.; Cluzeau, D.; Heddadj, D.; Menasseri-Aubry, S. Tillage and fertilization practices affect soil aggregate stability in a Humic Cambisol of Northwest France. Soil Tillage Res. 2017, 170, 14–17. [Google Scholar] [CrossRef]
- Buragienė, S.; Šarauskis, E.; Romaneckas, K.; Sasnauskienė, J.; Masilionytė, L.; Kriaučiūnienė, Z. Experimental analysis of CO2 emissions from agricultural soils subjected to five different tillage systems in Lithuania. Sci. Total Environ. 2015, 514, 1–9. [Google Scholar] [CrossRef]
- Schneider, F.; Don, A.; Hennings, I.; Schmittmann, O.; Seidel, S.J. The effect of deep tillage on crop yield—What do we really know? Soil Tillage Res. 2017, 174, 193–204. [Google Scholar] [CrossRef]
- Cagnini, C.Z.; Garcia, D.M.; Silva, N.D.S.; Macedo, E.C.; Souza, S.; Da Silva, A.P.; Colauto, N.B. Cover crop and deep tillage on sandstone soil structure and microbial biomass. Arch. Agron. Soil Sci. 2019, 65, 980–993. [Google Scholar] [CrossRef]
- Yang, Z.; Zhao, N.; Huang, F.; Lv, Y. Long-term effects of different organic and inorganic fertilizer treatments on soil organic carbon sequestration and crop yields on the North China Plain. Soil Tillage Res. 2015, 146, 47–52. [Google Scholar] [CrossRef]
- Ozlu, E.; Kumar, S. Response of surface GHG fluxes to long-term manure and inorganic fertilizer application in corn and soybean rotation. Sci. Total Environ. 2018, 626, 817–825. [Google Scholar] [CrossRef]
- Gutser, R.; Ebertseder, T.; Weber, A.; Schraml, M.; Schmidhalter, U. Short-term and residual availability of nitrogen after long-term application of organic fertilizers on arable land. J. Plant Nutr. Soil Sci. 2005, 168, 439–446. [Google Scholar] [CrossRef]
- Jiao, X.; Gao, C.; Sui, Y.; Lv, G.; Wei, D. Effects of long-term fertilization on soil carbon and nitrogen in Chinese mollisols. Agron. J. 2014, 106, 1018–1024. [Google Scholar] [CrossRef]
- Cookson, W.R.; Murphy, D.V.; Roper, M.M. Characterizing the relationships between soil organic matter components and microbial function and composition along a tillage disturbance gradient. Soil Biol. Biochem. 2008, 40, 763–777. [Google Scholar] [CrossRef]
- Gesch, R.; Reicosky, D.; Gilbert, R.; Morris, D. Influence of tillage and plant residue management on respiration of a Florida Everglades Histosol. Soil Tillage Res. 2007, 92, 156–166. [Google Scholar] [CrossRef]
- Ding, W.; Cai, Y.; Cai, Z.; Yagi, K.; Zheng, X. Soil respiration under maize crops: Effects of water, temperature, and nitrogen fertilization. Soil Sci. Soc. Am. J. 2007, 71, 944–951. [Google Scholar] [CrossRef]
- Bekku, Y.S.; Nakatsubo, T.; Kume, A.; Adachi, M.; Koizumi, H. Effect of warming on the temperature dependence of soil respiration rate in arctic, temperate and tropical soils. Appl. Soil Ecol. 2003, 22, 205–210. [Google Scholar] [CrossRef]
- Bi, Y.; Cai, S.; Wang, Y.; Zhao, X.; Wang, S.; Xing, G.; Zhu, Z. Structural and microbial evidence for different soil carbon sequestration after four-year successive biochar application in two different paddy soils. Chemosphere 2020, 254, 126881. [Google Scholar] [CrossRef]
- Li, Y.; Zhou, G.; Huang, W.; Liu, J.; Fang, X. Potential effects of warming on soil respiration and carbon sequestration in a subtropical forest. Plant Soil 2016, 409, 247–257. [Google Scholar] [CrossRef]
- Liu, L.; Li, T.; Wei, X.; Jiang, B.; Fang, P. Effects of a nutrient additive on the density of functional bacteria and the microbial community structure of bioorganic fertilizer. Bioresour. Technol. 2014, 172, 328–334. [Google Scholar] [CrossRef] [PubMed]
- Lloyd, J.; Taylor, J.A. On the temperature dependence of soil respiration. Funct. Ecol. 1994, 8, 315–323. [Google Scholar] [CrossRef]
- Foltz, M.; Zilles, J.L.; Koloutsou-Vakakis, S. Prediction of N2O emissions under different field management practices and climate conditions. Sci. Total Environ. 2018, 646, 872–879. [Google Scholar] [CrossRef] [PubMed]
- Grave, R.A.; Nicoloso, R.; Cassol, P.C.; da Silva, M.L.B.; Mezzari, M.P.; Aita, C.; Wuaden, C.R. Determining the effects of tillage and nitrogen sources on soil N2O emission. Soil Tillage Res. 2018, 175, 1–12. [Google Scholar] [CrossRef]
- Liu, N.; Liao, P.; Zhang, J.; Zhou, Y.; Luo, L.; Huang, H.; Zhang, L. Characteristics of denitrification genes and relevant enzyme activities in heavy-metal polluted soils remediated by biochar and compost. Sci. Total Environ. 2020, 739, 139987. [Google Scholar] [CrossRef]
- Dong, Y.; Scharffe, D.; Manfred, D.; Qi, Y.; Zhang, S. N2O emissions from agricultural soils in the North China Plain: The effect of chemical nitrogen fertilizer and organic manure. J. Environ. Sci. 2000, 12, 463. [Google Scholar]
- Ball, B.C.; Griffiths, B.S.; Topp, C.F.; Wheatley, R.; Walker, R.L.; Rees, R.M.; Watson, C.A.; Gordon, H.; Hallett, P.D.; McKenzie, B.M.; et al. Seasonal nitrous oxide emissions from field soils under reduced tillage, compost application or organic farming. Agric. Ecosyst. Environ. 2014, 189, 171–180. [Google Scholar] [CrossRef]
- van Kessel, C.; Venterea, R.; Six, J.; Adviento-Borbe, M.A.; Linquist, B.; van Groenigen, K.J. Climate, duration, and N placement determine N2O emissions in reduced tillage systems: A meta-analysis. Glob. Chang. Biol. 2013, 19, 33–44. [Google Scholar] [CrossRef]
- Cai, Z.; Gao, S.; Hendratna, A.; Duan, Y.; Xu, M.; Hanson, B. Key factors, soil nitrogen processes, and nitrite accumulation affecting nitrous oxide emissions. Soil Sci. Soc. Am. J. 2016, 80, 1560–1571. [Google Scholar] [CrossRef]
- Hu, J.; Inglett, K.S.; Clark, M.W.; Inglett, P.W.; Reddy, K.R. Nitrous oxide production and consumption by denitrification in a grassland: Effects of grazing and hydrology. Sci. Total Environ. 2015, 532, 702–710. [Google Scholar] [CrossRef] [PubMed]
- Schindlbacher, A.; Zechmeister-Boltenstern, S.; Butterbach-Bahl, K. Effects of soil moisture and temperature on NO, NO2, and N2O emissions from European forest soils. J. Geophys. Res. Atmos. 2004, 109, D17. [Google Scholar] [CrossRef]
- Hu, X.-K.; Su, F.; Ju, X.-T.; Gao, B.; Oenema, O.; Christie, P.; Huang, B.-X.; Jiang, R.-F.; Zhang, F.-S. Greenhouse gas emissions from a wheat-maize double cropping system with different nitrogen fertilization regimes. Environ. Pollut. 2013, 176, 198–207. [Google Scholar] [CrossRef] [PubMed]
- Liu, C.; Wang, K.; Zheng, X. Responses of N2O and CH4 fluxes to fertilizer nitrogen addition rates in an irrigated wheat-maize cropping system in northern China. Biogeosciences 2012, 9, 839–850. [Google Scholar] [CrossRef] [Green Version]
- Zhang, A.; Bian, R.; Pan, G.; Cui, L.; Hussain, Q.; Li, L.; Zheng, J.; Zheng, J.; Zhang, X.; Han, X.; et al. Effects of biochar amendment on soil quality, crop yield and greenhouse gas emission in a Chinese rice paddy: A field study of 2 consecutive rice growing cycles. Field Crop. Res. 2012, 127, 153–160. [Google Scholar] [CrossRef]
- Wang, Y.Y.; Hu, C.S.; Ming, H.; Zhang, Y.M.; Li, X.X.; Dong, W.X.; Oenema, O. Concentration profiles of CH4, CO2 and N2O in soils of a wheat-maize rotation ecosystem in North China Plain, measured weekly over a whole year. Agric. Ecosyst. Environ. 2013, 164, 260–272. [Google Scholar] [CrossRef]
- Bista, P.; Norton, U.; Ghimire, R.; Norton, J.B. Effects of tillage system on greenhouse gas fluxes and soil mineral nitrogen in wheat (Triticum aestivum, L.)-fallow during drought. J. Arid Environ. 2017, 147, 103–113. [Google Scholar] [CrossRef]
- Zhang, J.; Hang, X.; Lamine, S.M.; Jiang, Y.; Afreh, D.; Qian, H.; Feng, X.; Zheng, C.; Deng, A.; Song, Z.; et al. Interactive effects of straw incorporation and tillage on crop yield and greenhouse gas emissions in double rice cropping system. Agric. Ecosyst. Environ. 2017, 250, 37–43. [Google Scholar] [CrossRef]
- Wang, G.; Liang, Y.; Zhang, Q.; Jha, S.K.; Gao, Y.; Shen, X.; Sun, J.; Duan, A. Mitigated CH4 and N2O emissions and improved irrigation water use efficiency in winter wheat field with surface drip irrigation in the North China Plain. Agric. Water Manag. 2016, 163, 403–407. [Google Scholar] [CrossRef]
- Wang, X.; Zhou, B.; Sun, X.; Yue, Y.; Ma, W.; Zhao, M. Soil tillage management affects maize grain yield by regulating spatial distribution coordination of roots, soil moisture and nitrogen status. PLoS ONE 2015, 10, e0129231. [Google Scholar] [CrossRef] [Green Version]
- Liang, Q.; Chen, H.; Gong, Y.; Fan, M.; Yang, H.; Lal, R.; Kuzyakov, Y. Effects of 15 years of manure and inorganic fertilizers on soil organic carbon fractions in a wheat-maize system in the North China Plain. Nutr. Cycl. Agroecosyst. 2012, 92, 21–33. [Google Scholar] [CrossRef]
- Jeffery, S.; Verheijen, F.G.A.; van der Velde, M.; Bastos, A.C. A quantitative review of the effects of biochar application to soils on crop productivity using meta-analysis. Agric. Ecosyst. Environ. 2011, 144, 175–187. [Google Scholar] [CrossRef]
- Chen, J.; Zheng, M.-J.; Pang, D.-W.; Yin, Y.-P.; Han, M.-M.; Li, Y.-X.; Luo, Y.-L.; Xu, X.; Li, Y.; Wang, Z.-L. Straw return and appropriate tillage method improve grain yield and nitrogen efficiency of winter wheat. J. Integr. Agric. 2017, 16, 1708–1719. [Google Scholar] [CrossRef] [Green Version]
- Zhai, L.; Xu, P.; Zhang, Z.; Li, S.; Xie, R.; Zhai, L.; Wei, B. Effects of deep vertical rotary tillage on dry matter accumulation and grain yield of summer maize in the Huang-Huai-Hai Plain of China. Soil Tillage Res. 2017, 170, 167–174. [Google Scholar] [CrossRef]
- Pinto, R.M.D.S.; Weigelhofer, G.; Diaz-Pines, E.; Brito, A.G.; Zechmeister-Boltenstern, S.; Hein, T. River-floodplain restoration and hydrological effects on GHG emissions: Biogeochemical dynamics in the parafluvial zone. Sci. Total Environ. 2020, 715, 136980. [Google Scholar] [CrossRef]
- Wang, X.; Siciliano, S.; Helgason, B.; Bedard-Haughn, A. Responses of a mountain peatland to increasing temperature: A microcosm study of greenhouse gas emissions and microbial community dynamics. Soil Biol. Biochem. 2017, 110, 22–33. [Google Scholar] [CrossRef]


| Treatment | Tillage before Sowing | Basal Fertilization Rate | Topdressing Rate | |||||||
|---|---|---|---|---|---|---|---|---|---|---|
| Wheat | Corn | Wheat | Corn | Wheat | Corn | |||||
| CCF | ETS | JS | CCF | ETS | JS | Urea | ||||
| kg°N°ha−1 | kg°ha−1 | L°ha−1 | kg°N°ha−1 | kg°ha−1 | L°ha−1 | kg°N°ha−1 | ||||
| TF | RT | NT | 112.5 | - | - | 112.5 | - | - | 112.5 | 112.5 |
| TE | RT | 78.75 | 3000 | - | 78.75 | 3000 | - | 78.75 | 78.75 | |
| TJ | RT | 78.75 | - | 30 | 78.75 | - | 30 | 78.75 | 78.75 | |
| DTE | DT | 78.75 | 3000 | - | 78.75 | 3000 | - | 78.75 | 78.75 | |
| DTJ | DT | 78.75 | - | 30 | 78.75 | - | 30 | 78.75 | 78.75 | |
| Factor | Treatments | Layer | Type | CO2 (mg·m−2·h−1) | N2O (µg·m−2·h−1) | CH4 (µg·m−2·h−1) | |||
|---|---|---|---|---|---|---|---|---|---|
| R2 | p | R2 | p | R2 | p | ||||
| Moisture | TF | 0–20 cm | Linear | 0.317 | ** | 0.071 | ns | 0.203 | ** |
| Quadratic | 0.112 | ns | 0.072 | ns | 0.681 | *** | |||
| TE | Linear | 0.003 | ns | 0.005 | ns | 0.004 | ns | ||
| Quadratic | 0.080 | ns | 0.007 | ns | 0.003 | ns | |||
| TJ | Linear | 0.015 | ns | 0.038 | ns | 0.028 | ns | ||
| Quadratic | 0.072 | ns | 0.046 | ns | 0.041 | ns | |||
| DTE | Linear | 0.498 | *** | 0.345 | *** | 0.001 | ns | ||
| Quadratic | 0.697 | *** | 0.302 | ** | 0.338 | ** | |||
| DTJ | Linear | 0.382 | ** | 0.312 | ** | 0.341 | ** | ||
| Quadratic | 0.583 | *** | 0.318 | ** | 0.521 | *** | |||
| TF | 20–40 cm | Linear | 0.025 | ns | 0.042 | ns | 0.183 | * | |
| Quadratic | 0.270 | ** | 0.158 | * | 0.557 | *** | |||
| TE | Linear | 0.056 | ns | 0.020 | ns | 0.017 | ns | ||
| Quadratic | 0.327 | ** | 0.044 | ns | 0.025 | ns | |||
| TJ | Linear | 0.057 | ns | 0.052 | ns | 0.032 | ns | ||
| Quadratic | 0.396 | ** | 0.059 | ns | 0.102 | ns | |||
| DTE | Linear | 0.060 | ns | 0.076 | ns | 0.044 | ns | ||
| Quadratic | 0.240 | * | 0.083 | ns | 0.303 | ** | |||
| DTJ | Linear | 0.251 | ** | 0.143 | * | 0.327 | ** | ||
| Quadratic | 0.482 | *** | 0.158 | * | 0.483 | *** | |||
| Temperature | TF | 0–20 cm | Linear | 0.597 | *** | 0.375 | ** | 0.307 | ** |
| Quadratic | 0.610 | *** | 0.498 | *** | 0.408 | *** | |||
| TE | Linear | 0.642 | *** | 0.403 | *** | 0.016 | ns | ||
| Quadratic | 0.667 | *** | 0.424 | *** | 0.171 | ns | |||
| TJ | Linear | 0.656 | *** | 0.319 | ** | 0.158 | * | ||
| Quadratic | 0.684 | *** | 0.323 | ** | 0.160 | ns | |||
| DTE | Linear | 0.668 | *** | 0.408 | *** | 0.200 | * | ||
| Quadratic | 0.726 | *** | 0.602 | *** | 0.374 | ** | |||
| DTJ | Linear | 0.635 | *** | 0.406 | *** | 0.334 | ** | ||
| Quadratic | 0.682 | *** | 0.459 | *** | 0.368 | ** | |||
| TF | 20–40 cm | Linear | 0.547 | *** | 0.361 | ** | 0.294 | ** | |
| Quadratic | 0.570 | *** | 0.455 | *** | 0.419 | *** | |||
| TE | Linear | 0.596 | *** | 0.385 | ** | 0.029 | ns | ||
| Quadratic | 0.635 | *** | 0.403 | ** | 0.198 | * | |||
| TJ | Linear | 0.611 | *** | 0.295 | ** | 0.129 | * | ||
| Quadratic | 0.653 | *** | 0.296 | ** | 0.131 | ns | |||
| DTE | Linear | 0.605 | *** | 0.411 | *** | 0.165 | * | ||
| Quadratic | 0.684 | *** | 0.585 | *** | 0.268 | ** | |||
| DTJ | Linear | 0.581 | *** | 0.402 | *** | 0.333 | ** | ||
| Quadratic | 0.652 | *** | 0.450 | *** | 0.357 | ** | |||
| Treatment | Wheat | Maize | ||
|---|---|---|---|---|
| Grain Yield (kg·ha−1) | Straw Yield (kg·ha−1) | Grain Yield (kg·ha−1) | Straw Yield (kg·ha−1) | |
| TF | 8591.4 ± 1376.4 a | 12364.2 ± 1300.3 a | 11364.7 ± 2012.2 b | 11515.4 ± 596.1 a |
| TE | 8194.5 ± 1296.7 a | 10001.0 ± 977.2 b | 13810.0 ± 851 a | 12570.0 ± 1351 a |
| TJ | 9095.7 ± 212.8 a | 10326.5 ± 366.1 b | 11497.3 ± 659.3 b | 13170.0 ± 991.4 a |
| DTE | 8647.3 ± 884.9 a | 10161.6 ± 553.1 b | 12455.9 ± 760.7 ab | 12300.0 ± 2177.4 a |
| DTJ | 8808.2 ± 985.5 a | 9489.6 ± 1513.7 b | 12637.7 ± 785.4 ab | 11580.0 ± 1549.3 a |
Publisher’s Note: MDPI stays neutral with regard to jurisdictional claims in published maps and institutional affiliations. |
© 2022 by the authors. Licensee MDPI, Basel, Switzerland. This article is an open access article distributed under the terms and conditions of the Creative Commons Attribution (CC BY) license (https://creativecommons.org/licenses/by/4.0/).
Share and Cite
Gong, H.; Li, J.; Liu, Z.; Zhang, Y.; Hou, R.; Ouyang, Z. Mitigated Greenhouse Gas Emissions in Cropping Systems by Organic Fertilizer and Tillage Management. Land 2022, 11, 1026. https://doi.org/10.3390/land11071026
Gong H, Li J, Liu Z, Zhang Y, Hou R, Ouyang Z. Mitigated Greenhouse Gas Emissions in Cropping Systems by Organic Fertilizer and Tillage Management. Land. 2022; 11(7):1026. https://doi.org/10.3390/land11071026
Chicago/Turabian StyleGong, Huarui, Jing Li, Zhen Liu, Yitao Zhang, Ruixing Hou, and Zhu Ouyang. 2022. "Mitigated Greenhouse Gas Emissions in Cropping Systems by Organic Fertilizer and Tillage Management" Land 11, no. 7: 1026. https://doi.org/10.3390/land11071026